Article

Non-Structural Carbohydrate Metabolism, Growth, and Productivity of Maize by Increasing Plant Density

by
Jairo O. Cazetta
1,* and
Marcos D. Revoredo
2
1
Department of Technology, Unesp—São Paulo State University, Jaboticabal SP 14884-900, Brazil
2
Department of Technology, Soil Science Graduation Program, Unesp—São Paulo State University, Jaboticabal SP 14884-900, Brazil
*
Author to whom correspondence should be addressed.
Agronomy 2018, 8(11), 243; https://doi.org/10.3390/agronomy8110243
Submission received: 8 September 2018 / Revised: 28 October 2018 / Accepted: 30 October 2018 / Published: 2 November 2018
(This article belongs to the Special Issue Environmental and Management Factor Contributions to Maize Yield)

Abstract

:
Increasing plant density seems to improve the productivity of maize crops, and the understanding of how the metabolism of non-structural carbohydrates is affected in plants under high crop density is critical. Thus, with the objective of further clarifying this issue, maize plants were subjected to densities from 30,000 to 90,000 plants ha−1, and the plant growth, soluble sugars and starch contents, invertase and sucrose synthase activities, and plant production were evaluated. We found that the stalk is more sensitive to the increasing plant density than leaves and kernels. The dry weight of the stalk and leaves per single plant decreased more drastically from low to intermediate plant densities, while grain production was reduced linearly in all plant density ranges, leading to higher values of harvest index in intermediate plant densities. The sucrose concentration did not change in leaves, stalk, or kernels of plants subjected to increasing plant densities at the R4 stage. Also, the specific activity of soluble invertase, bound invertase, and sucrose synthase did not change in leaf, stalk, or kernels of plants subjected to increased plant density. The productivity was increased with the increase in plant density, using narrow row (0.45 m) spacing.

1. Introduction

Humanity has the great challenge of achieving continued improvements in agricultural production to face the growing demand for food, feed, and renewable fuels, likely against unfavorable global climatic changes [1]. Grasses still constitute the most productive and widely grown crop family which provides the bases for human life across the world [2]. In this context, maize plays important role, with growing relevance. Since 2001, maize surpassed other cereals to be the second most important commodity produced in the world, just after sugarcane [3]. Considering that sugarcane is used to produce mainly water-soluble carbohydrates and biomass for energy, it is reasonable to say that maize is the most important crop grown to obtain non-soluble carbohydrates. Nevertheless, the kernels are used mainly as food and feed. There are also expectations of using maize for biomass and sugar production [4].
To maintain paired demand and production, multiple approaches will be required, with an immediate effort to understand the gaps between potential plant production and actually obtained yield [1,5]. Among other approaches, increasing plant density is an important way to improve productivity [6,7,8]. While it is clear that intra-specific competition for water, nutrients, and light is increased by increasing plant density, it is not completely clear how maize crop yield tends to increase even above relatively high plant densities [9,10,11]. Probably the small increases in productivity obtained by an additional plant population, above relatively high plant densities, is no longer compensated by additional cultural costs needed for plant protection, by increased risks of plant lodging and drought stress, among other problems that may occur under those conditions [6]. However, the understanding of how plant physiology works to perform those small increases is very important to drive new technologies for productivity enhancement. As a result, this issue has recently attracted the attention of many researchers in this area [11,12,13,14,15,16,17]. There are suggestions that even though carbohydrate reserves do not directly increase yield potential in maize plants under normal conditions for growth, they contribute to yield stability when plants are challenged by environmental or biotic stresses [2,6]. Also, it is considered that controlling plant carbohydrate reserves could be a way to avoid yield loss in maize grown under environmentally unpredictable regions, or grown as a rain-fed crop in which plants are commonly subjected to some detrimental conditions such as low nutrient availability or water stress [18]. In this context, it is well known that sucrose is the main photosynthetic compound in leaves, which is partitioned from source leaves to the sink organs of maize plants [19,20,21,22,23]. Also, it is already known that invertases are enzymes that irreversibly catalyze the cleavage of sucrose into reducing sugars (glucose + fructose), while sucrose synthase is a cytosolic enzyme that reversibly catalyzes sucrose cleavage, but whose reaction relies on the production of ADP- and UDP-glucose for starch and cell wall polysaccharide synthesis [23]. Therefore, it is expected that these compounds, and the activity of the related enzymes, would change in plants challenged by increasing plant density. So, it is supposed that, if plant non-structural carbohydrate reserves are important to stabilize yield under the mentioned situations [2], these reserves also could be responsible for sustaining maize productivity even when plants are grown under relatively high densities. However, the involvement of non-structural carbohydrate reserves, and related enzyme activity, on the process of increasing kernel productivity of maize subjected to increasing plant density is not completely clear. Taking into account the aforementioned information, there is no doubt that maize is one of the most important crops in the world, and that yield improvement can be reached by increasing plant density. Also, there is no doubt that non-structural carbohydrates play important roles in this situation. Therefore, improving our knowledge on non-structural carbohydrate metabolism in whole plants subjected to increasing density is essential to understand as well as circumvent related problems, with the aim of maximizing maize productivity. Thus, this study was designed with the objective of gaining a better understanding of how non-structural carbohydrates levels, and the activities of some related enzymes, change in plants subjected to increasing density. Also, this study aims to understand the relationship of these variables with plant production under real rain-fed field conditions.

2. Materials and Methods

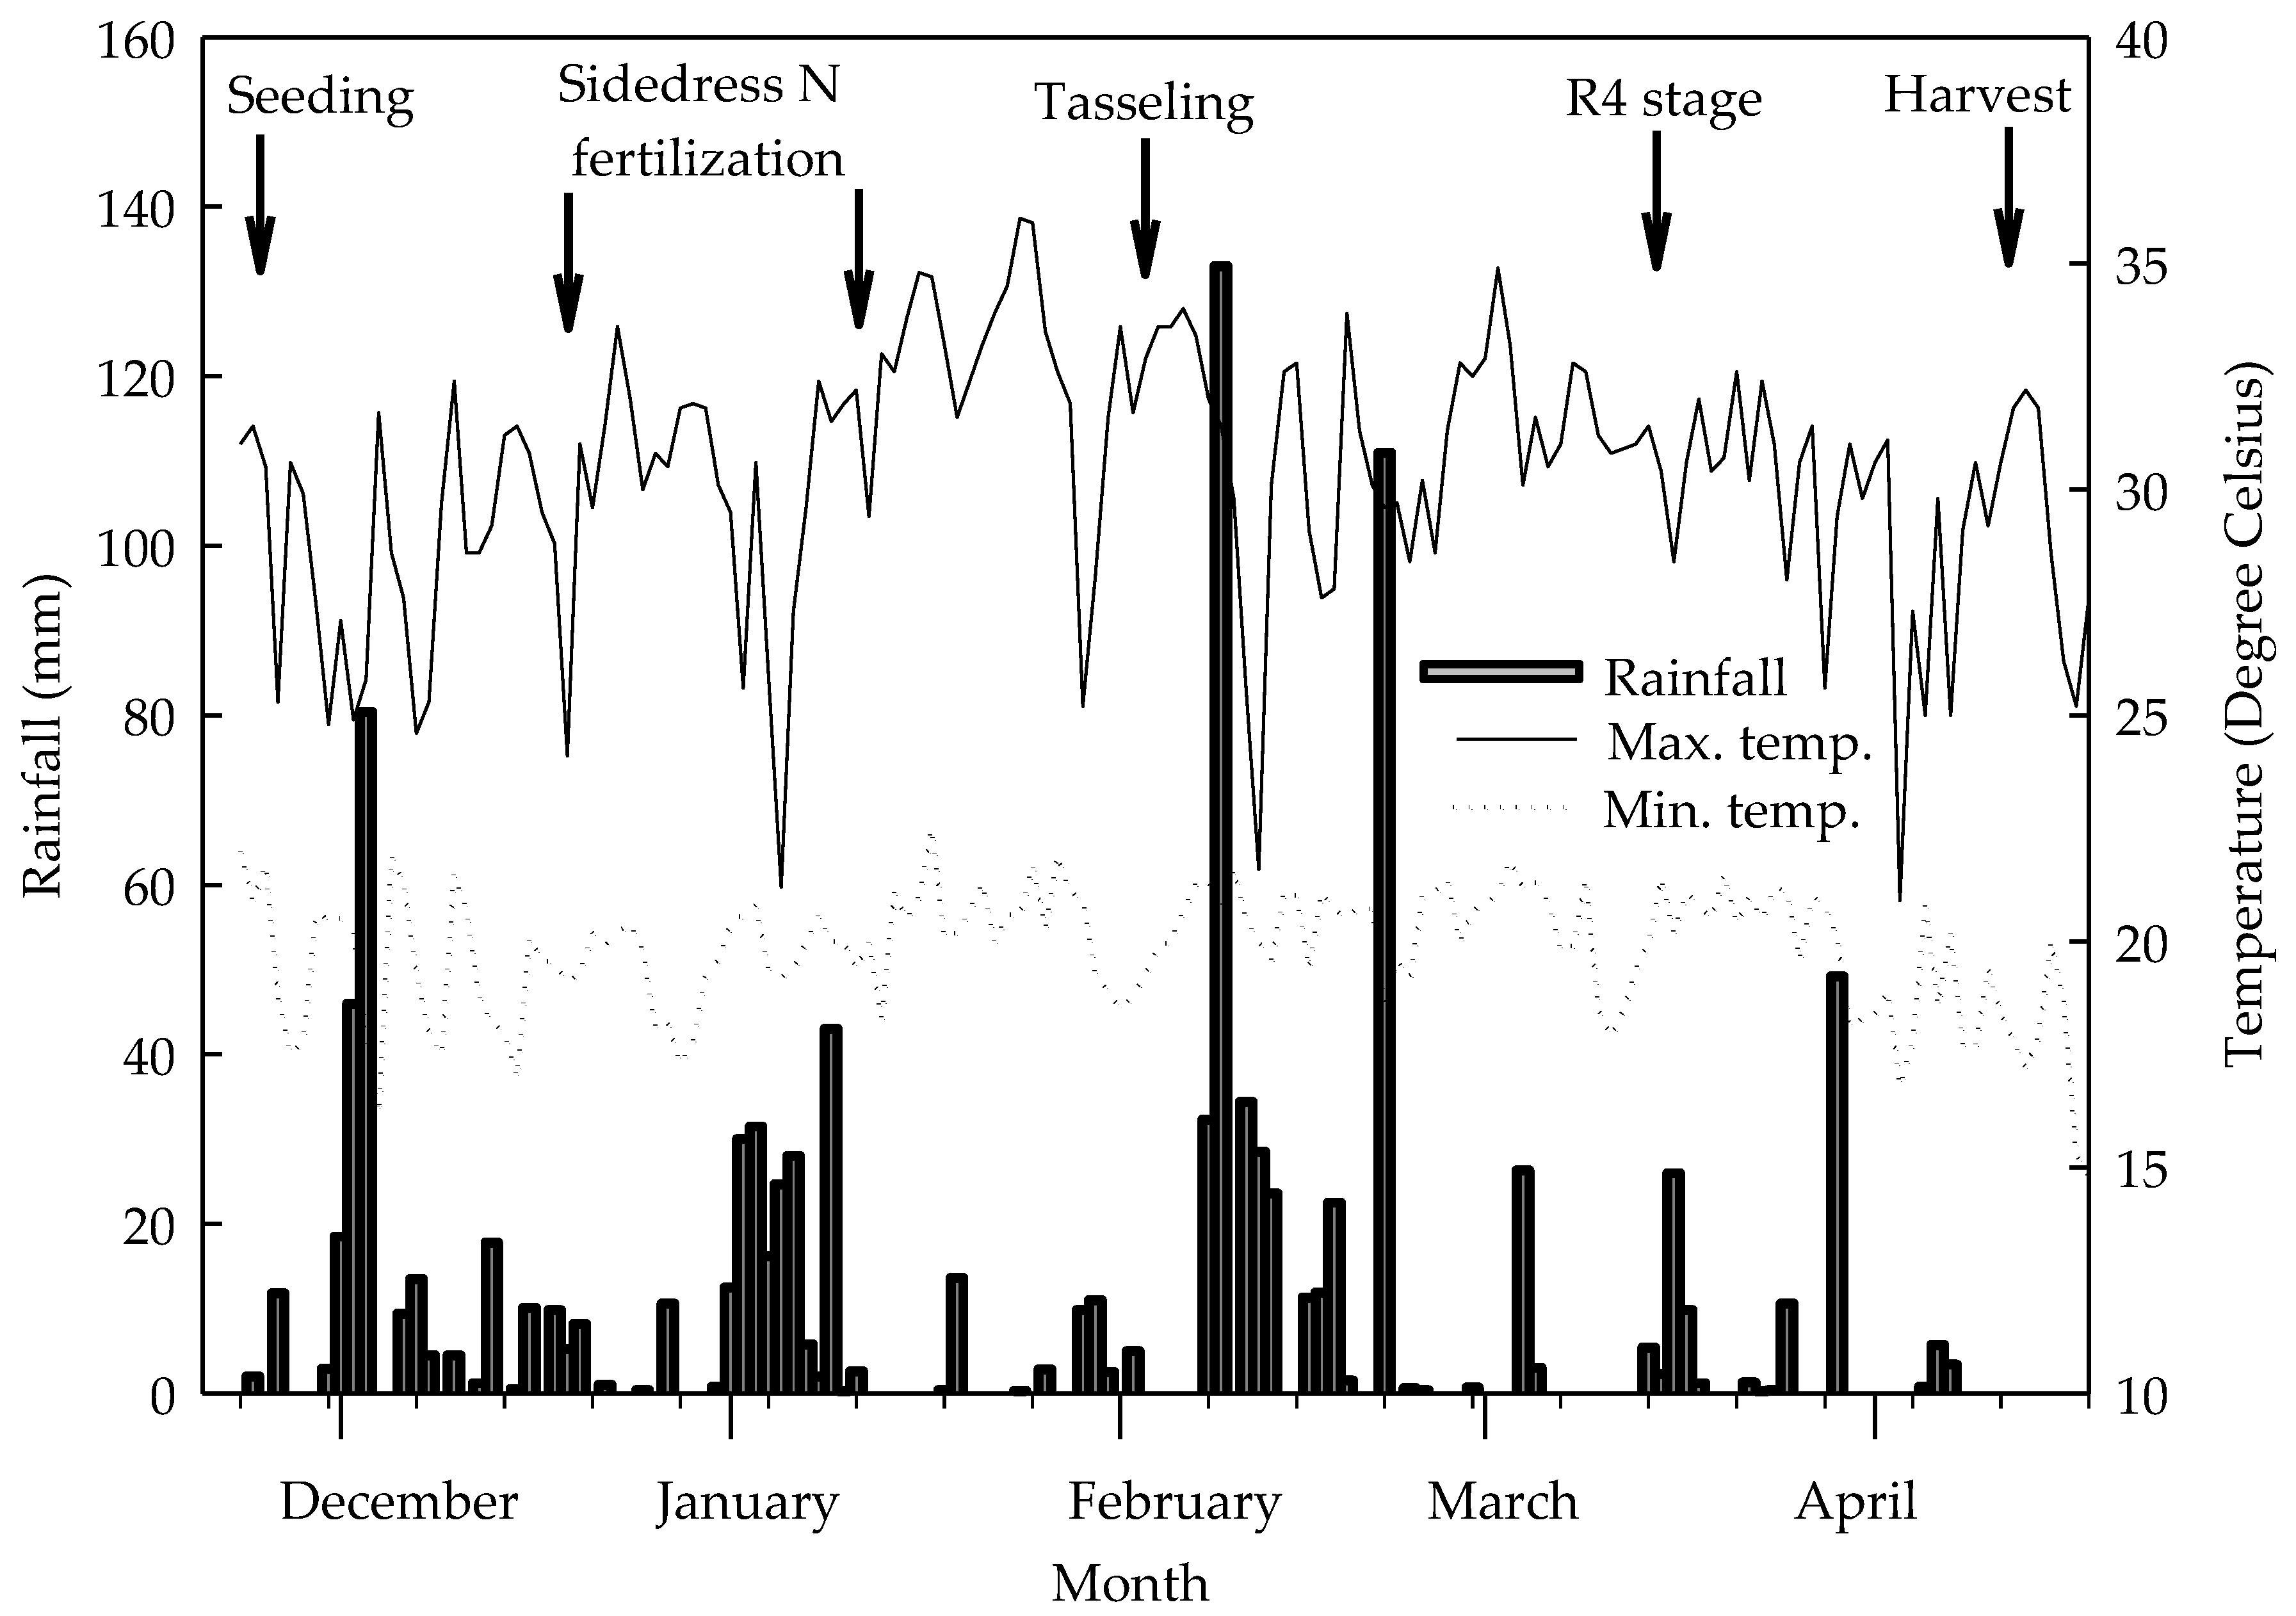
2.1. Characterization of Experimental Conditions, Treatments, and Assay Design

This research was carried out under field conditions at Jaboticabal, SP, Brazil, located at 48°18′58′′ W and 21°15′22′′ S, at an altitude of 575 m. The climate of this area is classified as Cwa (humid subtropical climate, with dry winters) according to the classification of Köppen. The climate characteristics of the experimental period are presented in Figure 1.
The soil of the experimental area is a typical eutrophic red oxisol with a clay texture. In this area, soybean crops were grown for two years before the development of this assay. The chemical analysis of the soil collected from the upper layer of 0–20 cm was accomplished according to method of Raij et al. [24], and revealed the following values: pH (in CaCl2) = 6.1; organic matter = 25 g dm−3; P (extracted by resin) = 84 mg dm−3; K = 3.7 mmolc dm−3 (milimol of charge per cubic decimeter); Ca = 63 mmolc dm−3; Mg = 50 mmolc dm−3; H + Al = 20 mmolc dm−3; sum of bases = 116.7 mmolc dm−3; total cationic exchange capacity = 136.7 mmolc dm−3; and base saturation = 85%.
Treatments consisted of five densities of plants (30,000, 45,000, 60,000, 75,000, and 90,000 plants per hectare) and four replications, in a complete randomized block design, resulting in 20 experimental units (plots). Each experimental unit consisted of 10 rows of plants, spaced 0.45 m apart, and with a length of 6 m. A border of 1 m was maintained along all sides of the plot, so the central part was considered for samplings. To obtain the five treatments (plant densities) mentioned above, plants were allocated at 0.74 m, 0.49 m, 0.37 m, 0.30 m, and 0.25 m apart. The sowing was conducted manually and two seeds were sown in each sowing point. At the V3 stage, thinning was accomplished in order to leave a single plant per sowing point.
The simple hybrid AG 9010 (early cycle, relatively small plant height, and erect leaves) was used, grown under rain-fed conditions (Figure 1).
Before the experiment assembly, the soil was prepared by using the conventional system (plowing once and harrowing twice). Based on the soil chemical analysis and recommendations of Raij and Cantarella [25], planting fertilization of all experimental unities was performed in the sowing furrow by applying 16 kg ha−1 of N, 48 kg ha−1 P2O5, 32 kg ha−1 K2O, 22 kg ha−1 S, and 9.6 kg ha−1 Zn.
Nitrogen side-dress fertilization was performed with 134 kg ha−1 N (ammonium sulfate), with 60% of this total being applied in the V4 stage and the remaining 40% in the V8 stage (Figure 1).
Part of each experimental unit was used for plant samplings at the R4 stage, for biochemical and biometrical determinations, and the other part was reserved untouched until plants were completely dry, when the harvest was accomplished for final agronomic variables measurement.

2.2. Biometric Determinations in Plants Evaluated at the R4 Stage

Ten plants at random were collected per plot in order to obtain a composite sample, and they were then separated into leaves, stem, kernels, and cob + husks. Leaf area was measured using an Image Analysis System (Delta-T Devices, Cambridge, UK). The dry mass of each sample was determined after drying at 65 ± 5 °C until constant weight was achieved. The total plant dry mass was obtained as the sum of the dry mass of all plant component parts. Average per plant values, referring to the dry matter of each part and the total plant dry mass, were used for statistical analyses.

2.3. Non-Structural Carbohydrate Determinations in Plants at the R4 Stage

With the aid of a scalpel blade, fresh samples were taken from the central part of the leaf closest to the main ear, as well as from the first internode of the stalk right below the ear, and kernels from the central part of the main ear. In order to obtain representative samples of kernel, stalk, and leaf for biochemical determination, sampling was carried out in 10 plants from each experimental unit, and then mixed to make composite samples of each plant part. The samples were identified and immediately immersed in liquid nitrogen. Then, samples were lyophilized, ground in mortar containing liquid nitrogen, and stored at −80 °C.
For the extraction of reducing sugars and sucrose, 25 mg of the sample was homogenized (Turrax type homogenizer) in a centrifuge tube containing 1 mL of 80% ethanol, incubated at 60 °C for 30 min, and centrifuged (1200× g, 20 min). Then the supernatant was transferred to a clean tube, and the procedure was repeated two more times. The supernatants were combined and deionized water was added to obtain a volume of 8 mL. This extract was subjected to the determination of reducing sugars and sucrose, while the remaining pellet was reserved for the determination of starch [26]. Reducing sugars were quantified by reaction with DNSA (3,5-dinitrosalicylic acid) and subsequent spectrophotometric determination, as proposed by Miller [27]. The sucrose contents were quantified by reaction with resorcinol and spectrophotometric determination [28]. The starch content was determined by using the remaining pellet, after hydrolysis with α-amylase and amyloglucosidase [29], and the glucose content in the hydrolyzate was determined by the reaction with DNSA (3,5-dinitrosalicylic acid) and subsequent spectrophotometric determination [27], calculating the content of starch as indicated by Brown and Hubber [30].

2.4. Enzymatic Activities Determination in Plants at the R4 Stage

The activities of sucrose synthase (UDP-Gluc: D-fructose 2-glucosyl-transferase, EC 2. 4. 1. 13) and invertases (α-fructofuranosidase, EC 3. 2. 1. 26) were determined in the same samples harvested, prepared and stored as described above for non-structural carbohydrates determinations.
The extraction of soluble enzymes (sucrose synthase and soluble invertase) was performed according to Singletary et al. [31]. Briefly, 100 mg of lyophilized sample was homogenized (Turrax type homogenizer) (30 s at 4 °C) in 2 mL of a mixture containing 50 mM HEPES (50 mM N-2-hydroxymethylpiperazine-N’-2-ethanesulfonic acid) buffer (pH 7.5), 5 mM MgCl2, and 1 mM DTT (dithiothreitol), and centrifuged (20,000× g, 4 °C, 20 min). The supernatant was transferred to Spectrapor 4 dialysis tubes and dialyzed in 10 mM HEPES buffer pH 7.2 containing 5 mM MgCl2 and 1 mM DTT for 24 h at 4 °C, while the pellet was reserved for the determination of bound invertase activity.
Sucrose synthase was assayed in the direction of sucrose degradation, in a mixture containing 80 mM MES (2(N-morfolino)-ethanesulfonic acid) (pH 6.0), 300 mM sucrose, and 10 mM UDP (uridine diphosphate). Soluble invertase (α-fructofuranosidase, EC 3. 2. 1. 26) activity was assayed following the procedure described by Doehlert and Felker [32]. The mixture contained 200 mM acetate buffer (pH 5.0), 10 mM sucrose, and the dialyzed enzyme extract in a proportion of 500 µL mL−1 final volume. Bound invertase activity was determined using the pellet remaining from the first enzyme extraction, which was submitted to a new extraction (3 min, 4 °C) with 10 mM HEPES (pH 7.5) containing 5 mM MgCl2, 1 mM DTT, and 1 M NaCl. The suspension was centrifuged (20,000× g, 20 min) and the activity was assayed immediately due to the instability of the enzyme. The activities of sucrose synthase and the invertases were determined after 20 min at 30 °C, and reducing sugars produced were measured using the DNSA method [27].
From the specific activities of the enzymes (activities per unit of tissue dry matter) and the total amounts of dry matter of the respective tissues per plant, the total enzymatic activities per plant were also estimated.

2.5. Agronomic Determinations in Plants Evaluated at Final Harest Time

After the complete drying of the crop in the field, the remaining plants in the useful area of the plots reserved for this purpose were counted, as were the number of ears per plant, and all the ears from the counted plants were subsequently harvested. After the harvest, 20 ears were chosen at random and evaluated to obtain the average number of kernels and the weight of kernels per ear. The average weight of kernels was determined after the evaluation of sub-samples containing 1000 kernels, and the average weight is expressed in mg per kernel. Considering all the plants harvested in the useful area of the plot, the average kernel yield per plant was calculated. The final grain yield was estimated by multiplying the average yield of a single plant per density of plants of each treatment, and the result is expressed in kg ha−1.

2.6. Statistical Analysis

Data were submitted to analysis of variance, using the F test at p ≤ 0.05 and p ≤ 0.01. Significant differences (p ≤ 0.05) were assayed by polynomial regression analysis. As more than one statistical model was always significant (at least p ≤ 0.05), the model having the highest coefficient of determination (R2) was chosen. All statistical analyses were performed following indications of Barbosa and Maldonado Jr [33], using the software AgroEstat [33].

3. Results

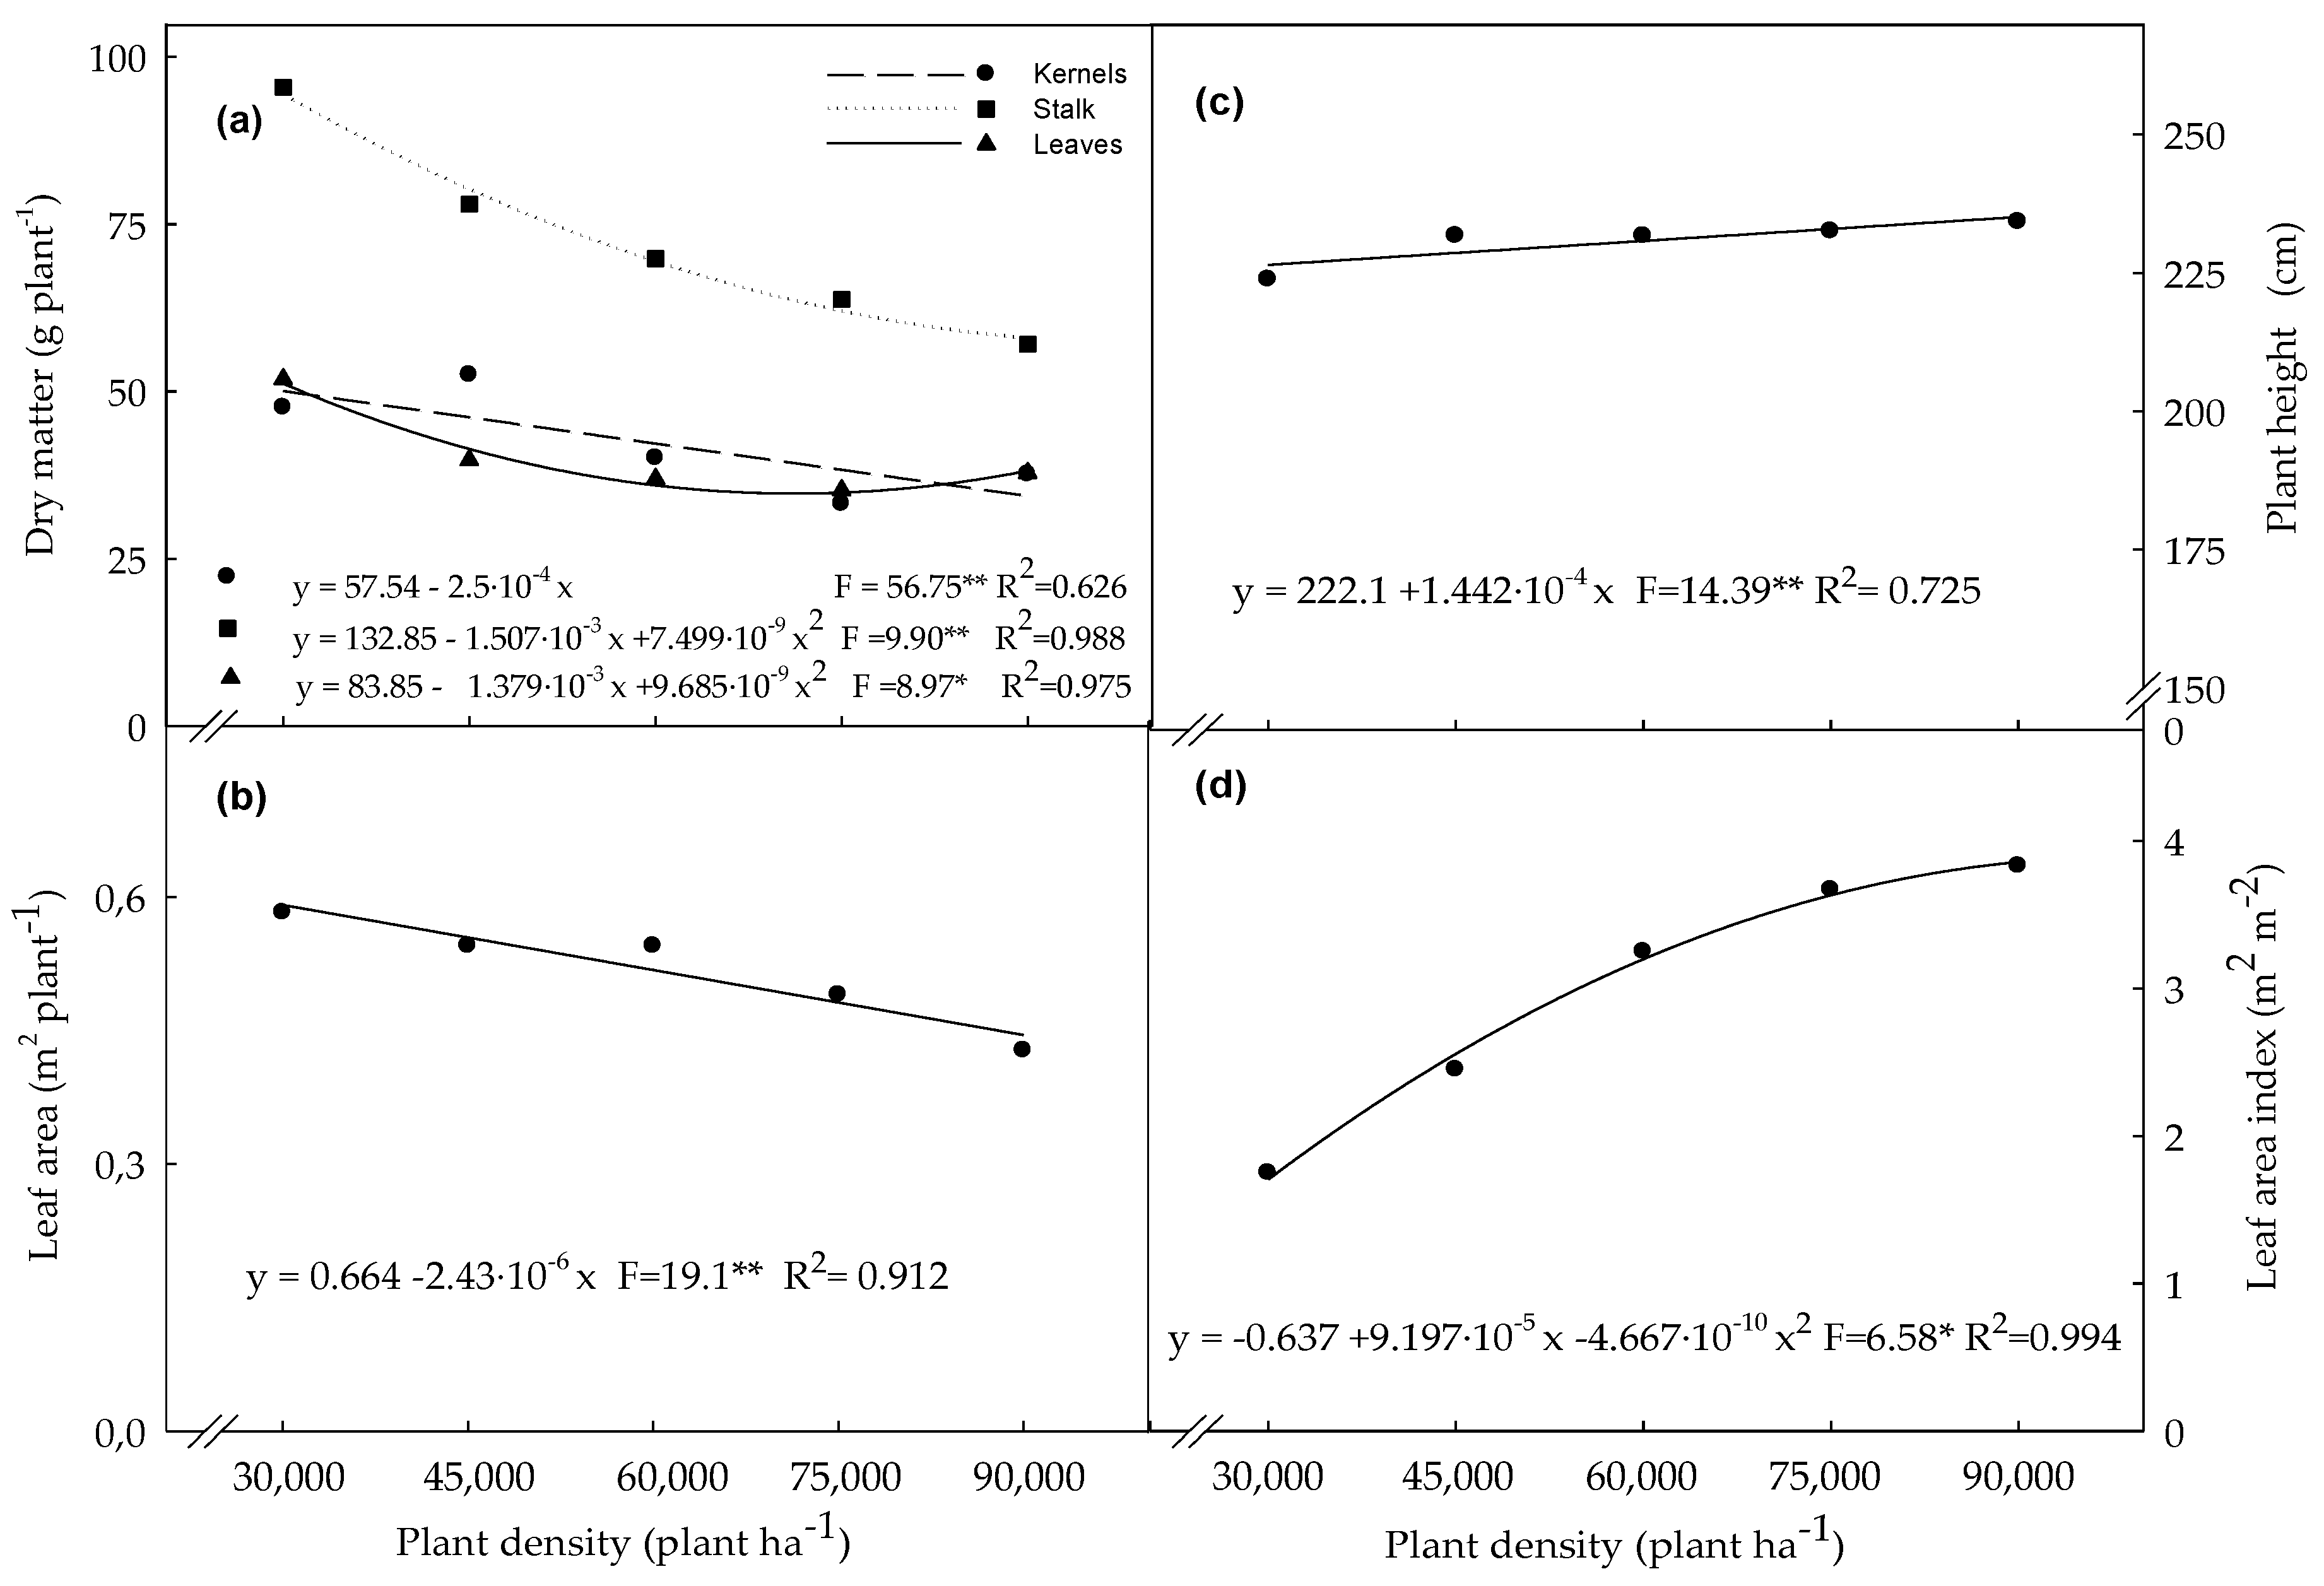
3.1. Biometric Variables Determined in Plants Evaluated at the R4 Stage

Increasing plant density from 30,000 to 90,000 plants ha−1 decreased the kernel production per plant by about 21%, while the stalk decreased in a quadratic manner by 40%. Leaf dry matter varied in a quadratic model, showing a minimum (estimated by the model) at 71,192 plants ha−1 (Figure 2a). Values of this variable decreased by 27% from 30,000 to 71,192 plants ha−1, with a little increase from this density to 90,000 plants ha−1 (Figure 2a). Plant leaf area decreased by 25% from the lowest to highest density studied (Figure 2b), while plant height increased by 5% (Figure 2c). In its turn, the leaf area index (area of leaves per area of soil cultivated) was increased in a quadratic model by about 54% from 30,000 to 90,000 plants ha−1 (Figure 2d).

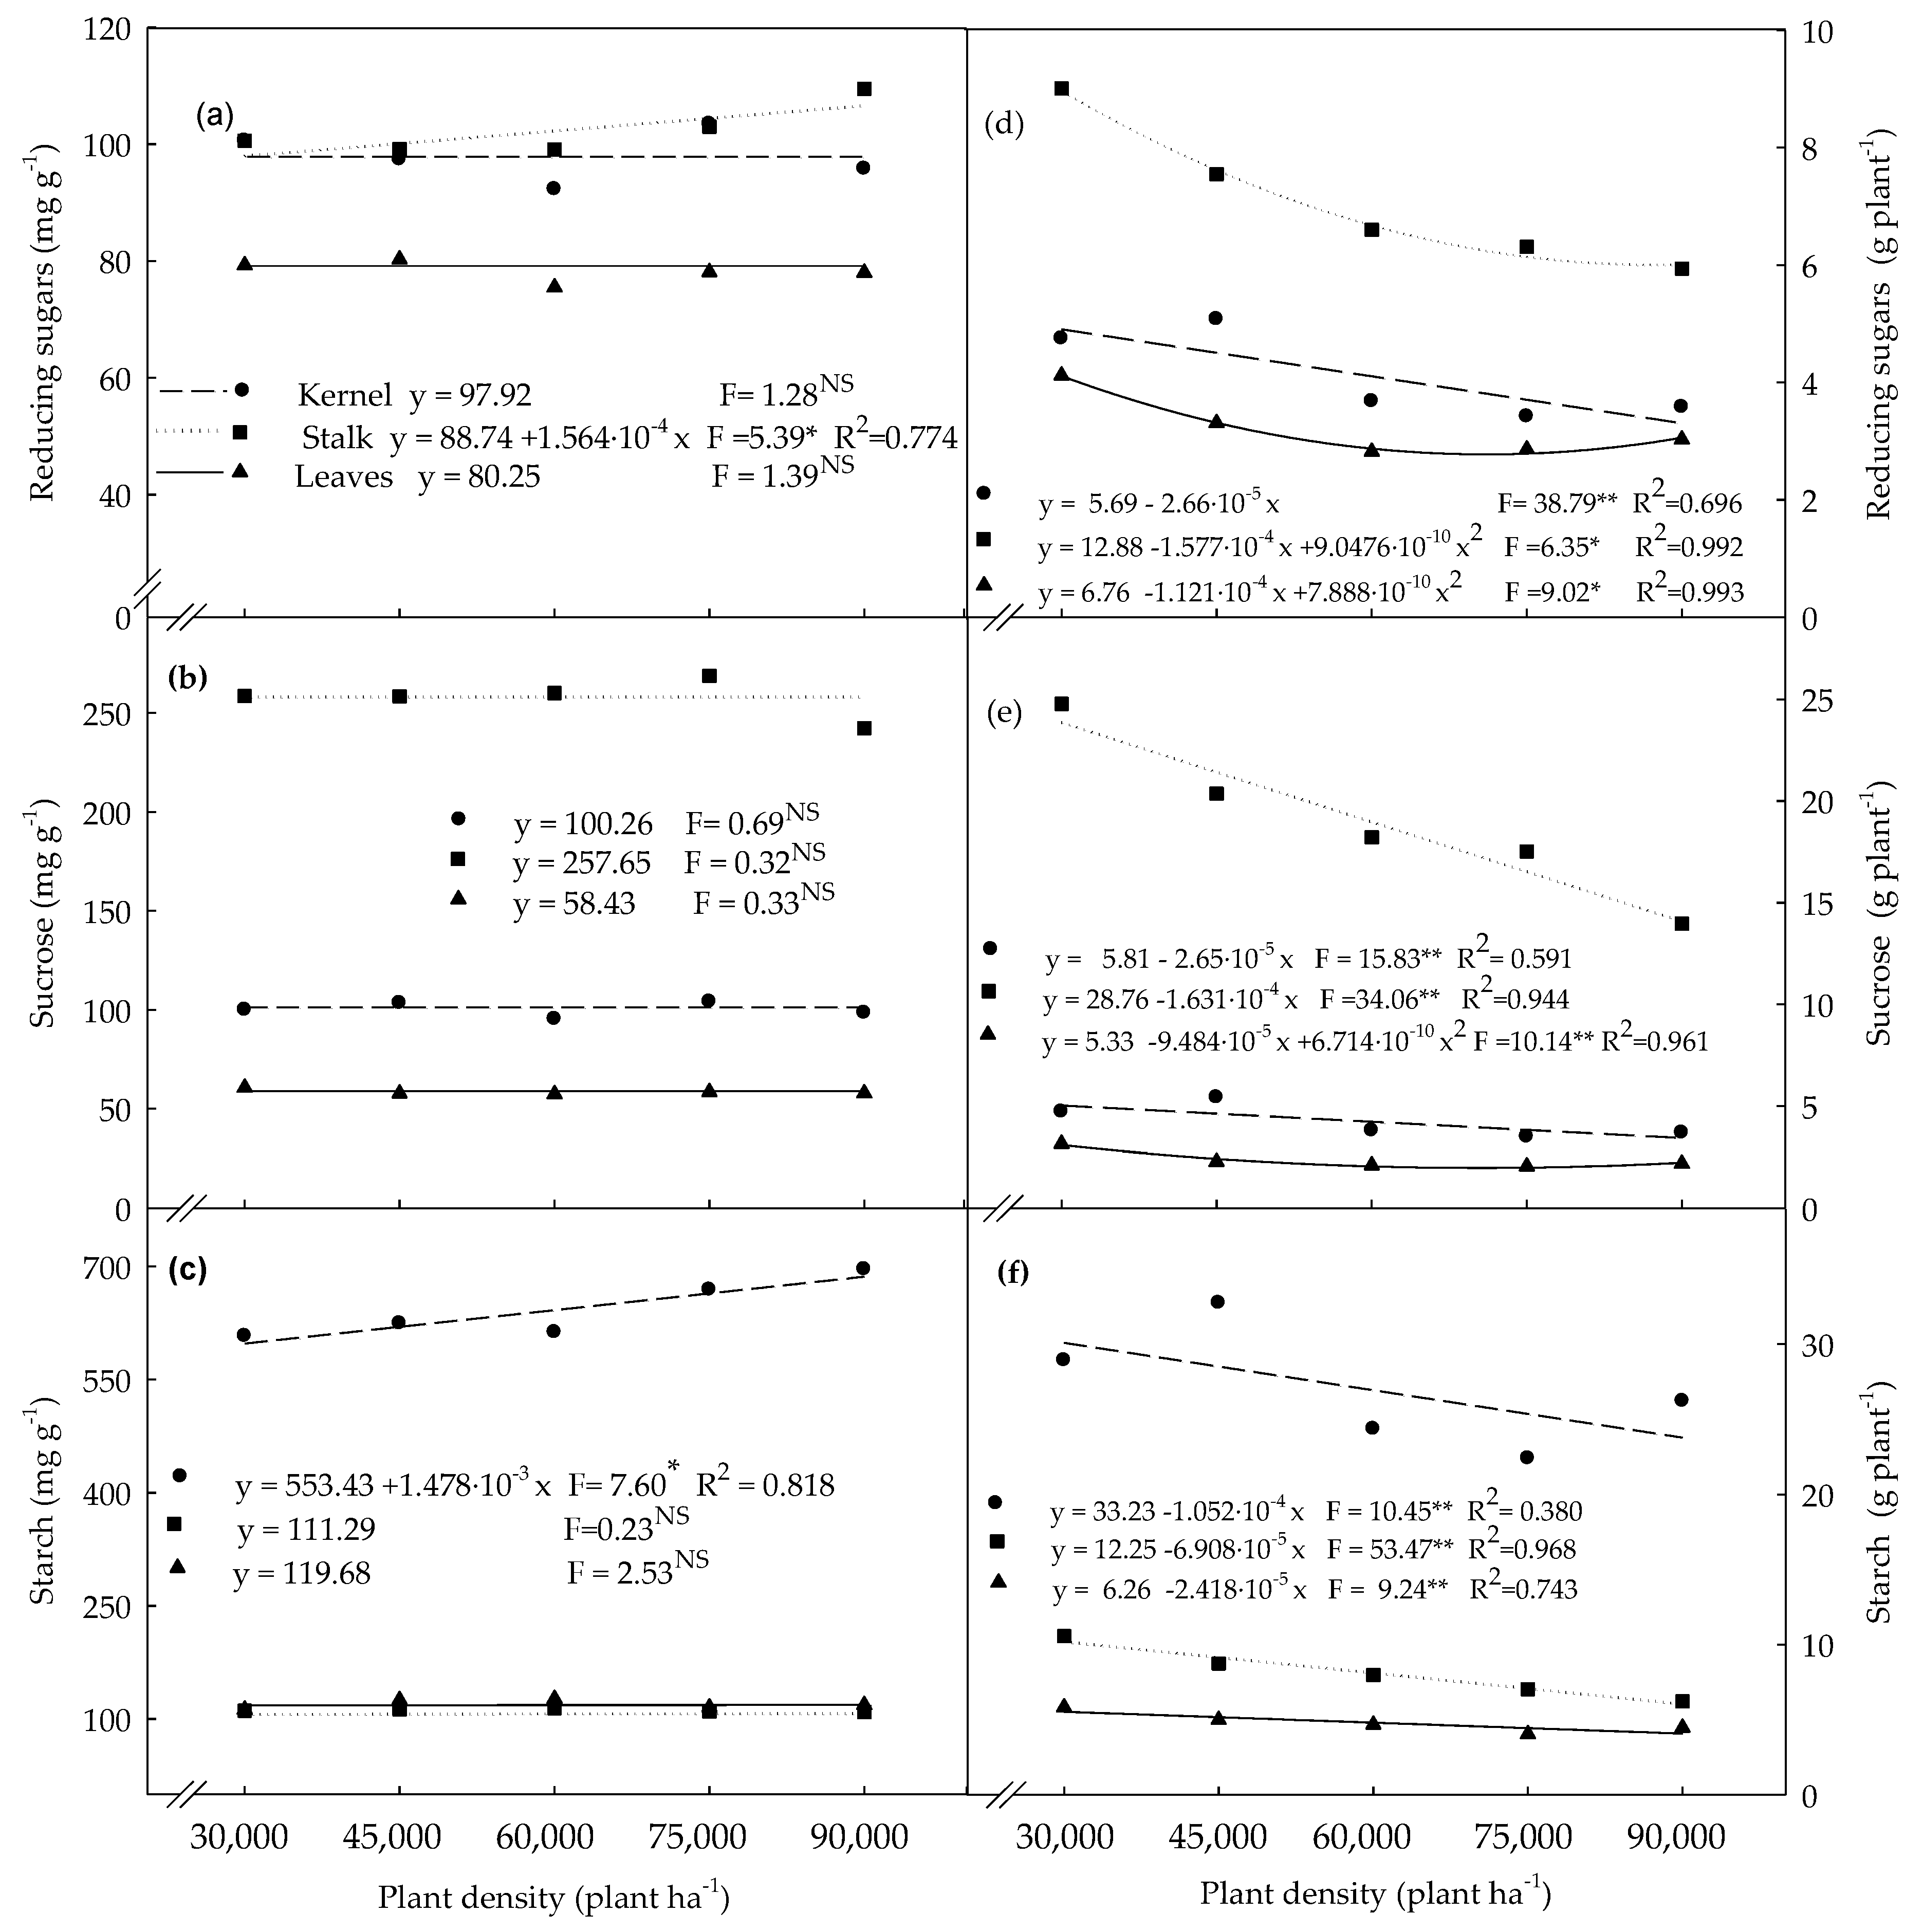
3.2. Carbohydrates Determined in Plants Evaluated at the R4 Stage

The reducing sugars concentration increased in the stalk by 8% as plant density increased from 30,000 to 90,000 plants ha−1, while this carbohydrate fraction did not vary in kernels and leaves (Figure 3a). Plant density did not affect sucrose concentration in the plant (Figure 3b). Starch concentration remained constant in leaves and stalk, but increased by about 12% in kernels as plant density increased (Figure 3c). Considering that the concentration of carbohydrates did not vary dramatically in plant tissues, the total plant content of reducing sugars (Figure 3d), sucrose (Figure 3e), and starch (Figure 3f) varied mainly as a function of plant growth. Thus, data of the abovementioned carbohydrates presented behavior similar to great extent to those of the kernel, stalk, and leaf dry matter (Figure 2a).

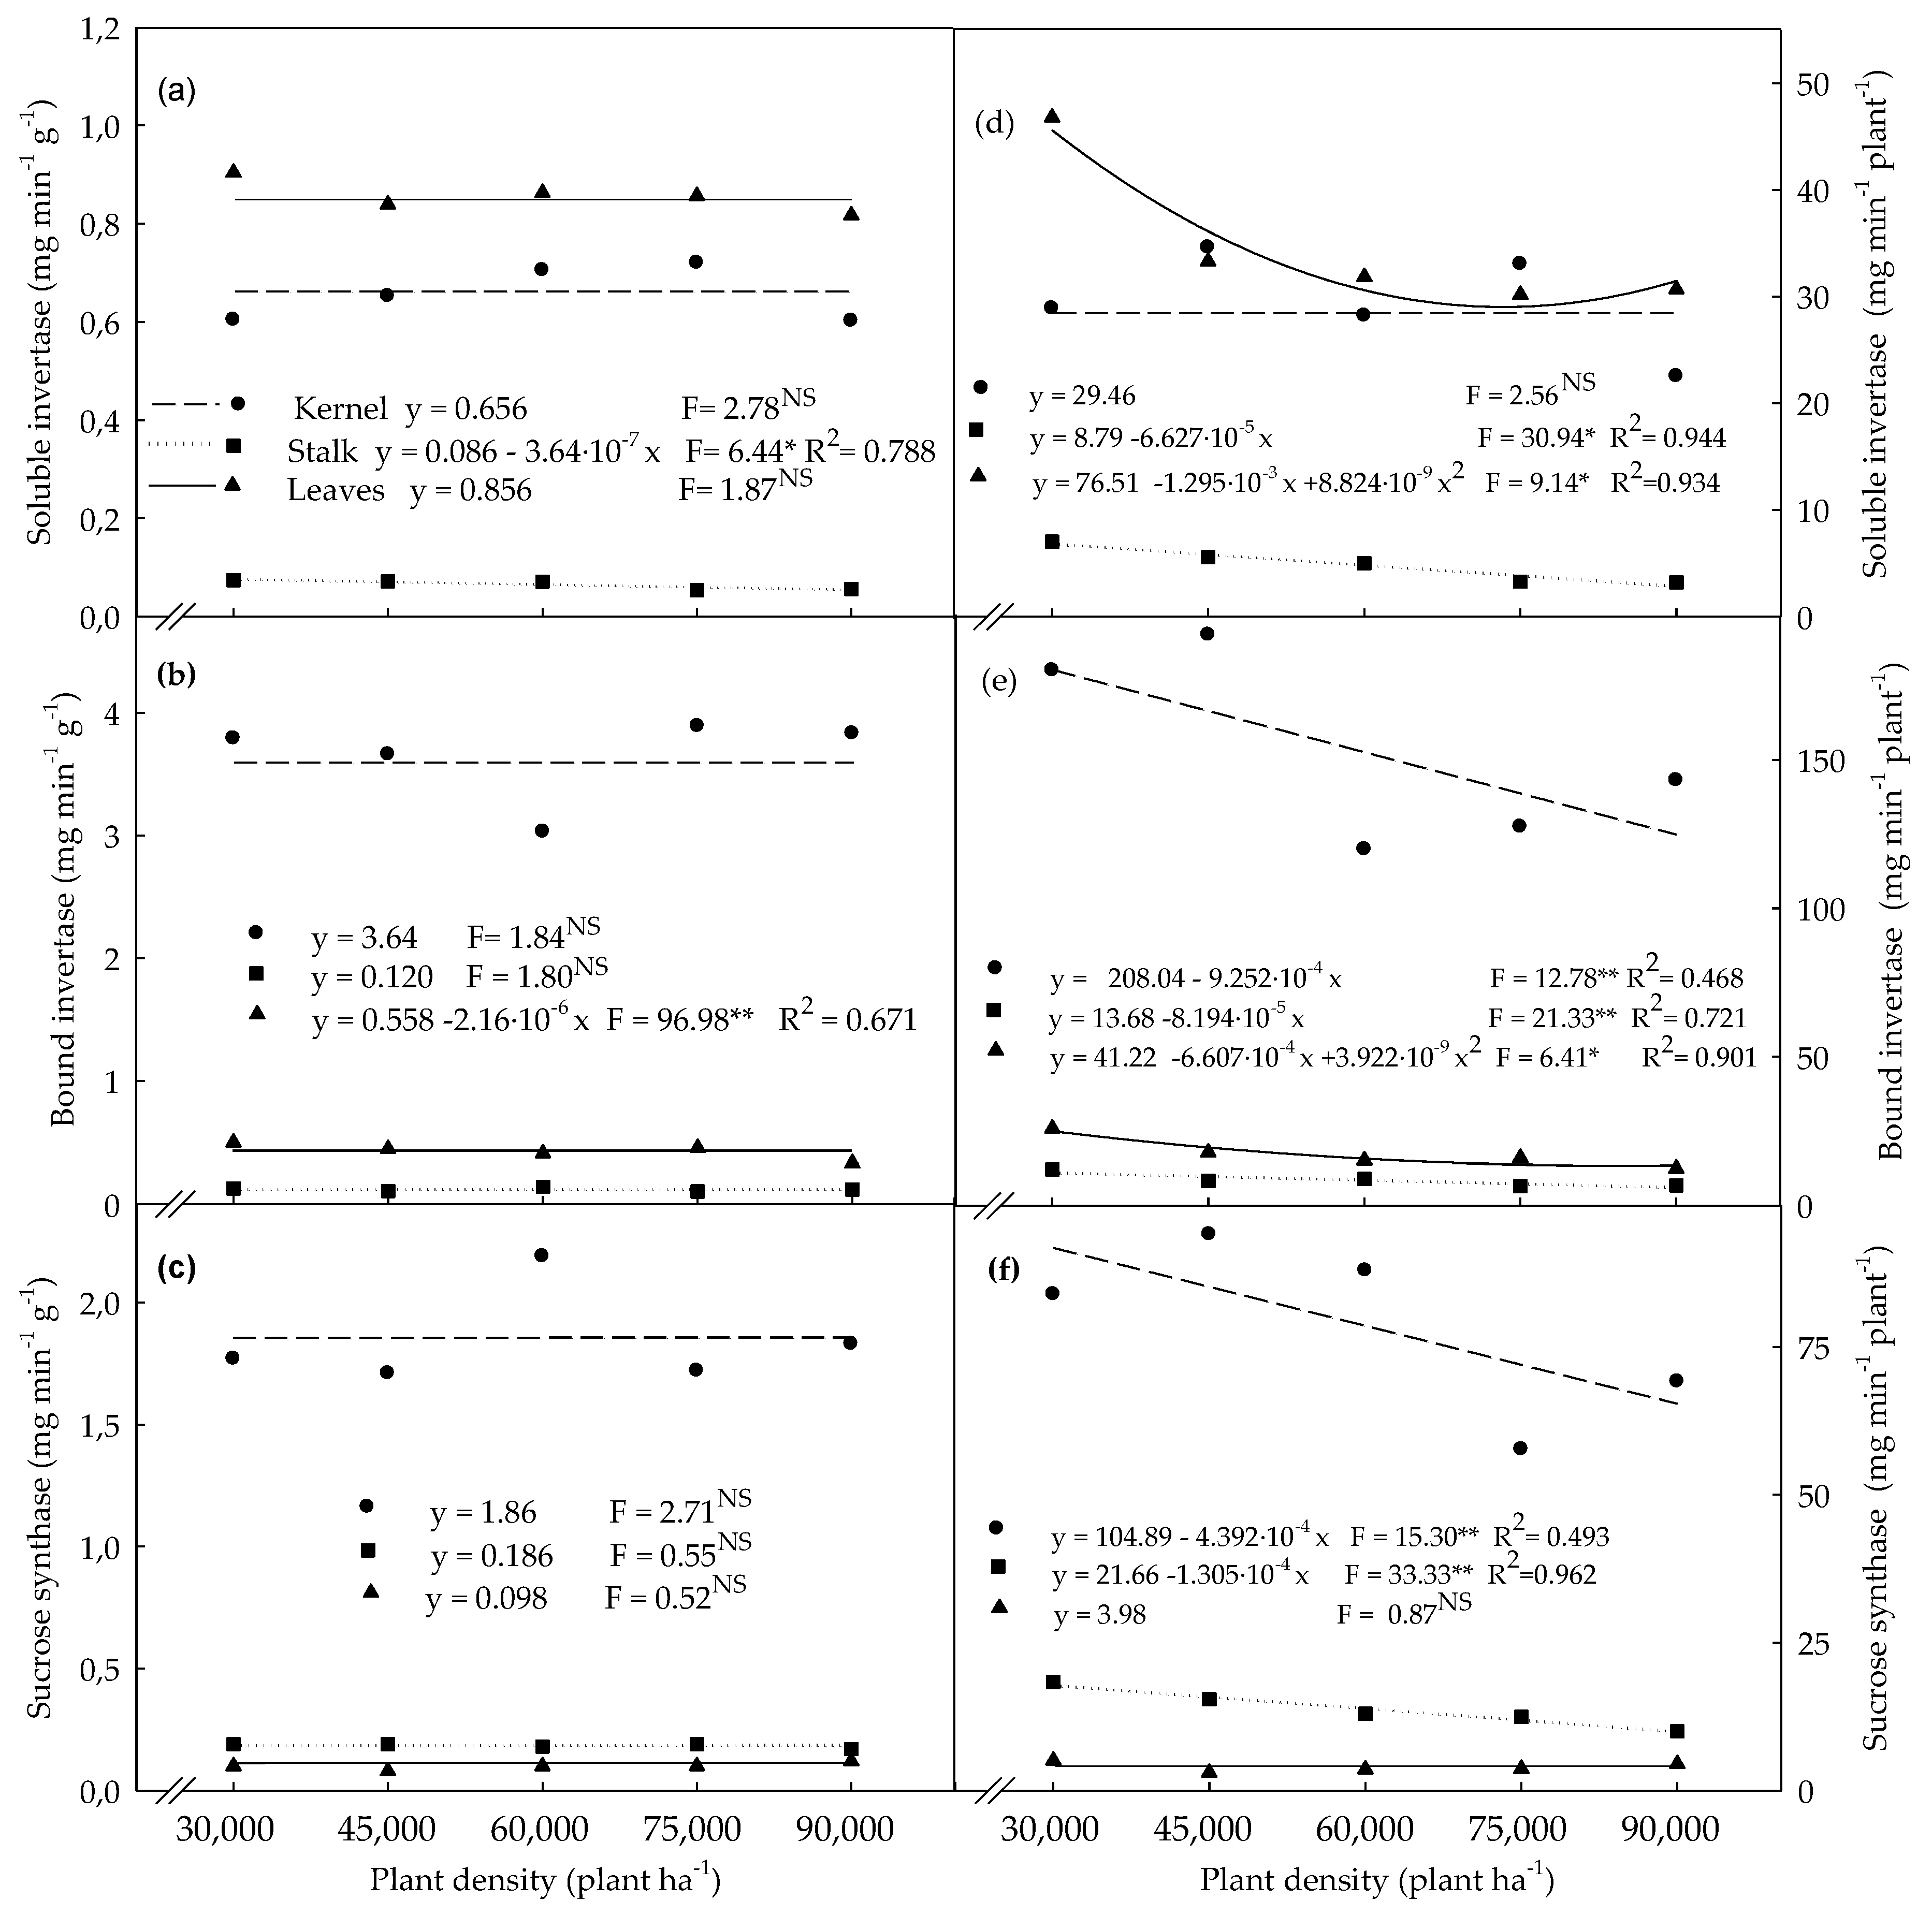
3.3. Enzymatic Activities Determined in Plants Evaluated at the R4 Stage

Specific activity (activity per unit of dry matter) of soluble invertase in stalk tissue showed a slight decrease (about 15%) as plant density increased from 30,000 to 90,000 plants ha−1, while no variation was detected in leaves and kernels (Figure 4a). Also, soluble invertase activity in leaves showed values 23% higher than that observed in kernels, and about 10 times higher than that found in stalks (Figure 4a).
Similar to that observed for soluble invertase, bound invertase activity in kernels remained constant as plant density increased. However, the activity of bound invertase in kernels was 5.5 times higher than that of soluble invertase in this tissue (Figure 4b). Bound invertase activity in leaves was reduced by 40% as plant density increased (Figure 4b), and the values were lower (by about half) than those found for soluble invertase (Figure 4a). In its turn, bound invertase in stalk tissue did not respond to plant density, but the activity of this enzyme was 50% higher than that of soluble invertase activity (Figure 4a,b). The activity of bond invertase in kernel tissue was 6.5 times higher than that in leaves, and 30 times higher than that in stalk tissue. As observed in the data of soluble invertase, the activity of bound invertase detected in stalk was much smaller (4.6 times) than that found in leaves (Figure 4b). The activity of sucrose synthase did not change as a result of the increase in plant density (Figure 4c). Stalk tissue showed activity of sucrose synthase 47% higher than that in leaves, and in kernels the activity of this enzyme was about 10 times higher than that found in other studied plant parts (Figure 4c). The values of enzymes activity per plant were obtained by multiplying the specific activity of a tissue by the total dry matter of the respective plant part. So, taking into account that the specific activity of studied enzymes did not vary, or slightly varied in tissues of plants due to treatments (plant density)—in general, the results of soluble invertase (Figure 4d), bound invertase (Figure 4e), and sucrose synthase activity (Figure 4f) were greatly associated with the production of plant dry matter in each treatment (Figure 2a), as also observed for carbohydrates accumulation per plant (Figure 3d–f). In its turn, differences among specific enzymatic activity of tissues tended to be maintained throughout the results of activity per plant, because different tissues showed very distinct activities (Figure 4). The only exemption was verified for soluble invertase in kernels, because data variations in specific activity did not allow for the adjustment of an appropriate model for that variable (Figure 4a), and it seems that this should have reflected the values of activity per plant, leading to a constant response (Figure 4d) instead of a decreasing line as observed for kernel dry weight per plant (Figure 2a).

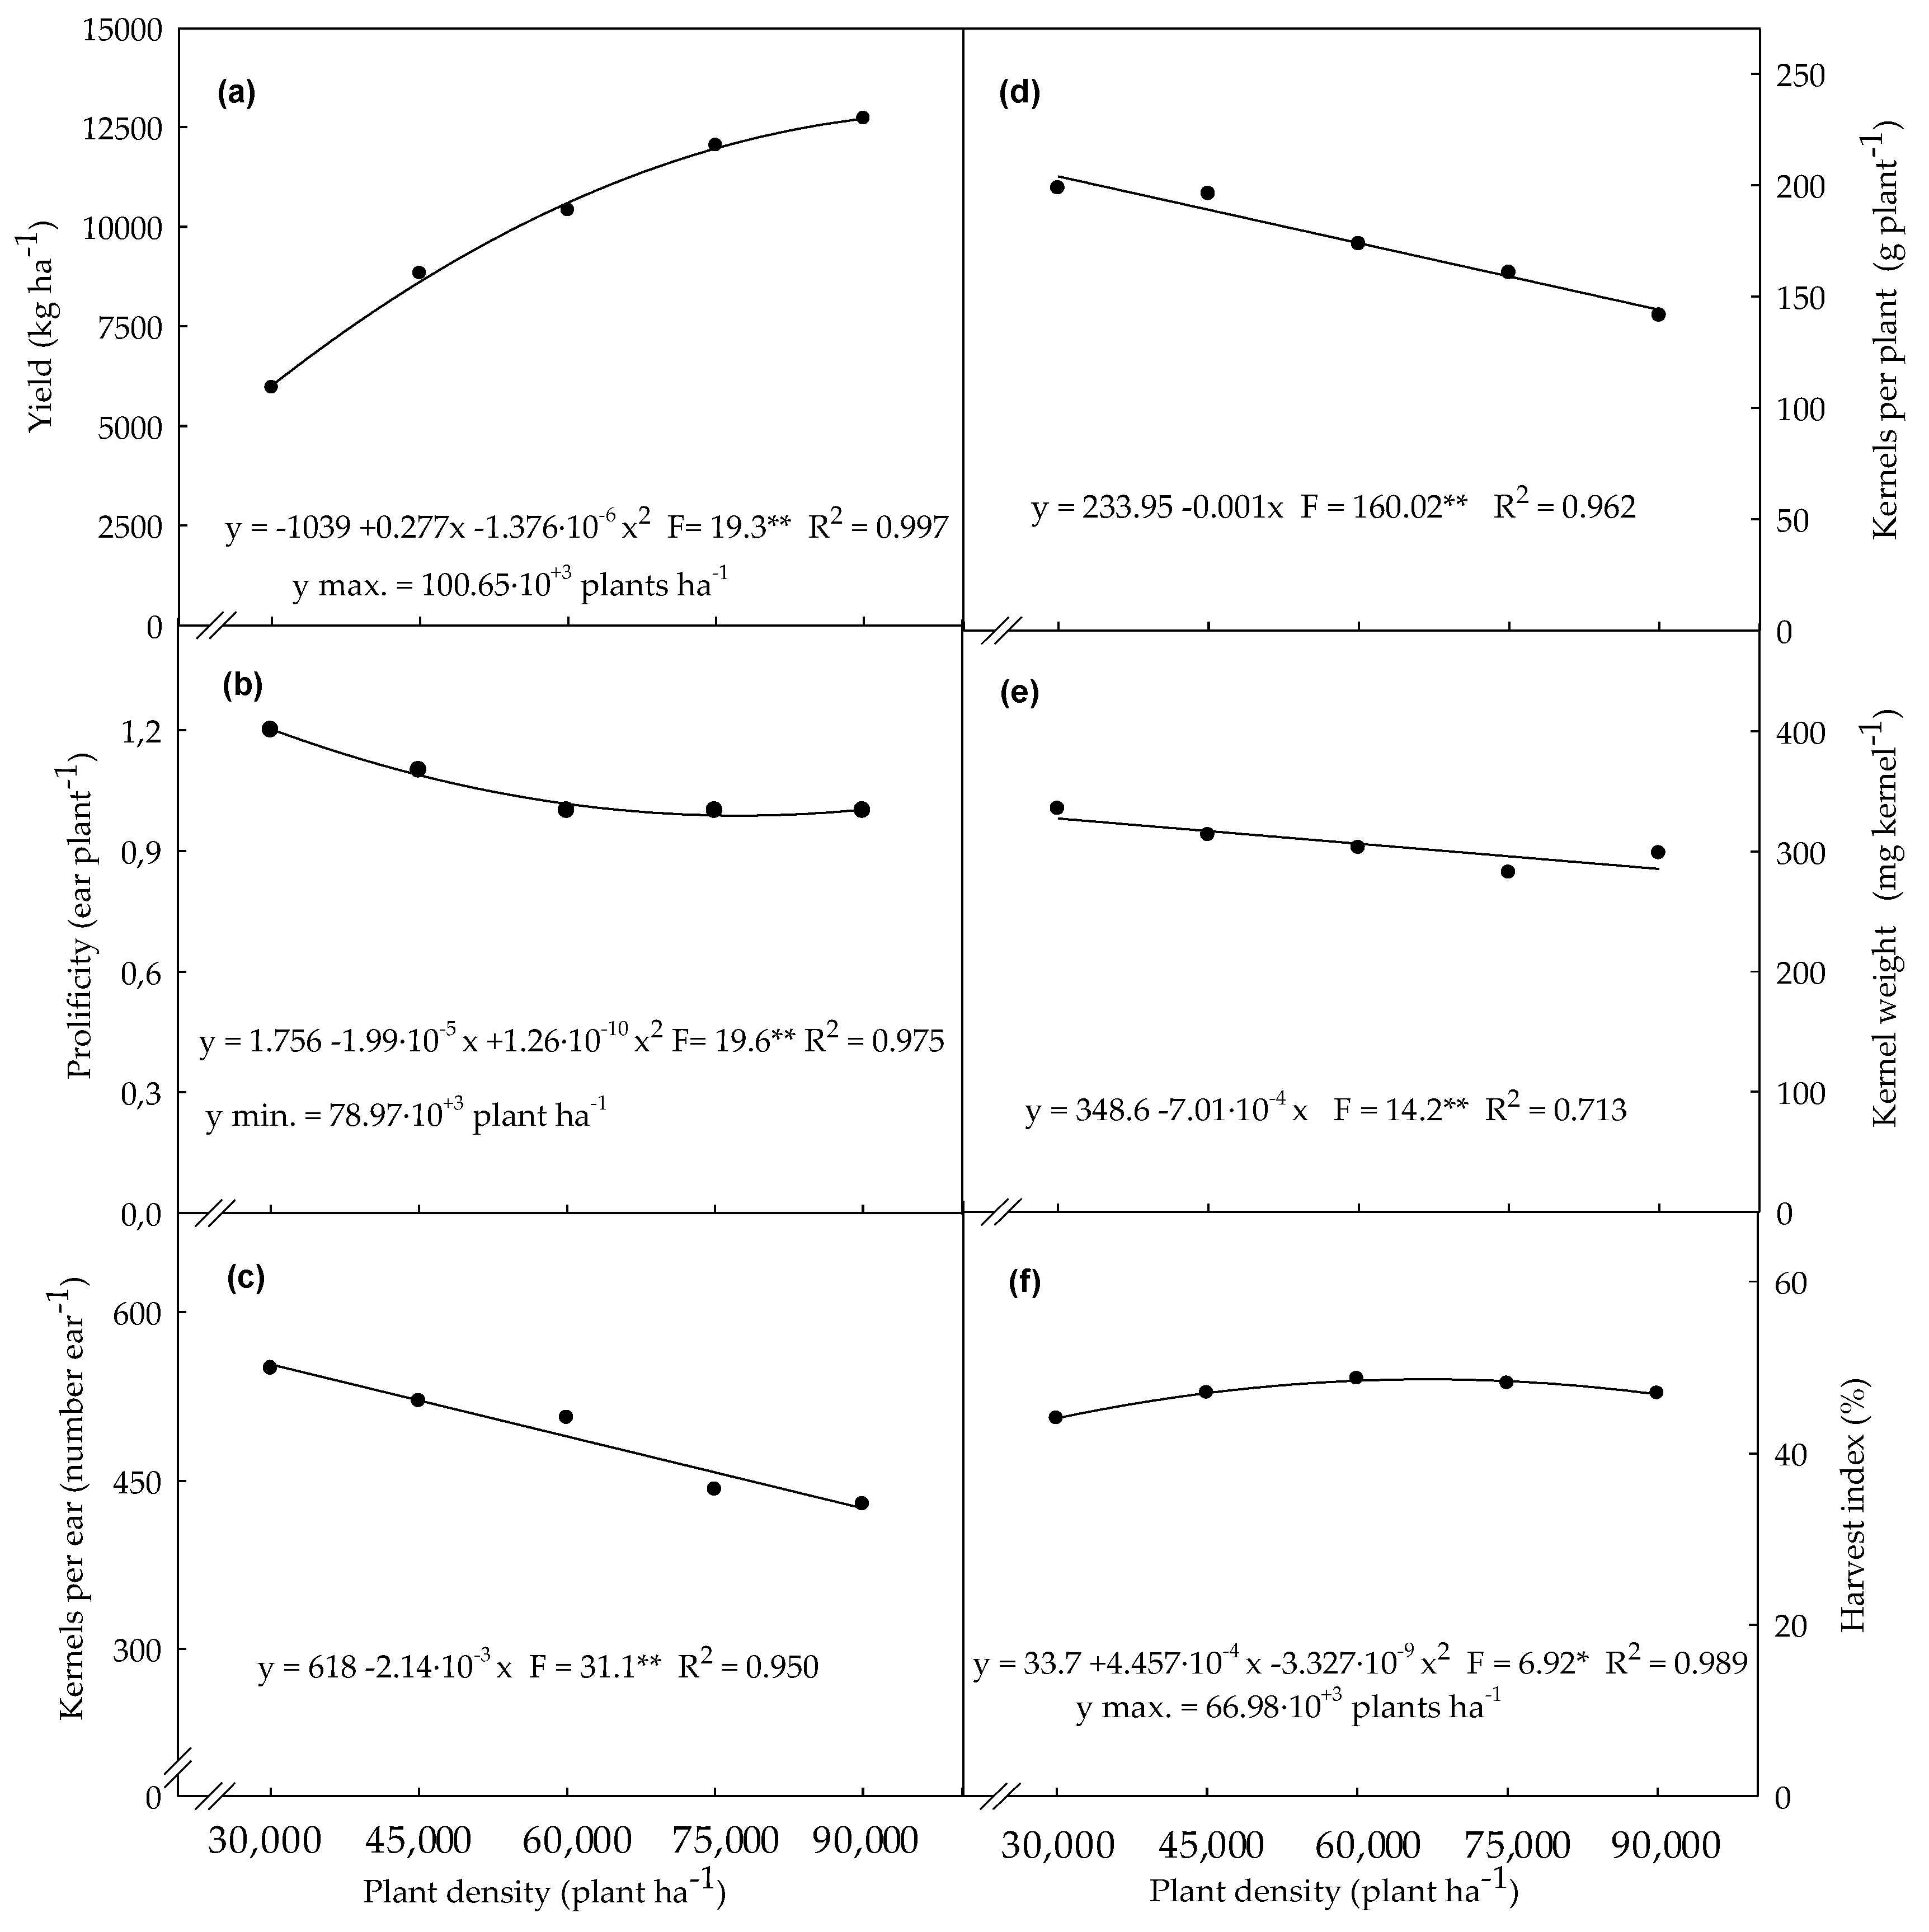
3.4. Agronomic Variables Determined in Plants Evaluated at Final Harest Time

Final kernel productivity increased with plant density from 30,000 to 90,000 plants ha−1 in a quadratic model, as presented in Figure 5a. The maximum productivity was not achieved with the highest plant density tested. However, by applying the mathematic model, it may be predicted to occur at a density of 100,650 plants ha−1. The prolificity (average number of ears per plant) was reduced by 20% with increasing plant density, and this reduction occurred mainly with increasing the density from 30,000 to 60,000 plants ha−1 (Figure 5b). The number of kernels per ear (Figure 5c), dry matter of kernels produced per plant (Figure 5d), and kernel weight average (Figure 5e) were reduced proportionally to the increase of plant density, by 28%, 40%, and 12%, respectively, from 30,000 to 60,000 plants ha−1. In its turn, the harvest index increased by 6% from 30,000 to 66,980 plants ha−1 (reaching a harvest index maximum estimated as 48.63%), then reduced 15% from densities of 66,980 to 90,000 plants ha−1 (Figure 5f).

4. Discussion

It is already known that it is possible to improve maize productivity by increasing, to some extent, plant density [9,10,11]. Also, increasing plant density leads to an increase in plant competition for nutrient, water, light, and causes morphological alterations in corn plants [8,13,14,34]. So, it could be supposed that variables such as non-structural carbohydrates concentration and accumulation, as well as the activity of enzymes involved in carbon metabolism in leaves, stalk, and kernels, would also greatly change to sustain the increases in productivity, reported up to relatively high plant densities [6,16]. In this research, we submitted maize plants to different crop densities, from 30,000 to 90,000 plants ha−1, aiming to study the expected changes in those variables. Biometric measurements were accomplished at the R4 stage to ensure that plants really had been subjected to sufficiently high competition, so that biochemical (metabolites and enzymatic activities) changes could be detected and studied in those plants. Also, agronomic variables were determined in plants evaluated at the final harvest time in order to study the yield, the yield components, and their relationships with the biochemical and biometrical results determined in plants at the R4 stage.

4.1. Biometric Variables Determined in Plants Evaluated at the R4 Stage

The range of plant densities imposed on maize crops in this study effectively caused significant biometrical alterations in plants at the R4 stage (Figure 2). This result is very important, because this allowed us to more clearly study the relationship of plant growth with the results of the biochemical determinations at this same stage. The dry weight of stalk was more sensitive to the effect of increases in plant density than that of leaves and kernels (Figure 2a), with respectively 40%, 27%, and 21% reductions. This increased sensitivity of stalk dry weight compared to the dry weight of other plant parts as a function of plant density was not found in previous critical reviews on this subject [6,16]. This sequence of decreasing effects suggest that plants in the stage of grain filling, and under increasing competition due to the increase of density, directs photoassimilates mainly to the kernels (sink), with the leaves (source) being the second priority and the stalk being the lowest priority, in order to maintain the production of photoassimilates demanded by kernels. Naturally, this fact can lead to the well-known problem of stem weakening and the loss of productivity by plants lodging under high plant densities [6,16]. Other authors verified that the increase in plant density reduces the duration of stalk internode thickening and dry matter accumulation [13], which helps to explain the results observed for stalk tissue (Figure 2a). Parallel to the decrease in dry weight, stalk length increased with plant density (Figure 2c). This was expected since high plant density reduces light intensity in the crop canopy, inhibiting the photodegradation of the hormone auxin, which is responsible for plant shoot elongation [13]. The similar models observed for kernel dry weight (Figure 2a) and leaf area (Figure 2b) per plant may be related to the dependence between kernel production and light interception [34]. Leaf dry weight per plant was reduced in a quadratic model with a minimum estimated at the point of 71,192 plants ha−1; however, it tended to exhibit and increase from this point on (Figure 2a). This may be explained by the fact that distinct leaves of a maize plant subjected to the condition of increasing competition will change shape in order to adapt to this condition [8,9]. However, it is reported that these alterations begin as soon as mild competition is detected, but do not continue any further beyond severe competition [8]. While the leaf area per plant decreased by 5% as plant density varied from 30,000 to 90,000 plants ha−1 (Figure 2b), the leaf area index (LAI) increased by 54% (Figure 2d). This difference would justify why maize productivity usually is enhanced by increasing plant density (Figure 5a) even though individual plant growth (Figure 2a) and kernel production per plant is decreased by interplant competition (Figure 5c,d). This statement is supported by other studies suggesting that an increase in maize kernel productivity should be related to the increase in LAI values [8,9,13,14,16,34].

4.2. Non-Structural Carbohydrates Determined in Plants Evaluated at the R4 Stage

Taking into account the evident growth limitations of leaves, stem, and kernels of maize plants subjected to increasing plant density (Figure 2), as well as the reports that stalks may store non-structural carbohydrates under low sink demands and the partition from stalk to sink organs when photosynthesis is not paired with sink demands [2], changes in non-structural carbohydrate concentrations in plants under growing density also would have been expected. However, we found no alterations in the levels of non-structural carbohydrates in the leaf near the developing ear (Figure 3a–c), and no change of sucrose levels was verified in any studied part of the maize plants (Figure 3b). Stalks presented 5-fold more sucrose concentration than leaves, and 2.5-fold more than kernels (Figure 3b). Only slight increases of reducing sugars concentration in stalk tissue (8%) and of starch concentration in kernels (12%) were detected as plant density increased (Figure 3a,c). Previous research [13] reported that plants at stages before silking use the flux of water-soluble carbohydrates produced by the source (mature leaves) chiefly for plant morphological growth. After that, those compounds are used for the mechanical strength formation of stalk tissue, whose phase ends by the silking stage, and after that photoassimilates are driven to the ear under development. Thus, probably due to this competitive relationship between ear and stalk sinks, the continuous flux of water-soluble carbohydrates produced in the leaves did not accumulate in leaves, stalk or kernels. This may explained, at least in part, the lack of alterations verified in this research. So, in our study we could not confirm, for maize plants with increasing density, the general statement that grasses store carbohydrates in stem tissue, whose reserve is used to improve yield stability in grain crops by providing an alternative source to complete grain filling when photosynthesis is not enough or during phases of plant stress [2]. It is interesting to note that there occurred a slight increase in kernel starch concentration with increasing plant density. Schlüter et al. [35] reported that, at least in leaves, starch production was upregulated under stress (low-N conditions), probably to reduce starch turnover, but that the sucrose concentration did not change. So, this plant mechanism is one possibility to explain, at least in part, the increase in starch in kernels of plants under increasing stress (increasing plant density). Another possibility is that the increasing plant density could have accelerated the kernel filling and maturation process [36]; thus, kernels from plants at a higher density were further ahead in finalizing kernel filling and reducing the demand for photoassimilates. This latter theory could also explain the greater starch concentration, and the supposed reduction in kernel sink demand would have induced the reducing sugars to accumulate in the stalk (Figure 3a). Although values of non-structural carbohydrates concentrations were maintained at relatively stable levels (or slightly increased, as in the case of reducing sugars in the stalk and starch in kernels), the total amounts estimated per plant tended to follow the data found for stalk, leaf, and kernels dry matter (Figure 3d–f).

4.3. Enzymatic Activities Determined in Plants Evaluated at the R4 Stage

It is well known that sucrose is the main photosynthetic compound in leaves, which is partitioned from source leaves to the sink organs of maize plants [19,20,21,22,23]. Also, it is already known that invertases are enzymes that irreversibly catalyze the cleavage of sucrose into reducing sugars (glucose + fructose), while sucrose synthase is a cytosolic enzyme that reversibly catalyzes sucrose cleavage, but whose reaction relies on the production of ADP- and UDP-glucose for starch and cell wall polysaccharide synthesis [23]. Thus, alterations in the activity of those enzymes would be expected in plants subjected to the stress of increasing plant density. However, we did not find a clear relationship among the specific activities of soluble invertase (Figure 4a), bound invertase (Figure 4b), and sucrose synthase (Figure 4c) with plant density. Probably, this lack of response is related to the relatively stable contents of soluble sugars observed in the same plants (Figure 2). In a previous study, using the third basal internode of younger maize plants (V6 stage), a decrease in soluble carbohydrate contents was reported as plant density increased [13]. This suggests that in the V6 stage, a difference in the activity of related enzymes would also be found, and it is indicative that the activity of the mentioned enzymes may vary with plant stage. We did not find reports of research on enzymatic activities in adult plants subjected to increased density. Thus, further efforts should be made to better understand the results found in this study, and to elucidate the carbohydrate metabolism of plants under high densities. However, it is already known that genotypes with increased cell wall invertase activities in different tissues and organs, including leaves and developing seeds, exhibit substantially improved grain yield [20] and grain nutrients [22]. This suggests that distinct genotypes may also lead to different responses when grown under increasing plant density.
Notwithstanding the fact that the activity of enzymes did not change with plant density, the specific activities of soluble invertase in stalk, leaves, and kernels (Figure 4a) were opposite to the behavior of the sucrose concentration in the respective plant parts (Figure 3b), while the activity of bound invertase (Figure 4b) was more related to the starch concentration (Figure 3c). Similar to bound invertase, the sucrose synthase activity (Figure 4c) was also greatly related to starch levels in the studied tissues (Figure 3c). These results suggest that soluble invertase activity was the main factor responsible for controlling the transport and accumulation of sucrose in maize plant tissues, while bound invertase was more related to the loading of sucrose into cells of tissues where starch should be deposited.

4.4. Agronomic Variables Determined in Plants Evaluated at Final Harvest Time

The increase in yield with the increase in plant density up to a maximum value at a threshold plant density value, with a decline after this point, has already been extensively reported [6,9,10,11,37]. So, the obtained result (Figure 5a) was already expected. The only uncertainty concerned the absolute value of kernel productivity, and the respective plant density in which maximum productivity would be obtained. The maximum yield was not achieved within the plant density range tested in this study, but it was predicted by the statistical model (Figure 5a) to occur at densities of 12,901 kg ha−1 and 100,650 plants ha−1. This result is in accordance with those obtained by Testa et al. [11], who also proved that a high planting density of up to 100,500 plants ha−1 can lead to a sensitive improvement in grain yield when plants are grown in narrow (0.5 m) inter-row spacing. This high limit of plant density was reached in this assay probably as a result of the relatively optimal environmental conditions (Figure 1) and limited nutritional stress (proper fertilization) under which the plants developed. This statement is supported by the fact that the greater the nutritionally and environmentally limitations that a maize crop is submitted to, the lower the threshold plant density in which maximum productivity is reached [6,10]. Also, if plants are grown under severe limitations such as low N fertilization, the yield productivity may even not respond positively to an increase in plant density [9].
While the prolificity (Figure 5b), number of kernels per ear (Figure 5c), dry weight of kernels produced per plant (Figure 5d), and average weight per kernel (Figure 5d) decreased with increasing plant density, the harvest index was enhanced up to a density of 66,982 plants ha−1 (density value estimated by the statistical model), after which a decreasing trend became noticeable (Figure 5f). Although there are many discussions about harvest index, and on the variation in the methodology used by distinct researchers to obtain this index [38], the phenomenon of the highest value of harvest index occurring at an intermediate plant density has also been observed in other studies [9,38,39]. In this research it is clear that such a phenomenon occurred because the kernel production per plant reduced in a linear fashion (Figure 3a and Figure 5e), while the values for stalk and leaves (and cob + ear straw, data not shown) decreased under quadratic models. In particular, those quadratic models showed sharp reductions from low to intermediate plant densities, and a very small decrease (in the case of stalk tissue) or even a slight increase (as observed for leaves) in the range from intermediate to high plant densities (Figure 2a). In conjunction, it can be depicted by the data of the biometrical variables that, although the single plant yield potential was reduced by increasing plant density, the increase in plant number per area circumvented this individual reduction and led to an overall increase in kernel productivity.
Future research is needed to determine whether the same lack of response we found by analyzing plants at the R4 stage would occur in other plant stages, when the stalk and tassels are still functioning as sinks and the kernels are not yet under formation. In this study, we analyzed only metabolite concentrations and enzymes activity in a specific part of the stalk (just below the main ear), and in a specific type of leaf (near the main ear). So, studies using distinct parts of the stalk and upper and lower leaves may help to further the understanding of why the metabolic variables evaluated in the studied tissues did not respond to increasing plant density.

5. Conclusions

In summary, we found that the dry weight of stalk tissue was more sensitive to the effect of increases in plant density than those of leaves and kernels. The stalk and the leaf dry weight per single plant decreased in a quadratic model, while the production of grain per plant was reduced linearly with increasing plant density, leading to higher values of harvest index in intermediate plant densities. The sucrose concentration did not change in leaves, stalk, or kernels of plants subjected to increased plant density, evaluated at the R4 stage. The specific activity of soluble invertase, bound invertase, and sucrose synthase did not change in leaves, stalk, or kernels of plants subjected to increased plant density. The productivity was increased with the increase in plant density by using narrow row (0.45 m) spacing in the studied plant density range.

Author Contributions

Both authors were involved in all phases of this research development and manuscript preparation.

Funding

This research was funded by FAPESP—Fundação de Amparo à Pesquisa do Estado de São Paulo.

Acknowledgments

Authors acknowledge the administrative and technical support given by Funep—Fundação de Apoio à Pesquisa, Ensino e Extensão. The first author are grateful to the CNPq (National Council for Scientific and Technological Development) for the granting of research productivity scholarship.

Conflicts of Interest

The authors declare no conflict of interest.

References

  1. Gregory, P.J.; George, T.S. Feeding nine bilion: The challenge to sustainable production. J. Exp. Bot. 2011, 62, 5223–5239. [Google Scholar] [CrossRef] [PubMed]
  2. Slewinski, T.L. Non-structural carbohydrates partitioning in grass stems: A target to increase yield stability, stress tolerance, and biofuel production. J. Exp. Bot. 2012, 63, 4647–4670. [Google Scholar] [CrossRef] [PubMed]
  3. FAO. FAOSTAT-Agriculture Database. 2018. Available online: http://faostat.fao.org/site/ (accessed on 1 August 2018).
  4. White, E.G.; Moose, E.P.; Weil, C.F.; McCann, M.C.; Carpita, N.C.; Below, F.E. Tropical maize: Exploiting maize genetic diversity to develop a novel annual crop for lignocellulosic biomass and sugar production. In Routs to Cellulosic Ethanol; Buckeridge, M.S., Goldman, G.G., Eds.; Springer: New York, NY, USA, 2011; pp. 167–179. [Google Scholar]
  5. Lobell, D.B.; Cassman, K.G.; Field, C.B. Crop yield gaps: Their importance, magnitudes, and causes. Annu. Rev. Environ. Resour. 2009, 34, 179–204. [Google Scholar] [CrossRef]
  6. Sangoi, L. Understanding plant density effects on maize growth and development: An important issue to maximize grain yield. Ciênc. Rural 2000, 31, 159–168. [Google Scholar] [CrossRef]
  7. Bisht, A.S.; Bhatnagar, A.; Sing, V. Influence of plant density and integrated nutrient management on N, P, and K contents and uptake of quality protein maize. Madras Agric. J. 2013, 100, 110–112. [Google Scholar]
  8. Song, Y.; Rui, Y.; Bedane, G.; Li, J. Morphological characteristics of maize canopy development as affected by increased plant density. PLoS ONE 2016, 11, 1–10. [Google Scholar] [CrossRef] [PubMed]
  9. Ciampitti, I.A.; Vyn, T.J. A comprehensive study of plant density consequences on nitrogen uptake dynamics of maize plants from vegetative to reproductive stages. Field Crops Res. 2011, 121, 2–18. [Google Scholar] [CrossRef]
  10. Tokatlidis, I.S.; Hasb, V.; Melidisc, V.; Hasb, I.; Mylonasa, I.; Evgenidisc, G.; Copandeanb, A.; Ninouc, E.; Fasoulad, V.A. Maize hybrids less dependent on high plant densities improve resource-use efficiency in rainfed and irrigated conditions. Field Crops Res. 2011, 120, 345–351. [Google Scholar] [CrossRef]
  11. Testa, G.; Reyneri, A.; Blandino, M. Maize grain yield enhancement through high plant density cultivation with different inter-row and intra-row spacings. Eur. J. Agron. 2016, 72, 28–37. [Google Scholar] [CrossRef]
  12. Yan, P.; Zhang, Q.; Shuai, X.F.; Pan, J.X.; Zhang, W.J.; Shi, J.F.; Wang, M.; Chen, X.P.; Cui, Z.L. Interaction between plant density and nitrogen management strategy in improving maize grain yield and nitrogen use efficiency on the North China Plain. J. Agric. Sci. 2016, 154, 978–988. [Google Scholar] [CrossRef]
  13. Xue, J.; Zhao, Y.; Gou, L.; Shi, Z.; Yao, M.; Zhang, W. How High Plant Density of Maize Affects Basal Internode Development and Strength Formation. Crop Sci. 2016, 56, 3295–3306. [Google Scholar] [CrossRef]
  14. Huang, S.; Gaoa, Y.; Lia, Y.; Xub, L.; Taoa, H.; Wanga, P. Influence of plant architecture on maize physiology and yield in the Heilonggang River valley. Crop J. 2017, 5, 52–62. [Google Scholar] [CrossRef]
  15. Al-Naggar, A.M.M.; Shabana, R.A.; Atta, M.M.M.; Al-Khalil, T.H. Maize response to elevated plant density combined with lowered N-fertilizer rate is genotype-dependent. Crop J. 2015, 3, 96–109. [Google Scholar] [CrossRef]
  16. Sher, A.; Khan, A.; Cai, L.J.; Ahmad, M.I.; Asharf, U.; Jamoro, S.A. Response of maize grown under high plant density; performance, issues and management—A critical review. Adv. Crop Sci. Tech. 2017, 5, 1–8. [Google Scholar] [CrossRef]
  17. Xu, Z.; Lai, T.; Li, S.; Si, D.; Zhang, C.; Cui, Z.; Chen, X. Promoting potassium allocation to stalk enhances stalk bending resistance of maize (Zea mays L.). Field Crops Res. 2018, 213, 200–206. [Google Scholar] [CrossRef]
  18. Shiferaw, B.; Prasanna, B.M.; Hellin, J.; Bänziger, M. Crops that feed the world. Past successes and future challenges to the role played by maize in global food security. Food Sec. 2011, 3, 307. [Google Scholar] [CrossRef]
  19. Cazetta, J.O.; Seebauer, J.R.; Below, F.E. Sucrose and nitrogen supplies regulate growth of maize kernels. Ann. Bot. 1999, 84, 747–754. [Google Scholar] [CrossRef]
  20. Li, B.; Liu, H.; Zhang, Y.; Kang, T.; Zhang, L.; Tong, J.; Xiao, L.; Zhang, H. Constitutive expression of cell wall invertase genes increases grain yield and starch content in maize. Plant Biotechnol. J. 2013, 11, 1080–1091. [Google Scholar] [CrossRef] [PubMed] [Green Version]
  21. Jiang, S.; Chi, Y.; Wang, J.; Zhou, J.; Cheng, Y.; Zhang, B.; Ma, A.; Vanitha, J.; Ramachandran, R. Sucrose metabolism gene families and their biological functions. Nature 2015, 17583. [Google Scholar] [CrossRef] [PubMed]
  22. Guo, X.; Duan, X.; Wu, Y.; Cheng, J.; Zhang, J.; Zhang, H.; Li, B. Genetic Engineering of Maize (Zea mays L.) with Improved Grain Nutrients. J. Agric. Food Chem. 2018, 66, 1670–1677. [Google Scholar] [CrossRef] [PubMed]
  23. Tong, X.; Wang, Z.; Ma, B.; Zhang, C.; Zhu, L.; Ma, F.; Li, M. Structure and expression analysis of the sucrose synthase gene family in apple. J. Integr. Agric. 2018, 17, 847–856. [Google Scholar] [CrossRef]
  24. Van Raij, B.; Andrade, J.C.; Cantarella, H.; Quaggio, J.A. Análise Química Para Avaliação da Fertilidade de Solos Tropicais; Instituto Agronômico: Campinas, Brasil, 2001; 285p, ISBN 85-85564-05-9. [Google Scholar]
  25. Van Raij, B.; Cantarella, H. Cereais: Milho para grão e silagem. In Recomendações de Calagem e Adubação Para o Estado de São Paulo; van Raij, B., Cantarella, H., Quaggio, J.A., Furlani, A.M.C., Eds.; Instituto Agronômico de Campinas: Campinas, Brasil, 1997; pp. 56–59. [Google Scholar]
  26. Faleiros, R.R.S.; Seebauer, J.R.; Below, F.E. Nutritionally induced changes in endosperm of shrunken-1 and brittle-2 maize kernels growth in vitro. Crop Sci. 1996, 36, 947–954. [Google Scholar] [CrossRef]
  27. Miller, G.L. Use of dinitrosalisylic acid reagent for determination of reducing sugars. Ann. Chem. 1959, 31, 426–428. [Google Scholar] [CrossRef]
  28. Fieuw, S.; Willenbrink, J. Sucrose synthase and sucrose phosphate synthase in sugar beet plants (Beta vulgaris L. ssp. altissima). J. Plant Physiol. 1987, 131, 153–162. [Google Scholar] [CrossRef]
  29. Hendrix, D.L. Rapid extraction and analysis of nonstructural carbohydrates in plant tissues. Crop Sci. 1993, 33, 1306–1311. [Google Scholar] [CrossRef]
  30. Brow, C.S.; Huber, S.C. Reserve mobilization and starch formation in soybean (Glycine max) cotyledon in relation to seedling growth. Plant Physiol. 1988, 72, 518–524. [Google Scholar] [CrossRef]
  31. Singletary, G.W.; Doehlert, D.C.; Wilson, C.M.; Muhtich, M.J.; Below, F.E. Response of enzymes and storage proteins of maize endosperm to nitrogen supply. Plant Physiol. 1990, 94, 858–864. [Google Scholar] [CrossRef] [PubMed]
  32. Doehlert, D.C.; Felker, F.C. Characterization and distribution of invertase activity in developing maize (Zea mays) kernels. Physiol. Plant. 1987, 70, 51–57. [Google Scholar] [CrossRef]
  33. Barbosa, J.C.; Maldonado, W., Jr. Experimentação Agronômica & AgroEstat: Sistema Para Análise Estatística de Ensaios Agronômicos; Gráfica Multipress: Jaboticabal, Brazil, 2015; ISBN 978-85-68020-01-02. [Google Scholar]
  34. Balkcom, K.S.; Satterwhiteb, J.L.; Arriagaa, F.J.; Pricea, J.A.; Santenb, E.V. Conventional and glyphosate-resistant maize yields across plant densities in single- and twin-row configurations. Field Crops Res. 2011, 120, 330–337. [Google Scholar] [CrossRef]
  35. Schlüter, U.; Mascher, M.; Colmsee, C.; Scholz, U.; Bräutigam, A.; Fahnenstich, H.; Sonnewald, U. Maize source leaf adaptation to nitrogen deficiency affects not only nitrogen and carbon metabolism but also control of phosphate homeostasis. Plant Physiol. 2012, 160, 1384–1406. [Google Scholar] [CrossRef] [PubMed]
  36. Rajcan, I.; Tollenaar, M. Source: Sink ratio and leaf senescence in maize: II. Nitrogen metabolism during grain filling. Field Crops Res. 1999, 60, 255–265. [Google Scholar] [CrossRef]
  37. Tollenaar, M.; Aguilera, A.; Nissanka, S.P. Grain yield is reduced more by weed interference in an old than in a new maize hybrid. Agron. J. 1997, 89, 239–246. [Google Scholar] [CrossRef]
  38. Unkovich, M.; Baldock, J.; Forbes, M. Variability in Harvest Index of Grain Crops and Potential Significance for Carbon Accounting: Examples from Australian Agriculture. Adv. Agron. 2010, 105, 173–219. [Google Scholar] [CrossRef]
  39. Demetrio, C.S.; Fornasieri Filho, D.; Cazetta, J.O.; Cazetta, D.A. Desempenho de híbridos de milho submetidos a diferentes espaçamentos e densidades populacionais. Pesqui. Agropecu. Bras. 2008, 43, 1691–1697. [Google Scholar] [CrossRef] [Green Version]
Figure 1. Rainfall, maximum temperature (Max. temp.), and minimum temperature (Min. temp.) during the assay development, as well as indications date of seeding, N fertilization, tasseling, R4 stage, and final harvest.
Agronomy 08 00243 g001
Figure 2. Kernel, leaf, and stalk dry weight per plant (a), plant leaf area (b), plant height (c), and leaf area index (d) of corn plants at the R4 stage, as a function of the plant density, ranging from 30,000 to 90,000 plants per hectare. Statistical data were obtained from four field replications. F = F test result of the regression analysis; (*) and (**) indicate that the F test revealed statistical significance at p ≤ 0.05 and p ≤ 0.01, respectively; R2 = determination coefficient.
Agronomy 08 00243 g002
Figure 3. Concentration of reducing sugars (a), sucrose (b), and starch (c), and the amount per plant of reducing sugars (d), sucrose (e), and starch (f) in the kernel, leaf, and stalk of corn plants at the R4 stage, as a function of the plant density, ranging from 30,000 to 90,000 plants per hectare. Statistical data were obtained from four field replications. F = F test result of the regression analysis; (*) and (**) indicate that the F test revealed statistical significance at p ≤ 0.05 and p ≤ 0.01, respectively; R2 = determination coefficient.
Agronomy 08 00243 g003
Figure 4. Specific activity of soluble invertase (a), bound invertase (b), and sucrose synthase (c), as well as activity per plant of soluble invertase (d), bound invertase (e), and sucrose synthase (f) in the kernel, leaf, and stalk of corn plants at the R4 stage as a function of the plant density ranging from 30,000 to 90,000 plants per hectare. Statistical data were obtained from four field replications. F = F test result of the regression analysis; (*) and (**) indicate that the F test revealed statistical significance at p ≤ 0.05 and p ≤ 0.01, respectively; R2 = determination coefficient.
Agronomy 08 00243 g004
Figure 5. Yield (a), prolificity (b), number of kernels per ear (c), production of kernels per plant (d), kernel weight average (e), and harvest index (f) of corn plants at final harvest time as a function of the plant density. Plant density in the field ranged from 30,000 to 90,000 plants per hectare. Statistical data were obtained from four field replications. F = F test result of the regression analysis; (*) and (**) indicate that the F test revealed statistical significance at p ≤ 0.05 and p ≤ 0.01, respectively; R2 = determination coefficient.
Agronomy 08 00243 g005

