Article

Impacts of Fertilization Type on Soil Microbial Biomass and Nutrient Availability in Two Agroecological Zones of Ghana

by
Richard Ansong Omari
1,
Elsie Sarkodee-Addo
2,
Yoshiharu Fujii
2,
Yosei Oikawa
2 and
Sonoko Dorothea Bellingrath-Kimura
3,4,*
1
United Graduate School of Agricultural Science, Tokyo University of Agriculture and Technology, Saiwaicho 3-5-8, Fuchu, Tokyo 183-8509, Japan
2
Institute of Agriculture, Tokyo University of Agriculture and Technology, Saiwaicho 3-5-8, Fuchu, Tokyo 183-8509, Japan
3
Leibniz Centre for Agricultural Landscape Research, Institute of Land Use Systems, Eberswalder str. 84, 15374 Muncheberg, Germany
4
Humboldt University of Berlin, Faculty of Life Science, Institute of Agriculture and Horticulture, Division of Land Use Systems, Albrecht-Thaer-Weg 5, 14195 Berlin, Germany
*
Author to whom correspondence should be addressed.
Agronomy 2017, 7(3), 55; https://doi.org/10.3390/agronomy7030055
Submission received: 11 July 2017 / Revised: 12 August 2017 / Accepted: 16 August 2017 / Published: 21 August 2017
(This article belongs to the Special Issue Sustaining soil functions in agro-ecosystems)

Abstract

:
The decline in soil productivity amidst efforts to increase crop yield in Sub Saharan Africa (SSA) has made it imperative to assess the current fertilization management approaches. This study was conducted in two agroecological zones (i.e., Guinea Savannah (GS) and Deciduous forest (DF)) of Ghana to evaluate how different fertilization schemes in the long term (>5 years) impacted the soil biochemical properties. Soil samples under four fertilization schemes (inorganic fertilizer only, low-to-medium organic residues only, inorganic fertilizers plus low-to-medium organic residues, and no fertilization) from 20 farmers’ field were sampled from March to April 2015. Soil biochemical quality indicators were determined using standard procedures. Overall, the average chemical and microbial biomass contents for most indicators were significantly higher in DF compared to GS. Relative to the reference sites, soil quality improvement were observed under inorganic fertilization in both agroecologies in contrast to significant soil deterioration (26.5%) under sole organic residue application in GS. Furthermore, the results showed that increased inorganic fertilization rate alone or combination with organic residues improved soil quality relative to the reference. The present results suggest the need to raise the current fertilizer application rates, especially in GS in order to enhance optimum soil productivity.

1. Introduction

Estimates show that Africa holds 52% of the world’s remaining arable land [1] that can be utilized for agricultural production. In recent years, high annual food production rate has been recorded in Sub Saharan Africa (SSA) relative to the other regions [2]. This validates the prospects of agriculture in boosting the economic growth in many African countries. Even though the trend looks promising, agricultural productivity in SSA is faced with many difficulties. For instance, although new crop productivity improvement techniques have been introduced in many parts of the world [3], smallholder farmers predominantly in SSA are largely unable to benefit.
Ghana’s economy is hugely dependent on agriculture and an estimated 44% of the population is involved with a significant rural-dwelling proportion [4]. Their farming practices are highly diverse [5] due to their risk averse nature, economic situation and conservative lifestyle. This reflects variability in the crop yield as well as the soil biochemical properties, even though little on farm research exists in SSA focusing on the interaction of soil characteristics and agricultural management practices. Farming in Guinea savannah (GS) and deciduous forest (DF) zones are typically rain-fed and is characterized by the use of traditional management practices [4]. Both zones are major contributors of agricultural products for domestic and international markets. The main crops grown in GS include maize (Zea mays), yam (Dioscorea spp.), sorghum (Sorghum bicolor), millet (Pennisetum americanum), rice (Oryza sativa) and shea (Vitellaria paradoxa). In the DF, maize (Zea mays), cassava (Manihot esculenta), plantain (Musa paradisiaca) and cash crops like cocoa (Theobroma cacao) and oil palm (Elaeis guineensis) are commonly cultivated. Soil fertility approach is one notable transitioning practice that is differently practiced among farmers in both zones [6,7] and ranges from inorganic to organic amendments or combination of both, fallow periods or even no fertilization. Such differences are reflected in both the type and rates of resource inputs. Consequently, the choice of fertilization practice in the long term impacts the soil physical, chemical and microbial composition differently [8,9].
The efficient use of fertilizer is reflected in nutrient availability to crops [10], as influenced by the synchrony of crop growth with dose and time of application [11], holding other factors constant. For example, soil nitrogen (N) together with total organic carbon (C), extractable phosphorus (P) and bulk density have the ability to reveal changes in microbial community dynamics, mineralization, nutrient availability, humification, and soil porosity [12]. On the other hand, soil microbes have been recognized to influence crop productivity by controlling N dynamics and its synchrony with crop demand [5], hence their presence is important in soil productivity studies especially in SSA soils where high nutrient deficiencies have been reported [13].
This study is one of the few reports that characterize soils under different fertilization and management practices in Ghana. It is important for the development of adaptable standard farming practices aimed at minimizing the negative effects of common crop production practices. The main objective of this study was to examine how long-term fertilization regimes and management practices impact soil chemical and microbial properties in two agroecological zones. The specific objective was to determine the relationship between the current rate of fertilization and soil microbial biomass indicators.

2. Results

2.1. Basic Soil Chemical Properties

Across the 20 farms, soil C and N related indicators, as well as available P, were significantly higher in the DF soils compared to the GS (Table 1). Average soil carbon-to-nitrogen (CN) ratio of DF sites was 6.07 while that of GS was 4.76. At DF, inorganic fertilizer treatment and the reference and respectively had the highest total nitrogen (TN) and total carbon (TC) contents, although no significant differences were observed. Among the GS sites, inorganic fertilizer treatment showed the highest significant soil TC (6.84 g kg−1) and CN ratio contents than the other fertilization types, in contrast to soil TN where no significant differences were observed.
On the other hand, the nitrates and ammonium (NO3–N, NH4+–N) and available P contents of the inorganic fertilizer treatment at DF were significantly higher relative to the other fertilization types. Similarly, at GS, the highest NO3–N (107.89 mg kg−1) and NH4+–N (65.02 mg kg−1) contents were observed in the inorganic fertilizer treatments.
Fertilization practice significantly impacted the soil organic matter (SOM) contents (Table 1). At DF, although not significantly different, higher SOM content was observed in the inorganic fertilizer treatments compared to the reference and combined application (organic residue plus chemical fertilizer) sites. Among the GS sites, the highest significant SOM content was observed in the reference. There were no clear differences in the soil pH among the studied sites in both agroecological zones. The GS sites, although with high variation showed higher soil cation exchange capacity (CEC) values compared to the DF. The highest significant values at GS was observed in the inorganic fertilizer and no fertilizer input treatments while no statistical differences were observed among the DF treatments.

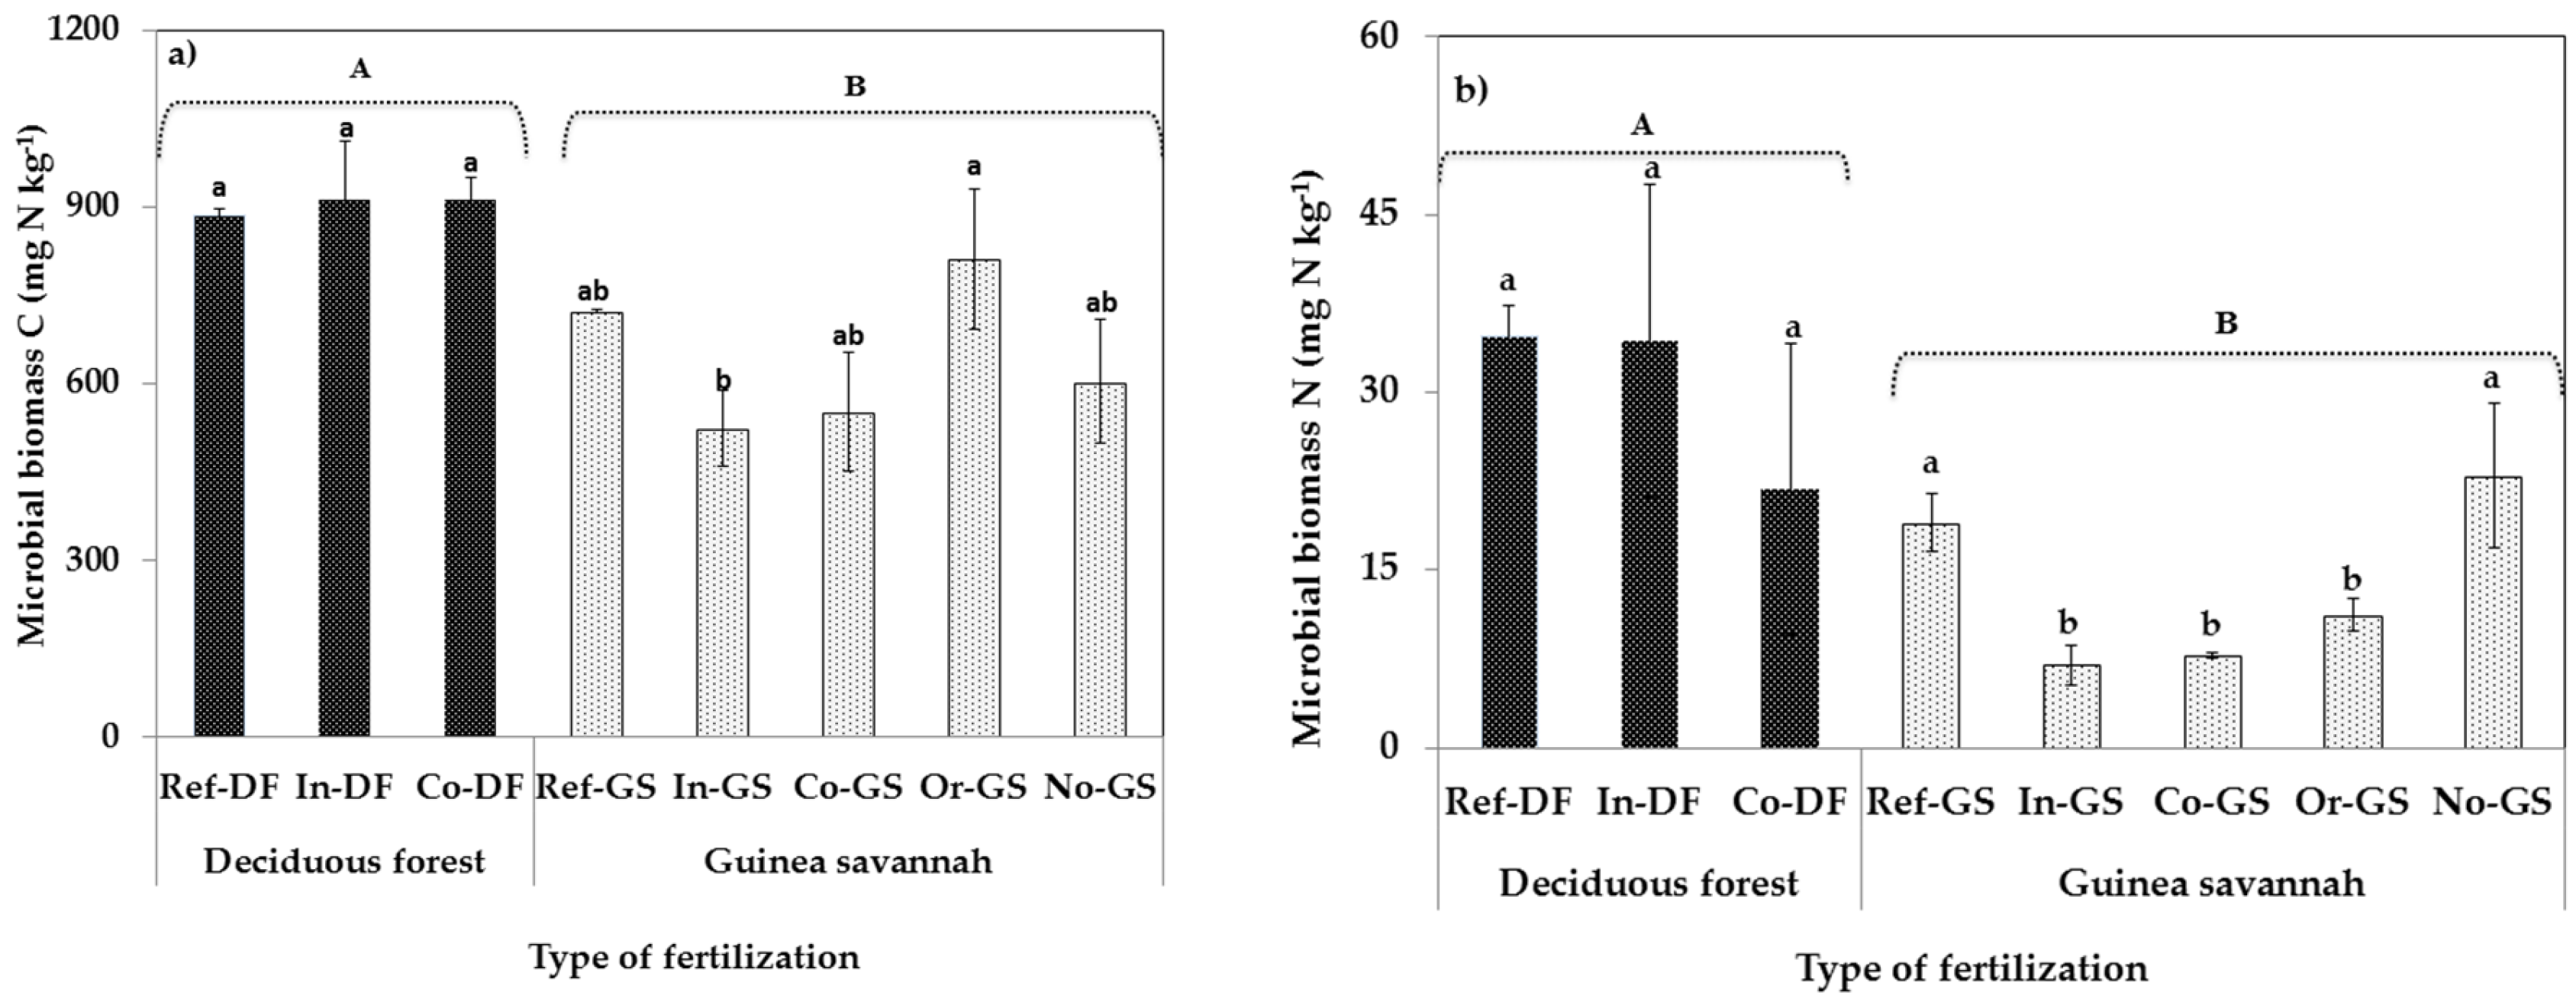
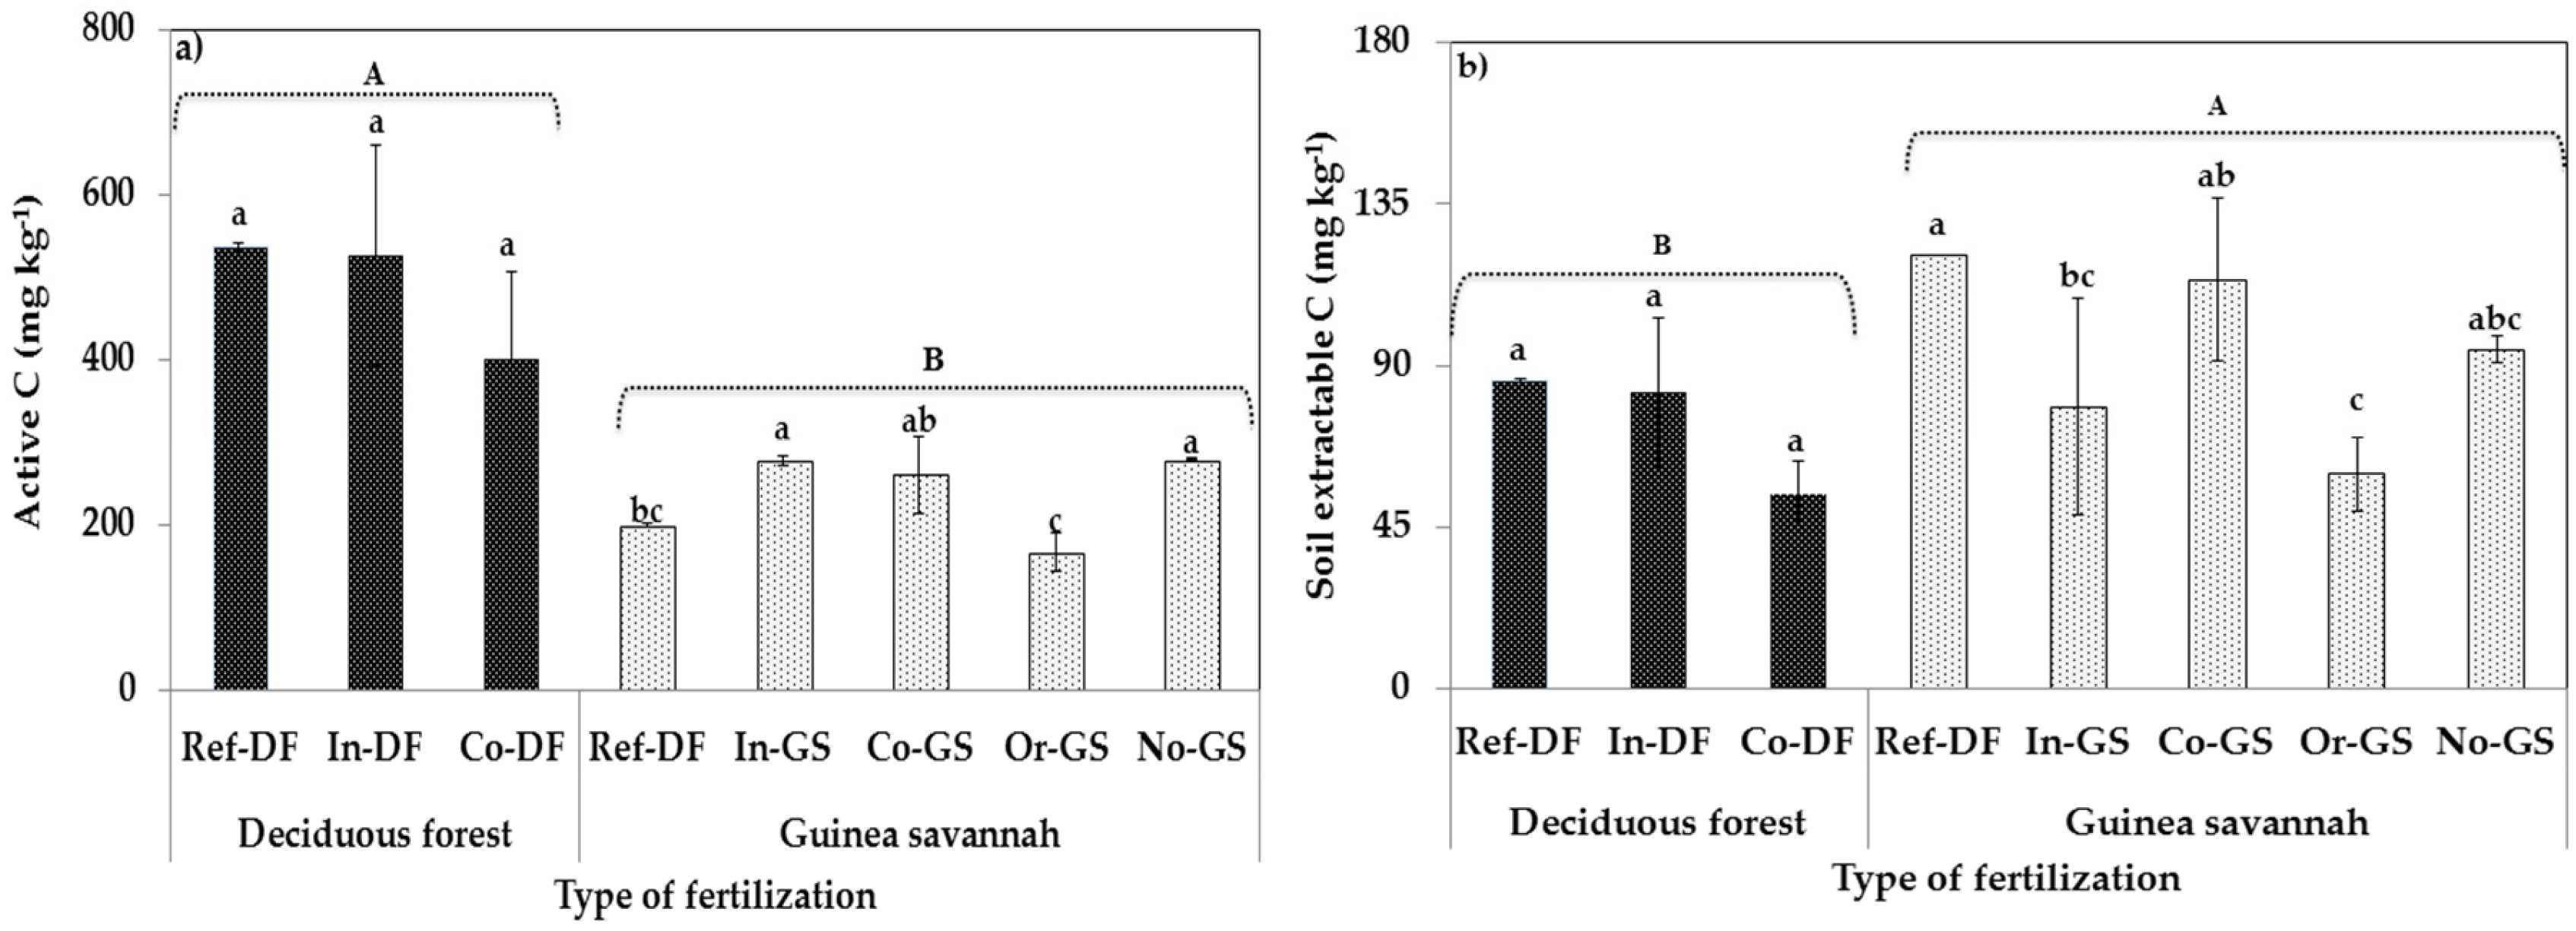
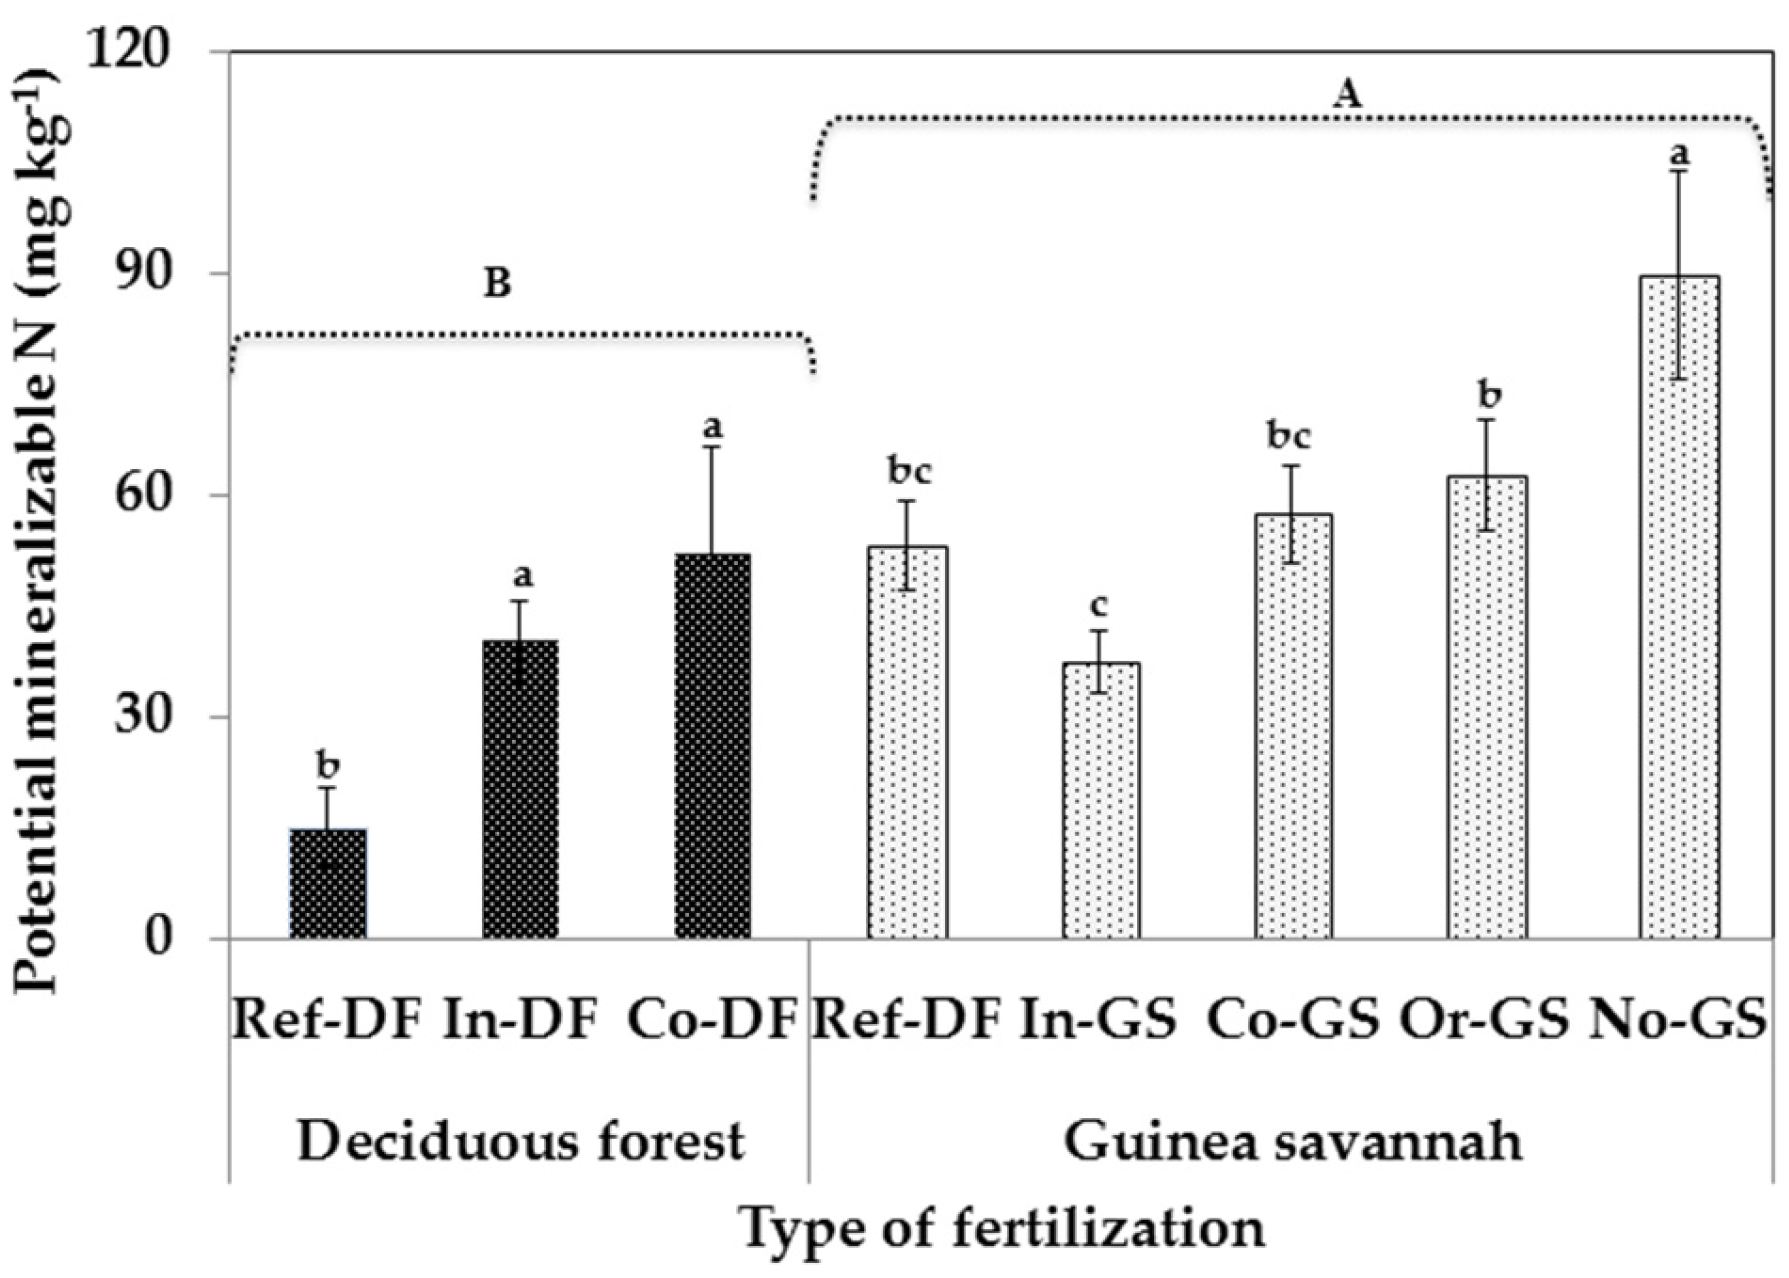
2.2. Microbial Biomass Content-Differences Among Sites

Soils under the DF zone showed higher soil microbial biomass C and N (MBC and MBN) contents but lower MBC-to-MBN ratio compared to GS sites regardless of fertilization type (Figure 1). The average MBC (904.21 mg kg−1) and MBN (30.32 mg kg−1) contents in DF sites were almost twice higher than that of GS. At GS, the no fertilization input treatment and the reference showed the highest significant MBN contents, compared to the other fertilization types. Additionally, similar observations were made for MBC content as in the case of the sole low-to-medium organic residue amendment.
Similar to the microbial biomass contents, active C contents in DF was significantly higher than that in GS (Figure 2a). At GS, the no fertilizer input (278.63 mg kg−1) and only inorganic fertilizer treatment (277.71 mg kg−1) had significantly higher active C contents while the lowest was found in the sole organic residue amendment (165.73 mg kg−1). Among the DF sites, however, there were no statistical differences in soil active C contents. In contrast to soil MBC, MBN and active C contents and irrespective of fertilization practices, significantly higher average extractable C (Extr C) and potential mineralizable nitrogen (PMN) values were recorded for GS sites compared to the DF (Figure 2b and Figure 3). The highest Extr C content at GS was found in the reference (120.75 mg kg−1) followed by the co-application of organic residues with inorganic fertilizer treatment (114.13 mg kg−1) while the lowest was in the sole organic residue amendment (59.72 mg kg−1). In contrast, no significant differences in Extr C were observed among the DF sites. The highest PMN content among the GS sites was observed in no fertilization input treatment followed by the sole organic residue amendment with only inorganic fertilizer treatment being the lowest.
The average deterioration index (DI) ranged from −31.0% to 26.5% with DF sites showing lower deterioration relative to the GS (Figure 4a). The lowest DI was observed in the inorganic fertilization treatment while the highest was in the organic residue amendment. Both fertilization schemes in the DF sites showed negative DI values. However, at GS, only the inorganic fertilization and no fertilization treatments showed negative deterioration. The carbon management index (CMI) at DF was higher in the inorganic fertilizer treatment, though not significantly different from the combined application amendment (Figure 4b). Similarly, the highest CMI at the GS was observed in the inorganic fertilizer treatment while the lowest was in the sole organic residue amendment.

3. Discussion

3.1. Fertilization Type and Climate Effects on Soil Chemical Properties

The basic soil fertility status for most of the studied sites (Table 1) was relatively higher than values reported by Issaka et al. [14]. However, these concentrations are generally below the threshold for attaining the optimum crop yield [15]. Inorganic N and extractable P measure the two most important and limiting soil nutrients in typical productive land management systems [5,12]. Similarly, CN ratio is indicative of the capacity of the soil to store and recycle nutrients [16]. As such, the reported low soil nutrient contents threaten crop and soil productivity. Although this study has no information on yield output, a report by Benin et al. [17] revealed enhanced crop yield in the country during seasons of increased inorganic fertilizer application due to subsidy placement.
Soils in both zones are similar in characteristics but exist in different climates [18]. In the present study, however, soils in the DF showed high nutrient content compared to GS. Similar to this finding, Issaka et al. [14] reported high soil TC, TN, available P and SOM in DF relative to GS zone. The relative high soil nutrient content in DF sites is associated with the high fertilizer application rates as shown by a positive correlation between the rate of fertilizer application and soil chemical content (Table 2). In contrast, the low fertilizer application rate in a continuous cropping manner under climate-driven high SOM decomposition in GS [19], may have contributed to the observed low soil C, N, and P composition.
Only inorganic fertilizer application followed by co-application of organic residues with inorganic fertilizers proved superior among the DF sites. Similarly, at the GS, sole chemical fertilization resulted in relatively higher soil nutrients status, in contrast to the lower values observed for the sole organic residues (Table 1). The enhanced productivity of inorganic fertilizers in both zones relates to its readily available forms, thereby ensuring quick absorption by plants. Additionally, the rate of input application correlated with a number of soil properties (Table 2). Hence, increased inorganic fertilization in both agroecological zones is promising although concerns of its high cost and price instability [20] coupled with the low economic status of Ghanaian farmers may limit its optimal use. Moreover, problems regarding the potential topsoil acidification due to continuous application of inorganic fertilizers in soils with poor buffering capacity have been reported [21], and the subsequent long-term soil fertility enhancement is still not clear.
In the present study, non-fertilizer input treatment at GS as regulated by short fallow periods enhanced the soil chemical composition. However, accelerated human population growth, which consequently reduces the length of the fallow period makes non-fertilization based agronomic practice a less sustainable option.
It must be mentioned that the organic inputs used by farmers either in sole organic residue systems or in combined application with inorganic fertilizers (Table S1) are materials of low to medium quality [21]. The nutrient composition of such organic materials is usually low, thus their slow N inputs to the soil are inadequate. Additionally, the nutrient release pattern of such organic residues is not commonly matched to the nutrient demands of many cultivated crops [22]. Besides, all year availability of these organic residues in SSA has been questioned due to its competitive use as roofing material, fuel, and fodder for livestock [23].
The results of the present study show that combined input application of organic and inorganic resources in both agroecological zones gave better responses in basic soil fertility status compared to sole organic residue application. This reiterates the need to encourage co-application of inorganic and organic fertilization [5]. Hence, inherent quality characteristics and decomposition trends of locally available organic materials must be investigated to allow for their efficient incorporation into crop production systems [24].

3.2. Fertilization Type on Soil Microbial Biomass Indicators

Across the wide array of different fertilization systems, microbial composition differed (Figure 1, Figure 2 and Figure 3). The high rate of fertilizer application in DF relative to GS sites partly as a result of farmers’ low economic status [25], enhanced the growth of vegetation in DF and subsequently resulted in an increased SOM contents. The soluble C compounds from SOM consequently induced microbial biomass community [26]. This finding was supported by significant relationships between the rate of fertilizer application and soil microbial biomass indicators (Table 3). Moreover, soil microbial biomass was largely influenced by soil nutrients as shown by the significant positive association with the resultant soil TN. In support of this result, Lovell et al. [27] reported that long-term addition of N at 200 kg N ha−1 to previously unfertilized soils increased MBC by 60% and MBN by 63%. The observed low PMN at DF sites is related to the high SOM composition which triggered soil microbial population during incubation, resulting in inorganic N immobilization. This assumption was justified by the observed low PMN content in most DF sites coupled with the negative correlation with other microbial parameters (Table 2).
The low microbial composition at the GS sites (Figure 1, Figure 2 and Figure 3) can be also attributed to the severe bush burning practices during harmattan, together with extreme drought conditions [25]. A number of reports have highlighted the effects of soil moisture and temperature [28], burning [9] on soil microbial biomass and fertility. According to this study, GS sites showed high Extr C contents (Figure 2b), predominantly from the burning regimes but did not stimulate the soil microbial biomass. The rampant bush burning activity rather released various charred biomass forms into the soil mass, which subsequently contributes to soil CEC. According to Liang et al. [29], black carbon content in soil is effective in retaining soil CEC. In line with the present finding, Ajwa et al. [30] reported that long-term burning and N fertilization reduced MBC and MBN contents although total C was not significantly altered.
The type of fertilizer inputs in each zone impacted the soil microbial biomass (Figure 1). This was especially evident in the only inorganic fertilizer or the combined application of organic residues with inorganic fertilizer treatments. Applications of inorganic fertilizers have often produced inconsistent effects on soil microbial biomass or its fractions; enhancement [31], suppression [32], little or no effect [16,33]. The present results of DF are in accord with Grego et al. [33], where inorganic N application showed minimal effects on the soil microbial biomass compared to other fertilization types. Such discrepancies may be attributed to the soil type differences and their interactive effects with fertilization inputs as well as the time of measurement after inorganic fertilizer addition. In contrast, none of the fertilization practices in GS showed consistent effects on the soil microbial biomass indicators. Although the non-fertilization input approach showed encouraging results on soil microbial biomass content, human population pressure which subsequently makes agricultural lands less available has rendered fallow agriculture unsustainable. Sole low-medium quality organic residue amendment for extended period coupled with burning activity is less sustainable as depicted in the low soil chemical and microbial biomass contents.
The computed soil DI reflects the impacts of land management on the studied soil properties compared to the respective reference sites [34,35]. The higher the DI value, the higher the soil deterioration and vice versa. Irrespective of the agroecological zone differences, increased rate of inorganic fertilizer application in either inorganic or combined fertilization enhanced soil quality (Figure 4). This relates to the increased readily available mineral N which alone or synergistically resulted in enhanced growth of vegetation and subsequently increased C inputs to the soil. The contradiction in CMI of the present study compared to Blair et al. [36] and Yang et al. [37] are ascribed to the differences in the rate of application and organic material quality. Unlike the sole low-to-medium organic residues incorporation in the GS, the relatively high application rate with rich dairy manure as observed in Blair et al. [36] and Yang et al. [37] induced shifts in C dynamics as a percentage of total C and that subsequently increased the CMI.

4. Materials and Methods

4.1. Site Description and Soil Samplings

This study was carried out in 8 farming communities in the GS and DF zones of Ghana. The communities in GS comprised; Bannayilli, Janton Dabongshie, Dimabi, Nyankpala and Zugu, all located in the northern region of Ghana (9°15’1” N, 0°52’49” W; 170 m above sea level (a.s.l.)). In the DF, the communities constituted Akroso and Kade (6°8’48” N, 0°53’58” W; 170 m (a.s.l.) in the eastern region, and Mankessim (5°17’26’’ N, 0°58’57” W; 10 m (a.s.l.)) in the central region. Mean monthly rainfall (1983–2012) and mean temperature (1983–2012) obtained from Ghana Meteorological Agency showed a bimodal rainfall pattern and relatively lower temperature in DF relative to GS (Figure 5). The soils in GS are defined as weathered Lixisols/Luvisols/Plinthosols [38]. The soils in DF are Forest Ochrosols and are characteristically similar to those in GS [18].
In each agroecological zone, common fertilization schemes being adopted by farmers were investigated. In the DF, the two notable fertilization practices were sole inorganic fertilizer application (NPK and sulphate of ammonia (SOA)) and inorganic fertilizer (NPK and urea), with low-to-medium organic residues.
In the GS, however, the four fertilization practices comprised; sole inorganic fertilizer application (NPK and SOA), inorganic fertilizer, (NPK and SOA) with low-to-medium organic residues, sole low-to-medium organic residues, and no fertilization. It must be emphasized that the total nutrient input in the studied fertilization practices varied and were all applied below the conventional recommended rates. This study, however, sought to evaluate the effects of each ‘low-input’ fertilization approach on soil productivity under specific agronomic schemes in their respective agroecological zones. Common farmland improvement approaches in each zone were selected as reference sites. At GS, the soil was taken from an average of five years old agroforestry field (Ref-GS) while neighboring 10-year fallow fields (Ref-DF) were chosen for the DF. For each fertilization type, 3 different farms with similar agronomic practices and input application rates under at least 5 years of continuous cultivation were chosen as replicates. Table S1 shows the detailed fertilization inputs and agronomic characteristics of the studied fields.
Soil sampling was performed on each field in the dry season from March-April, 2015 using hand auger. On each field, ten core samples were randomly collected from 0 to 15 cm soil depth and pooled to form a composite sample. Soil samples were passed through a 2-mm sieve, stored in plastic bags at temperatures below 4°C before further biochemical analysis.

4.2. Soil Physicochemical Analyses

Soil Extr C was determined as described by Hu et al. [39]. Briefly, a 20 g dry weight soil equivalent was extracted with 50 mL 0.5 M K2SO4 after shaking mechanically at 120 rpm for 1 h. The dissolved organic C in filtrates was analyzed using TOC-L analyzer (TOC-L CPH, Shimadzu Corporation, Kyoto, Japan). Inorganic N was estimated by extracting a 10 g equivalent dry weight soil with 100 mL of 2 M KCl. The NH4+–N and NO3–N contents in the filtrates were respectively determined using the indo-phenol-blue colorimetric method [40] and continuous flow injection analysis method [41], on a UV-VIS spectrophotometer (UV mini 1240, Shimadzu, Kyoto, Japan). Total N and total C contents in soil (0.1 g dry weight) were determined using an automatic sensitive CN analyzer (Sumigraph NC-80 Auto analyzer; Sumika Chemical Analysis Service Ltd., Osaka, Japan). Available p content in soil samples was first extracted with 0.05 N sulphuric acid solution (H2SO4) buffered with 0.02 M ammonium sulphate (NH4 (SO4)2, pH 3) followed by colorimetric determination using the truog-soluble P method [42].
Soil pH was measured in the supernatant suspension of a 1:2.5 solid-liquid mixture (pH-H2O) with a Beckman PKG-260 pH meter (Beckman Coulter Instruments Inc., Fullerton, CA, USA). The CEC was determined by extracting soil samples with 1 M ammonium acetate (NH4OAc, pH 7) following the method by Schollenberger and Simon [43].

4.3. Soil Microbial Analyses

MBC and MBN were estimated using the modified fumigation extraction method proposed by Hobbie [44]. Briefly, 20 g dry weight equivalent sub soil samples designated as fumigated and non-fumigated were weighed out from each soil mass. Samples designated as fumigated were kept in a desiccator clouded with alcohol-free chloroform for 72 h. Non-fumigated samples and fumigated samples were extracted with 0.5 M of 50 mL K2SO4. The dissolved organic C and N in 0.5 M K2SO4 extracts were respectively analyzed with TOC-L and TNM-L analyzer (TOC-L CPH, Shimadzu Corporation, Kyoto, Japan). Soil MBC was estimated from the relationship MBC = C/KEC. The calibration value (KEC) estimated as 0.45 [45], was used to convert the extracted organic C to microbial biomass C. Similarly, soil MBN was determined in the same extract from the relationship MBN = N/KEN, where KEN given as 0.54 according to Brookes et al. [46] was used to convert the extracted organic N to microbial biomass N. PMN was determined using the method described by Gugino et al. [47]. Briefly, NH4+-N contents in soil were measured at time = 0 and t = 7 days for different sub samples of the same soil mass. At time = 0, NH4+–N contents in 10 g dry weight soil was determined in 2 M KCl extract. For time = 7, 10 g dry weight soil was incubated with 10 mL distilled water at 30 °C for 7 days. The incubated soil mixture was extracted with 30 mL of 2.67 M KCl solution. NH4+–N content in both extracts (at time = 0 and time = 7) were determined on a UV-VIS spectrophotometer. PMN is the difference between KCl-extractable NH4+–N contents before (time = 0) and after (time = 7) incubation.
Active C was determined by following the procedure described by Weil et al. [48]. Soil sample (5 g) was mixed with 2 mL of 0.02 M KMnO4 and 18 mL distilled H2O in a centrifuge tube. The mixture was shaken for approximately 2 min and allowed to sit for 10 min. After settling, 0.5 mL of supernatant was mixed with 49.5 mL deionized water in a centrifuged tube and the active C content was determined on a UV-VIS spectrophotometer at an absorbance of 550 nm. SOM per unit mass of soil was determined by dry combustion [49] using the Electric muffle furnace (FUL 230 FA, Advantech Toyo Co., Ltd., Tokyo, Japan).

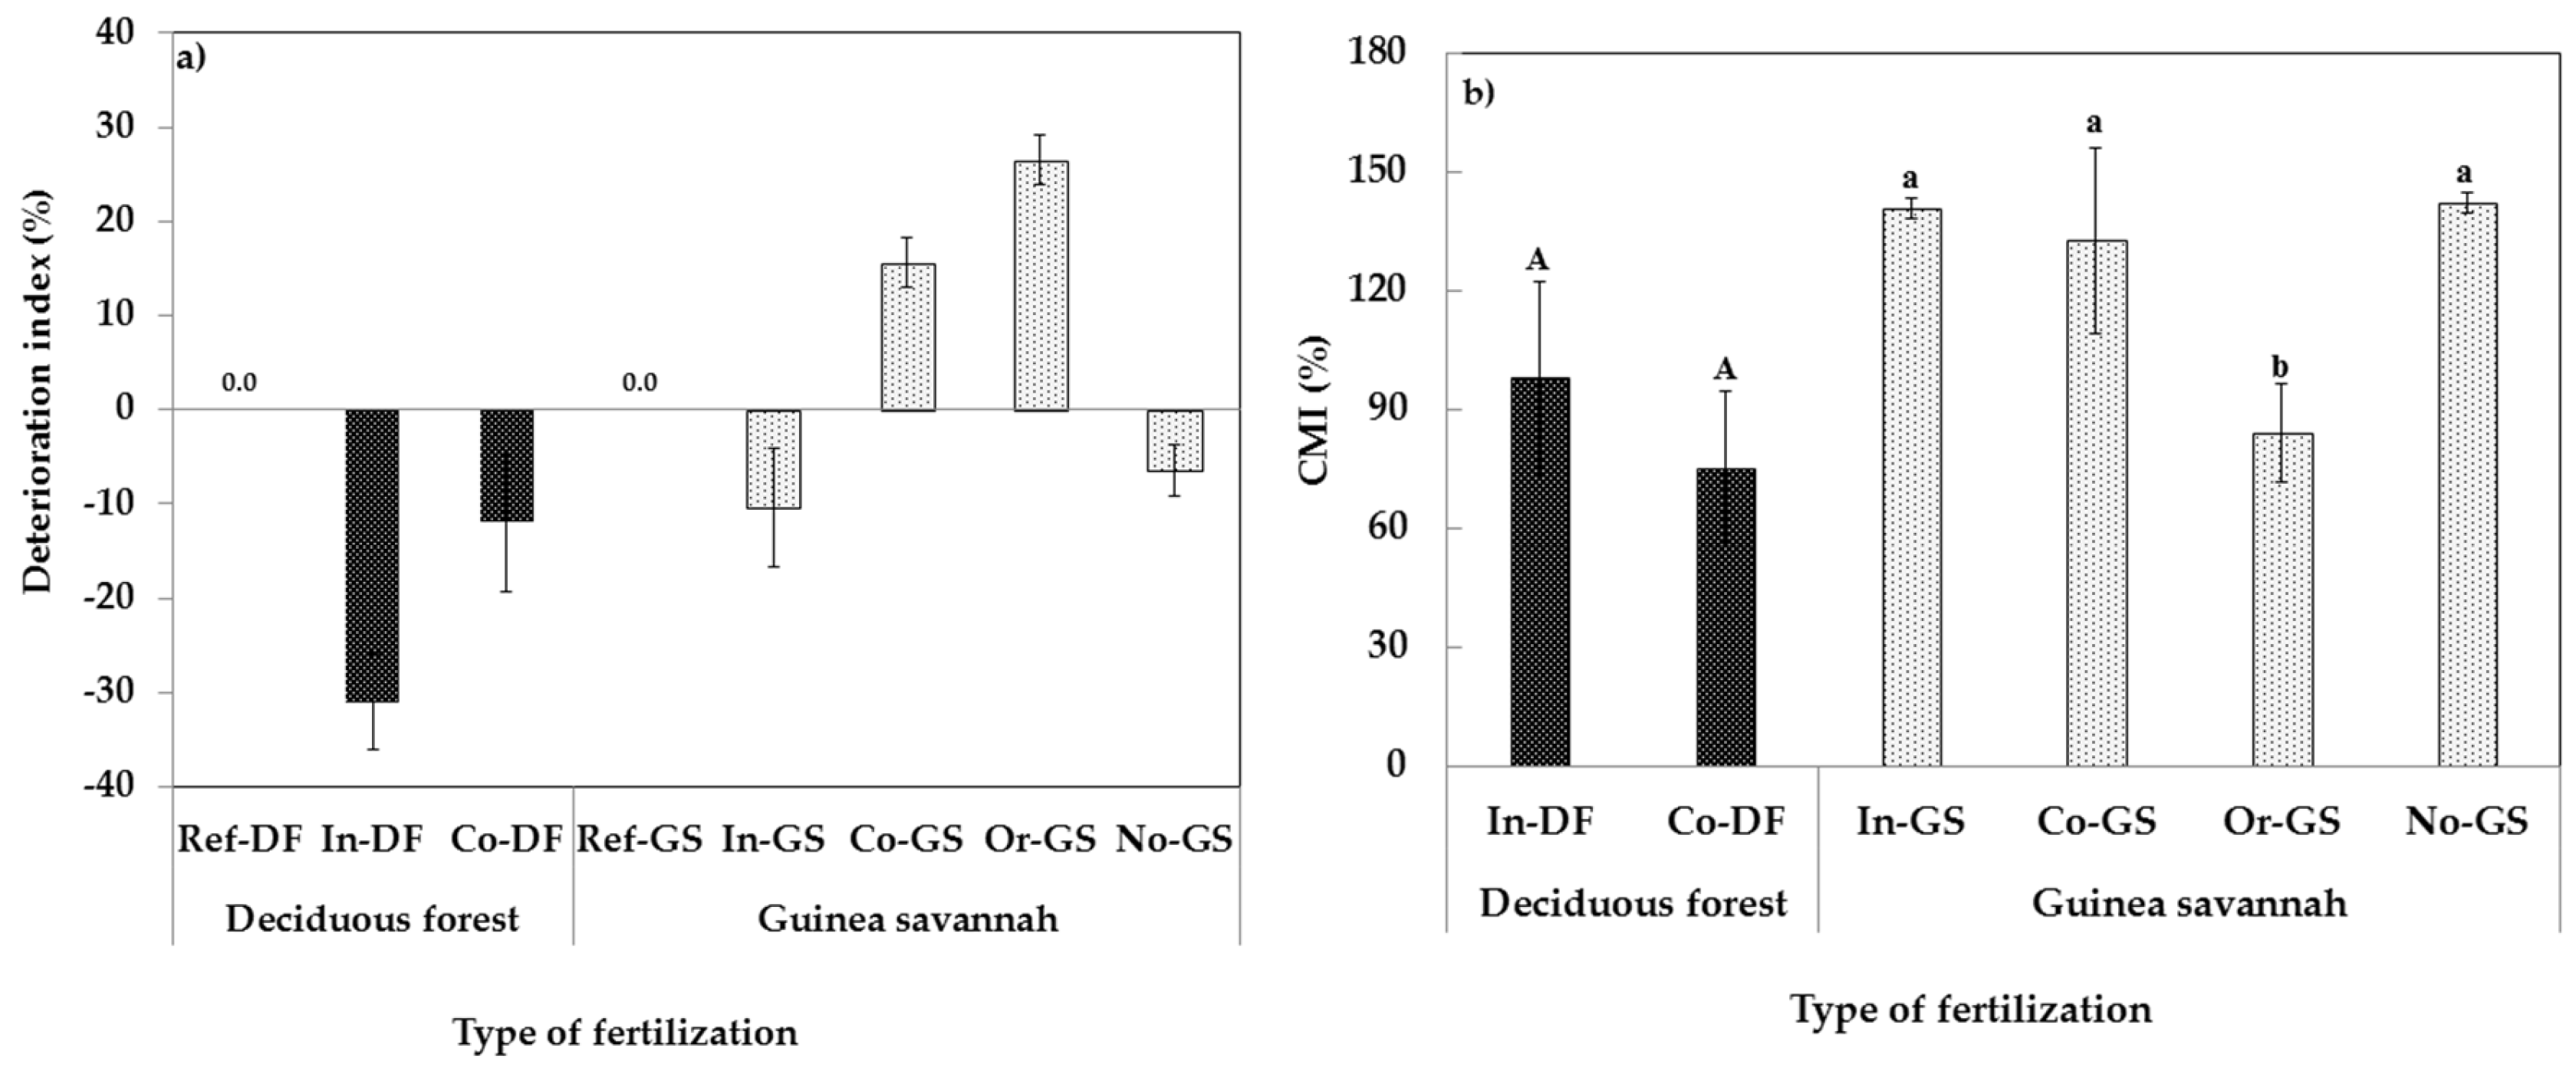
4.4. Calculation of Deterioration Index (DI) and Carbon Management Index (CMI)

DI was calculated following the procedure of Adejuwon and Ekanade [34]
DI = ( Ref x Ref ) × 100 .
DI is the percentage changes of the individual fertilization schemes for the different soil properties relative to their respective reference sites. This was based on the assumption that the individual fertilization sites once had a similar quality composition as their reference sites [35]. The Ref is the reference mean value of a specific soil property and x is the corresponding soil property for the comparable fertilization scheme. The different soil properties comprised TN, TC, NO3–N, and NH4+–N, Extr C, active C, PMN, MBN, MBC, and SOM.
CMI, which is a measure of the soil C dynamics relative to the reference site [50] was calculated for each treatment in both agroecological zones as follows:
(1)
C pool index (CPI) was expressed as CPI = Sample   total   C Reference   sample   total   C
(2)
Lability index (LI) was calculated as LI = Lability   of   C   in   sample   soil Lability   of   C   in   reference   soil where,
(3)
Lability   of   C = Active   C   content TOC-Active   C   content
(4)
And CMI is given as C M I = C P I × L I × 100

4.5. Data Analysis

The data were subjected to analysis of variance (ANOVA) using SAS software (SAS Institute Inc., Cary, NC, USA. Version 9.0) to detect significant differences among the different fertilization practices. Mean differences were compared using Duncan’s multiple range test at p < 0.05. Correlations between the measured soil parameters were done using the Pearson’s correlation coefficient. Multiple regression analysis was done among the soil parameters using the SigmaPlot program, version 11 (Systat Software Inc., San Jose, CA, USA).

5. Conclusions

The present study provides evidence showing how different types of fertilization influence the resultant soil fertility status of farmlands. Overall, the advantage of chemical fertilization, although applied below recommended rates was evident on soil biochemical composition in both agroecologies relative to the reference sites where conventional soil improvement approaches were being practiced. Additionally, high rates of fertilizer application in DF relative to GS regulated the resultant soil chemical composition and further contributed to enhanced soil microbial biomass dynamics. This was especially evident in either the sole inorganic fertilizer application treatment or its combined application with organic resources. On the other hand, organic residues incorporation as sole soil resource input in GS induced low soil productivity. Hence, it is suggested that the current low fertilization rate, especially in GS, must be increased to reasonable thresholds as in the deciduous forest in order to ensure its sustained effects on soil productivity.

Supplementary Materials

The following are available online at https://www.mdpi.com/2073-4395/7/3/55/s1. Table S1. Main management and agronomic characteristics of the studied sites.

Acknowledgments

The authors appreciate the assistance from Edem Daniel Halolo and Alex Yeboah (Savannah Agriculture Research Institute (SARI), Tamale) during soil sampling. The first author is particularly grateful to the Ministry of Education, Culture, Sports, Science and Technology (MEXT), Japan for the financial support throughout his Ph.D. study. The publication of this article was funded by the Open Access Fund of the Leibniz Association.

Author Contributions

Omari R.A. conceived, designed, performed experiment, analyzed data and wrote the article; Sarkodee-Addo E. assisted in the conception, design, and experiment execution; Fujii Y. and Oikawa Y contributed reagents, materials and assisted in the implementation of study; Bellingrath-Kimura S.D. coordinated the study from its conception to publication.

Conflicts of Interest

The authors declare no conflict of interest.

References

  1. Deininger, K.; Byerlee, D.; Lindsay, J.; Norton, A.; Selod, H.; Stickler, M. Rising Global Interest in Farmland. Can It Yield Sustainable and Equitable Benefits; World Bank Publisher: Washington, DC, USA, 2011; pp. 9–44. [Google Scholar]
  2. OECD-FAO. Agriculture in Sub-Saharan Africa: Prospects and challenges for the next decade. In OECD-FAO Agricultural Outlook 2016–2025; OECD Publishing: Paris, France, 2016; pp. 1–39. [Google Scholar]
  3. Giller, K.E.; Witter, E.; Corbeels, M.; Tittonell, P. Conservation agriculture and smallholder farming in Africa: The heretics’ view. F. Crop. Res. 2009, 114, 23–34. [Google Scholar] [CrossRef]
  4. MoFA. Agriculture in Ghana. Facts and Figures (2010); MoFA: Accra, Ghana, 2011.
  5. Vanlauwe, B.; Bationo, A.; Chianu, J.; Giller, K.E.; Merckx, R.; Mokwunye, U.; Ohiokpehai, O.; Pypers, P.; Tabo, R.; Shepherd, K.D.; et al. Integrated soil fertility management. Operational definition and consequences for implementation and dissemination. Outlook Agric. 2010, 39, 17–24. [Google Scholar] [CrossRef]
  6. González-Estrada, E.; Rodriguez, L.C.; Walen, V.K.; Naab, J.B.; Koo, J.; Jones, J.W.; Herrero, M.; Thornton, P.K. Carbon sequestration and farm income in West Africa: Identifying best management practices for smallholder agricultural systems in northern Ghana. Ecol. Econ. 2008, 67, 492–502. [Google Scholar] [CrossRef]
  7. Houssou, N.; Johnson, M.; Kolavalli, S.; Asante-Addo, C. Changes in Ghanaian Farming Systems: Stagnation or a Quiet Transformation? In IFPRI Discussion Paper 01504; International Food Policy Research Institute: Washington, DC, USA, 2016. [Google Scholar]
  8. Úbeda, X.; Outeiro, L. Physical and Chemical Effects of Fire on Soil. In Fire Effects on Soils and Restoration Strategies; Cerdà Artemi, R.R.P., Ed.; Science Publishers: Enfield, NH, USA, 2009; pp. 105–132. [Google Scholar]
  9. Mataix-Solera, J.; Cerdà, A.; Arcenegui, V.; Jordàn, A.; Zavala, L.M. Fire effects on soil aggregation: A review. Earth-Sci. Rev. 2011, 109, 44–60. [Google Scholar] [CrossRef]
  10. Baligar, V.C.; Fageria, N.K.; He, Z.L. Nutrient Use Efficiency in Plants. Commun. Soil Sci. Plant Anal. 2001, 32, 921–950. [Google Scholar] [CrossRef]
  11. Spiertz, J.H.J. Nitrogen, sustainable agriculture and food security. A review. Agron. Sustain. Dev. 2010, 30, 43–55. [Google Scholar] [CrossRef]
  12. McBride, A.C.; Dale, V.H.; Baskaran, L.M.; Downing, M.E.; Eaton, L.M.; Efroymson, R.A.; Garten, C.T.; Kline, K.L.; Jager, H.I.; Mulholland, P.J.; et al. Indicators to support environmental sustainability of bioenergy systems. Ecol. Indic. 2011, 11, 1277–1289. [Google Scholar] [CrossRef]
  13. Sanchez, P.A. ECOLOGY: Soil Fertility and Hunger in Africa. Science 2002, 295, 2019–2020. [Google Scholar] [CrossRef] [PubMed]
  14. Issaka, N.R.; Mohammed, M.; Tobita, S.; Nakamura, S.; Owusu-Adjei, E. Indigenous fertilizing materials to enhance soil productivity in Ghana. In Soil Fertility Improvement and Integrated Nutrient Management—A Global Perspective; Whalen, K.J., Ed.; InTech: Rijeka, Croatia, 2012; pp. 119–134. [Google Scholar]
  15. Marx, E.S.; Hart, J.; Stevens, R.G. Soil Test Interpretation Guide. Ec 1478; Oregon State University: Corvallis, OR, USA, 1999. [Google Scholar]
  16. Šimon, T. The influence of long-term organic and mineral fertilization on soil organic matter. Soil Water Res. 2008, 3, 41–51. [Google Scholar]
  17. Benin, S.; Johnson, M.; Abokyi, E.; Ahorbo, G.; Jimah, K.; Nasser, G.; Owusu, V.; Taabazuing, J.T.A. Revisiting agricultural input and farm support subsidies in Africa: The case of Ghana’s mechanization, fertilizer, block farms, and marketing programs. In IFPRI Discussion Paper 01300; International Food Policy Research Institute: Washington, DC, USA, 2013. [Google Scholar]
  18. Adjei-Gyapong, T.; Asiamah, R. The interim Ghana soil classification system and its relation with the World Reference Base for Soil Resources. In FAO Report on Soil Resources; Food and Agriculture Organization: Rome, Italy, 2002; pp. 9–13. [Google Scholar]
  19. Heve, W.K.; Olesen, J.E.; Chirinda, N.; Adiku, S.G. K. Targeted management of organic resources for sustainably increasing soil organic carbon: Observations and perspectives for resource use and climate adaptations in northern Ghana. Acta Agric. Scand. Sect. B 2016, 66, 178–190. [Google Scholar] [CrossRef]
  20. Fuentes, P.A.; Bumb, B.; Johnson, M. Improving Fertilizer Markets in West Africa: The Fertilizer Supply Chain in Ghana; International Fertilizer Development Center (IFDC) and International Food Policy Research Institute (IFPRI): Muscle Shoals, AL, USA; Washington, DC, USA, 2012. [Google Scholar]
  21. Vanlauwe, B.; Giller, K.E. Popular myths around soil fertility management in sub-Saharan Africa. Agric. Ecosyst. Environ. 2006, 116, 34–46. [Google Scholar] [CrossRef]
  22. Chirinda, N.; Olesen, J.E.; Porter, J.R.; Schjønning, P. Soil properties, crop production and greenhouse gas emissions from organic and inorganic fertilizer-based arable cropping systems. Agric. Ecosyst. Environ. 2010, 139, 584–594. [Google Scholar] [CrossRef]
  23. Smith, J.; Abegaz, A.; Matthews, R.B.; Subedi, M.; Orskov, E.R.; Tumwesige, V.; Smith, P. What is the potential for biogas digesters to improve soil carbon sequestration in Sub-Saharan Africa? Comparison with other uses of organic residues. Biomass Bioenergy 2014, 70, 73–86. [Google Scholar] [CrossRef]
  24. Omari, R.A.; Aung, H.P.; Hou, M.; Yokoyama, T.; Onwona-Agyeman, S.; Oikawa, Y.; Fujii, Y.; Bellingrath-Kimura, S.D. Influence of Different Plant Materials in Combination with Chicken Manure on Soil Carbon and Nitrogen Contents and Vegetable Yield. Pedosphere 2016, 26, 510–521. [Google Scholar] [CrossRef]
  25. Apusigah, A.A. Promoting sustainable wildfire management in Northern Ghana: Learning from history. Eur. J. Soc. Sci. 2007, 5, 61–76. [Google Scholar]
  26. Liang, B.; Yang, X.; He, X.; Zhou, J. Effects of 17-year fertilization on soil microbial biomass C and N and soluble organic C and N in loessial soil during maize growth. Biol. Fertil. Soils 2011, 47, 121–128. [Google Scholar] [CrossRef]
  27. Lovell, R.D.; Jarvis, S.C.; Bardgett, R.D. Soil microbial biomass and activity in long-term grassland: Effects of management changes. Soil Biol. Biochem. 1995, 27, 969–975. [Google Scholar] [CrossRef]
  28. Allison, S.D.; Treseder, K.K. Warming and drying suppress microbial activity and carbon cycling in boreal forest soils. Glob. Chang. Biol. 2008, 14, 2898–2909. [Google Scholar] [CrossRef]
  29. Liang, B.; Lehmann, J.; Solomon, D.; Kinyangi, J.; Grossman, J.; O’Neill, B.; Skjemstad, J.O.; Thies, J.; Luizão, F.J.; Petersen, J.; et al. Black carbon increases cation exchange capacity in soils. Soil Sci. Soc. Am. J. 2006, 70, 1719–1730. [Google Scholar] [CrossRef]
  30. Ajwa, H.A.; Dell, C.J.; Rice, C.W. Changes in enzyme activities and microbial biomass of tallgrass prairie soil as related to burning and nitrogen fertilization. Soil Biol. Biochem. 1999, 31, 769–777. [Google Scholar] [CrossRef]
  31. Gong, W.; Yan, X.Y.; Wang, J.Y.; Hu, T.X.; Gong, Y.B. Long-term manuring and fertilization effects on soil organic carbon pools under a wheat-maize cropping system in North China Plain. Plant Soil 2009, 314, 67–76. [Google Scholar] [CrossRef]
  32. Ghani, A.; Dexter, M.; Perrott, K.W. Hot-water extractable carbon in soils: A sensitive measurement for determining impacts of fertilisation, grazing and cultivation. Soil Biol. Biochem. 2003, 35, 1231–1243. [Google Scholar] [CrossRef]
  33. Grego, S.; Marinari, S.; Moscatelli, M.; Badalucco, L. Effect of ammonium nitrate and stabilized farmyard manure on microbial biomass and metabolic quotient of soil under Zea mays. Agric. Mediterr. 1998, 128, 132–137. [Google Scholar]
  34. Adejuwon, J.O.; Ekanade, O. A comparison of soil properties under different land use types in a part of the Nigerian cocoa belt. Catena 1988, 15, 319–331. [Google Scholar] [CrossRef]
  35. Islam, K.R.; Weil, R.R. Land use effects on soil quality in a tropical forest ecosystem of Bangladesh. Agric. Ecosyst. Environ. 2000, 79, 9–16. [Google Scholar] [CrossRef]
  36. Blair, N.; Faulkner, R.D.; Till, A.R.; Poulton, P.R. Long-term management impacts on soil C, N and physical fertility. Part I: Broadbalk experiment. Soil Tillage Res. 2006, 91, 30–38. [Google Scholar] [CrossRef]
  37. Yang, X.; Ren, W.; Sun, B.; Zhang, S. Effects of contrasting soil management regimes on total and labile soil organic carbon fractions in a loess soil in China. Geoderma 2012, 177–178, 49–56. [Google Scholar] [CrossRef]
  38. FAO/ISRIC/ISSS. World Reference Base for Soil Resources (WRB). World Soil Resources Report 84; Food and Agriculture Organization: Rome, Italy, 1998. [Google Scholar]
  39. Hu, S.; Coleman, D.C.; Carroll, C.R.; Hendrix, P.F.; Beare, M.H. Labile soil carbon pools in subtropical forest and agricultural ecosystems as influenced by management practices and vegetation types. Agric. Ecosyst. Environ. 1997, 65, 69–78. [Google Scholar] [CrossRef]
  40. Parsons, T.R.; Maita, Y.; Lalli, C.M. A Manual of Chemical and Biological Methods for Seawater Analysis, 1st ed.; Pergamon Press: Oxford, UK, 1984; p. 173. [Google Scholar]
  41. US Environmental Protection Agency. Methods for Chemical Analysis of Water and Wastes. In Environmental Protection Agency; US Environmental Protection Agency: Washington, DC, USA, 1983; p. 491. [Google Scholar]
  42. Truog, E. The Determination of the Readily Available Phosphorus of Soils. Agron. J. 1930, 22, 874–882. [Google Scholar] [CrossRef]
  43. Schollenberger, C.J.; Simon, R.H. Determination of exchange capacity and exchangeable bases in soil-ammonium acetate method. Soil Sci. 1945, 59, 13–24. [Google Scholar] [CrossRef]
  44. Hobbie, S.E. Chloroform Fumigation Direct Extraction (CFDE) Protocol for Microbial Biomass Carbon and Nitrogen. Available online: https://web.stanford.edu/group/Vitousek/cfde.htm (accessed on 29 June 2017).
  45. Beck, T.; Joergensen, R.G.; Kandeler, E.; Makeshin, E.; Nuss, E.; Oberholzer, H.R.; Scheu, S. An inter-laboratory comparison of ten different ways of measuring soil microbial biomass C. Soil Biol. Biochem. 1997, 29, 1023–1032. [Google Scholar] [CrossRef]
  46. Brookes, P.C.; Landman, A.; Pruden, G.; Jenkinson, D.S. Chloroform fumigation and the release of soil nitrogen: A rapid direct extraction method to measure microbial biomass nitrogen in soil. Soil Biol. Biochem. 1985, 17, 837–842. [Google Scholar] [CrossRef]
  47. Gugino, B.K.; Idowu, O.J.; Schindelbeck, R.R.; Van Es, H.M.; Wolfe, D.W.; Thies, J.E.; Abawi, G.S. Cornell Soil Health Assessment Training Manual, edition 2.0; Cornell University: Geneva, NY, USA, 2009. [Google Scholar]
  48. Weil, R.R.; Islam, K.R.; Stine, M.A.; Gruver, J.B.; Samson-Liebig, S.E. Estimating active carbon for soil quality assessment: A simplified method for laboratory and field use. Am. J. Altern. Agric. 2003, 18, 3–17. [Google Scholar] [CrossRef]
  49. Nelson, D.W.; Sommers, L.E. Total Carbon, Organic Carbon, and Organic Matter. In Methods of Soil Analysis Part 3—Chemical Methods; Sparks, D.L., Page, A.L., Helmke, P.A., Loeppert, R.H., Eds.; Soil Science Society of America, American Society of Agronomy: Fitchburg, WI, USA; Madison, WI, USA, 1996; Volume sssabookse, pp. 961–1010. [Google Scholar]
  50. Blair, N.; Daniel, H. The impact of cropping on soil aggregate stability and carbon content. In ASSSI and NZSSS National Soils Conference, Oral Papers’; Australian Soil Science Society Inc.: Melbourne, Vic., Australia, 1996; pp. 17–18. [Google Scholar]
Figure 1. Soil microbial biomass C (a) and microbial biomass N (b) at depth (0–15 cm) of different types of fertilization. Treatment code: Ref-DF, reference DF site; In-DF, inorganic fertilization at DF; Co-DF, inorganic fertilizer, with low-to-medium organic residues at DF; Ref-GS, reference site; In-GS, inorganic fertilization at GS; Co-GS, inorganic fertilizer, with low-to-medium organic residues at GS; Or-GS, sole low-to-medium organic residues at GS and No-GS, no fertilization input at GS.The error bar indicates the standard deviation of three replicates. Small letters (a, b) represent mean differences among fertilization types in each ecological zone and capital letters (A, B) represent mean the difference between the two ecological zones.
Agronomy 07 00055 g001
Figure 2. Active Carbon (a), soil extractable C (b) at depth (0–15 cm) of different types of fertilization. Treatment code: Ref-DF, reference DF site; In-DF, inorganic fertilization at DF; Co-DF, inorganic fertilizer, with low-to-medium organic residues at DF; Ref-GS, reference site; In-GS, inorganic fertilization at GS; Co-GS, inorganic fertilizer, with low-to-medium organic residues at GS; Or-GS, sole low-to-medium organic residues at GS and No-GS, no fertilization input at GS. The error bar indicates the standard deviation of three replicates. Small letters (a, b) represent mean differences among fertilization types in each ecological zone and capital letters (A, B) represent mean the difference between the two ecological zones.
Agronomy 07 00055 g002
Figure 3. Potential mineralizable nitrogen at depth (0–15 cm) of different types of fertilization. Treatment code: Ref-DF, reference DF site; In-DF, inorganic fertilization at DF; Co-DF, inorganic fertilizer, with low-to-medium organic residues at DF; Ref-GS, reference site; In-GS, inorganic fertilization at GS; Co-GS, inorganic fertilizer, with low-to-medium organic residues at GS; Or-GS, sole low-to-medium organic residues at GS and No-GS, no fertilization input at GS. The error bar indicates the standard deviation of three replicates. Small letters (a, b) represent mean differences among fertilization types in each ecological zone and capital letters (A, B) represent mean the difference between the two ecological zones.
Agronomy 07 00055 g003
Figure 4. Deterioration index (DI) (a) and Carbon management index (CMI) (b) for different types of fertilization in the DF and GS agro-ecological zones. Treatment code: Ref-DF, reference DF site; In-DF, inorganic fertilization at DF; Co-DF, inorganic fertilizer, with low-to-medium organic residues at DF; Ref-GS, reference site; In-GS, inorganic fertilization at GS; Co-GS, inorganic fertilizer, with low-to-medium organic residues at GS; Or-GS, sole low-to-medium organic residues at GS and No-GS, no fertilization input at GS. Each deterioration index is an average of percentage changes of TN, TC, NO3-N, NH4+-N, Extr C, active C, PMN, MBN, MBC, and SOM relative to their respective reference sites. The error bar indicates the standard deviation of the soil parameters.
Agronomy 07 00055 g004
Figure 5. Mean monthly rainfall (1983–2012) and mean temperature (1983–2012) in (a) Deciduous forest and (b) Guinea savannah agroecological zone of Ghana.
Agronomy 07 00055 g005
Table 1. Biochemical properties of the studied soils.
Treatment Code TC (g kg−1)TN (g kg−1)CN RatioNO3 (mg kg−1)NH4 (mg kg−1)Phosphorus (mg kg−1)SOM (%)CECpH
Ref-DF16.85 ± 0.14a2.38 ± 0.08a7.09 ± 0.30a176.17 ± 1.17b76.0 ± 0.48ab5.82 ± 0.00b2.63 ± 0.00a9.60 ± 0.01a6.12
In-DF15.97 ± 4.95a2.64 ± 0.62a6.00 ± 0.61a362.32 ± 42.25a78.2 ± 0.58a19.77 ± 4.26a3.22 ± 0.58a10.66 ± 1.49a5.94
Co-DF10.04 ± 4.42a1.91 ± 0.22a5.14 ± 1.65a307.88 ± 21.39a68.3 ± 1.18abc16.53 ± 8.24ab2.13 ± 0.81a11.07 ± 3.09a5.85
Mean-DF14.29 ± 4.62A2.31 ± 0.46A6.07 ± 1.23A282.12 ± 86.2A77.62 ± 8.19A14.04 ± 7.84A2.66 ± 0.69A10.44 ± 0.76B5.97
Ref-GS6.05 ± 0.43ab1.30 ± 0.04a4.68 ± 0.47b38.60 ± 0.06b49.4 ± 0.74bc16.89 ± 0.01a2.48 ± 0.01a16.82 ± 4.46abND
In-GS6.84 ± 0.62a1.19 ± 0.08a5.73 ± 0.16a107.89 ± 5.36a65.0 ± 2.14a14.55 ± 3.12b1.15 ± 0.13c19.72 ± 5.88a5.80
Co-GS5.71 ± 1.12ab1.26 ± 0.170a4.51 ± 0.33b24.44 ± 0.45b44.0 ± 0.48bc11.05 ± 1.36bc0.89 ± 0.12cdND5.90
Or-GS4.32 ± 0.68b1.05 ± 0.09a4.11 ± 0.51b39.19 ± 1.27b31.4 ± 1.16c13.68 ± 1.19bc0.46 ± 0.08d10.53 ± 1.86b6.40
No-GS6.24 ± 1.88ab1.28 ± 0.22a4.79 ± 0.63b33.44 ± 0.73b43.9 ± 0.81bc17.25 ± 8.44a1.82 ± 0.76b19.20 ± 3.26a5.45
Mean-GS5.83 ± 1.26B1.22 ± 0.15B4.76 ± 0.67B62.45 ± 44.38B46.72 ± 15.21B13.35 ± 2.21A1.36 ± 0.79B16.57 ± 4.21A5.89
Values represent the mean ± standard deviation of three replicates per fertilization type. Bold values indicate the average of the respective fertilization type in each ecological zone. Treatment code: Ref-DF, reference DF site; In-DF, inorganic fertilization at DF; Co-DF, inorganic fertilizer, with low-to-medium organic residues at DF; Ref-GS, reference site; In-GS, inorganic fertilization at GS; Co-GS, inorganic fertilizer, with low-to-medium organic residues at GS; Or-GS, sole low-to-medium organic residues at GS and No-GS, no fertilization input at GS. SOM, Soil organic matter; TN, total nitrogen; TC, total nitrogen; P, phosphorus; CN, carbon to nitrogen ratio; NH4, Ammonium; NO3, Nitrate. In each column, small letters (a, b) represent mean differences among fertilization types in each respective ecological zone and capital letters (A, B) represent mean the difference between the two ecological zones at p < 0.05 using Duncan's Multiple Range Test.
Table 2. Linear correlation among the analyzed biological and chemical soil parameters (n = 45).
RateTNTCCNNO3Extr CMBCMBNACCPPMNSOMAM
Rate
TN0.57 **
TC0.60 **0.96 **
CN0.54 **0.52 **0.73 **
NO30.73 **0.82 **0.76 **0.43 **
Extr C−0.38 *−0.14 NS−0.09 NS−0.03 NS−0.54 **
MBC0.43 **0.83 **0.72 **0.24NS0.84 **−0.42 **
MBN0.17 NS0.65 **0.66 **0.45 **0.60 **−0.16 NS0.62 **
ACC0.57 **0.95 **0.96 **0.62 **0.80 **−0.16 NS0.73 **0.66 **
P0.21NS0.44 **0.40 *0.15 NS0.48 **−0.19 NS0.47 **0.38 *0.50 **
PMN−0.83 **−0.30 *−0.35 *−0.42 **−0.50 **0.27 NS0.14 NS0.03 NS−0.34 *−0.11 NS
SOM0.15 NS0.52 **0.60 **0.50 **0.24 NS−0.12 NS0.38 *0.24 NS0.55 **0.26 NS−0.02 NS
AM0.71 **0.60 **0.56 **0.38 *0.79 **−0.41 **0.61 **0.35 *0.62 **0.45 **0.63 **0.13 NS
CEC−0.55 **−0.56 **−0.50 **−0.19 NS−0.62 **0.25 NS−0.76−0.32 *−0.46 *0.010.32 *−0.16 NS−0.28 NS
SOM, Soil organic matter; TN, total nitrogen; TC, total nitrogen; SOM, Organic matter; TN, total nitrogen; CN, carbon to nitrogen ratio; AM, Ammonium; NO3, nitrate; PMN, P, phosphorus; Potential mineralizable nitrogen; MBC, Microbial biomass carbon; MBN, Microbial biomass nitrogen; Extr C, Soil extractable carbon; CEC, cation exchange capacity. Significance levels: NS: p > 0.05; * p < 0.05; ** p < 0.01.
Table 3. Summary of forward step-wise regression analysis between rates of fertilizer application, soil TN and soil microbial properties (n = 45).
VariableMicrobial Properties
MBNMBCBIO CNACCPMNEXTR CMBC/TCMBN/TN
Rate
R20.030.180.020.330.690.140.230.10
Sig.0.3 NS0.004 *0.4 NS0.001 **0.001 **0.01 *0.001 **0.04 *
Soil TN
R20.420.690.100.910.090.020.250.04
Sig.0.001 **0.001 **0.03 *0.001 **0.04 *0.4 NS0.001 **0.2 NS
SOM, Soil organic matter; TN, total nitrogen; ACC, active carbon; PMN, Potential mineralizable nitrogen; MBC, Microbial biomass carbon; MBN, Microbial biomass nitrogen; Extr C, Soil extractable carbon; Sig; statistical significance of regression. Significance levels: NS: p > 0.05; * p < 0.05; ** p < 0.01.

