Article

Spatiotemporal Heterogeneity Characteristics of Rice Grain Quality and Its Response to Nitrogen Management

1
School of Agronomy and Horticulture, Jiangsu Vocational College of Agriculture and Forestry, Jurong 212400, China
2
Agricultural College, Yangzhou University, Yangzhou 225000, China
3
Institute of Crop Science, Huzhou Academy of Agricultural Sciences, Huzhou 313000, China
*
Author to whom correspondence should be addressed.
Agronomy 2026, 16(8), 789; https://doi.org/10.3390/agronomy16080789
Submission received: 26 February 2026 / Revised: 2 April 2026 / Accepted: 8 April 2026 / Published: 11 April 2026

Abstract

Optimizing nitrogen (N) management is crucial for high-quality rice (Oryza sativa L.) production. However, how N affects grain quality at different positions within a panicle remains unclear. This study evaluated the effects of different N application regimes on the milling, appearance, eating, and nutritional quality of grains at varying panicle positions. We used a japonica cultivar Wuyunjing 31 in a controlled pot experiment with three N treatments: N32:0 (early heavy N), N16:16 (split application with late N topdressing), and N16:0 (low-N control). Results showed that late N topdressing (N16:16) significantly improved head rice yield across all grain positions, which was linked to higher storage protein accumulation (especially glutelin) and larger length-to-width ratio. Conversely, late N application deteriorated appearance quality by increasing the chalky grain rate and chalkiness. This negative effect was most pronounced in superior grains on upper and middle branches. Furthermore, the N16:16 treatment consistently decreased amylose content while increasing albumin, prolamin, and glutelin levels, demonstrating a clear trade-off between carbon (C) and N sinks. We speculated that these intra-panicle differences result from increased competition for carbon resources between starch and protein synthesis pathways. Overall, precision N management should account for spatial differences in grain development to effectively balance rice yield and quality.

1. Introduction

Rice (Oryza sativa L.) serves as a primary staple food for over half of the global population, and its grain quality is a critical determinant of market value, consumer acceptance, and food security [1,2]. In China, the world’s largest rice producer and consumer, there is an increasing demand for high-quality rice, driven by rising living standards and a more discerning market. Consequently, understanding and optimizing the factors that govern rice quality formation has become a paramount research priority [3,4]. Nitrogen (N) is the most essential mineral nutrient for rice growth and development, profoundly influencing both yield and quality. N fertilizer management, including the rate, timing, and method of application, is a key agronomic practice that can be optimized to modulate grain quality traits [5,6]. Extensive research has demonstrated the dual, often opposing, effects of N on rice quality. On the one hand, N application, particularly during the reproductive stage, enhances grain protein content, thereby improving the nutritional value of rice [7,8]. On the other hand, increased N supply is frequently associated with a decline in eating and appearance quality, characterized by reduced amylose content, increased grain chalkiness, and higher protein content which can negatively impact texture and palatability [9,10]. This creates a complex challenge for rice producers who aim to simultaneously achieve high yield and superior quality.
The vast majority of studies investigating N effects on rice quality have traditionally focused on the whole-panicle level, treating the panicle as a homogenous unit. This approach overlooks a fundamental aspect of rice biology: the panicle is a heterogeneous structure. It is a determinate panicle with a hierarchical arrangement of primary and secondary branches. Grains located on different branches and at different positions within the panicle exhibit significant asynchrony in their development [11,12]. Superior grains, typically located on apical primary branches, flower earlier, fill faster, and accumulate more dry matter, while inferior grains, found on proximal secondary branches, flower later, fill slowly, and often have lower weight and quality [13,14]. This inherent spatiotemporal variation in grain-filling dynamics suggests that grains occupying distinct positional niches may exhibit highly divergent physiological responses to agronomic interventions, particularly nitrogen fertilization [12,15]. Postponing N topdressing or N fertilizer rate had different influences on superior and inferior grain taste quality via altering starch structural properties and protein components [16,17,18,19].
Previous studies have provided valuable insights into the variation in milling, cooking, and appearance quality among grains at different positions within a rice panicle [20,21,22]. They demonstrated that grain position significantly influences traits such as grain weight, chalkiness, and protein content. However, these studies were conducted with specific rice varieties and panicle types, and their conclusions may not be directly transferable to other widely grown cultivars or different ecological conditions. Furthermore, their studies focused on comparing the quality traits of primary branches at different positions, while neglecting the grains borne on secondary branches. In fact, the amino acid metabolism of grains on secondary branches in the middle and lower panicle parts (typically inferior grains) is more sensitive to nitrogen [23]. However, the differences in quality formation between primary and secondary branches in response to N remain largely elusive. Starch and storage protein synthesis represent two competing processes within the developing endosperm, competing for energy (ATP) and carbon skeletons [24]. It is hypothesized that N application, especially during the late reproductive stages, may intensify this competition, and the outcome may vary across grain positions due to differences in sink strength and the timing of metabolic shifts.
Wuyunjing 31 is a high-yielding, widely adaptable japonica rice cultivar extensively cultivated in the lower reaches of the Yangtze River, a major rice-producing region in China [25,26]. Its popularity among farmers makes it an ideal model for studying the effects of agronomic practices on quality formation. However, a comprehensive understanding of how N management strategies influence the grain quality of Wuyunjing 31, especially the position-specific responses within the panicle, is currently lacking. Filling this knowledge gap is crucial for developing precision N management guidelines that can optimize multiple quality attributes simultaneously.
To address this knowledge gap, the specific objectives of this study were to: (1) systematically evaluate the effects of varying nitrogen (N) application regimes on the milling, appearance, eating, and nutritional quality of Wuyunjing 31 at both the whole-panicle level and across six distinct spatial positions; (2) characterize the position-specific response patterns of these key traits to N supply; and (3) put forward a hypothesis to elucidate the underlying physiological mechanisms driving these spatial differences, with a primary focus on the carbon–nitrogen (C–N) metabolic trade-off. We hypothesized that late N topdressing would enhance nutritional quality at the expense of appearance and eating quality, and that this trade-off would be most pronounced in vigorously filling superior grains due to their heightened metabolic sink strength. Ultimately, these findings will provide a theoretical foundation for precision N management strategies to optimize rice quality at a micro-spatial scale.

2. Materials and Methods

2.1. Experimental Site and Soil Characteristics

The pot experiment was conducted from May to October 2023 at the Jiangsu Agricultural Expo Park, Jurong, Jiangsu Province, China (119°14′50″ E, 32°01′23″ N). The region is characterized by a subtropical monsoon climate with a mean annual temperature of 15.2 °C and mean annual precipitation of 1018.6 mm. The soil used for the pots was a clay loam (Typic Epiaqualf) collected from the top 20 cm layer of a local paddy field. Prior to the experiment, the soil was air-dried, crushed, and passed through a 5-mm sieve to remove plant debris and large aggregates. The basic physicochemical properties of the soil were as follows: pH (H2O) 6.5, organic matter 22.5 g kg−1, total N 1.5 g kg−1, available phosphorus (Olsen-P) 12.8 mg kg−1, and available potassium (NH4OAc-K) 98.5 mg kg−1.

2.2. Plant Material and Growth Conditions

The japonica rice (Oryza sativa L.) cultivar Wuyunjing 31, which was widely cultivated in the lower Yangtze River region, was used as the test material, with seeds kindly provided by the Changzhou Agricultural Technology Extension Center. Seeds were sown in a seedling bed on 27 May 2023. Uniform 21-day-old seedlings (at the 4-leaf stage) were manually transplanted on 18 June 2023, into cylindrical plastic pots (30 cm in height, 34 cm in diameter). Each pot was filled with 15 kg of the prepared soil. Four hills were transplanted per pot, with two seedlings per hill, simulating a planting density of approximately 30 hills m−2. The pots were placed in an open-air field under a transparent rain shelter to prevent interference from natural rainfall, allowing precise control over water and nutrient management. Plants were irrigated daily to maintain a 2–3 cm water layer above the soil surface, except for a brief mid-season drainage period at the end of tillering to control unproductive tillers. Standard pest and disease control measures were implemented according to local practices to ensure healthy crop growth.

2.3. Experimental Design and Nitrogen Treatments

The experiment followed a completely randomized design with three N fertilizer treatments. Each treatment included 10 pots with three biological replications, resulting in a total of 90 pots. The three N treatments were designed to vary in both total N rate and the timing of application:
N32:0 (High N, All Basal/Tillering): A total of 3.2 g N pot−1 was applied. This relatively high rate was split equally between basal fertilization (one week before transplanting) and tillering fertilization (10 days after transplanting). No N was applied at the panicle initiation or spikelet differentiation stages. This treatment represents a traditional N management strategy with a focus on early-season N supply.
N16:16 (Moderate N, Split Application with Late N): A total of 3.2 g N pot−1 was applied, identical to the N32:0 treatment. However, the application timing was split equally into four portions: 0.8 g N pot−1 at basal, tillering, panicle initiation (corresponding to the appearance of the 3.5th leaf from the top), and spikelet differentiation (corresponding to the appearance of the 1.5th leaf from the top). This treatment represents a “late N application” or “N topdressing” strategy, where a significant portion of the total N is supplied during the reproductive phase to support grain filling.
N16:0 (Low N, All Basal/Tillering): A total of 1.6 g N pot−1 was applied, serving as a low-N control. Similar to N32:0, this amount was split equally between basal and tillering fertilization, with no N applied during reproductive stages.
Urea (46% N) was used as the N source for all applications. Phosphorus and potassium fertilizers were applied uniformly across all treatments to avoid nutrient limitations other than N. Calcium superphosphate (12% P2O5) was applied at a rate of 2.4 g P2O5 pot−1, split equally as basal and panicle initiation fertilizer. Potassium chloride (60% K2O) was applied at a rate of 3.0 g K2O pot−1, also split equally as basal and panicle initiation fertilizer.

2.4. Sampling and Grain Classification

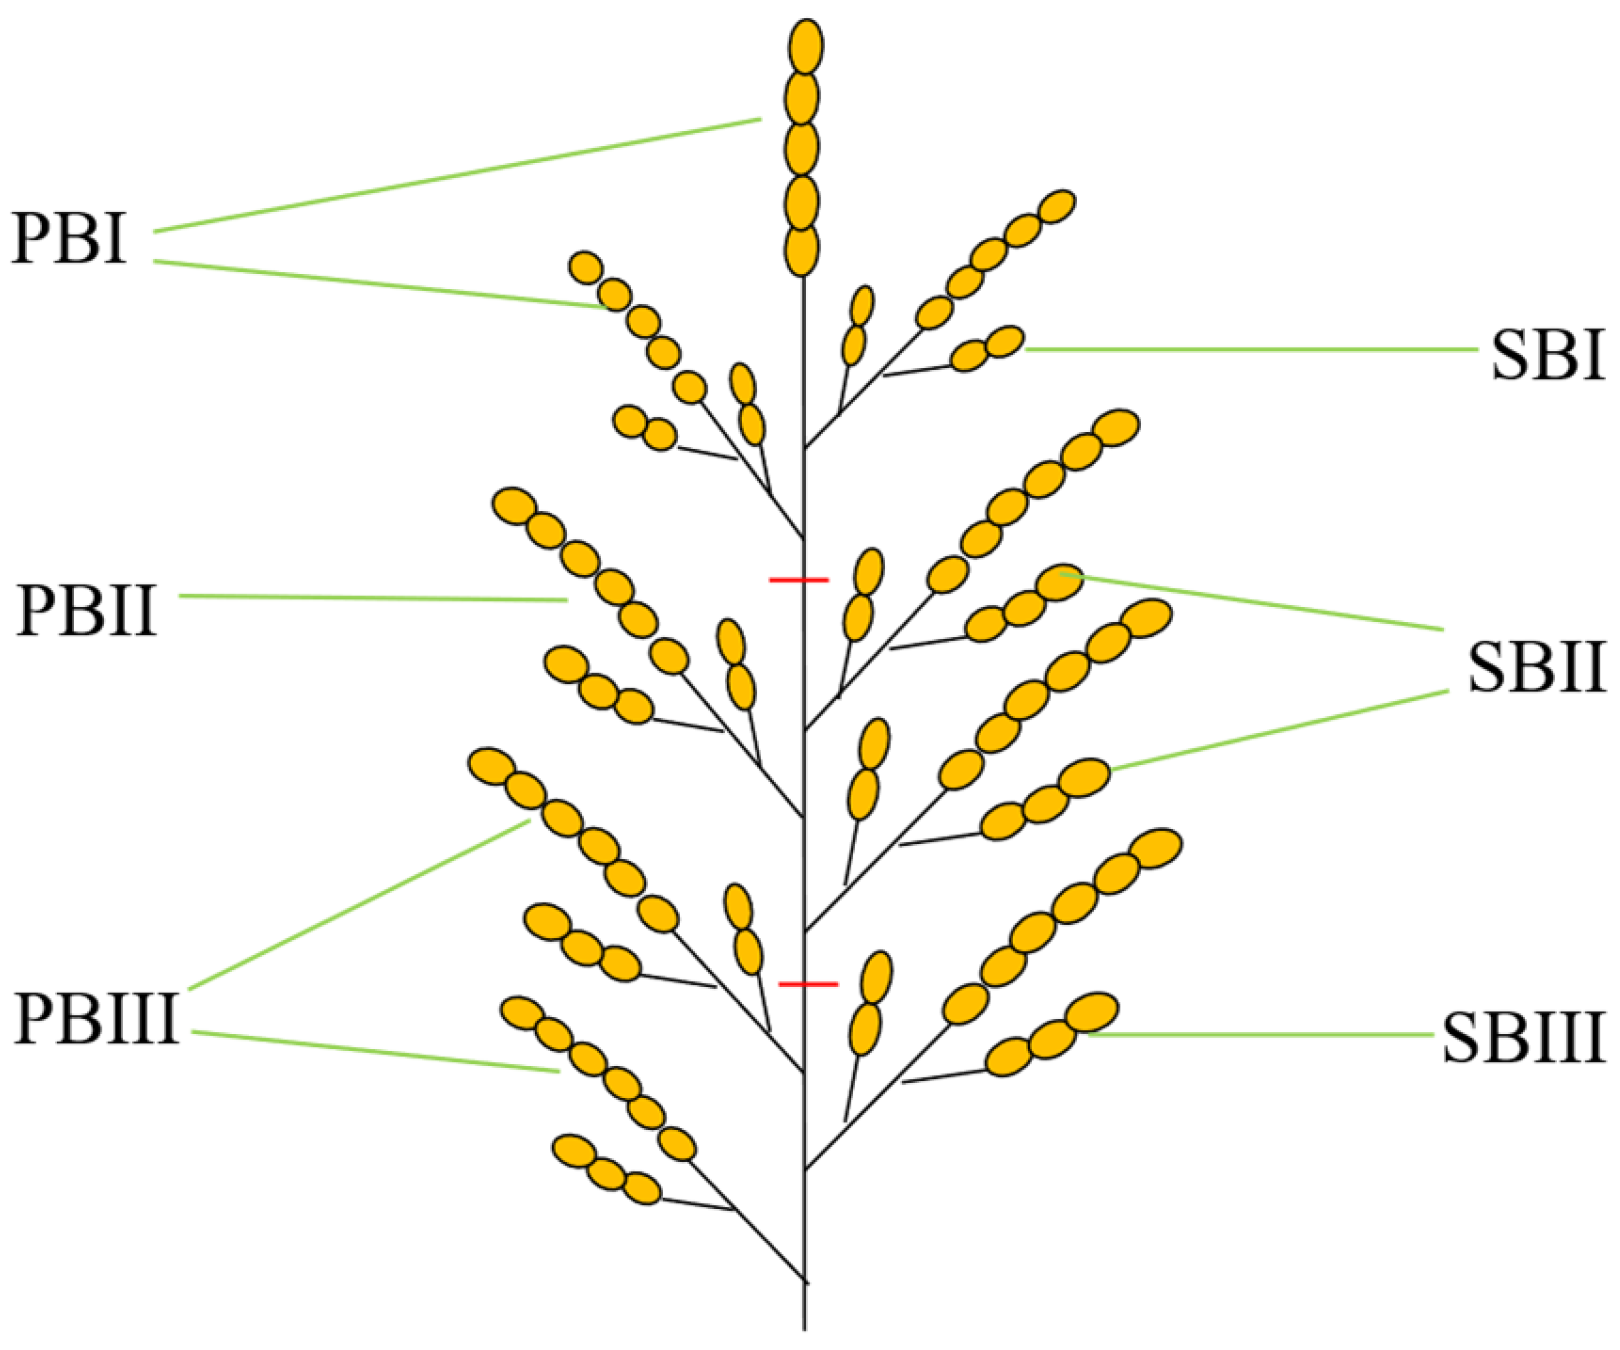
At physiological maturity (approximately 40 days after heading), when 95% of panicles had turned yellow, 80 representative panicles were harvested per replicate. The panicles were hand-threshed carefully to avoid mechanical damage. After natural drying, the collected samples were subsampled according to the method described by Zhang et al. [14]. Each panicle was dissected, and spikelets (grains) were divided into six distinct groups based on their position on the panicle (Figure 1):
Grains from each group were pooled across all 80 panicles to obtain sufficient material for quality analysis. The pooled samples were then air-dried to a uniform moisture content of approximately 13%, and stored in sealed bags at 4 °C until further processing. A subsample of grains from each group was manually dehulled to obtain brown rice for subsequent quality measurements.

2.5. Determination of Grain Quality Traits

2.5.1. Milling Quality

Milling characteristics were determined following the standard methods of the National Standard of the People’s Republic of China, GB/T 17891-2017 (High Quality Paddy). A 50 g subsample of clean paddy grains from each group was used. Brown rice rate was determined using a laboratory rice husker (JLG-IIA, Taizhou Grain Instrument Co., Ltd., Taizhou, China). The resulting brown rice was then milled for 60 s using a laboratory rice miller (JNM-III, Taizhou Grain Instrument Co., Ltd., Taizhou, China) to obtain milled rice. Head rice was manually separated from broken kernels by sieving over a 2.0 mm round-hole sieve. The rates were calculated as percentages of the initial paddy weight:
Brown Rice Rate (%) = (Weight of brown rice/Weight of paddy sample) × 100
Milled Rice Rate (%) = (Weight of milled rice/Weight of paddy sample) × 100
Head Rice Rate (%) = (Weight of head rice/Weight of paddy sample) × 100

2.5.2. Appearance Quality

Appearance quality traits, including perfect grain rate, chalky grain rate, chalkiness degree, and grain length-to-width ratio (L/W), were assessed using a rice quality analyzer (SC-E, Wseen Detection Technology Co., Ltd., Hangzhou, China) according to the GB/T 17891-2017 standard. A representative sample of approximately 500 milled rice grains from each group was scanned. The analyzer automatically identified and quantified chalky grains (grains with opaque, chalky portions covering ≥ 20% of the grain surface) and calculated the chalkiness degree (the percentage of the total grain area that is chalky, averaged over all grains). The length-to-width ratio was calculated as the average grain length divided by the average grain width.

2.5.3. Starch Composition (Eating Quality)

Milled rice samples were ground into fine flour using a cyclone mill (CT 193 Cyclotec, FOSS, Hillerod, Denmark) and passed through a 100-mesh sieve. Total starch content was determined using the Megazyme Total Starch Assay Kit (Megazyme International, Bray, Ireland) following the AOAC Method 996.11. Amylose content was determined using the standard iodine colorimetry method as described in GB/T 15683-2008 (Rice—Determination of amylose content) [27]. Amylopectin content was calculated as the difference between total starch and amylose content. All results were expressed as percentages of the milled rice flour weight on a dry basis.

2.5.4. Protein Fractions and Total Protein (Nutritional Quality)

Protein fractions were sequentially extracted from defatted rice flour based on their differential solubility, following the method of Landry and Moureaux [28] with minor modifications. The fractions were defined as:
Albumins (water-soluble): Extracted with distilled water.
Globulins (salt-soluble): Extracted with 5% NaCl solution.
Prolamins (alcohol-soluble): Extracted with 70% ethanol.
Glutelins (alkali-soluble): Extracted with 0.05 M NaOH.
The nitrogen content in each fraction was determined by the micro-Kjeldahl method, and protein content was calculated by multiplying the N content by a conversion factor of 5.95. Total protein content was calculated as the sum of the four protein fractions.

2.6. Statistical Analysis

All data were expressed as means ± standard deviation (SD) of the three replicate measurements. Statistical analyses were performed using SPSS software (version 29.0, IBM Corp., Armonk, NY, USA). Two-way analysis of variance (ANOVA) was conducted to test the main effects of N treatment, grain position, and their interaction on each quality trait. Means were compared using Duncan’s new multiple range test at a significance level of p < 0.05. The coefficient of variation (CV) was calculated for whole-panicle traits to assess variability among treatments.

3. Results

3.1. Nitrogen Effects on Whole-Panicle Grain Quality

Analysis at the whole-panicle level showed that N management significantly affected all measured quality traits (Table 1). Both N treatments (N32:0 and N16:16) significantly increased brown and milled rice rates compared to the low-N control (N16:0). Notably, the timing of N application significantly influenced the head rice rate; the N16:16 treatment yielded the highest rate (57.29%), which was 13.6% and 13.5% higher than those of N32:0 and N16:0, respectively.
Conversely, N application significantly reduced the appearance quality (Table 1). The perfect grain rate was highest under N16:0 (84.22%), whereas both N-fertilized treatments exhibited significantly higher chalky grain rates and chalkiness degrees. The N32:0 treatment resulted in the highest chalkiness parameters, followed closely by N16:16. Grain length-to-width ratio was unaffected by N treatments at the whole-panicle level.
Regarding nutritional and eating quality, N application demonstrated a clear trade-off. Protein fractions (albumin, prolamin, glutelin) and total protein content were significantly enhanced by N supply, peaking under the N16:16 treatment (7.60% total protein). In contrast, total starch and amylose contents were significantly reduced under the N16:16 treatment (78.41% and 19.77%, respectively) compared to the N16:0 control (Table 1).

3.2. Position-Specific Responses of Grain Quality to Nitrogen

Two-way ANOVA indicated highly significant (p < 0.01) main effects of N treatment, grain position, and their interactions for most measured traits except for some protein compositions, highlighting the spatial heterogeneity of the N response (Table 2).

3.2.1. Milling Quality: Position-Dependent Enhancement by Late N

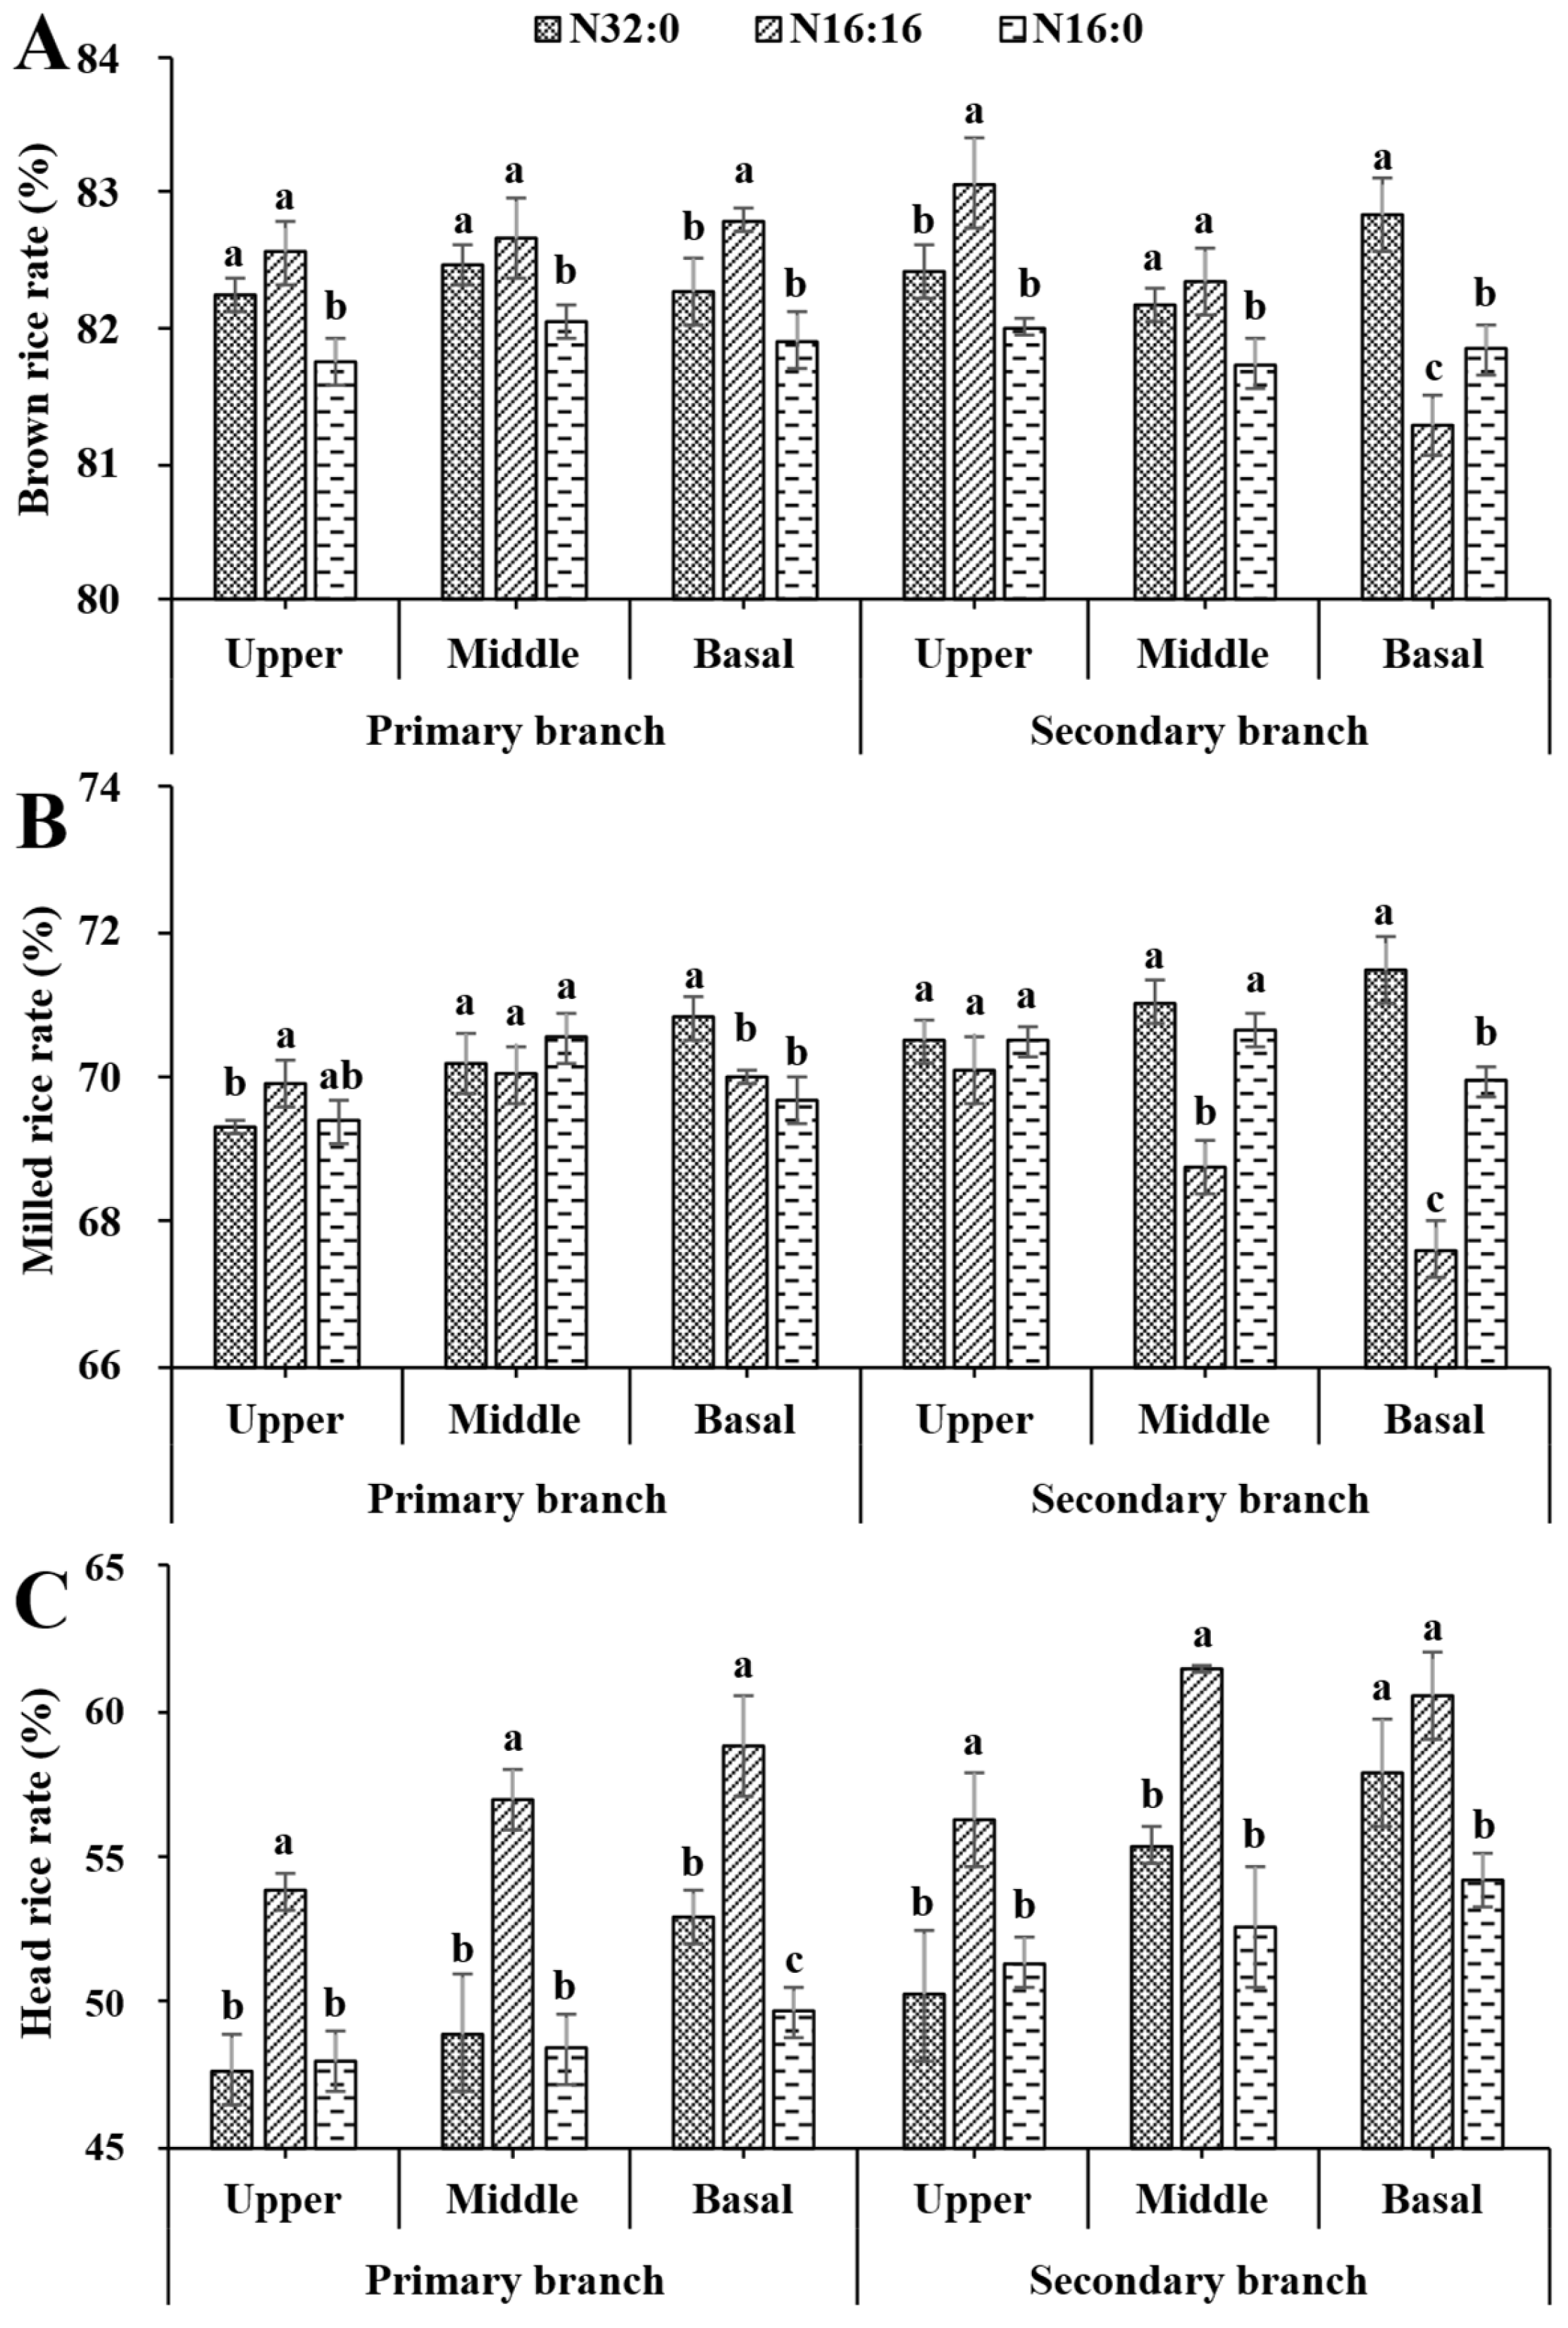
The impact of nitrogen management on milling quality demonstrated profound spatial dependency across the panicle architecture (Figure 2). While both N fertilization strategies generally elevated the brown rice rates for grains situated on the middle and upper branches (PBI, PBII, SBI, SBII), the late N topdressing (N16:16) induced a slight reduction in this metric specifically for the most inferior grains located on the lower secondary branches (SBIII).
Conversely, the head rice rate exhibited a universally positive response to the late N supply. The N16:16 treatment consistently and significantly enhanced head rice rates across all spatial niches. Notably, the magnitude of this enhancement was biphasic, with the most substantial increases occurring at the panicle’s structural extremes: the PBIII grains (increasing from 49.7% under N16:0 to 58.8% under N16:16) and the SBII grains (increasing from 52.6% to 61.4%). Furthermore, an intrinsic architectural advantage was evident; regardless of the specific N regime, grains positioned on secondary branches consistently maintained significantly higher head rice rates than their primary branch counterparts at corresponding vertical strata.

3.2.2. Appearance Quality: Spatial Patterning of Deterioration

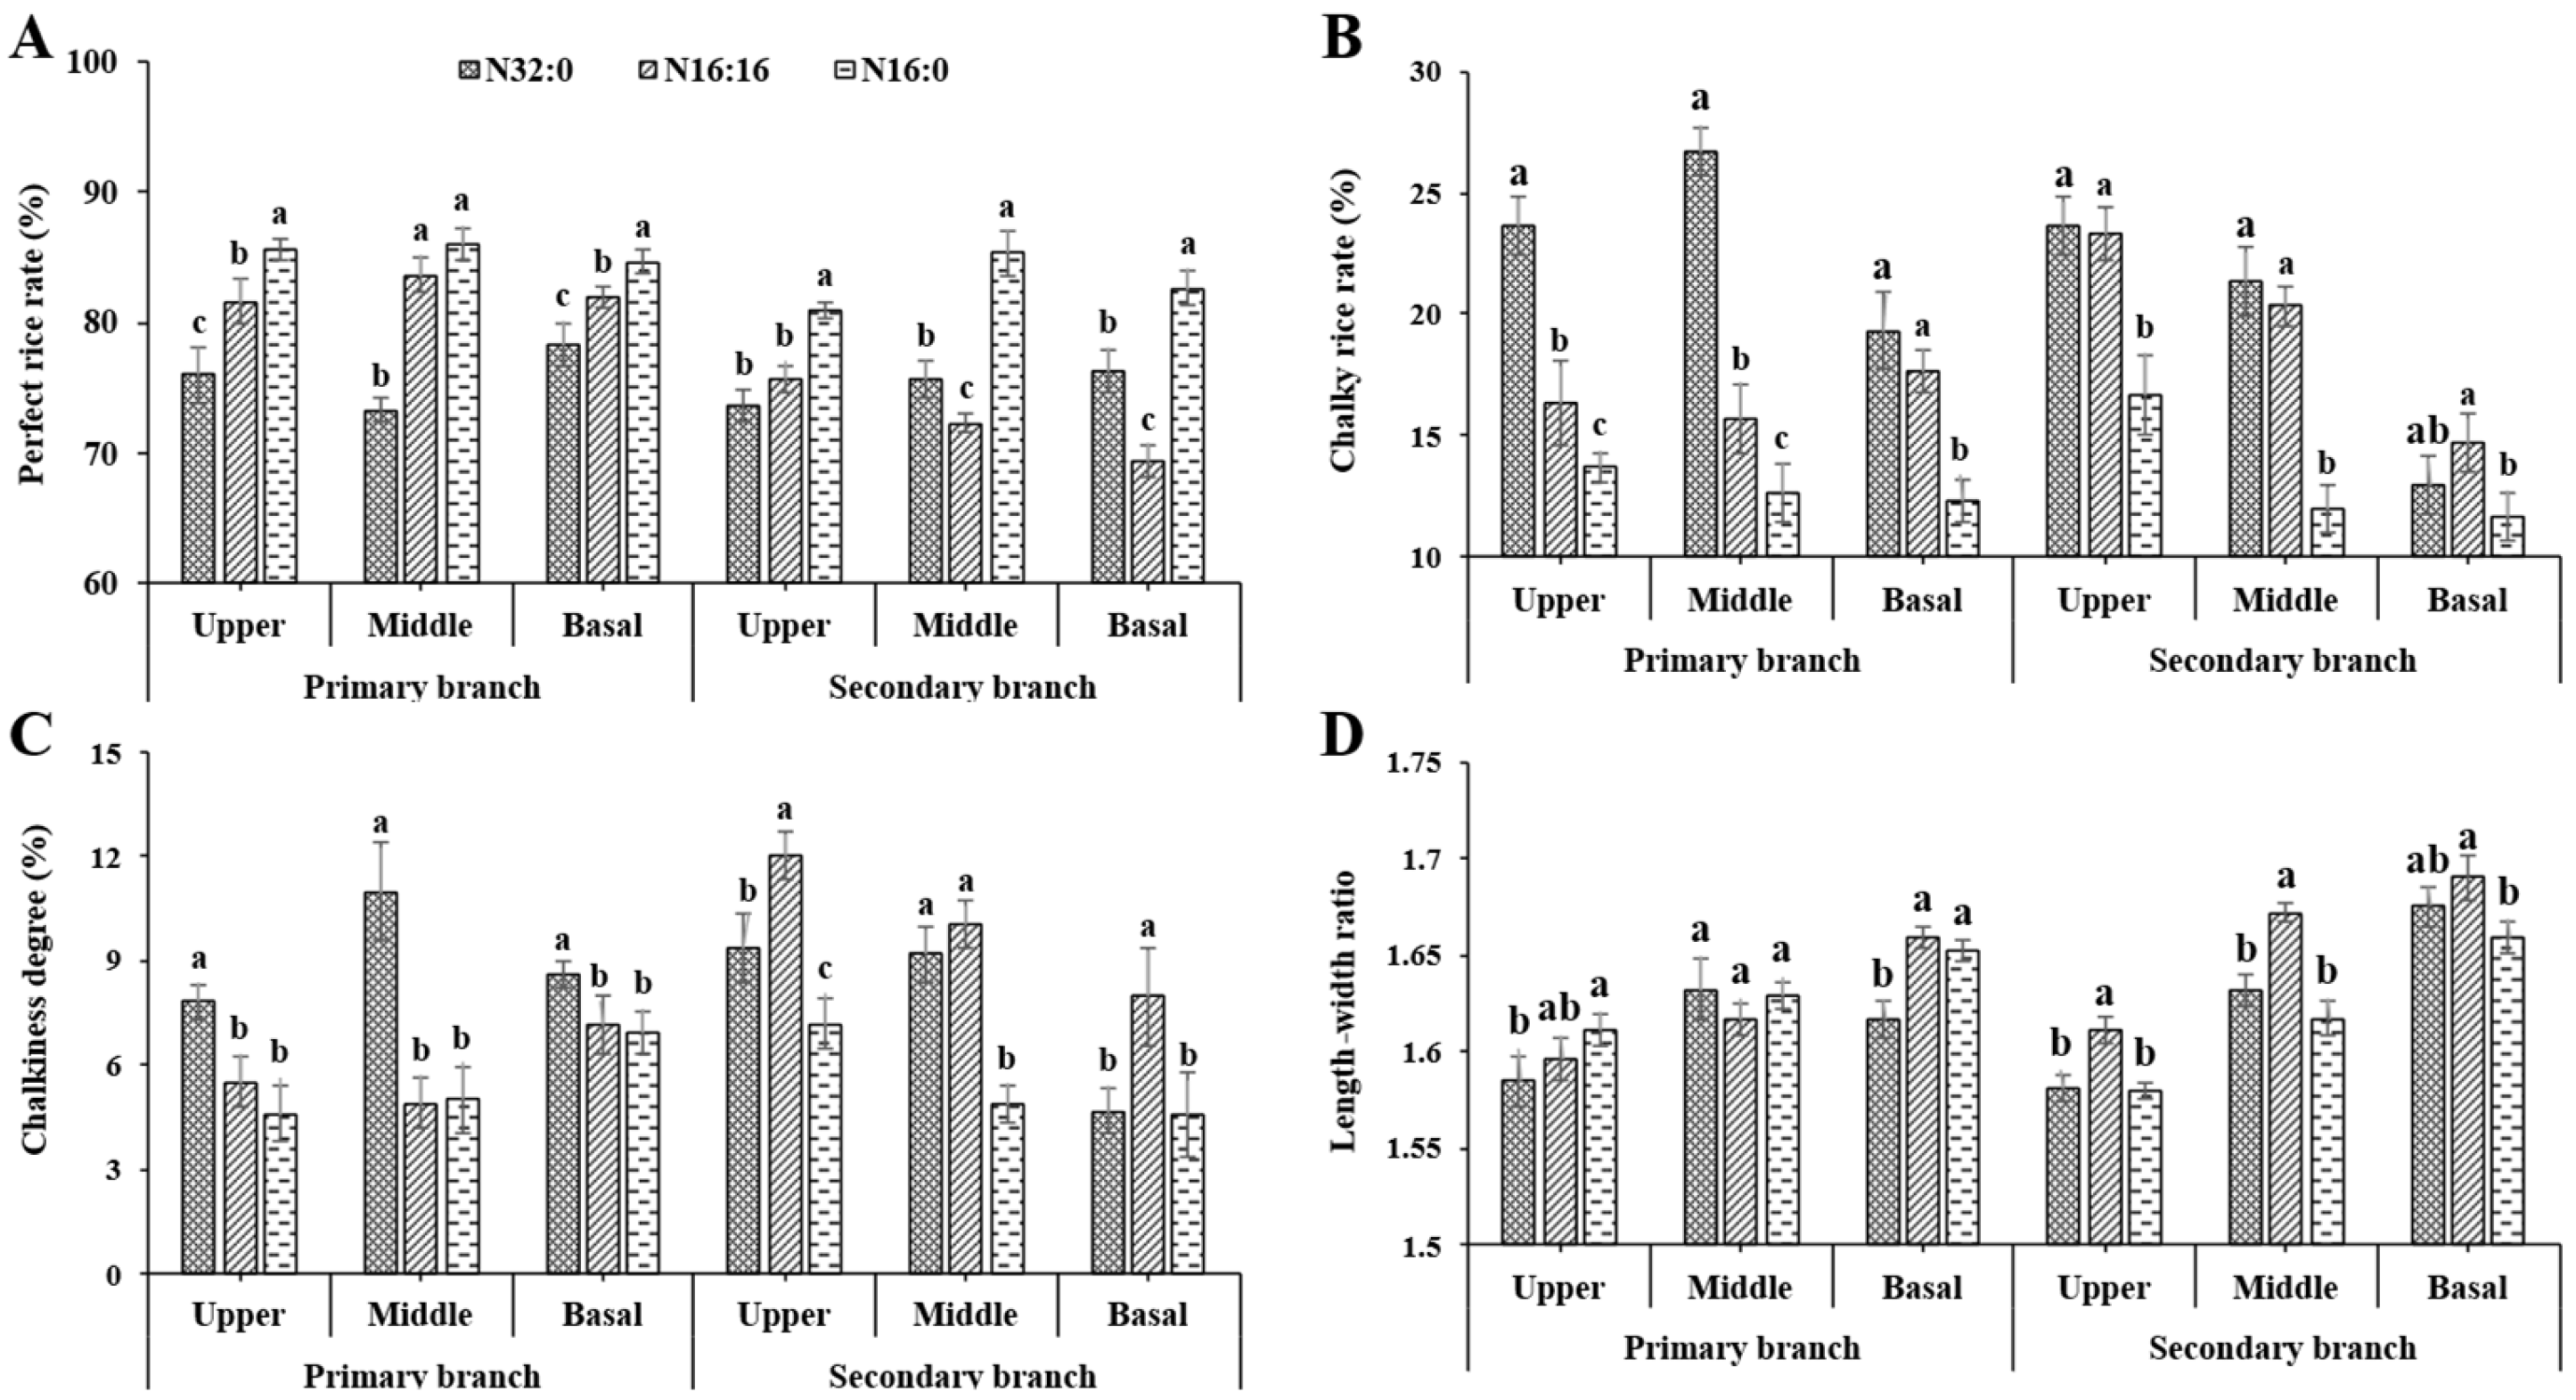
Nitrogen fertilization universally reduced the perfect grain rate across all panicle positions; however, the subsequent development of grain chalkiness exhibited pronounced spatial heterogeneity (Figure 3). Under the low-N control (N16:0), the baseline chalkiness parameters remained relatively minimal across the entire panicle. In contrast, increased N supply substantially elevated chalkiness, with these morphological deteriorations being heavily concentrated in the middle and upper grains. Specifically, the average chalky grain rate in upper branch (PBI + SBI) grains increased significantly from 14.1% under N16:0 to 23.7% and 19.7% under the N32:0 and N16:16 treatments, respectively. Similarly, upper secondary grains (SBI) demonstrated a high susceptibility to N-induced chalkiness, whereas the inferior grains located on lower branches (SBIII) were notably less affected. Conversely, late N topdressing resulted in a greater increase in grain chalkiness degree in secondary branch grains than in primary branch grains. Furthermore, the late N topdressing (N16:16) significantly increased the grain length-to-width ratio, though this morphological alteration was exclusively confined to secondary branch grains (Figure 3D).

3.2.3. Starch Accumulation: Altered Composition and Allocation

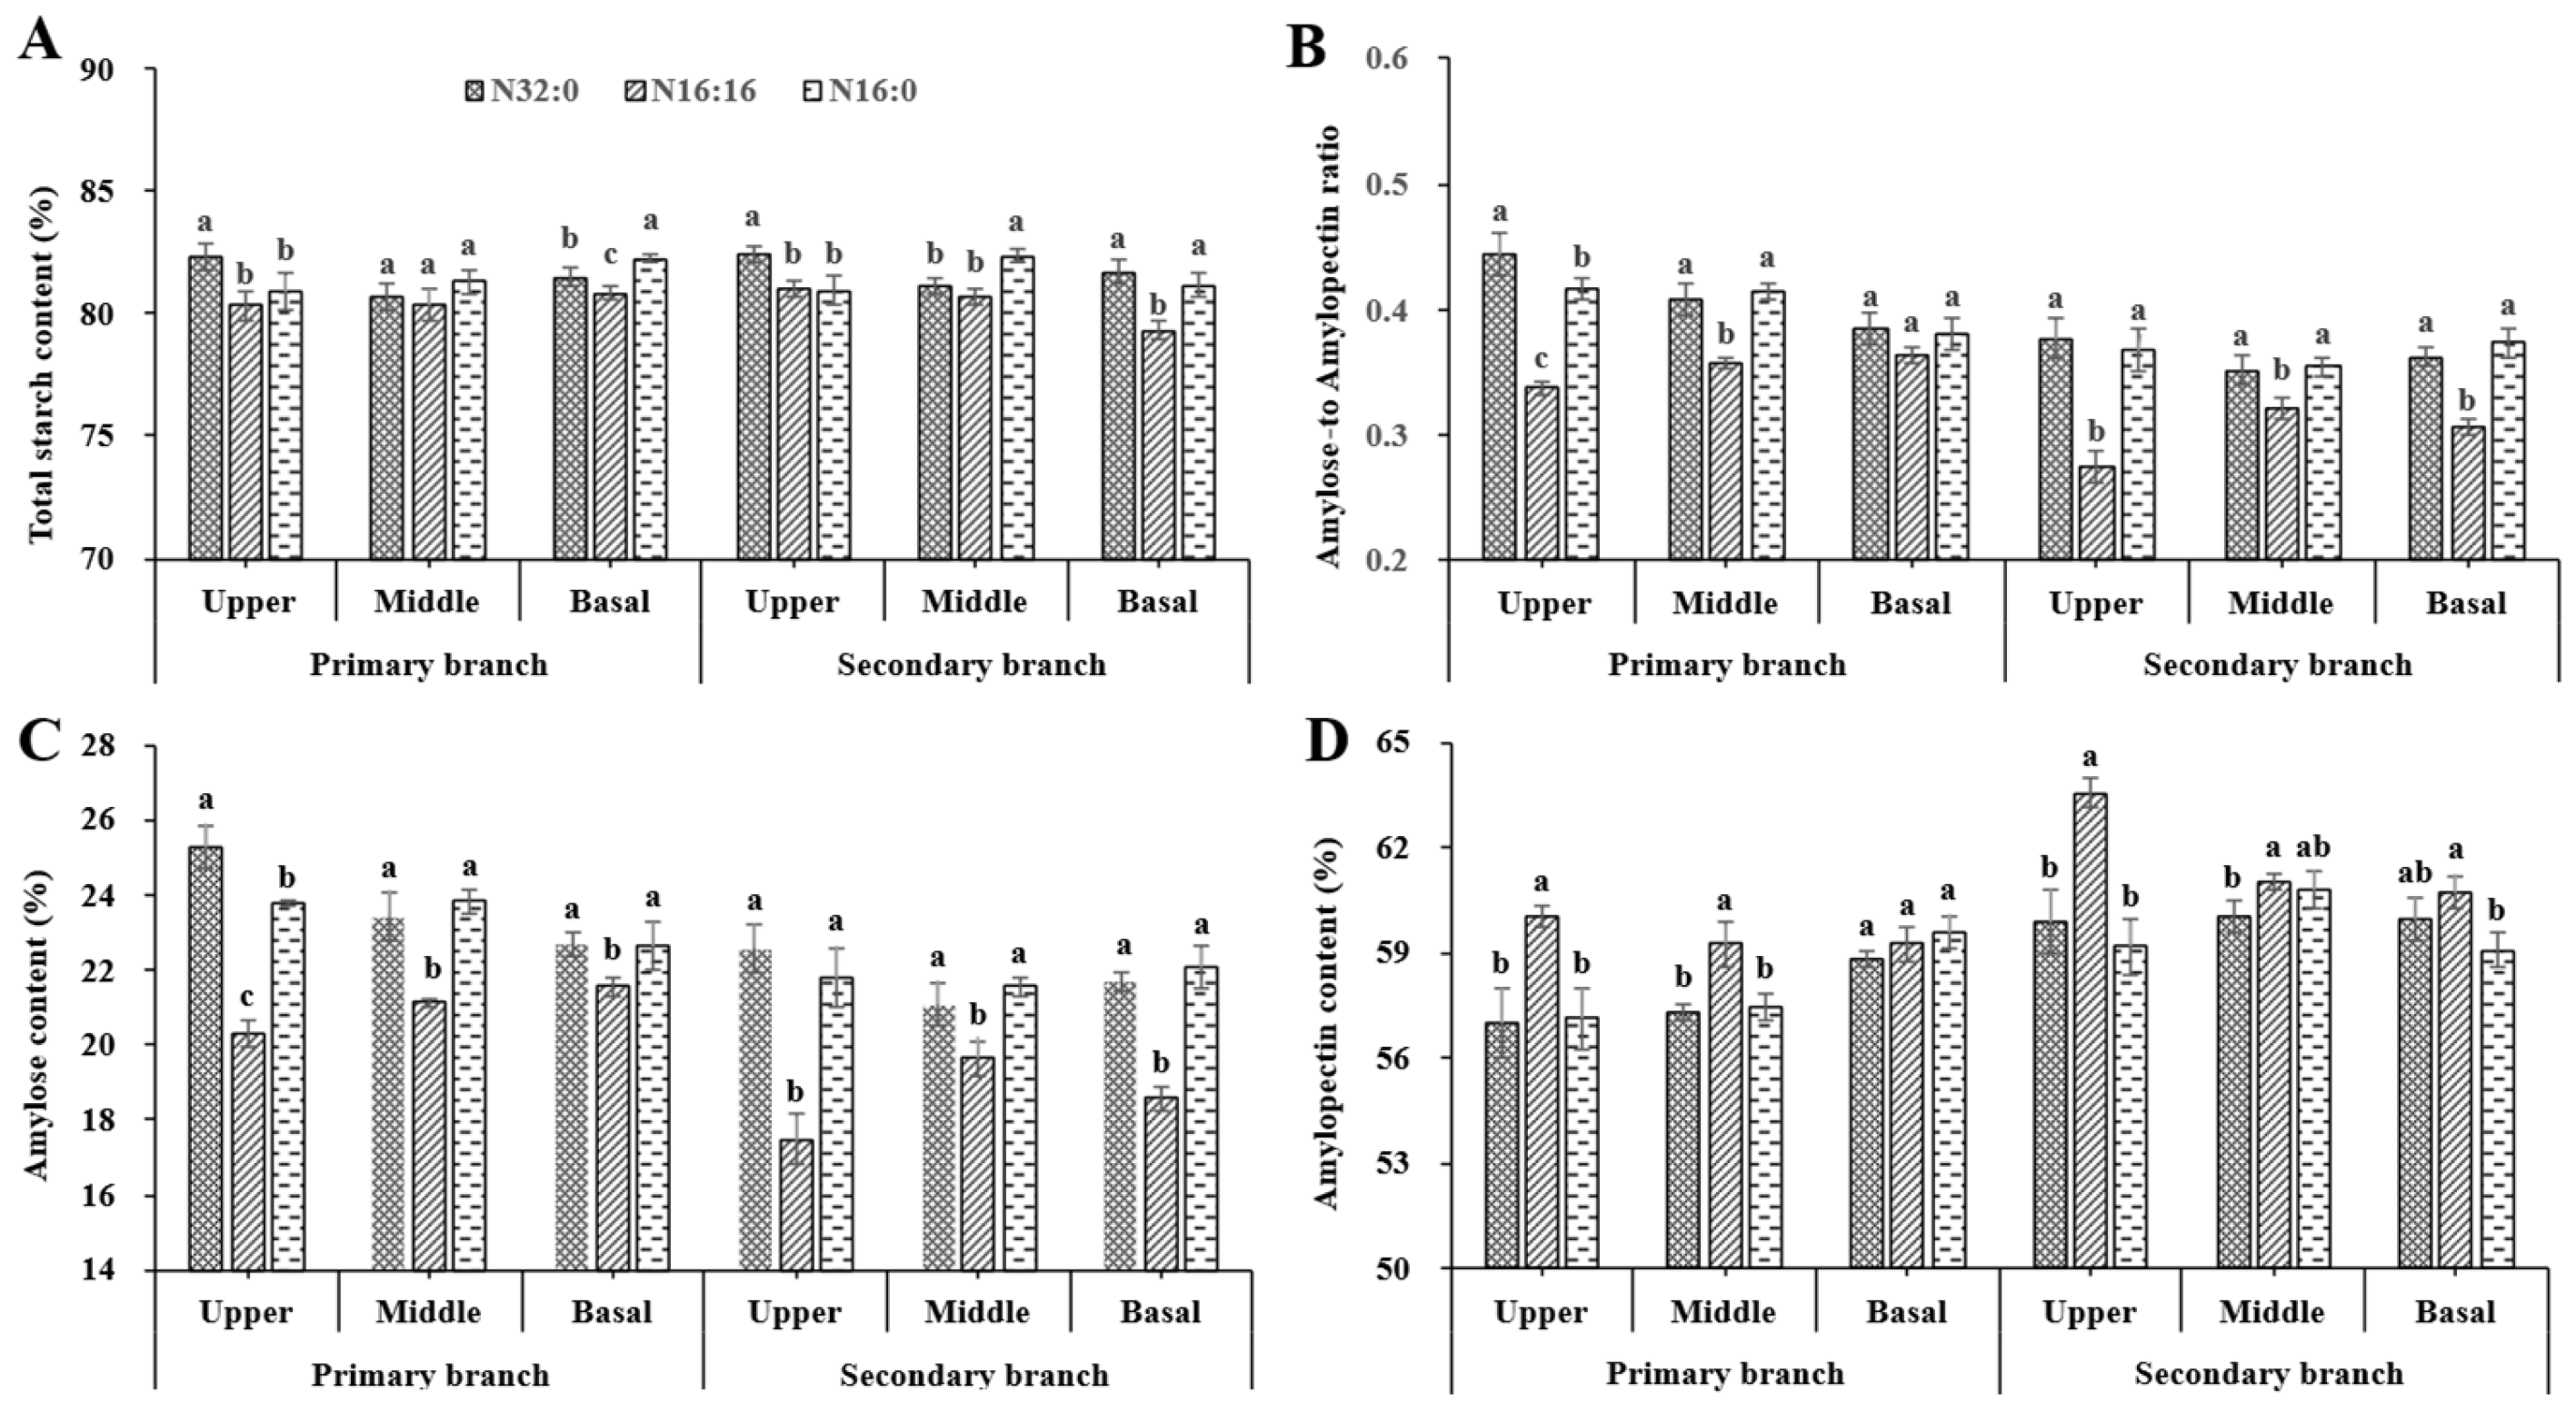
Nitrogen management significantly altered the starch composition of rice grains, exhibiting distinct position-specific patterns across the panicle (Figure 4). The late N topdressing (N16:16) treatment consistently and significantly reduced amylose content across all spatial positions compared to the N16:0 and N32:0 treatments. Notably, the magnitude of this reduction followed a clear top-to-bottom spatial gradient; grains located on the upper branches (PBI, SBI) experienced the most substantial decreases (approximately 3.5 percentage points), whereas grains on the lower branches (PBIII, SBIII) exhibited significantly smaller reductions (Figure 4C).
Conversely, the response of amylopectin accumulation to varying N supply demonstrated greater spatial complexity. The N16:16 treatment significantly elevated amylopectin levels in the upper and middle primary grains (PBI, PBII), as well as in the upper secondary grains (SBI) (Figure 4D). Correspondingly, the ratio of amylose to amylopectin was significantly reduced in these positions (Figure 4B). Consequently, the total starch content under the N16:16 regime was largely maintained in the upper and middle grains (PBI, PBII, and SBI), but it underwent a significant reduction in the other grains (Figure 4A).

3.2.4. Protein Synthesis: Uniform Upregulation and Positional Nuances

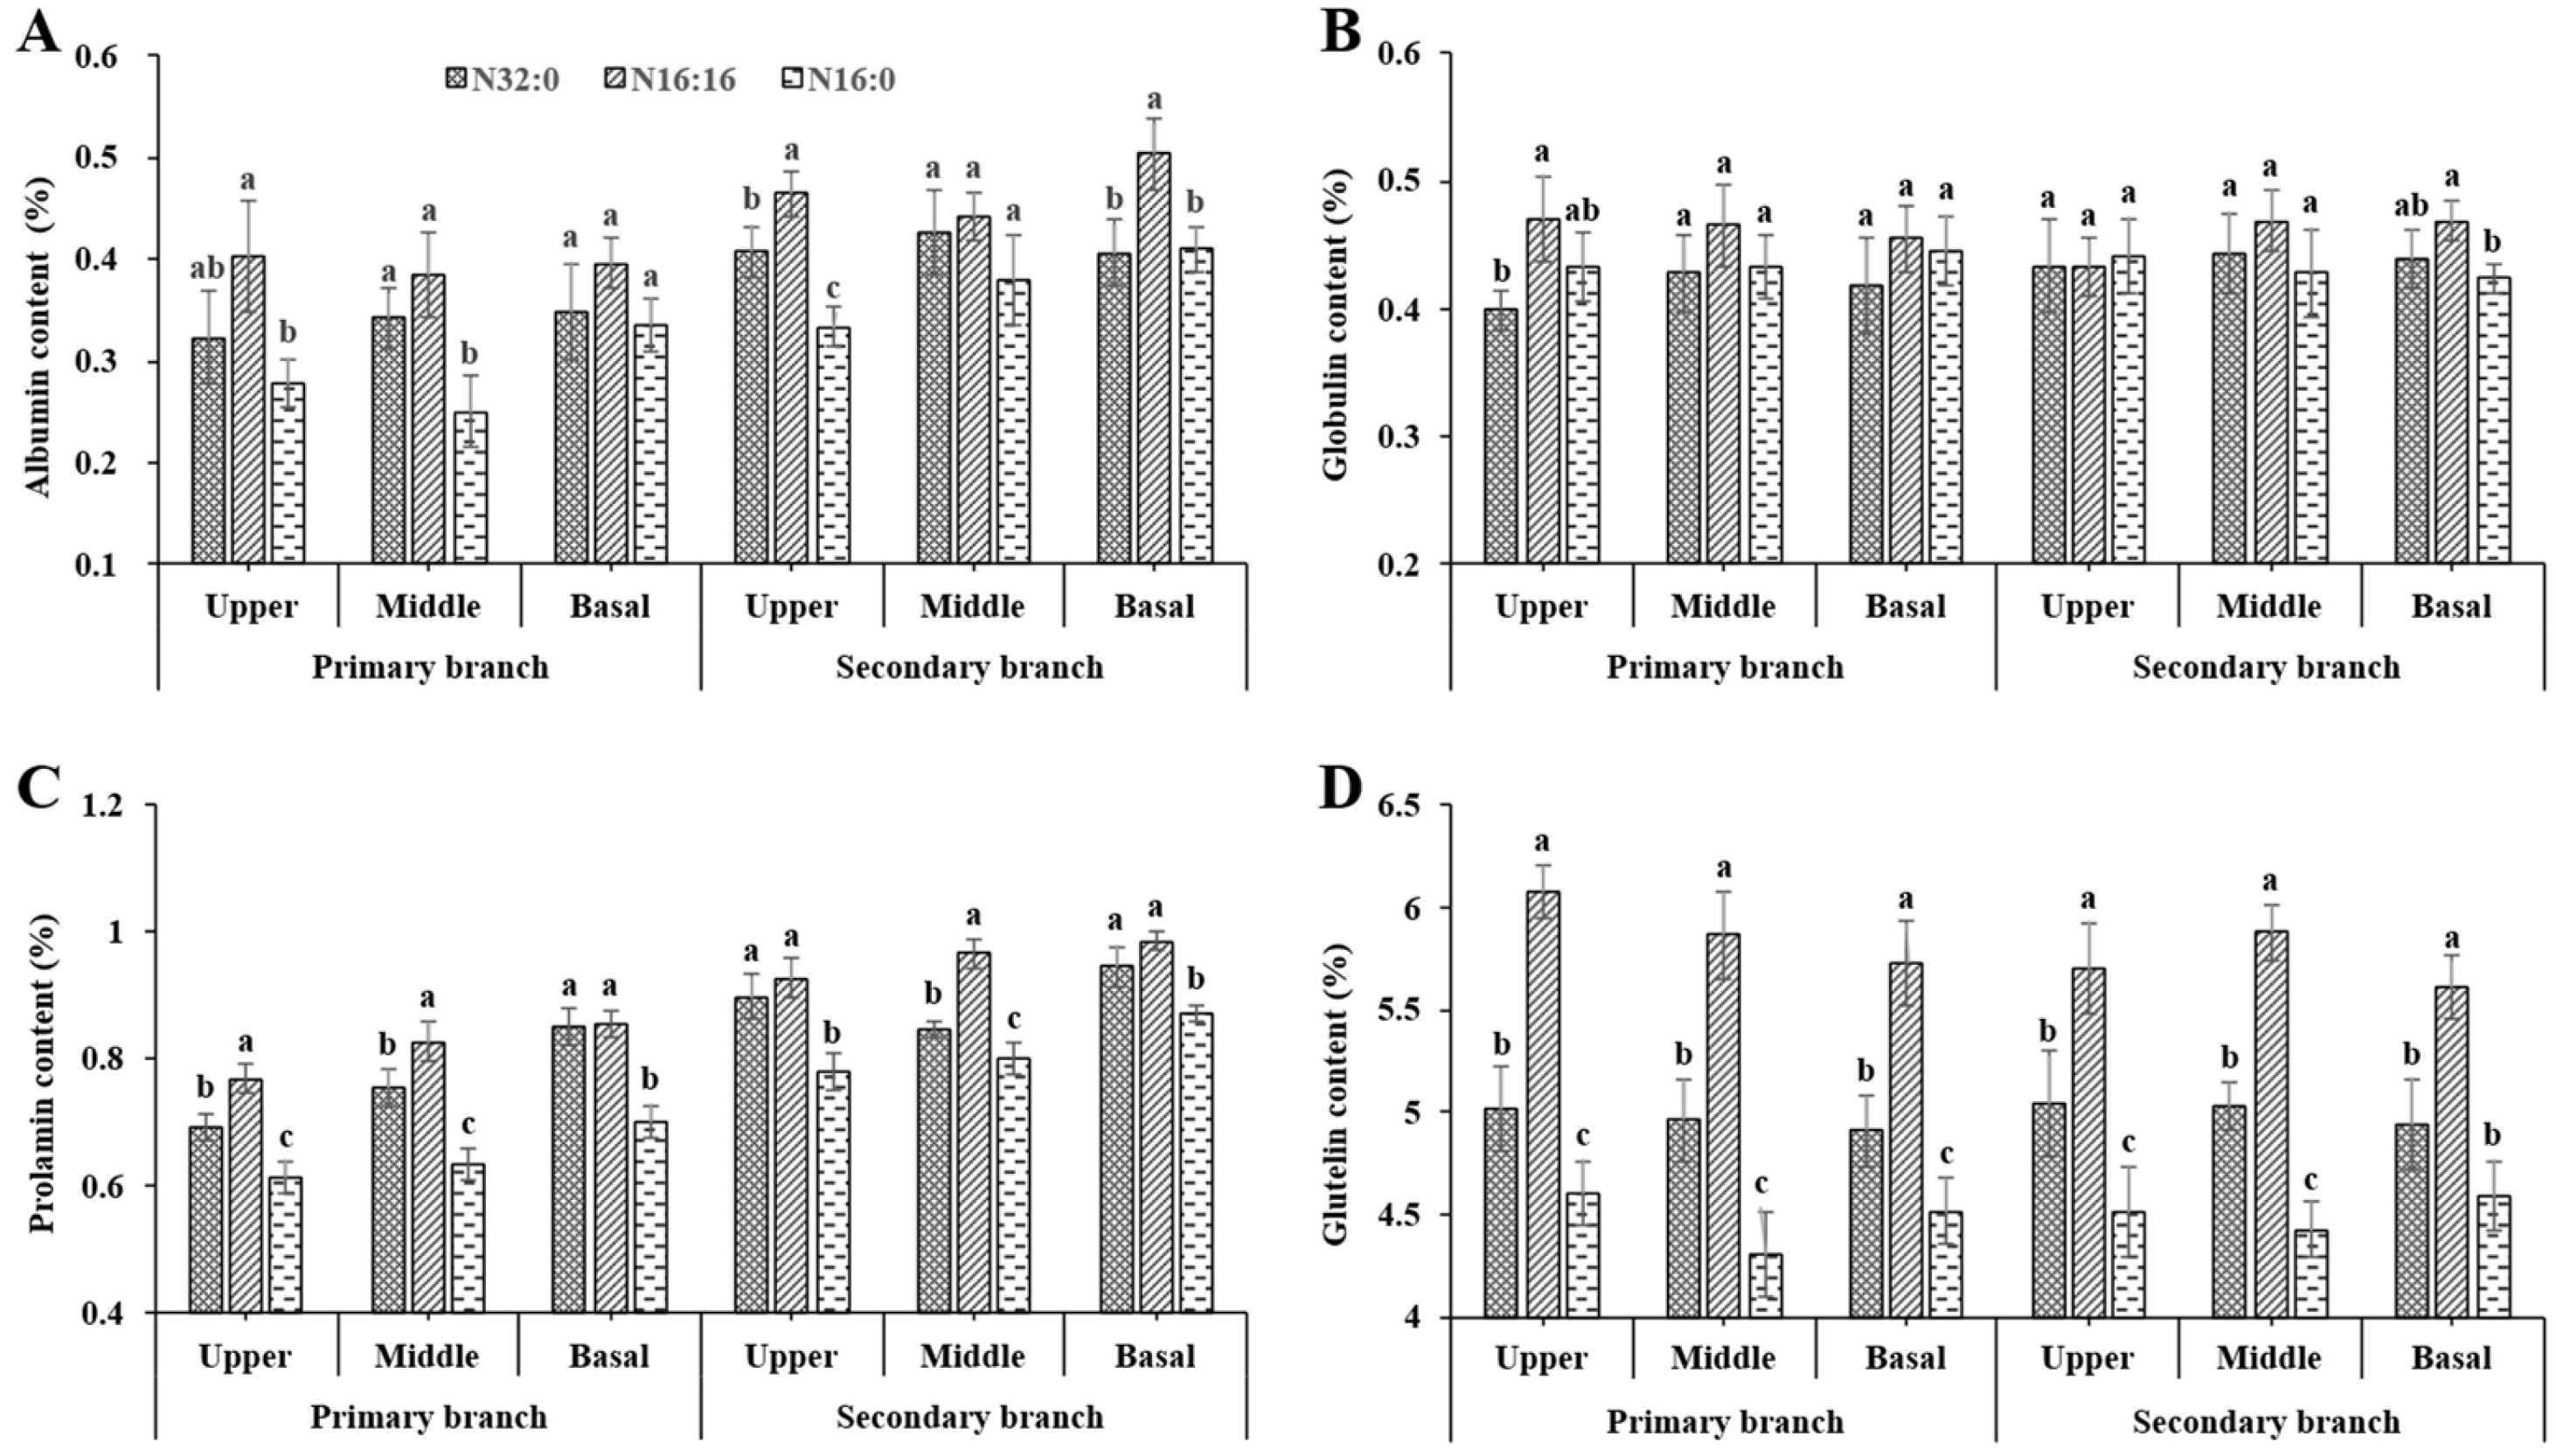
Nitrogen management significantly altered the accumulation profiles of distinct protein fractions across all panicle positions (Figure 5). Specifically, late N topdressing (N16:16) induced a consistent and significant increase in albumin, prolamin, and glutelin contents. The accumulation of these specific fractions progressively responded to N supply, consistently following the order of N16:16 > N32:0 > N16:0 across all spatial niches. The most substantial enhancement was observed in glutelin, which increased by an average of over 25% under the N16:16 treatment relative to the low-N control (N16:0). In contrast, globulin content remained largely unaffected by varying N fertilization regimes across all grain positions.
Beyond the treatment effects, an intrinsic spatial heterogeneity in protein partitioning was evident. Regardless of the N application strategy, secondary branch grains consistently accumulated significantly higher contents of albumin and prolamin compared to their corresponding primary branch counterparts at identical vertical strata. Consequently, these fraction-specific increases culminated in a uniform and significant elevation of total protein content across all grain positions under the late N supply.

3.2.5. Starch and Protein: Trade-Off Relationship

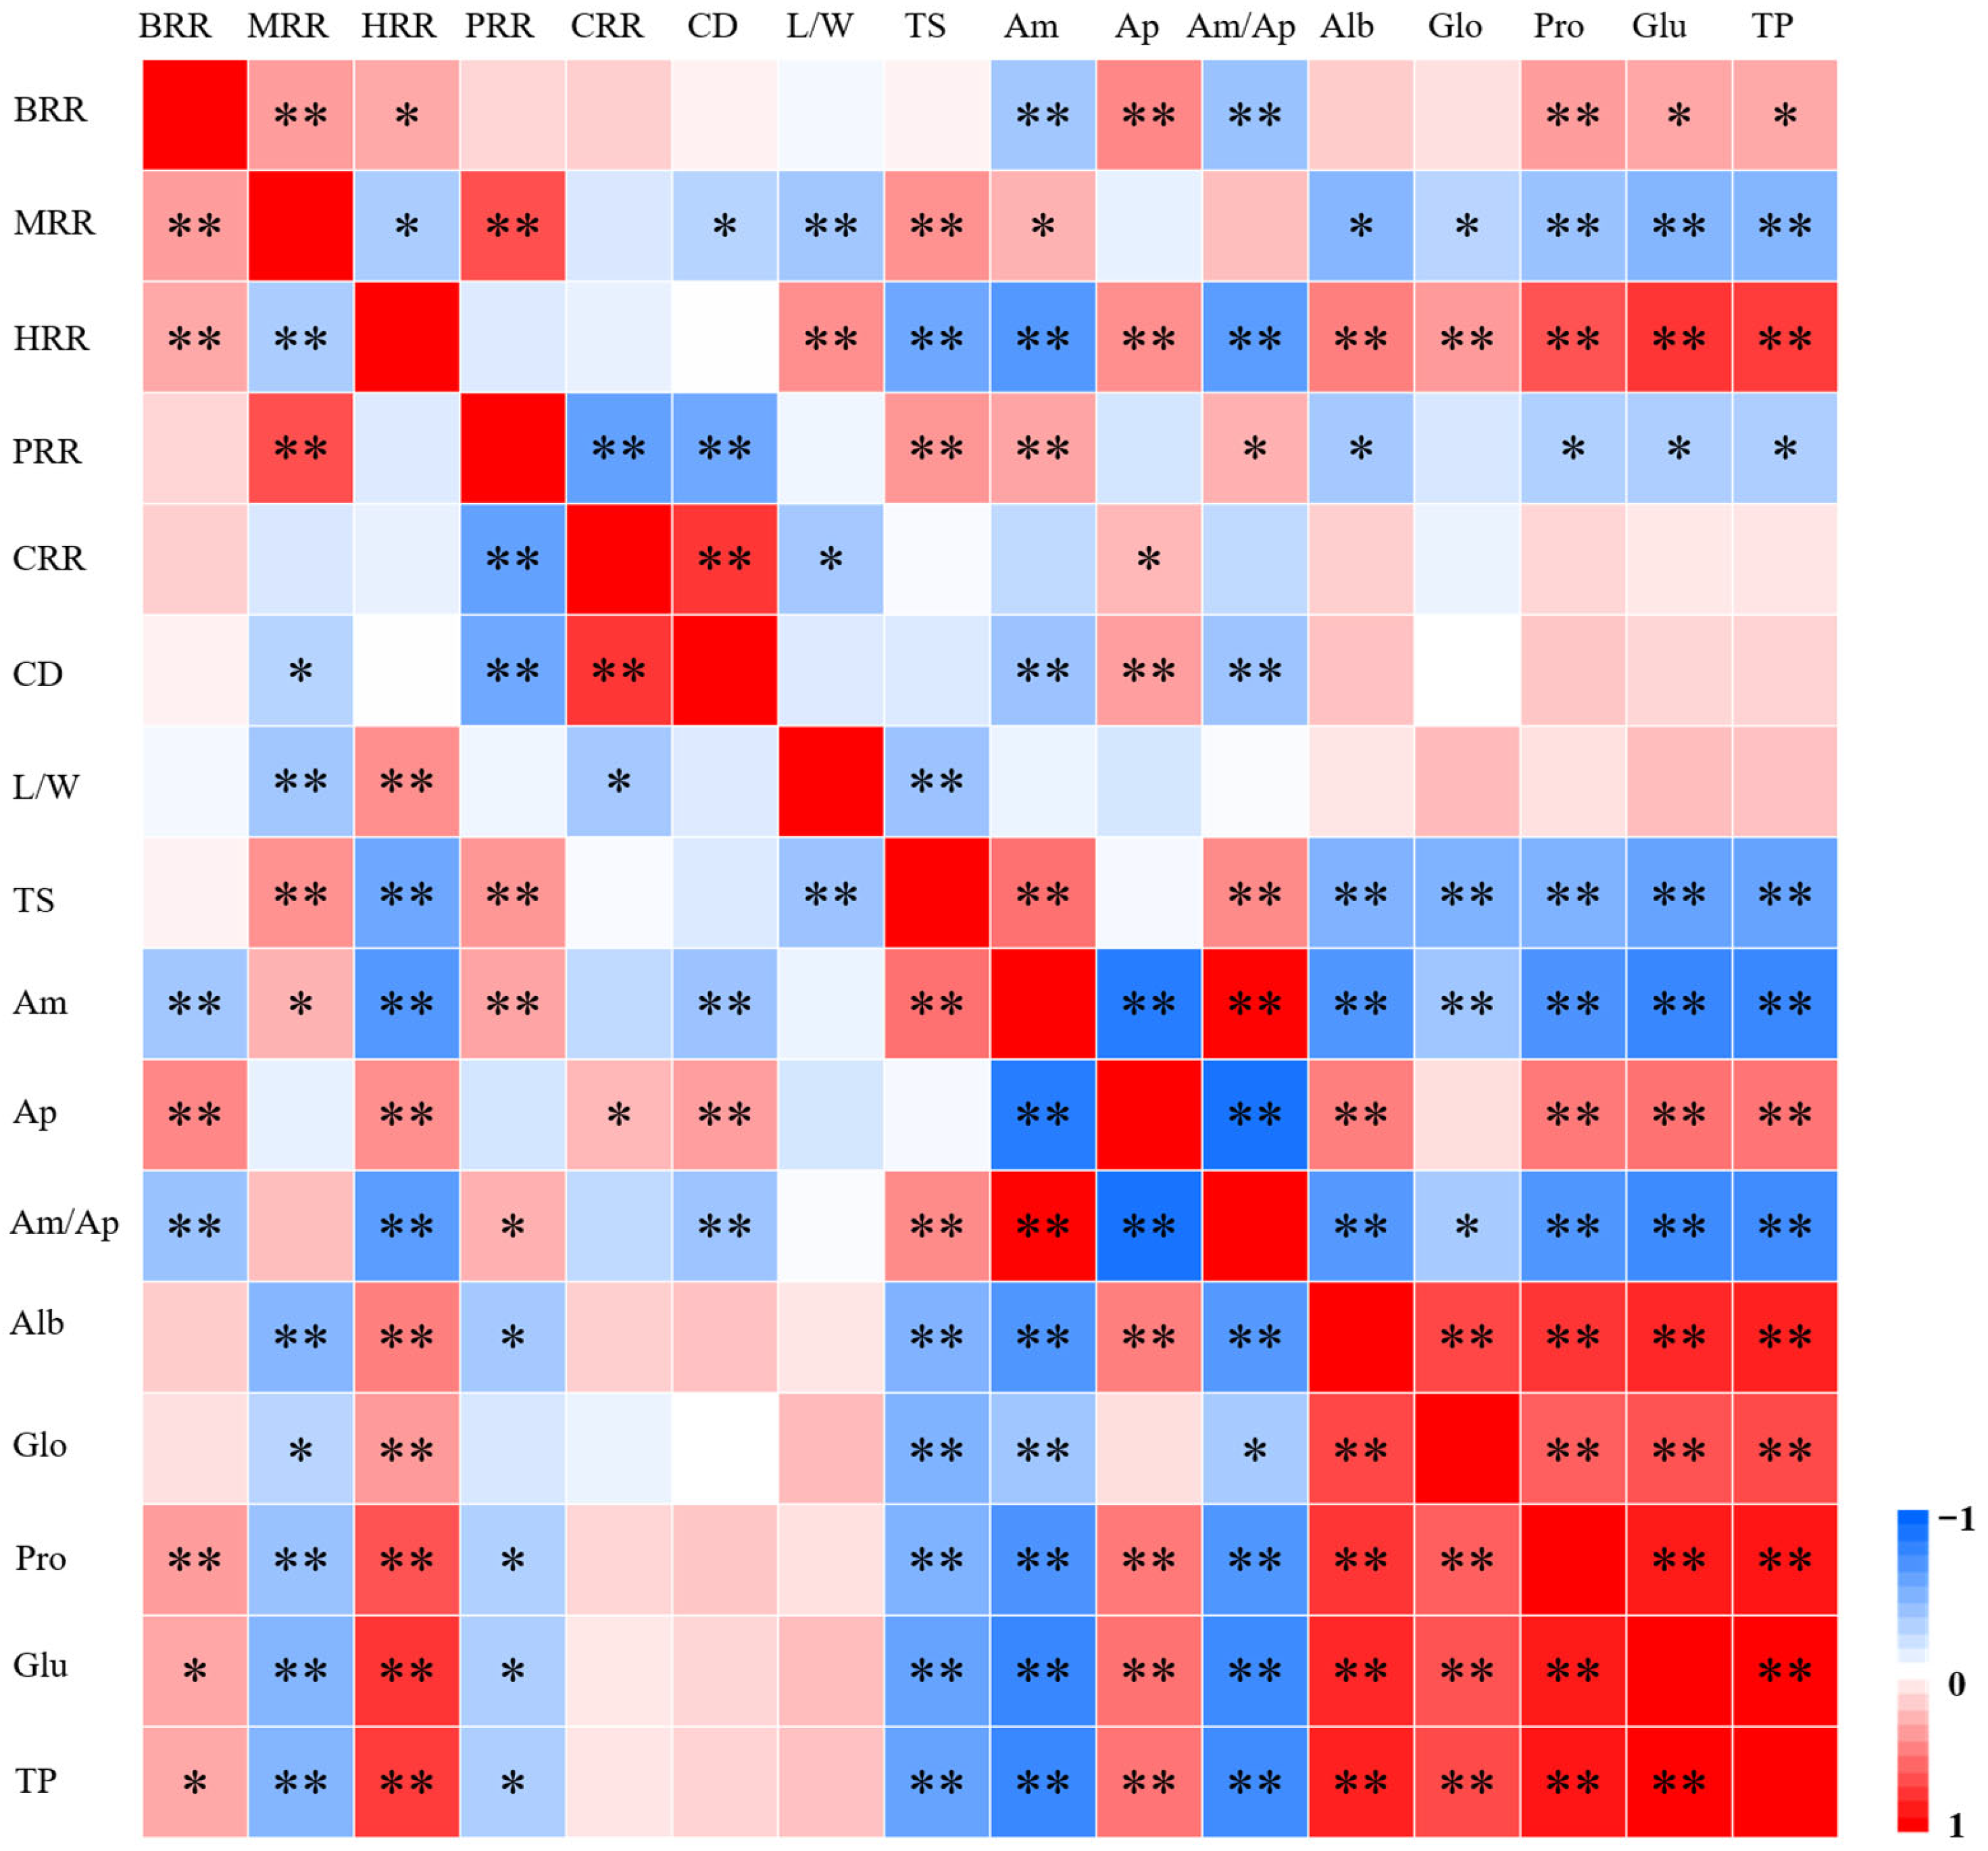
Complex relationships were present among the various quality parameters (Figure 6). Head rice rate (HRR) showed highly significant positive correlations with all protein fractions, but exhibited opposite relationships with total starch content (TS), amylose content (Am), and the amylose/amylopectin ratio (Am/Ap). Milled rice rate (MRR) exhibited a reverse relationship with HRR. Chalkiness degree was negatively correlated with amylose content, while positively correlated with amylopectin content. Notably, TS, Am, and Am/Ap showed highly significant negative correlations with all protein fractions.

4. Discussion

4.1. Late Nitrogen Application Enhances Milling Quality Through Protein-Mediated Grain Hardening, with Positional Specificity

The significant increase in head rice yield under the late N topdressing (N16:16) treatment, particularly in the PBIII and SBII grains (Figure 2C), aligns with the positive correlation between grain protein content and milling quality reported in previous studies [5,7,8]. Prior research indicates that storage proteins, specifically glutelin, fill the interstitial spaces between starch granules, forming a protein matrix that increases grain hardness and reduces breakage during milling [9,29]. Our data are consistent with this mechanism, as the N16:16 treatment universally elevated both glutelin and total protein contents across all grain positions (Figure 5). The significant and positive correlation between the head rice rate and all protein fractions observed in this study further supports the role of protein accumulation in improving milling quality (Figure 6).
In addition to biochemical changes, the N16:16 treatment also modified grain morphology, specifically by increasing the length-to-width ratio of secondary branch grains (Figure 3D). Previous studies suggest that an elongated grain shape can facilitate more uniform stress distribution during milling, thereby reducing kernel breakage [30]. In our study, this morphological change in secondary branch grains likely acted in combination with the increased protein content, contributing to their improved head rice rates under late N application (Figure 3D and Figure 5).
Furthermore, the contrasting outcomes between the N32:0 and N16:16 treatments—despite identical total N inputs—highlight the importance of N availability during the grain-filling period. Early N application (N32:0) mainly promotes vegetative growth, but this N pool may be largely depleted or partitioned into vegetative organs before anthesis, limiting its direct contribution to endosperm development [31]. In contrast, late N topdressing (N16:16) provides a continuous supply of translocatable N to the developing sinks during grain filling [6]. This source-sink dynamic is evident in the specific response of the inferior SBIII grains, which were improved by N16:16 but not by N32:0. Due to their delayed developmental timeline, these inferior grains appear highly dependent on a sustained late-season N supply to optimize their physical properties [13].

4.2. Nitrogen-Induced Chalkiness: A Consequence of Metabolic Imbalance in Vigorously Filling Grains

The severe deterioration of appearance quality—specifically the increased chalky grain rate and chalkiness degree under N fertilization (Figure 3B,C)—corroborates the well-documented negative impact of N supply on rice appearance [9,32,33]. By contrast, a recent study reported that N application improved the appearance quality by reducing the chalkiness in ratoon rice [34]. These divergent effects may be attributed to the differences in genotype or N application timing. However, a novel finding of this study is that the negative effect of N on chalkiness is not uniformly expressed across the rice panicle; instead, it is spatially concentrated in the middle and upper grains (PBII, PBI, SBI). Notably, these specific positions correspond to the grains that exhibit the most rapid and intense dry matter accumulation during the early to mid-grain filling stages. However, the grain chalkiness degree was largely affected by late N application in the secondary branch grains (Figure 3C).
It is well known that chalkiness fundamentally arises from the loose and disordered packing of starch granules and protein bodies in the endosperm, which creates interstitial air spaces that scatter light rather than transmitting it [22,35]. Physiologically, the genesis of chalkiness is often attributed to an asynchrony or imbalance in the accumulation rates of starch and storage proteins during grain filling [33,35,36]. Generally, the earlier-flowering spikelets (PBII, PBI, SBI) initiated grain filling earlier with a fast filling rate, however, their filling durations were shortened compared with later flowering spikelets (SBII and SBIII). This reduction in duration may result in insufficient starch accumulation during grain development, leading to enhanced chalkiness [22,37]. Unfortunately, the N topdressing can further reduce the biosynthesis of starch and amylose [33]. These conclusions strongly support our results (Figure 3B and Figure 4C). Additionally, the storage protein accumulation induced by late N application is a major factor responsible for the higher chalkiness degree in secondary branch grains (Figure 3C and Figure 5), since grain protein synthesis was enhanced at the expense of starch production [31].

4.3. The Carbon-Nitrogen Metabolic Trade-Off: A Unified Framework for Understanding Position-Specific Quality Responses

The position-specific quality responses observed in this study can be fundamentally understood through the lens of source–sink competition between carbon (C) and nitrogen (N) metabolism during the grain-filling period. Developing rice grains import C (as sucrose) and N (as amino acids) from the mother plant [38,39]. Within the endosperm, these assimilated resources are partitioned into starch (the primary C sink) and storage proteins (the primary N sink), utilizing biosynthetic pathways that inherently compete for limited energy (ATP) and carbon skeletons. Our data indicate that the late N application (N16:16) regime markedly shifts this metabolic balance in favor of N assimilation, as evidenced by the universal elevation of protein fractions across all spatial positions (Figure 5), while amylose content decreased (Figure 4C). Given that the energetic cost of protein synthesis is substantial—requiring approximately 1.5 g of glucose equivalents per gram of synthesized protein—this N-driven metabolic upregulation inevitably constrains starch biosynthesis [40]. It is widely documented that starch synthesis is more susceptible to ATP supply restriction than protein synthesis [41].
Crucially, this framework elucidates the underlying mechanism of N-induced chalkiness discussed in Section 4.2. In metabolically active superior and middle grains, the surge in N metabolism redirects key carbon intermediates (e.g., pyruvate and α-ketoglutarate) away from plastidial starch synthesis to fuel the TCA cycle. This competition potentially induces transient shortages in the carbon flux (e.g., ADP-glucose) required for optimal amyloplast development [42]. The upregulation of protein synthesis involves increased N assimilation and C skeleton consumption, with the consequent reduction in carbohydrates dedicated to starch biosynthesis [35]. Such metabolic bottlenecks directly result in the incomplete filling and disordered packing of starch granules. Conversely, inferior grains (SBIII), characterized by significantly slower baseline filling rates with longer filling duration [13], experience a less severe impact from this N-driven competitive pressure, thereby maintaining lower chalky grain rate (Figure 3B).

4.4. Agronomic Implications and Future Perspectives

The pronounced positional heterogeneity in grain quality responses to N reveals critical implications for both agronomic management and rice breeding. From a management perspective, our findings challenge the adequacy of traditional whole-panicle assessments, underscoring the necessity for precision N strategies that treat the panicle as a heterogeneous target. For instance, while late N application improves the milling quality of inferior grains, it simultaneously exacerbates chalkiness in superior grains. Achieving uniformly high-quality rice may therefore require alternative agronomic interventions, such as targeted, low-dose foliar N sprays during the linear filling phase of inferior grains [43]. In our study, late-stage topdressing accounted for 50% of the total nitrogen application, which is relatively high. However, previous studies have demonstrated that a late-stage nitrogen ratio of 30–40% facilitates the coordination of grain yield and quality [44,45]. Thus, we recommend that farmers adopt an optimal nitrogen application strategy with a nitrogen allocation ratio of 4:3:2:1 at the basal, tillering, panicle initiation, and spikelet differentiation stages, respectively. The total nitrogen application rate should be determined by combining soil nitrogen supply capacity and cultivar-specific requirements. This practice may help balance the milling quality among grains at different positions, as well as the overall balance between appearance quality and nutritional quality in rice. From a breeding standpoint, these results emphasize the potential of selecting cultivars with an optimized C–N metabolic balance or more synchronous grain-filling patterns. Varieties possessing stronger C sink strength (e.g., elevated starch synthase activity) could better tolerate late N supplies without severe penalties to appearance and eating quality.
While this study provides a detailed evaluation of position-specific grain quality and proposes a preliminary C–N metabolic framework, it is important to acknowledge that the underlying mechanisms are primarily inferred from the final physicochemical composition of the grains. To validate and build upon these findings, future research should directly monitor the dynamic activities of key C and N metabolic enzymes (e.g., AGPase and glutamine synthetase) throughout the grain-filling period. Additionally, employing stable isotope tracing (e.g., 13C and 15N) would offer definitive evidence regarding the real-time partitioning of assimilates to specific panicle positions under varying N regimes [46]. Furthermore, Scanning electron microscopy (SEM) or light microscopy observations are required to provide direct microstructural evidence for chalkiness formation. Finally, investigating these spatial responses across multiple genotypes and diverse environments, together with integrating multi-omics approaches, will be crucial for comprehensively elucidating the molecular networks governing this intra-panicle heterogeneity.

5. Conclusions

This study demonstrates that late nitrogen (N) topdressing differentially programs grain quality across the rice panicle. While late N application (N16:16) universally elevates protein accumulation and significantly enhances the milling quality of late-filling secondary branch grains, it simultaneously deteriorates the appearance and eating quality of vigorously filling superior grains by exacerbating chalkiness. These spatially divergent responses are likely associated with a carbon–nitrogen (C–N) metabolic trade-off, although more direct evidence is required to verify this in future study. Future agronomic practices and breeding programs should account for this intra-panicle spatiotemporal asynchrony to satisfy the specific developmental requirements of inferior grains while mitigating C–N competitive stress in superior grains.

Author Contributions

Conceptualization, Y.Z. and X.Z.; methodology, H.Y. and Y.W.; resources, C.N. and H.G.; formal analysis, H.Y.; investigation, Y.W. and C.N.; data curation: C.N. and H.G.; visualization, Y.Z.; validation, Y.Z.; project administration, H.Y.; supervision, X.Z.; writing-original draft, Y.Z., H.G., Y.W. and C.N.; writing-review & editing, X.Z. and H.Y.; funding acquisition, Y.Z. All authors have read and agreed to the published version of the manuscript.

Funding

This research was funded by the Modern Agricultural Key Technology Integration and Extension Project of Jiangsu Province [JCTG(2025)02-4], the “Qinglan Project” for Excellent Young Backbone Teachers in Jiangsu Universities (102603063), and the Key Cultivation Project of Jiangsu Polytechnic College of Agriculture and Forestry (2024kj20).

Data Availability Statement

The raw data supporting the conclusions of this article will be made available by the authors on request.

Acknowledgments

We gratefully acknowledge the technical support provided by the Jiangsu Agricultural Expo Garden, and we thank Na Zhang from the Changzhou Agricultural Technology Extension Center for kindly supplying the rice seeds. We also thank the AI-assisted tool “DeepSeek-R1” for language polishing. All authors have reviewed and approved the final content.

Conflicts of Interest

The authors declare no conflicts of interest.

References

  1. Custodio, M.C.; Cuevas, R.P.; Ynion, J.; Laborte, A.G.; Velasco, M.L.; Demont, M. Rice quality: How is it defined by consumers, industry, food scientists, and geneticists? Trends Food Sci. Technol. 2019, 92, 122–137. [Google Scholar] [CrossRef]
  2. Saha, I.; Durand-Morat, A.; Nalley, L.L.; Alam, M.J.; Nayga, R. Rice quality and its impacts on food security and sustainability in Bangladesh. PLoS ONE 2021, 16, e0261118. [Google Scholar] [CrossRef]
  3. Xiong, Q.Q.; Sun, C.H.; Wang, R.N.; Wang, R.Z.; Wang, X.Y.; Zhang, Y.; Zhu, J.Y. The key metabolites in rice quality formation of conventional japonica varieties. Curr. Issues Mol. Biol. 2023, 45, 990–1001. [Google Scholar] [CrossRef] [PubMed]
  4. Zhou, X.C.; Guo, H.L.; Lu, M.; Xu, Q.; Dou, Z.; Gao, H. Research progress on the effect of endosperm protein on rice quality. China Rice 2023, 29, 27–34, (In Chinese with English Abstract). [Google Scholar]
  5. Jiang, M.J.; Xu, W.B.; Li, L.J.; Zhang, J.F.; Wang, R.J.; Ji, G.M.; Luo, D.Q.; Jiang, X.H.; Tian, J.Y.; Li, M. Balanced nitrogen reduction for improved grain yield and eating quality in mechanically transplanted hybrid indica rice. Agriculture 2024, 14, 1313. [Google Scholar] [CrossRef]
  6. Teng, Y.; Chen, R.; Guo, M.; Chen, X.; Jiang, M. Synergistic effect of nitrogen fertilizer management on rice productivity and quality. Agronomy 2025, 15, 1648. [Google Scholar] [CrossRef]
  7. Zhang, X.C.; Fu, L.B.; Tu, Y.S.; Zhao, H.F.; Kuang, L.H.; Zhang, G.P. The influence of nitrogen application level on eating quality of the two indica-japonica hybrid rice cultivars. Plants 2020, 9, 1663. [Google Scholar] [CrossRef]
  8. Shi, S.; Zhang, G.; Li, L.; Chen, D.; Liu, J.; Cao, C.; Jiang, Y. Effects of nitrogen fertilizer on the starch structure, protein distribution, and quality of rice. ACS Food Sci. Technol. 2022, 2, 1347–1354. [Google Scholar] [CrossRef]
  9. Zhou, T.Y.; Zhou, Q.; Li, E.P.; Yuan, L.M.; Wang, W.L.; Zhang, H.; Li, L.J.; Wang, Z.Q.; Yang, J.C.; Gu, J.F. Effects of nitrogen fertilizer on structure and physicochemical properties of ‘super’ rice starch. Carbohydr. Polym. 2020, 239, 116237. [Google Scholar] [CrossRef]
  10. Chen, H.; Yang, G.; Xiao, Y.; Zhang, G.H.; Yang, G.X.; Wang, X.C.; Hu, Y.G. Effects of nitrogen and phosphorus fertilizer on the eating quality of indica rice with different amylose content. J. Food Compos. Anal. 2023, 118, 105167. [Google Scholar] [CrossRef]
  11. Mohapatra, P.K.; Panigrahi, R.; Turner, N.C. Physiology of spikelet development on the rice panicle: Is manipulation of apical dominance crucial for grain yield improvement? Adv. Agron. 2011, 110, 333–360. [Google Scholar]
  12. Yuan, X.; Luo, Y.; Yang, Y.; Chen, K.; Wen, Y.; Luo, Y.; Li, B.; Ma, Y.; Guo, C.; Chen, Z.; et al. Effects of postponing nitrogen topdressing on starch structural properties of superior and inferior grains in hybrid indica rice cultivars with different taste values. Front. Plant Sci. 2023, 14, 1251505. [Google Scholar] [CrossRef]
  13. Yang, J.; Zhang, J. Grain-filling problem in ‘super’ rice. J. Exp. Bot. 2010, 61, 1–5. [Google Scholar] [CrossRef]
  14. Zhang, X.C.; Md, A.A.; Lin, Z.M.; Liu, Z.H.; Li, G.H.; Wang, Q.S.; Wang, S.H.; Ding, Y.F. Analysis of variations in white-belly and white-core rice kernels within a panicle and the effect of panicle type. J. Integr. Agric. 2014, 13, 1672–1679. [Google Scholar] [CrossRef]
  15. Parida, A.K.; Sekhar, S.; Panda, B.B.; Sahu, G.; Shaw, B.P. Effect of panicle morphology on grain filling and rice yield: Genetic control and molecular regulation. Front. Genet. 2022, 13, 876198. [Google Scholar] [CrossRef]
  16. Jiang, Y.; Chen, Y.; Zhao, C.; Liu, G.M.; Shi, Y.; Zhao, L.T.; Wang, Y.; Wang, W.L.; Xu, K.; Li, G.H.; et al. The starch physicochemical properties between superior and inferior grains of japonica rice under panicle nitrogen fertilizer determine the difference in eating quality. Foods 2022, 11, 2489. [Google Scholar] [CrossRef]
  17. Jiang, H.; Zhao, Y.; Chen, L.; Wan, X.; Yan, B.; Liu, Y.; Liu, Y.; Zhang, W.; Gao, J. Grain weight and taste quality in japonica rice are regulated by starch synthesis and grain filling under nitrogen-phosphorus interactions. Plants 2025, 14, 432. [Google Scholar] [CrossRef]
  18. Jiang, L.; Xin, X.; Cao, Z.; Zhou, J.; Jia, H.; Wan, L.; Jia, B.; Wang, Y.; Wang, S.; Huang, Y.; et al. Effects of nitrogen application on grain-filling characteristics and quality of rice. J. Sci. Food Agric. 2026, 106, 3059–3071. [Google Scholar] [CrossRef]
  19. Zhang, X.C.; Zhang, G.P. Transcriptome and metabolome profiling reveal the regulatory mechanism of protein accumulation in inferior grains of indica-japonica rice hybrids. Curr. Plant Biol. 2021, 28, 100226. [Google Scholar] [CrossRef]
  20. Dong, M.H.; Sang, D.Z.; Wang, P.; Wang, X.M.; Yang, J.C. Variation in cooking and nutrient quality between grains at different positions within a rice panicle under different nitrogen levels. Chin. J. Rice Sci. 2006, 20, 389–395, (In Chinese with English Abstract). [Google Scholar]
  21. Xi, M.; Li, Z.; Liang, S.; Xu, Y.; Zhou, Y.; Tu, D.; Sun, X.; Yang, L. Positional variations of rice protein compositions accumulation within a panicle during the grain filling. BMC Plant Biol. 2025, 25, 356. [Google Scholar] [CrossRef]
  22. Li, Z.; Xi, M.; Xu, Y.; Sun, X.; Tu, D.; Zhou, Y.; Ji, Y.; Yang, L. Molecular mechanisms of grain chalkiness variation in rice panicles. Plants 2025, 14, 244. [Google Scholar] [CrossRef]
  23. Zhang, X.C.; Lei, J.C.; Zheng, D.Y.; Liu, Z.H.; Li, G.H.; Wang, S.H.; Ding, Y.F. Amino acid composition of leaf, grain and bracts of japonica rice (Oryza Sativa ssp. japonica) and its response to nitrogen fertilization. Plant Growth Regul. 2017, 82, 1–9. [Google Scholar] [CrossRef]
  24. Ma, H.; Jia, Y.; Wang, W.; Wang, J.; Zou, D.; Wang, J.; Gong, W.; Han, Y.; Dang, Y.; Wang, J.; et al. Effects of low-temperature stress during the grain-filling stage on carbon–nitrogen metabolism and grain yield formation in rice. Agronomy 2025, 15, 417. [Google Scholar] [CrossRef]
  25. Li, J.; Yang, H.J.; Deng, J.P. Current situation of rice production in Jiangsu and technical countermeasures for green sustainable development under the new situation. China Rice 2017, 23, 41–44, (In Chinese with English Abstract). [Google Scholar]
  26. Xu, X.J.; Xu, Y.F.; Zhu, X.Y.; Zhang, Q.; Tu, R.W. Effect of mechanical transplanting density on stem and tiller panicle rate and yield of Wuyunjing 31. China Rice 2019, 25, 104–105, (In Chinese with English Abstract). [Google Scholar]
  27. GB/T 15683-2008; Rice-Determination of amylose content. National Standard of People’s Republic of China: Beijing, China, 2008.
  28. Landry, J.; Moureaux, T. Hétérogénéité des glutélines du grain de maïs: Extraction sélective et composition en acides aminés des trois fractions isolées. Bull. Soc. Chim. Biol. 1970, 52, 1021–1037. [Google Scholar]
  29. Li, J.; Yang, S.; Zhong, Z.; Xia, T.; Zhou, W.; Tu, Z.; Chen, Z.; Wang, H.; Dai, Z.; Jin, G.; et al. Effects of degree of milling on bran layer structure, physicochemical properties and cooking quality of brown rice. Food Chem. 2025, 462, 140847. [Google Scholar] [CrossRef]
  30. Li, G.; Zhang, H.; Li, J.; Zhang, Z.; Li, Z. Genetic control of panicle architecture in rice. Crop J. 2021, 9, 590–597. [Google Scholar] [CrossRef]
  31. Wei, H.; Chen, Z.; Xing, Z.; Liu, Q.; Zhang, Z.; Jiang, Y.; Hu, Y.; Zhu, J.; Cui, P.; Dai, Q.; et al. Effects of slow or controlled release fertilizer types and fertilization modes on yield and quality of rice. J. Integr. Agric. 2018, 17, 2222–2234. [Google Scholar] [CrossRef]
  32. Qiao, J.F.; Liu, Z.H.; Deng, S.Y.; Ning, H.F.; Yang, X.Y.; Lin, Z.M.; Li, G.H.; Wang, Q.S.; Wang, S.H.; Ding, Y.F. Occurrence of perfect and imperfect grains of six japonica rice cultivars as affected by nitrogen fertilization. Plant Soil 2011, 349, 191–202. [Google Scholar] [CrossRef]
  33. Xi, M.; Wu, W.G.; Xu, Y.Z.; Zhou, Y.J.; Chen, G.; Ji, Y.L.; Sun, X.Y. Grain chalkiness traits is affected by the synthesis and dynamic accumulation of the storage protein in rice. J. Sci. Food Agric. 2021, 101, 6125–6133. [Google Scholar] [CrossRef]
  34. Tu, D.; Yang, L.; Liang, S.; Li, Z.; Xu, Y.; Zhou, Y.; Sun, X.; Xi, M. Nitrogen management regulates grain quality of rice ratoon crop by altering starch structure and protein composition. Carbohydr. Polym. 2026, 374, 124721. [Google Scholar] [CrossRef]
  35. Xi, M.; Wu, W.G.; Xu, Y.Z.; Zhou, Y.J.; Chen, G.; Ji, Y.L.; Sun, X.Y. iTRAQ-based quantitative proteomic analysis reveals the metabolic pathways of grain chalkiness in response to nitrogen topdressing in rice. Plant Physiol. Biochem. 2020, 154, 622–635. [Google Scholar] [CrossRef]
  36. Ishimaru, T.; Horigane, A.K.; Ida, M.; Iwasawa, N.; San-oh, Y.A.; Nakazono, M. Formation of grain chalkiness and changes in water distribution in developing rice caryopses grown under high-temperature stress. J. Cereal Sci. 2009, 50, 166–173. [Google Scholar] [CrossRef]
  37. Su, Y.; Xiao, L. 3D visualization and volume-based quantification of rice chalkiness in vivo by using high resolution micro-CT. Rice 2020, 13, 69. [Google Scholar] [CrossRef]
  38. Farrar, J.; Pollock, C.; Gallagher, J. Sucrose and the integration of metabolism in vascular plants. Plant Sci. 2000, 154, 1–11. [Google Scholar] [CrossRef]
  39. Xiong, R.; Tan, X.; Yang, T.; Wang, H.; Pan, X.; Zeng, Y.; Zhang, J.; Zeng, Y. Starch multiscale structure and physicochemical property alterations in high-quality indica rice quality and cooked rice texture under different nitrogen panicle fertilizer applications. Int. J. Biol. Macromol. 2023, 252, 126455. [Google Scholar] [CrossRef]
  40. Penning de Vries, F.W.T.; Brunsting, A.H.M.; van Laar, H.H. Products, requirements and efficiency of biosynthesis: A quantitative approach. J. Theor. Biol. 1974, 45, 339–377. [Google Scholar] [CrossRef]
  41. Emes, M.J.; Bowsher, C.G.; Hedley, C.; Burrell, M.M.; Scrase-Field, E.S.F.; Tetlow, I.J. Starch synthesis and carbon partitioning in developing endosperm. J. Exp. Bot. 2003, 54, 569–575. [Google Scholar] [CrossRef]
  42. Li, S.; Wei, X.; Ren, Y.; Qiu, J.; Jiao, G.; Guo, X.; Tang, S.; Wan, J.; Hu, P. OsBT1 encodes an ADP-glucose transporter involved in starch synthesis and compound granule formation in rice endosperm. Sci. Rep. 2017, 7, 40124. [Google Scholar] [CrossRef]
  43. Zhang, H.; Jing, W.; Zhao, B.; Wang, W.; Xu, Y.; Zhang, W.; Gu, J.; Liu, L.; Wang, Z.; Yang, J. Alternative fertilizer and irrigation practices improve rice yield and resource use efficiency by regulating source-sink relationships. Field Crops Res. 2021, 265, 108124. [Google Scholar] [CrossRef]
  44. Guo, C.; Yuan, X.; Yan, F.; Xiang, K.; Wu, Y.; Zhang, Q.; Wang, Z.; He, L.; Fan, P.; Yang, Z.; et al. Nitrogen application rate affects the accumulation of carbohydrates in functional leaves and grains to improve grain filling and reduce the occurrence of chalkiness. Front. Plant Sci. 2022, 13, 921130. [Google Scholar] [CrossRef]
  45. Huang, M.; Shu, A.; Xie, J.X.; Cao, F.B.; Chen, J.N.; Wang, W.Q.; Zheng, H.B. Nitrogen management for improving grain yield and quality in high-quality hybrid rice. J. Soil Sci. Plant Nut. 2025, 25, 1480–1492. [Google Scholar] [CrossRef]
  46. Yang, S.; Chen, L.; Tang, Y.; Tan, X.; Zeng, Y.; Pan, X.; Zeng, Y. Quantitative assessment of the transport and distribution of photosynthetic carbon and exogenous nitrogen in a rice-soil system under long-term straw return: An isotope trial using 13C and 15N labelling. J. Integr. Agric. 2025, 24, 4063–4077. [Google Scholar] [CrossRef]
Figure 1. A schematic diagram of the rice panicle. PBI (Primary Branch, Upper), grains from the top three primary branches; PBII (Primary Branch, Middle), grains from the middle three primary branches; PBIII (Primary Branch, Lower): grains from the bottom three primary branches; SBI (Secondary Branch, Upper): grains from secondary branches attached to the upper three primary branches; SBII (Secondary Branch, Middle): grains from secondary branches attached to the middle three primary branches; SBIII (Secondary Branch, Lower): grains from secondary branches attached to the lower three primary branches. The red lines on the rachis represent the boundary points between the upper, middle, and lower parts.
Agronomy 16 00789 g001
Figure 2. Spatial heterogeneity in milling quality responses to nitrogen within a rice panicle. (A) Brown rice rate, (B) Milled rice rate, (C) Head rice rate. Data are means ± SD (n = 3). Different lowercase letters above bars for a given grain position indicate significant differences among N treatments at p < 0.05, the same below.
Agronomy 16 00789 g002
Figure 3. Effects of nitrogen on appearance quality parameters across different panicle positions. (A) Perfect grain rate, (B) Chalky grain rate, (C) Chalkiness degree, (D) Length-to-width ratio.
Agronomy 16 00789 g003
Figure 4. Spatial heterogeneity in starch composition within a rice panicle in response to nitrogen. (A) Total starch content, (B) Amylose to amylopectin ratio, (C) Amylose content, (D) Amylopectin content.
Agronomy 16 00789 g004
Figure 5. Spatial heterogeneity in protein components within a rice panicle in response to nitrogen. (A) Albumin content, (B) Globulin content, (C) Prolamin content, (D) Glutelin content.
Agronomy 16 00789 g005
Figure 6. Correlation analysis among quality traits across the six grain positions. BRR, brown rice rate; MRR, milled rice rate; HRR, head rice rate; PRR, perfect rice rate; CRR, chalky rice rate; CD, chalkiness degree; L/W, length-to-width ratio; TS, total starch content; Am, amylose content; Ap, amylopectin content; Alb, albumin content; Glo, globulin content; Pro, prolamin content; Glu, glutelin content; TP, total protein content. “*” and “**” represent significant differences at the p < 0.05 and p < 0.01 levels.
Agronomy 16 00789 g006
Table 1. Effects of nitrogen treatment on the quality traits of whole panicle grains of Wuyunjing 31.
Rice QualityQuality IndexNitrogen Treatment
N32:0N16:16N16:0MeanCV (%)
Milling qualityBrown rice rate (%)82.32 ± 0.21 a82.59 ± 0.18 a81.87 ± 0.15 b82.260.44
Milled rice rate (%) 70.65 ± 0.30 a70.29 ± 0.25 a69.70 ± 0.22 b70.210.68
Head rice rate (%)51.21 ± 1.05 b 57.29 ± 1.18 a50.41 ± 0.95 b52.977.10
Appearance qualityPerfect rice rate (%)77.61 ± 1.52 b77.44 ± 1.43 b84.22 ± 1.61 a79.764.85
Chalky rice rate (%)21.28 ± 1.31 a18.00 ± 1.05 b13.17 ± 0.88 c17.4823.34
Chalkiness degree (%)8.45 ± 0.62 a7.94 ± 0.51 a5.53 ± 0.39 b7.3021.36
Length-to-width ratio (L/W)1.62 ± 0.02 a1.64 ± 0.03 a1.62 ± 0.02 a1.630.71
Eating qualityTotal starch content (%)81.53 ± 0.71 b78.41 ± 0.62 c83.62 ± 0.48 a81.243.24
Amylose content (%)22.72 ± 0.35 a19.77 ± 0.40 b22.84 ± 0.32 a21.787.98
Amylopectin content (%)58.81 ± 0.48 b58.63 ± 0.51 b60.77 ± 0.45 a59.462.00
Nutritional qualityAlbumin content (%)0.37 ± 0.02 b0.43 ± 0.02 a0.33 ± 0.01 c0.3813.25
Globulin content (%)0.43 ± 0.01 b0.46 ± 0.01 a0.43 ± 0.01 b0.443.94
Prolamin content (%)0.83 ± 0.04 a0.89 ± 0.03 a0.73 ± 0.02 b0.829.86
Glutelin content (%)4.98 ± 0.21 b5.81 ± 0.25 a4.49 ± 0.18 c5.1013.08
Total protein content (%) 6.62 ± 0.28 b7.60 ± 0.31 a5.99 ± 0.22 c6.7312.06
Values are means ± SD (n = 3). Different lowercase letters within a row indicate significant differences among N treatments at p < 0.05 (Duncan’s test). CV, coefficient of variation.
Table 2. Two-way ANOVA showing significance of position, nitrogen treatment (N), and their interaction (position × N) on rice quality traits.
TraitsPositionN TreatmentPosition × N
Brown rice ratio ******
Milled rice rate ******
Head rice rate *****
Perfect rice rate ******
Chalky rice rate ******
Chalkiness degree ******
Length/width ratio ******
Total starch content ******
Amylose content ******
Amylopectin content ******
Albumin content ****ns
Globulin content ns**ns
Prolamin content *****
Glutelin content ns**ns
Total protein content ns**ns
“*” and “**” represent significant differences at the p < 0.05 and p < 0.01 levels, respectively, while “ns” stands for not significant.
Disclaimer/Publisher’s Note: The statements, opinions and data contained in all publications are solely those of the individual author(s) and contributor(s) and not of MDPI and/or the editor(s). MDPI and/or the editor(s) disclaim responsibility for any injury to people or property resulting from any ideas, methods, instructions or products referred to in the content.