Article

Enhancing Olive Oil Functional Properties by Pre-Harvest Foliar Application of Chitosan and Harpin Elicitors on ‘Megaritiki’ Olive Cultivar Grown Under Rainfed Conditions in Greece


by
Asimina-Georgia Karyda
1,
Georgios Roubis
1,
Stefania Komninou
1,
Aikaterini Mpelimpasaki
1,
Maria Zoti
2 and
Petros Anargyrou Roussos
1,*
1
Laboratory of Pomology, Department of Crop Science, Agricultural University of Athens, Iera Odos 75, 11855 Athens, Greece
2
General Directory of Agriculture, Ministry of Rural Development and Food, 10176 Athens, Greece
*
Author to whom correspondence should be addressed.
Agronomy 2026, 16(8), 788; https://doi.org/10.3390/agronomy16080788
Submission received: 21 March 2026 / Revised: 6 April 2026 / Accepted: 8 April 2026 / Published: 11 April 2026

Abstract

Climate change-induced abiotic stress, particularly heat and drought during olive oil accumulation, significantly threatens the productivity and oil quality of olive trees (Olea europaea L.). This study investigated the efficacy of pre-harvest elicitation using the biostimulants harpin and chitosan (both as commercially available products) under summer conditions in Greece, in commercially productive rainfed groves of cv. ‘Megaritiki’. Multivariate analysis (PCA and factor analysis) revealed that pre-harvest application of these elicitors successfully balanced the trade-off between oil yield and quality. Both harpin and chitosan maintained hydrolytic (free acidity—0.25 and 0.29 g oleic acid 100 g−1, respectively, compared to 0.56 g oleic acid 100 g−1 in the control) and primary oxidative markers (peroxides—4.16 and 4.16 meq O2 kg−1, respectively, compared to 5.20 meq O2 kg−1 in the control) at exceptionally low levels compared to untreated trees. The treatments induced a distinctive metabolic shift regarding volatile compounds governed by the lipoxygenase (LOX) pathway. Harpin application was strongly associated with complex floral and fruity volatile compounds (2-hexen-1-ol and trans-2-hexenal) and a high α-tocopherol concentration (38.58 mg kg−1 compared to 23.12 mg kg−1 in the control), suggesting an enhanced physiological response in favor of oil quality attributes. Conversely, chitosan elevated the oxidative stability of the oil by increasing total phenol concentration (by almost 97% compared to the control) and prioritizing the accumulation of the stable monounsaturated fatty acids (oleic acid—increased by 12.5% compared to the control) over polyunsaturated ones (linoleic acid), while endowing the oil with desirable “green freshness” aromas (cis-3-hexenal). These results demonstrate that elicitation with harpin and chitosan is a potent tool for sustainably enhancing extra virgin olive oil quality under rainfed conditions in Greece, steering fruit metabolism toward a premium nutraceutical and sensory profile and enhancing the functional properties of the oil (phenol content, antioxidant capacity, monounsaturated fatty acids, α-tocopherol and squalene).

1. Introduction

The olive tree (Olea europaea L.), one of the oldest cultivated species in the world, stands as one of the most fundamental pillars of Mediterranean Basin ecology, environment, economy, and cultural heritage [1,2]. It is strongly tied with local traditions and rituals and is a symbol of peace, prosperity and longevity [3]. These unique characteristics of the tree are mostly based on its long standing history in the area, dating far beyond 4000 BC [4]. The olive tree is also linked to the Mediterranean’s unique climate and culinary identity, as olive oil, for many people is the cornerstone of the famous Mediterranean diet, cherished for its distinctive flavors and nutritional benefits [1,5].
Mediterranean olive groves represent around 95% of the world’s total cultivated area for this species [6,7]. The olive tree is considered one of the most suitable and best-adapted species to the Mediterranean-type climate, characterized by warm, dry summers and mild, wet winters. Over millennia, it has developed specific phenological and physiological characters to survive in marginal and less favorable, subhumid, and semi-arid lands [8]. While the species is renowned for its resilience to drought and varying temperature regimes, recent environmental shifts are testing the limits of this adaptation [8,9].
Climate change currently stands as the most significant imminent challenge that human societies and agricultural sectors face in the 21st century. The Mediterranean Basin is considered a climate change “hotspot”, i.e., a vulnerable region where the potential impacts of climate change are expected to be severe [10]. Most climate change scenarios and models predict an increase in air temperature along with a reduction in precipitation incidences, since summer rainfalls are expected to decrease by 10 to 30% [5]. This overall increase in aridity, coupled with more frequent and severe heatwaves, creates a challenging environment for olive growers, as olive trees may be drought-resistant, but their yields are highly vulnerable to water stress and extreme temperatures [11]. Production is heavily dependent on water availability, traditionally provided by winter rainfall that replenishes soil moisture, as most olive groves dedicated to olive oil production are grown under rainfed conditions [9]. However, the annual number of dry days is increasing along with the frequency, intensity and duration of heatwaves in summer, and with these, the atmospheric water demand, expressed through reference evapotranspiration (ETo), is also expected to increase [12].
The impact of summer stress extends beyond yield reduction, as it also affects olive oil quality and nutritional attributes. Severe water deficit and high temperatures alter the oil accumulation process, decreasing beneficial polyphenols and oleic acid content while increasing oil acidity [3,13]. These changes reduce the market value and stability of the oil, affecting its flavor, aroma, and nutritional profile. Consequently, future olive cultivation may require significantly higher water inputs at a time when water availability is likely to be reduced and subject to increasing competition from urban demands [14]. Studies have projected yield declines of up to 45% in primary production areas by the end of the century due to these combined stressors [15].
In this context, developing robust adaptation and mitigation strategies is essential to ensure the sustainability of olive-growing areas. Short-term strategies include precision irrigation management, the use of alternative water sources (such as reclaimed water, olive mill waste water etc.), and specific soil management practices such as mulching and the use of cover crops to preserve soil moisture [5,16]. Other field management practices, such as tailored pruning, early harvesting, and the application of precision agriculture tools, provide immediate tactical responses to extreme weather. Long-term strategies, on the other hand, focus on cultivar and clone selection or breeding for heat and drought tolerance (among other traits such as yield and product quality), and potential relocation to more favorable climatic conditions [5,16]. Since breeding for tolerant cultivars is a costly and time-consuming endeavor [4], farmers desperately need tools that serve as as immediate, effective and cheap alleviation measures to ensure olive production and their income.
Among these strategies, biostimulants have emerged as a promising and sustainable tool for modern agriculture [13]. Based on natural compounds or microorganisms, biostimulants promote plant growth-related processes even at low levels, improving nutrient uptake and use efficiency and improving plant tolerance to abiotic stress factors [13].
Chitosan and harpin are valuable biostimulants elicitors that have been tested against various biotic and abiotic stress factors with varying efficacy [17,18,19,20]. Chitosan, a natural cationic amino-polysaccharide derived from the deacetylation of chitin—a structural component found in crustacean and insect exoskeleton and fungal cell walls—has emerged as a potent elicitor and plant growth promoter [21,22,23,24]. Due to its biocompatibility and high affinity for plant cell membranes, chitosan triggers a wide array of defense-related molecular systems. It enhances the physiological resilience to abiotic stressors such as high temperatures and drought by upregulating the phenylpropanoid pathway—specifically through increased activity of phenylalanine ammonia lyase (PAL) and tyrosine ammonia lyase (TAL) [25]. Furthermore, chitosan application supports the plant’s antioxidant defense systems, reducing the accumulation of reactive oxygen species (ROS) [26] and improving water use efficiency (WUE) through the regulation of stomatal conductance and transpiration, often mediated by abscisic acid (ABA) signaling [24,25,27,28].
Similarly, harpin proteins represent a class of heat-stable, glycine-rich proteinaceous elicitors originally isolated from Gram-negative plant pathogenic bacteria such as Erwinia amylovora [29,30,31]. When applied foliarly, harpin is recognized by specific receptors in the plant cell wall, triggering a systemic signal that activates multifaceted defense and growth pathways, including those dependent on salicylic acid, jasmonic acid, and ethylene [31,32,33]. This elicitation leads to the expression of genes involved in the hypersensitive response and the systemic acquired resistance (SAR) pathway, manifested by increased lignin deposition and the accumulation of secondary metabolites like chlorogenic acid and polyphenols [34]. In addition to suppressing diseases and insect pests, harpin enhances plant vigor, biomass, and fruit quality, while also promoting tolerance to environmental extremes [29,32,35]. Recent transcriptomic evidence suggests that harpin-mediated resilience is further supported by the generation of nitric oxide and the activation of stress-response genes, providing a comprehensive biological shield against both biotic threats and the physiological challenges of summer drought [33,36,37].
Given the vital contribution of the olive sector to the Mediterranean economy and identity, it is crucial to improve its resilience and productivity. The present study explores the efficacy of foliar applications of the elicitors chitosan and harpin to rainfed grown olive trees under Greece’s summer conditions, aiming to safeguard the future of olive farming in an increasingly volatile and harsh climate. The evaluation of their efficacy was based on yield and oil production, as well as oil quality attributes and functional characteristics (phenol content, antioxidant capacity, unsaturated fatty acids, α-tocopherol and squalene). There are not many data concerning the efficacy of these elicitors in olive trees and olive oil. In fact, to our knowledge, this is the first report on the effect of harpin and the most extensive work on the effect of chitosan on olive oil quality and nutraceutical properties.

2. Materials and Methods

2.1. Trial Site—Plant Material and Treatments

The study was conducted in two adjacent olive groves in Katheni village (38.5712° N, 23.7726° E), Evia county, in central Greece. The two olive groves were selected to increase the number of replications under different trial sites. In all sites, the olive trees were cultivated under rainfed conditions.
In each olive grove, eighteen uniform, full-bearing, thirty-six-year old trees of the cultivar ‘Megaritiki’, with a similar fruit load, were selected in early summer.
Apart from the control treatment (no spray at all), two commercially available products of elicitors were used, i.e.,
  • Project One (chitosan hydrochloride 3% w/w) SL (by Phytorgan S.A., Nea Kifisia, Athens, Greece) (from now on referred to as chitosan) at the supplier-recommended and registered dose rate of 300 mL 100 L−1, and
  • ProAct (Harpin αβ 1% w/w) WG (Plant Health Care, Pittsburgh, PA, USA, distributed in Greece by K&N Efthimiadis S.A., Sindos, Greece) (from now on referred to as harpin) at the supplier-recommended and registered dose rate of 15 g 100 L−1.
Both products were applied at one-month intervals, starting from the beginning of July and ending at the beginning of October (four spray applications, using a knapsack battery-driven sprayer equipped with an adjustable hollow cone nozzle with an integrated orifice disk). Six trees were used per treatment in each orchard, with each pair of trees representing one replicate (thus, three replicate plots per treatment, each consisting of two trees). The trees were sprayed till the point of run-off, with a mean application volume of 6.5 L of spray solution per tree.
The climatic data per month in the region are shown in Table 1 (sources NASA POWER https://power.larc.nasa.gov/data-access-viewer/ and www.freemeteo.gr, last access on 15 March 2026). Based on the following table, it is evident that summer conditions were characterized by elevated temperatures and low rainfall, which may affect olive growth under rainfed conditions.
The harvest took place in early November. Each plot was harvested separately, and the yield was recorded. Approximately 1.5 kg healthy olive fruits were randomly sampled from each plot and transferred to the laboratory for oil extraction. A total of three samples (1.5 kg each) per treatment per orchard were assayed.

2.2. Olive Oil Extraction Procedure

The maturity index of the fruits was determined in the laboratory using a sample of 100 randomly selected olive fruits [38]. The oil was extracted from the olive fruits using an Abencor-type olive mill (Callis S.A., Athens, Greece) and the oil percentage in the paste was determined according to Roussos et al. [39]. The oil samples were then stored in amber glass top-filled bottles at 4 ± 2 °C until analysis.

2.3. Olive Oil Analyses

The determination of olive oil free acidity, peroxide value, and ultraviolet absorption at 232 and 270 nm (K232, K270, respectively), as well as ΔK was conducted according to the European Official Methods of Analysis 2016/1784.

2.4. Determination of Total Phenols

Extraction of phenolic compounds and quantification was accomplished based on the methods described by Roussos et al. [39]. The results for total phenolic compounds were expressed as mg gallic acid equivalents (GAE), those for o-diphenols as mg caffeic acid equivalents (CAE), and those for total flavonoids as mg catechin equivalents (CtE) per kg of olive oil.

2.5. Antioxidant Capacity

The antioxidant capacity was determined in the same extract as that used for phenolic compounds based on the diphenyl picryl hydrazyl (DPPH) and ferric-reducing antioxidant power (FRAP) assays according to Roussos et al. [40], and expressed as μmol Trolox equivalents kg−1 of olive oil.

2.6. α-Tocopherol Determination

The concentration of α-tocopherol was evaluated based on the protocol by Roussos et al. [39].

2.7. Individual Phenolic Compounds Determination

Individual phenolic compounds were detected in the same phenolic extract produced during the extraction of total phenolic compounds, according to Roussos et al. [39]. Identification of twelve (12) phenolic constituents (hydroxytyrosol, tyrosol, 4-hydroxy benzoic acid (4HB), vanillic acid, caffeic acid, vanillin, p-coumaric acid, ferulic acid, oleacein, oleocanthal, luteolin, and apigenin) was achieved by comparing retention times and spectral data with commercial standards. These standards were purchased from Sigma-Aldrich (St. Louis, MO, USA), and final concentrations in the samples were reported as mg kg−1 of olive oil.

2.8. Fatty Acids Methyl Esters and Squalene Determination

The profile of fatty acid methyl esters (FAMEs) was analyzed following the methodology described by Roussos et al. [39]. The methyl esters identified included those of palmitic (C16:0), palmitoleic (C16:1), heptadecanoic (C17:0), heptadecenoic (C17:1), stearic (C18:0), oleic (C18:1), linoleic (C18:2), linolenic (C18:3), arachidic (C20:0), gadoleic (C20:1), eicosenoic (C20:1), behenic (C22:0) and lignoceric (C24:0) acids. FAMES were identified using the 37-component FAME mix of Supelco (Merck Group, St. Louis, MO, USA). Squalene was also determined under the same conditions (the area of its peak was not taken into account for the calculation of the total area of FAMES). Squalene concentration was quantified via a five-point calibration curve using analytical standards (Sigma-Aldrich, St. Louis, MO, USA) and reported as mg 100 g−1 of olive oil.

2.9. Volatile Compounds of Olive Oil

2.9.1. Headspace Solid-Phase Microextraction (SPME)

Volatile compounds were isolated according to the method applied by Mikrou et al. [41], with slight modifications. An aliquot (5 g) of olive oil sample was accurately weighed into a 20 mL glass vial and hermetically closed with a cup equipped with a 1.5 mm polytetrafluoroethylene (PTFE)/silicone septum. The vial was left for 30 min at 50 °C to allow equilibration of the volatile compounds in the headspace, with periodical light stirring. Then, the SPME fiber (Divinylbenzene [DVB]/Carboxen [CAR]/Polydimethylsiloxane [PDMS], 50/30 μm, length 2 cm; Sigma Aldrich, Darmstadt, Germany) was exposed to the headspace for 30 min to absorb the volatile compounds under the same conditions. Before use, the fiber was thermally conditioned and activated at 250 °C for 30 min.

2.9.2. Gas Chromatography–Mass Spectrometry

The absorbed volatiles were loaded in the injector of a GCMS QP-2020NX system connected to a Nexis GC-2030 (Shimadzu Inc., Kyoto, Japan) set at 250 °C, using a split ratio of 1:5 and a desorption time of 5 min. Subsequently, the volatiles were separated in a Mega 5-HT fused silica capillary column (30 m, I.D. 0.25 mm, film thickness 0.25 μm; MEGA S.r.l., Milan, Italy) using helium as the carrier gas. Its linear velocity was held constant (36.1 cm/s) during analysis. The oven temperature was set initially at 40 °C for 12 min, then increased to 120 °C at a rate of 5 °C min−1, held for 1 min, then increased to 160 °C at a rate of 3 °C min−1, held for 1 min, and finally increased to 250 °C at a rate of 15 °C min−1, where it stayed for another 1 min. The operation mode of the mass spectrometer was electron ionization (70 eV), using a scan range of 40–500 m/z. The temperature of the source and the interface were kept at 220 °C and 290 °C, respectively. Data acquisition was accomplished using the vendor’s software (GCMS Real Time Analysis module of LabSolutions ver.5.110, Shimadzu Inc., Kyoto, Japan), whereas the identification of the compounds was performed by the NIST 20 (ver. 2.2; NIST, Gaithersburg, MD, USA) and Wiley 7 libraries. The relative content of each compound was calculated by determining the ratio of the area to the sum of all known components.

2.10. Statistical Analysis

Both trials followed a completely randomized design with three replicates of two trees in each orchard (these two trees were the experimental unit), i.e., six trees per treatment (three experimental units) in each orchard. The raw data were analyzed using two-way ANOVA (with orchards and treatments as factors). However, as there were no significant effects of the orchards (results are presented in the Supplementary Material), the raw data from the two groves were analyzed together using one-way ANOVA and are presented in the text. The raw data of FAMEs and volatiles were analyzed by ANCOVA, with the maturity index serving as the covariate in order to assess any effect of the different maturation stages of the fruit on the measured variables. Significant differences among treatments were determined based on the Tukey’s HSD multiple range test at a = 0.05, after checking the normal distribution of the raw data using standard skewness and standard kurtosis, as well as homogeneity of variances. When necessary, suitable transformations of the raw data were performed in order to get normal distribution. Principal component analysis (PCA) was used to visualize the grouping of samples and reduce data dimensionality. Subsequently, factor analysis (FA) with Varimax rotation was applied to identify the underlying latent variables characterizing each treatment. Factor scores were calculated to map the samples in the reduced space, and factor loadings were used to identify the most influential variables for each factor. The statistical software JMP 13.0 (SAS Institute, Cary, NC, USA) and Statgraphics Centurion version XV (Statgraphics Technologies, Inc., The Plains, VA, USA) were used for the aforementioned analyses.

3. Results

The treatments did not exhibit any significant effect on yield or oil production as can be seen in Table 2, while fruits from the control were at a slightly more advanced stage than the fruits from the other two treatments, without any significant difference though. There was also no significant effect of the orchard or the interaction of treatments with the orchard where the trial took place (Table S1).
The oils produced from trees treated with the biostimulants were characterized by lower free acidity and peroxide value than the control, while no differences were detected regarding K232, K270 and ΔΚ values (Table 3). There was also no significant effect of the orchard or the interaction between treatments with the orchard where the trial took place (Table S2).
The total phenol concentration in the oil produced from trees treated with chitosan was higher than that determined in the oils from control treatment but did not present any significant difference from the oils produced under harpin influence (Table 4). Control oils presented higher o-diphenol concentration than oils from either harpin or chitosan treatments, while the exact opposite was observed regarding total flavonoids concentration. Similarly, oils derived from trees treated with the biostimulants presented higher antioxidant capacity (based on the FRAP assay) than the control, while harpin foliar spray induced a higher antioxidant capacity in the oils (based on the DPPH assay) compared to both chitosan and control treatments. Nonetheless, oils produced from chitosan-treated trees also exhibited higher antioxidant capacity (based on the DPPH assay) than the control. α-tocopherol concentration was higher in oils produced under the influence of harpin compared to the other two treatments. Oils produced in the first orchard were characterized by higher o-diphenol concentrations but lower α-tocopherol concentrations, while no other significant effects of the orchard or the interaction of treatments with the orchard were observed on the measured variables (Table S3).
Chitosan-treated trees produced oils with a high concentration of hydroxytyrosol (Table 5). Harpin-treated trees produced oils with the highest concentration of vanillic acid, while oils from control trees were characterized by a high oleocanthal concentration (higher than that of chitosan-treated trees). There was no significant effect of the orchard or the interaction of treatments with the orchard where the trial took place on the concentration of the individual phenolic compounds detected (Table S4).
Treatments had a significant effect on the fatty acid (determined as FAMEs) content of the oils produced (Table 6). Oils from control treatment presented a high content of C16:0 (higher than chitosan), C16:1 and C18:2 (higher than both harpin and chitosan), and a low content of C18:1 (lower than that found in the oils produced from trees treated with the biostimulants) (Table 5). Chitosan application resulted in the lowest content of C17:1 and C18:3, but the highest content of C18:1 (compared to the control). There was no significant effect of the orchard or the interaction of treatments with the orchard where the trial took place on the content of the FAMEs detected (Table S5).
Chitosan-derived oils presented the highest UFAs content and MUFAs/PUFAs ratio (though similar to harpin) and the lowest SFAs content and SFAs/UFAs ratio (Table 7). On the other hand, oils from control trees presented the highest PUFAs and the lowest MUFAs content along with the lowest MUFAs/PUFAs and C18:1/C18:2 ratios. The maturity index of the fruit seemed to have an effect on the content of C22:0. Squalene was determined in high concentration in the oils produced from trees treated with the biostimulants, with significant difference compared to oils from the control treatment. There was no significant effect of the orchard or the interaction of treatments with the orchard where the trial took place on the content of the different groups of FAMEs detected (Table S6).
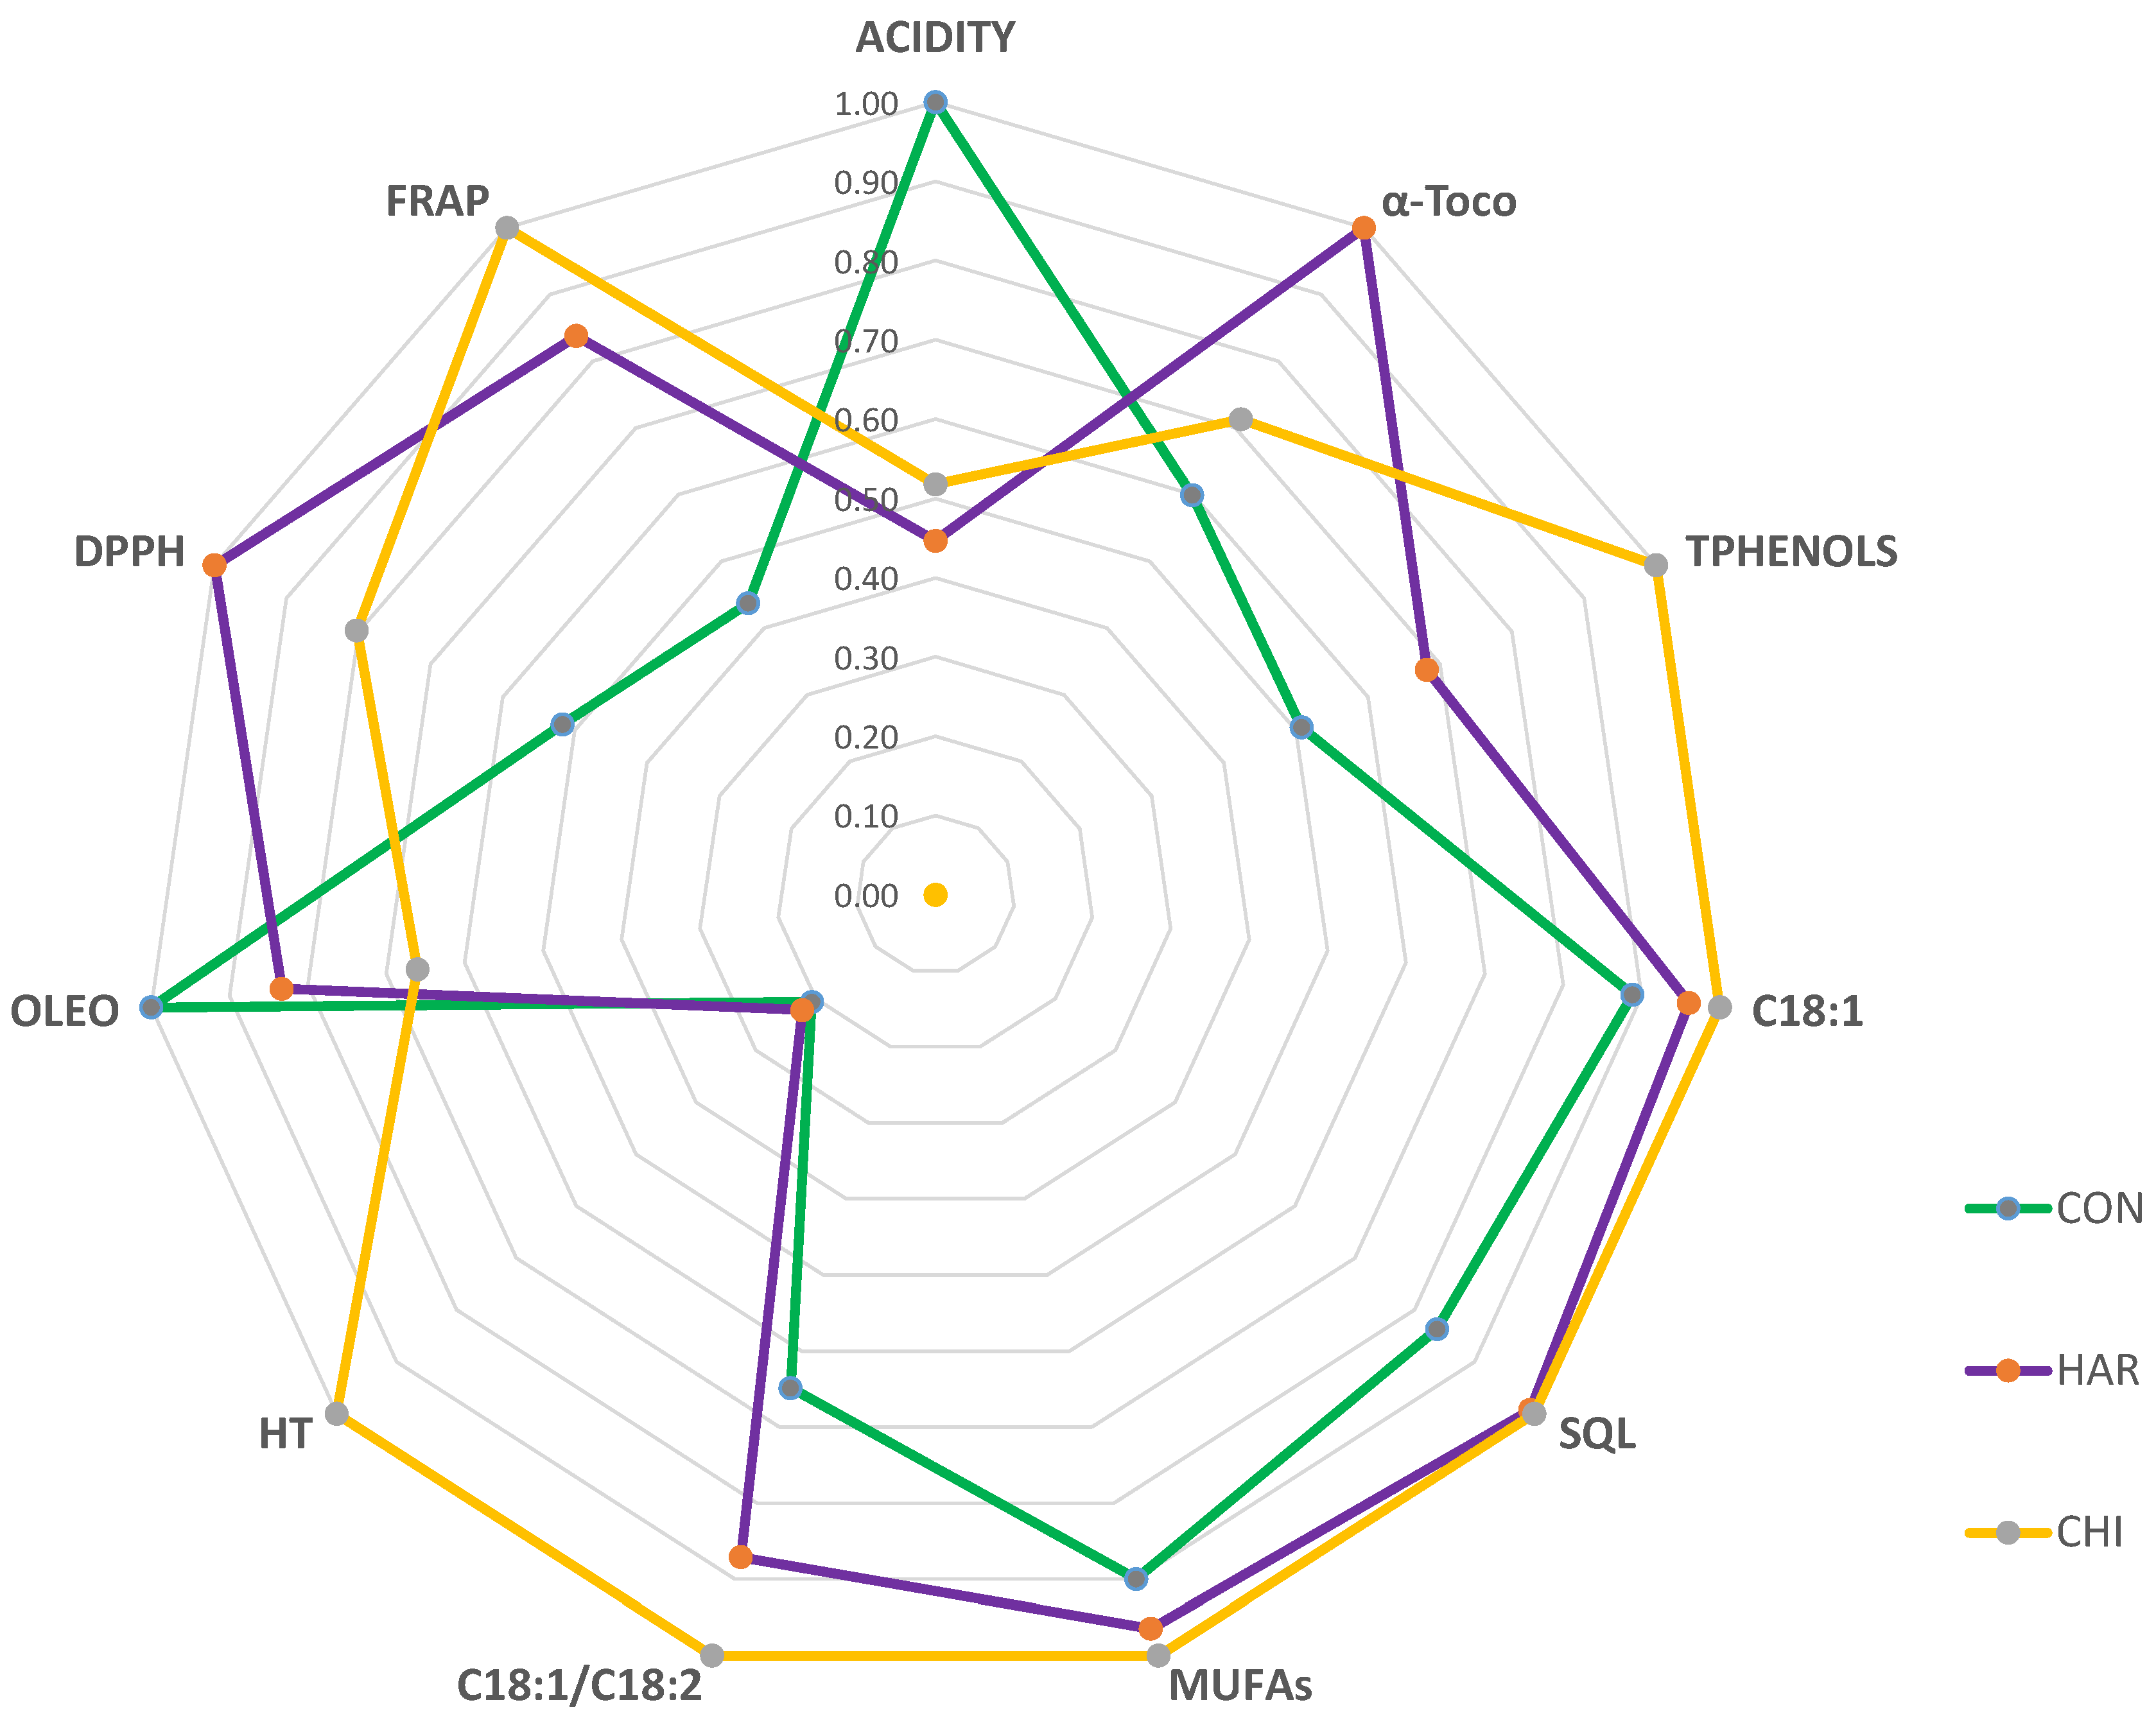
The spider chart of the main quality and nutraceutical characteristics of olive oil summarizes the main effects of treatments on critical olive oil attributes for the human health (Figure 1). Free acidity and oleocanthal concentration were higher under the control treatment, total phenols, hydroxytyrosol and FRAP values were higher under chitosan treatment, while DPPH values and α-tocopherol concentration were higher under harpin treatment. Both biostimulants enhanced the content of oleic acid (C18:1) and MUFAs, as well as the concentration of squalene and the ratio of C18:1/C18:2.
The treatments had a significant impact on some of the volatiles detected (Table 8). Oils produced from trees treated with harpin presented lower ethanol content than those from chitosan-treated trees. Oils produced from trees treated with the elicitors presented lower content of isoamyl alcohol and (E)-hept-2-enal than control oils, while those produced from chitosan-treated trees presented lower hexanal and n-hexanol content than control oils. On the other hand, oils from control trees exhibited lower (Z)-3-hexenal content than the oils produced under the effect of the elicitors and lower trans-2-hexenal content than the oils produced under the influence of harpin. The fruit maturity stage had a significant effect on the contents of isoamyl alcohol and hexanal. The content of α-copaene was the only volatile significantly affected by both the orchard site and its interaction with the treatments employed (Tables S7 and S8), with higher content detected in oils produced from the first orchard, especially under the influence of harpin.
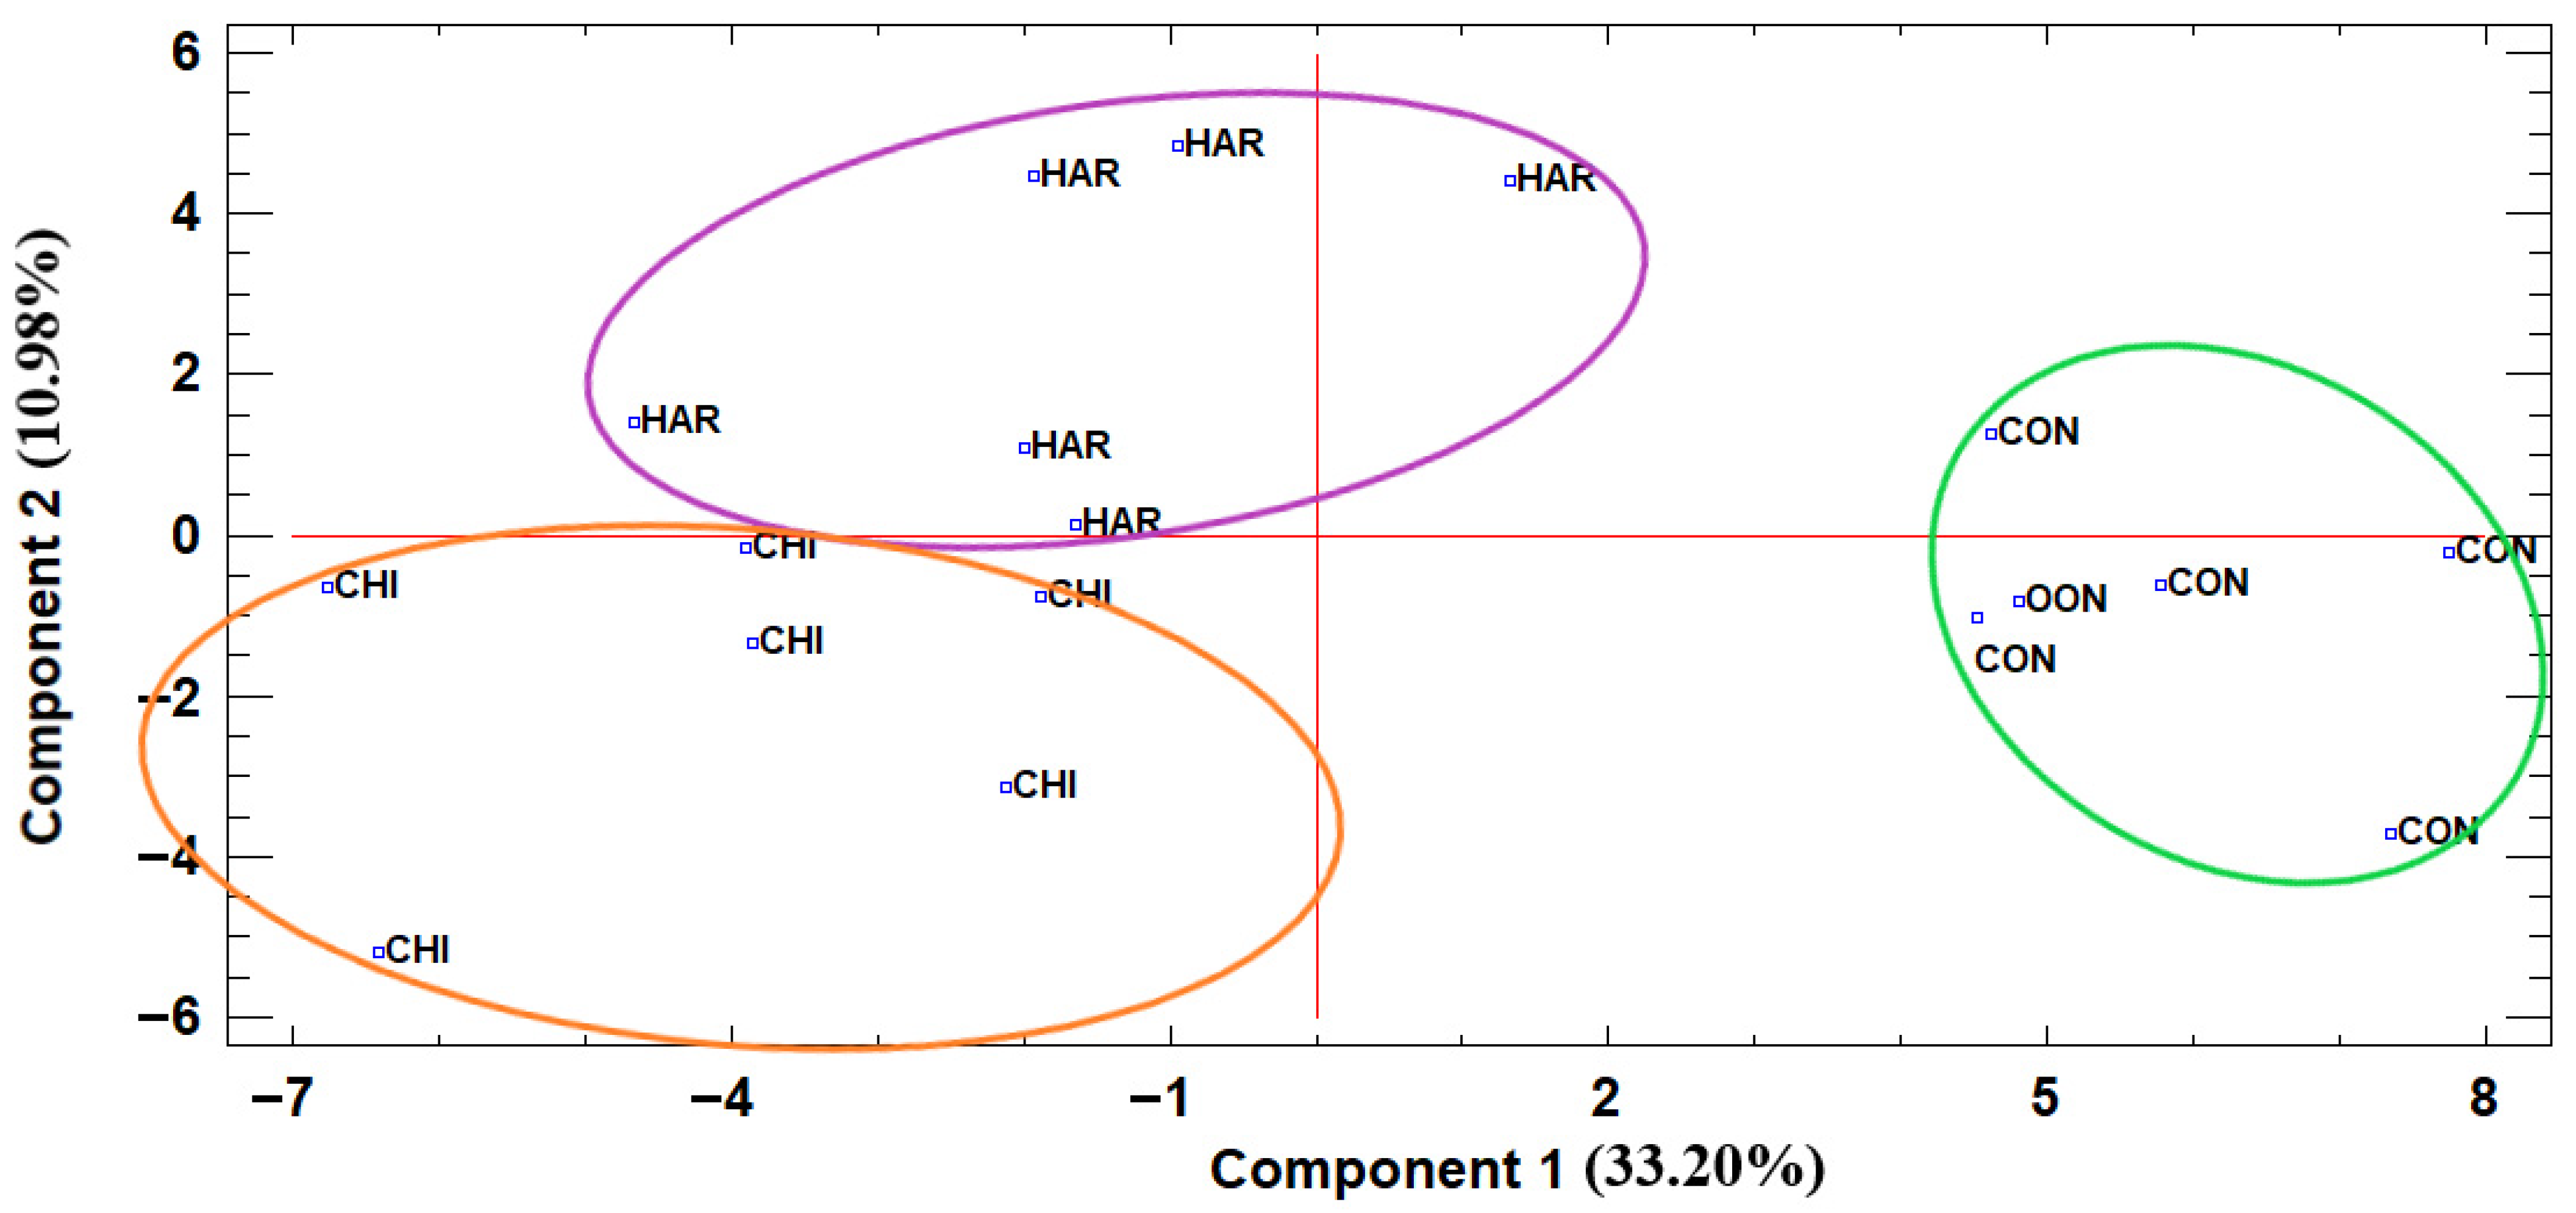
The PCA analysis revealed significant differences between the control and elicitors, even though the cumulative variance explained by the first two components was relatively low (close to 44%) (Figure 2). The control was located on the positive side of PC1 (explaining 33% of the total variance), while chitosan was located on its negative side. The majority of HAR samples were distributed along the negative side of PC1; however, they were primarily characterized by strong positive scores on PC2, exactly the opposite of CHI samples, which were located on the negative side of PC2, showing distinct differences from HAR. Based on the location of control treatments on the PCA scatterplot and the table of component weights (Table S9), the oils produced were characterized by high acidity, ΔK index, olive oil percentage per fruit, as well as high content of C16:0, C16:1, C18:2, SFAs, PUFAs and the SFAs/UFAs ratio, along with high isoamyl alcohol, hexanal and (E)-hept-2-enal content. On the other hand, oils derived from trees treated with CHI were characterized by high ΔK index, olive oil percentage per fruit, C18:1, MUFAs, and UFAs, as well as MUFAs/PUFAs and C18:1/C18:2 ratios, together with high hydroxytyrosol concentration, ethanol and (Z)-3-hexenal content. Samples from HAR-treated trees were characterized by high α-tocopherol concentration, high antioxidant capacity (based on the DPPH assay), high contents of C17:1, C18:3 and C22:0, as well as high 4HB, vanillic, and ferulic concentration, and high 2-hexen-1-ol content.
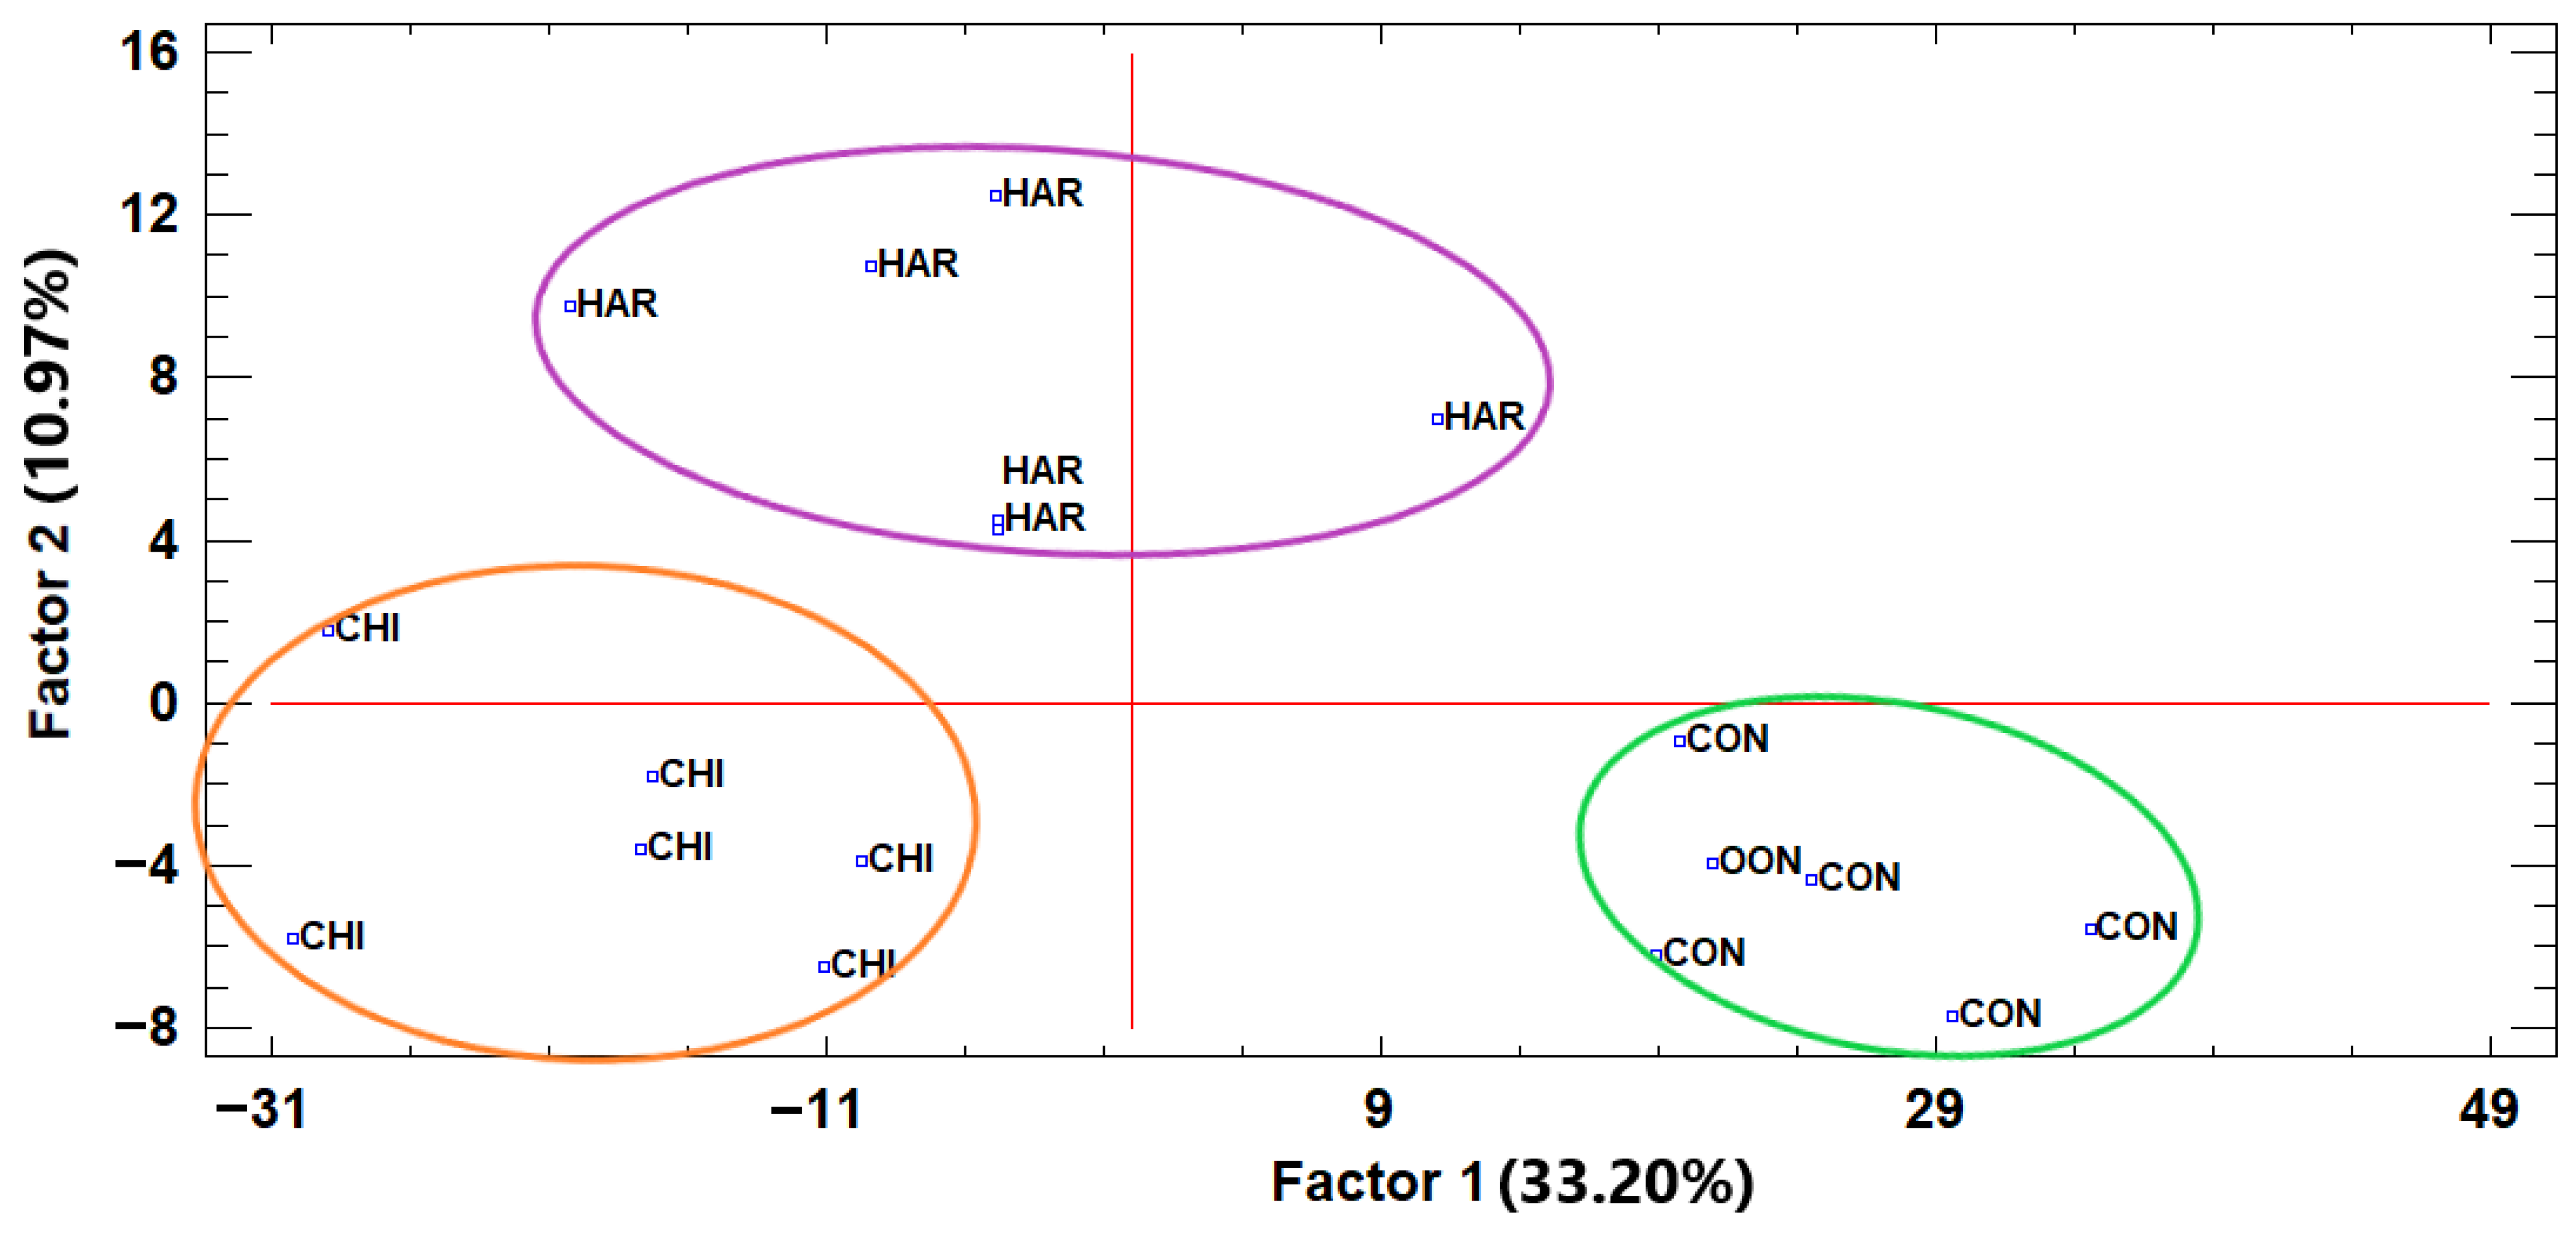
Factor analysis provided further separation of the treatments, discriminating the elicitors from the control (Figure 3). For the interpretation of the factor analysis, a loading threshold of >0.60 was applied to identify the most significant variables contributing to each factor (Table S10). The control was located on the positive side of factor 1 (explaining 33% of the variance) and chitosan on its negative side, while harpin was located on the positive side of factor 2 (explaining an 11% of the variance) and the control on its negative side. Based on the loadings of each factor, it became evident that samples from control treatment were characterized by high acidity, o-diphenol concentration, C16:0, C16:1, C17:1, C18:2, SFAs and PUFAs, as well as high isoamyl alcohol, high hexanal, high n-hexanol and high (E)-hept-2-enal content, while showing low (Z)-3-hexenal, UFAs, MUFAs and C18:1 content, and low squalene concentration. The exact opposite stood for samples from chitosan-treated trees. Similarly, harpin-treated trees produced oils with a high C18:3 content, high vanillic acid concentration and high 2-hexen-1-ol content, along with low ethanol content, opposite to that of the control.

4. Discussion

Both the PCA and factor analysis clearly separated control treatment from the biostimulants, indicating a significant effect of the applied elicitors on the measured variables.
Neither chitosan nor harpin had a significant effect on olive yield and oil production. This is in contrast to many research works where these two elicitors have increased the production of various crops [18,19,21,22,23,42]. Nonetheless, there are some reports where no significant increase in yield or crop maturity has been reported [17,25,43]. These discrepancies may be attributed to the different species employed in each research, the different pedoclimatic conditions, and the different cultivars [29,35]. Generally, the positive effect of these elicitors on yield components is attributed to increased photosynthesis and reduced transpiration, as well as increased water and nutrient uptake and enhancement of the antioxidant defense mechanism of plants under harsh conditions [24,27,34,36,44,45]. In the present trial, the olive trees were grown under rainfed conditions, when, in summer temperature and vapor pressure deficit rise and induce severe stress in all plants. The absence of any positive effect of the two elicitors on either yield or oil production could be attributed to the nature of the species, as olive is a perennial woody species well adapted to the xerothermic conditions of Greece. Furthermore, the majority of research involving these elicitors have been done on annual crops, and very few reports exist on their effect on perennial tree species. Chitosan has been tested in olive trees with varying results, as it has been found to increase fruit production in ‘Picual’ and ‘Arbosana’ cultivars [19,46], while not having a significant effect in the ‘Aggizi’ cultivar [17]. Most of these studies; however, were conducted using laboratory-made chitosan products and not a commercially available one as in the present trial, which may affect the efficacy of the final product.
On the other hand, both elicitors enhanced oil properties by reducing free acidity and peroxide value, which are significant characteristics of extra virgin olive oil. Similar results have also been reported in olive trees after the application of chitosan [19]. Even though there are no reports on how it may work on oil acidity, chitosan seems to be able to inhibit lipase activity [47] and therefore, through this reduction could have preserved low levels of oil acidity. The significant reduction in acidity and peroxide values in treated samples suggests that harpin and chitosan acted as physiological primers, enhancing the trees’ resilience to harsh environmental conditions such as limited water supply, high irradiance and heat. By strengthening cellular membranes and upregulating the endogenous antioxidant system, these biostimulants may have prevented premature enzymatic hydrolysis and lipid oxidation typically induced by abiotic stress, resulting in a chemically superior olive oil. With global temperatures projected to increase by 1.5 °C—and even higher in the Mediterranean Basin—alongside increasingly erratic rainfall patterns [48], these elicitors emerge as indispensable tools in the modern grower’s arsenal.
The effects of the elicitors on the total phenol and total flavonoid content of the oils produced, as well as on their antioxidant capacity further corroborate this. Similar increases in total phenolic compounds have been reported in a number of species [23,25,27]. At least for chitosan, it is reported that, along with zinc application, it enhances the activity of PAL or induces genes encoding PAL [24], a key enzyme for the production of phenolic compounds, thereby justifying the enhanced total phenols concentration found under chitosan application [25,34,49]. Similarly, harpin has been found to induce SAR pathway through enhanced PAL activity [25,50], as well as the activity of a plethora of antioxidant enzymes [33,37]. It seems that the elicitors did their job, i.e., to trigger the defensive arsenal of the plant and to prepare it for harsh climatic conditions [17,27,32]. It is known that they can enhance the antioxidant defense system, thereby reducing possible ROS generation and function [26,45], protecting the quality of the product and enhancing plant growth, development and physiological functions [17,19,29]. The enhanced phenolic compound concentration in oils produced under the effect of elicitors could also be the result of lower fruit water content [17]. This could have resulted in reduced phenolic compound leaching during the malaxation process of the olive paste, with fewer phenolic compounds transferred into the water phase of the paste [51,52], as most phenolic compounds are water-soluble.
Even though the effect of the elicitors on total phenol concentration and antioxidant capacity of the oils was evident, their effect on individual olive oil phenolics was not so clear. In most cases, there was no significant effect, as chitosan significantly increased hydroxytyrosol and reduced oleocanthal concentration, while harpin application resulted in increased vanillic acid concentration. Similar results have been reported by [34], who found that only chlorogenic acid concentration was significantly increased after harpin application in lettuce. In another study, harpin induced the expression of stilbene synthase (StSy), an enzyme that catalyzes the production of the phenolic compound resveratrol in Vitis cells [53], showing that the triggering effect of elicitors may be more specific to certain phenolic compounds. Under all treatments, however, the level of total phenolic compounds was lower than that issued for health claim (EU legislation 432/2012, with the limit being 250 mg equivalents hydroxytyrosol kg−1 olive oil—although not directly comparable with the one measured here as GAE). This could be due to the advanced maturity stage of the fruits. Nonetheless, the elicitors, even under such conditions, enhanced the concentration of total phenolic compounds, proving their efficacy in elevating oil quality.
Significant effects, on the other hand, were detected regarding the FAMEs of the oils produced. Both elicitors had a significant positive effect on the profile of FAMEs, as was clearly demonstrated by both PCA and factor analyses. The elicitors reduced the content of PUFAs and increased the content of MUFAs, with a significant increase detected regarding oleic acid (C18:1) content. Oleic acid is the predominant fatty acid in olive oil and, along with phenolic compounds, is an important health protector [54,55], with its content in extra virgin olive oils ranging between 55 and 83% (EU legislation 2568/1991). Primarily chitosan and, secondly, harpin increased oleic acid content compared to the control, which exhibited oleic acid content near the lower limit, i.e., 56.44%. Harpin and chitosan may act by upregulating the activity of stearoyl-ACP desaturases or by reducing the activity of fatty acid desaturase 2 (FAD2), enzymes responsible for the synthesis of oleic acid from stearic acid and its metabolism to linoleic acid, respectively [56]. In the present trial, there was no difference among treatments concerning C18:0 content, but there was one concerning C18:2 content, where both harpin- and chitosan-derived oils presented lower values. This may indicate that the elicitors could have suppressed FAD2 activity, thus preserving high levels of C18:1. Interestingly, it has been reported that ABA has a central role in lipid biosynthesis in olive fruit, as its biosynthesis and signaling genes were co-expressed with modules of MUFA and PUFA biosynthesis [56]. At the same time, it is known that chitosan enhances the concentration of ABA in plants [25,27,28], as well as harpin [37,57]. Taking all these into account, the increase in MUFAs (a hallmark of premium quality and high oxidative stability in virgin olive oils, with oleic acid being the primary monounsaturated fatty acid) could be partly attributed to the increase in ABA concentration after the application of these elicitors. Thus, the elicitors may have increased oleic acid content directly by suppressing its metabolism or indirectly through the activity of ABA on lipid biosynthesis, an assumption that surely merits further investigation.
Squalene concentration was significantly higher in oils produced under the influence of the elicitors. According to some researchers, squalene concentration diminishes significantly under heat and drought stress in olive fruits [58]. Since both chitosan and harpin are elicitors promoting plant resilience against stress factors, it is safe to assume that their actions as alleviating agents resulted in higher squalene levels in the oils produced.
The volatile profile of the oils produced in this experiment adds further information on the way the elicitors work on olive trees growing under rainfed conditions in Greece, where the summer months are characterized by high temperatures and extremely low rainfall, even though their expression as relative percentages produces limits on a solid interpretation.
The most distinctive quality improvement was observed in the volatile profile, governed by the lipoxygenase (LOX) pathway, with C5 and C6 LOX compounds being the major contributors [59,60]. While oils produced from control trees showed signs of degradation (higher levels of hexanal, (E)-hept-2-enal and fermentation-related alcohols such as ethanol and isoamyl alcohol) [60,61,62,63], biostimulant treatments directed metabolism towards the synthesis of “premium” green volatiles. It should be noted that the content of these volatiles could also be the result of the slightly advanced maturity stage of the fruits from the control trees. Hexanal usually increases as fruit ripens [64,65], and this could be the case here, as fruits from control treatments were slightly more mature than the ones from elicitor-treated trees (even though there was no significant difference concerning the maturity index), and the maturity index seemed to influence its content, as well as that of isoamyl alcohol. This also stands for ethanol, which is found at higher levels in oils from mature olive fruits [60,61]. The slightly more ripened control olive fruits could also indicate that the intense summer conditions triggered oxidative bursts and forced ripening, leading to membrane leakage and thus inferior oil quality [60], compared to elicitors that probably alleviated any summer stress. Furthermore, the simultaneous presence of higher linoleic acid (C18:2) and hexanal levels in control oils compared to biostimulant treatments indicates greater susceptibility to lipid oxidation. While hexanal is a product of the LOX pathway, its accumulation in the control—concomitant with lower antioxidant markers (i.e., total phenolic compounds and antioxidant capacity)—suggests that it serves as a marker of secondary oxidation rather than of desirable aroma. According to Carrapiso et al. [60], hexanal, besides being generated via the LOX pathway, can also be generated through the oxidation of linoleic acid, giving a rancid note to the oil at high concentrations. Conversely, harpin and chitosan treatments successfully diverted lipid metabolism towards a more stable profile (higher C18:1/C18:2 ratio), effectively suppressing oxidative degradation that leads to hexanal formation.
Moreover, harpin may have acted as a potent activator of the later stages of the LOX pathway [59]. The strong association with 2-hexen-1-ol (an alcohol) and the moderate association with trans-2-hexenal (an aldehyde) (based on the loadings of Factor 2 of the factor analysis) may be related to the upregulation of alcohol dehydrogenase (ADH) and hydroperoxide lyase (HPL), as suggested by other researchers [59]. This may have resulted in an oil with sophisticated floral and fruity notes, characterized by high aromatic complexity, as 2-hexen-1-ol produces a banana, leaf-like or green-fruit odor, and trans-2-hexenal a green, fruity to sweet odor [59,62]. Chitosan, on the other hand, enhanced “green freshness” by significantly boosting cis-3-hexenal content (green, leaf-like, fresh-cut grass aroma) [60,64].

5. Conclusions

The integration of biostimulants into olive grove management seems to improve several oil quality attributes without reducing yield. Even though these results are based on one year of experimentation in two olive groves, it seems that the elicitors are able to secure olive fruit productivity under harsh conditions and induce at the same time the production of extra virgin olive oils with desirable sensory and health-promoting characteristics. Harpin stands out for achieving maximum aromatic complexity and higher α-tocopherol and squalene concentrations, while chitosan enhances the oxidative stability of the oil by increasing the total phenol concentration and the monounsaturated fatty acid profile, giving, at the same time a “green freshness” aroma to the produced olive oil. These results demonstrate that elicitation is a powerful tool for producing high-quality extra virgin olive oil in challenging environmental conditions, steering fruit metabolism toward a premium nutraceutical and sensory profile. Having that in mind, these two elicitors could become the first line of defense in the future, where the projections speak of a 1.5 °C increase in mean temperature in the middle of the century and erratic rainfall.

Supplementary Materials

The following supporting information can be downloaded at: https://www.mdpi.com/article/10.3390/agronomy16080788/s1.

Author Contributions

Conceptualization, P.A.R.; methodology, P.A.R. and A.-G.K.; software, P.A.R. and A.-G.K.; validation, P.A.R. and A.-G.K.; formal analysis, A.-G.K., G.R., S.K. and A.M.; investigation, A.-G.K., G.R., S.K. and A.M.; resources, P.A.R.; data curation, P.A.R. and A.-G.K.; writing—original draft preparation, P.A.R.; writing—review and editing, P.A.R., M.Z. and A.-G.K.; visualization, P.A.R. and M.Z.; supervision, P.A.R. and A.-G.K.; project administration, P.A.R. and A.-G.K.; funding acquisition, P.A.R. All authors have read and agreed to the published version of the manuscript.

Funding

This research received no external funding.

Data Availability Statement

The original contributions presented in this study are included in the article. Further inquiries can be directed to the corresponding author.

Conflicts of Interest

The authors declare no conflicts of interest.

References

  1. Kaniewski, D.; Marriner, N.; Terral, J.-F.; Besnard, G.; Tsitsou, L.; Topsakal, J.; Morhange, C.; Otto, T.; Luce, F.; Cheddadi, R. Olive production in the 21st century will be threatened by water stress and declining solar activity. Commun. Earth Environ. 2025, 6, 268. [Google Scholar] [CrossRef]
  2. Arenas-Castro, S.; Gonçalves, J.F.; Moreno, M.; Villar, R. Projected climate changes are expected to decrease the suitability and production of olive varieties in southern Spain. Sci. Total Environ. 2020, 709, 136161. [Google Scholar] [CrossRef] [PubMed]
  3. Leal Filho, W.; Luetz, J.M.; Dinis, M.A.P.; Nagy, G.J. Dinner is served: How climate change interferes with olive oil production. Sustain. Sci. 2026, 21, 417–426. [Google Scholar] [CrossRef]
  4. Villalobos, F.J.; López-Bernal, Á.; García-Tejera, O.; Testi, L. Is olive crop modelling ready to assess the impacts of global change? Front. Plant Sci. 2023, 14, 1249793. [Google Scholar] [CrossRef]
  5. Martins, S.; Pereira, S.; Dinis, L.-T.; Brito, C. Enhancing Olive Cultivation Resilience: Sustainable Long-Term and Short-Term Adaptation Strategies to Alleviate Climate Change Impacts. Horticulturae 2024, 10, 1066. [Google Scholar] [CrossRef]
  6. Cabezas, J.M.; Ruiz-Ramos, M.; Soriano, M.A.; Santos, C.; Gabaldón-Leal, C.; Lorite, I.J. Impact of climate change on economic components of Mediterranean olive orchards. Agric. Water Manag. 2021, 248, 106760. [Google Scholar] [CrossRef]
  7. Mairech, H.; López-Bernal, Á.; Moriondo, M.; Dibari, C.; Regni, L.; Proietti, P.; Villalobos, F.J.; Testi, L. Sustainability of olive growing in the Mediterranean area under future climate scenarios: Exploring the effects of intensification and deficit irrigation. Eur. J. Agron. 2021, 129, 126319. [Google Scholar] [CrossRef]
  8. Koutroulis, A.; Daliakopoulos, I.; Grillakis, M. Climate Change Impacts on Olive Oil Production in Greece: Challenges and Pathways to Resilience. In Proceedings of the EGU General Assembly Conference Abstracts, Vienna, Austria, 1 April 2025; p. EGU25-12096. [Google Scholar]
  9. Özdel, M.M.; Ustaoğlu, B.; Cürebal, İ. Modeling of the Potential Distribution Areas Suitable for Olive (Olea europaea L.) in Türkiye from a Climate Change Perspective. Agriculture 2024, 14, 1629. [Google Scholar] [CrossRef]
  10. Giorgi, F. Climate change hot-spots. Geophys. Res. Lett. 2006, 33, 101029. [Google Scholar] [CrossRef]
  11. Ronchail, J.; Cohen, M.; Alonso-Roldán, M.; Garcin, H.; Sultan, B.; Angles, S. Adaptability of Mediterranean Agricultural Systems to Climate Change: The Example of the Sierra Mágina Olive-Growing Region (Andalusia, Spain). Part II: The Future. Weather Clim. Soc. 2014, 6, 451–467. [Google Scholar] [CrossRef]
  12. Tanasijevic, L.; Todorovic, M.; Pereira, L.S.; Pizzigalli, C.; Lionello, P. Impacts of climate change on olive crop evapotranspiration and irrigation requirements in the Mediterranean region. Agric. Water Manag. 2014, 144, 54–68. [Google Scholar] [CrossRef]
  13. Dias, M.C.; Araújo, M.; Silva, S.; Santos, C. Sustainable Olive Culture under Climate Change: The Potential of Biostimulants. Horticulturae 2022, 8, 1048. [Google Scholar] [CrossRef]
  14. Yildiz, H.; Sirli, B.; Doğan, D.; Aydoğdu, M. Impact of climate change on olive suitability areas. Soil Stud. 2024, 13, 88–95. [Google Scholar] [CrossRef]
  15. Fraga, H.; Pinto, J.G.; Viola, F.; Santos, J.A. Climate change projections for olive yields in the Mediterranean Basin. Int. J. Climatol. 2020, 40, 769–781. [Google Scholar] [CrossRef]
  16. Fraga, H.; Moriondo, M.; Leolini, L.; Santos, J.A. Mediterranean Olive Orchards under Climate Change: A Review of Future Impacts and Adaptation Strategies. Agronomy 2021, 11, 56. [Google Scholar] [CrossRef]
  17. El-Bolok, T.K.; Kasem, M. Effect of Foliar application with Chitosan and amino acids on growth, flowering, yield and Fruit Quality of Aggizi Olive Trees under Qena Governorate conditions. Hortic. Res. J. 2023, 1, 52. [Google Scholar] [CrossRef]
  18. Algohary, A.; Zewail, R. Response of Olive Trees Irrigated with Sewage Water to Foliar Spray with Salicylic Acid, Chitosan and Algae Extract. Ann. Agric. Sci. Moshtohor 2024, 62, 13–20. [Google Scholar] [CrossRef]
  19. Kasem, M.; Fawzy, H. Effect of spraying chitosan on productivity of picual olive trees. Egypt. J. Appl. Sci. 2020, 35, 1–15. [Google Scholar] [CrossRef]
  20. Chuang, H.-W.; Harnrak, A.; Chen, Y.-C.; Hsu, C.-M. A harpin-induced ethylene-responsive factor regulates plant growth and responses to biotic and abiotic stresses. Biochem. Biophys. Res. Commun. 2010, 402, 414–420. [Google Scholar] [CrossRef]
  21. Mondal, M.; Puteh, A.; Dafader, N.; Rafii, M.; Malek, M. Foliar application of chitosan improves growth and yield in maize. J. Food Agric. Environ. 2013, 11, 520–523. [Google Scholar]
  22. Mondal, M.; Malek, M.; Puteh, A.; Ismail, M.; Ashrafuzzaman, M.; Naher, L. Effect of foliar application of chitosan on growth and yield in okra. Aust. J. Crop Sci. 2012, 6, 918–921. [Google Scholar]
  23. Reyes-Pérez, J.J.; Llerena-Ramos, L.T.; Tezara, W.; Reynel, V.; Hernández-Montiel, L.G.; Juárez-Maldonado, A. Chitosan Application Improves the Growth and Physiological Parameters of Tomato Crops. Horticulturae 2025, 11, 878. [Google Scholar] [CrossRef]
  24. Bittelli, M.; Flury, M.; Campbell, G.S.; Nichols, E.J. Reduction of transpiration through foliar application of chitosan. Agric. For. Meteorol. 2001, 107, 167–175. [Google Scholar] [CrossRef]
  25. Hanafy Ahmed, A.; Nesiem, M.; Hesham, A.; Amira, F. Effect of pre-harvest chitosan foliar application on growth, yield and chemical composition of Washington navel orange trees grown in two different regions. Afr. J. Biochem. Res. 2016, 10, 59–69. [Google Scholar] [CrossRef]
  26. El Amerany, F.; Meddich, A.; Wahbi, S.; Porzel, A.; Taourirte, M.; Rhazi, M.; Hause, B. Foliar Application of Chitosan Increases Tomato Growth and Influences Mycorrhization and Expression of Endochitinase-Encoding Genes. Int. J. Mol. Sci. 2020, 21, 535. [Google Scholar] [CrossRef]
  27. Malerba, M.; Cerana, R. Chitosan Effects on Plant Systems. Int. J. Mol. Sci. 2016, 17, 996. [Google Scholar] [CrossRef]
  28. Iriti, M.; Picchi, V.; Rossoni, M.; Gomarasca, S.; Ludwig, N.; Gargano, M.; Faoro, F. Chitosan antitranspirant activity is due to abscisic acid-dependent stomatal closure. Environ. Exp. Bot. 2009, 66, 493–500. [Google Scholar] [CrossRef]
  29. Akbudak, N.; Akbudak, B.; Seniz, V. Foliar applied harpin effects on fruit quality of peppers. Acta Agric. Scand. Sect. B Soil Plant Sci. 2007, 57, 82–86. [Google Scholar] [CrossRef]
  30. Li, M.; Wang, Y.; Dong, Y. Pre-harvest application of harpin β protein improves fruit on-tree and storage quality attributes of ‘Lapins’ and ‘Regina’ sweet cherry (Prunus avium L.). Sci. Hortic. 2020, 263, 109115. [Google Scholar] [CrossRef]
  31. Saour, G.; Ismail, H.; Hashem, A. Impact of kaolin particle film, spirodiclofen acaricide, harpin protein, and an organic biostimulant on pear psylla Cacopsylla pyri (Hemiptera: Psyllidae). Int. J. Pest Manag. 2010, 56, 75–79. [Google Scholar] [CrossRef]
  32. Akbudak, N. The Effects of Harpin on Fruiting and Botrytis cinerea Resistance of Three Pepper Cultivars. Biol. Agric. Hortic. 2009, 26, 391–398. [Google Scholar] [CrossRef]
  33. Chuang, H.-W.; Chang, P.-Y.; Syu, Y.-Y. Harpin Protein, an Elicitor of Disease Resistance, Acts as a Growth Promoter in Phalaenopsis Orchids. J. Plant Growth Regul. 2014, 33, 788–797. [Google Scholar] [CrossRef]
  34. Rodrigo-Garcia, J.; Navarrete-Laborde, B.; Rosa, L.; Alvarez-Parrilla, E.; Núñez-Gastélum, J.A. Effect of Harpin protein as an elicitor on the content of phenolic compounds and antioxidant capacity in two hydroponically grown lettuce (Lactuca sativa L.) varieties. Food Sci. Technol. 2018, 39, 72–77. [Google Scholar] [CrossRef]
  35. Fallahi, E. Harpin Protein Influence on Fruit Quality Attributes, Ethylene, Respiration, and Minerals in Apples. Am. J. Plant Sci. 2021, 12, 1236–1245. [Google Scholar] [CrossRef]
  36. Zhang, C.; Qian, J.; Bao, Z.; Hong, X.; Dong, H. The Induction of Abscisic-Acid-Mediated Drought Tolerance is Independent of Ethylene Signaling in Arabidopsis Plants Responding to a Harpin Protein. Plant Mol. Biol. Report. 2007, 25, 98–114. [Google Scholar] [CrossRef]
  37. Zhang, L.; Xiao, S.; Li, W.; Feng, W.; Li, J.; Wu, Z.; Gao, X.; Liu, F.; Shao, M. Overexpression of a Harpin-encoding gene hrf1 in rice enhances drought tolerance. J. Exp. Bot. 2011, 62, 4229–4238. [Google Scholar] [CrossRef]
  38. Karyda, A.-G.; Roussos, P.A. Influence of the Invasive Species Ailanthus altissima (Tree of Heaven) on Yield Performance and Olive Oil Quality Parameters of Young Olive Trees cv. Koroneiki Under Two Distinct Irrigation Regimes. Appl. Sci. 2025, 15, 7678. [Google Scholar] [CrossRef]
  39. Roussos, P.A.; Karyda, A.-G.; Kapasouris, P.; Kosmadaki, P.G.; Kotsi, C.; Zoti, M. Efficacy Evaluation of Different Mineral Clay Particles on Olive Production Traits and Olive Oil Quality of ‘Koroneiki’ Olive Cultivar Under Rainfed and Irrigated Conditions in Southern Greece. Horticulturae 2025, 11, 579. [Google Scholar] [CrossRef]
  40. Roussos, P.A.; Karabi, A.; Anastasiou, L.; Assimakopoulou, A.; Gasparatos, D. Apricot Tree Nutrient Uptake, Fruit Quality and Phytochemical Attributes, and Soil Fertility under Organic and Integrated Management. Appl. Sci. 2023, 13, 2596. [Google Scholar] [CrossRef]
  41. Mikrou, T.; Litsa, M.; Papantoni, A.; Kapsokefalou, M.; Gardeli, C.; Mallouchos, A. Effect of Cultivar and Geographical Origin on the Volatile Composition of Greek Monovarietal Extra Virgin Olive Oils. Chemosensors 2023, 11, 80. [Google Scholar] [CrossRef]
  42. Díaz-Pérez, J.C. Bell pepper plant growth, gas exchange, mineral nutrition, phytophtora blight, fruit yield, and postharvest fruit decay as affected by Harpin protein. Commun. Soil Sci. Plant Anal. 2008, 39, 2861–2872. [Google Scholar] [CrossRef]
  43. Bednarz, C.W.; Brown, S.N.; Flanders, J.T.; Tankersley, T.B.; Brown, S.M. Effects of foliar applied harpin protein on cotton lint yield, fiber quality, and crop maturity. Commun. Soil Sci. Plant Anal. 2002, 33, 933–945. [Google Scholar] [CrossRef]
  44. Kazimi, R.; Saxena, D. Significance of chitosan foliar spraying on the growth and yield of vegetable crop under protected cultivation: A review. Plant Sci. Today 2023, 10, 140–148. [Google Scholar] [CrossRef]
  45. El-Miniawy, S.M.; Ragab, M.E.; Youssef, S.; Metwally, A. Response of Strawberry Plants to Foliar Spraying of Chitosan. Res. J. Agric. Biol. Sci. 2013, 9, 366–372. [Google Scholar]
  46. Alshallash, K.; Elnaggar, I.; Abd El-Wahed, A.; Fahmy, A.; Tawfeeq, A.; Hammad, E.; Almashad, A.; Elmezien, A.; Hamdy, A.; Taha, I. Using chitosan nanoparticles and N-acetyl thiazolidine 4-carboxylic acid for olive trees efficiency raising, improving fruits properties and oil quality. Braz. J. Biol. 2023, 83, e273643. [Google Scholar]
  47. Ostanina, E.; Varlamov, V.; Yakovlev, G. Inhibition of lipase activity by low-molecular-weight chitosan. Appl. Biochem. Microbiol. 2007, 43, 655–660. [Google Scholar] [CrossRef]
  48. Roussos, P.A. Climate Change Challenges in Temperate and Sub-Tropical Fruit Tree Cultivation. Encyclopedia 2024, 4, 558–582. [Google Scholar] [CrossRef]
  49. Salimi, A.; Oraghi Ardebili, Z.; Salehibakhsh, M. Potential benefits of foliar application of chitosan and Zinc in tomato. Iran. J. Plant Physiol. 2019, 9, 2703–2708. [Google Scholar]
  50. Kongala, S.I.; Nadendla, S.R.; Mamidala, P. Internalization and induction of defense responses in tobacco by harpinPss conjugated gold nanoparticles as a foliar spray. Colloid Interface Sci. Commun. 2021, 43, 100438. [Google Scholar] [CrossRef]
  51. Patumi, M.; d’Andria, R.; Marsilio, V.; Fontanazza, G.; Morelli, G.; Lanza, B. Olive and olive oil quality after intensive monocone olive growing (Olea europaea L., cv. Kalamata) in different irrigation regimes. Food Chem. 2002, 77, 27–34. [Google Scholar] [CrossRef]
  52. Brito, C.; Dinis, L.-T.; Silva, E.; Gonçalves, A.; Matos, C.; Rodrigues, M.A.; Moutinho-Pereira, J.; Barros, A.; Correia, C. Kaolin and salicylic acid foliar application modulate yield, quality and phytochemical composition of olive pulp and oil from rainfed trees. Sci. Hortic. 2018, 237, 176–183. [Google Scholar] [CrossRef]
  53. Chang, X.; Heene, E.; Qiao, F.; Nick, P. The Phytoalexin Resveratrol Regulates the Initiation of Hypersensitive Cell Death in Vitis Cell. PLoS ONE 2011, 6, e26405. [Google Scholar] [CrossRef] [PubMed]
  54. Lu, Y.; Zhao, J.; Xin, Q.; Yuan, R.; Miao, Y.; Yang, M.; Mo, H.; Chen, K.; Cong, W. Protective effects of oleic acid and polyphenols in extra virgin olive oil on cardiovascular diseases. Food Sci. Hum. Wellness 2024, 13, 529–540. [Google Scholar] [CrossRef]
  55. Lu, H.; Liu, B.; Fu, W.; Ji, K.; Rong, S.; Bao, W. Dietary oleic acid intake, olive oil consumption, and risk of cardiovascular and all-cause mortality. JUSTC 2024, 54, 0906. [Google Scholar] [CrossRef]
  56. Tsitsekian, D.; Daras, G.; Panara, A.; Alatzas, A.; Koupa, A.; Kamargiakis, E.; Mylona, P.; Thomaidis, N.S.; Rigas, S. Molecular regulation of fatty acid biosynthesis and oil composition during olive drupe ripening. Plant Cell Rep. 2025, 44, 284. [Google Scholar] [CrossRef] [PubMed]
  57. Liu, H.; Wang, Y.; Zhou, X.; Wang, C.; Wang, C.; Fu, J.; Wei, T. Overexpression of a harpin-encoding gene popW from Ralstonia solanacearum primed antioxidant defenses with enhanced drought tolerance in tobacco plants. Plant Cell Rep. 2016, 35, 1333–1344. [Google Scholar] [CrossRef] [PubMed]
  58. Valente, S.; Machado, B.; Pinto, D.C.G.A.; Santos, C.; Silva, A.M.S.; Dias, M.C. Modulation of phenolic and lipophilic compounds of olive fruits in response to combined drought and heat. Food Chem. 2020, 329, 127191. [Google Scholar] [CrossRef]
  59. Vincenti, S.; Mariani, M.; Alberti, J.-C.; Jacopini, S.; Brunini-Bronzini de Caraffa, V.; Berti, L.; Maury, J. Biocatalytic Synthesis of Natural Green Leaf Volatiles Using the Lipoxygenase Metabolic Pathway. Catalysts 2019, 9, 873. [Google Scholar] [CrossRef]
  60. Carrapiso, A.I.; Rubio, A.; Sánchez-Casas, J.; Martín, L.; Martínez-Cañas, M.; de Miguel, C. Effect of the Organic Production and the Harvesting Method on the Chemical Quality and the Volatile Compounds of Virgin Olive Oil over the Harvesting Season. Foods 2020, 9, 1766. [Google Scholar] [CrossRef]
  61. García-Vico, L.; Belaj, A.; León, L.; Rosa, R.d.l.; Sanz, C.; Pérez, A.G. A survey of ethanol content in virgin olive oil. Food Control 2018, 91, 248–253. [Google Scholar] [CrossRef]
  62. Kiritsakis, A.K. Flavor components of olive oil—A review. J. Am. Oil Chem. Soc. 1998, 75, 673–681. [Google Scholar] [CrossRef]
  63. Ranalli, A.; De Mattia, G. Characterization of olive oil produced with a new enzyme processing aid. J. Am. Oil Chem. Soc. 1997, 74, 1105–1113. [Google Scholar] [CrossRef]
  64. Cevik, S.; Ozkan, G.; Kıralan, M. Optimization of malaxation process of virgin olive oil using desired and undesired volatile contents. LWT 2016, 73, 514–523. [Google Scholar] [CrossRef]
  65. Çevik, Ş.; Ozkan, G.; Kiralan, M. Optimization of Malaxation Process using Major Aroma Compounds in Virgin Olive Oil. Braz. Arch. Biol. Technol. 2016, 59, e16160356. [Google Scholar] [CrossRef]
Figure 1. Spider chart of the effects of treatments on major olive oil quality and nutraceutical attributes. Abbreviations: CON, control; HAR, harpin; CHI, chitosan, MUFAs, monounsaturated fatty acids; SQL, squalene; TPHENOLS, total phenols; α-Toco, α-tocopherol; OLEO, oleocanthal; HT, hydroxytyrosol.
Agronomy 16 00788 g001
Figure 2. Principal component analysis of the effects of the various elicitor treatments on yield and olive oil quality and nutraceutical properties. Abbreviations: CON, control; HAR, harpin; CHI, chitosan.
Agronomy 16 00788 g002
Figure 3. Plot of factor analysis of the three treatments based on their effects on yield and olive oil quality and nutraceutical properties. Abbreviations: CON, control; HAR, harpin; CHI, chitosan.
Agronomy 16 00788 g003
Table 1. Meteorological data per month in the Katheni region.
MonthMaximum Temperature (°C)Mean Maximum Temperature (°C)Mean Temperature (°C)Rainfall (mm)Mean ET (Mean Daily Evapotranspiration) (mm day−1)
June41.732.327.20.468.98
July38.232.528.35.118.20
August37.032.027.510.027.24
September33.128.724.126.895.48
October31.423.519.15.963.51
Table 2. Olive fruit yield, olive oil percentage, oil produced per tree and fruit maturity index at harvest as influenced by the different treatments.
TreatmentYield
(kg tree−1)
Oil Percentage Per FruitOil Per Tree (kg)Maturity Index
p-value0.9880.4900.9270.492
CON27.3 a21.96 a5.99 a6.41 a
HAR27.7 a19.85 a5.64 a6.05 a
CHI27.7 a21.19 a5.90 a6.08 a
Means within the same column followed by the same letter do not differ significantly based on Tukey’s HSD test at a = 0.05. Abbreviations: CON, control; HAR, harpin; CHI, chitosan.
Table 3. Olive oil free acidity, peroxide value, K232, K270, and ΔK under the influence of the different treatments.
TreatmentFree Acidity
(g Oleic Acid 100 g−1)
Peroxide Value
(meq O2 kg−1)
K232K270ΔK
p-value0.0000.0460.4390.0710.071
CON0.56 a5.20 a2.01 a0.13 a0.000 a
HAR0.25 b4.16 b1.87 a0.08 a−0.003 a
CHI0.29 b4.16 b1.86 a0.08 a−0.002 a
Means within the same column followed by the same letter do not differ significantly based on Tukey’s HSD test at a = 0.05. Abbreviations: CON, control; HAR, harpin; CHI, chitosan.
Table 4. Olive oil total phenols, o-diphenols, flavonoids and α-tocopherol concentration, and antioxidant capacity on FRAP and DPPH assays (in μmol Trolox equivalents kg−1), as influenced by the different treatments.
TreatmentTotal Phenols (mg GAE kg−1)o-Diphenols (mg CAE kg−1)Total Flavonoids (mg CtE kg−1)FRAPDPPHα-Tocopherol (mg kg−1)
p-value0.0390.0300.0120.0120.0000.007
CON78.33 b37.78 a34.80 b173.58 b376.80 c23.12 b
HAR105.15 ab23.52 b49.51 a334.36 a728.60 a38.58 a
CHI154.20 a19.42 b50.72 a335.86 a584.78 b27.51 b
Means within the same column followed by the same letter do not differ significantly based on Tukey’s HSD test at a = 0.05. Abbreviations: CON, control; HAR, harpin; CHI, chitosan; GAE, gallic acid equivalents; CAE, caffeic acid equivalents; CtE, catechin equivalents.
Table 5. The effects of the various treatments on the concentrations of individual phenolic compounds detected in the olive oils produced (mg kg−1).
TreatmentHydroxytyrosolTyrosol4HBVanillic AcidCaffeic AcidVanillinp-Coumaric AcidFerulic AcidOleaceinOleocanthalLuteolinApigenin
p-value0.0240.8210.1050.0020.3640.1160.6190.2040.7390.0100.1670.052
CON0.13 b6.01 a0.21 a0.18 b0.01 a0.05 a1.09 a0.12 a1.74 a33.23 a3.88 a2.65 a
HAR0.14 b5.99 a0.25 a0.48 a0.01 a0.04 a1.00 a0.12 a1.26 a27.69 ab5.39 a4.03 a
CHI0.63 a6.52 a0.18 a0.27 b0.01 a0.04 a1.18 a0.09 a1.56 a21.94 b3.17 a4.42 a
Means within the same column followed by the same letter do not differ significantly based on Tukey’s HSD test at a = 0.05. Abbreviations: CON, control; HAR, harpin; CHI, chitosan.
Table 6. Effects of the various treatments on the content of FAMEs (%) in the oil.
TreatmentC16:0C16:1C17:0C17:1C18:0C18:1C18:2C20:0C18:3C20:1C22:0C24:0
p-value0.0050.0000.0990.0000.7240.0000.0000.1900.0000.5150.060 *0.175
CON17.15 a2.13 a0.02 a0.07 a2.36 a56.44 b20.42 a0.37 a0.69 a0.22 a0.1 a0.03 a
HAR16.59 ab1.76 b0.03 a0.07 a2.48 a61.02 a16.57 b0.39 a0.70 a0.22 a0.1 a0.03 a
CHI16.07 b1.60 b0.03 a0.06 b2.43 a63.52 a14.96 b0.37 a0.58 b0.23 a0.1 a0.03 a
Means within the same column followed by the same letter do not differ significantly based on Tukey’s HSD test at a = 0.05 after ANCOVA analysis, with the maturity index as a covariate. The asterisk next to the p-value indicates a significant effect of the covariant. Abbreviations: CON, control; HAR, harpin; CHI, chitosan.
Table 7. The content of various groups of FAMEs (%) and their ratios, as well as squalene concentrations in the oils produced under the influence of the different treatments.
TreatmentSFAsMUFAsPUFAsUFAsMUFAs/PUFAsSFAs/UFAsC18:1/C18:2Squalene (mg/100 g)
p-value0.0030.0000.0000.0030.0000.0030.0000.000
CON20.03 a58.85 b21.11 a79.96 b2.79 b0.25 a2.77 b625.3 b
HAR19.62 a63.10 a17.27 b80.38 b3.68 a0.24 a3.72 a741.5 a
CHI19.03 b65.41 a15.55 b80.97 a4.23 a0.23 b4.27 a746.8 a
Means within the same column followed by the same letter do not differ significantly based on Tukey’s HSD test at a = 0.05 after ANCOVA analysis, with the maturity index as a covariate. Abbreviations: CON, control; HAR, harpin; CHI, chitosan.
Table 8. The content of various volatile compounds (%) in the oils produced under the influence of the different treatments.
ParametersTreatments
CONCHIHARp-Value
Ethanol44.52 ab45.92 a30.82 b0.011
Pentan-3-one0.56 a0.59 a0.26 a0.343
Isoamyl alcohol0.64 a0.27 b0.23 b0.005 *
Ethyl isobutyrate0.22 a0.14 a0.34 a0.331
n-octane2.84 a2.02 a2.11 a0.100
(Z)-3-hexenal0.31 b2.16 a1.73 a0.000
Hexanal6.63 a3.06 b4.46 ab0.006 *
Ethyl-2-methyl butyrate0.67 a0.59 a1.71 a0.166
Trans-2-hexenal15.77 b20.81 ab24.81 a0.001
2-hexen-1-ol5.53 b5.63 b11.82 a0.000
n-hexanol9.88 a5.92 b7.71 ab0.012
3-Ethyl-1,5-octadiene 5.29 a7.35 a7.70 a0.360
(E)-hept-2-enal0.49 a0.03 b0.11 b0.000
(E)-3-Hexen-1-ol acetate1.67 a3.87 a2.85 a0.180
Hexyl acetate1.13 a0.46 a0.48 a0.239
dl-limonene0.40 a0.18 a0.43 a0.557
(E)-β-ocimene0.32 a0.19 a0.29 a0.847
n-Nonanal1.04 a1.08 a0.86 a0.751
(E)-4,8-dimethyl-nona-1,3,7-triene0.21 a0.51 a0.63 a0.449
α-Copaene0.75 a1.30 a0.75 a0.346
Means within the same column followed by the same letter do not differ significantly based on Tukey’s HSD test at a = 0.05 after ANCOVA analysis, with the maturity index as a covariate. The asterisk next to the p-value indicates significant effect of the covariate. Abbreviations: CON, control; HAR, harpin; CHI, chitosan.
Disclaimer/Publisher’s Note: The statements, opinions and data contained in all publications are solely those of the individual author(s) and contributor(s) and not of MDPI and/or the editor(s). MDPI and/or the editor(s) disclaim responsibility for any injury to people or property resulting from any ideas, methods, instructions or products referred to in the content.