Article

Effects of Combined Application of Nitrogen Fertilizer and Multiple Soil Amendments on Soil Properties and Bacterial Community Structure in Arid-Zone Jujube Orchards


1
The National-Local Joint Engineering Laboratory of High Efficiency and Superior-Quality Cultivation and Fruit Deep Processing Technology on Characteristic Fruit Trees, College of Horticulture and Forestry Sciences, Tarim University, Alar 843300, China
2
Agricultural Science Research Institute of the 14th Division, Xinjiang Production and Construction Corps, Kunyu 848000, China
*
Author to whom correspondence should be addressed.
Agronomy 2026, 16(7), 694; https://doi.org/10.3390/agronomy16070694
Submission received: 13 February 2026 / Revised: 18 March 2026 / Accepted: 24 March 2026 / Published: 25 March 2026
(This article belongs to the Section Soil and Plant Nutrition)

Abstract

Jujube (Ziziphus jujuba Mill.) cultivation in arid regions of China faces severe soil constraints, including high alkalinity, low organic matter content, and poor water retention. Although soil amendments have demonstrated potential for improving soil quality, their combined effects on soil–plant–microbe interactions in desert agroecosystems remain poorly understood. This study conducted a three-year field experiment in a desert jujube orchard in southern Xinjiang, China, to evaluate six nitrogen fertilizer management strategies: urea alone (CK) or combined with biochar (NB), bentonite (NP), graphene (NS), biochar plus bentonite (NBP), or microbial inoculants (NW). Soil physicochemical properties, enzyme activities, bacterial community structure, and jujube yield were analyzed. Structural equation modeling (SEM) was employed to elucidate the pathways linking soil amendments to crop productivity. Results showed that NBP was the most effective in improving soil physical structure, significantly reducing bulk density and enhancing water retention capacity compared to the control. The NBP treatment also enhanced soil organic matter (30% increase), available phosphorus (119% increase), and urease activity (44% increase), resulting in the highest jujube yield (7.14 kg per tree). Bacterial community analysis revealed that NBP significantly increased Shannon diversity and enriched Actinobacteriota and Proteobacteria. SEM analysis indicated that urease activity served as a significant mechanistic pathway linking soil organic matter improvements to enhanced crop productivity. These findings demonstrate that combined application of biochar and bentonite with nitrogen fertilizer represents an effective strategy for improving soil quality, enhancing microbial functionality, and increasing crop yield in desert jujube orchards, providing a practical and synergistic amendment combination for sustainable soil management and productivity enhancement in arid agroecosystems.

1. Introduction

Jujube (Ziziphus jujuba Mill.) cultivation represents a cornerstone of agricultural economy in the arid regions of Northwest China, particularly in Xinjiang Province, where desert brown soils dominate the landscape [1]. These orchards not only provide substantial economic returns but also contribute to ecological stabilization through windbreak functions and carbon sequestration in marginal lands [2]. However, the inherent physicochemical constraints of desert brown soils—characterized by strong alkalinity, low organic matter content, poor water retention capacity, elevated salinity, and deficient nutrient pools—severely limit jujube productivity and orchard sustainability. Conventional management practices relying predominantly on synthetic nitrogen (N) fertilizers have proven insufficient to overcome these multifaceted soil limitations, and excessive urea application may exacerbate soil degradation through acidification, salinization, and disruption of native microbial communities. Consequently, there is an urgent need to develop integrated soil management strategies that simultaneously address physical structure deterioration, chemical imbalances, and biological fertility decline in arid zone agricultural systems.
Soil amendments offer distinct mechanisms for ameliorating degraded soils, yet their combined effects remain poorly understood. Biochar improves carbon storage and water retention but may immobilize N [3], whereas bentonite enhances structure and cation exchange but provides limited carbon inputs [4,5]. These complementary limitations suggest potential for synergistic interaction when co-applied. Alternative amendments such as graphene [6,7,8]. Microbial inoculants containing plant growth-promoting rhizobacteria or phosphate-solubilizing microorganisms offer biological approaches to enhance nutrient cycling, accelerate organic matter decomposition, and suppress soilborne pathogens [9,10]. Despite extensive documentation of individual amendment effects, a critical knowledge gap persists regarding the performance of combined amendments, particularly whether synergistic interactions occur when biochar is co-applied with mineral conditioners in alkaline desert soils.
The beneficial effects of soil amendments on crop productivity are mediated through complex interactions within the soil–microbe–plant continuum. Amendments influence plant performance through both direct mechanisms—such as improved physical structure facilitating root penetration, enhanced water retention buffering drought stress, and increased nutrient availability supporting plant uptake—and indirect mechanisms involving modulation of soil enzyme activities and restructuring of microbial community composition and function [11,12]. The soil microbiome, particularly bacterial communities, serves as a critical mediator in these processes by regulating biogeochemical cycling of carbon, N, and phosphorus through diverse metabolic pathways including N fixation, nitrification, denitrification, phosphate solubilization, and organic matter decomposition [13,14,15]. Soil enzymes such as urease, invertase, and phosphatase, predominantly produced by microbial communities, catalyze rate-limiting steps in nutrient mineralization and directly correlate with soil fertility status and crop productivity [16,17]. Soil ecological theory emphasizes that nutrient mineralization is governed by specific extracellular enzymes catalyzing rate-limiting steps [18]. In N-limited desert soils, urease activity represents the primary bottleneck controlling nitrogen availability, thus functioning as the pivotal mediator between soil organic matter pools and crop productivity.
However, most amendment studies have adopted reductionist approaches focusing either on soil chemical properties or crop yield responses, while neglecting the microbial ecological mechanisms that link amendments to agricultural outcomes [19,20]. To test the hypothesis that combined organic–mineral amendments enhance crop productivity through targeted modification of soil microbial functional capacity, we conducted a three-year field experiment in a desert jujube orchard in Southern Xinjiang, China. We specifically hypothesized that: (1) biochar–bentonite co-application would create synergistic effects on soil physical structure and organic matter retention, thereby enriching carbon- and N-cycling microbial guilds; (2) this functional restructuring would enhance extracellular enzyme activities (particularly urease-mediated nitrogen mineralization), serving as the primary mechanistic pathway linking soil quality improvements to yield enhancement; (3) distinct amendment strategies would converge on similar functional outcomes despite differing in specific microbial community composition. To evaluate these hypotheses, we compared six N fertilizer management strategies: urea alone (CK), urea combined with biochar (NB), urea combined with graphene (NS), urea combined with bentonite (NP), urea combined with biochar and bentonite (NBP), and urea combined with microbial inoculant (NW), integrating soil physicochemical analyses, bacterial community sequencing, enzyme activity assays, and structural equation modeling to elucidate the amendment–microbe–yield causal chain.

2. Materials and Methods

2.1. Site Description and Plant Material

The field experiment was conducted in a Ziziphus jujuba Mill. cv. Junzao orchard located at the experimental station of the Agricultural Science Research Institute in Kunyu City, Xinjiang Uygur Autonomous Region, China (79°19′56″ E, 37°16′27″ N). The study area is situated on the southern margin of the Tarim Basin and is characterized by a typical warm temperate extreme continental desert climate. The region experiences a mean annual temperature of approximately 12.2 °C, with an annual precipitation of merely 33.4 mm and an evaporation capacity reaching 2824 mm. The site receives approximately 2610.6 h of annual sunshine, with a frost-free period extending to 214 days and marked diurnal temperature variations.
The jujube trees were originally planted in 2003 and renewed by cutting back to the stump in 2019. Trees were trained to a central leader shape with a spacing of 2.0 m (within row) × 4.0 m (between rows). At the time of experimentation, trees exhibited uniform vigor with heights ranging from 3.0 to 3.5 m and canopy diameters of 2.2–2.5 m. The soil is classified as brown desert soil (Calcisol according to WRB), characterized by inherently low organic matter content, elevated pH values, and high susceptibility to salinization. Baseline physicochemical properties of the plow layer (0–40 cm) prior to experimental establishment are detailed in Table S1. Abbreviations used in this study are defined in Table 1.

2.2. Soil Amendments and Fertilizers

The following soil amendments and fertilizers were used in this study: (1) Urea: Dongping Lake granular urea (N ≥ 46.4%, particle size 2.0–2.5 mm, sphericity 0.975), produced by Shandong Runyin Biochemical Co., Ltd. (Dongping County, Shandong, China). (2) Triple superphosphate (TSP): Sanhuan® granular triple superphosphate (P2O5 ≥ 46%, granular), produced by Yunnan Yuntianhua International Chemical Co., Ltd. (Kunming, Yunnan, China). (3) Potassium sulfate: Xirun Baichuan agricultural-grade potassium sulfate (K2O ≥ 50%, chloride-free), supplied by Xinjiang Xirun Agricultural Technology Co., Ltd. (Urumqi, China). (4) Biochar: Bamboo-derived biochar (pH 9.2, total C 68.5%, total N 0.8%, specific surface area 185 m2 g−1, particle size 2–5 mm), a crop-residue-derived granular product supplied by Henan Yuzhong’ao Agricultural Technology Co., Ltd. (Zhengzhou, Henan, China). (5) Graphene: Liquid-phase graphene dispersion (concentration 5 mg mL−1, lateral size 0.5–5 μm, thickness 1–3 nm, purity > 95%), provided by the Engineering Research Center of Coal-Based Ecological Carbon Sequestration Technology, Ministry of Education, Datong University (Datong, Shanxi, China). (6) Bentonite: Natural sodium-based bentonite (montmorillonite content ≥ 85%, cation exchange capacity 95 cmol kg−1, pH 8.5), sourced from Xinjiang Baohua Jingshi New Material Technology Co., Ltd. (Changji, Xinjiang, China). (7) Microbial inoculant: Biowish microbial fertilizer (≥1.0 × 10⁹ CFU mL−1, containing Bacillus subtilis, Bacillus amyloliquefaciens, Bacillus licheniformis, and Bacillus pumilus), produced by BioWish Inc. (Cincinnati, OH, USA).

2.3. Experimental Design and Field Management

A three-year field experiment was conducted from March 2023 to November 2025, with sampling and measurements performed in 2025. The experiment employed a randomized complete block design with six treatments and six replicate blocks (n = 6).
Each experimental plot consisted of a single row containing 20 consecutive jujube trees. Adjacent plots were separated by guard rows and buffer zones of ≥10 m to eliminate edge effects. The middle 10 trees in each plot were designated for soil physicochemical property and yield measurements, while the outer trees served as guard trees.
Fertilizer rates for N, phosphorus (P2O5), and potassium (K2O) were standardized across all treatments based on local high-yield jujube orchard management practices (Table 2). All amendments and fertilizers were applied as basal fertilizers in mid-March each year. The application method involved excavating two trenches (1.0 m long × 0.3 m wide × 0.35 m deep) on the east and west sides of each tree trunk at a distance of 45 cm from the trunk. N, phosphorus, and potassium fertilizers were uniformly spread at the trench bottom, followed by the addition of respective soil amendments according to treatment specifications. The excavated soil was then thoroughly mixed with the fertilizers and amendments before backfilling and leveling. All cultural practices except soil amendment types were identical across treatments. Drip irrigation was employed throughout the growing season, with uniform irrigation timing, frequency, and water volume across all treatments. Standard horticultural practices including pruning, pest and disease management, and weed control were implemented consistently following local orchard protocols.

2.4. Soil Sampling and Yield Measurement

Soil samples were collected in October 2025 (after fruit harvest). For physicochemical analyses, five random subsamples (0–40 cm depth) were collected from each plot and composited to form one representative sample per plot, resulting in six analytical replicates per treatment (n = 6). For microbial community analysis, three of the six replicate plots per treatment were randomly selected for high-throughput sequencing, yielding three biological replicates (n = 3). All samples were immediately transported to the laboratory on ice. A portion of each sample was stored at 4 °C for enzyme activity assays (within 48 h), while the remainder was air-dried for physicochemical analyses or stored at −80 °C for DNA extraction.
Soil physicochemical properties were determined following standard protocols: soil bulk density by the core method; water-stable aggregates by wet sieving; pH and EC in 1:5 soil:water extracts; SOM by potassium dichromate oxidation; TC and TN by elemental analysis; Avail-P by sodium bicarbonate extraction-molybdenum antimony colorimetry; Avail-K by ammonium acetate extraction-flame photometry; AHN by alkaline hydrolysis-diffusion method. Total elemental concentrations (P, K, Na, Ca, Mg, Fe, Mn, Zn) were determined by ICP-OES following HNO3-HClO4 digestion. Soil enzyme activities were assayed colorimetrically: invertase activity by 3,5-dinitrosalicylic acid method (expressed as mg g−1 d−1); urease activity by indophenol blue method (mg g−1 d−1); alkaline phosphatase activity by p-nitrophenyl phosphate disodium method (μ g−1); catalase activity by potassium permanganate titration (mL g−1 h−1).
Fruit yield was determined at harvest (late October 2025) by individually weighing all marketable fruits from 10 designated trees per plot (n = 3). Total yield per tree was calculated and reported as kg tree−1.

2.5. Microbial Community Analysis

DNA was extracted from 0.5 g fresh soil using the PowerSoil DNA Isolation Kit (QIAGEN, Hilden, Germany) following the manufacturer’s instructions. The V3-V4 hypervariable regions of the bacterial 16S rRNA gene were amplified using primers 338F (5′-ACTCCTACGGGAGGCAGCAG-3′) and 806R (5′-GGACTACHVGGGTWTCTAAT-3′) (Tsingke Biotechnology Co., Ltd., Beijing, China). Sequencing was performed on an Illumina MiSeq platform (PE300) at Metware Biotechnology Co., Ltd. (Wuhan, China).
Raw sequences were processed using QIIME2 (v2021.4). Briefly, paired-end reads were merged, quality-filtered, and denoised using DADA2 to generate amplicon sequence variants. Taxonomic assignment was performed against the SILVA 138 database using the naive Bayes classifier. Alpha diversity indices were calculated using the ‘vegan’ package in R (v4.2.1). Beta diversity was assessed by PCoA based on Bray–Curtis dissimilarity matrices, with statistical significance determined by PERMANOVA using the ‘adonis2′ function. Functional prediction was performed using FAPROTAX v1.2.4 based on SILVA taxonomy.

2.6. Statistical Analysis

All data were tested for normality (Shapiro–Wilk test) and homogeneity of variance (Levene’s test) prior to analysis. Treatment effects were evaluated by one-way analysis of variance (ANOVA) followed by Duncan’s multiple range test (p < 0.05) using SPSS v26.0 (IBM Corp., New York, NY, USA) [21]. Pearson correlation coefficients were calculated to examine relationships between soil properties and bacterial communities. Structural equation modeling was conducted using R v4.4.1 to elucidate direct and indirect pathways linking soil organic matter, enzyme activities, bacterial diversity, and crop yield [22]. Model fit was assessed using χ2 test, comparative fit index, root mean square error of approximation, and Akaike information criterion. All figures were generated using Origin 2024 (OriginLab, Northampton, MA, USA) and R v4.4.1 with the ‘ggplot2′ v4.0.2. package.

3. Results

3.1. Effects of N Fertilizer Combined with Soil Amendments on Soil Physicochemical Properties

3.1.1. Response of Soil Physical Properties

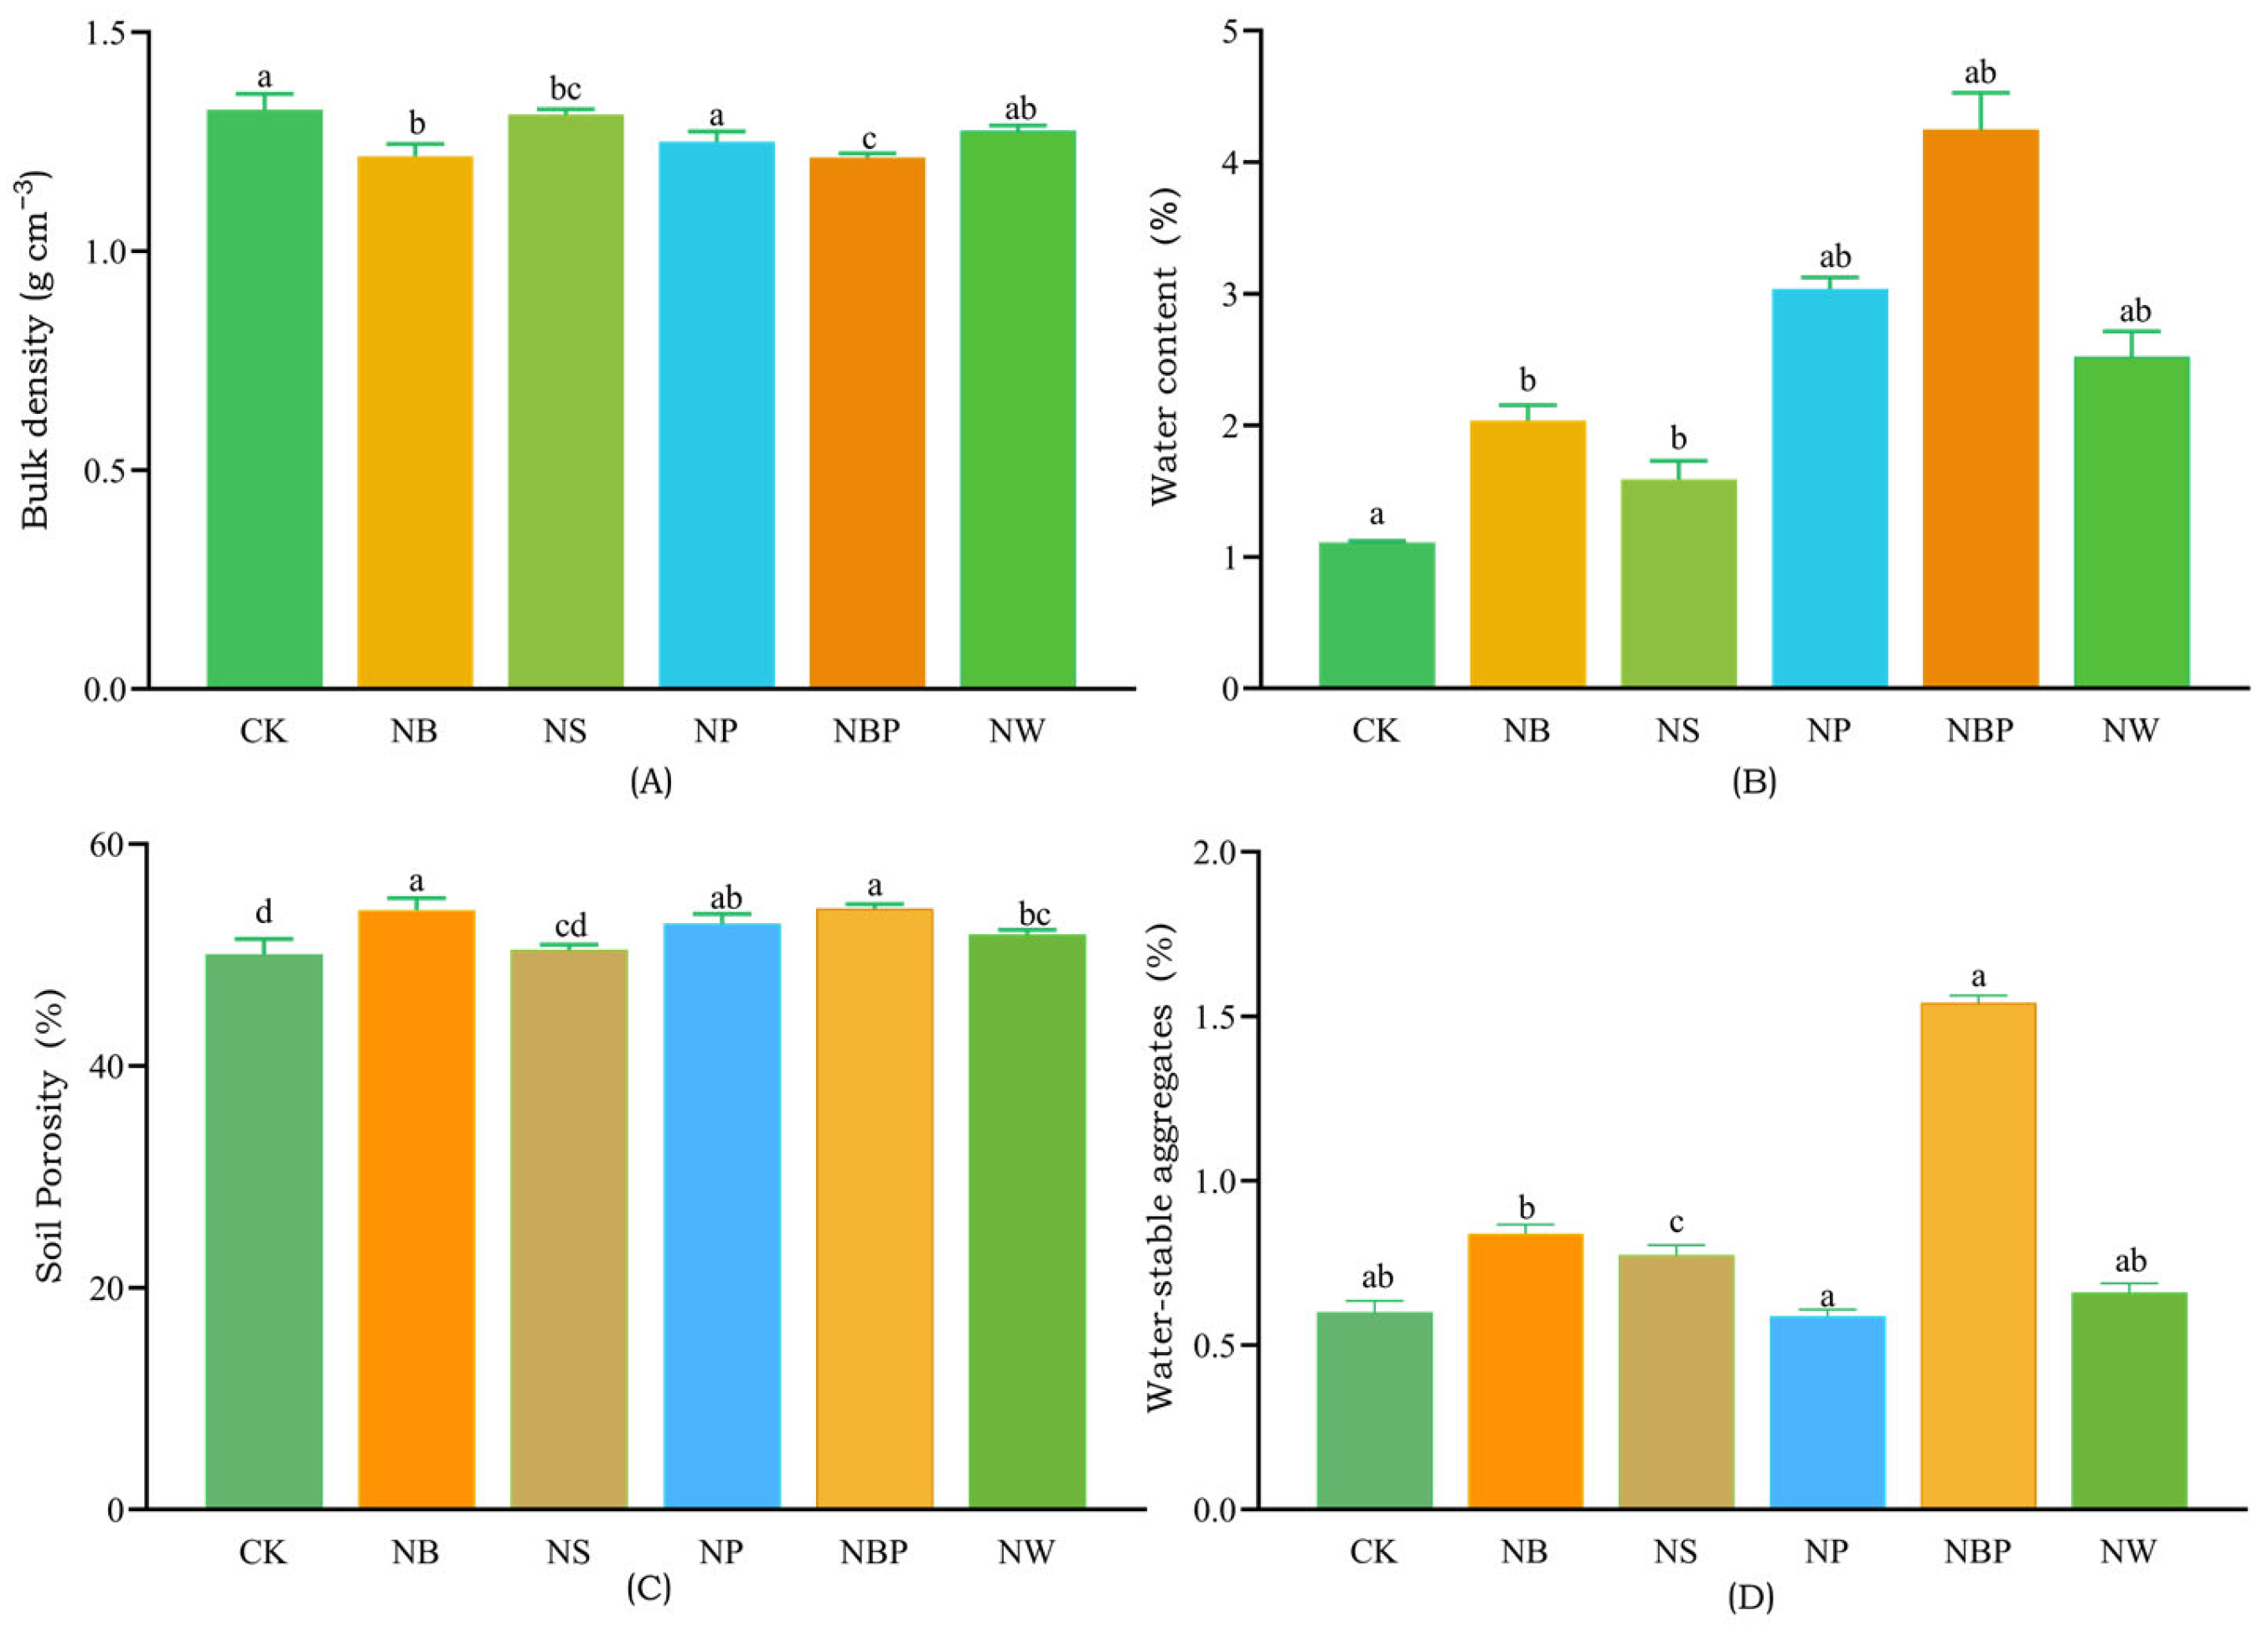
Application of soil amendments in combination with urea significantly altered soil physical structure (Figure 1). Compared with the control, NB and combined application of NBP decreased soil bulk density by 8.0% and 8.2%, respectively, with values reaching 1.217 and 1.214 g cm−3. The NP moderately reduced bulk density to 1.250 g cm−3, whereas NS and NW showed no significant effects compared with CK. Soil porosity exhibited an inverse pattern to bulk density. The NBP and NB treatments achieved the highest porosity values (54.21% and 54.06%, respectively), representing significant increases of 8.2% and 8.0% relative to CK (50.08%). The NP treatment moderately enhanced porosity to 52.82%, while NS (50.47%) remained comparable to the control. Soil moisture retention capacity responded dramatically to amendment applications. The NBP treatment exhibited the most pronounced effect, elevating soil water content by 283% to 4.25% compared with CK (1.11%). Similarly, NP and NW treatments significantly increased water content to 3.04% and 2.52%, representing 174% and 127% enhancements, respectively. NB and NS showed moderate yet significant improvements (83% and 43%, respectively).

3.1.2. Changes in Soil pH and EC

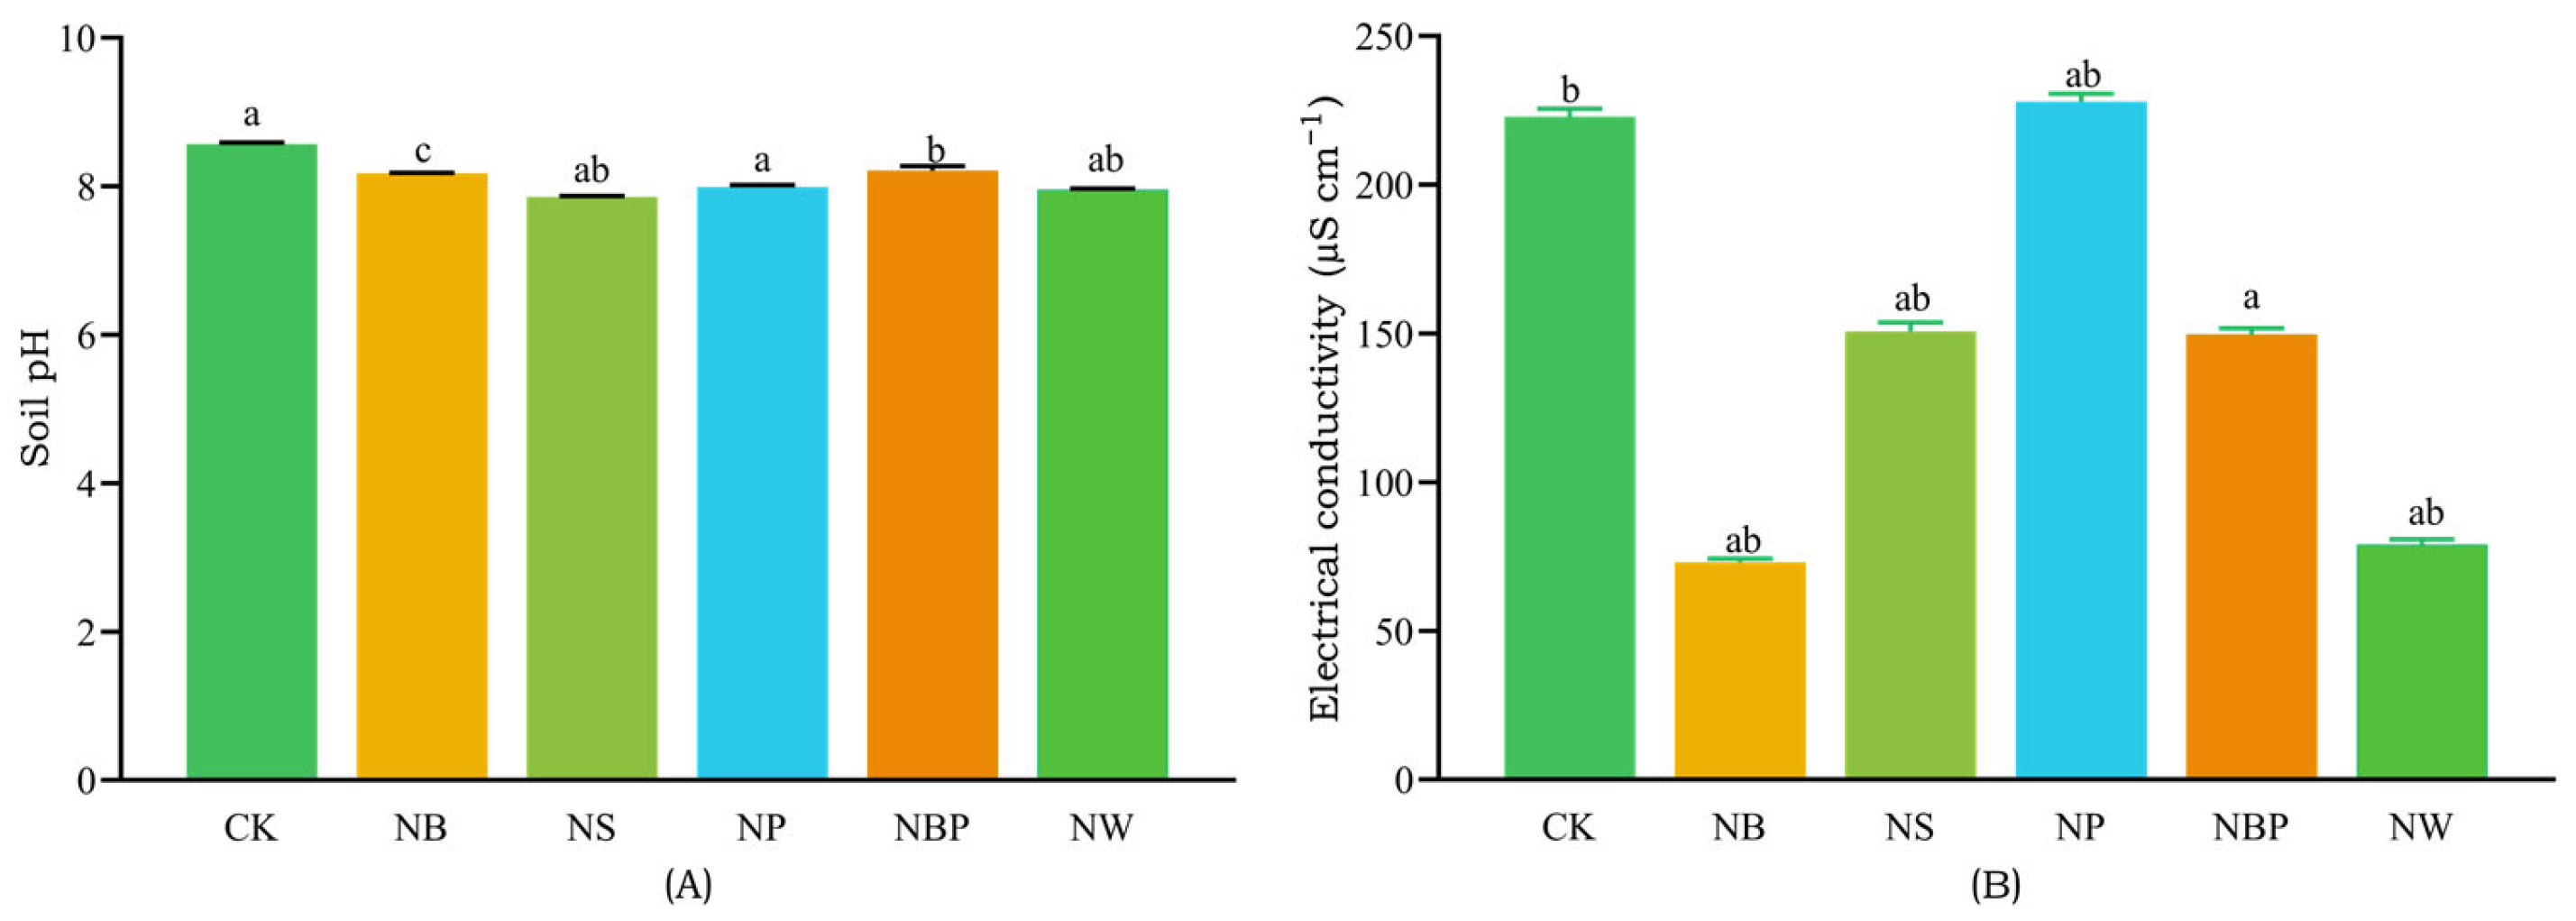
All amendment treatments significantly altered soil pH compared with the unamended control (Figure 2A). The control soil exhibited strongly alkaline conditions (pH 8.57), typical of desert brown desert soil in Southern Xinjiang. NS induced the most pronounced pH reduction to 7.86, representing a 0.71-unit decrease. NW and NP treatments moderately lowered pH to 7.96 and 7.99, respectively. Notably, NB and NBP showed relatively modest pH reductions to 8.18 and 8.21, maintaining moderately alkaline conditions while achieving significant improvement over the control. EC exhibited distinct response patterns among treatments (Figure 2B). NB most effectively reduced soil salinity (to 73 μS cm−1, 67.3% decrease), followed by NW (79 μS cm−1). NBP and NS achieved moderate desalination (149–151 μS cm−1), whereas NP failed to reduce EC (228 μS cm−1, comparable to control).

3.1.3. Shifts in Soil Carbon and N Pools

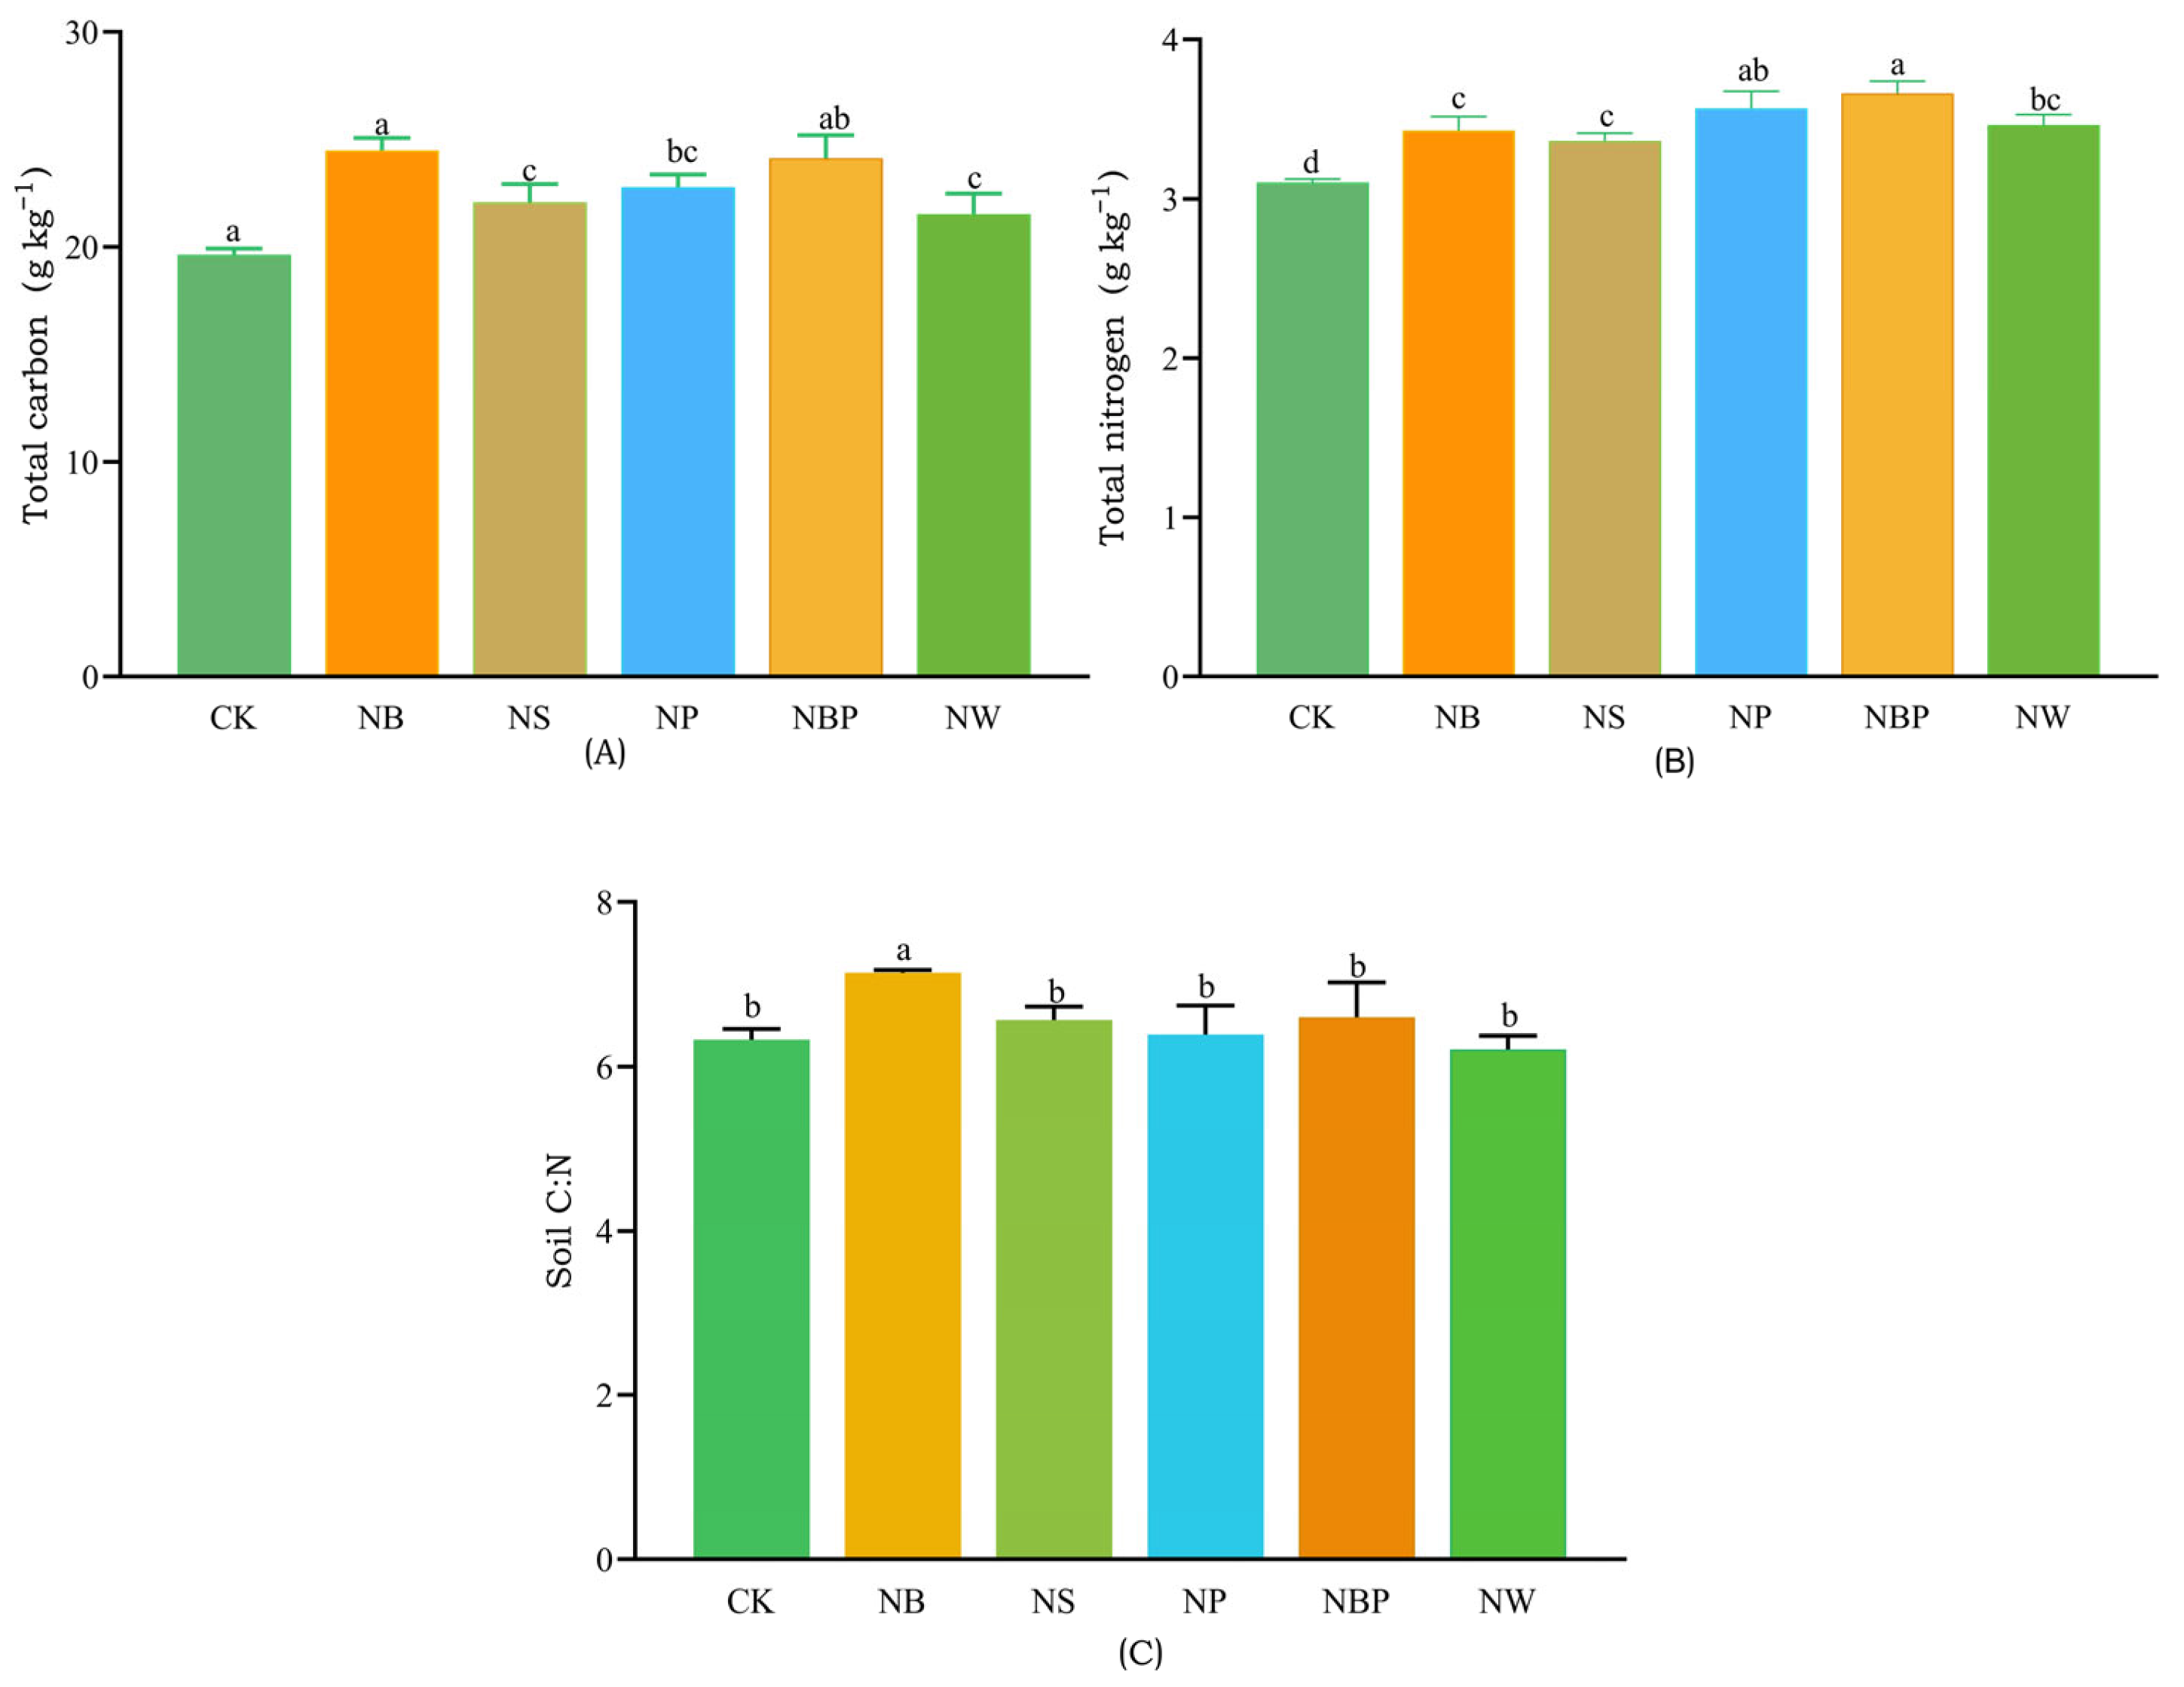
Soil amendment applications significantly enhanced SOC and STN stocks (Figure 3A,B). NB and NBP most effectively elevated total carbon (24.7% and 22.9%, respectively), while NP and NS showed moderate accumulation and NW had no significant effect. All amendments significantly increased STN, with NBP achieving the highest nitrogen stock (18.1% to 3.66 g kg−1), followed by NP (15.2%). NB, NW, and NS showed moderate N enhancement. The C/N ratio, a critical indicator of soil organic matter quality and N mineralization potential, showed distinct treatment responses (Figure 3C). NB significantly elevated the C/N ratio to 7.14, representing a 12.8% increase over CK (6.33). Notably, NBP maintained a moderate C/N ratio of 6.60, comparable to CK and other treatments, despite achieving the highest absolute carbon and N contents. This suggests that the biochar–bentonite combination optimized carbon sequestration without inducing N immobilization risks associated with high C/N ratios. By contrast, NS, NP, and NW exhibited C/N ratios ranging from 6.21 to 6.56.

3.1.4. Dynamics of Available Nutrients and Organic Matter

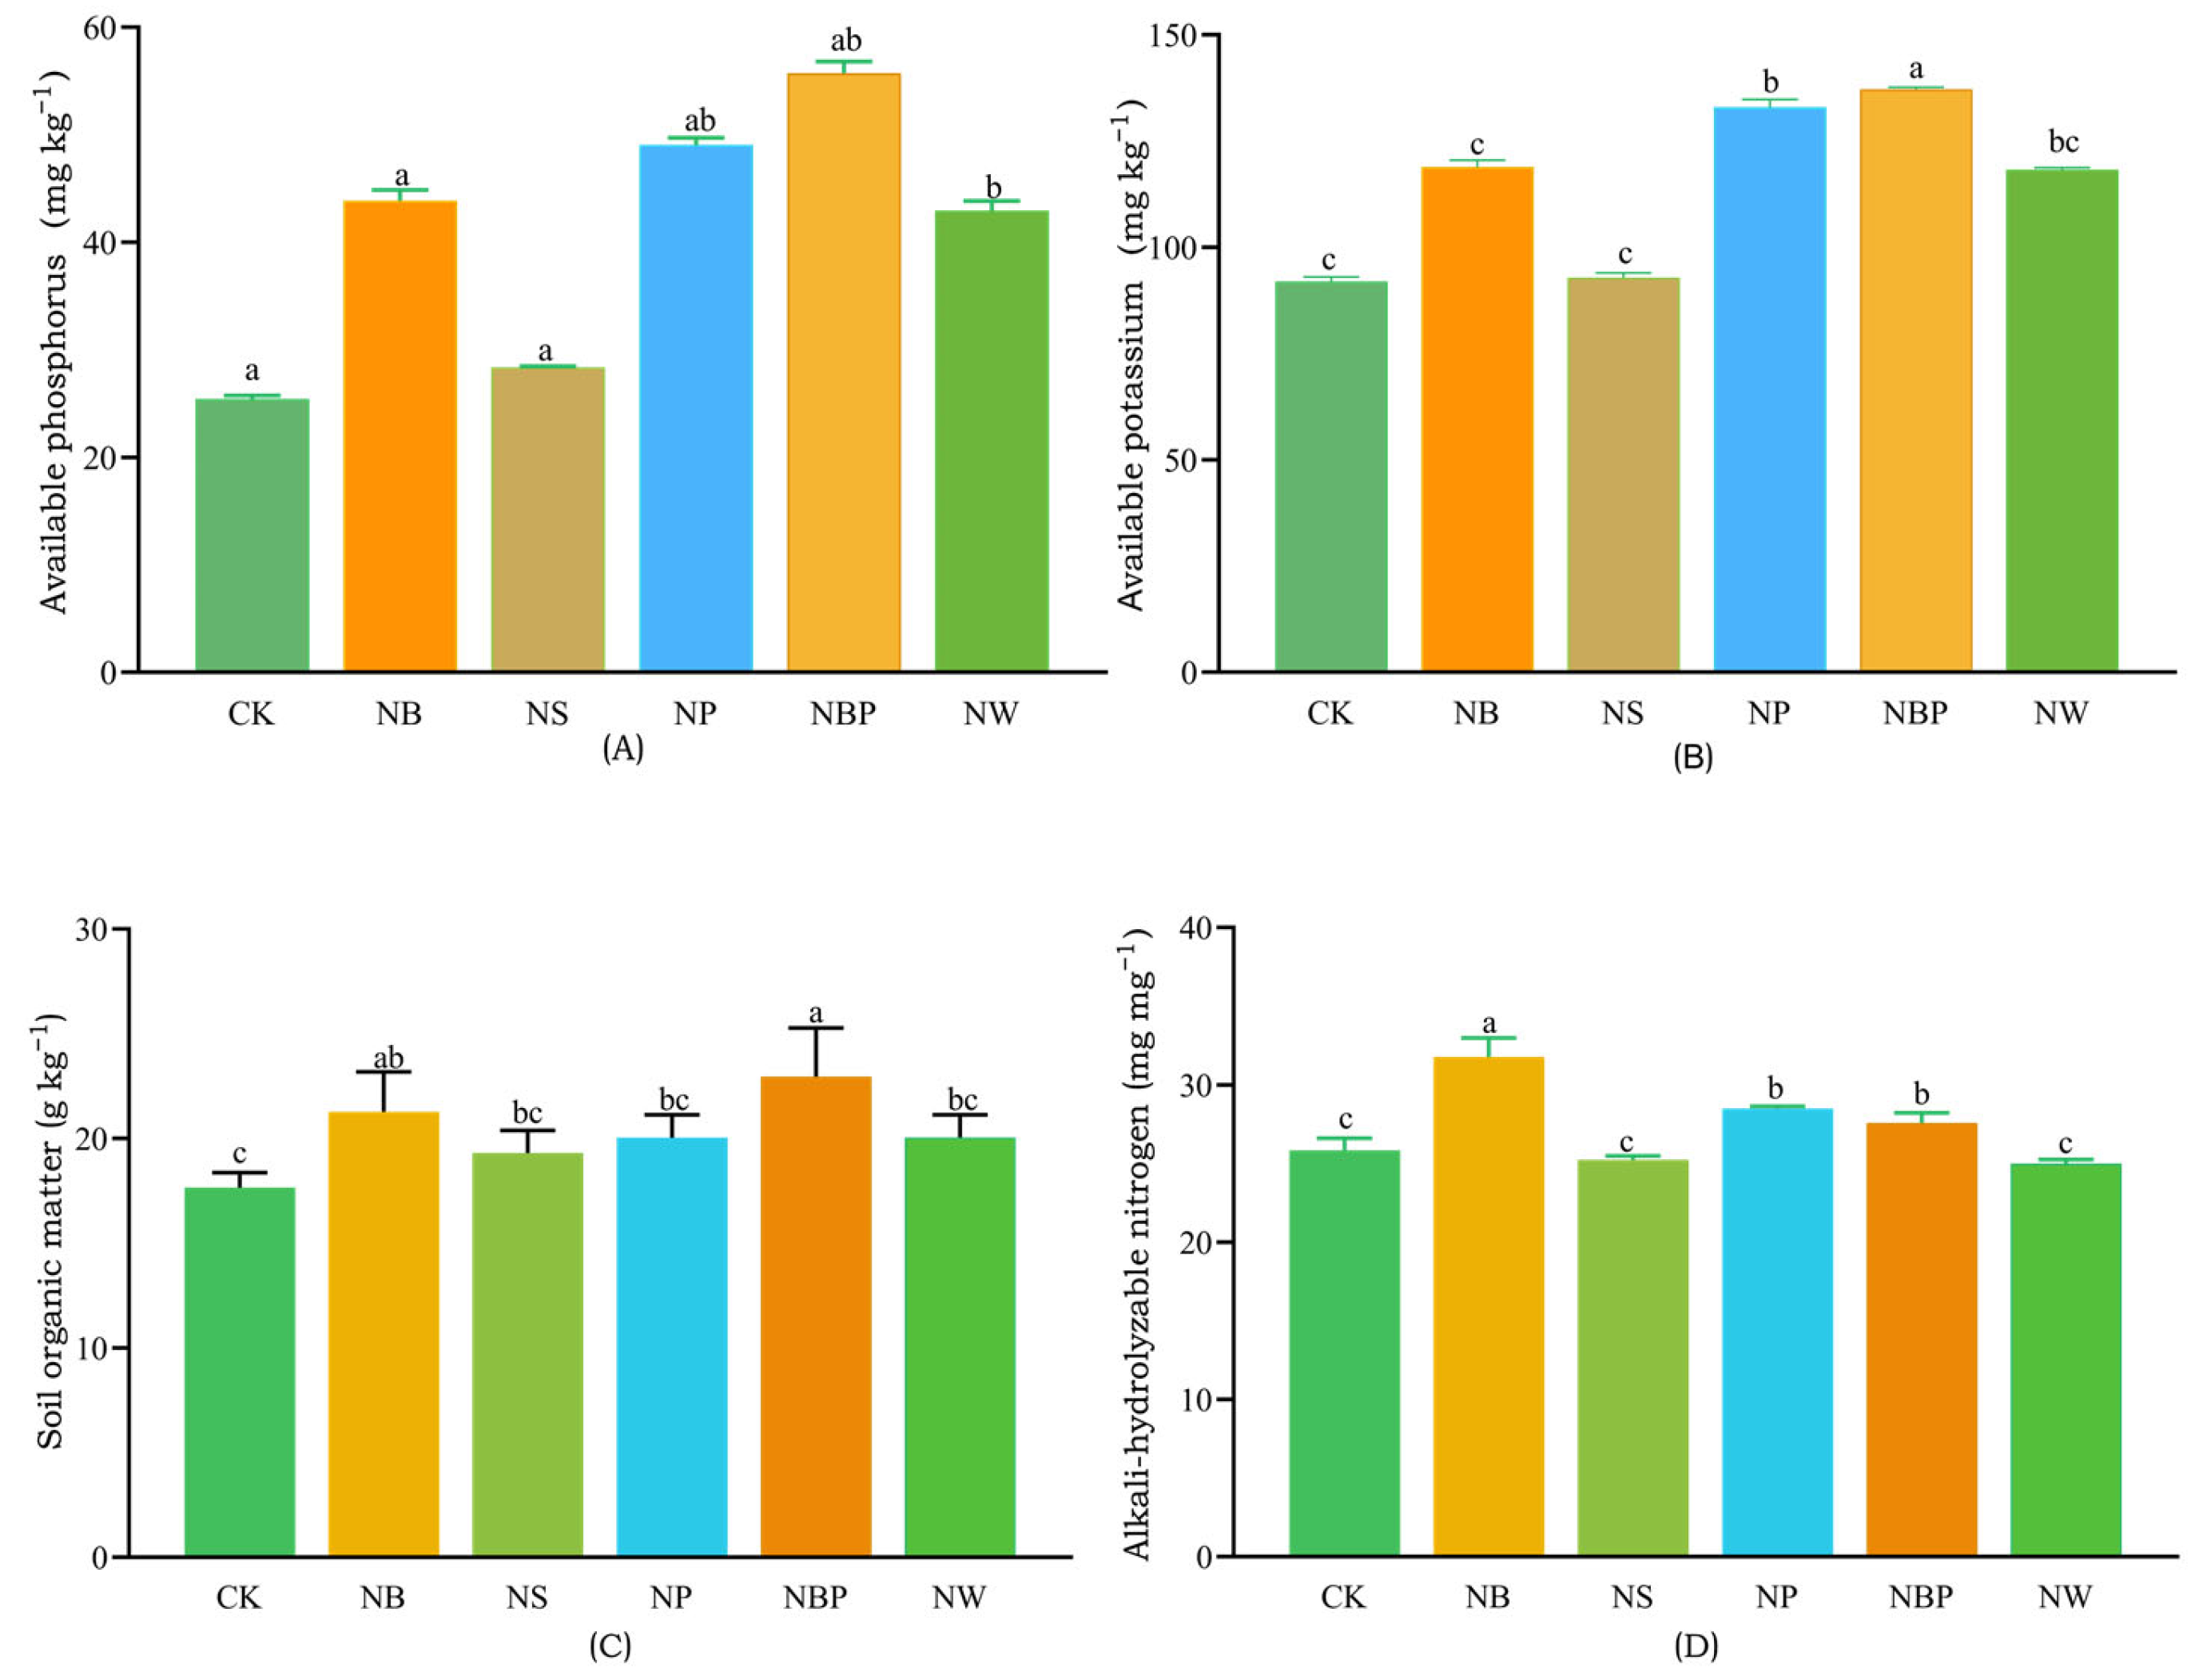
Amendment applications profoundly influenced soil nutrient availability (Figure 4A–D). NBP achieved the highest available P concentration (55.7 mg kg−1, 119% increase) and available K (137.1 mg kg−1, 49% increase), followed by NP (49.1 mg kg−1 and 133.0 mg kg−1, respectively). NB and NW showed moderate P and K activation, whereas NS exhibited marginal enhancement for P and failed to improve K availability. For available N, only NB showed significant enhancement (31.8 mg kg−1, 23% increase), while NBP uniquely increased SOM (22.96 g kg−1, 30% increase). Other treatments showed non-significant SOM elevations (19.30–21.27 g kg−1), possibly due to high variability in desert soil organic pools.

3.1.5. Soil Total Elemental Composition

Amendment applications profoundly altered soil total elemental pools (Table S2). Total P exhibited the most dramatic response, with NP and NBP achieving the highest concentrations (745.11 and 716.46 mg kg−1, 264% and 250% increases), followed by NB (653.01 mg kg−1, 219% increase). NS and NW showed only marginal effects on total P (210.51 and 272.66 mg kg−1). NBP also achieved the highest total K concentration (2073.24 mg kg−1, 9% increase), followed by NB (1955.08 mg kg−1). Total sodium showed substantial elevation under bentonite-containing treatments, with NBP exhibiting the highest concentration (1261.76 mg kg−1, 162% increase), followed by NP (950.37 mg kg−1, 97% increase) and NW (900.61 mg kg−1, 87% increase), reflecting the sodium-rich nature of bentonite amendments.
Micronutrient concentrations (Zn, Mn, Fe) showed moderate but significant responses. Total Zn reached maximum levels under NBP (50.17 mg kg−1, 32% increase over CK at 38.07 mg kg−1), while total Mn peaked under NP (304.77 mg kg−1, 6% increase over CK at 286.97 mg kg−1). Total Fe was highest in NBP (21.90 mg kg−1) and lowest in NW (19.11 mg kg−1). Total calcium and magnesium, essential structural elements for soil aggregation and plant nutrition, remained relatively stable across treatments. Total Ca ranged narrowly from 59.07 to 61.60 mg kg−1 with no significant differences among treatments, indicating that amendment applications did not substantially alter the base cation saturation or carbonate equilibrium in this calcareous desert soil. Total Mg showed modest variation (13.34–14.10 mg kg−1), with NW achieving the highest concentration (13.67 mg kg−1) and CK the lowest (13.34 mg kg−1).

3.1.6. Response of Soil Enzyme Activities

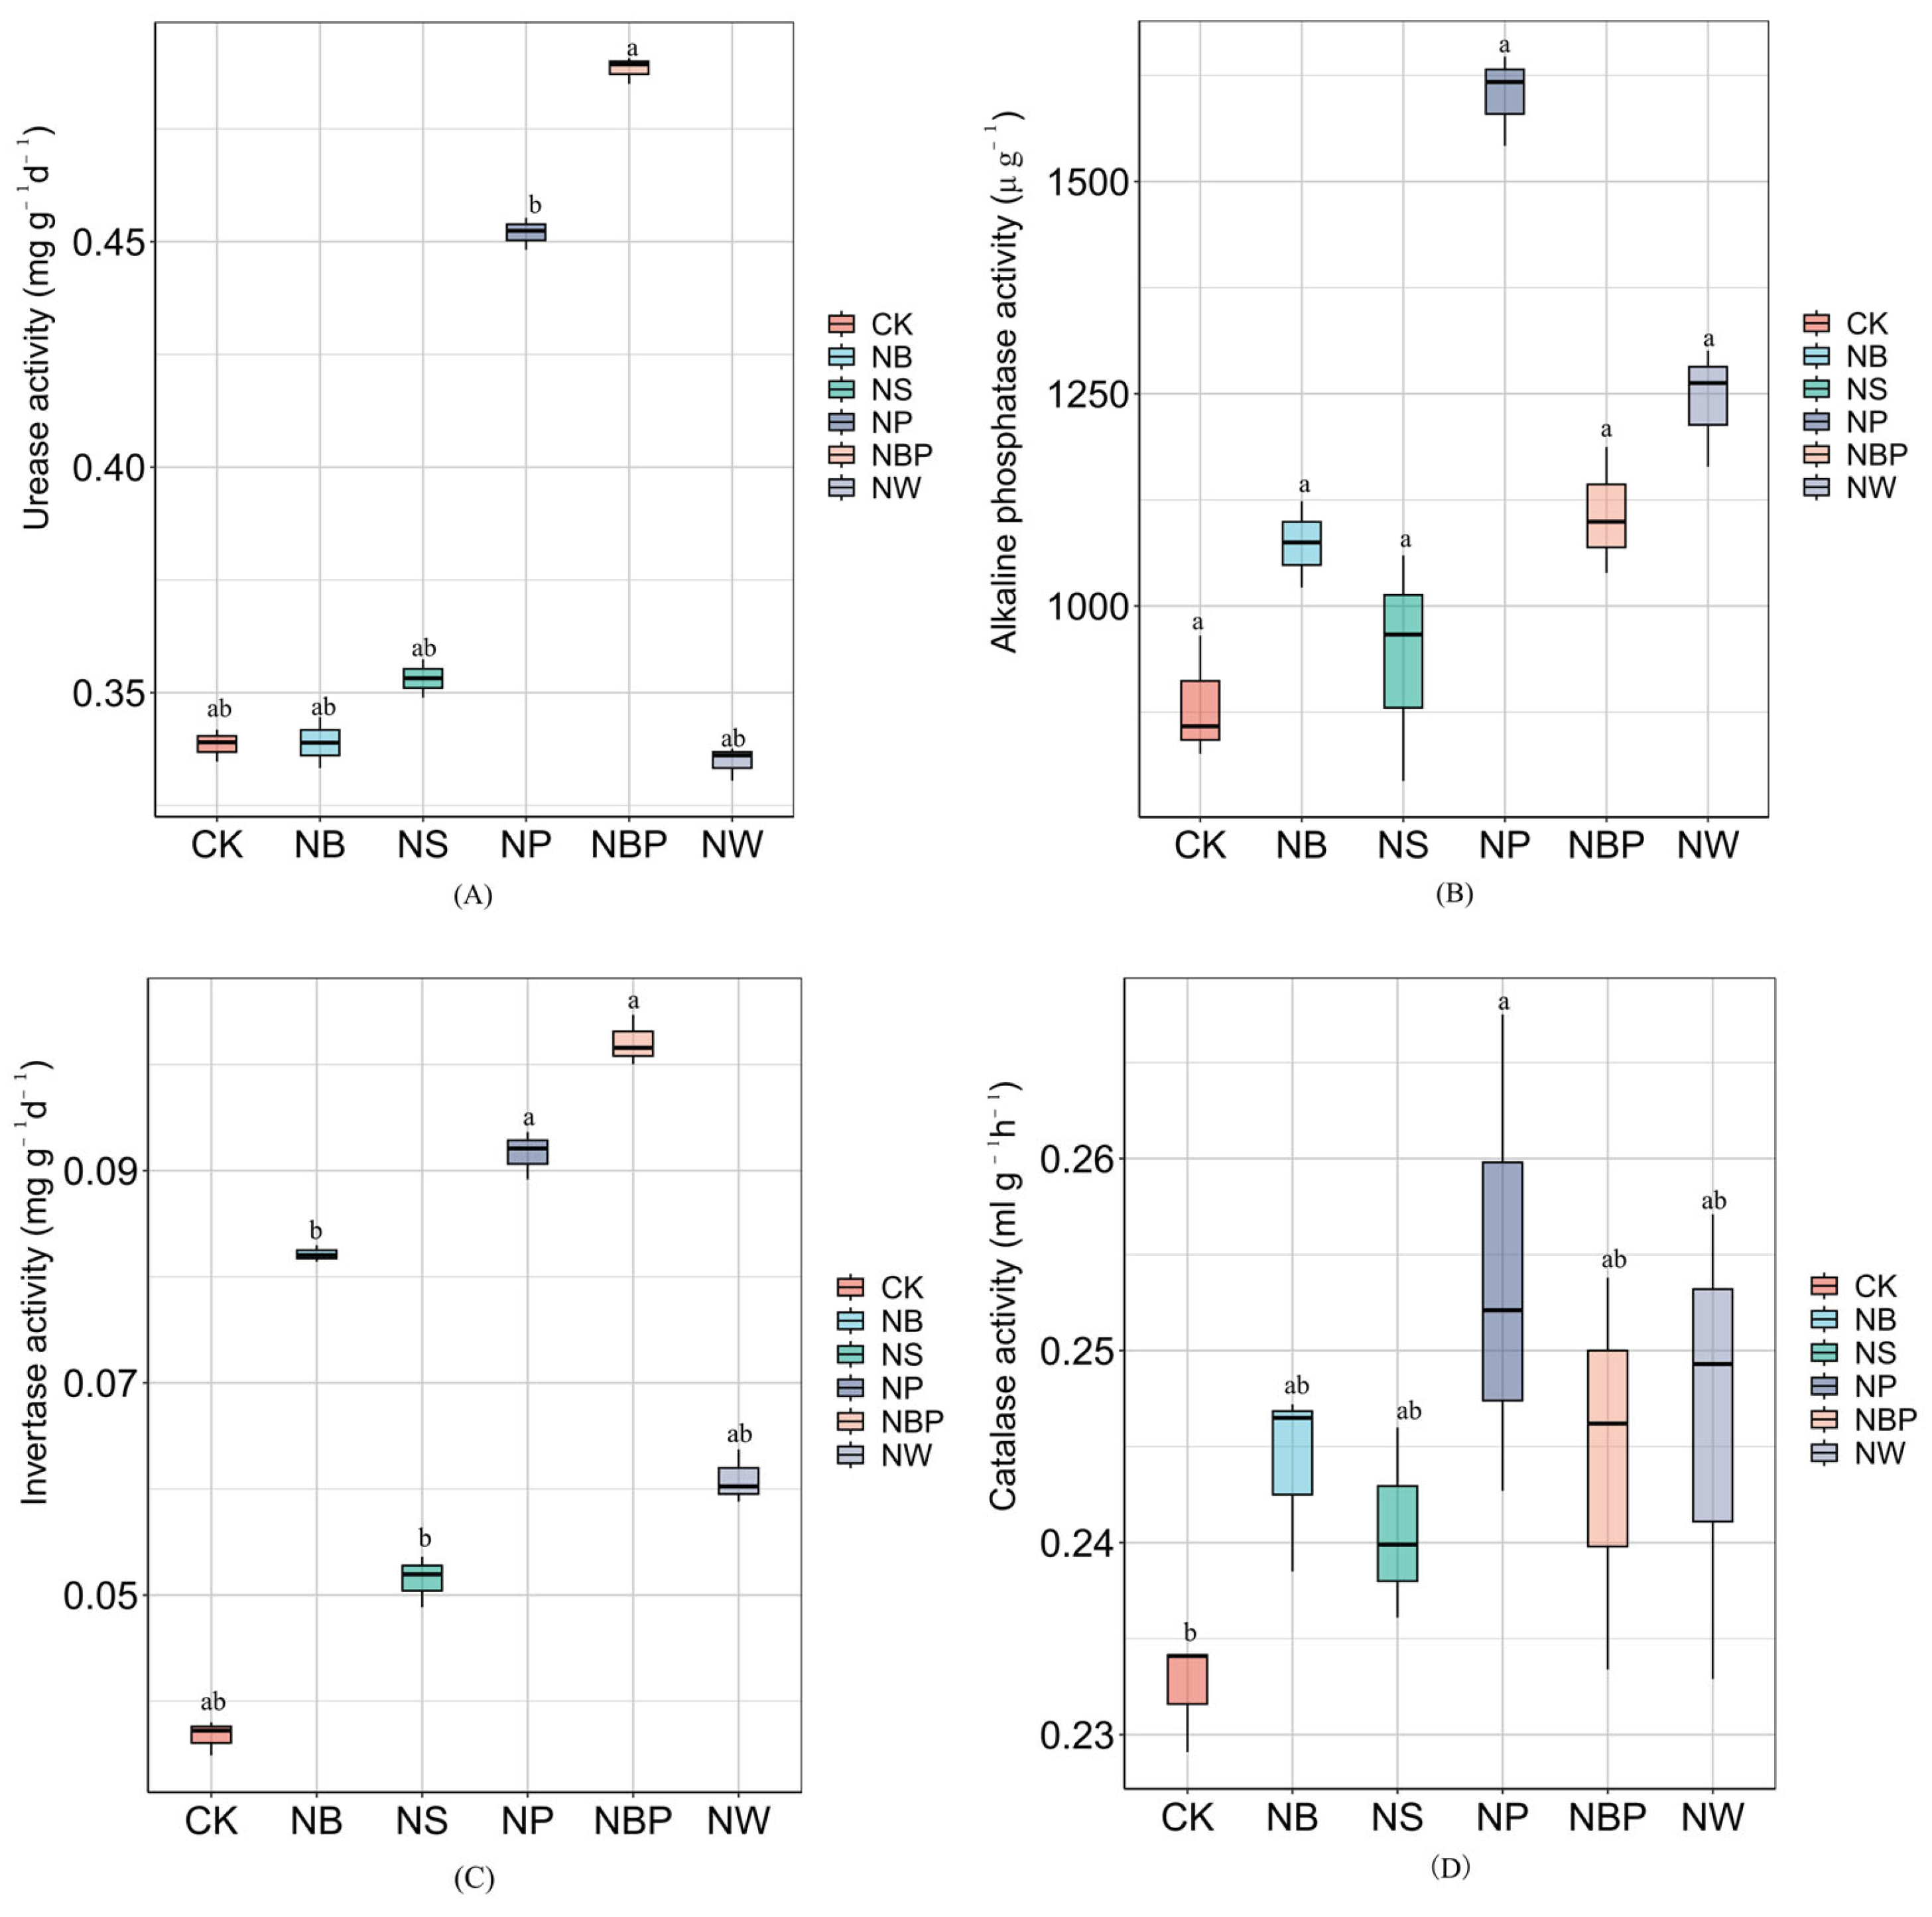
Soil enzyme activities responded differentially to amendment applications (Figure 5A–D). All amendments significantly enhanced invertase activity compared with CK (0.0367 mg g−1 d−1). The NBP treatment achieved the highest activity (0.1021 mg g−1 d−1), representing a 178% increase over CK. Similarly, NP significantly elevated invertase to 0.0916 mg g−1 d−1. NB, NW, and NS induced moderate enhancements of 124%, 66%, and 40%, respectively.
Urease activity showed significant treatment differentiation, but with distinct patterns from invertase. Only NBP and NP significantly enhanced urease activity to 0.4883 and 0.4520 mg g−1 d−1, corresponding to 44% and 34% increases over CK (0.3385 mg g−1 d−1). By contrast, NB, NS, and NW showed no significant effects on urease activity, remaining statistically comparable to the control.
NP dramatically elevated phosphatase activity to 1602.1 μg g−1 h−1, representing an 81% increase over CK (883.2 μg g−1 h−1). NW also significantly enhanced activity to 1242.6 μg g−1 h−1, while NBP induced a modest but significant increase to 1108.5 μg g−1 h−1. NB and NS failed to significantly alter phosphatase activity compared with CK. Remarkably, catalase activity ranged from 0.2325 mL g−1 h−1 in CK to 0.2541 mL g−1 h−1 in NP. This suggests that amendment applications did not significantly alter soil oxidative status or hydrogen peroxide metabolism in this desert soil system.

3.2. Yield Responses to Amendment Applications

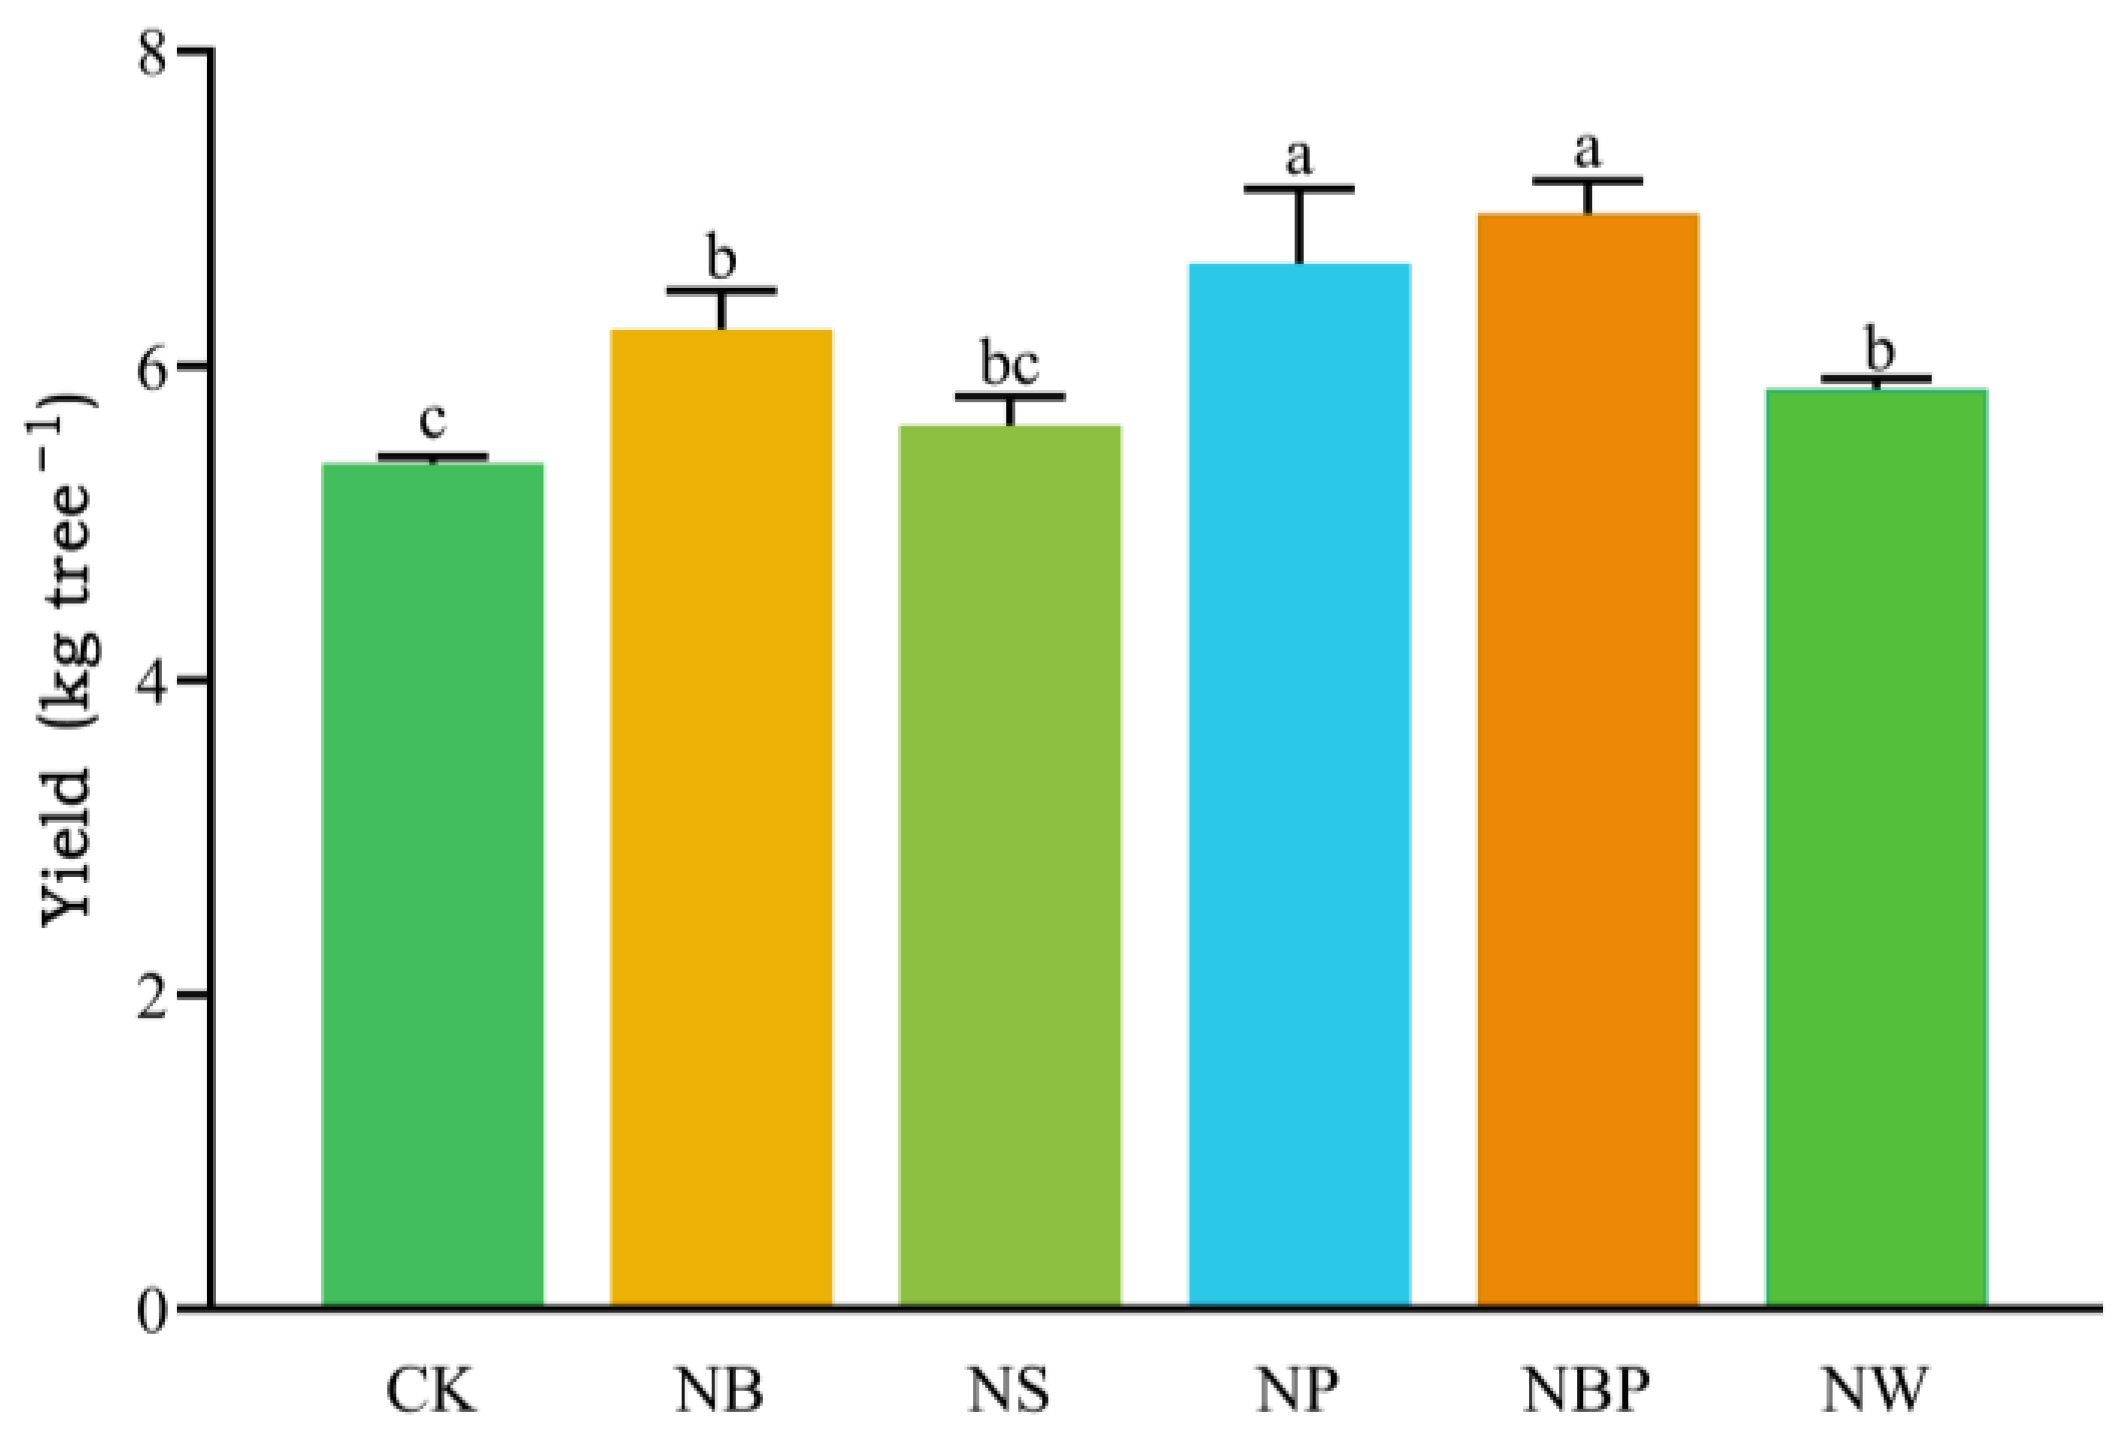
Amendment applications significantly influenced jujube fruit yield, with distinct treatment effects observed at both individual tree and per-hectare scales (Figure 6). The NBP treatment achieved the highest yield, reaching 7.138 kg per tree, corresponding to 479.67 kg per mu. Similarly, the NP treatment significantly elevated yield to 6.838 kg per tree (459.51 kg per mu). The NB treatment and NW treatment achieved intermediate yields of 6.069 kg per tree (407.84 kg per mu, 12.2% increase) and 5.871 kg per tree (394.53 kg per mu, 8.5% increase), respectively. Both treatments significantly outperformed the control, but showed no significant difference from each other. By contrast, the NS treatment exhibited the lowest yield response among all amendments, reaching only 5.639 kg per tree (378.94 kg per mu, 4.3% increase).

3.3. Effects of N Fertilizer Combined with Soil Amendments on Soil Microbial Community Structure

3.3.1. Patterns of Bacterial Alpha Diversity

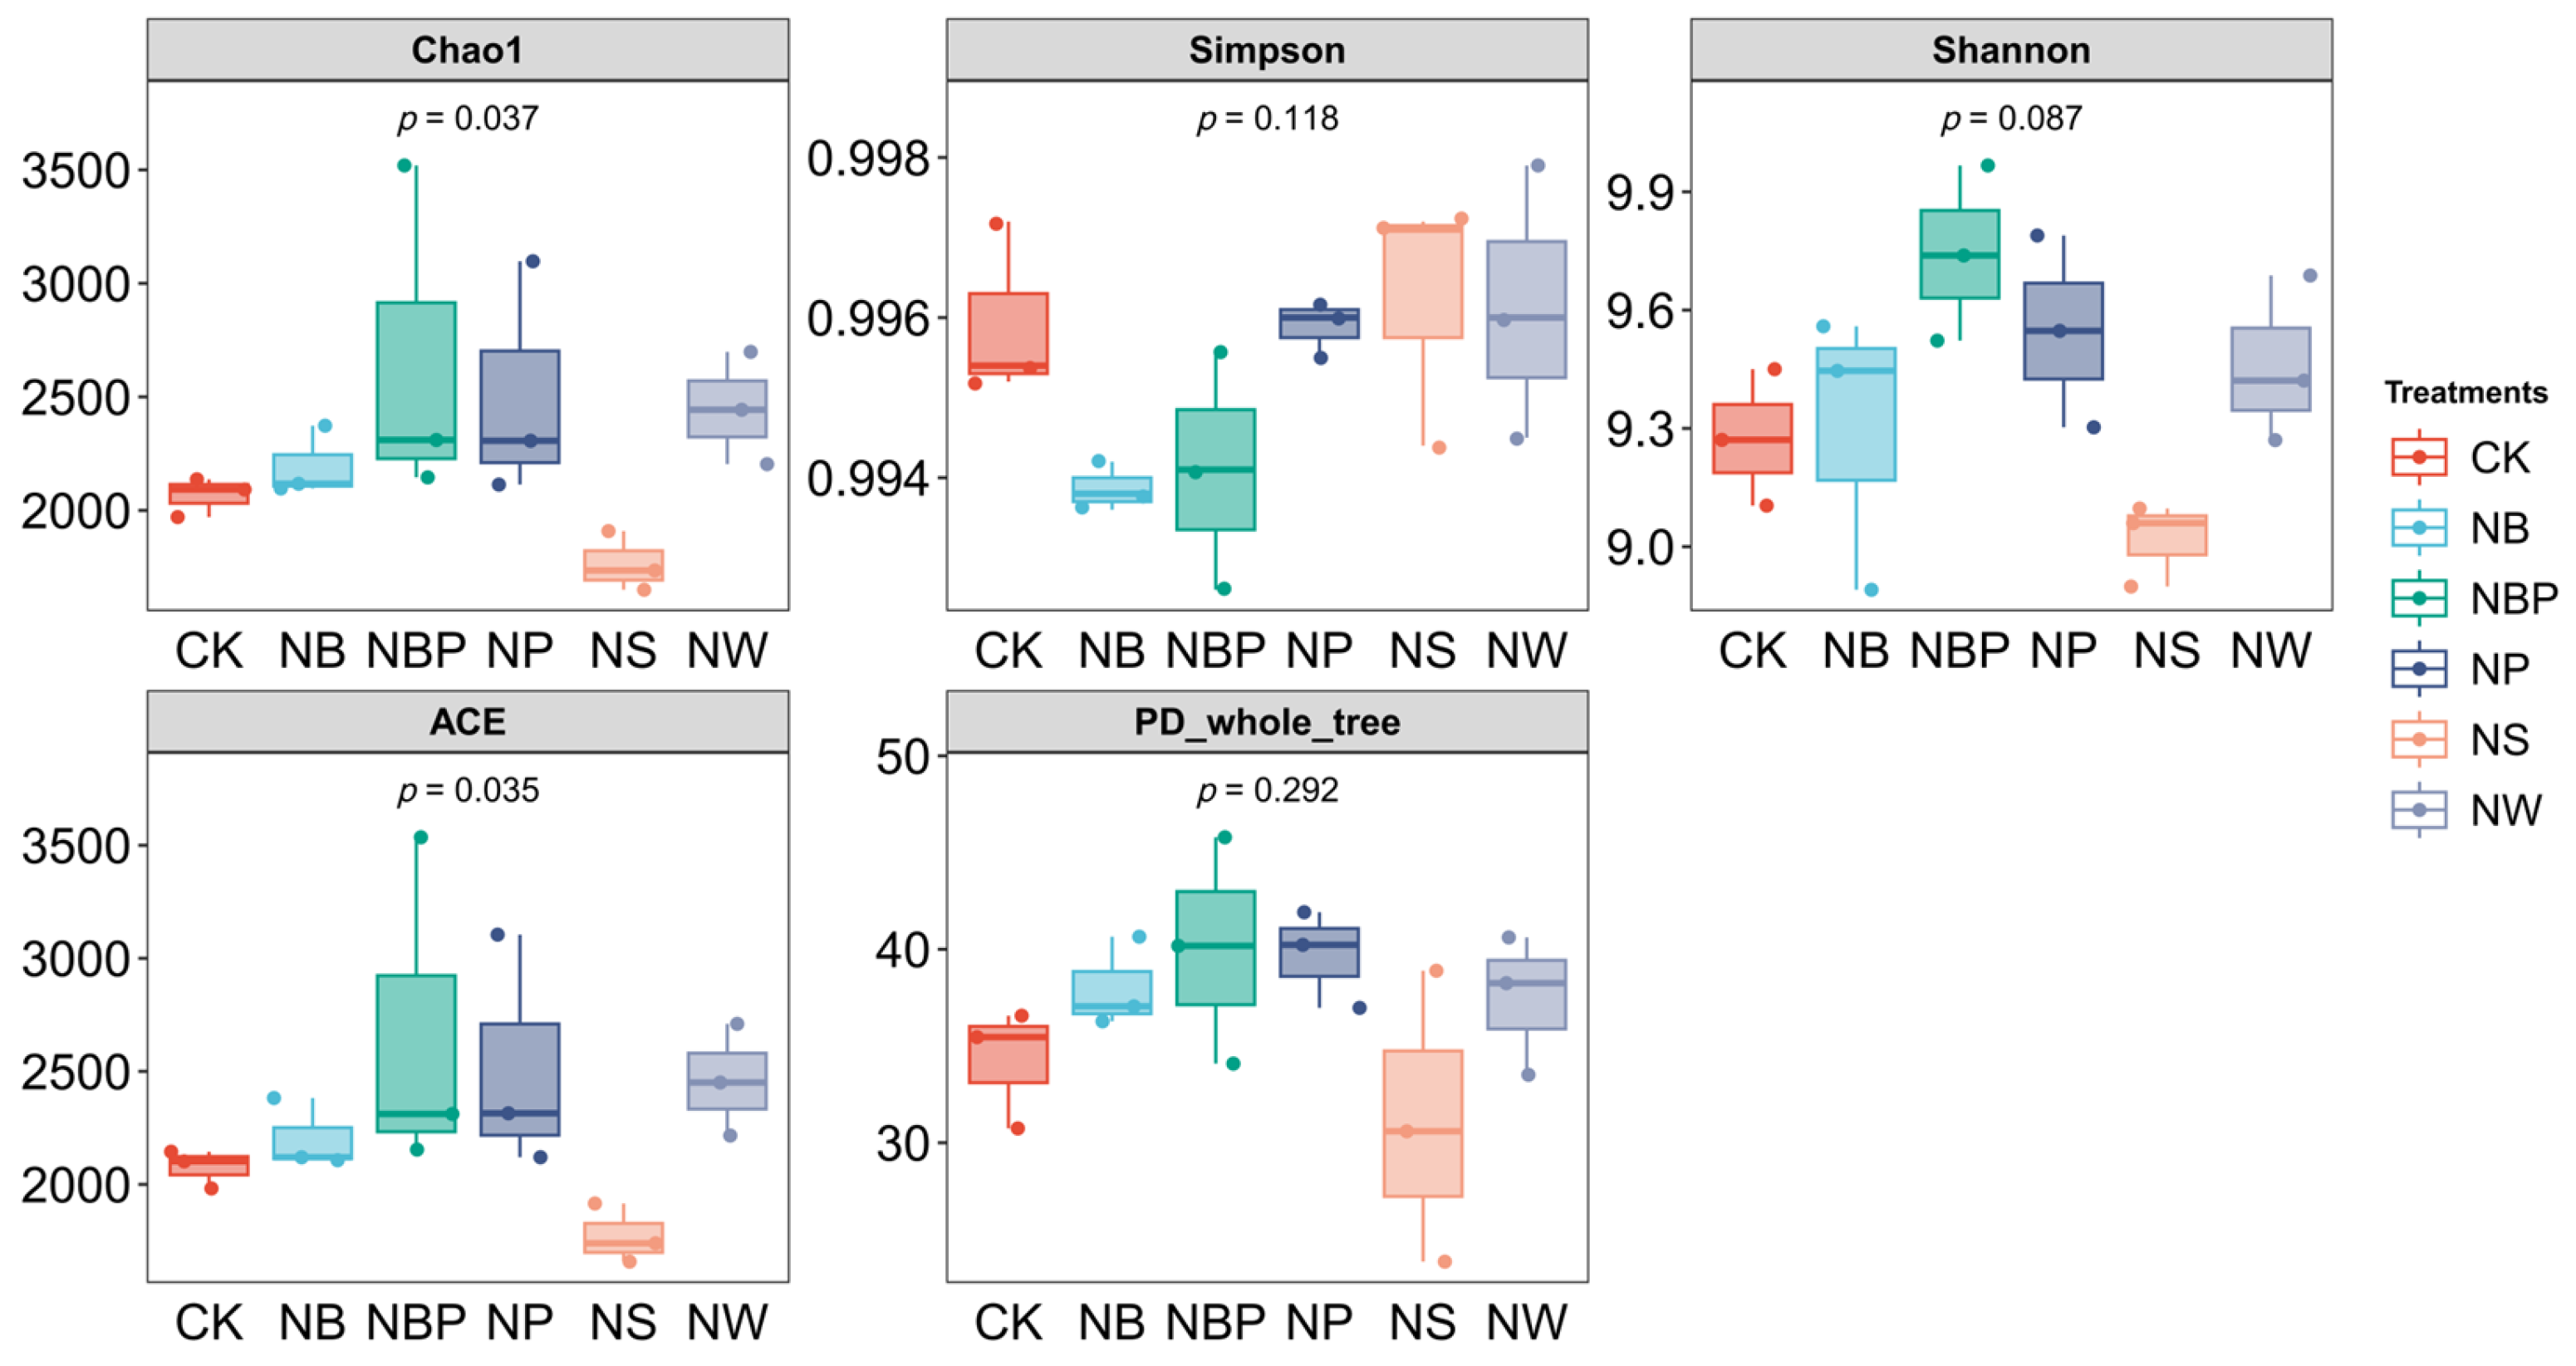
Soil amendment applications induced significant shifts in bacterial community diversity (Figure 7). The Shannon index, reflecting both species richness and evenness, showed significant treatment effects, NBP exhibited the highest Shannon diversity (9.74), significantly surpassing NS (9.0). The NP and NW treatments achieved intermediate diversity levels (9.55 and 9.46, respectively), whereas NB (9.30) remained comparable to CK (9.28). Notably, NS displayed the lowest Shannon index among all treatments, suggesting potential inhibitory effects of graphene on bacterial community diversity in desert soils. Community richness indices (Chao1 and ACE) showed positive response, NBP demonstrated the highest mean richness values (Chao1: 2658; ACE: 2667), followed by NP (2506 and 2513) and NW (2448 and 2459), all exceeding CK (2066 and 2076). Conversely, NS exhibited the lowest richness (Chao1: 1765; ACE: 1771), approximately 15% lower than CK.
The Simpson index, measuring community dominance, showed no significant treatment differences, with all values ranging narrowly from 0.9939 to 0.9962. This indicates uniformly high evenness across treatments, suggesting that amendment applications altered community composition without promoting specific dominant taxa. Phylogenetic diversity (PD_whole_tree) followed patterns similar to taxonomic diversity indices. NBP achieved the highest PD value (40.02), followed by NP (39.71) and NB (37.99), whereas NS exhibited the lowest (31.11). Notably, while NBP exhibited the highest Shannon diversity, SEM analysis revealed that diversity per se had no direct effect on yield (β = −0.087, p > 0.05), suggesting that specific functional recruitment rather than general diversity enhancement mediated the observed productivity gains.

3.3.2. Amendment-Driven Restructuring of Bacterial Community Composition

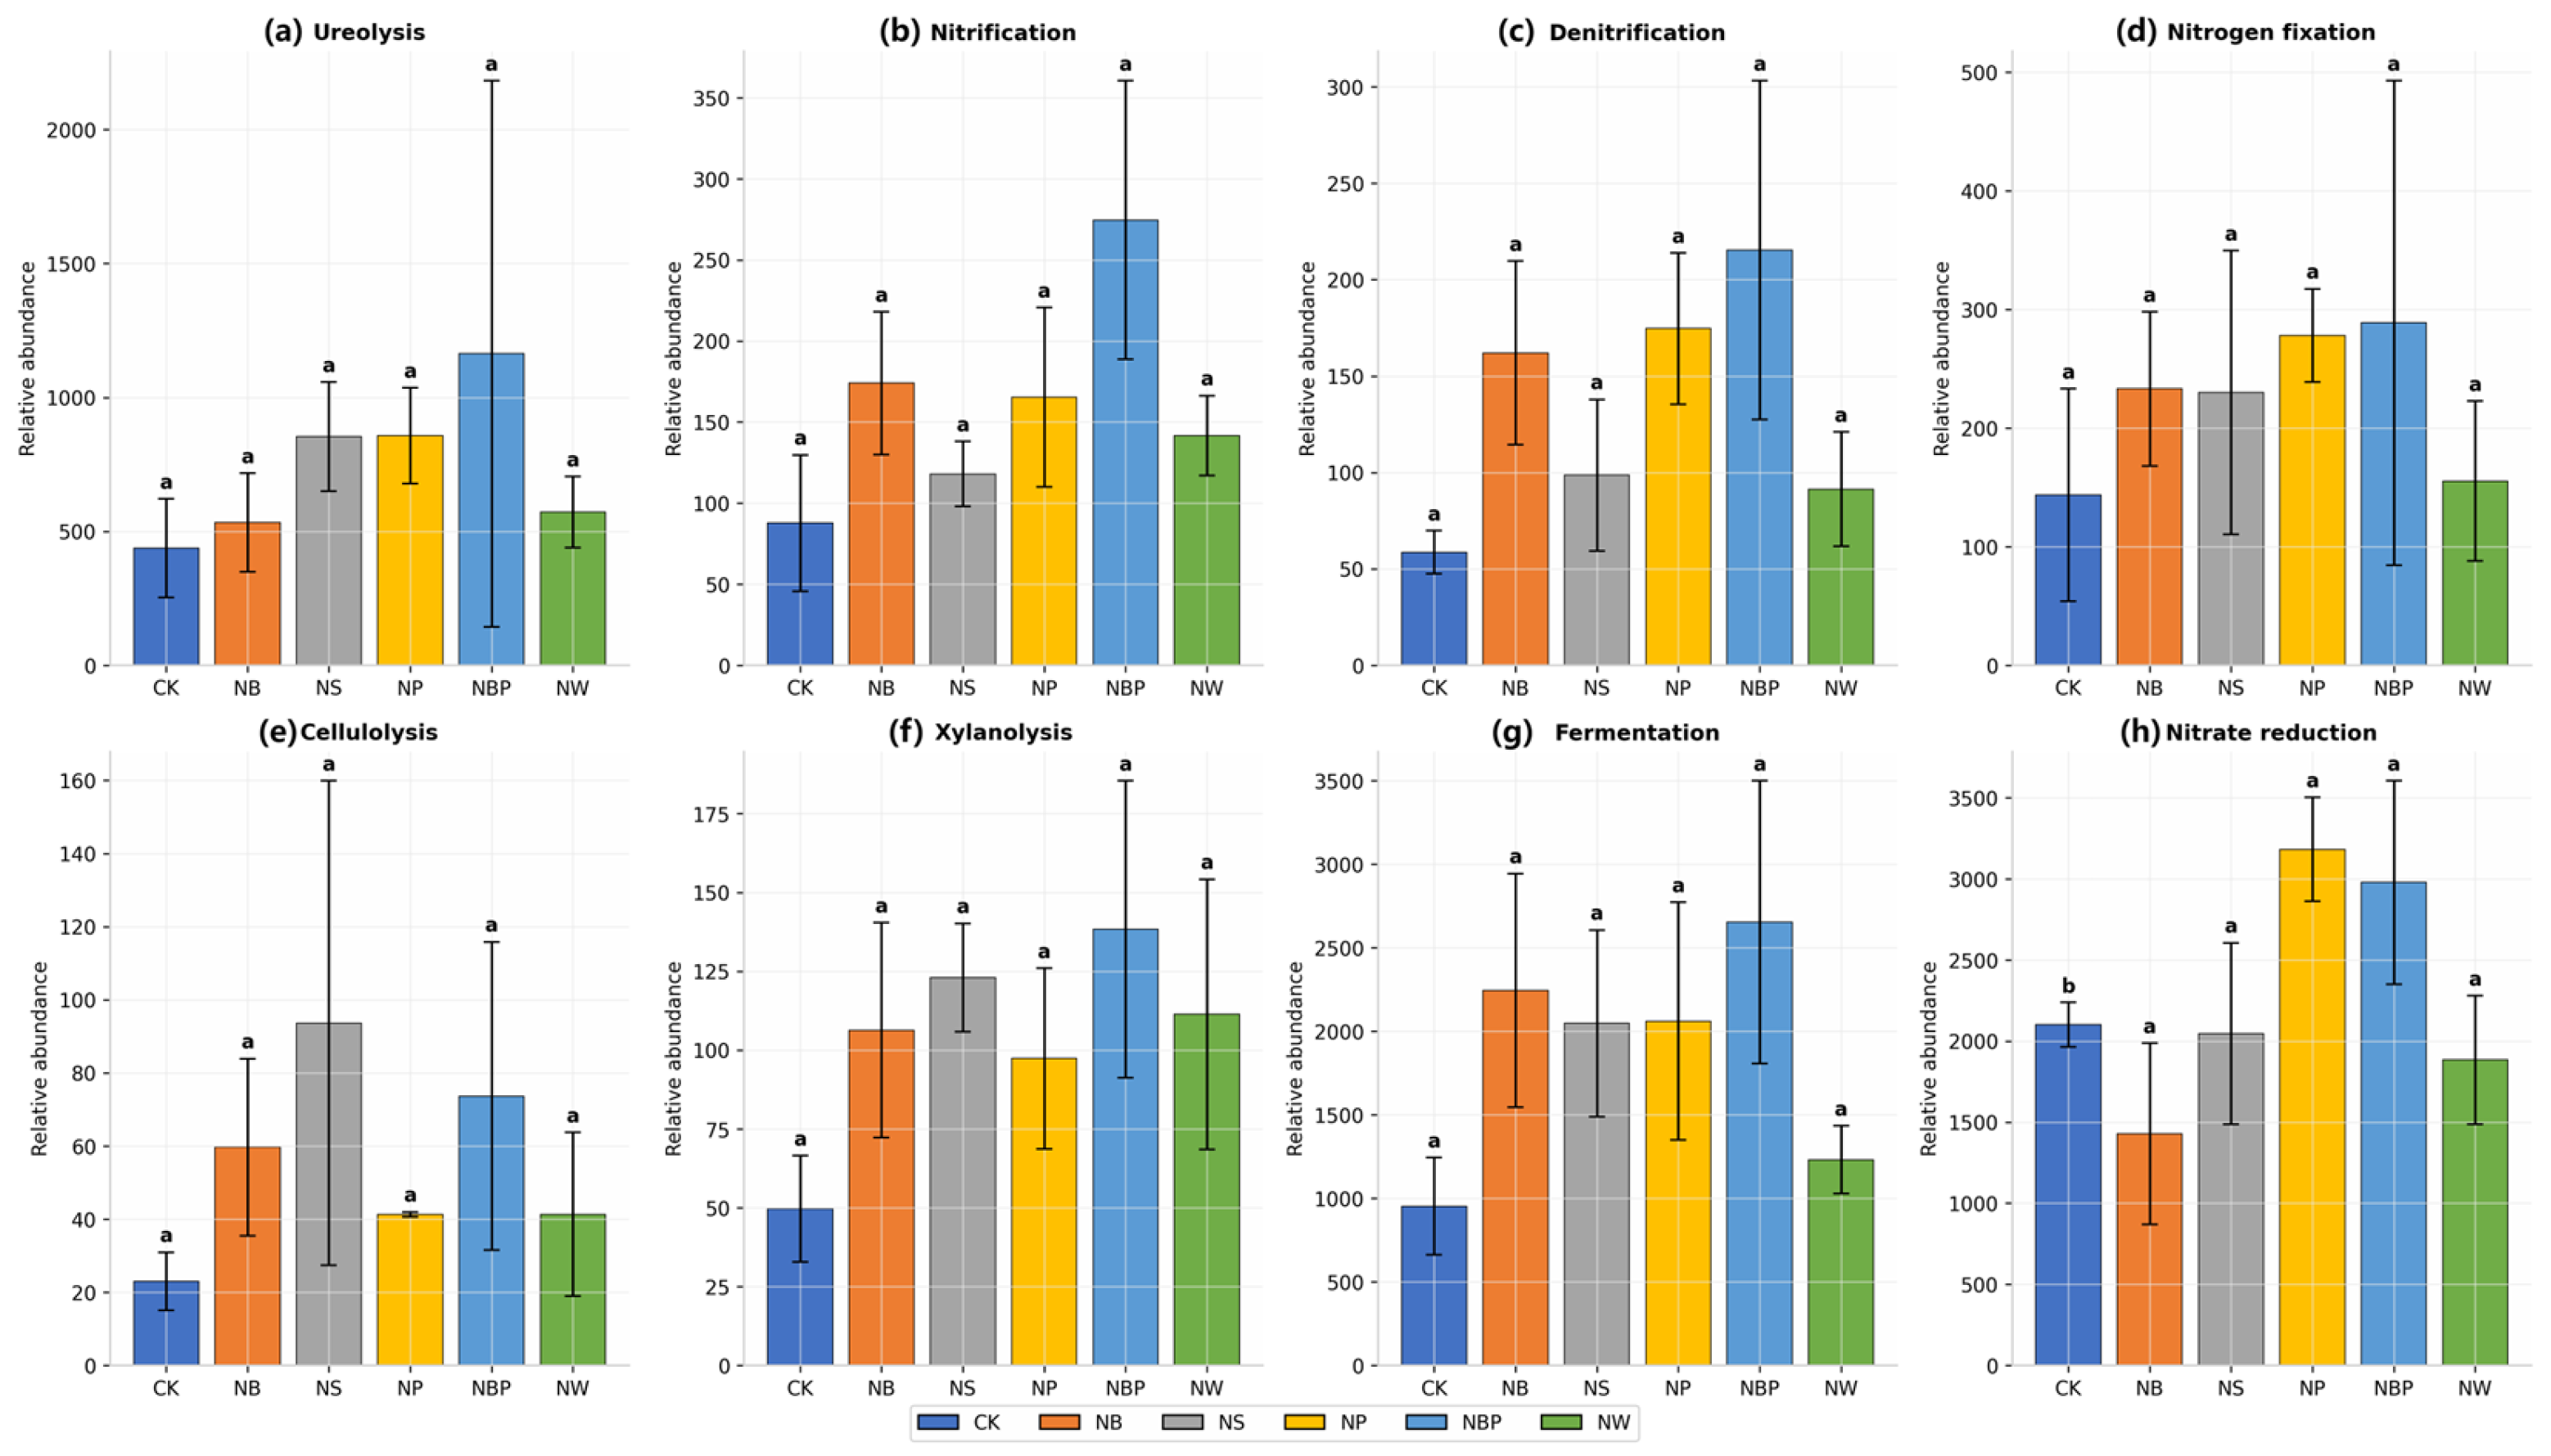
OTUs analysis revealed that NBP treatment significantly enriched bacterial taxa, harboring 64% more OTUs than the control (Figure S1). Principal coordinate analysis further demonstrated that amendment treatments induced significant restructuring of bacterial community composition (PERMANOVA: F = 1.233, R2 = 0.339, p < 0.01; Figure S2). Notably, despite differing amendment strategies, NBP and NW treatments converged toward similar community configurations, clustering distinctly from the control. This structural convergence aligns with their comparable yield responses (Figure 6) and shared enrichment of N-cycling functional genes (Figure 8), suggesting that distinct amendment approaches can recruit functionally equivalent microbial communities to enhance nutrient cycling potential.

3.3.3. Functional Restructuring of Bacterial Communities at Phylum Level

Phylum-level analysis revealed that amendments specifically enriched functional guilds associated with nutrient cycling rather than inducing random community changes (Figure S3). NBP treatment significantly recruited carbon-decomposing consortia, including Actinobacteriota and Bacteroidota (43% and 77% increases, respectively), corresponding with the concurrently elevated invertase activity (178% increase; Figure 5) and organic matter turnover. Concurrently, N-cycling Proteobacteria increased by 27% under NBP (21.17% vs. 16.64% in CK), aligning with enhanced urease activity and available nitrogen pools (Figure 4 and Figure 5). Notably, Gemmatimonadota, a phylum associated with phosphate solubilization, showed consistent enrichment across amendments (64% increase in NB), corroborating the substantial elevation of available phosphorus under NBP and NP treatments (Figure 4). By contrast, NS exhibited minimal enrichment of these functional groups, consistent with its limited effects on soil enzyme activities and nutrient availability.

3.3.4. Predicted Functional Gene Abundances via FAPROTAX

To assess the functional potential of soil bacterial communities, FAPROTAX analysis was conducted to predict the abundance of ecologically relevant functional genes (Figure 8). Eight key functions associated with nutrient cycling were evaluated, including ureolysis, nitrification, denitrification, N fixation, cellulolysis, xylanolysis, fermentation, and nitrate reduction. The NBP treatment was predicted to harbor the highest abundance of ureolysis genes (1163 gene copies), representing a putative 2.7-fold increase compared to the control (437 gene copies). This trend was consistent with the significantly enhanced soil urease activity observed in the NBP treatment, suggesting that the combined application of biochar and bentonite may improve N mineralization potential in desert jujube orchard soils. Similarly, fermentation-related genes were predicted to be most abundant in the NBP treatment (2654 gene copies), followed by the NP treatment (2061 gene copies) and the NS treatment (2047 gene copies), all of which exhibited predicted abundances higher than the control (953 gene copies). This pattern aligns with the improved carbon cycling capacity observed in amendment treatments. Nitrification genes also showed predicted elevated abundance in the NBP treatment (275 gene copies) compared to the control (88 gene copies). In contrast, predicted nitrate reduction gene abundances displayed a different pattern, with the NP treatment showing the highest abundance (3182 gene copies), followed by the NBP treatment (2979 gene copies). Notably, the control treatment was predicted to have significantly lower nitrate reduction gene abundance compared to NP, NBP, and NS treatments (Figure 8h). It is important to note that FAPROTAX provides predictions of metabolic potential based on taxonomic assignments rather than direct measurements of functional genes. While the predicted 2.7-fold increase in ureolysis gene abundance aligns with the observed 44% increase in urease enzyme activity (Figure 5), these predictions should be interpreted as indicative of functional potential rather than confirmation of actual gene expression or enzymatic rates. Direct validation through quantitative PCR of marker genes (e.g., ureC) or metagenomic sequencing would be required to confirm these predictions.

3.4. Effects of N Fertilizer Combined with Soil Amendments on Soil–Microbe–Yield Relationships

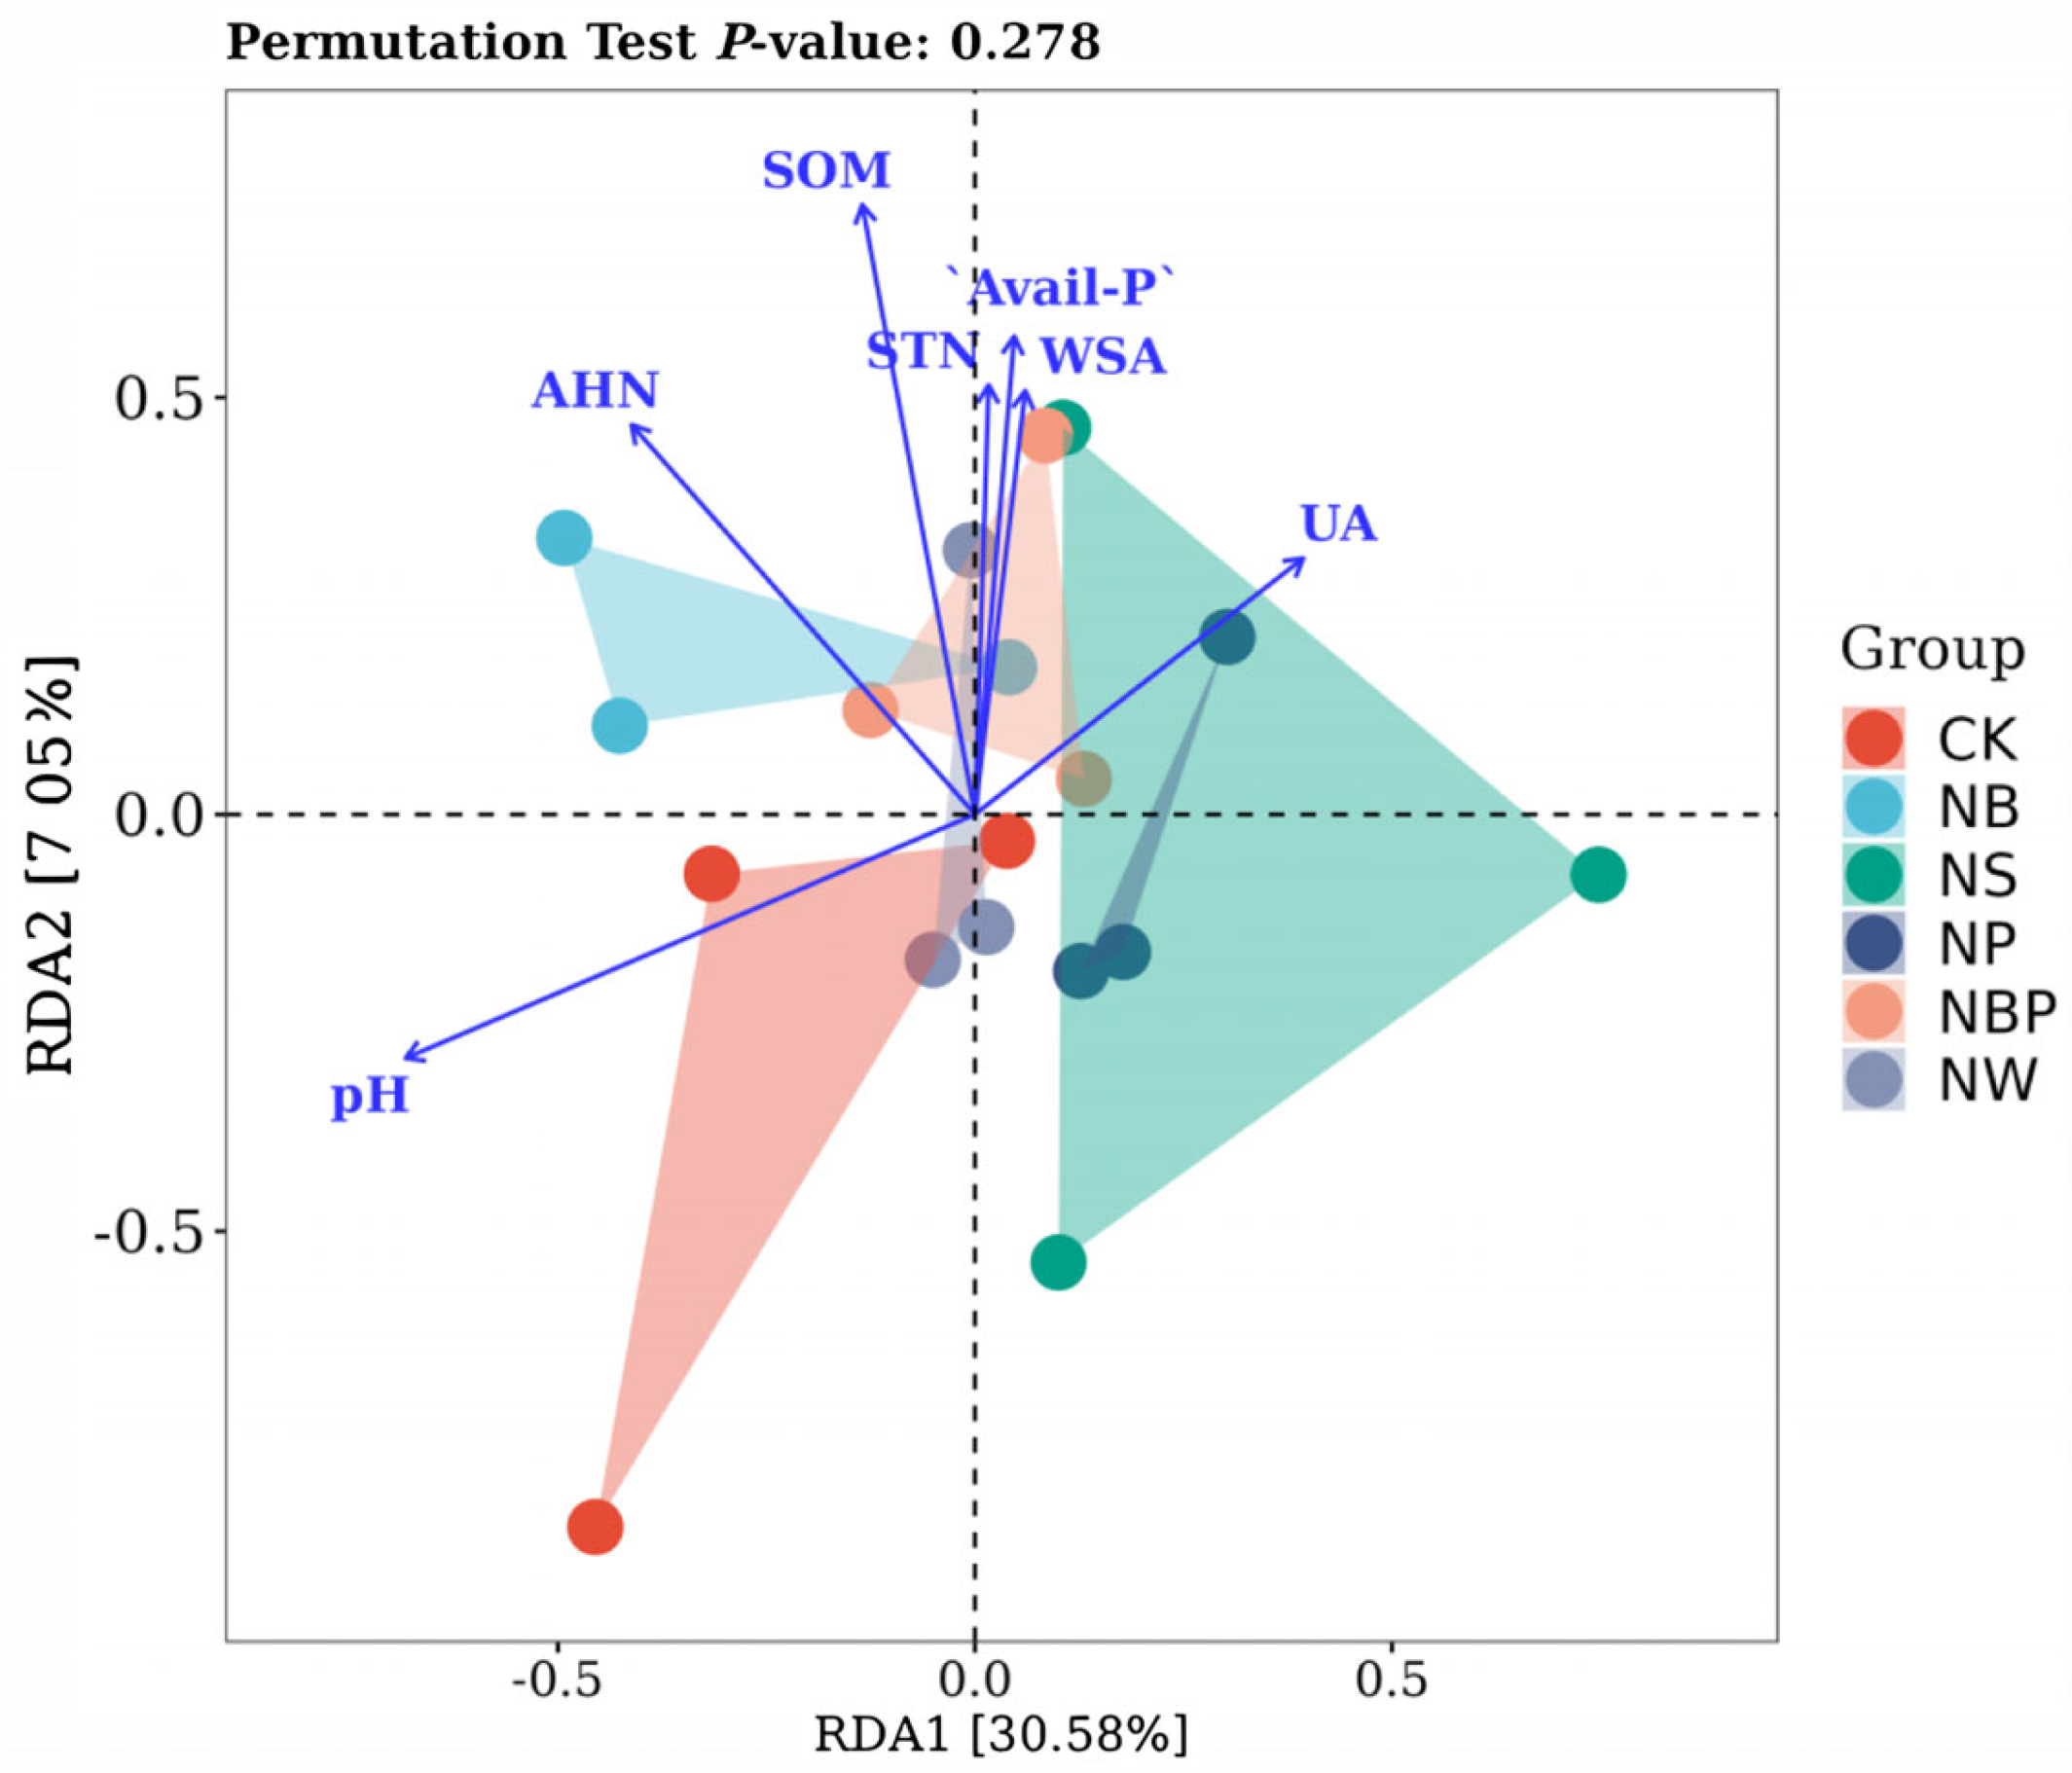
3.4.1. Exploratory Identification of Environmental Drivers

To identify environmental filters shaping the above community restructuring prior to path validation, RDA was conducted as an exploratory approach (Figure 9). The first two axes explained 37.6% of community variation, with pH and SOM emerging as primary gradients separating treatments. CK clustered with higher pH, while NBP and NW aligned with elevated SOM, AHN, and UA, suggesting these edaphic factors drive the functional recruitment observed in Section 3.3.3. Although the overall RDA model was not statistically significant (permutation test, p = 0.278), the observed gradients provided the foundational hypotheses subsequently tested in the SEM framework, where direct vs. indirect pathways were formally validated.

3.4.2. Correlation Analyses Between Soil Physicochemical Properties and the Community Structures of Bacterial Assemblages

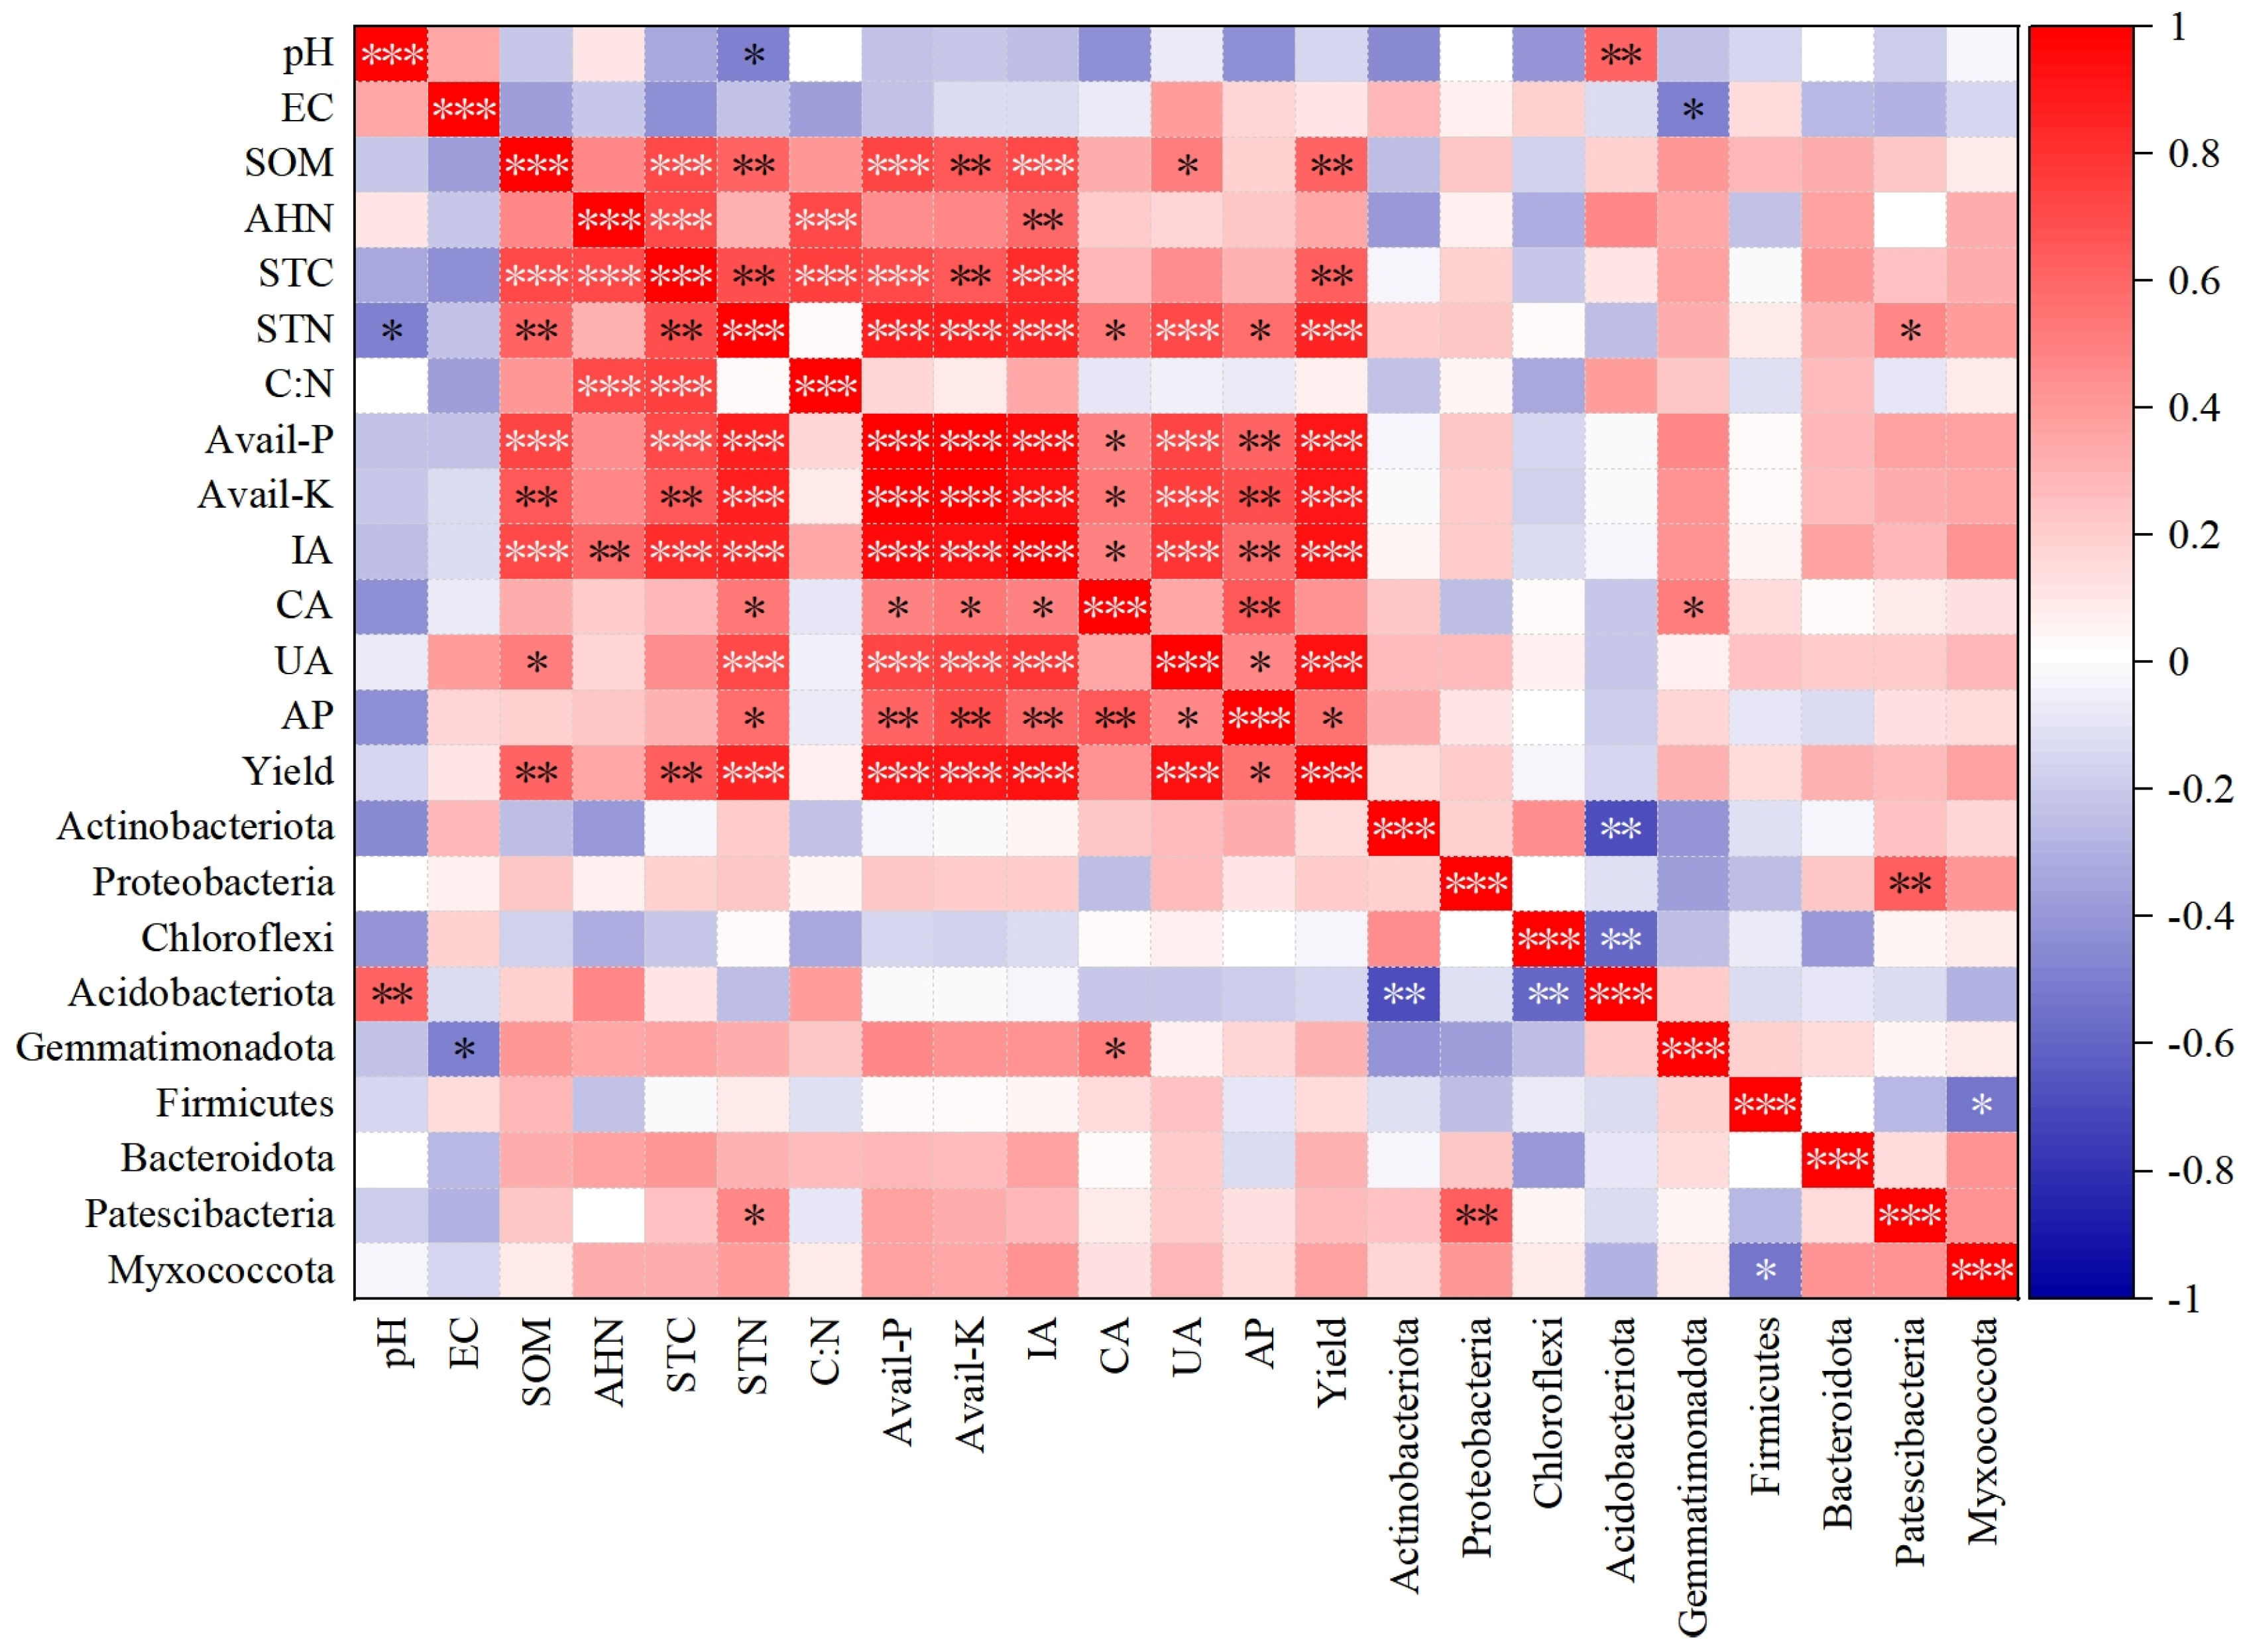
Pearson correlation analysis was performed to examine relationships between soil edaphic factors and bacterial phyla (Figure 10). Following Benjamini–Hochberg FDR correction to account for multiple comparisons (253 tests), only correlations with q-values < 0.05 were considered significant. The analysis revealed strong correlations among soil nutrient availability indicators: available P was highly correlated with available K (r = 0.987, q < 0.001), invertase activity (r = 0.949, q < 0.001), and yield (r = 0.911, q < 0.001). Similarly, urease activity showed strong correlation with yield (r = 0.933, q < 0.001). However, none of the correlations between bacterial phyla and soil properties survived the stringent FDR correction (all q > 0.05), suggesting that the observed taxonomic shifts, while functionally relevant, did not exhibit statistically robust linear relationships with individual edaphic parameters at the phylum level.

3.4.3. SEM-Based Pathway Analysis of Amendment Effects on Crop Yield

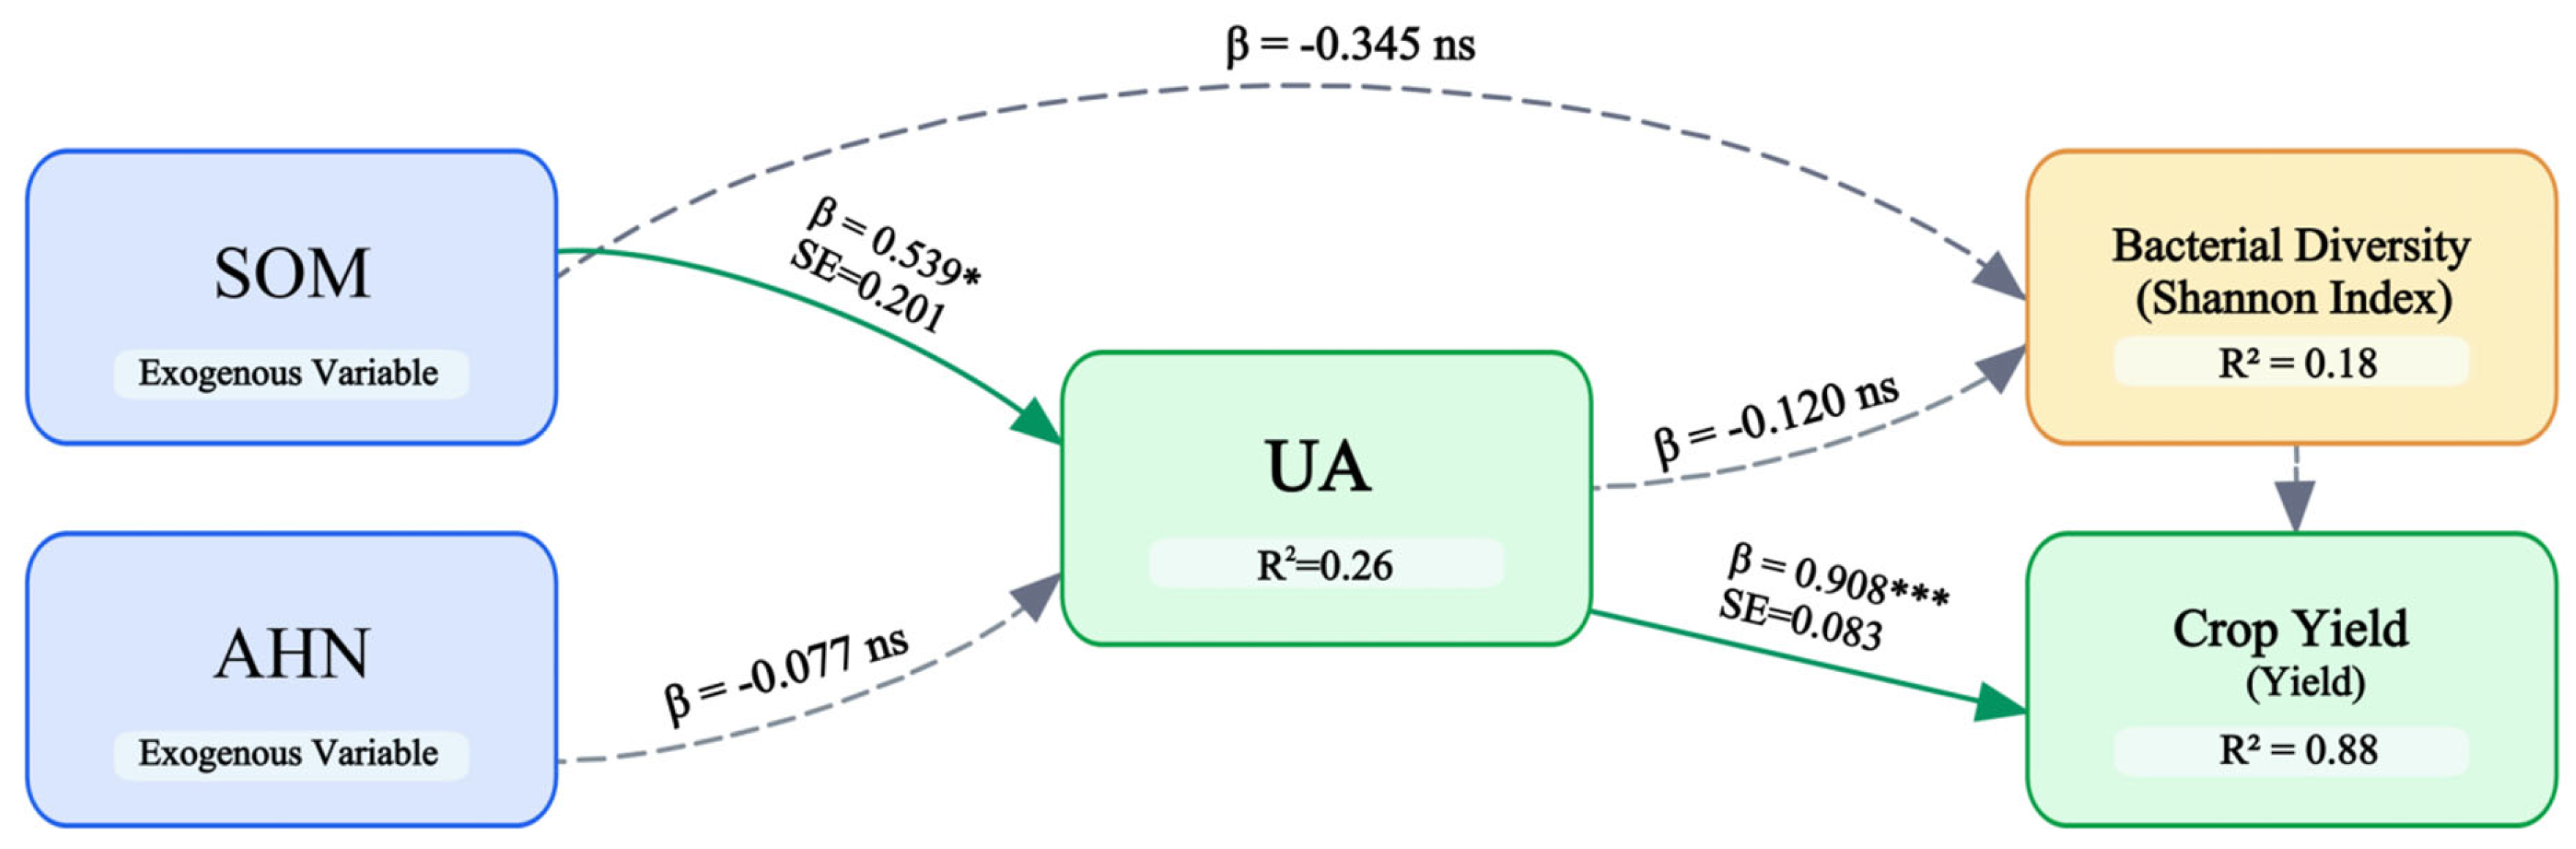
SEM was employed to disentangle the direct and indirect pathways linking SOM to crop yield through enzyme-mediated nutrient cycling and bacterial community regulation (Figure 11). The hypothesized model achieved acceptable fit to the observed data (χ2 = 7.508, df = 3, p = 0.057; Fisher’s C = 12.128, p = 0.059; AIC = 122.425), explaining 88% of the variance in crop yield (R2 = 0.88), 26% of urease activity (R2 = 0.26), and 18% of bacterial Shannon diversity (R2 = 0.18). Standardized path coefficients revealed that UA served as the primary mediator transmitting SOM effects to crop productivity. SOM exhibited a significant positive direct effect on UA (β = 0.539, SE = 0.201, p < 0.05), indicating that enhanced organic matter availability substantially stimulated N mineralization enzyme activity. In turn, UA demonstrated a strong positive effect on crop yield (β = 0.908, SE = 0.083, p < 0.001), representing the dominant pathway in the model. By contrast, AHN showed no significant direct effect on UA (β = −0.077, p > 0.05), suggesting that in this desert soil system, N availability was primarily regulated through enzymatic mineralization of organic pools rather than inorganic N reserves. Similarly, bacterial Shannon diversity exerted no significant influence on crop yield (β = −0.087, p > 0.05), and UA showed no significant effect on Shannon diversity (β = −0.120, p > 0.05), indicating that bacterial community taxonomic diversity was decoupled from N cycling functionality and crop productivity in this agricultural context.
To ensure robust model selection and address potential omitted variable bias, we compared four alternative SEM specifications using Akaike Information Criterion (AIC; Table S3). While more complex models incorporating additional pathways (e.g., direct SOM→Yield, IA→Yield) exhibited lower AIC values (11.215 and 31.431), they demonstrated significant misspecification (χ2 p < 0.001), indicating overparameterization. The final model achieved the best balance between parsimony and adequate fit. Variance inflation factors (VIFs) calculated for all predictors (SOM: 1.28; AHN: 1.28; UA: 1.34; Shannon: 1.09) were well below the collinearity threshold of 5.0 (and even 2.0), rigorously excluding multicollinearity as an explanation for the strong UA→yield path. While the moderate R2 values for UA (26%) and Shannon diversity (18%) indicate substantial influence of unmeasured factors (e.g., microclimate, root exudates, legacy effects), the high yield variance explained (88%) suggests the specified pathways capture the dominant mechanisms governing productivity in this system.

4. Discussion

4.1. Synergistic Mechanisms of Biochar–Bentonite Co-Application on Soil Physicochemical Properties

The superior performance of NBP in ameliorating multiple soil quality dimensions provides compelling evidence for synergistic interactions between organic and mineral amendments in desert brown soils. Observations that NBP reduced soil bulk density by 8.2% and increased porosity to 54.21% align with the conceptual framework that biochar and bentonite operate through complementary physical mechanisms: biochar contributes macro-porosity through its inherent porous structure (specific surface area typically 150–500 m2g−1), while bentonite enhances micro-aggregate formation and stability through its high cation exchange capacity and swelling clay mineralogy [23,24]. Furthermore, the NBP treatment exhibits water retention that exceeds the additive effects predicted from individual NB and NP applications, indicating that biochar macropores (>50 μm) facilitate rapid infiltration and reduce surface runoff, while bentonite-induced micropores (<2 μm) retain plant-available water through capillary forces [25,26]. In the context of desert agriculture where water scarcity constitutes the primary abiotic constraint, this dramatic enhancement of soil hydraulic properties represents a critical breakthrough for sustainable orchard management.
The differential effects of amendments on soil pH and electrical conductivity reveal distinct chemical mechanisms. NS induced the most pronounced pH reduction (0.71 units), yet failed to improve most other soil quality indicators or crop yield, suggesting that pH modification alone is insufficient for comprehensive soil rehabilitation in alkaline desert systems [27]. By contrast, NB achieved the greatest salinity reduction (67.3% decrease in EC) despite inducing only modest pH changes, potentially through adsorption of sodium and chloride ions onto biochar’s charged functional groups or through promotion of leaching via improved hydraulic conductivity [28,29]. The failure of NP to reduce soil salinity, despite its high cation exchange capacity, may reflect competitive displacement of previously adsorbed cations by calcium and magnesium abundant in this calcareous soil, actually mobilizing salts into soil solution [30].
The soil carbon and N dynamics observed in this study illuminate the mechanistic basis for biochar–bentonite synergy in nutrient cycling. NBP elevated TC by 22.9% while increasing TN by 18.1%, yet maintained a C/N ratio (6.60) comparable to the control, avoiding the N immobilization risks associated with high C/N amendments [31,32]. This balanced nutrient stoichiometry contrasts with NB, which significantly elevated the C/N ratio to 7.14, potentially indicating temporary N sequestration in microbial biomass during biochar colonization [33]. The ability of NBP to enhance both carbon and N stocks proportionally suggests that bentonite facilitates N retention through its cation exchange sites, preventing leaching losses of ammonium while biochar provides stable carbon substrates [34]. Furthermore, the dramatic increases in available phosphorus under NBP (119% increase) and NP (93% increase) cannot be attributed solely to direct phosphorus inputs from amendments, as typical biochar and bentonite contain only modest total phosphorus [35]. While this study focused on fertility and productivity outcomes, future research should evaluate the long-term fate of potential contaminants, including heavy metals, when applying carbonaceous and mineral amendments in arid agroecosystems.

4.2. Bacterial Community Restructuring and Functional Implications of Amendment Applications

The bacterial community responses observed in this study reveal that amendment-induced shifts in taxonomic composition and functional capacity, rather than simple diversity enhancement, constitute the mechanistic basis for improved soil ecosystem functioning. The 64% increase in operational taxonomic unit richness and elevated Shannon diversity (9.74) under NBP treatment align with the habitat heterogeneity hypothesis, which posits that spatially complex substrates—such as biochar’s porous architecture combined with bentonite’s clay microstructures—provide diverse microhabitats supporting taxonomically distinct microbial guilds with complementary ecological functions [19,36]. However, the structural equation modeling results demonstrating no significant effect of Shannon diversity on crop yield (β = −0.087, p > 0.05) challenge simplistic diversity-function paradigms prevalent in soil microbial ecology literature [37,38]. This finding suggests that in highly managed agricultural systems subjected to strong environmental filtering (e.g., fertilization, irrigation, tillage), functional redundancy among taxa may decouple taxonomic diversity from ecosystem-level processes such as nutrient provisioning to crops [39,40].
The selective enrichment of specific bacterial phyla under NBP and NB treatments provides mechanistic insights into the functional reconfiguration of soil microbiomes following amendment applications. Actinobacteriota, which increased 43% under NBP, comprise predominantly aerobic, Gram-positive bacteria renowned for production of diverse extracellular enzymes including cellulases, xylanases, chitinases, and proteases that catalyze decomposition of recalcitrant organic polymers [41]. Concurrently, the 62% enrichment of Chloroflexi under NBP warrants mechanistic consideration given this phylum’s established roles in carbon cycling, aggregate formation, and anaerobic metabolism. Chloroflexi members are known to degrade recalcitrant organic compounds and thrive in micro-aggregates or micro-oxic environments created by biochar–bentonite co-application [42]. The increased soil porosity and water retention observed under NBP (Figure 1) likely created anaerobic microsites within biochar pores and bentonite aggregates, providing favorable habitats for Chloroflexi while simultaneously enhancing carbon sequestration potential through complex organic matter decomposition [43]. The parallel 85% increase in Bacteroidota—specialists in polysaccharide degradation through elaborate carbohydrate-active enzyme systems—further indicates enhanced capacity for organic matter processing [44].
Gemmatimonadota, which showed consistent enrichment across all amendments with highest abundance under NB (64% increase), represents another functionally significant phylum. Recent genomic and physiological studies have revealed that Gemmatimonadota possess phosphate solubilization capabilities through production of organic acids and phosphatases, and exhibit drought tolerance mediated by poly-β-hydroxybutyrate accumulation and exopolysaccharide production [45]. Their negative correlation with electrical conductivity observed in this study (Figure 10) indicates sensitivity to salinity stress, consistent with their ecology as stress-tolerant oligotrophs preferring low-salt conditions [46]. The enrichment of Gemmatimonadota specifically in treatments achieving salinity reduction (NB, NBP) suggests that amelioration of salt stress may indirectly enhance phosphorus cycling capacity through supporting salt-sensitive phosphate-solubilizing taxa.
The FAPROTAX-predicted functional gene abundances provide valuable insights into the metabolic potential of amendment-restructured communities. Nevertheless, the 2.7-fold increase in predicted ureolysis gene abundance under NBP treatment shows remarkable concordance with directly measured urease enzyme activity (44% increase), providing empirical validation of functional predictions. Similarly, the elevated fermentation gene predictions align with increased invertase activity and enhanced SOM decomposition. The distinct pattern of nitrate reduction genes, which peaked under NP rather than NBP, may reflect the specific enrichment of facultative anaerobes in bentonite-treated soils where enhanced water retention creates microsites with reduced oxygen diffusion [47]. This observation highlights an important consideration: while improved water retention benefits plant productivity, it may simultaneously create anaerobic conditions promoting denitrification and gaseous N losses—a potential tradeoff requiring optimization through irrigation management [48].

4.3. Enzyme-Mediated Pathways Linking Soil Organic Matter to Crop Productivity

The SEM result identifying urease activity as the dominant pathway (β = 0.908, p < 0.001) linking SOM to jujube yield illuminates the central role of enzymatic N mineralization in regulating crop productivity in desert agricultural systems. This finding aligns with the conceptual framework that in strongly alkaline, low-organic-matter soils, plant nitrogen availability is primarily governed by the capacity of soil microbiomes to hydrolyze organic N through extracellular enzymes rather than by standing pools of inorganic N [49]. The lack of significant effect of AHN on urease activity (β = −0.077, p > 0.05) supports this interpretation: despite NBP treatment containing elevated available N, the productivity gains derived predominantly from enhanced enzymatic mineralization capacity rather than direct fertilizer N uptake.
Integration of enzyme activity patterns with bacterial community composition data reveals coherent relationships between taxonomic structure and ecosystem functioning. The enrichment of Actinobacteriota and Bacteroidota—both prolific extracellular enzyme producers—in NBP and NB treatments corresponds directly with elevated invertase and urease activities, supporting the inference that taxonomic shifts toward enzyme-producing guilds drive functional changes [50]. However, the lack of correlation between bacterial Shannon diversity and enzyme activities or crop yield indicates that functional capacity depends more on the identity and abundance of specific functional guilds rather than overall community diversity [51]
The exceptionally strong standardized path coefficient from urease activity to yield (β = 0.908) warrants careful interpretation in the context of desert agroecosystem functioning. While such high coefficients may raise concerns regarding collinearity with unmeasured covariates, variance inflation factors (VIF < 1.4 for all predictors) rigorously excluded multicollinearity artifacts. Ecologically, this strong path likely reflects the severe N limitation characteristic of desert brown soils, where urease-mediated N mineralization constitutes the primary bottleneck for plant productivity, thus exhibiting disproportionate influence on yield [52]. Mechanistically, this relationship operates through multiple pathways beyond simple N provisioning. Enhanced N availability supports canopy development, extending the photosynthetically active period and increasing carbon assimilation. Improved N status enhances root growth and architecture, facilitating water and nutrient uptake from deeper soil horizons—particularly critical in water-limited desert environments [53]. Adequate N nutrition strengthens plant resistance to abiotic stresses (drought, salinity, extreme temperatures) prevalent in Xinjiang’s continental climate through synthesis of protective compounds and osmolytes [54]. The magnitude of this effect (standardized coefficient 0.908) substantially exceeds typical soil property–yield relationships reported in meta-analyses (mean effect sizes 0.2–0.4), potentially reflecting the severe N limitation characterizing unamended desert brown soils and the corresponding high marginal returns to N availability enhancement [55].
However, our model explained only 26% of urease activity variance and 18% of bacterial Shannon diversity variance, indicating that unmeasured factors—potentially including soil temperature dynamics, moisture fluctuations, root exudate composition, or legacy effects of historical management—exert substantial influence on these biological variables [56]. Furthermore, for desert jujube orchards and similar arid agricultural systems, soil management strategies should prioritize enhancement of SOM stocks through stable carbon inputs (biochar), nutrient retention capacity via high-CEC minerals (bentonite), and urease-producing microbial populations through appropriate substrate and habitat provisioning. The biochar–bentonite combination achieves all three objectives synergistically, representing a functionally integrated amendment approach superior to single-material applications. However, optimization of application rates, timing (pre-planting incorporation versus top-dressing), and frequency (annual versus multi-year intervals) requires additional research across diverse soil types, climatic zones, and crop species to develop broadly applicable management guidelines [57,58].

5. Conclusions

This study demonstrates that NBP represents the most effective strategy for improving soil quality and increasing jujube yield in desert agroecosystems. The NBP treatment significantly enhanced soil physical structure, nutrient availability, and enzyme activities compared to single amendments or control. Bacterial community analysis revealed increased diversity and enrichment of Actinobacteriota and Proteobacteria under NBP, accompanied by elevated functional gene abundances related to nutrient cycling. SEM identified urease activity as the primary driver of crop productivity, mediating the indirect effects of soil organic matter on yield. Despite limitations including the three-year duration and unexplained variance in biological variables, these findings provide evidence-based guidance for sustainable soil management in arid-region orchards, highlighting the importance of integrated amendment strategies that simultaneously address physical, chemical, and biological soil constraints.

Supplementary Materials

The following supporting information can be downloaded at: https://www.mdpi.com/article/10.3390/agronomy16070694/s1, Table S1: Baseline soil physicochemical properties (0–40 cm) of the desert jujube orchard experimental site; Table S2: Effects of nitrogen fertilizer combined with different soil amendments on soil total elemental concentrationss; Table S3. Comparison of alternative structural equation model specifications; Figure S1. Bacterial community OTU composition across treatments; Figure S2. PCoA of microbial community composition based on Bray–Curtis dissimilarity; Figure S3. Bacterial community composition at phylum level.

Author Contributions

Conceptualization, Y.Z. and C.W.; methodology, H.L. and J.S.; software, Y.W.; validation, Y.W. and Y.M.; formal analysis, Y.W. and S.J.; investigation, Y.W. and H.L.; resources, Y.Z.; data curation, Y.W. and S.J.; writing—original draft preparation, Y.W. and H.L.; writing—review and editing, Y.Z. and C.W.; supervision, Y.Z. and C.W.; funding acquisition, Y.Z. and C.W. All authors have read and agreed to the published version of the manuscript.

Funding

This research was financially supported by the Key areas of science and technology research plan (2023AB004-04) to Y.Y.Z.; Science and Technology Bureau General Research Project (2025DA034); Tarim University-Nanjing Agricultural University Joint Fund project (NNLH202407) to Y.Y.Z.; Reform and Construction of the Grassroots Agricultural Technology Extension System in the Corps (20250069) to C.Y.W.; The Project for the Construction of the Standard System of the Standardized Jujube Garden in Kunyu City (2021011) to C.Y.W.

Data Availability Statement

The data presented in this study are available on request from the corresponding author.

Conflicts of Interest

The authors declare that the research was conducted in the absence of any commercial or financial relationships that could be construed as a potential conflict of interest.

References

  1. Zhao, H.; Lai, H.; Feng, C.; Tian, H. Soil nutrients and actinomycete community composition in saline-alkali desertified areas of Xinjiang. Northwest J. Agric. 2008, 17, 161–166. [Google Scholar]
  2. Zhang, S.; Wang, J.; Cui, Z.; Li, T.; Dong, Z.; Qiao, H.; Li, L.; Wan, S.; Li, X.; Zhang, W.; et al. Jujube–Cotton Intercropping Enhances Yield and Economic Benefits via Photosynthetic Regulation in Oasis Agroecosystems of Southern Xinjiang. Agronomy 2025, 15, 1676. [Google Scholar] [CrossRef] [Scilit]
  3. Clough, T.J.; Condron, L.M.; Kammann, C.; Muller, C.W. A Review of Biochar and Soil Nitrogen Dynamics. Agronomy 2013, 3, 275–293. [Google Scholar] [CrossRef] [Scilit]
  4. Murray, H.H. Traditional and new applications for kaolin, smectite, and palygorskite: A general overview. Appl. Clay Sci. 2000, 17, 207–221. [Google Scholar] [CrossRef] [Scilit]
  5. Agaba, H.; Orikiriza, L.J.B.; Esegu, J.F.O.; Obua, J.; Kabasa, J.D.; Hüttermann, A. Effects of Hydrogel Amendment to Different Soils on Plant Available Water and Survival of Trees under Drought Conditions. CLEAN—Soil Air Water 2010, 38, 328–335. [Google Scholar] [CrossRef] [Scilit]
  6. Hu, X.; Zhou, Q. Health and ecosystem risks of graphene. Chem. Rev. 2013, 113, 3815–3835. [Google Scholar] [CrossRef] [Scilit]
  7. Chen, M.; Zhou, S.; Zhu, Y.; Sun, Y.; Zeng, G.; Yang, C.; Xu, P.; Yan, M.; Liu, Z.; Zhang, W. Toxicity of carbon nanomaterials to plants, animals and microbes: Recent progress from 2015-present. Chemosphere 2018, 206, 255–264. [Google Scholar] [CrossRef] [Scilit]
  8. Zhao, L.; Peralta-Videa, J.R.; Varela-Ramirez, A.; Castillo-Michel, H.; Li, C.; Zhang, J.; Aguilera, R.J.; Keller, A.A.; Gardea-Torresdey, J.L. Effect of surface coating and organic matter on the uptake of CeO2 NPs by corn plants grown in soil: Insight into the uptake mechanism. J. Hazard. Mater. 2012, 225–226, 131–138. [Google Scholar] [CrossRef] [Scilit]
  9. Vessey, J.K. Plant growth promoting rhizobacteria as biofertilizers. Plant Soil 2003, 255, 571–586. [Google Scholar] [CrossRef] [Scilit]
  10. Sharma, S.B.; Sayyed, R.Z.; Trivedi, M.H.; Gobi, T.A. Phosphate solubilizing microbes: Sustainable approach for managing phosphorus deficiency in agricultural soils. SpringerPlus 2013, 2, 587. [Google Scholar] [CrossRef] [Scilit]
  11. Baigorri, R.; Francisco, S.S.; Urrutia, Ó.; García-Mina, J.M. Biochar-Ca and Biochar-Al/-Fe-Mediated Phosphate Exchange Capacity are Main Drivers of the Different Biochar Effects on Plants in Acidic and Alkaline Soils. Agronomy 2020, 10, 968. [Google Scholar] [CrossRef] [Scilit]
  12. Joseph, S.; Cowie, A.L.; Van Zwieten, L.; Bolan, N.; Budai, A.; Buss, W.; Cayuela, M.L.; Graber, E.R.; Ippolito, J.A.; Kuzyakov, Y.; et al. How biochar works, and when it doesn’t: A review of mechanisms controlling soil and plant responses to biochar. GCB Bioenergy 2021, 13, 1731–1764. [Google Scholar] [CrossRef] [Scilit]
  13. Fierer, N. Embracing the unknown: Disentangling the complexities of the soil microbiome. Nat. Rev. Microbiol. 2017, 15, 579–590. [Google Scholar] [CrossRef] [Scilit] [PubMed]
  14. Trivedi, P.; Leach, J.E.; Tringe, S.G.; Sa, T.; Singh, B.K. Plant-microbiome interactions: From community assembly to plant health. Nat. Rev. Microbiol. 2020, 18, 607–621. [Google Scholar] [CrossRef] [Scilit] [PubMed]
  15. Silva, S.D.; Gamage, L.K.H.; Thapa, V.R. Impact of Drought on Soil Microbial Communities. Microorganisms 2025, 13, 1625. [Google Scholar] [CrossRef] [Scilit]
  16. Burns, R.G.; DeForest, J.L.; Marxsen, J.; Sinsabaugh, R.L.; Stromberger, M.E.; Wallenstein, M.D.; Weintraub, M.N.; Zoppini, A. Soil enzymes in a changing environment: Current knowledge and future directions. Soil Biol. Biochem. 2013, 58, 216–234. [Google Scholar] [CrossRef] [Scilit]
  17. Nannipieri, P.; Giagnoni, L.; Renella, G.; Puglisi, E.; Ceccanti, B.; Masciandaro, G.; Fornasier, F.; Moscatelli, M.C.; Marinari, S. Soil enzymology: Classical and molecular approaches. Biol. Fertil. Soils Coop. J. Int. Soc. Soil Sci. 2012, 48, 743–762. [Google Scholar] [CrossRef] [Scilit]
  18. Wang, G.; Gao, Q.; Yang, Y.; Hobbie, S.E.; Reich, P.B.; Zhou, J. Soil enzymes as indicators of soil function: A step toward greater realism in microbial ecological modeling. Glob. Change Biol. 2021, 28, 1935–1950. [Google Scholar] [CrossRef] [Scilit]
  19. Lehmann, J.; Rillig, M.C.; Thies, J.; Masiello, C.A.; Hockaday, W.C.; Crowley, D. Biochar effects on soil biota—A review. Soil Biol. Biochem. 2011, 43, 1812–1836. [Google Scholar] [CrossRef] [Scilit]
  20. Ameloot, N.; Graber, E.R.; Verheijen, F.G.A.; De Neve, S. Interactions between biochar stability and soil organisms: Review and research needs. Eur. J. Soil Sci. 2013, 64, 379–390. [Google Scholar] [CrossRef] [Scilit]
  21. Chapman, S.J. Review of Discovering Statistics Using IBM SPSS Statistics, 4th Edition. J. Polit. Sci. Educ. 2017, 14, 145–147. [Google Scholar] [CrossRef] [Scilit]
  22. Ling, L. Statistical Computing with R (2nd ed.), by Maria L. Rizzo. Boca Raton, FL: Chapman and Hall/CRC Press, 2019, xiv+474 pp., $99.95(H), ISBN: 978-1-46-655332-3. J. Am. Stat. Assoc. 2020, 115, 1557–1558. [Google Scholar]
  23. Gao, Z.; Jian, T.; Zhang, Y.; Lan, M.; Dong, X.; Chen, H.; Yu, Q.; Li, J. Biochar Addition as a Strategy for Increasing Amorphophallus konjac Yield: From the Perspective of Improving Soil Physicochemical Properties and Bacterial Community Diversity. J. Soil Sci. Plant Nutr. 2026, 1–15. [Google Scholar] [CrossRef] [Scilit]
  24. Hussain, M.; Farooq, M.; Nawaz, A.; Al-Sadi, A.M.; Solaiman, Z.M.; Alghamdi, S.S.; Ammara, U.; Ok, Y.S.; Siddique, K.H.M. Biochar for crop production: Potential benefits and risks. J. Soils Sediments 2017, 17, 685–716. [Google Scholar] [CrossRef] [Scilit]
  25. Głąb, T.; Palmowska, J.; Zaleski, T.; Gondek, K. Effect of biochar application on soil hydrological properties and physical quality of sandy soil. Geoderma 2016, 281, 11–20. [Google Scholar] [CrossRef] [Scilit]
  26. Liu, Z.; Dugan, B.; Masiello, C.A.; Gonnermann, H.M. Biochar particle size, shape, and porosity act together to influence soil water properties. PLoS ONE 2017, 12, e0179079. [Google Scholar] [CrossRef] [Scilit]
  27. Edmeades, D.C. The long-term effects of manures and fertilisers on soil productivity and quality: A review. Nutr. Cycl. Agroecosystems 2003, 66, 165–180. [Google Scholar] [CrossRef] [Scilit]
  28. Thomas, S.C.; Frye, S.; Gale, N.; Garmon, M.; Launchbury, R.; Machado, N.; Melamed, S.; Murray, J.; Petroff, A.; Winsborough, C. Biochar mitigates negative effects of salt additions on two herbaceous plant species. J. Environ. Manag. 2013, 129, 62–68. [Google Scholar] [CrossRef] [Scilit]
  29. Lashari, M.S.; Liu, Y.; Li, L.; Pan, W.; Fu, J.; Pan, G.; Zheng, J.; Zheng, J.; Zhang, X.; Yu, X. Effects of amendment of biochar-manure compost in conjunction with pyroligneous solution on soil quality and wheat yield of a salt-stressed cropland from Central China Great Plain. Field Crops Res. 2013, 144, 113–118. [Google Scholar] [CrossRef] [Scilit]
  30. Qadir, M.; Oster, J.D.; Schubert, S.; Noble, A.D.; Sahrawat, K.L. Phytoremediation of Sodic and Saline-Sodic Soils. Adv. Agron. 2007, 96, 197–247. [Google Scholar] [CrossRef] [Scilit]
  31. Bruun, E.W.; Ambus, P.; Egsgaard, H.; Hauggaard-Nielsen, H. Effects of slow and fast pyrolysis biochar on soil C and N turnover dynamics. Soil Biol. Biochem. 2011, 46, 73–79. [Google Scholar] [CrossRef] [Scilit]
  32. Nelissen, V.; Saha, B.K.; Ruysschaert, G.; Boeckx, P. Effect of different biochar and fertilizer types on N2O and NO emissions. Soil Biol. Biochem. 2014, 70, 244–255. [Google Scholar] [CrossRef] [Scilit]
  33. Zimmerman, A.R.; Gao, B.; Ahn, M.-Y. Positive and negative carbon mineralization priming effects among a variety of biochar-amended soils. Soil Biol. Biochem. 2011, 43, 1169–1179. [Google Scholar] [CrossRef] [Scilit]
  34. Laird, D.; Fleming, P.; Wang, B.; Horton, R.; Karlen, D. Biochar impact on nutrient leaching from a Midwestern agricultural soil. Geoderma 2010, 158, 436–442. [Google Scholar] [CrossRef] [Scilit]
  35. Yuan, J.; Xu, R. The amelioration effects of low temperature biochar generated from nine crop residues on an acidic Ultisol. Soil Use Manag. 2011, 27, 110–115. [Google Scholar] [CrossRef] [Scilit]
  36. Quilliam, R.S.; Glanville, H.C.; Wade, S.C.; Jones, D.L. Life in the ‘charosphere’—Does biochar in agricultural soil provide a significant habitat for microorganisms? Soil Biol. Biochem. 2013, 65, 287–293. [Google Scholar] [CrossRef] [Scilit]
  37. Nielsen, U.N.; Ayres, E.; Wall, D.H.; Bardgett, R.D. Soil biodiversity and carbon cycling: A review and synthesis of studies examining diversity–function relationships. Eur. J. Soil Sci. 2011, 62, 105–116. [Google Scholar] [CrossRef] [Scilit]
  38. Delgado-Baquerizo, M.; Maestre, F.T.; Reich, P.B.; Jeffries, T.C.; Gaitan, J.J.; Encinar, D.; Berdugo, M.; Campbell, C.D.; Singh, B.K. Microbial diversity drives multifunctionality in terrestrial ecosystems. Nat. Commun. 2016, 7, 10541. [Google Scholar] [CrossRef] [Scilit]
  39. Louca, S.; Polz, M.F.; Mazel, F.; Albright, M.B.; Huber, J.A.; O’Connor, M.I.; Ackermann, M.; Hahn, A.S.; Srivastava, D.S.; Crowe, S.A.; et al. Function and functional redundancy in microbial systems. Nat. Ecol. Evol. 2018, 2, 936–943. [Google Scholar] [CrossRef] [Scilit]
  40. Allison, S.D.; Martiny, J.B.H. Resistance, Resilience, and Redundancy in Microbial Communities. Proc. Natl. Acad. Sci. USA 2008, 105, 11512–11519. [Google Scholar] [CrossRef] [Scilit]
  41. Barka, E.A.; Vatsa, P.; Sanchez, L.; Gaveau-Vaillant, N.; Jacquard, C.; Klenk, H.-P.; Clément, C.; Ouhdouch, Y.; van Wezel, G.P. Taxonomy, Physiology, and Natural Products of Actinobacteria. Microbiol. Mol. Biol. Rev. MMBR 2016, 80, 1–43. [Google Scholar] [CrossRef] [Scilit]
  42. El-Desouki, Z.; Li, Y.; Abd-Elkader, A.M.; Riaz, M.; Wang, J.; Babar, S.; Wang, X.; Xia, X.; Jiang, C. Alterations of bacterial community related C cycle by affecting soil carbon fractions under aged biochar application. Soil Use Manag. 2024, 40, e13075. [Google Scholar] [CrossRef] [Scilit]
  43. Huang, J.; Zhu, C.; Kong, Y.; Cao, X.; Zhu, L.; Zhang, Y.; Ning, Y.; Tian, W.; Zhang, H.; Yu, Y.; et al. Biochar Application Alleviated Rice Salt Stress via Modifying Soil Properties and Regulating Soil Bacterial Abundance and Community Structure. Agronomy 2022, 12, 409. [Google Scholar] [CrossRef] [Scilit]
  44. François, T.; Jan-Hendrik, H.; Etienne, R.; Mirjam, C.; Gurvan, M. Environmental and gut bacteroidetes: The food connection. Front. Microbiol. 2011, 2, 93. [Google Scholar] [CrossRef] [Scilit] [PubMed]
  45. DeBruyn, J.M.; Nixon, L.T.; Fawaz, M.N.; Johnson, A.M.; Radosevich, M. Global biogeography and quantitative seasonal dynamics of Gemmatimonadetes in soil. Appl. Environ. Microbiol. 2011, 77, 6295–6300. [Google Scholar] [CrossRef] [Scilit]
  46. Zhang, Y.; Shen, H.; He, X.; Thomas, B.W.; Lupwayi, N.Z.; Hao, X.; Thomas, M.C.; Shi, X. Fertilization Shapes Bacterial Community Structure by Alteration of Soil pH. Front. Microbiol. 2017, 8, 1325. [Google Scholar] [CrossRef] [Scilit]
  47. Philippot, L.; Hallin, S.; Schloter, M. Ecology of Denitrifying Prokaryotes in Agricultural Soil. Adv. Agron. 2007, 96, 249–305. [Google Scholar] [CrossRef] [Scilit]
  48. Butterbach-Bahl, K.; Baggs, E.M.; Dannenmann, M.; Kiese, R.; Zechmeister-Boltenstern, S. Nitrous oxide emissions from soils: How well do we understand the processes and their controls? (Review). Philos. Trans. R. Soc. Lond. Ser. B Biol. Sci. 2013, 368, 20130122. [Google Scholar] [CrossRef] [Scilit]
  49. Geisseler, D.; Scow, K.M. Long-term effects of mineral fertilizers on soil microorganisms—A review. Soil Biol. Biochem. 2014, 75, 54–63. [Google Scholar] [CrossRef] [Scilit]
  50. Martina, S.; Lucia, Z.; Beth, L.M.; Robert, B.; Petr, B. Cellulose utilization in forest litter and soil: Identification of bacterial and fungal decomposers. FEMS Microbiol. Ecol. 2012, 80, 735–746. [Google Scholar] [CrossRef] [Scilit]
  51. Peter, H.; Beier, S.; Bertilsson, S.; Lindström, E.S.; Langenheder, S.; Tranvik, L.J. Function-specific response to depletion of microbial diversity. ISME J. 2011, 5, 351–361. [Google Scholar] [CrossRef] [Scilit]
  52. Junwei, H.; Ummehani, H.; Tsegaye, G.M.; Kenneth, D.; Tom, D.S.; Wim, W.; Steven, S.; Stefaan, D.N. Root traits explain multitrophic interactions of belowground microfauna on soil nitrogen mineralization and plant productivity. Soil Biol. Biochem. 2023, 184, 109093. [Google Scholar] [CrossRef] [Scilit]
  53. Meharg, A. Marschner’s Mineral Nutrition of Higher Plants. Exp. Agric. 2012, 48, 305. [Google Scholar] [CrossRef] [Scilit]
  54. Fujita, M.; Alam, M.M.; Roychowdhury, R.; Hasanuzzaman, M.; Nahar, K. Physiological, Biochemical, and Molecular Mechanisms of Heat Stress Tolerance in Plants. Int. J. Mol. Sci. 2013, 14, 9643–9684. [Google Scholar] [CrossRef] [Scilit]
  55. Lai, R. Soil degradation as a reason for inadequate human nutrition. Food Secur. 2009, 1, 45–57. [Google Scholar] [CrossRef] [Scilit]
  56. Grace, J.B.; Anderson, T.M.; Olff, H.; Scheiner, S.M. On the specification of structural equation models for ecological systems. Ecol. Monogr. 2010, 80, 67–87. [Google Scholar] [CrossRef] [Scilit]
  57. Galinato, S.P.; Yoder, J.K.; Granatstein, D. The economic value of biochar in crop production and carbon sequestration. Energy Policy 2011, 39, 6344–6350. [Google Scholar] [CrossRef] [Scilit]
  58. Roberts, K.G.; Gloy, B.A.; Joseph, S.; Scott, N.R.; Lehmann, J. Life cycle assessment of biochar systems: Estimating the energetic, economic, and climate change potential. Environ. Sci. Technol. 2010, 44, 827–833. [Google Scholar] [CrossRef] [Scilit]
Figure 1. Effects of N fertilizer combined with different soil amendments on soil physical properties. (A) Soil bulk density (g cm3); (B) Soil water content (%); (C) Soil porosity (%); (D) Water-stable aggregates (%). Values are means (n = 6). Different lowercase letters within the same column indicate significant differences among treatments at p < 0.05 according to Duncan’s test.
Agronomy 16 00694 g001
Figure 2. Effects of N fertilizer combined with different soil amendments on pH and EC. (A) Soil pH; (B) EC (μS cm−1). Values are means (n = 6). Different lowercase letters within the same column indicate significant differences among treatments at p < 0.05 according to Duncan’s test.
Agronomy 16 00694 g002
Figure 3. Effects of N fertilizer combined with different soil amendments on soil carbon and N pools. (A) Total carbon content (g kg−1); (B) Total nitrogen content (g kg−1); (C) Soil C/N ratio. Values are means (n = 6). Different lowercase letters within the same column indicate significant differences among treatments at p < 0.05 according to Duncan’s test.
Agronomy 16 00694 g003
Figure 4. Effects of N fertilizer combined with different soil amendments on soil available nutrients and organic matter. (A) Available phosphorus (mg kg−1); (B) Available potassium (mg kg−1); (C) Soil organic matter (g kg−1); (D) Alkali-hydrolyzable nitrogen (mg kg−1). Values are means (n = 6). Different lowercase letters within the same column indicate significant differences among treatments at p < 0.05 according to Duncan’s test.
Agronomy 16 00694 g004
Figure 5. Effects of N fertilizer combined with different soil amendments on soil enzyme activities. (A) Soil urease activity (mg g−1 d−1); (B) Soil alkaline phosphatase activity (μg g−1); (C) Soil invertase activity (mg g−1 d−1); (D) Soil catalase activity (ml g−1 h−1). Boxplots display median (horizontal line), interquartile range (box), and data distribution within 1.5× interquartile range (whiskers), with outliers shown as individual points. Colors distinguish treatment groups as per legend (n = 6). Different lowercase letters within the same column indicate significant differences among treatments at p < 0.05 according to Duncan’s test.
Agronomy 16 00694 g005
Figure 6. Effects of N fertilizer combined with different soil amendments on jujube fruit yield. Bars represent mean values (n = 10) with error bars indicating standard deviation. Different lowercase letters above bars denote significant differences among treatments at p < 0.05 according to Duncan’s test.
Agronomy 16 00694 g006
Figure 7. Effects of nitrogen fertilizer combined with different soil amendments on bacterial community alpha diversity. Boxplots display median (horizontal line), interquartile range (box), and data distribution within 1.5× interquartile range (whiskers), with outliers shown as individual points. p-values are indicated above panels. Colors distinguish treatment groups as per legend (n = 3). Statistical analysis employed the Kruskal–Wallis test.
Agronomy 16 00694 g007
Figure 8. FAPROTAX-predicted functional gene abundances across six soil amendment treatments. (a) Ureolysis, (b) Nitrification, (c) Denitrification, (d) Nitrogen fixation, (e) Cellulolysis, (f) Xylanolysis, (g) Fermentation, and (h) Nitrate reduction. Data are presented as mean ± SEM (n = 3). Different lowercase letters indicate significant differences among treatments at p < 0.05 (Duncan’s test).
Agronomy 16 00694 g008
Figure 9. RDA biplot showing the relationships between bacterial community composition (at the phylum level) and soil physicochemical properties. The analysis was based on Bray–Curtis dissimilarity of bacterial communities and seven soil variables: WSA, pH, STN, SOM, AHN, Avail-P, and UA. The first two RDA axes explained 37.6% of the total variation. Arrows indicate the direction and magnitude of environmental gradients.
Agronomy 16 00694 g009
Figure 10. Pearson correlation heatmap showing relationships among soil physicochemical properties and bacterial phyla. p-values from 253 pairwise comparisons were adjusted using the Benjamini–Hochberg false discovery rate method; only correlations with q-values < 0.05 are considered statistically significant (indicated by asterisks: * q < 0.05, ** q < 0.01, *** q < 0.001).
Agronomy 16 00694 g010
Figure 11. Structural equation model illustrating the pathways linking soil organic matter to crop yield through enzyme activity and bacterial diversity. SEM showing standardized path coefficients (β) among soil properties (exogenous variables: SOM and AHN), UA, bacterial Shannon diversity, and crop yield (endogenous variables). Solid green arrows indicate significant positive pathways (p < 0.05), dashed gray arrows indicate non-significant pathways (p ≥ 0.05). Arrow width is proportional to the magnitude of standardized coefficients. R2 values indicate the proportion of variance explained for each endogenous variable. Model fit statistics: χ2 = 7.508, df = 3, p = 0.057; Fisher’s C = 12.128, p = 0.059; AIC = 122.425. Significance levels: p < 0.05, *; p < 0.001, ***; ns, non-significant. Bootstrap resampling (R = 1000) was used for confidence interval estimation.
Agronomy 16 00694 g011
Table 1. List of Abbreviations.
AbbreviationsFull Name
AHNAvailable Hydrolyzable Nitrogen
ASVAmplicon Sequence Variant
Avail-PAvailable Phosphorus
Avail-KAvailable Potassium
CACatalase Activity
CKControl (urea alone)
ECElectrical Conductivity
IAInvertase Activity
NBUrea + Biochar
NBPUrea + Biochar + Bentonite
NPUrea + Bentonite
NSUrea + Graphene
NW Urea + Microbial Inoculant
OTUOperational Taxonomic Unit
PCoAPrincipal Coordinate Analysis
PERMANOVAPermutational Multivariate Analysis of Variance
RDARedundancy Analysis
SEMStructural Equation Modeling
SOMSoil Organic Matter
STNSoil Total Nitrogen
TCTotal Carbon
TNTotal Nitrogen
UAUrease Activity
WSAWater–Stable Aggregates
Table 2. Experimental design and amendment application rates.
TreatmentsUrea
(kg hm−2)
Biochar
(kg hm−2)
Graphene
(kg hm−2)
Sodium
Bentonite
(kg hm−2)
Microbial
Agent
(kg hm−2)
P2O5
(kg hm−2)
K2O
(kg hm−2)
CK (Urea)3500000200200
NB (Urea + Biochar)3505000000200200
NS (Urea + Graphene)35001000200200
NP (Urea + Bentonite)3500090000200200
NBP (Urea + Biochar + Bentonite)3505000090000200200
NW (Urea + Microbial inoculant)3500005200200
Disclaimer/Publisher’s Note: The statements, opinions and data contained in all publications are solely those of the individual author(s) and contributor(s) and not of MDPI and/or the editor(s). MDPI and/or the editor(s) disclaim responsibility for any injury to people or property resulting from any ideas, methods, instructions or products referred to in the content.