Article

Risk-Oriented Evaluation of Yield Stability and Genotype × Year Interaction in Triticale Under Interannual Climatic Variability

by
Hristo P. Stoyanov
1,
Asparuh I. Atanasov
2 and
Atanas Z. Atanasov
3,*
1
Dobrudzha Agricultural Institute—General Toshevo, Agricultural Academy—Sofia, 9521 General Toshevo, Bulgaria
2
Department of Mechanics and Elements of Machines, Technical University of Varna, 9010 Varna, Bulgaria
3
Department of Agricultural Machinery, Agrarian and Industrial Faculty, University of Ruse “Angel Kanchev”, 7017 Ruse, Bulgaria
*
Author to whom correspondence should be addressed.
Agronomy 2026, 16(6), 664; https://doi.org/10.3390/agronomy16060664
Submission received: 21 February 2026 / Revised: 10 March 2026 / Accepted: 17 March 2026 / Published: 20 March 2026

Abstract

Climate variability amplifies temporal heterogeneity in crop production, challenging uniform varietal recommendations and highlighting the need to integrate genotype × environment interactions. This study evaluated the yield performance and stability of sixteen triticale (×Triticosecale Wittmack) genotypes over three consecutive growing seasons (2022/2023, 2023/2024, 2024/2025) at a single location with pronounced interannual climatic variability. Grain yield ranged from 3.49 to 6.68 t/ha in the least productive season (2022/2023) and from 7.71 to 9.92 t/ha in the most favorable season (2024/2025), with overall genotype means varying between 6.67 and 8.12 t/ha. Stability was assessed using regression-based parameters (regression coefficient and variance of deviations from regression), Shukla’s stability variance, and derived indices describing responsiveness (RI), predictability (PI), genetic risk (GRI), stress robustness (SRI), and yield opportunity (YOI). Results revealed substantial genotype × year interaction, with yield strongly dependent on seasonal conditions. Four genotypes combined high mean yield with stable performance and low interaction-related risk, indicating broad adaptability across years. Another four exhibited strong responsiveness to favorable seasons or elevated instability, increasing production risk despite high yield potential. The derived indices enabled risk-oriented genotype profiling, identifying contrasting adaptation strategies. Multivariate AMMI and GGE biplot analyses confirmed these patterns, providing a comprehensive view of interaction structure and stability. This integrated framework translates stability metrics into practical, decision-oriented descriptors, supporting risk-aware genotype selection under variable climates.

1. Introduction

Crop productivity under field conditions is strongly influenced by environmental variability, which modulates the expression of genetic potential across seasons and management regimes. In cereal crops, yield formation is not a fixed genetic attribute but the result of complex interactions between genotype and environment [1,2,3,4,5]. Consequently, genotypes with comparable mean yields may differ substantially in performance stability, leading to contrasting levels of yield reliability under variable climatic conditions [4,5,6].
Yield stability has therefore become a central concept in plant breeding and agronomy. It is commonly defined as the capacity of a genotype to maintain predictable performance across diverse environments, integrating adaptability and consistency of response [4,5,7,8]. Stability does not imply the absence of variation; rather, it reflects structured and biologically interpretable responses to environmental fluctuations [9,10,11,12]. From a production perspective, stability is intrinsically linked to risk, as unstable genotypes increase uncertainty in both yield and economic return [13].
The importance of stability-oriented evaluation has intensified under ongoing climatic change. Increasing temperature variability, irregular precipitation patterns, and a higher frequency of extreme weather events have amplified interannual heterogeneity, even within a single geographical location [14,15,16,17,18]. Under such conditions, varietal assessment based solely on mean yield is insufficient, as it fails to capture genotype-specific vulnerability to unfavorable seasons and differential capacity to exploit favorable years.
Genotype × environment interaction arises when genotypes respond differentially to environmental variation, resulting in changes in their relative ranking across environments [19,20]. When environmental differentiation is primarily temporal, this interaction is expressed as genotype × year (G × Y) interaction, which directly reflects interannual climatic variability. G × Y interaction complicates the identification of genotypes combining high productivity with reliable performance and represents a major source of production risk [21,22]. Biologically, it reflects differences in physiological plasticity, stress tolerance, phenological adjustment, and resource-use efficiency among genotypes [23,24,25], while agronomically, it manifests as yield instability.
Numerous analytical approaches have been developed to quantify stability and characterize interaction effects [26]. Regression-based methods estimate genotypic responsiveness and predictability [6,7,8], variance-based parameters assess the contribution of individual genotypes to interaction components [27], and multivariate techniques, including additive main effects and multiplicative interaction models and genotype plus genotype-by-environment interaction analysis, facilitate the interpretation of adaptation patterns [28,29]. Although these methods provide valuable statistical descriptions of genotype behavior, their results are frequently interpreted independently rather than integrated into a coherent, risk-oriented evaluation framework that explicitly links stability parameters with production reliability under interannual climatic variability.
This limitation is particularly relevant in regions where temporal climatic variability represents the dominant source of environmental heterogeneity [30,31,32,33,34,35,36,37]. South Dobruja, a major cereal-producing region in northeastern Bulgaria, is characterized by fertile chernozem soils and high yield potential but also by increasing climatic instability, including recurrent drought episodes and irregular rainfall distribution [38,39,40]. In such environments, genotype × year interaction becomes a critical determinant of yield reliability [36,38,39,40,41,42,43]. Despite the strategic importance of the region for cereal production, comprehensive multi-year assessments that explicitly quantify interaction-related risk and differentiate contrasting genotypic response patterns remain limited.
Triticale (×Triticosecale Wittmack) is widely recognized for its adaptability and tolerance to abiotic stress, making it a promising crop for resilient cereal-based systems [37,38,39,42]. Nevertheless, substantial genotype × environment interaction has been reported for triticale, particularly under fluctuating climatic conditions, indicating that stability-based evaluation remains essential for informed genotype deployment [36,37,38,39,41,42,43]. However, the systematic translation of stability metrics into risk-oriented interpretation under pronounced interannual variability has received comparatively less attention. The analytical framework applied in this study does not replace classical stability models but rather integrates complementary approaches, including regression-based parameters, variance-based stability measures, and multivariate analyses (AMMI and GGE), thereby enabling a more comprehensive and risk-oriented interpretation of genotype × year interaction under interannual climatic variability.
Against this background, the present study aimed to evaluate yield stability and genotype × year interaction in triticale genotypes under multi-year field conditions in South Dobruja and to develop a risk-oriented interpretation of genotypic response patterns under interannual climatic variability. By integrating complementary stability approaches within a unified analytical framework, this research seeks to improve the understanding of interaction-related risk and to support more reliable genotype selection in climatically variable cereal production systems.

2. Materials and Methods

2.1. Plant Material and Growing Conditions

The experiment was conducted during three consecutive growing seasons at the experimental field of the Dobrudzha Agricultural Institute, General Toshevo, South Dobruja, Bulgaria. The evaluated environments corresponded to the seasons 2022/2023 (E1), 2023/2024 (E2), and 2024/2025 (E3), which differed markedly in their climatic characteristics and represented contrasting seasonal conditions.
A total of sixteen triticale (×Triticosecale Wittmack) genotypes were included in the experiment. Four registered cultivars were used as standards: AD-7291 (A), Vihren (V), Rakita (R), and Kolorit (K). The cultivar Kolorit is used as a reference standard in the national variety testing system, whereas AD-7291, Vihren, and Rakita serve as reference cultivars in the triticale breeding program of the Dobrudzha Agricultural Institute. In addition, twelve advanced breeding lines were evaluated, including 137/09-264 (G1), 48/10-172 (G2), 203T/14-4 (G3), 20/10-267 (G4), 214/11-240 (G5), 46/09-188 (G6), 203T/11-4 (G7), 214/11-231 (G8), 214/11-223 (G9), 47/10-101 (G10), 158/10-310 (G11), and 164/10-302 (G12).
The field trials were established in a randomized complete block design with five replications in each growing season. Each experimental plot had an area of 10 m2. Sowing was performed mechanically between 20 and 30 October, within the recommended agronomic period for winter triticale in the region. Standard crop management practices were applied uniformly across all genotypes and years, including fertilization, weed control, and plant protection, in accordance with local recommendations. No intentional stress treatments were imposed, allowing genotypic responses to be driven primarily by natural seasonal variability. Harvest was performed at full grain maturity in mid-July using a small-plot combine harvester (manufactured by the Wintersteiger Holdig AG, based in Ried im Innkreis, Austria).
Grain yield was recorded at maturity from each plot and converted to a hectare basis (t/ha) according to the plot area (10 m2). The values were adjusted to a standard grain moisture content (14%). The same experimental layout and management practices were maintained across all three years to ensure comparability among environments.
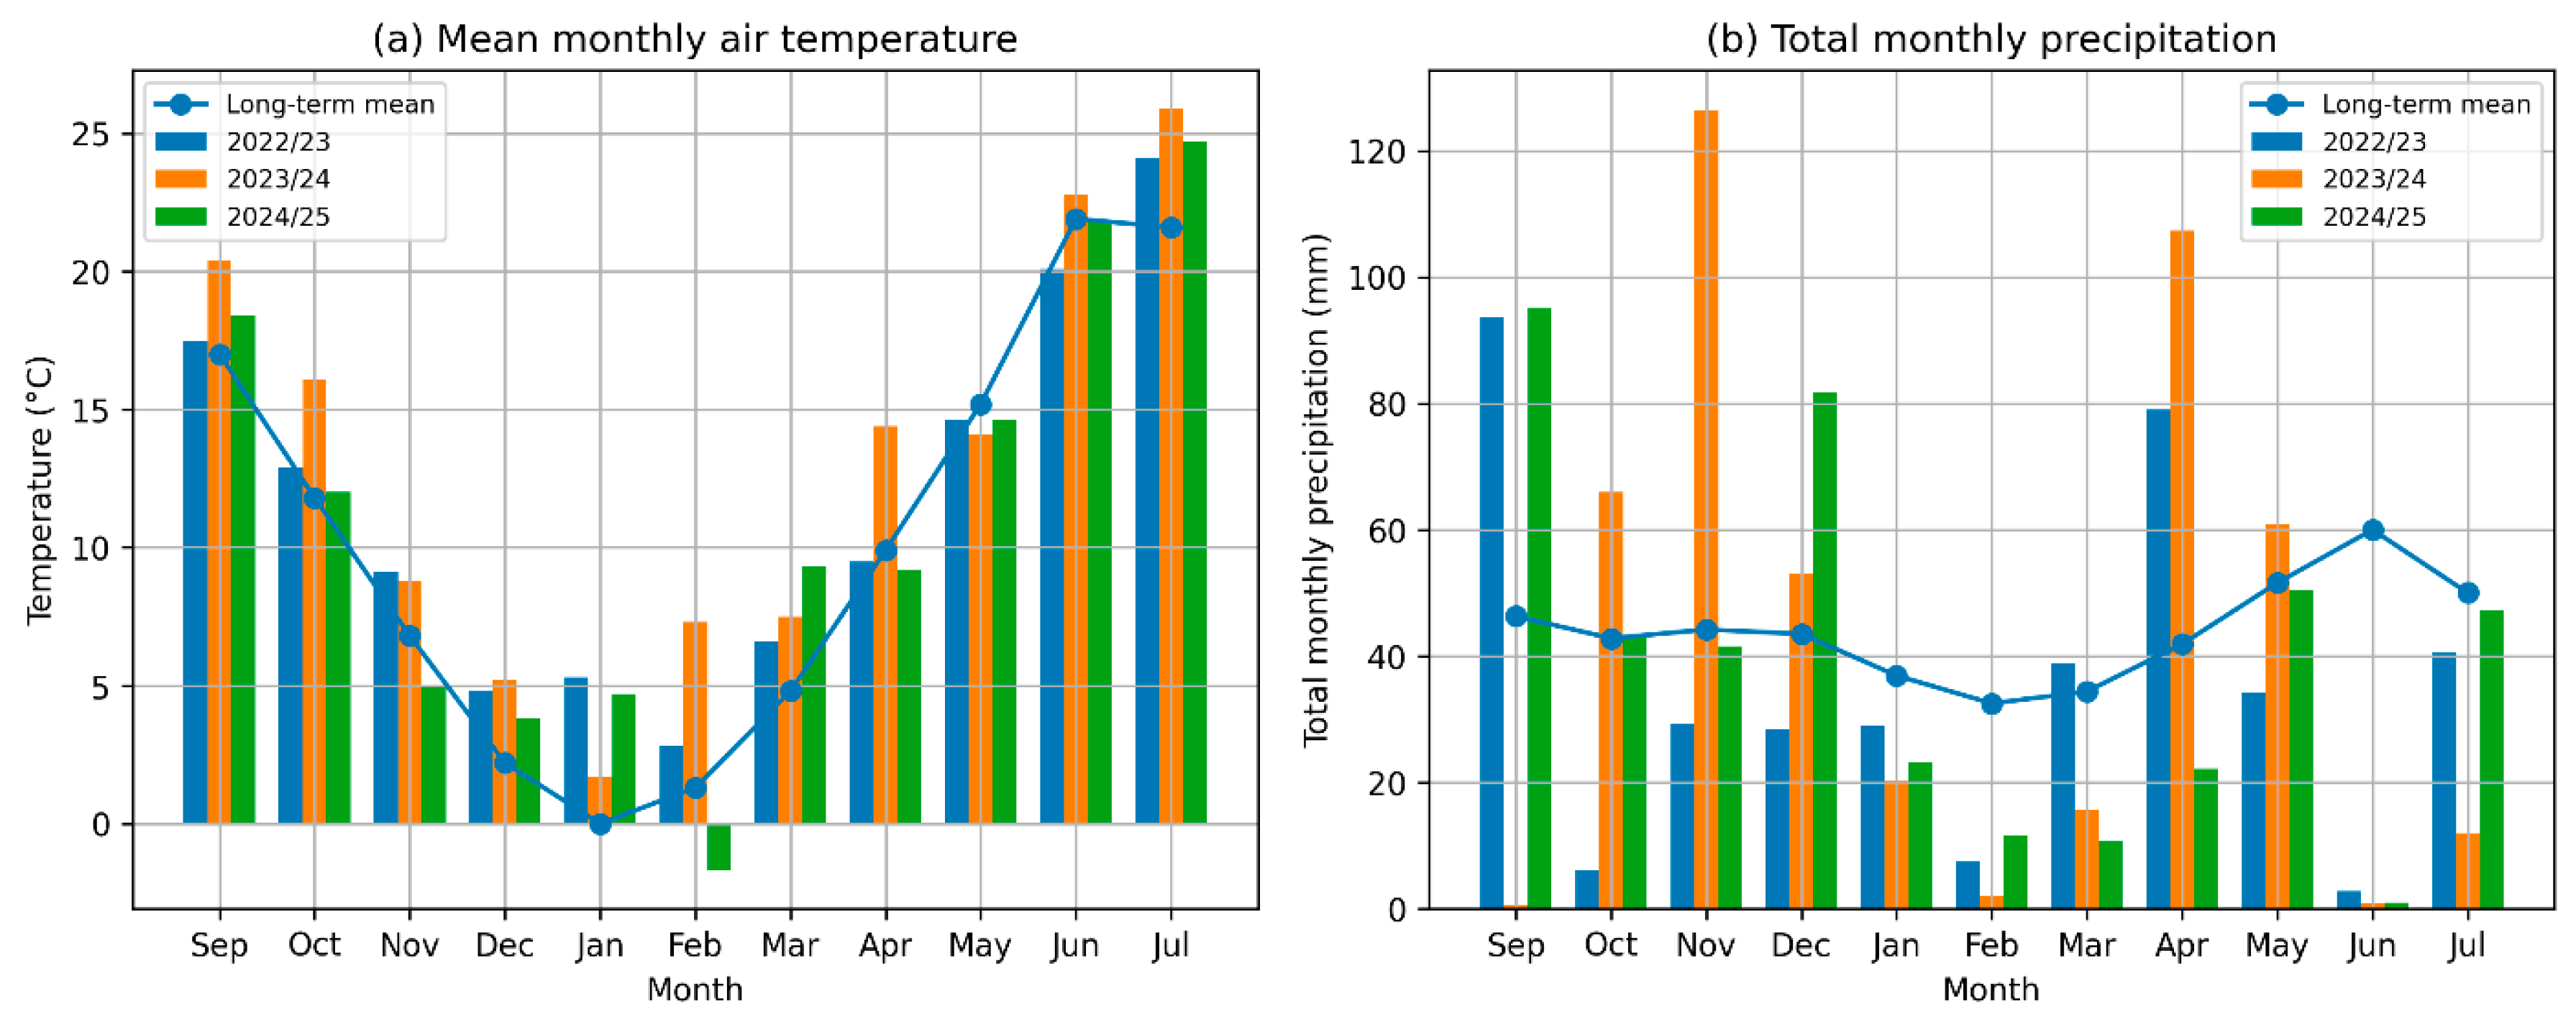
Climatic conditions in the study differed among the three growing seasons (E1: 2022/2023, E2: 2023/2024, E3: 2024/2025), reflecting variation in both temperature regime and precipitation distribution (Figure 1). Mean monthly temperatures during autumn and early summer were generally above the long-term average (1960–2025), while winter conditions varied among years. The E3 season included a markedly cold February, indicating stronger exposure to low temperatures during overwintering, whereas E2 was characterized by comparatively mild winter conditions and elevated autumn temperatures. Spring temperatures were relatively similar among seasons, and all years showed warm conditions during June–July.
Precipitation differed substantially in both amount and seasonal distribution. E1 was characterized by high rainfall during September, before sowing, followed by relatively dry winter conditions. In contrast, E2 exhibited pronounced precipitation peaks in late autumn and spring, including exceptionally high rainfall in November and April. The E3 season showed a more irregular distribution, with wet autumn months but reduced precipitation during late winter and early spring. The resulting variability provided an appropriate climatic framework for assessing genotype performance across seasons differing in triticale productivity potential.

2.2. Statistical and Mathematical Analysis

Grain yield data were analyzed to quantify genotype performance and to characterize the magnitude and structure of genotype × environment interaction. The analytical framework focused on partitioning phenotypic variance and describing genotypic stability, responsiveness, and interaction-related variability.
Initially, analysis of variance (ANOVA) was conducted to partition total phenotypic variation into genotype ( G ), environment ( E ; year), and genotype × environment ( G E ) interaction components. The presence of significant G E interaction indicates differential genotypic responses across environments and justifies subsequent stability analysis [4,12,14]. The following linear model was applied:
Y i j k = μ + G i + E j + ( G E ) i j + R k ( E j ) + ε i j k
where Y i j k is the observed grain yield of genotype i in environment j and replication k ; μ is the overall grain yield mean; G i represents genotypic effects; E j represents environmental effects; ( G E ) i j denotes genotype × environment interaction; R k ( E j ) is the replication effect nested within the environment; and ε i j k is the experimental error.
Stability analysis was subsequently performed using regression-based and variance-based approaches. Genotypic responsiveness to environmental productivity was evaluated using the model of Finlay and Wilkinson [7], formalized by Eberhart and Russell [8]:
Y i j = μ i + b i I j + δ i j
where I j is the environmental index (environmental mean minus grand mean).
The regression coefficient b i describes responsiveness to environmental improvement, and the variance of deviations from regression S d i 2 quantifies predictability of performance [8,12].
To quantify the contribution of individual genotypes to GE interaction, Shukla’s stability variance was calculated [27]:
σ i 2 = 1 ( e 1 ) ( g 1 ) j = 1 e ( Y i j μ i μ j + μ ) 2
where g is the number of genotypes and e is the number of environments. Shukla’s variance estimates genotype-specific instability independently of mean yield and has been widely applied as a measure of interaction-related variability [6,11,43].
Derived indices were calculated to synthesize stability parameters into standardized descriptors, facilitating genotype comparison. Genotypic responsiveness was expressed as:
R I i = b i 1
This transformation centers responsiveness around zero, enabling clear differentiation between conservative genotypes ( R I i   <   0 ), widely adapted genotypes ( R I i     0 ), and highly responsive genotypes ( R I i   >   0 ).
Predictability was quantified as:
P I i = 1 S d i 2 m a x ( S d 2 )
where S d i 2 represents the deviation from regression for genotype i . The use of max(S2di) as the denominator scales the index to a 0–1 range, where values approaching 1 indicate highly predictable yield expression and values approaching 0 reflect maximum irregularity relative to the evaluated set.
Interaction-related genetic risk ( G R I ) was expressed as:
G R I i = σ i 2 m a x ( σ 2 )
Normalization enabled comparisons among genotypes on a common relative scale. In this context, a low G R I value indicates that the genotype contributes minimally to interaction variance, maintains consistent relative performance across seasons of contrasting productivity and thus reduces production uncertainty.
To characterize genotype behavior under contrasting seasonal conditions, relative yield indices were calculated. Stress robustness was estimated as:
S R I i = Y i , E u Y E u
where Y i , E u is the mean grain yield of genotype i in the unfavorable environment E u , and Y E u is the mean yield of all genotypes in the same environment. Values of S R I i >   1 indicate above-average performance under stress conditions, whereas values below unity indicate reduced robustness. Relative yield-based indices have been shown to provide robust descriptors of stress tolerance and adaptation strategies across environments [44,45,46,47,48,49,50,51].
Yield potential under favorable conditions was assessed using the Yield Opportunity Index ( Y O I ), which reflects the capacity of a genotype to exploit high-yield environments. The index was calculated as:
Y O I i = Y i , E f Y E f
where Y i , E f is the mean grain yield of genotype i in the favorable environment E f , and Y E f is the corresponding environmental mean. Indices based on relative yield expression under optimal conditions are commonly used to describe genotype responsiveness and yield opportunity in multi-environment trials.
The unfavorable and favorable environments were defined based on seasonal mean yield across all genotypes, with the lowest-yielding season considered the stress environment and the highest-yielding season as the favorable environment. Together, S R I and Y O I provide complementary descriptors of genotype behavior under contrasting seasonal conditions and support the interpretation of adaptation strategies and varietal suitability for conservative or high-input management systems.
To explore the structure and patterns of genotype × environment interaction beyond univariate parameters, multivariate analyses were also applied. Additive main effects and multiplicative interaction (AMMI) analysis was used to decompose the interaction matrix into principal components, thereby revealing dominant interaction patterns and supporting the identification of genotypes with broad or specific adaptation [28,52]. Genotype plus genotype × environment interaction (GGE) biplot analysis was further applied to simultaneously evaluate genotype performance and environmental discrimination ability, providing an integrated graphical interpretation of interaction effects [21,29].
Variance-based stability parameters typically exhibit highly right-skewed distributions, characterized by a small number of genotypes with extremely large values. Such distributions reduce the interpretability of graphical representations and obscure differences among moderately stable genotypes. Therefore, logarithmic transformation of Shukla’s stability variance was applied exclusively for visualization purposes in risk-related figures. This transformation preserved the ranking of genotypes while expanding the dynamic range of moderate values, enabling clearer visualization of genetic risk gradients without influencing statistical inference or numerical comparisons.

2.3. Software and Computational Procedures

All data processing, statistical calculations, and graphical analyses were performed using open-source statistical software to ensure reproducibility and transparency of the analytical workflow.
Initial data organization, calculation of descriptive statistics, analysis of variance, regression-based stability parameters, variance-based stability indices, and derivation of risk-oriented indicators were conducted using the Python programming language (version 3.11). Numerical computations and data manipulation were carried out using the libraries pandas, NumPy, and SciPy, while graphical visualizations were generated using Matplotlib (version 3.8.2). Python was additionally used to generate decision-oriented visualizations, including yield-responsiveness-risk matrices and comparative stability plots, enabling integrated interpretation of genotype performance across years. Multivariate analyses of genotype × environment interaction were performed in the R statistical environment (version 4.3). Additive main effects and multiplicative interaction ( A M M I ) analysis and genotype plus genotype × environment interaction ( G G E ) biplot analysis were conducted using the metan package (version 1.19.0) [53].

3. Results

3.1. Genotype × Environment Interaction and Variance Structure

The analysis of variance revealed a highly structured pattern of grain yield variation among triticale genotypes, growing seasons, and their interaction (Table 1). All main sources of variation—genotype, environment (year), and genotype × environment interaction—were statistically significant (p < 0.001), indicating that yield expression was jointly influenced by genetic differences, strong temporal environmental effects, and differential genotypic responses across seasons.
The environment (year) effect was the dominant source of variation in grain yield, accounting for 79.13% of the total sum of squares and exhibiting an exceptionally high F value (F = 2138.46). This result indicates pronounced differences in productivity among the three seasons and confirms the strong influence of interannual environmental variability on yield formation.
Genotypic differences were also significant, explaining 11.08% of the total variation (F = 39.92, p < 0.001), demonstrating substantial genetic variability in yield potential among the evaluated material. In addition, genotype × year interaction accounted for 6.24% of the total variation and was significant (F = 11.24, p < 0.001), indicating that genotypes differed in their response to seasonal conditions and that their relative performance varied across years.
Taken together, the variance structure shows that grain yield was primarily driven by seasonal conditions but also structured by significant genetic differences and interaction effects. The presence of a significant genotype × year interaction indicates that genotype performance cannot be fully characterized by mean yield alone and justifies further analyses of yield stability and response patterns across years.

3.2. Grain Yield Performance Across Growing Seasons

Grain yield of the evaluated triticale genotypes varied substantially across the three growing seasons, reflecting pronounced interannual environmental variability (Table 2). The seasons 2022/2023 (E1), 2023/2024 (E2), and 2024/2025 (E3) differed markedly in their productivity levels and thus provided a suitable environmental gradient for assessing genotype performance and response patterns.
The lowest mean grain yield was recorded in the first season, E1, indicating generally unfavorable growing conditions during 2022/2023. In contrast, productivity increased markedly in E2, and further increased in E3. The difference between the least and most productive seasons exceeded 3.3 t/ha, corresponding to an increase of approximately 60%, which underlines the strong influence of year effects on yield formation. These pronounced seasonal contrasts confirm that environmental variability among years represented a dominant component of production conditions during the experimental period.
Within each season, substantial variation in grain yield was observed among genotypes. During the unfavorable season E1, yields ranged from 3.486 t/ha for the standard cultivar Kolorit (K) to 6.681 t/ha for breeding line 203T/14-4 (G3), a difference well exceeding the LSD0.05 (0.377 t/ha). The remaining standard cultivars—AD-7291 (A), Vihren (V), and Rakita (R)—exhibited intermediate performance, with yields between 4.558 and 4.920 t/ha. Several breeding lines maintained comparatively higher productivity under these unfavorable conditions, including 48/10-172 (G2), 214/11-240 (G5), 203T/11-4 (G7), 214/11-231 (G8), 158/10-310 (G11), and 164/10-302 (G12), all exceeding 6.0 t/ha. This variation indicates that even under reduced environmental favorability, genotypes differed considerably in their ability to express yield potential.
In the second season, E2, environmental conditions improved markedly and grain yield increased across all genotypes. Yields ranged from 7.041 t/ha for AD-7291 (A) to 8.693 t/ha for 203T/14-4 (G3), a statistically significant difference (LSD0.05 = 0.468 t/ha). All genotypes exceeded 7.0 t/ha, and most breeding lines surpassed 8.0 t/ha, indicating a general improvement in productivity relative to E1. Among the standard cultivars, Vihren (V) and Kolorit (K) recorded higher values, whereas AD-7291 (A) and Rakita (R) remained below the seasonal mean. In contrast, several breeding lines, including 48/10-172 (G2), 20/10-267 (G4), 214/11-240 (G5), and 203T/11-4 (G7), consistently expressed high yield levels, reinforcing the observed differentiation between registered cultivars and advanced breeding material.
The third season, E3, represented the most favorable production environment of the study. Mean grain yield approached 9.0 t/ha, and several genotypes exceeded 9.5 t/ha. The highest yields were recorded for breeding lines 214/11-231 (G8), 48/10-172 (G2), and 20/10-267 (G4), all differing significantly from the lower-performing genotypes. In this season, the standard cultivar Kolorit (K) also showed a pronounced yield increase, reaching 9.254 t/ha, which contrasted sharply with its low performance in E1. Other standard cultivars exhibited more moderate yield gains, remaining below 8.35 t/ha. The wide dispersion of genotypic performance in E3 further emphasized differences in responsiveness to improved environmental conditions.
When averaged across all three seasons, clear and statistically significant differences in overall productivity among genotypes were evident (LSD0.05 = 0.834 t/ha). Mean grain yield ranged from 6.666 t/ha for AD-7291 (A) to 8.118 t/ha for G3. Several breeding lines consistently ranked among the highest-yielding genotypes, including 48/10-172 (G2), 203T/14-4 (G3), 203T/11-4 (G7), and 214/11-231 (G8), all exceeding 8.0 t/ha on average. In contrast, the four standard cultivars clustered within a lower yield range (6.666–6.785 t/ha), indicating a clear distinction between registered cultivars and advanced breeding material.
Despite these general trends, genotypes differed markedly in the magnitude and direction of their seasonal yield responses. Some genotypes, such as G3 and G7, maintained comparatively high yields across all seasons, suggesting a stable yield expression under contrasting conditions. Other genotypes showed stronger responsiveness to favorable environments. Kolorit (K), for example, exhibited one of the lowest yields in E1 but ranked among the higher-yielding genotypes in E3, indicating a pronounced response to improved seasonal conditions. Several breeding lines also showed substantial yield increases from E1 to E3, though the magnitude of response differed among genotypes. The observed differences among genotypes were statistically significant within each season and across the overall mean, as indicated by the LSD values presented in Table 2.

3.3. Yield Stability and Environmental Responsiveness Based on Classical Stability Parameters

Classical stability analysis revealed substantial differences among triticale genotypes in their responsiveness to environmental variability, the regularity of yield expression, and their contribution to genotype × year interaction (Table 3). Regression-based and variance-based parameters provided complementary evidence describing both the direction of genotypic response to seasonal productivity and the consistency with which this response was expressed across years.
The regression coefficient (bi) showed wide variation among genotypes, indicating contrasting adaptive patterns. Values ranged from 0.501 for genotype 158/10-310 (G11) to 1.718 for the local standard cultivar Kolorit. Genotypes with slopes close to 1.00, including AD-7291, Rakita, 48/10-172 (G2), 137/09-264 (G1), 214/11-240 (G5), 46/09-188 (G6), 203T/11-4 (G7), 214/11-223 (G9), and 164/10-302 (G12), exhibited proportional yield adjustment across environments and can be interpreted as broadly adapted. A second group, represented by Vihren, 20/10-267 (G4), 214/11-231 (G8), and especially Kolorit, showed stronger responsiveness, expressed as greater yield gains under favorable conditions together with increased sensitivity to seasonal variation. In contrast, genotypes such as 203T/14-4 (G3) and 158/10-310 (G11) displayed reduced slopes, reflecting limited yield increase under improving environments and a more conservative response pattern.
While regression coefficients describe the magnitude of response, the variance of deviations from regression (S2di) reflects its regularity. Considerable differences in S2di were observed, ranging from 7.3 for AD-7291 to 5615.9 for 164/10-302 (G12). Very low values, as recorded for AD-7291, indicated that yield closely followed the environmental gradient and was therefore highly predictable. Kolorit combined strong responsiveness with comparatively low deviation variance, suggesting a consistent response relative to environmental productivity. In contrast, several breeding lines, including 214/11-223 (G9), 47/10-101 (G10), 158/10-310 (G11), and 164/10-302 (G12), exhibited markedly larger deviations, indicating irregular expression across seasons.
Variance-based analysis using Shukla’s stability variance (σ2i) further differentiated genotypes according to their involvement in genotype × year interaction. Values ranged from 324.5 for genotype 214/11-240 (G5) to 30,694.3 for Kolorit. Low σ2i values, observed for AD-7291, Rakita, 214/11-240 (G5), 46/09-188 (G6), 203T/11-4 (G7), and 48/10-172 (G2), indicated limited interaction-driven variability and comparatively stable performance across seasons. In contrast, Kolorit and 158/10-310 (G11) showed extremely high σ2i values, reflecting strong environmental interaction and unstable relative performance.
Taken together, the classical stability parameters indicated that genotypes differed not only in responsiveness but also in the predictability and interaction-related variability of yield performance. However, interpretation based on individual parameters remains challenging, as genotypes often combined contrasting characteristics across stability measures. Some entries showed strong responsiveness with consistent expression, whereas others combined conservative responses with substantial interaction effects. This multidimensionality illustrates the limitations of relying on single stability statistics for varietal evaluation, as regression slopes, deviation variances, and interaction variances each describe distinct aspects of genotype behavior and may lead to different conclusions when considered separately. To facilitate interpretation and provide a unified assessment framework, the classical stability parameters were therefore transformed into derived indices integrating responsiveness, predictability, and interaction effects.

3.4. Risk- and Decision-Oriented Indices Describing Genotype Behavior

The derived indices revealed clear differentiation among triticale genotypes in their seasonal yield profiles (Table 3). By integrating classical stability parameters into composite descriptors, these indices allow direct comparison of genotypic behavior under temporal environmental variability.
The Responsiveness Index (RI) indicated broad differences in yield adjustment to improving seasonal conditions and delineated three main response patterns. Genotypes such as 158/10-310 (G11) and 203T/14-4 (G3), characterized by strongly negative RI values, displayed limited capacity to capitalize on favorable seasons, reflecting conservative response strategies. Slightly negative or near-neutral RI values, observed for AD-7291, Rakita, 214/11-223 (G9), 164/10-302 (G12), 214/11-240 (G5), and several additional entries, suggested proportional responses and relatively restrained environmental sensitivity. In contrast, genotypes with positive RI values showed increasing yield gains under favorable conditions. Moderate responsiveness characterized genotypes such as 48/10-172 (G2), 46/09-188 (G6), and 214/11-231 (G8), whereas Kolorit exhibited a markedly elevated RI, indicating a pronounced dependence on high-productivity seasons.
Predictability of yield expression, quantified through the Predictability Index (PI), revealed equally strong differentiation in the regularity of seasonal performance. Extremely high PI values for AD-7291 and Kolorit indicated that their yield trajectories closely followed expected environmental trends. Several genotypes, including 20/10-267 (G4), 214/11-240 (G5), and 203T/11-4 (G7), also showed high predictability, suggesting stable expression of seasonal responses. In contrast, reduced PI values for 214/11-223 (G9), 47/10-101 (G10), 158/10-310 (G11), and particularly 164/10-302 (G12) reflected irregular performance patterns and lower reproducibility across years, indicating that their yield expression was less tightly linked to environmental gradients.
The Genetic Risk Index (GRI), derived from interaction variance, further distinguished genotypes according to their contribution to genotype × year interaction and therefore their interaction-related production risk. Several genotypes, including AD-7291, Rakita, 214/11-240 (G5), 46/09-188 (G6), 203T/11-4 (G7), and 48/10-172 (G2), showed consistently low GRI values, indicating limited interaction-driven variability and comparatively stable seasonal ranking. In contrast, Kolorit showed the highest GRI value, reflecting a dominant contribution to interaction effects and strong environmental dependence. Elevated risk levels were also observed for 158/10-310 (G11) and 203T/14-4 (G3), while intermediate contributions characterized genotypes such as 214/11-231 (G8), 214/11-223 (G9), and 164/10-302 (G12).
When RI, PI, and GRI were considered jointly, several coherent behavioral profiles emerged. Genotypes 20/10-267 (G4), 214/11-240 (G5), 46/09-188 (G6), and 203T/11-4 (G7) combined moderate responsiveness with high predictability and low interaction-related variance, indicating consistent seasonal performance and relatively stable ranking across years.
A second group, including Kolorit and 214/11-231 (G8), showed stronger responsiveness accompanied by elevated interaction variance, reflecting greater yield increases under favorable conditions but also higher seasonal variability.
In contrast, genotypes such as 158/10-310 (G11) and 203T/14-4 (G3) exhibited low responsiveness combined with reduced predictability or increased interaction contribution, indicating limited yield adjustment capacity and irregular seasonal ranking.
Overall, the derived indices differentiated genotypes according to responsiveness, predictability, and interaction contribution, revealing distinct seasonal response patterns among genotypes.

3.5. Genotype Performance Under Unfavorable and Favorable Seasonal Conditions

Genotypic differences under contrasting seasonal conditions were quantified using the Stress Robustness Index (SRI) and the Yield Opportunity Index (YOI) (Table 3). SRI indicated pronounced variation in yield maintenance under the unfavorable season. Breeding lines 203T/14-4 (G3), 203T/11-4 (G7), 214/11-240 (G5), 48/10-172 (G2), and 158/10-310 (G11) maintained yields above the seasonal mean, whereas standard cultivars, particularly Kolorit, AD-7291, Vihren, and Rakita, performed below the mean.
YOI revealed a different ranking under favorable conditions. Genotypes 214/11-231 (G8), 48/10-172 (G2), 20/10-267 (G4), 46/09-188 (G6), 203T/11-4 (G7), 164/10-302 (G12), 214/11-240 (G5), and 214/11-223 (G9) exceeded the seasonal mean, while 137/09-264 (G1) and 203T/14-4 (G3) remained near it. Most standard cultivars showed limited yield opportunity, with Kolorit as the only standard exceeding the mean.
Joint consideration of SRI and YOI revealed coherent performance profiles. Some genotypes, including 48/10-172 (G2), 214/11-240 (G5), and 203T/11-4 (G7), combined high stress robustness with strong performance under favorable conditions, maintaining competitive ranking across seasons. Others, such as 203T/14-4 (G3), exhibited high robustness but moderate yield under favorable conditions, whereas Kolorit showed weak stress performance but high yield under favorable conditions.
These results demonstrate that genotype ranking shifts across seasonal productivity gradients, indicating that advantages under one set of conditions are not necessarily maintained under contrasting environments.

3.6. Multivariate Characterization of Genotype × Year Interaction

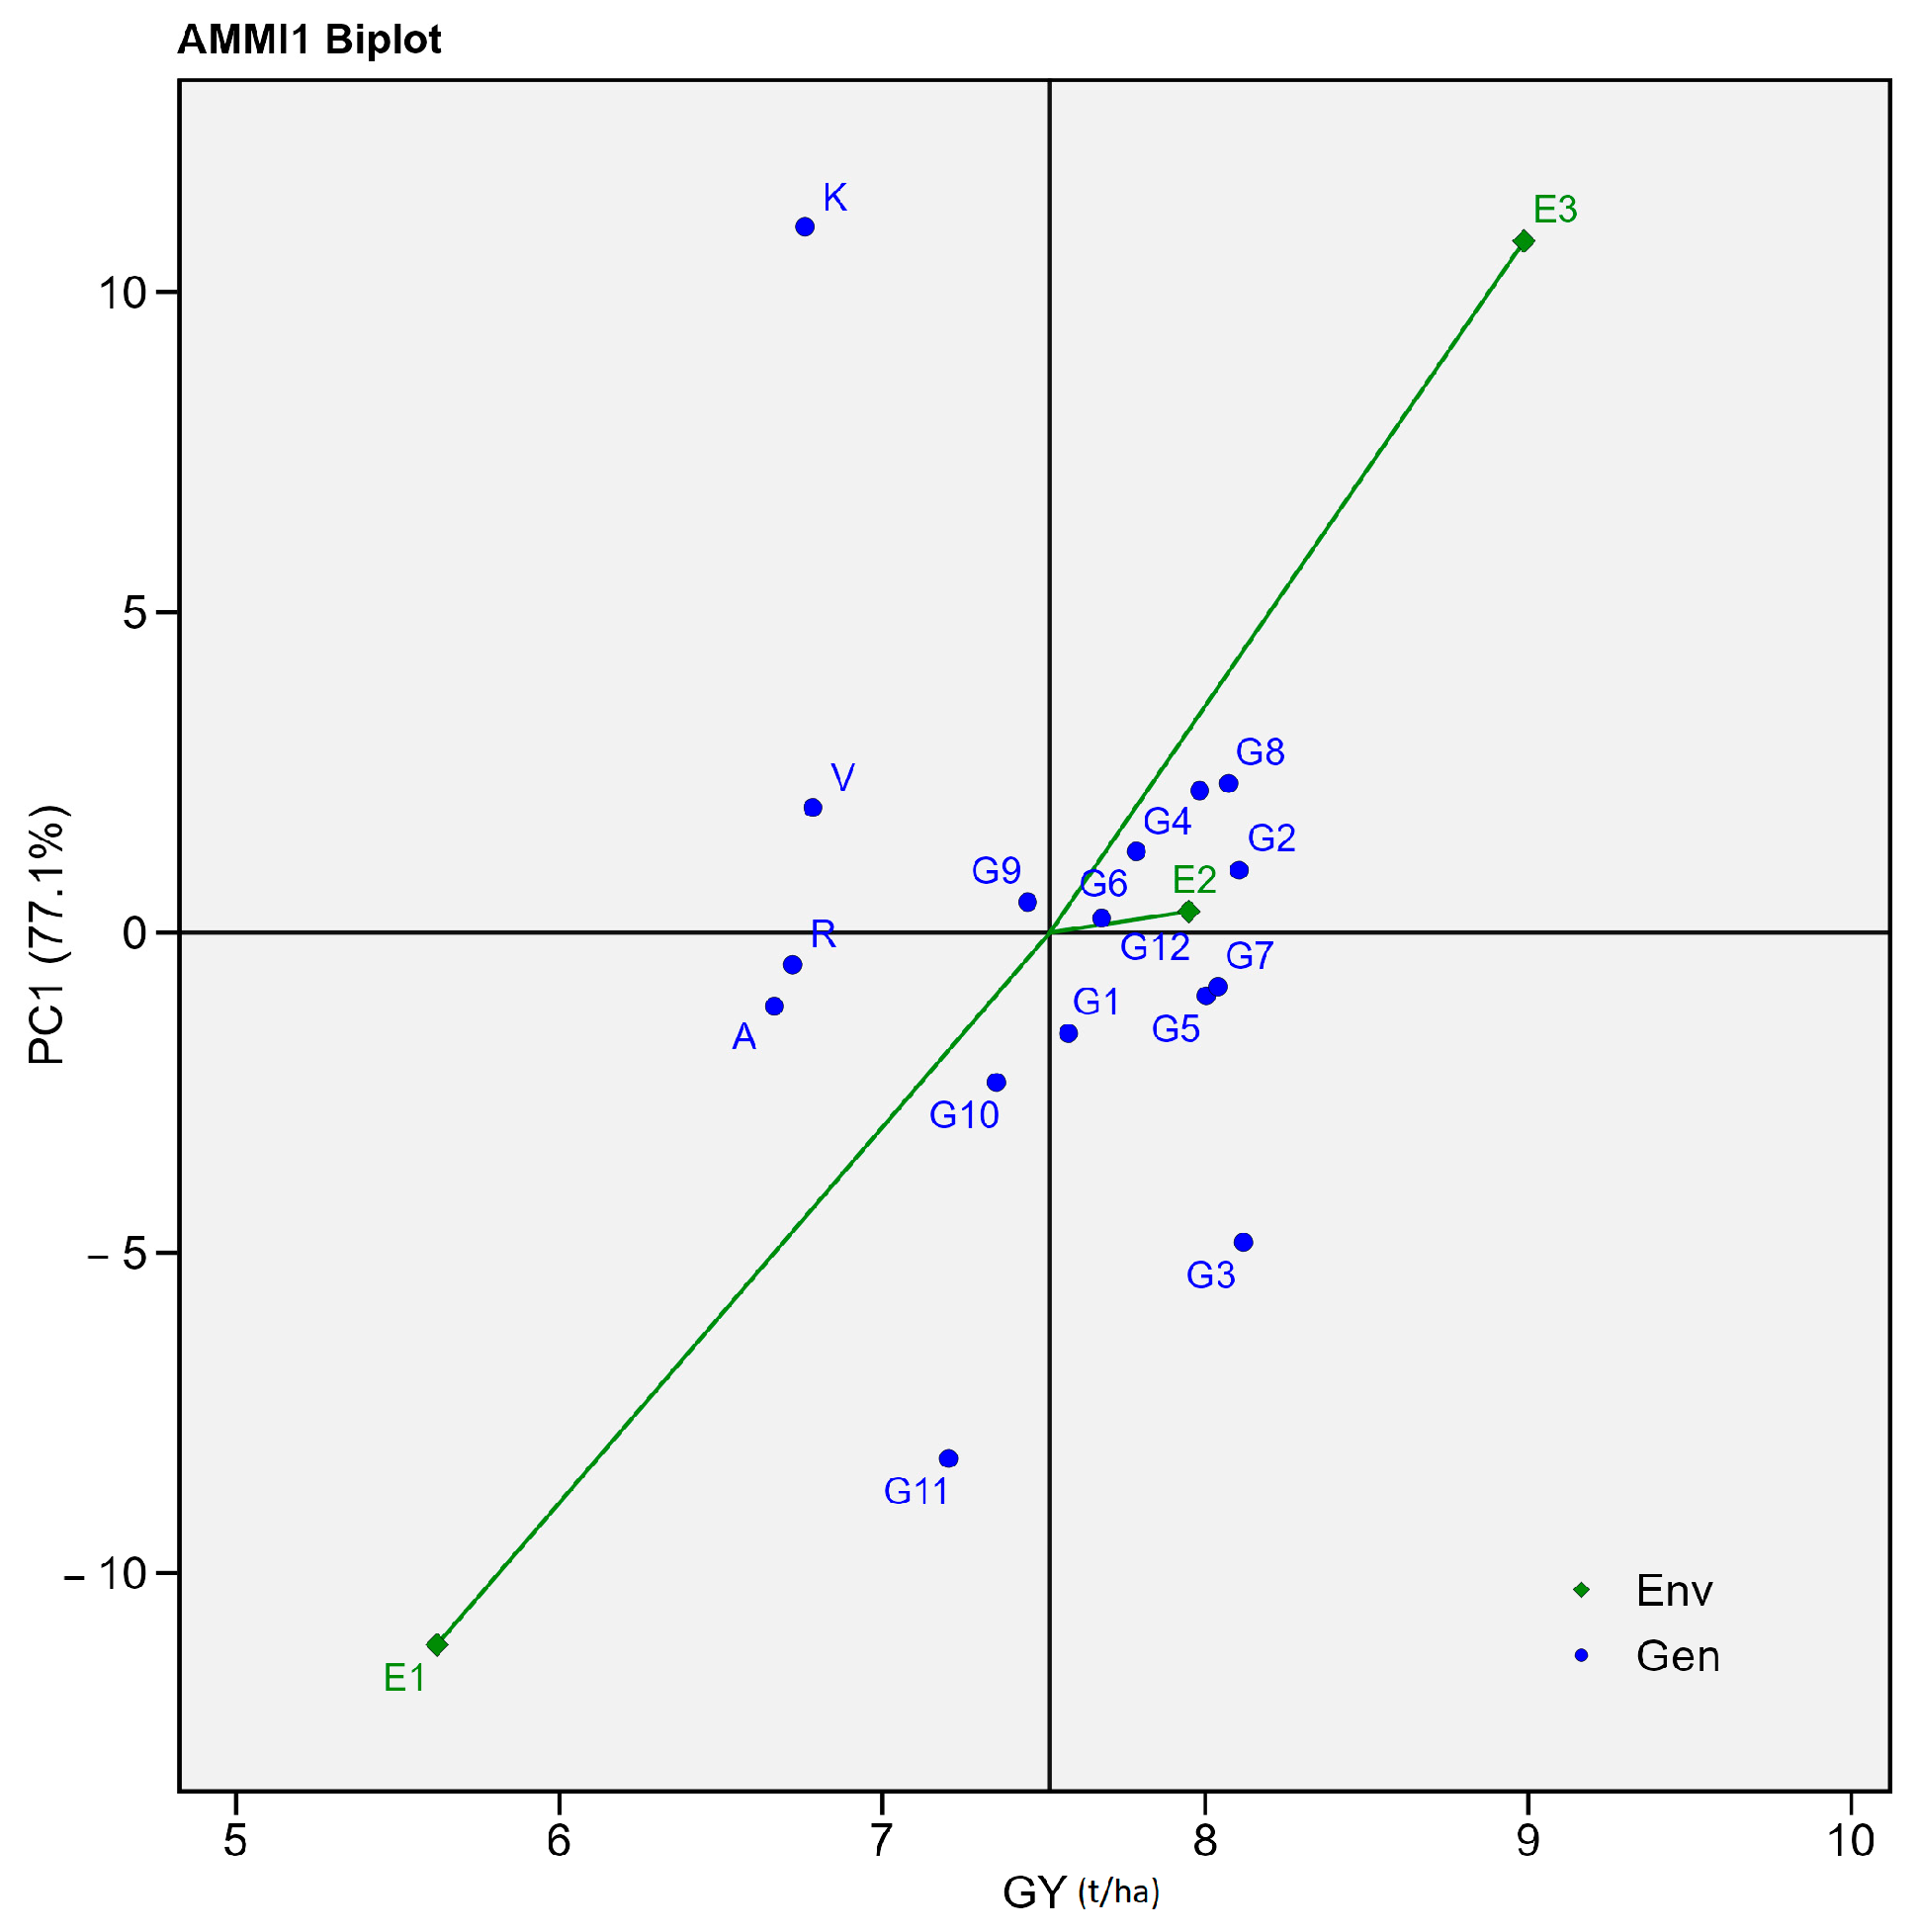
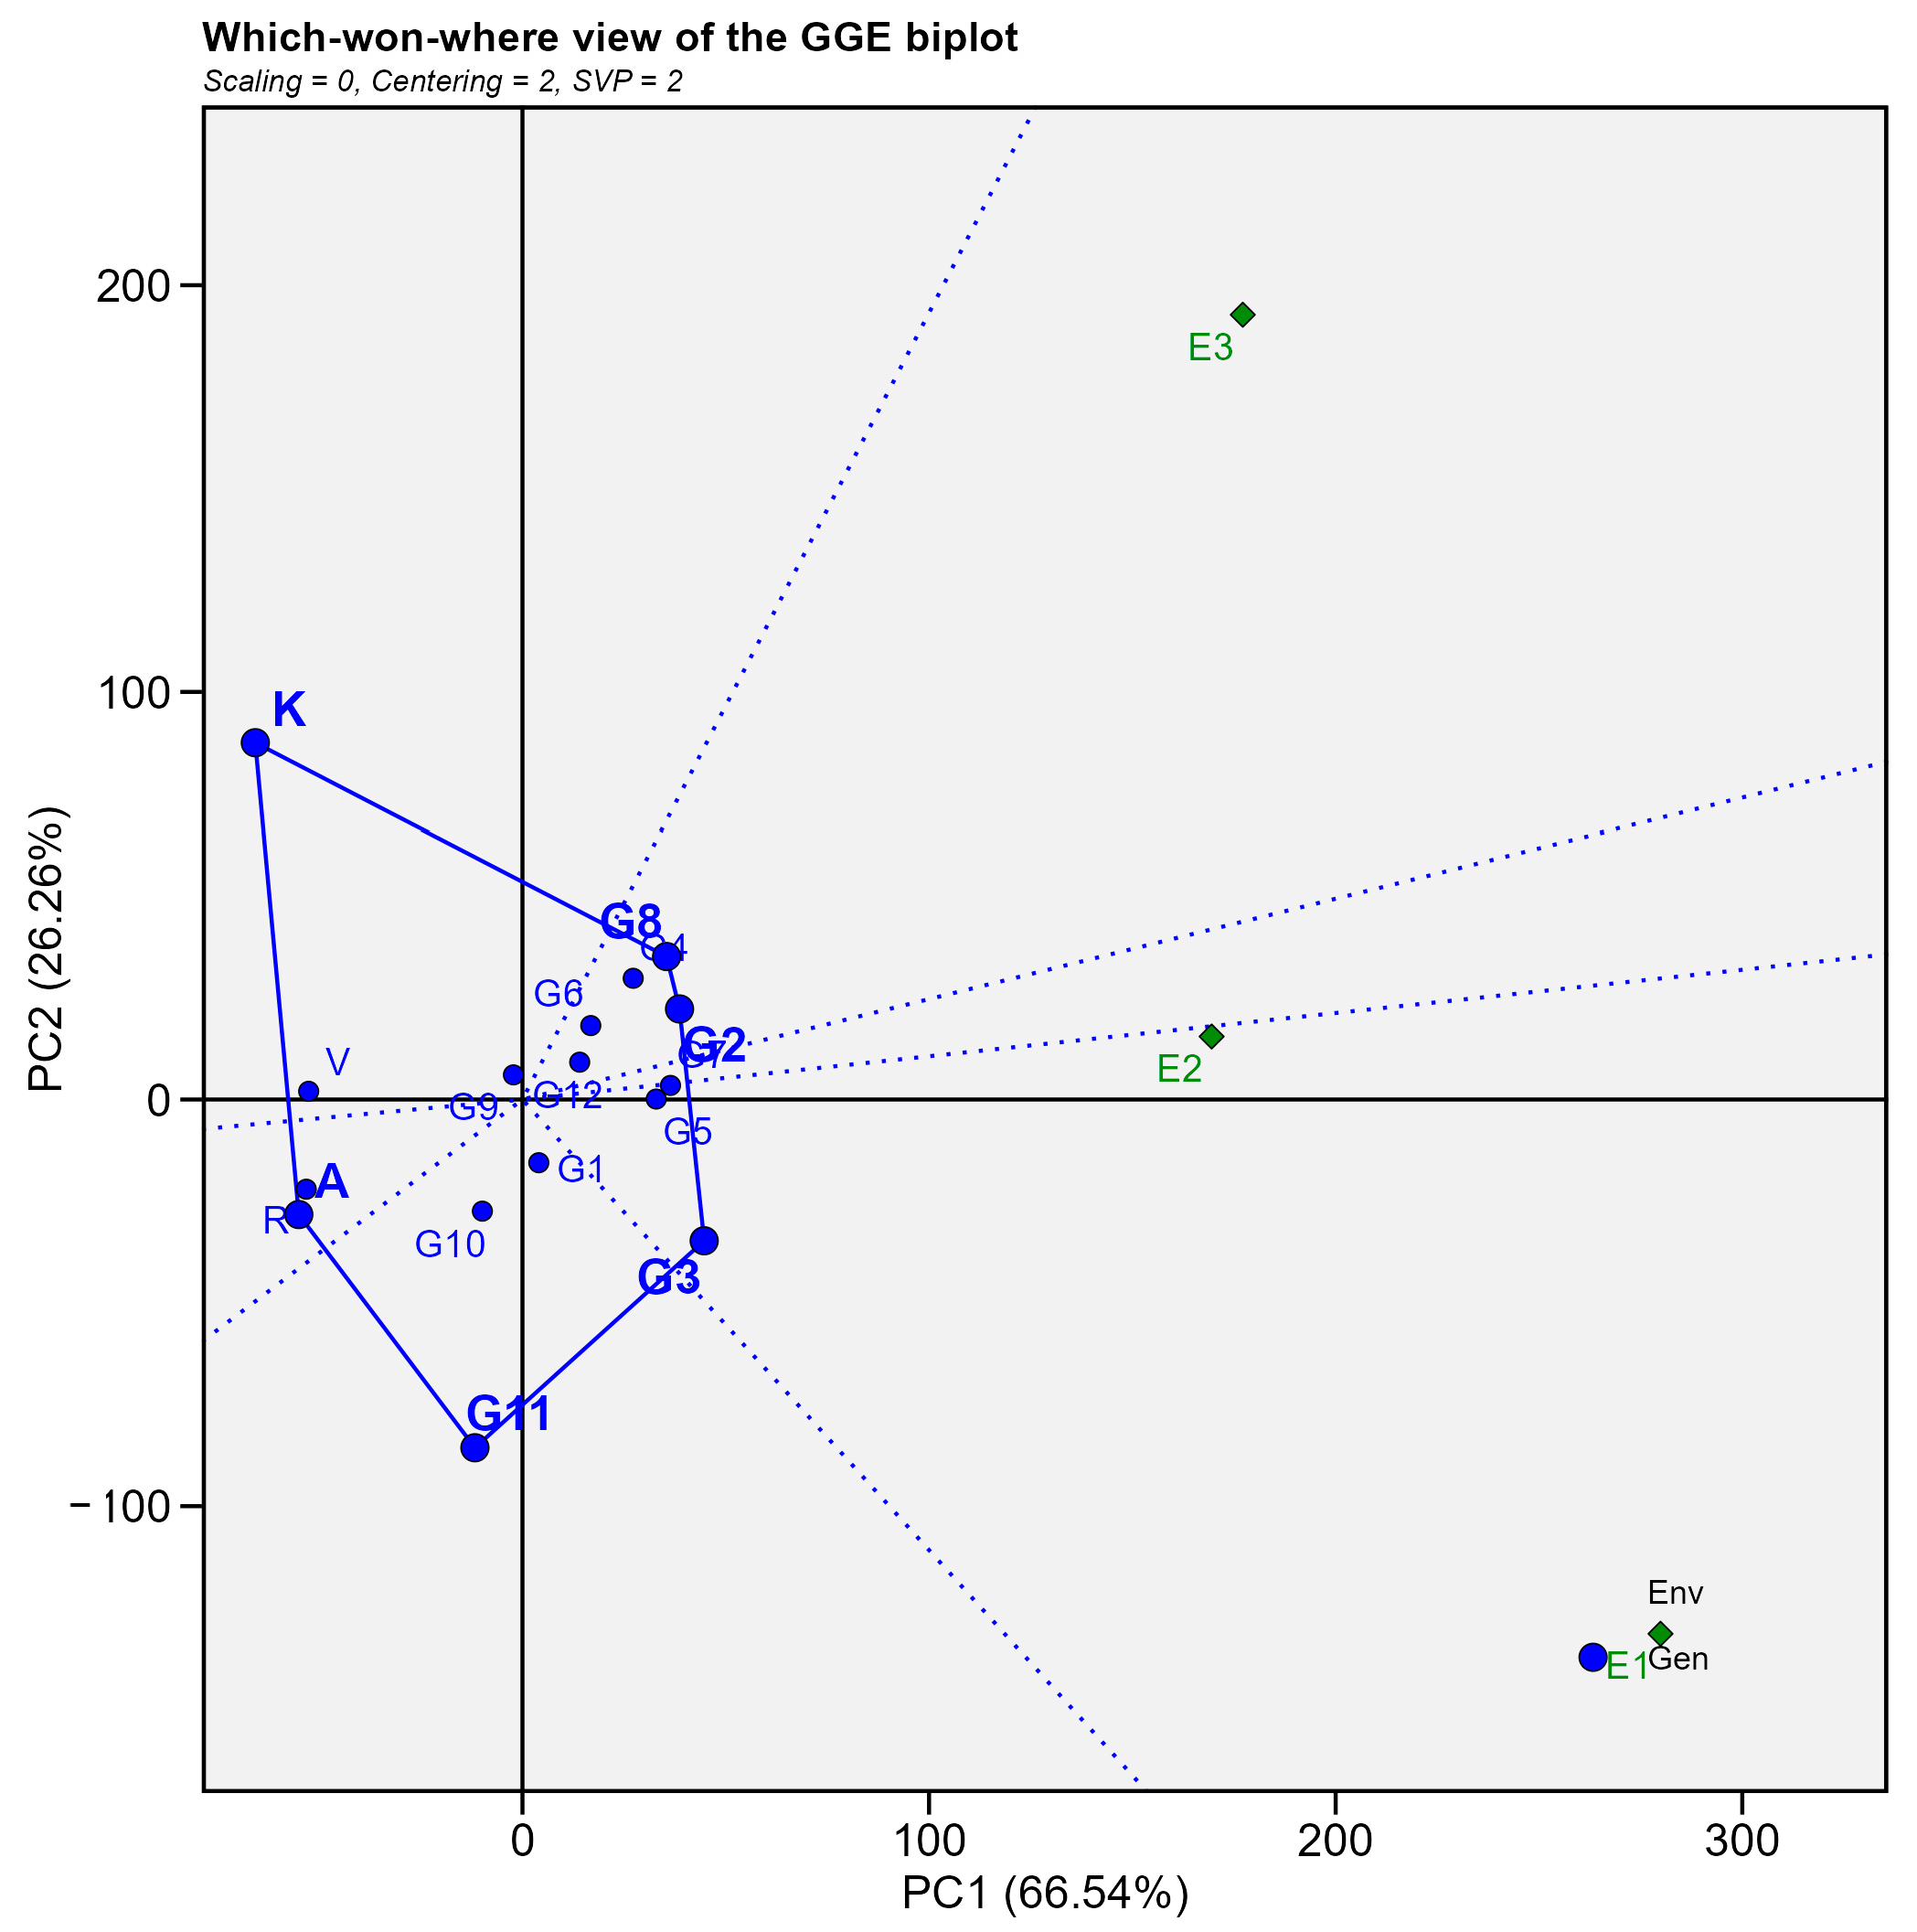
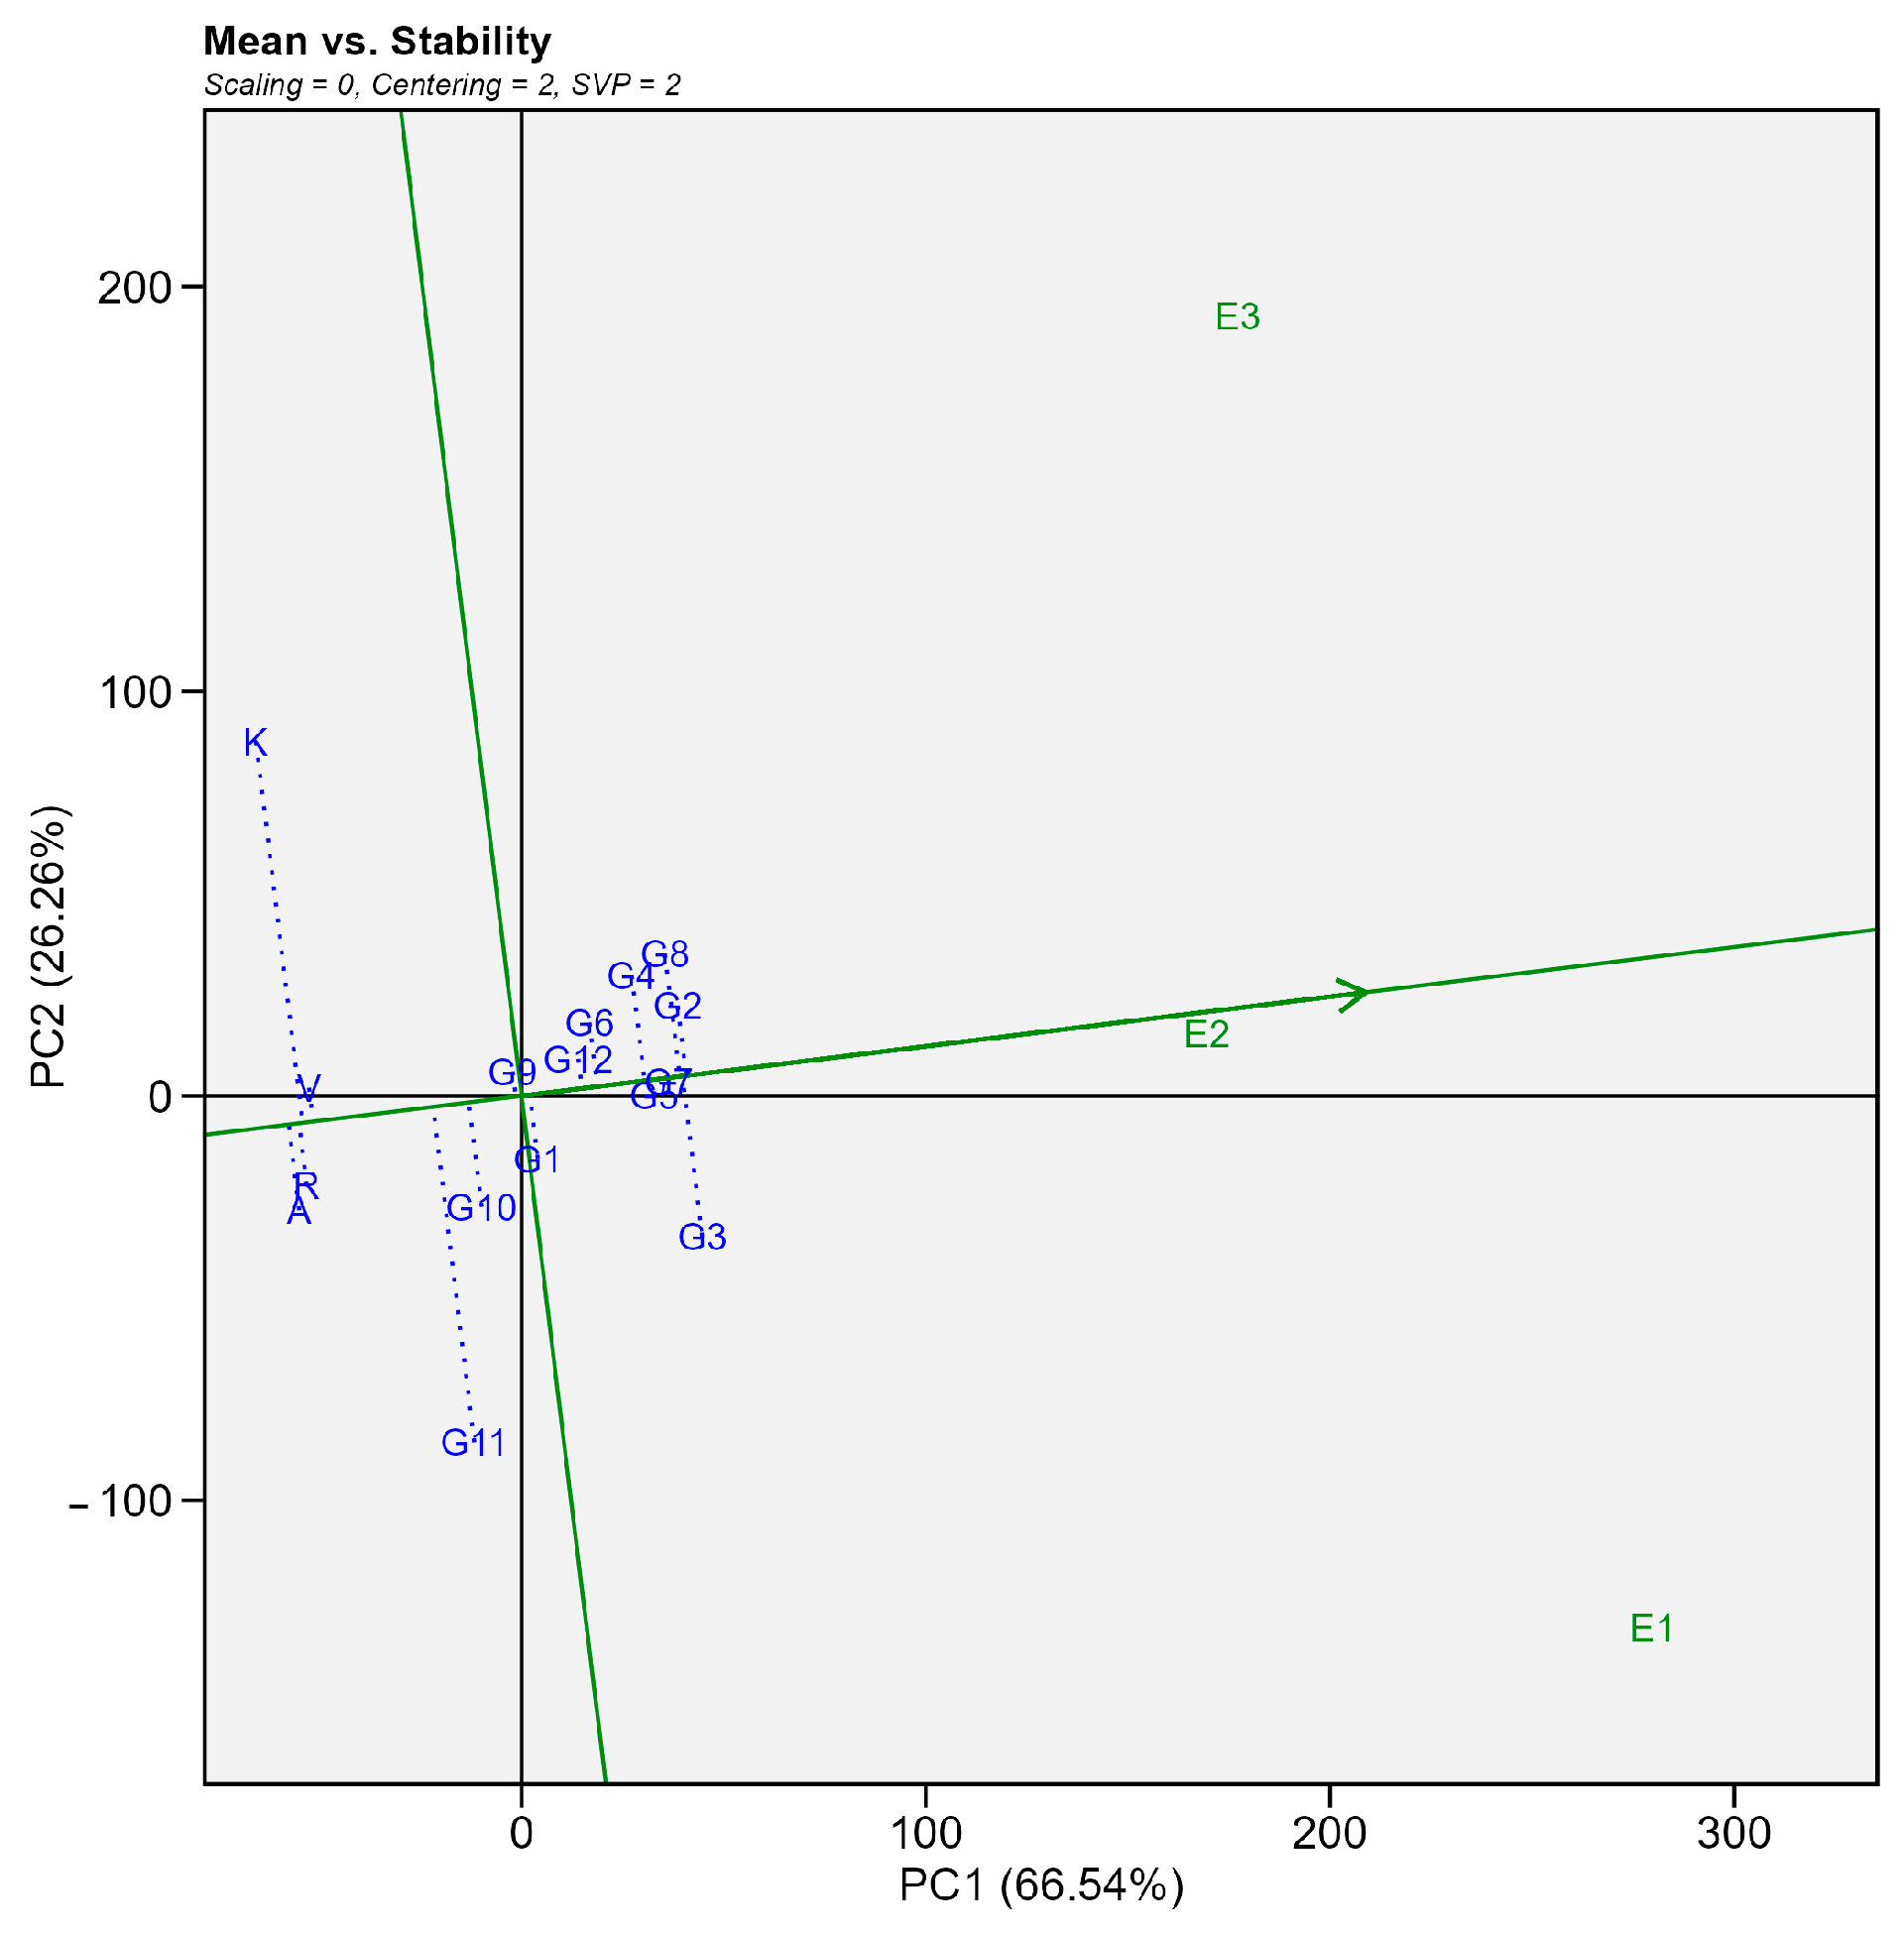
AMMI and GGE biplot analyses were used to visualize the structure of genotype × year interaction and to further characterize differences among genotypes in their yield response patterns across growing seasons (Figure 2, Figure 3 and Figure 4).
These multivariate approaches enabled simultaneous visualization of mean yield performance and interaction effects, providing a graphical synthesis of the patterns previously identified through univariate stability analyses.
In the AMMI1 biplot, growing seasons were clearly separated along the mean yield axis, with the unfavorable season E1 (2022/2023) located at the lower end of the productivity gradient and the favorable season E3 (2024/2025) at the upper end, while E2 (2023/2024) occupied an intermediate position (Figure 2). This distribution reflects the strong year effect detected in the analysis of variance. Genotypes were dispersed around the abscissa with varying distances along the interaction principal component axis, indicating differences in the magnitude of genotype × year interaction.
Several genotypes were positioned close to the abscissa, suggesting limited interaction effects and comparatively stable performance across seasons. This group included AD-7291 (A), Rakita (R), and breeding lines 214/11-240 (G5), 203T/11-4 (G7), and 164/10-302 (G12). In contrast, other genotypes showed pronounced displacement along the interaction axis, indicating stronger environmental sensitivity. The local standard cultivar Kolorit (K) exhibited the largest deviation, reflecting its substantial interaction with year effects. Genotype 158/10-310 (G11) and breeding line 203T/14-4 (G3) were also positioned further from the origin, indicating elevated interaction-related variability compared with most other entries.
The which-won-where view of the GGE biplot further illustrated shifts in genotypic performance across seasons (Figure 3). The polygon view identified different vertex genotypes associated with specific environments, confirming the presence of crossover interaction. In the favorable seasons E3 and E2, breeding lines such as 214/11-231 (G8), 48/10-172 (G2), 203T/11-4 (G7), and 20/10-267 (G4) occupied the winning sector, indicating superior relative performance under high-productivity conditions. In contrast, the unfavorable season E1 corresponded to a different sector, where genotypes such as 203T/14-4 (G3) showed comparatively better performance relative to other entries.
The average environment coordination (AEC) view of the GGE biplot provided additional differentiation among genotypes with respect to mean yield and stability (Figure 4). Genotypes located in the positive direction of the average environment axis exhibited higher mean yield across seasons; this group included breeding lines 203T/14-4 (G3), 48/10-172 (G2), 203T/11-4 (G7), and 214/11-231 (G8). Genotypes with shorter projections onto the stability axis, such as AD-7291, Rakita, 214/11-240 (G5), and 203T/11-4 (G7), showed comparatively stable performance. In contrast, Kolorit and 158/10-310 (G11) displayed larger projections, indicating greater year-to-year variability.
The relative positioning of genotypes across the three biplots was consistent with the patterns identified using univariate stability parameters and derived indices. Genotypes characterized by low interaction-related risk and high predictability tended to cluster near the origin of the AMMI biplot and showed short stability projections in the GGE AEC view (e.g., G5, G7). Conversely, genotypes with stronger responsiveness or higher interaction-related variability were located further from the origin and exhibited broader dispersion across the graphical analyses (e.g., G11).

3.7. Integrated Risk-Responsiveness-Yield Profiling of Triticale Genotypes

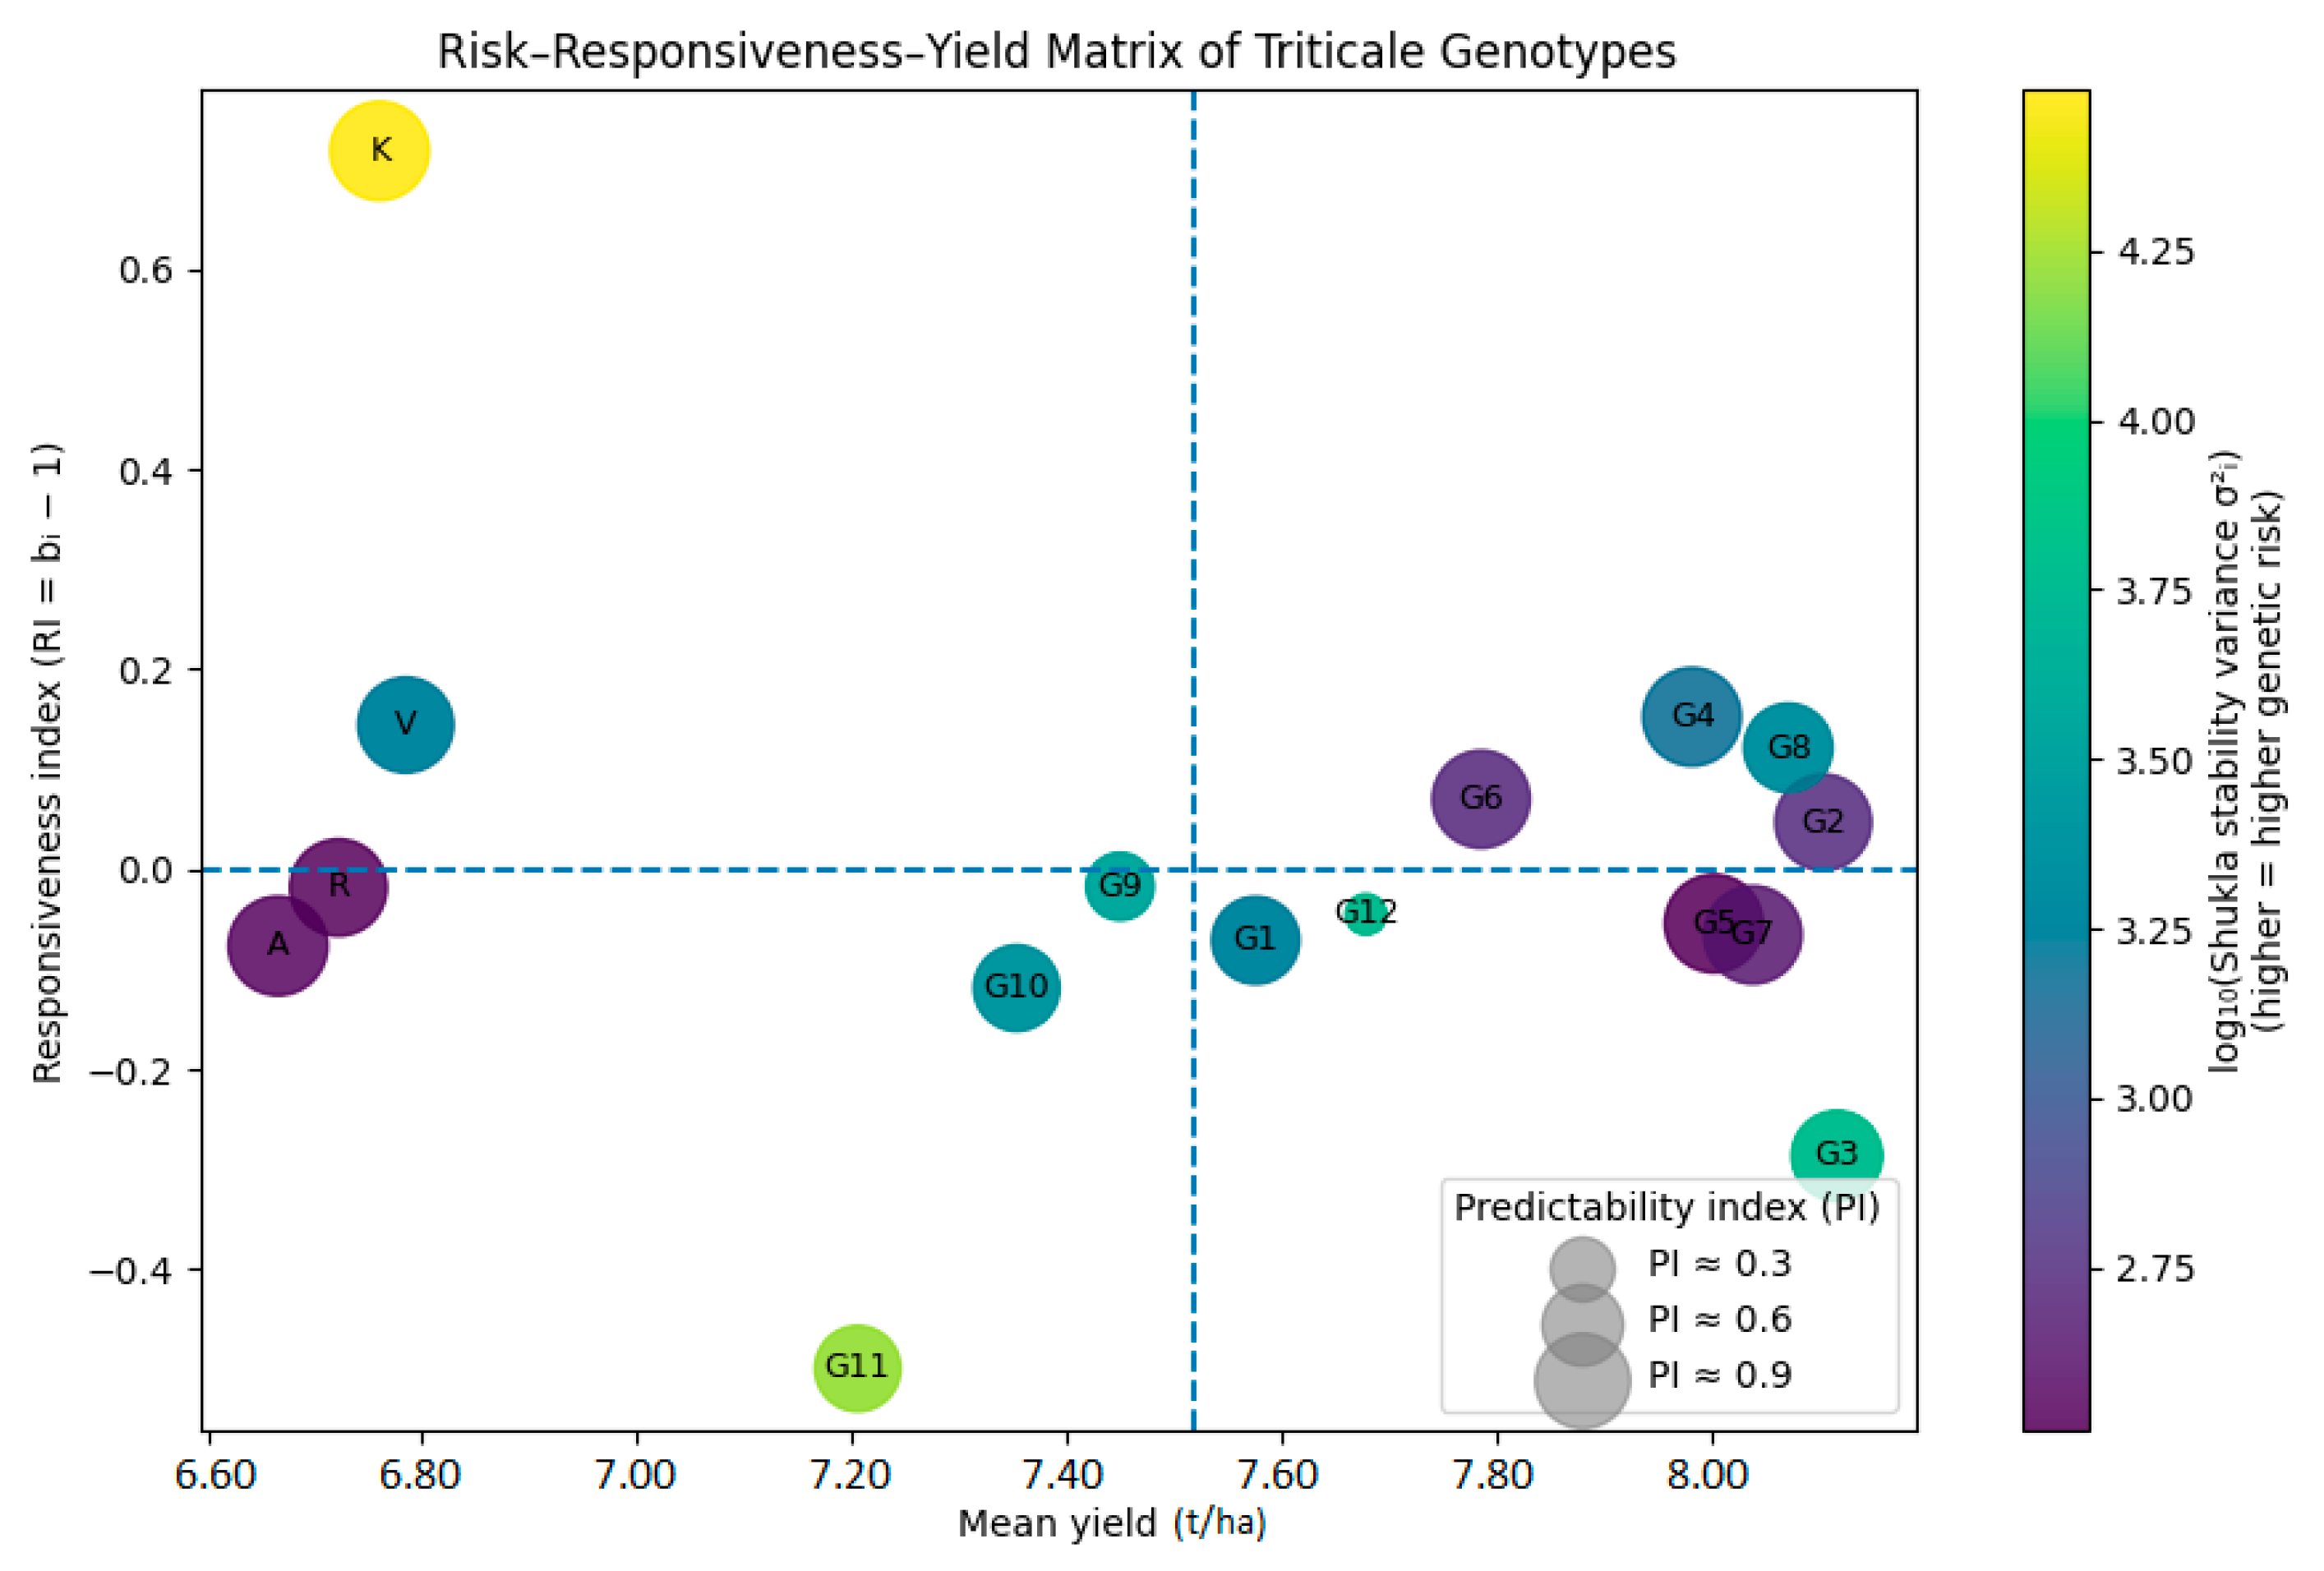
The risk-responsiveness-yield matrix (Figure 5) reveals clear differentiation among genotypes in terms of combined productivity, responsiveness, predictability, and genetic risk. The most favorable profile was shared by a group of high-yielding breeding lines (G2, G5, G6, G7), which combined balanced responsiveness, high predictability, and low interaction-related risk, indicating consistent and reliable performance across seasons.
A second group of high-yielding genotypes (G4, G8) showed slightly stronger responsiveness and moderately elevated genetic risk while maintaining good predictability. Genotype G3 represented a distinct strategy, achieving high mean yield through stress-oriented responsiveness and elevated interaction contribution rather than balanced seasonal adjustment. Among genotypes with productivity near the overall mean, contrasting profiles were evident. Some lines combined moderate yield with relatively good responsiveness but lower predictability and higher genetic risk (G9, G12), while others showed more conservative responses with greater predictability but limited yield adjustment capacity (G1, G10). Genotype G11 stood apart, combining low productivity with strongly negative responsiveness and the second highest genetic risk, suggesting limited agronomic value across the evaluated seasonal range.
The standard cultivars exhibited a particularly informative contrast. AD-7291 and Rakita showed low productivity with balanced responsiveness and low genetic risk, representing stable but yield-limited profiles. Vihren combined moderate responsiveness toward favorable conditions with elevated genetic risk despite its lower mean yield.
Kolorit represented the most extreme response pattern in the entire dataset, displaying the highest genetic risk and strongest responsiveness to favorable seasons, which translated into high yield under optimal conditions but poor performance under stress.
Taken together, the matrix demonstrates that high productivity can be achieved through contrasting adaptation strategies—either through balanced responsiveness with low interaction risk, or through strong environmental sensitivity with higher instability. This multidimensional visualization underscores the importance of jointly considering productivity, responsiveness, predictability, and interaction-related risk when evaluating genotypes for deployment under climatically variable conditions.

4. Discussion

Interannual climatic variability emerged as the dominant driver of yield variation in the present study, as evidenced by the strong year effect observed across seasons. Such predominance of temporal environmental influence is consistent with patterns reported for cereals grown under temperate and increasingly unstable climatic regimes [15,54,55,56]. However, beyond this environmental control, the significant genotype main effect and genotype × year interaction reveal that yield variability is not merely a reflection of climatic fluctuation. Instead, genotypes exhibited differentiated and structured response patterns to seasonal variability, in accordance with classical genotype × environment interaction theory [6,7,8,26].
Previous studies in triticale and other cereals have documented pronounced genotype × environment interaction, often resulting in shifts in genotypic ranking across contrasting seasons [20,36,57,58,59,60,61,62,63]. Our results confirm these findings and further show that genotype × year interaction in triticale is structured rather than random, reflecting differentiated adaptation strategies. This distinction shifts the interpretation of interaction effects from statistical variation toward biologically meaningful response organization.
Classical stability parameters revealed the multidimensional nature of genotypic yield responses. As discussed in the stability literature [11,12,20,26,52,64,65,66,67], responsiveness, predictability, and contribution to interaction variance are only partially associated, confirming that no single metric adequately captures genotype behavior. While these parameters are widely applied, they are often interpreted separately. The main novelty of the present study lies in integrating these complementary statistics into a unified, risk-oriented framework explicitly anchored in genotype × year interaction.
By translating stability parameters into derived indices describing responsiveness, predictability, and interaction-related risk, the study provides a coherent synthesis of genotypic behavior under interannual climatic variability. Although previous efforts have summarized stability information into decision-relevant descriptors in cereals [35,44,65,68,69,70], they have rarely focused specifically on temporal variability as the primary source of environmental differentiation. Here, genotype × year interaction is explicitly framed as a quantifiable dimension of production risk, advancing stability evaluation from descriptive analysis toward structured risk interpretation.
The integrated risk–responsiveness–yield profiling revealed clear differentiation among genotypes, ranging from conservative and predictable yield strategies to highly responsive but interaction-sensitive patterns. Trade-offs between yield potential and stability are widely reported in cereals [24,46,67,71,72,73,74], including triticale [42,43]. The present findings extend this knowledge by demonstrating that such trade-offs can be systematically quantified in relation to genotype × year interaction, enabling explicit visualization of adaptation strategies.
Stress robustness and yield opportunity analyses confirmed that genotypic advantages under unfavorable seasons do not necessarily coincide with superior performance under favorable conditions, reflecting classical crossover interaction and differential adaptation [19,75,76]. Similar context-dependent responses have been reported in cereals under contrasting stress regimes [44,65,77,78,79], reinforcing the biological basis of the observed interaction patterns.
Multivariate analyses using AMMI and GGE biplots supported the univariate results by revealing consistent interaction structures and distinct genotype groupings across seasons. These approaches are widely used in cereals to visualize genotype × environment interaction [37,43,66,80,81,82,83,84], and their concordance with the present stability assessment strengthens the robustness of the identified response profiles.
Overall, the study advances understanding of genotype × year interaction in triticale by demonstrating that interaction effects can be systematically decomposed, synthesized, and interpreted within a coherent risk-oriented framework. Rather than treating stability parameters as isolated descriptors, the integrated approach highlights genotype × year interaction as a biologically meaningful and quantifiable determinant of yield reliability, providing a stronger basis for genotype differentiation under interannual climatic variability.
The findings clearly demonstrate that mean yield alone is insufficient as a criterion for genotype selection in climatically variable environments. Genotypes combining high productivity with low interaction-related risk and high predictability represent the most reliable option for stable cereal production, while highly responsive genotypes, despite their yield potential under favorable conditions, introduce substantial production uncertainty. This trade-off between yield potential and stability is not incidental but reflects fundamentally different adaptation strategies, and its explicit quantification through risk-oriented indices provides breeders and agronomists with a more informed basis for varietal decision-making under increasing climatic uncertainty.

5. Conclusions

The present study demonstrates that genotype × year interaction represents a substantial and biologically meaningful component of yield variability in triticale under multi-year field conditions. The strong environmental effect confirms the dominant role of interannual climatic variability in yield formation, while the significant genotype and interaction components indicate that cultivars differ not only in productivity but also in the stability, predictability, and structure of their seasonal responses. These findings clearly show that mean yield alone is insufficient for varietal evaluation under increasingly variable climatic conditions.
The principal scientific contribution lies in the integration of complementary stability parameters into a unified, risk-oriented analytical framework explicitly linking genotype × year interaction with production reliability. By combining classical stability statistics with derived indices describing responsiveness, predictability, and interaction-related risk, the study enables differentiation of contrasting adaptation strategies and advances the conceptual understanding of yield stability beyond descriptive statistical characterization. From a practical perspective, genotypes combining competitive yield levels with predictable performance and limited interaction-related variability appear particularly suitable for reducing production risk in climatically unstable cereal-growing regions such as South Dobruja.
The study is subject to certain limitations. The experimental evaluation was conducted at a single location, and the findings therefore reflect genotype × year rather than true genotype × environment interaction in the broader sense.
Future research should expand the analytical framework across multiple locations and broader environmental gradients to validate the robustness of the proposed approach, and should integrate physiological and environmental covariates to clarify the biological mechanisms underlying differential genotypic responses.

Author Contributions

Conceptualization, H.P.S. and A.I.A.; methodology, H.P.S.; software, H.P.S.; validation, H.P.S., A.I.A. and A.Z.A.; formal analysis, H.P.S.; investigation, H.P.S.; resources, H.P.S.; data curation, A.I.A. and A.Z.A.; writing—original draft preparation, H.P.S., A.I.A. and A.Z.A.; writing—review and editing, H.P.S., A.I.A. and A.Z.A.; visualization, H.P.S.; supervision, A.I.A., A.Z.A.; project administration, A.I.A. and A.Z.A.; funding acquisition, A.Z.A. All authors have read and agreed to the published version of the manuscript.

Funding

This study was financed by the European Union—NextGenerationEU, through the National Recovery and Resilience Plan of the Republic of Bulgaria, project No BG-RRP-2.013-0001.

Data Availability Statement

The original contributions presented in this study are included in the article. Further inquiries can be directed to the corresponding author.

Acknowledgments

The research reflects some results of the work on project No. 26-FAI-01, financed by the “Scientific Research” fund of the University of Ruse. The authors are very grateful to the anonymous reviewers whose valuable comments and suggestions improved the quality of the paper.

Conflicts of Interest

The authors declare no conflicts of interest.

Abbreviations

The following abbreviations are used in this manuscript:
AMMIAdditive main effects and multiplicative interaction
GGEGenotype plus genotype × environment interaction
GRIGenetic Risk Index
PIPredictability Index
RIResponsiveness Index
SRIStress Robustness Index
YOIYield Opportunity Index

References

  1. Allard, R.W.; Bradshaw, A.D. Implications of genotype-environmental interactions in applied plant breeding. Crop Sci. 1964, 4, 503–508. [Google Scholar] [CrossRef]
  2. Cooper, M.; Stucker, R.E.; DeLacy, I.H.; Harch, B.D. Wheat breeding nurseries, target environments, and indirect selection for grain yield. Crop Sci. 1997, 37, 1168–1176. [Google Scholar] [CrossRef]
  3. Basford, K.E.; Cooper, M. Genotype × environment interactions and some considerations of their implications for wheat breeding in Australia. Aust. J. Agric. Res. 1998, 49, 153–174. [Google Scholar] [CrossRef]
  4. Begna, T. The role of genotype by environmental interaction in plant breeding. Int. J. Agric. Biosci. 2020, 9, 209–215. [Google Scholar]
  5. Pour-Aboughadareh, A.; Khalili, M.; Poczai, P.; Olivoto, T. Stability indices to deciphering the genotype-by-environment interaction (GEI) effect: An applicable review for use in plant breeding programs. Plants 2022, 11, 414. [Google Scholar] [CrossRef]
  6. Becker, H.C.; Leon, J. Stability analysis in plant breeding. Plant Breed. 1988, 101, 1–23. [Google Scholar] [CrossRef]
  7. Finlay, K.W.; Wilkinson, G.N. The analysis of adaptation in a plant-breeding programme. Aust. J. Agric. Res. 1963, 14, 742–754. [Google Scholar] [CrossRef]
  8. Eberhart, S.T.; Russell, W.A. Stability parameters for comparing varieties. Crop Sci. 1966, 6, 36–40. [Google Scholar] [CrossRef]
  9. Li, X.; Guo, T.; Bai, G.; Zhang, Z.; See, D.; Marshall, J.; Yu, J. Genetics-inspired data-driven approaches explain and predict crop performance fluctuations attributed to changing climatic conditions. Mol. Plant 2022, 15, 203–206. [Google Scholar] [CrossRef]
  10. Kumar, A.; Gill, A.S.; Sharma, A.; Kumar, V. Enhancing the explainability and interpretability of crop yield prediction models through precision agriculture. In Proceedings of the International Conference on Agriculture-Centric Computation; Springer Nature: Cham, Switzerland, 2024; pp. 218–226. [Google Scholar]
  11. Piepho, H.P. Stability analysis using the SAS system. Agron. J. 1999, 91, 154–160. [Google Scholar] [CrossRef]
  12. Kang, M.S. Breeding: Genotype-by-environment interaction. In Encyclopedia of Plant and Crop Science; Goodman, R.M., Ed.; Marcel Dekker: New York, NY, USA, 2004; pp. 218–221. [Google Scholar]
  13. Reckling, M.; Ahrends, H.; Chen, T.W.; Eugster, W.; Hadasch, S.; Knapp, S.; Döring, T.F. Methods of yield stability analysis in long-term field experiments: A review. Agron. Sustain. Dev. 2021, 41, 27. [Google Scholar] [CrossRef]
  14. Lobell, D.B.; Bänziger, M.; Magorokosho, C.; Vivek, B. Nonlinear heat effects on African maize as evidenced by historical yield trials. Nat. Clim. Chang. 2011, 1, 42–45. [Google Scholar] [CrossRef]
  15. Trnka, M.; Rötter, R.P.; Ruiz-Ramos, M.; Kersebaum, K.C.; Olesen, J.E.; Žalud, Z.; Semenov, M.A. Adverse weather conditions for European wheat production will become more frequent with climate change. Nat. Clim. Chang. 2014, 4, 637–643. [Google Scholar] [CrossRef]
  16. Shahid, M.R.; Wakeel, A.; Ishaque, W.; Ali, S.; Soomro, K.B.; Awais, M. Optimizing different adaptive strategies by using crop growth modeling under IPCC climate change scenarios for sustainable wheat production. Environ. Dev. Sustain. 2021, 23, 11310–11334. [Google Scholar] [CrossRef]
  17. Bathiany, S.; Belleflamme, A.; Zohbi, J.E.; Ney, P.; Goergen, K.; Rechid, D. Increasing interannual climate variability during crop flowering in Europe. Environ. Res. Lett. 2023, 18, 044037. [Google Scholar] [CrossRef]
  18. Knight, C.; Khouakhi, A.; Waine, T.W. The impact of weather patterns on inter-annual crop yield variability. Sci. Total Environ. 2024, 955, 177181. [Google Scholar] [CrossRef]
  19. Crossa, J. Statistical analyses of multilocation trials. Adv. Agron. 1990, 44, 55–85. [Google Scholar]
  20. Stoyanov, H. Environment adjusted yield model for ranking and stability assessment of winter triticale (×Triticosecale Wittm.) genotypes. Int. J. Innov. Approaches Agric. Res. 2021, 5, 141–157. [Google Scholar] [CrossRef]
  21. Yan, W.; Kang, M.S. GGE Biplot Analysis: A Graphical Tool for Breeders, Geneticists, and Agronomists; CRC Press: Boca Raton, FL, USA, 2002. [Google Scholar]
  22. Van Eeuwijk, F.A.; Bustos-Korts, D.V.; Malosetti, M. What should students in plant breeding know about the statistical aspects of genotype × environment interactions? Crop Sci. 2016, 56, 2119–2140. [Google Scholar] [CrossRef]
  23. Cooper, M.; Messina, C.D.; Tang, T.; Gho, C.; Powell, O.M.; Podlich, D.W.; Technow, F.; Hammer, G.L. Predicting Genotype × Environment × Management (G × E × M) interactions for the design of crop improvement strategies: Integrating breeder, agronomist, and farmer perspectives. Plant Breed. Rev. 2022, 46, 467–585. [Google Scholar]
  24. Sadras, V.O.; Richards, R.A. Improvement of crop yield in dry environments: Benchmarks, levels of organisation and the role of nitrogen. J. Exp. Bot. 2014, 65, 1981–1995. [Google Scholar] [CrossRef] [PubMed]
  25. Sadras, V.O.; Hayman, P.T. The causal arrows from genotype, environment, and management to plant phenotype are double headed. J. Exp. Bot. 2025, 76, 917–930. [Google Scholar] [CrossRef] [PubMed]
  26. Kona, P.; Vinayaka; Amaresh; Lakshmi Pathy, T.; Gopalareddy, K.; Maruthi, R.T.; Mahadeva Swamy, H.K.; Mohanraj, K.; Anna Durai, A.; Shanthi, R.M.; et al. Efficiency of multivariate statistical models in analysis of G × E interactions. In Genotype × Environment Interactions and Its Implications for Plant Breeding; Mohammadi, R., Jalal Kamali, M.R., Amri, A., Kehel, Z., Sadeghzadeh, B., Eds.; Springer: Singapore, 2026. [Google Scholar] [CrossRef]
  27. Shukla, G.K. Genotype Stability Analysis and Its Application to Potato Regional Trails. Crop Sci. 1972, 11, 184–190. [Google Scholar]
  28. Gauch, H.G., Jr. Statistical analysis of yield trials by AMMI and GGE. Crop Sci. 2006, 46, 1488–1500. [Google Scholar] [CrossRef]
  29. Yan, W.; Tinker, N.A. Biplot analysis of multi-environment trial data: Principles and applications. Can. J. Plant Sci. 2006, 86, 623–645. [Google Scholar] [CrossRef]
  30. Pierce, F.J.; Nowak, P. Aspects of precision agriculture. Adv. Agron. 1999, 67, 1–85. [Google Scholar]
  31. Gebbers, R.; Adamchuk, V.I. Precision agriculture and food security. Science 2010, 327, 828–831. [Google Scholar] [CrossRef]
  32. Mulla, D.J. Twenty five years of remote sensing in precision agriculture: Key advances and remaining knowledge gaps. Biosyst. Eng. 2013, 114, 358–371. [Google Scholar] [CrossRef]
  33. Cooper, M.; Messina, C.D.; Podlich, D.; Totir, L.R.; Baumgarten, A.; Hausmann, N.J.; Graham, G. Predicting the future of plant breeding: Complementing empirical evaluation with genetic prediction. Crop Pasture Sci. 2014, 65, 311–336. [Google Scholar] [CrossRef]
  34. Messina, C.D.; Cooper, M.; Hammer, G.L.; Berning, D.; Ciampitti, I.; Clark, R.; Diepenbrock, C.; Gho, C.; Jines, M.; Lee, T.; et al. Two decades of creating drought tolerant maize and underpinning prediction technologies in the US corn-belt: Review and perspectives on the future of crop design. bioRxiv 2020. [Google Scholar] [CrossRef]
  35. Kang, M.S. Genotype-environment interaction: Progress and prospects. In Quantitative Genetics, Genomics and Plant Breeding; Kang, M.S., Ed.; CABI: Wallingford, UK, 2002; pp. 221–243. [Google Scholar]
  36. Kendal, E.; Sayar, M.S.; Tekdal, S.; Aktaş, H.; Karaman, M. Assessment of the impact of ecological factors on yield and quality parameters in triticale using GGE biplot and AMMI analysis. Pak. J. Bot. 2016, 48, 1903–1913. [Google Scholar]
  37. Kendal, E.; Tekdal, S.; Karaman, M. Proficiency of biplot methods (AMMI and GGE) in the appraisal of triticale genotypes in multiple environments. Appl. Ecol. Environ. Res. 2019, 17, 5995–6007. [Google Scholar] [CrossRef]
  38. Stoyanov, H.; Baychev, V.; Petrova, T.; Mihova, G. Triticale cultivars suitable for growing under high level of abiotic stress. J. Mount. Agric. Balkans 2017, 20, 223–242. [Google Scholar]
  39. Stoyanov, H. Effect of drought on yield and yield components of triticale in the conditions of South Dobrudzha. Sci. Pap. Ser. A Agron. 2021, 64, 556–568. [Google Scholar]
  40. Kostov, G.; Kirchev, H. Productivity and quality of common wheat varieties (Triticum aestivum L.) in the climatic conditions of Southern Dobrudzha. Agric. Sci. 2025, 17, 59–65. [Google Scholar] [CrossRef]
  41. Stoyanov, H.; Baychev, V.; Belchev, I. Productivity and characteristics of triticale (×Triticosecale Wittmack) dihaploid lines. Bulg. J. Crop Sci. 2018, 55, 34–42. [Google Scholar]
  42. Stoyanov, H.; Baychev, V. Achievements and tendencies in the breeding of triticale (×Triticosecale Wittm.) in Bulgaria. Bulg. J. Crop Sci. 2023, 60, 3–16. [Google Scholar] [CrossRef]
  43. Stoyanov, H. Productivity and stability characteristics of winter hexaploid triticale cultivars with different geographical origins. I. Real yield features. J. Mount. Agric. Balkans 2024, 27, 220–244. [Google Scholar]
  44. Tsenov, N.; Nankova, M. Delineation of wheat varieties suitable for stress and non-stress conditions using yield-based productivity and tolerance indices. Genetika 2025, 57, 299–314. [Google Scholar] [CrossRef]
  45. Fischer, R.A.; Maurer, R. Drought resistance in spring wheat cultivars. I. Grain yield responses. Aust. J. Agric. Res. 1978, 29, 897–912. [Google Scholar] [CrossRef]
  46. Blum, A. Plant Breeding for Stress Environments; CRC Press: Boca Raton, FL, USA, 2018. [Google Scholar]
  47. Farshadfar, E.; Javadinia, J. Evaluation of chickpea (Cicer arietinum L.) genotypes for drought tolerance. Seed Plant Improv. J. 2011, 27, 517–537. [Google Scholar]
  48. Farshadfar, E.; Poursiahbidi, M.M.; Abooghadareh, A.P. Repeatability of drought tolerance indices in bread wheat genotypes. Int. J. Agric. Crop Sci. 2012, 4, 891–903. [Google Scholar]
  49. Farshadfar, E.; Mohammadi, R.; Farshadfar, M.; Dabiri, S. Relationships and repeatability of drought tolerance indices in wheat-rye disomic addition lines. Aust. J. Crop Sci. 2013, 7, 130–138. [Google Scholar]
  50. Lamba, K.; Kumar, M.; Singh, V.; Chaudhary, L.; Sharma, R.; Yashveer, S.; Dalal, M.S. Heat stress tolerance indices for identification of the heat tolerant wheat genotypes. Sci. Rep. 2023, 13, 10842. [Google Scholar] [CrossRef] [PubMed]
  51. Ghazvini, H.; Pour-Aboughadareh, A.; Jasemi, S.S.; Chaichi, M.; Tajali, H.; Bocianowski, J. A framework for selection of high-yielding and drought-tolerant genotypes of barley: Applying yield-based indices and multi-index selection models. J. Crop Health 2024, 76, 601–616. [Google Scholar] [CrossRef]
  52. Ceccarelli, S.; Grando, S. Genotype × environment interaction in breeding programs: Wide vs. specific adaptation. In Genotype × Environment Interactions and Its Implications for Plant Breeding; Mohammadi, R., Jalal Kamali, M.R., Amri, A., Kehel, Z., Sadeghzadeh, B., Eds.; Springer: Singapore, 2026. [Google Scholar] [CrossRef]
  53. Olivoto, T.; Lúcio, A.D.C. metan: An R package for multi-environment trial analysis. Methods Ecol. Evol. 2020, 11, 783–789. [Google Scholar] [CrossRef]
  54. Chloupek, O.; Hrstkova, P.; Schweigert, P. Yield and its stability, crop diversity, adaptability and response to climate change, weather and fertilisation over 75 years in the Czech Republic in comparison to some European countries. Field Crops Res. 2004, 85, 167–190. [Google Scholar] [CrossRef]
  55. Powell, N.; Ji, X.; Ravash, R.; Edlington, J.; Dolferus, R. Yield stability for cereals in a changing climate. Funct. Plant Biol. 2012, 39, 539–552. [Google Scholar] [CrossRef]
  56. Bonfil, D.J.; Abbo, S.; Degen, D.; Simchon, Y.; Ben-David, R. Towards stable wheat grain yield and quality under climatic instability. Agron. J. 2023, 115, 1622–1639. [Google Scholar] [CrossRef]
  57. Collier, G.R.; Spaner, D.M.; Beres, B.L. Learning to balance wheat G × E × M interactions in response to a changing climate—The case for ultra-early planting systems. Agron. J. 2024, 116, 395–414. [Google Scholar] [CrossRef]
  58. Varughese, G. Triticale: Present status and challenges ahead. In Triticale: Today and Tomorrow; Guedes-Pinto, H., Ed.; Kluwer Academic Publishers: Dordrecht, The Netherlands, 1996; pp. 13–20. [Google Scholar]
  59. Estrada-Campuzano, G.; Slafer, G.A.; Miralles, D.J. Differences in yield, biomass and their components between triticale and wheat grown under contrasting water and nitrogen environments. Field Crops Res. 2012, 128, 167–179. [Google Scholar] [CrossRef]
  60. Mut, Z.; Erbaş Köse, Ö.D.; Akay, H. Variation in grain mineral contents of oat genotypes grown at six locations. Gesunde Pflanz. 2022, 74, 583–593. [Google Scholar] [CrossRef]
  61. Mohammadi, R.; Amri, A. Genotype × environment interaction and genetic improvement for yield and yield stability of rainfed durum wheat in Iran. Euphytica 2013, 192, 227–249. [Google Scholar] [CrossRef]
  62. Gupta, V.; Kumar, M.; Singh, V.; Chaudhary, L.; Yashveer, S.; Sheoran, R.; Dalal, M.S.; Nain, A.; Lamba, K.; Gangadharaiah, N.; et al. Genotype by environment interaction analysis for grain yield of wheat (Triticum aestivum L. em. Thell) genotypes. Agriculture 2022, 12, 1002. [Google Scholar] [CrossRef]
  63. Bhandari, R.; Poudel, M.R. Genotype × environment interaction and selection parameters for high yielding wheat genotypes under irrigated and heat stress environment. J. Sustain. Agric. Environ. 2024, 3, e12098. [Google Scholar] [CrossRef]
  64. Gauch, H.G. A Simple Protocol for AMMI Analysis of Yield Trials. Crop Sci. 2013, 53, 1860–1869. [Google Scholar] [CrossRef]
  65. Stoyanov, H. Stability and adaptability of yield and yield related traits in Bulgarian triticale (×Triticosecale Wittm.) cultivars in drought conditions. AgroLife Sci. J. 2022, 11, 2. [Google Scholar] [CrossRef]
  66. Stoyanov, H.; Stefanova-Dobreva, S.; Muhova, A. Productivity and stability of Bulgarian triticale cultivars under different levels of nitrogen fertilization and contrasting environments. Sci. Pap.-Ser. A-Agron. 2024, 67, 380–391. [Google Scholar]
  67. Stoyanov, H. Productivity and stability of a collection of common winter wheat (Triticum aestivum L.) cultivars under contrasting growing conditions. Bulg. J. Crop Sci. 2025, 62, 37–50. [Google Scholar] [CrossRef]
  68. Ajay, B.C.; Aravind, J.; Fiyaz, R.A.; Kumar, N.; Lal, C.; Gangadhar, K.; Praveen, K.; Bera, S.K. Rectification of modified AMMI stability value (MASV). Indian J. Genet. Plant Breed. 2019, 79, 726–731. [Google Scholar] [CrossRef]
  69. Pezeshkpour, P.; Fallahi, D.; Karimizadeh, R.; Mirzaei, A.; Barzali, M. Analysis of genotype-by-environmental interaction in genotypes of chickpea using AMMI and BLUP-based indices. Crop Sci. Res. Arid Reg. 2025, 7, 337–362. [Google Scholar]
  70. Florax, R.J.; Voortman, R.L.; Brouwer, J. Spatial dimensions of precision agriculture: A spatial econometric analysis of millet yield on Sahelian coversands. Agric. Econ. 2002, 27, 425–443. [Google Scholar] [CrossRef]
  71. Ceccarelli, S. Positive interpretation of genotype by environment interactions in relation to sustainability and biodiversity. In Plant Adaptation and Crop Improvement; International Rice Research Institute: Los Baños, Philippines, 1996; pp. 467–486. [Google Scholar]
  72. Sinebo, W. Trade off between yield increase and yield stability in three decades of barley breeding in a tropical highland environment. Field Crops Res. 2005, 92, 35–52. [Google Scholar] [CrossRef]
  73. Tsenov, N.; Gubatov, T. Comparison of basic methods for estimating the size and stability of grain yield in winter wheat. Rastenievadni Nauk. 2018, 55, 9–19. (In Bulgarian) [Google Scholar]
  74. Khan, I.; Gul, S.; Khan, N.U.; Fawibe, O.O.; Akhtar, N.; Rehman, M.; Sabah, N.; Tahir, M.A.; Iqbal, A.; Naz, F.; et al. Stability analysis of wheat through genotype by environment interaction in three regions of Khyber Pakhtunkhwa, Pakistan. SABRAO J. Breed. Genet. 2023, 55, 50–60. [Google Scholar] [CrossRef]
  75. Singh, M.; Ceccarelli, S.; Grando, S. Genotype × environment interaction of crossover type: Detecting its presence and estimating the crossover point. Theor. Appl. Genet. 1999, 99, 988–995. [Google Scholar] [CrossRef]
  76. Crossa, J.; Yang, R.C.; Cornelius, P.L. Studying crossover genotype × environment interaction using linear-bilinear models and mixed models. J. Agric. Biol. Environ. Stat. 2004, 9, 362–380. [Google Scholar] [CrossRef]
  77. Sardouei-Nasab, S.; Mohammadi-Nejad, G.; Nakhoda, B. Yield stability in bread wheat germplasm across drought stress and non-stress conditions. Agronomy 2019, 111, 175–181. [Google Scholar] [CrossRef]
  78. Daiyoulhagh, D.; Rashidi, V.; Aharizad, S.; Farahvash, F.; Mershekari, B. Yield stability analysis of advanced spring wheat genotypes under non-stress and drought stress conditions. Plant Prod. 2021, 44, 489–502. [Google Scholar]
  79. Saed-Moucheshi, A.; Babaei, S.; Ansarshourijeh, F. Innovative multi-trial breeding and genotype screening in triticale (×Triticosecale Wittmack) for enhanced stability under drought stress. Sci. Rep. 2024, 14, 28273. [Google Scholar] [CrossRef]
  80. Kumar, V.; Kharub, A.S.; Verma, R.P.S.; Verma, A. AMMI, GGE biplots and regression analysis to comprehend the G × E interaction in multi-environment barley trials. Indian J. Genet. Plant Breed. 2016, 76, 202–204. [Google Scholar] [CrossRef]
  81. Mohammadi, R.; Armion, M.; Sadeghzadeh, B.; Golkari, S.; Khalilzadeh, G.R.; Ahmadi, H.; Abediasl, G.; Eskandari Torbaghan, M. Assessment of grain yield stability and adaptability of rainfed durum wheat breeding lines. Appl. Field Crops Res. 2016, 29, 25–42. [Google Scholar]
  82. Kizilgeci, F.; Albayrak, O.; Yildirim, M.; Akinci, C. Stability evaluation of bread wheat genotypes under varying environments by AMMI model. Fresenius Environ. Bull. 2019, 28, 6865–6872. [Google Scholar]
  83. Göçmen, D.B. Grain yield stability of durum wheat genotypes: A graphical approach. Turk. J. Field Crops 2025, 30, 164–174. [Google Scholar] [CrossRef]
  84. Panthi, B.; Poudel, M.R.; Nyaupane, S.; Kunwar, P. Exploring the genetic potential and genotype × environment interaction of winter wheat genotypes (Triticum aestivum L.) under irrigated and heat stress conditions. Int. J. Genom. 2025, 2025, 9681042. [Google Scholar] [CrossRef]
Figure 1. Monthly thermal and precipitation conditions during the experimental seasons compared with the long-term average (1960–2025): (a) mean monthly air temperature; (b) total monthly precipitation.
Agronomy 16 00664 g001
Figure 2. AMMI1 biplot of triticale genotypes across three growing seasons. Years: 2022/2023 (E1), 2023/2024 (E2), and 2024/2025 (E3); Genotypes: AD-7291 (A), Vihren (V), Rakita (R), Kolorit (K), 137/09-264 (G1), 48/10-172 (G2), 203T/14-4 (G3), 20/10-267 (G4), 214/11-240 (G5), 46/09-188 (G6), 203T/11-4 (G7), 214/11-231 (G8), 214/11-223 (G9), 47/10-101 (G10), 158/10-310 (G11), 164/10-302 (G12).
Agronomy 16 00664 g002
Figure 3. Which-won-where view of the GGE biplot for triticale genotypes evaluated across three growing seasons. Years: 2022/2023 (E1), 2023/2024 (E2), and 2024/2025 (E3); Genotypes: AD-7291 (A), Vihren (V), Rakita (R), Kolorit (K), 137/09-264 (G1), 48/10-172 (G2), 203T/14-4 (G3), 20/10-267 (G4), 214/11-240 (G5), 46/09-188 (G6), 203T/11-4 (G7), 214/11-231 (G8), 214/11-223 (G9), 47/10-101 (G10), 158/10-310 (G11), 164/10-302 (G12).
Agronomy 16 00664 g003
Figure 4. Mean performance and stability of triticale genotypes based on the GGE biplot (AEC—Average Environment Coordination view). Years: 2022/2023 (E1), 2023/2024 (E2), and 2024/2025 (E3); Genotypes: AD-7291 (A), Vihren (V), Rakita (R), Kolorit (K), 137/09-264 (G1), 48/10-172 (G2), 203T/14-4 (G3), 20/10-267 (G4), 214/11-240 (G5), 46/09-188 (G6), 203T/11-4 (G7), 214/11-231 (G8), 214/11-223 (G9), 47/10-101 (G10), 158/10-310 (G11), 164/10-302 (G12).
Agronomy 16 00664 g004
Figure 5. Risk-Responsiveness-Yield matrix of triticale genotypes based on multi-year field data. Genotypes: AD-7291 (A), Vihren (V), Rakita (R), Kolorit (K), 137/09-264 (G1), 48/10-172 (G2), 203T/14-4 (G3), 20/10-267 (G4), 214/11-240 (G5), 46/09-188 (G6), 203T/11-4 (G7), 214/11-231 (G8), 214/11-223 (G9), 47/10-101 (G10), 158/10-310 (G11), 164/10-302 (G12).
Agronomy 16 00664 g005
Table 1. Analysis of variance (ANOVA) for grain yield of triticale genotypes across three growing seasons.
SourceSSdfMSFSig.SS%
Genotype66.552154.43739.9180.000 *11.08
Environment475.3692237.6852138.4640.000 *79.13
GxE37.491301.24911.2440.000 *6.24
Error21.3401920.111--3.55
Total600.752239----
SS—sum of squares; df—degrees of freedom; MS—mean square; F—F-ratio; Sig.—level of significance (* p < 0.001); SS%—percentage of total sum of squares; GxE—genotype × environment interaction.
Table 2. Mean grain yield of triticale genotypes (t/ha) across three growing seasons (E1–E3) and overall mean performance.
Genotype2022/2023 (E1)2023/2024 (E2)2024/2025 (E3)Mean
AD-7291 (A)4.9207.0418.0366.666
Vihren (V)4.5587.4558.3416.785
Rakita (R)4.8157.2868.0656.722
Kolorit (K)3.4867.5419.2546.760
137/09-264 (G1)5.7188.2858.7267.576
48/10-172 (G2)6.1688.3939.7548.105
203T/14-4 (G3)6.6818.6938.9798.118
20/10-267 (G4)5.7688.5679.6137.983
214/11-240 (G5)6.1788.5079.3248.003
46/09-188 (G6)5.7938.1259.4417.786
203T/11-4 (G7)6.2998.3349.4858.039
214/11-231 (G8)6.0358.2599.9238.072
214/11-223 (G9)5.7337.3929.2257.450
47/10-101 (G10)5.5808.0618.4207.354
158/10-310 (G11)6.1547.7507.7137.206
164/10-302 (G12)6.0517.4929.4947.679
Mean5.6217.9498.9877.519
LSD0.050.3770.4680.4140.834
LSD0.010.5000.6220.5501.123
LSD0.0010.6500.8080.7151.488
Table 3. Stability parameters and derived responsiveness, predictability, and risk indices of triticale genotypes across three growing seasons.
GenotypebiS2diσ2iRIPIGRISRIYOI
AD-7291 (A)0.9237.3357.1−0.0770.9990.0120.8750.894
Vihren (V)1.144501.41737.00.1440.9110.0570.8110.928
Rakita (R)0.982317.4337.3−0.0180.9430.0110.8570.897
Kolorit (K)1.71827.830,694.30.7180.9951.0000.6201.030
137/09-264 (G1)0.9291506.31807.0−0.0710.7320.0591.0170.971
48/10-172 (G2)1.047412.9543.80.0470.9260.0181.0971.085
203T/14-4 (G3)0.7131136.36020.7−0.2870.7980.1961.1890.999
20/10-267 (G4)1.152124.61505.30.1520.9780.0491.0261.070
214/11-240 (G5)0.946149.5324.5−0.0540.9730.0111.0991.037
46/09-188 (G6)1.070231.3522.30.0700.9590.0171.0311.051
203T/11-4 (G7)0.934180.0436.1−0.0660.9680.0141.1211.055
214/11-231 (G8)1.1211372.72249.40.1210.7560.0731.0741.104
214/11-223 (G9)0.9833631.43649.1−0.0170.3530.1191.0201.026
47/10-101 (G10)0.8811698.82538.5−0.1190.6970.0830.9930.937
158/10-310 (G11)0.5011704.616,522.9−0.4990.6960.5381.0950.858
164/10-302 (G12)0.9555615.95736.9−0.0450.0000.1871.0761.056
bi—regression coefficient; S2di—variance of deviations from regression; σ2i—Shukla’s stability variance; RI—Responsiveness Index; PI—Predictability Index; GRI—Genetic Risk Index; SRI—Stress Robustness Index; YOI—Yield Opportunity Index.
Disclaimer/Publisher’s Note: The statements, opinions and data contained in all publications are solely those of the individual author(s) and contributor(s) and not of MDPI and/or the editor(s). MDPI and/or the editor(s) disclaim responsibility for any injury to people or property resulting from any ideas, methods, instructions or products referred to in the content.