Article

Comparative Effects of Biochar and Humic Acid on the Soil–Wheat System in Mildly Saline Soils

1
College of Agronomy, Inner Mongolia Agricultural University, Hohhot 010011, China
2
Wuyuan County Agricultural and Animal Husbandry Technology Extension Center, Shangrao 015100, China
3
Bayan Nur Rural and Pastoral Area Management Service Center, Bayannur 015100, China
4
State Key Laboratory of Efficient Utilization of Arable Land in China, The Institute of Agricultural Resources and Regional Planning, Chinese Academy of Agricultural Sciences, Beijing 100081, China
*
Authors to whom correspondence should be addressed.
Agronomy 2026, 16(5), 550; https://doi.org/10.3390/agronomy16050550
Submission received: 3 February 2026 / Revised: 23 February 2026 / Accepted: 26 February 2026 / Published: 28 February 2026

Abstract

Soil salinization is a major constraint on global crop production. While organic amendments are used in mildly saline soils, their seasonal effects require further study. This research applied biochar (BC) and humic acid (HA) annually in 2022 and 2023 separately, with an unamended control (CK), to assess impacts on soil quality and wheat yield. BC significantly reduced soil salt content by 28.1% and 17.5% in 2022 and 2023 at a rate of 7.5 Mg·ha−1, while increasing organic matter and total phosphorus. In contrast, HA lowered soil pH by 3.1% in 2022 and enhanced available nitrogen, potassium, and phosphorus. Both BC and HA increased alkaline phosphatase activity by 7.6% and 6.9% in 2023, respectively. Notably, grain yield showed no direct link to soil nutrients but was positively correlated with phosphatase activity in 2023. Consequently, BC did not improve the soil quality index but raised grain yield by 12.9% and 20.7% over two years, primarily via increased 1000-grain weight. In contrast, HA both improved the soil quality index by 16.1% in 2023 and increased grain yield by 17.2%, driven by enhanced aboveground biomass. In conclusion, soil chemical properties and crop productivity were decoupled in these mildly saline–alkaline soils, highlighting the potential for site-specific application of organic amendments.

1. Introduction

Soil salinization and alkalization pose globally significant environmental and agricultural challenges, disrupting ecological stability while threatening food production and environmental sustainability [1]. Current estimates indicate roughly 1 billion hectares of affected land worldwide, representing nearly 25% of the terrestrial surface and 76% of potentially arable areas [2]. These degraded soils exhibit characteristic structural deterioration marked by elevated pH, depleted organic matter, and severe nutrient deficiencies [3], compounded by high salt concentrations and extreme alkalinity [4]. Such conditions create physiological drought stress that suppresses seed germination, impairs plant metabolism, and severely diminishes crop productivity [5,6]. In China, mildly and moderately saline–alkaline soils account for approximately two-thirds of the total saline–alkaline land area [7]. While often prioritized for reclamation due to their perceived manageability, the ecological risks posed by mildly affected soils receive insufficient attention despite their extensive distribution. Importantly, even marginal salt-alkali stress significantly compromises crop performance, and improperly managed marginal lands readily progress to severe degradation stages [8]. This necessitates cost-effective remediation strategies that simultaneously address agricultural productivity and food security imperatives [9,10]. The latent agricultural value of mildly degraded soils warrants strategic interventions, offering critical opportunities for sustainable land rehabilitation and food system resilience [11]. Consequently, implementing scientifically validated, precision-targeted management protocols becomes imperative for restoring both ecological functionality and agricultural productivity in these vulnerable ecosystems.
Soil salinization and alkalization arise from complex interactions between natural factors—climatic conditions, geological settings, and hydrological patterns—and anthropogenic influences such as agricultural practices, irrigation management, and land-use changes [12,13]. These drivers induce significant alterations in soil physicochemical properties, necessitating region-specific remediation strategies tailored to local soil characteristics and degradation mechanisms [14]. For mildly affected soils, organic amendments present a promising intervention, offering simultaneous improvements in soil structure, nutrient availability, and salinity-alkalinity stress mitigation [15]. Among these amendments, biochar (BC) and humic acid (HA) have demonstrated significant potential [16,17,18], though their modes of action differ markedly. Biochar exerts multifunctional effects, including pH regulation, nutrient retention, and water-holding capacity [19], thereby sustaining crop productivity in degraded soils [20,21]. Its porous structure further enhances soil microbial diversity [22] and microbial biomass [23,24], with documented long-term influences on soil microbial community structure and enzyme activities [25]. In contrast, humic acid operates distinct biochemical pathways: organic acid-mediated pH regulation, aggregate stabilization, and direct nutrient solubilization. More importantly, humic acid can increase soil microbial activity and the functionality of various enzymes, thereby enhancing soil biological activity, improving nutrient cycling efficiency, and ultimately promoting crop growth and productivity [26]. The complementary yet divergent mechanisms of these amendments underscore the need for systematic evaluation of their efficacy in mild saline–alkaline systems. Such assessments are a prerequisite to optimizing amendment selection and advancing sustainable land management protocols for vulnerable agroecosystems.
Extensive studies confirm that the application of biochar or humic acid can mitigate adverse conditions in saline–alkaline soils by improving physicochemical and biological properties, ultimately enhancing crop productivity [27,28,29,30]. Application of biochar can increase soil water content and reduce salinity, thereby enhancing wheat yield by approximately 15% compared with the unfertilized control [31]. A meta-analysis further indicated that the application of biochar in saline–alkaline soils can increase overall crop yield by an average of approximately 20.8%, primarily by enhancing soil organic carbon content and reducing soil salinity [32]. In addition to biochar, the application of humic acid has also been shown to improve soil salinity conditions and enhance wheat yield; studies indicate that the sole application of humic acid can reduce soil electrical conductivity, resulting in wheat yields more than 30% higher than in untreated soils [33]. However, most existing studies have evaluated these amendments individually, leaving a critical gap in comparative assessments under consistent field conditions. Moreover, the mechanistic links between soil property improvements and yield increases remain unclear, particularly in mildly saline–alkaline environments. To address these knowledge gaps, this study examines the effects of biochar and humic acid—applied separately—on soil quality and wheat yield within a uniform, mildly saline–alkaline agroecosystem. The specific objectives were to (1) evaluate the efficiency of different amendments in modifying key soil physicochemical properties in a mildly saline–alkaline soil–wheat system and (2) clarify the causal relationships and drivers linking soil quality enhancement with wheat productivity in this system. We hypothesized that (1) biochar and humic acid would exhibit significant differences in their effectiveness in improving saline–alkaline soils and (2) biochar and humic acid would differ in their effectiveness in enhancing crop yield. By clarifying these relationships, this work aims to identify practical, efficient remediation strategies tailored to mildly saline–alkaline soils.

2. Materials and Methods

2.1. Study Site and Experimental Description

The study was conducted over two consecutive growing seasons (2022–2023) in Urad Rear Banner, Bayannur City, Inner Mongolia, China. The region receives an average annual rainfall of 187.4 mm and has a mean annual temperature of 14.3 °C. The experimental site consisted of adjacent plots (<50 m separation) with homogenous brown calcareous soil (Table 1). Each experimental plot had an area of 30 m2 (5 m × 6 m), which was repeated three times. A randomized design was used with three treatments: no amendment (control, CK), biochar (BC, 7.5 Mg ha−1), and humic acid (HA, 7.5 Mg ha−1). The biochar was derived from coconut shells, with an ash content of <5%, moisture < 10%, mechanical strength > 98%, particle size of 4–8 mesh, pH > 7, and a specific surface area > 1200 m2·g−1. The humic acid was sourced from weathered coal and appeared as a black powder. It contained more than 70% humic acid, 15–20% fulvic acid, and approximately 10% ash, with a pH of 6.5. Its chemical composition included 628 g·kg−1 organic carbon, 12 g·kg−1 total nitrogen, 1.1 g·kg−1 total phosphorus, and 114 g·kg−1 total potassium. Prior to sowing wheat (Var. Bamai 13), BC and HA were manually evenly applied to the experimental plots and then incorporated into the 0–20 cm soil layer using mechanical tillage. Mechanical sowing was conducted on 5 April 2022 and 22 April 2023, at a seeding rate of 450 kg ha−1. The wheat was harvested on 14 July 2022 and 27 July 2023, respectively. The type and application rate of basal fertilizer were determined according to the soil nutrient characteristics (high nitrogen, low phosphorus, and rich potassium) and local agricultural practices, which rely solely on basal fertilization without topdressing. Basal fertilization comprised diammonium phosphate applied at 450 kg ha−1 and a compound fertilizer applied at 150 kg ha−1 (N:P2O5:K2O = 16:16:16). Irrigation was applied four times at the tillering, jointing, heading, and grain-filling stages, with 450 m3·hm−2 each time.

2.2. Sampling Collection

At the wheat harvest stage each year (July 2022 and 2023), three 1 m2 quadrats were randomly selected in each plot, and all whole plants within each quadrat were collected (27 total samples per year). The harvested plants were brought back to the laboratory, where weeds and soil residues were removed, and the plants were separated into roots, shoots, spikes, and grains to determine the biomass of each organ. Yield components, including the number of spikes per unit area, number of grains per spike, and thousand-grain weight, were also measured. Finally, the grain dry weight per plant (single-plant grain weight) was multiplied by the number of plants per square meter to calculate the total grain dry weight per square meter, which was then converted to a per-hectare yield (kg ha−1). Meanwhile, rhizosphere soils were collected from the same three sampling points in each plot at a depth of 0–20 cm, yielding a total of 27 soil samples. The collected soil samples were air-dried at room temperature and passed through a 2 mm sieve to ensure uniformity and accuracy for subsequent soil chemical analyses. Soil bulk density (BD) was determined separately by collecting undisturbed soil cores using a cylindrical ring sampler with a volume of 100 cm3, which were sealed and brought back to the laboratory for weighing and measurement.

2.3. Sample Analysis

The soils were divided into two portions, one for the determination of soil physicochemical properties and the other for the measurement of soil enzyme activities. Soil pH was measured in a 1:2.5 soil-to-water suspension using a pH meter (Mettler Toledo, Greifensee, Switzerland). Soil cation exchange capacity (CEC) was measured using the rapid ammonium extraction method. Soil salinity was determined using the electrical conductivity (EC) method. Soil and water were mixed at a 1:5 (soil:water) ratio to prepare a suspension, and the EC value was measured. The soluble salt concentration was then calculated using the formula: Soluble salts (g·kg−1) ≈ EC (dS·m−1) × K, where K was taken as 0.64. The soil electrical conductivity (EC) values were 4.3 dS·m−1 in 2022 and 4.2 dS·m−1 in 2023. Alkaline-hydrolyzable nitrogen was determined by the alkali diffusion method, available phosphorus by sodium bicarbonate extraction followed by molybdenum-antimony anti-spectrophotometry, exchangeable potassium by ammonium acetate extraction and flame photometry, and soil organic matter by the potassium dichromate oxidation method. Soil enzyme activities were measured as follows: catalase (EC 1.11.1.6) by the sodium phenate–sodium hypochlorite colorimetric method, urease (EC 3.5.1.5) by the potassium permanganate titration method, and alkaline phosphatase (EC 3.1.3.1) by the disodium phenyl phosphate colorimetric method [34,35,36,37].

2.4. Soil Quality Index Calculation

Soil quality index (SQI) was measured by soil quality index area (SQI-area), which was calculated by determining the area inside a radar chart generated from all biophysicochemical indicators in this study under varying fertilization strategies [38]. The soil quality indicators have no weighting for the SQI [39]. Each soil indicator was converted to a value of 0–1 as follows [40]:
SLi   = x   x max
SLi = x min x
where SLi is the linear score of parameter i between 0 and 1; x is the measured value; and x max and x min are the maximum and minimum of parameter i, respectively. The soil biochemical properties were categorized into the following two sections. As for “more is better” indicators (e.g., available P), Formula (1) was used. For “less is better” (e.g., EC and pH) in this region of saline soil (with high salt content and pH), Formula (2) was used.
The overall SQI was calculated as follows [38]:
S Q I = 0.5 × i n S L i 2 × sin ( 2 × Π n )
where n is the sum of the indices.

2.5. Statistics

A two-way analysis of variance (ANOVA) was conducted to evaluate the individual and interactive effects of soil amendments (biochar, humic acid) and growing seasons (2022, 2023) on all the analyzed parameters. Normality (Shapiro–Wilk test, p > 0.05) and homogeneity of variance (Levene’s test, p > 0.05) assumptions were confirmed prior to analysis. Where significant differences (p < 0.05) were detected, post hoc comparisons were performed using Fisher’s Least Significant Difference (LSD) test. Statistical analyses were implemented in IBM SPSS Statistics (v25.0), while all figures were generated using Origin 2021.

3. Results

3.1. Soil

3.1.1. Soil Fertility and Enzyme Activities

Soil pH and cation exchange capacity were influenced by experimental year-site, organic amendment, and their interactions (Table 2, p < 0.05). Biochar (BC) increased soil pH by 2.04% and 3.73% in 2022 and 2023, respectively. Humic acid (HA) decreased soil pH by 3.1% in 2022, while it was stable in 2023. BC decreased soil salt content (SC) by 28.1% and 17.5% in 2022 and 2023, respectively, whereas HA increased soil SC by 2.82% and 22.9% in the corresponding years.
Soil organic matter (SOM) and available nutrients (alkali-hydrolyzable nitrogen, exchangeable potassium, and available phosphorus) were affected by organic amendment (Table 2, p < 0.05). BC increased soil SOM by 25.6% in 2023, respectively, and HA was maintained for two years. Available nutrients were maintained under BC in 2022 and 2023, whereas HA increased them by 16.6–20.1% and 17.7–23.5% in 2022 and 2023, respectively.
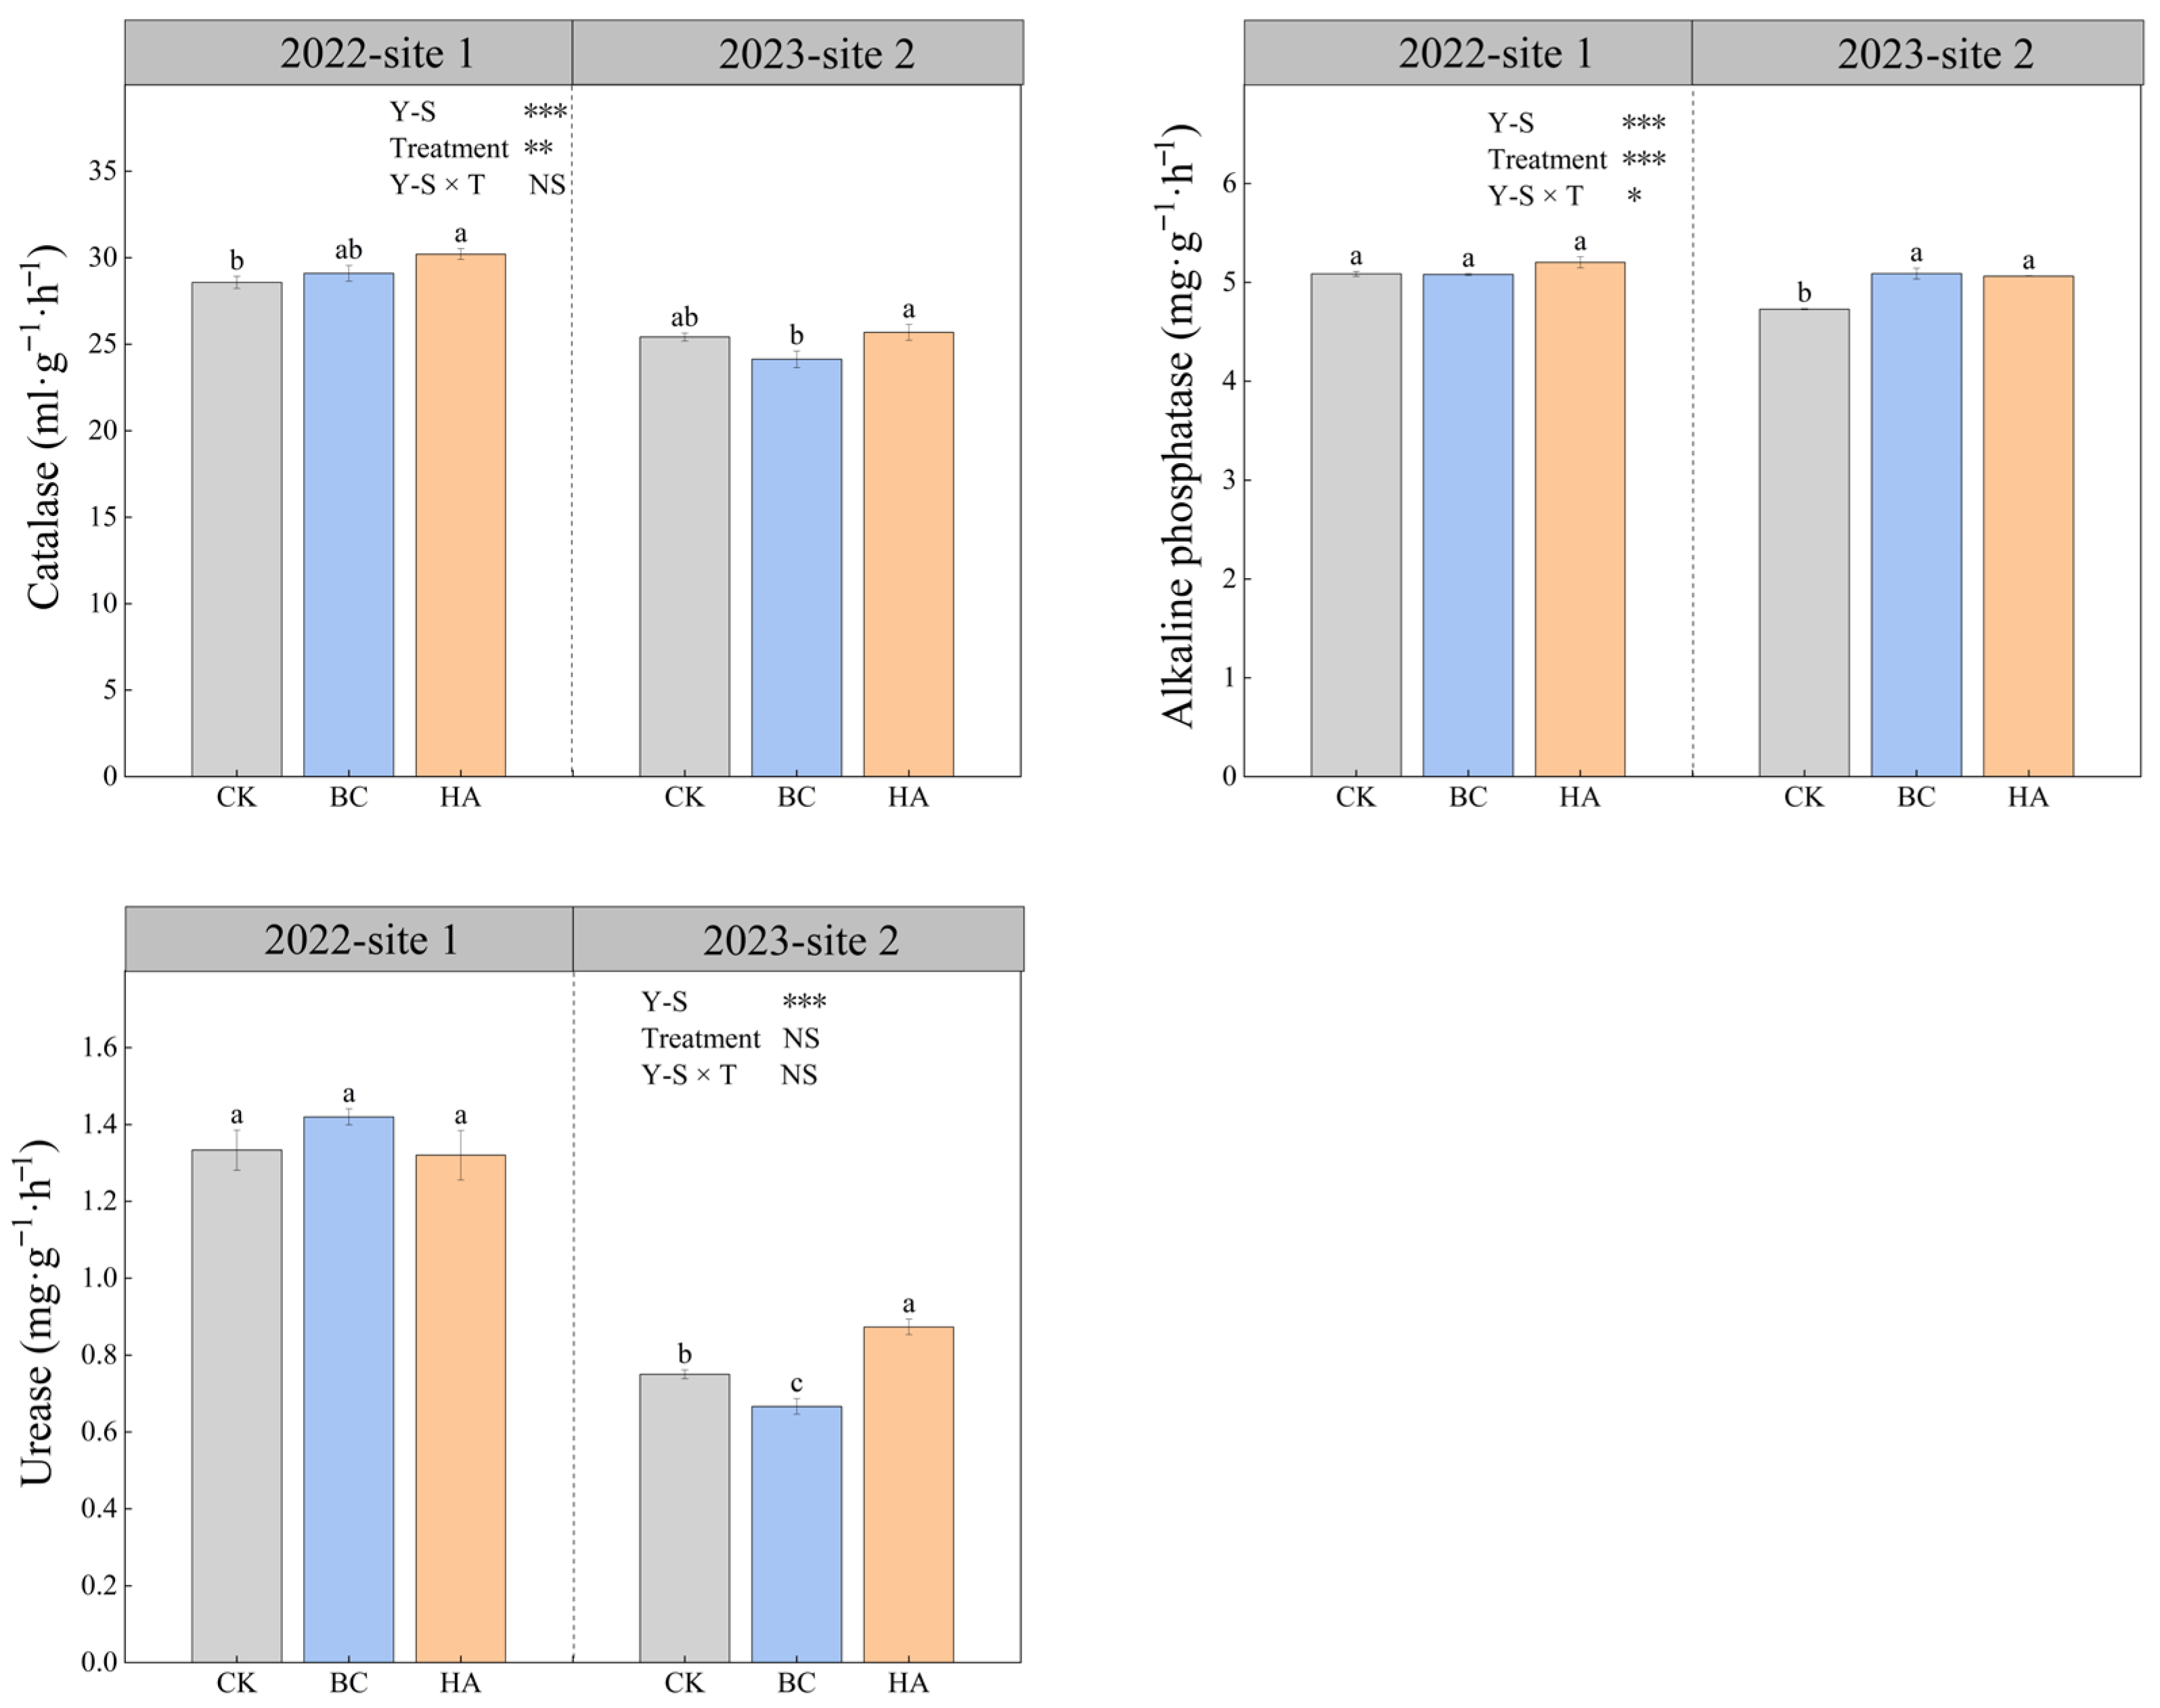
Soil catalase and alkaline phosphatase activities were significantly affected by organic amendments, whereas urease activity was significantly influenced by the interaction between year and organic amendments (Figure 1, p < 0.05). BC increased soil catalase activity by 5.6% in 2022 and enhanced soil alkaline phosphatase activity by 5.7% in 2023. HA increased soil catalase activity by 5.7% and 4.2% in 2022 and 2023, respectively, and increased soil urease activity by 16% in 2023.
Table 2. Soil fertility under biochar and humic acid amendment.
Experimental Year-SiteTreatmentpHBD
(g·cm−3)
SC
(g·kg−1)
CEC
(cmol·kg−1)
SOM
(g·kg−1)
TN
(g·kg−1)
TP
(g·kg−1)
AH-N
(mg·kg−1)
Exch-K
(mg·kg−1)
Avail-P
(mg·kg−1)
2022-site 1CK8.32 ± 0.02 b1.45 ± 0.03 a2.83 ± 0.08 a17.66 ± 0.55 a27.6 ± 1.21 a1.47 ± 0.06 a1.64 ± 0.09 b145 ± 3.48 b264 ± 6.65 b34.7 ± 1.47 b
Biochar8.49 ± 0.05 a1.46 ± 0.02 a2.21 ± 0.17 b15.60 ± 0.46 b28.1 ± 1.42 a1.34 ± 0.06 a2.21 ± 0.13 a128 ± 5.49 c249 ± 6.35 b33.3 ± 1.41 b
Humic acid8.06 ± 0.07 c1.48 ± 0.01 a2.91 ± 0.05 a17.23 ± 0.61 ab26.2 ± 1.30 a1.48 ± 0.05 a1.47 ± 0.13 b174 ± 2.61 a308 ± 11.5 a40.6 ± 1.33 a
2023-site 2CK8.03 ± 0.03 b1.36 ± 0.02 a2.61 ± 0.21 b22.5 ± 0.29 b22.6 ± 1.18 b1.72 ± 0.03 a0.98 ± 0.04 a149 ± 2.18 b260 ± 6.35 b35.6 ± 1.29 b
Biochar8.33 ± 0.05 a1.39 ± 0.03 a2.22 ± 0.27 b20.1 ± 0.03 c28.4 ± 0.84 a1.71 ± 0.03 a1.07 ± 0.03 a127 ± 3.28 c252 ± 4.63 b33.6 ± 1.47 b
Humic acid8.11 ± 0.03 b1.24 ± 0.03 b3.21 ± 0.36 a24.3 ± 0.06 a27.7 ± 0.37 a1.61 ± 0.02 b1.07 ± 0.03 a176 ± 3.76 a321 ± 5.04 a41.9 ± 0.92 a
Two-way ANOVA
Experimental year-site (Y-S)*****ns***ns******nsnsns
Treatment (T)***ns*******ns***********
Y-S × T***ns*nsns**nsnsns
Note: BD, Soil bulk density; SC, salt content; CEC, cation exchange capacity; SOM, soil organic matter; TN, total nitrogen; TP, total phosphorus; AH-N, alkali-hydrolyzable nitrogen; Exch-K, exchangeable potassium; Avail-P, available phosphorus. Different lowercase letters within a column of the same experimental year-site indicate significant differences at p < 0.05 by Fisher’s least significant difference (LSD) test. Values are means ± standard errors (n = 3). * p < 0.05, ** p < 0.01, *** p < 0.001, and ns not significant difference.

3.1.2. Soil Quality

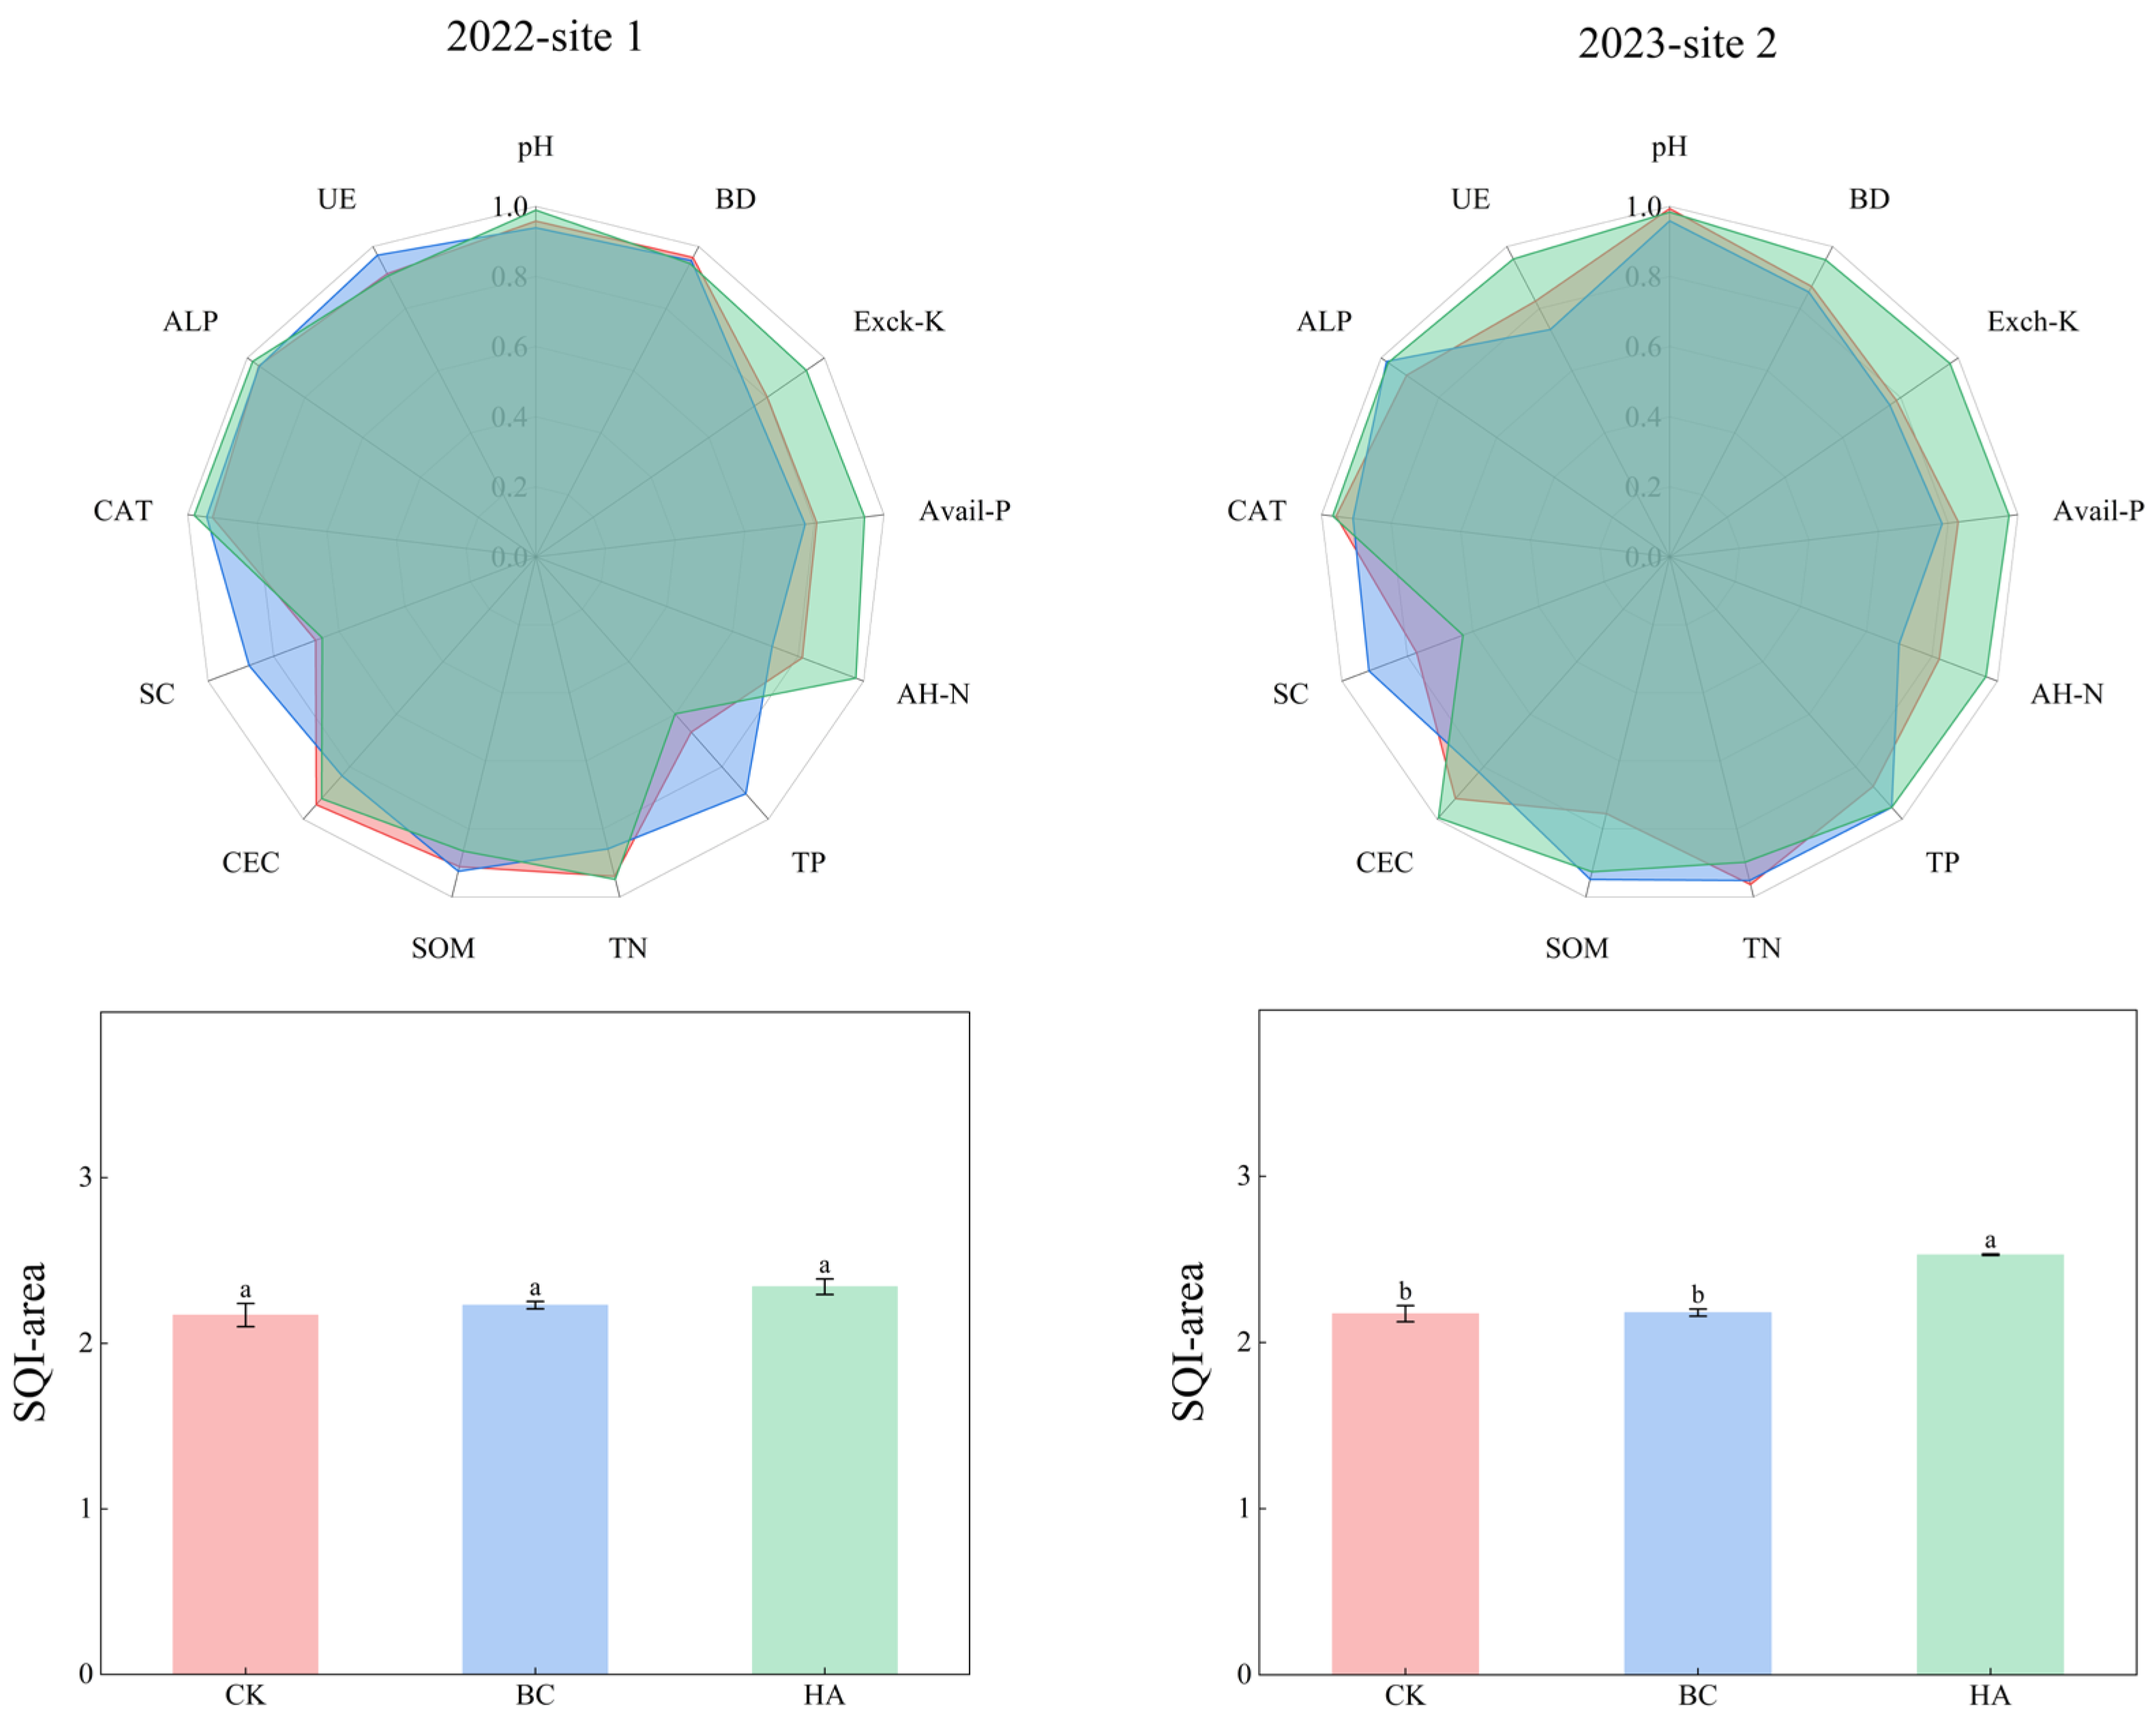
Although BC significantly improved total phosphorus, soil salinity, and SOM in 2022, it did not affect soil quality index (SQI) (Figure 2). In contrast, in 2023, HA lowered soil pH, increased nutrient availability, and markedly enhanced soil enzyme activities, resulting in a 16.1% increase in SQI and demonstrating a more pronounced ameliorative effect.

3.2. Crops

3.2.1. Biomass of Spring Wheat

Root, cation, shoot, spike, above-ground biomass (AGB), and harvest index (HI) were influenced by experimental year-site, organic amendment, and their interactions (Table 3, p < 0.05). BC increased AGB by 5% and 19.8% in 2022 and 2023, respectively, but decreased HI by 3.9% and 10.1% in the same years. HA increased AGB by 26.3% in 2023, while it decreased in 2022; HA decreased HI by 5% in 2022 but increased it by 11.3% in 2023.

3.2.2. Yield Components of Spring Wheat

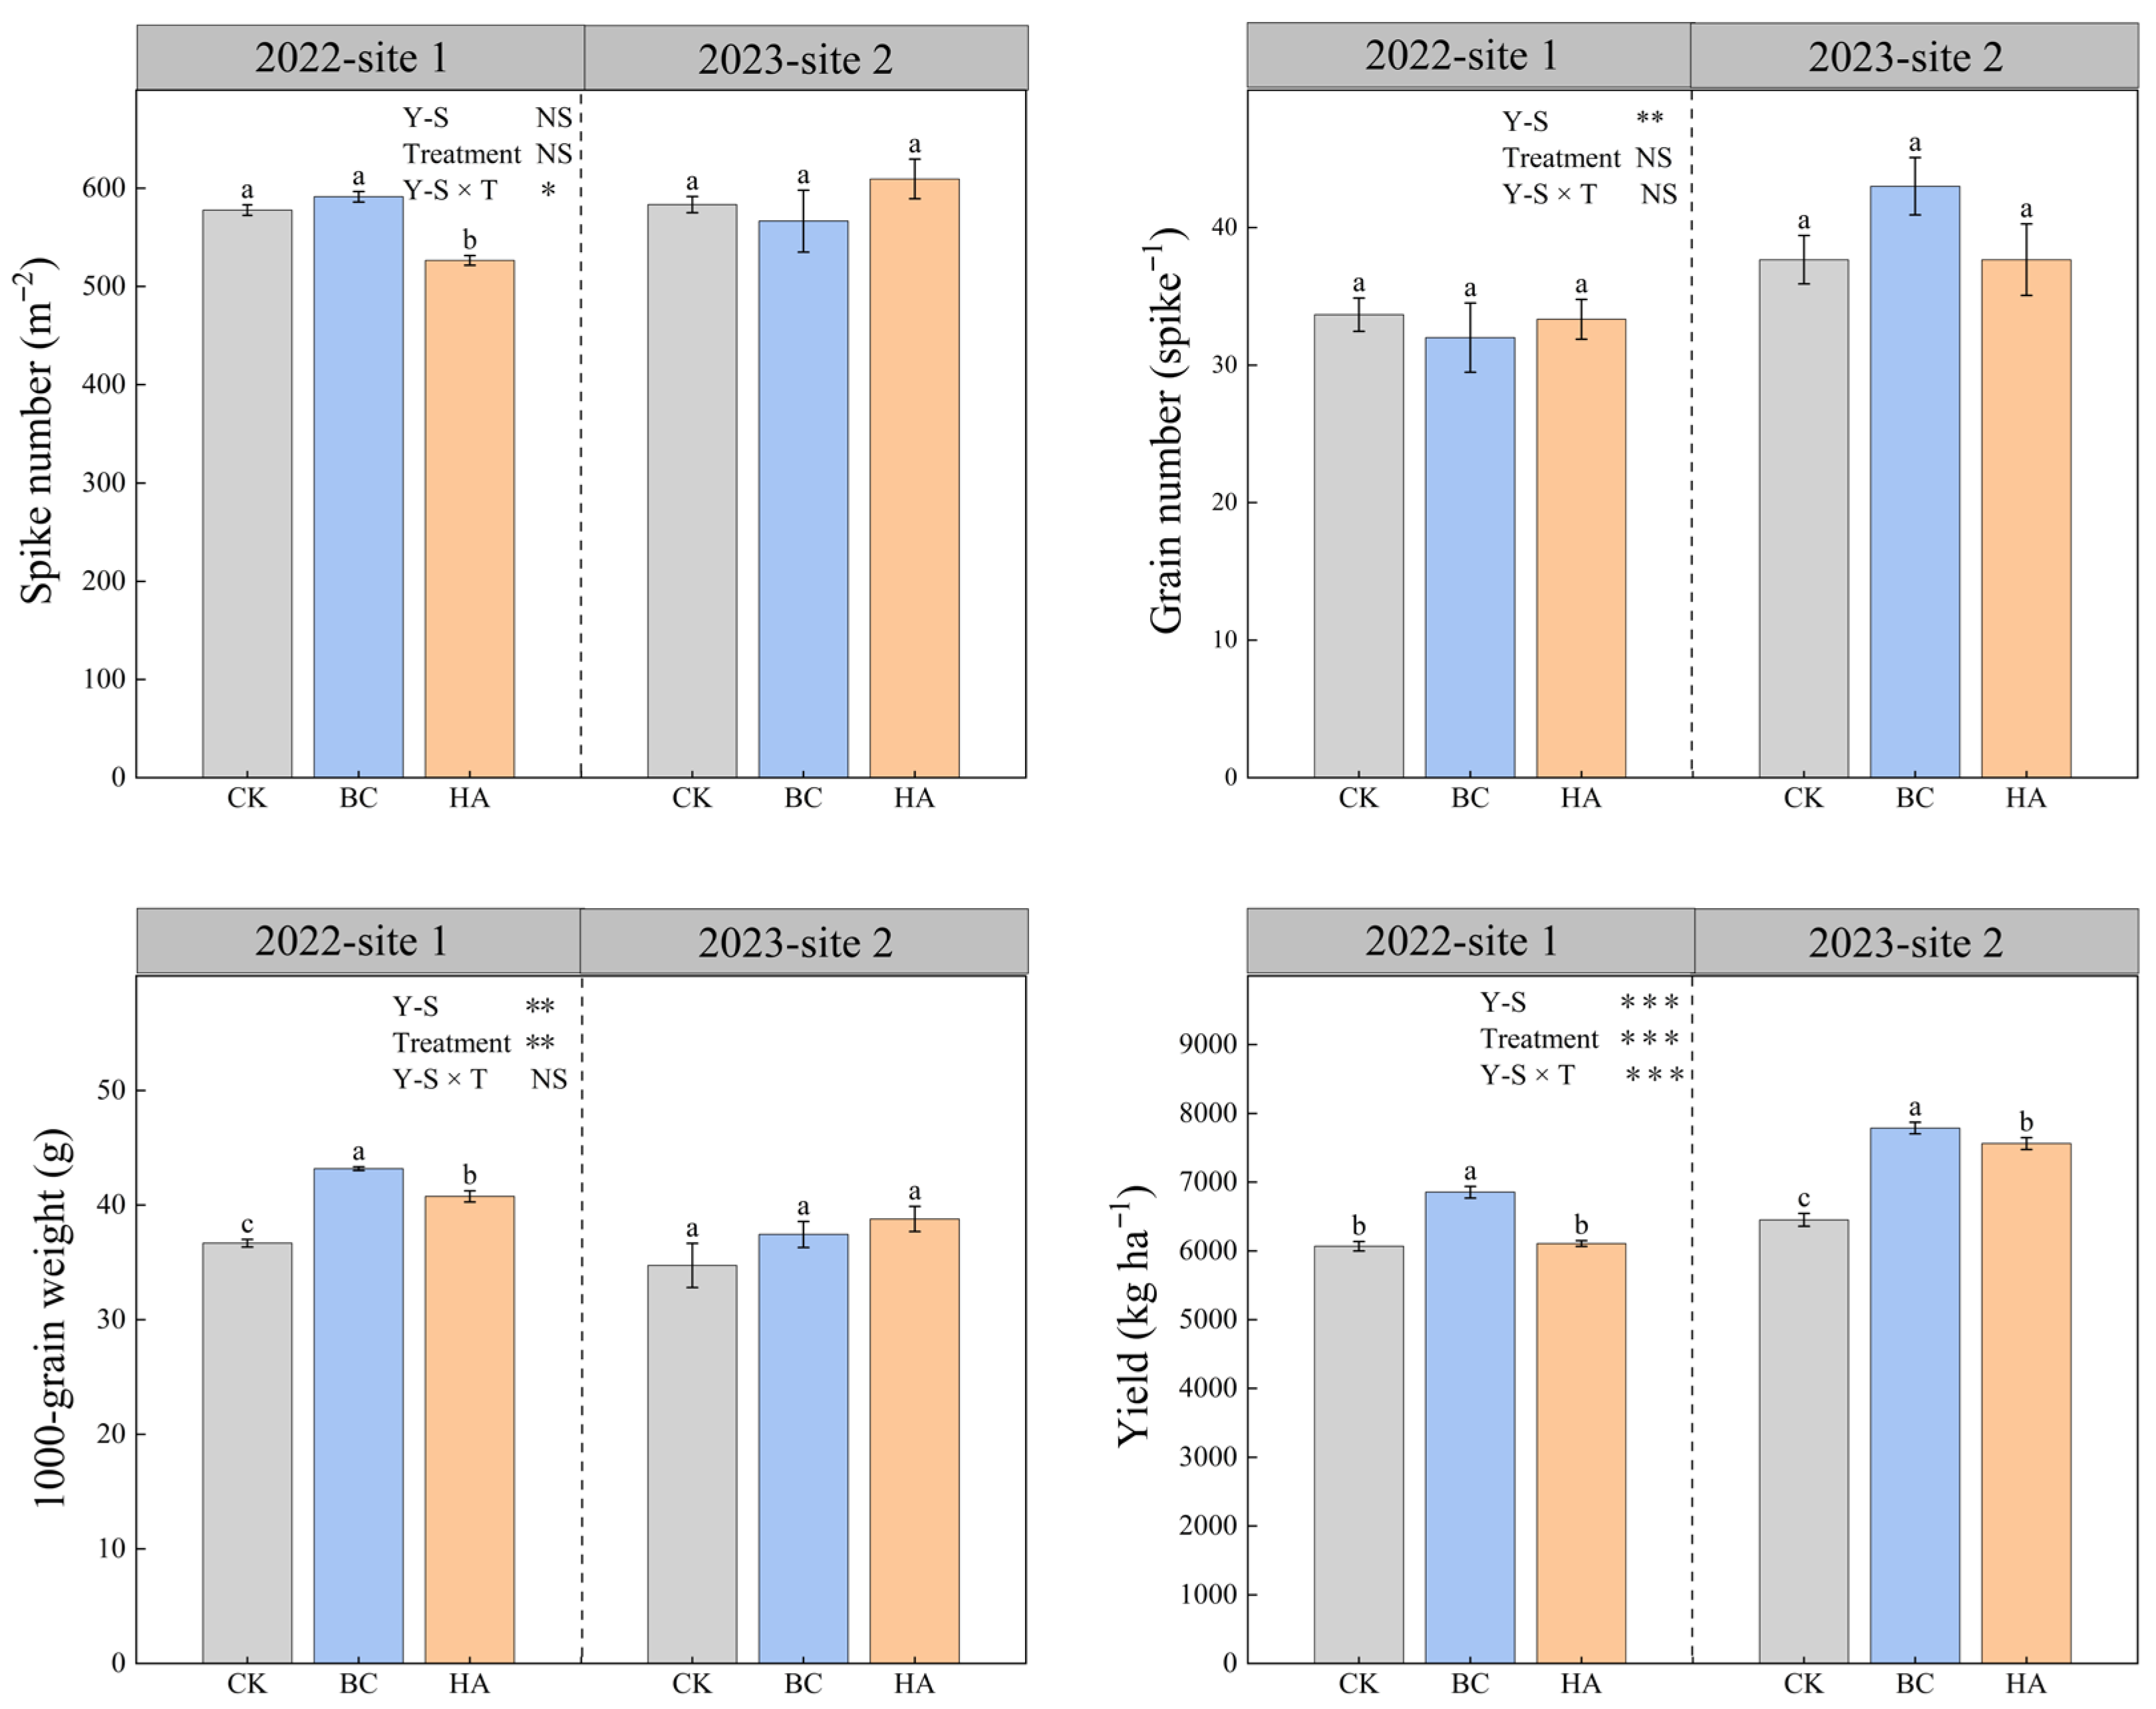
Yield and spike number were influenced by experimental year-site, organic amendment, and their interactions. A total of 1000-grain weight was affected by organic amendment (Figure 3, p < 0.05). BC and HA increased 1000-grain weight by 17.7% and 10.9% in 2022, respectively, while both amendments were maintained in 2023. BC increased wheat yield by 12.9% and 20.9% in 2022 and 2023, respectively. HA increased wheat yield by 17.2% in 2023, while it was maintained in 2022.
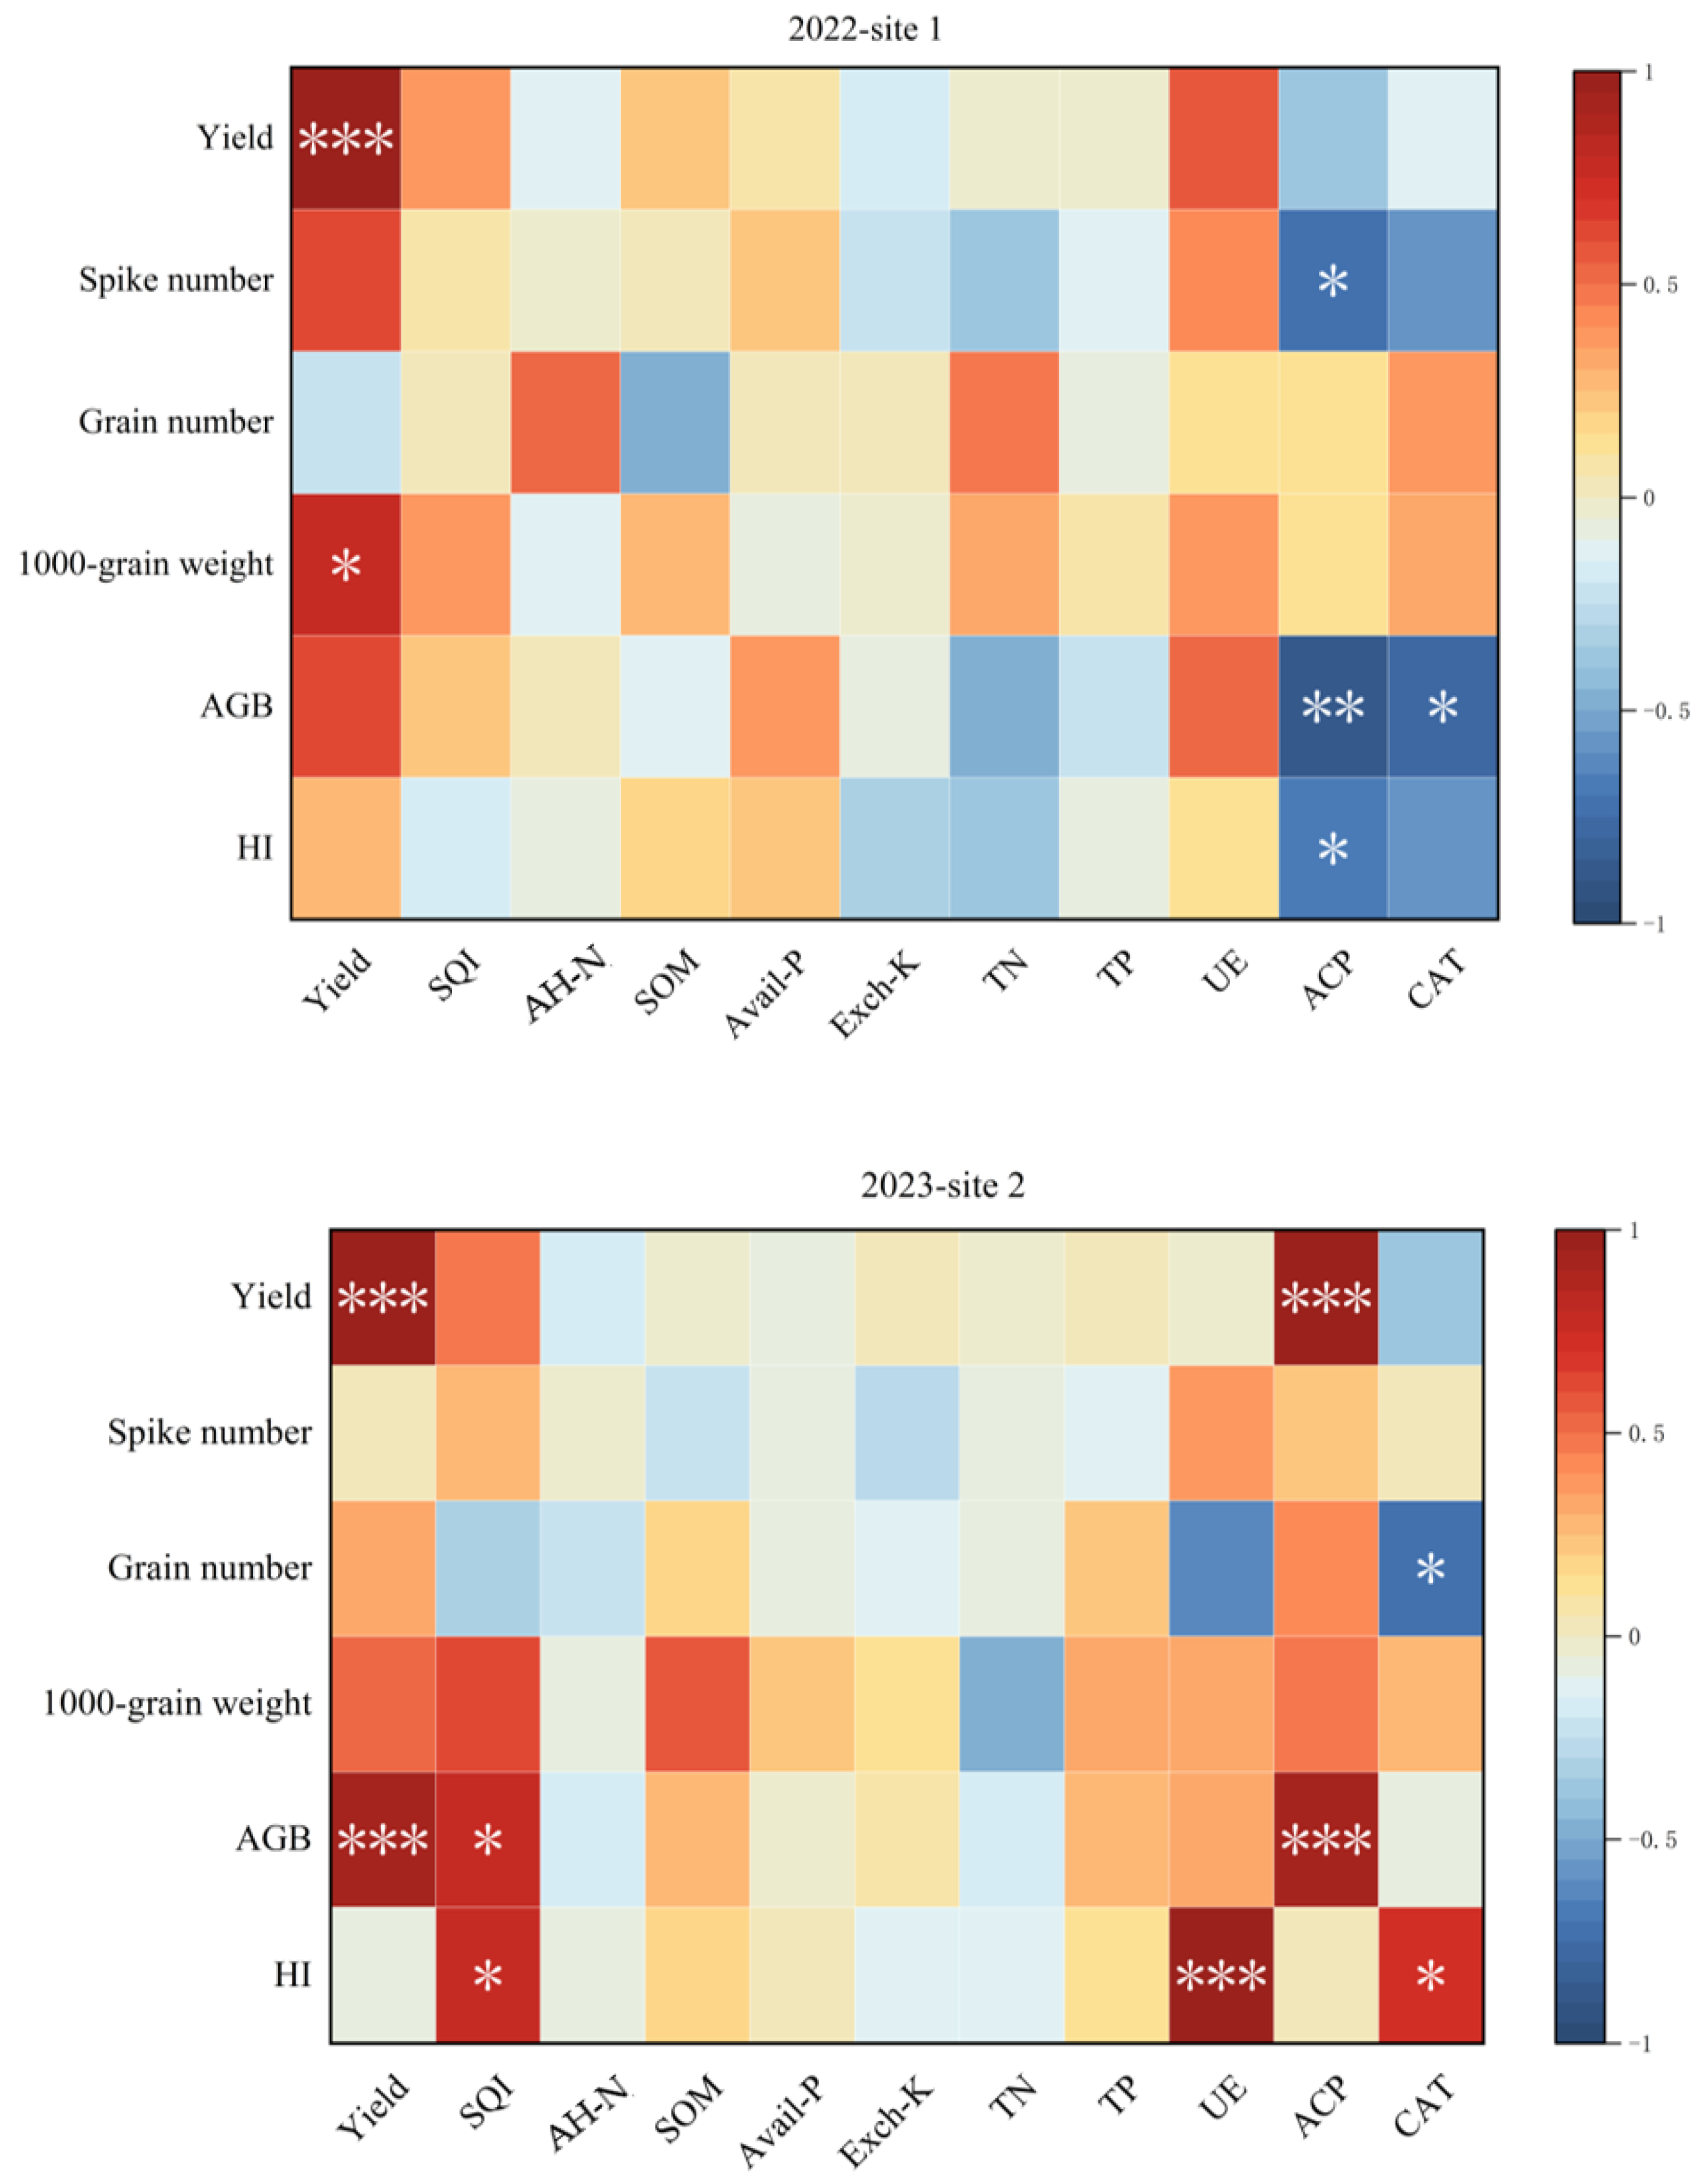
The grain yield was independent of soil chemical parameters in two years. However, it was positively correlated with alkaline phosphatase in 2023 (Figure 4, p < 0.001). In addition, the soil quality index was unrelated to yield components in 2022, while it was positively correlated with aboveground biomass and harvest index in 2023. The harvest index of spring wheat (Figure 4, p < 0.05).
Figure 3. Yield components of spring wheat under biochar (BC) and humic acid (HA), as well as no amendment as control (CK), over two experimental year-sites. Two-way ANOVAs were conducted for experimental year-site (Y-S) and treatment (T). Different lowercase letters within a column of the same experimental year-site indicate significant differences at p < 0.05 by Fisher’s least significant difference (LSD) test. Values are presented as means ± standard errors (n = 3). * p < 0.05, ** p < 0.01, *** p < 0.001, and NS indicates no significant difference.
Agronomy 16 00550 g003
Figure 4. Correlation analysis between soil chemical properties and spring wheat yield at Site 1 (2022) and Site 2 (2023). AGB, above-ground biomass; HI, harvest index; UE, urease; CAT, catalase; AH-N, alkali-hydrolyzable nitrogen; SOM, soil organic matter; TN, total nitrogen; TP, total phosphorus; Avail-P, available phosphorus; Exch-K, exchangeable potassium; SQI, soil quality index * p < 0.05, ** p < 0.01, *** p < 0.001.
Agronomy 16 00550 g004

4. Discussion

4.1. Effects of Organic Amendments on Soil Quality Improvement

Our study demonstrated that both biochar (BC) and humic acid (HA) significantly improved the soil quality index (Figure 2). However, during these two-year short-term field experiments, BC and HA exhibited distinctly different mechanisms in enhancing soil fertility, a finding that strongly corroborates our second hypothesis.
First, BC exerted superior effects compared to HA in increasing soil organic matter content, cation exchange capacity, and total phosphorus. These observations align with existing literature reporting that biochar can enhance soil organic matter and total phosphorus contents [41]. The biochar used in this study was primarily derived from coconut shells and contained inherently low concentration levels of primary nutrients (N, P, and K) [42]. However, BC possesses a stable carbon structure, and its application helps improve soil organic matter content and promotes the long-term accumulation of organic carbon in the soil [43]. Due to its high specific surface area, BC exhibits strong adsorption capacity and effectively adsorbs soluble salt ions in soil solutions, thereby reducing soil salinity and alleviating salt stress [44]. Furthermore, BC’s intrinsic alkalinity (pH > 7) conferred persistent buffering capacity against soil acidity throughout the experimental period, maintaining elevated pH levels in amended soils.
Conversely, HA was more effective than BC in increasing available nutrients, including alkali-hydrolyzable nitrogen, available phosphorus, and exchangeable potassium. This may be related to the relatively labile and highly reactive nature of HA, as well as its regulatory effects on soil processes, thereby enhancing nutrient availability [10]. Notably, HA reduced soil bulk density during the second experimental year (2023), consistent with its documented ability to stimulate microbial activity and root growth, which collectively promote soil porosity through biological processes [45,46]. These effects were further corroborated by the substantial increases in alkaline phosphatase and urease activities under HA treatment in 2023 (Figure 1).
In summary, BC and HA improve the soil quality index through distinct mechanisms. BC primarily enhances soil fertility accumulation through nutrient retention and structural stabilization. In contrast, HA mainly improves soil quality by rapidly enhancing nutrient availability and biological activation. Importantly, BC’s alkaline properties contrast with HA’s slight acidifying tendency, suggesting potential synergistic interactions when applied in combination. These mechanistic insights underscore the value of exploring optimized application ratios to maximize complementary effects, particularly for reclaiming saline–alkaline soils. Future investigations should prioritize long-term field trials to validate these interactions and establish science-based application protocols.

4.2. Effects of Organic Amendments on Spring Wheat Productivity

Both organic amendments significantly increased spring wheat yield (Figure 3), with BC demonstrating consistent beneficial effects across both experimental years. BC application led to a substantial increase in aboveground biomass of wheat annually, aligning with previous studies showing that biochar can promote crop growth and increase biomass by effectively alleviating soil salinity stress [47]. Correspondingly, BC enhanced spring wheat yield in both years. In contrast, HA effects exhibited strong interannual variability regarding both AGB and yield. While HA significantly increased AGB in 2023, it had no significant effect in 2022; similarly, yield was significantly improved in 2023, but no comparable stimulation occurred in 2022. This result is consistent with previous studies, indicating that humic acid can significantly increase the aboveground biomass of wheat, thereby serving as an important factor in enhancing wheat yield [48]. Correlation analysis further supported this point (Figure 4), showing a significant positive correlation between aboveground biomass and yield in 2023 (p < 0.001) and a noticeable positive trend in 2022.
Interestingly, yield responses showed no clear association with soil chemical properties but were more closely related to enzyme activities. In 2022, under phosphorus-rich conditions, HA did not significantly enhance soil alkaline phosphatase activity, and phosphatase activity was negatively correlated with AGB. Consequently, HA did not exert a significant promoting effect on AGB accumulation or grain yield that year. In contrast, during the relatively phosphorus-deficient conditions in 2023, alkaline phosphatase activity was positively correlated with both AGB and grain yield. Under these conditions, HA application increased alkaline phosphatase activity, which coincided with higher AGB accumulation and crop yield. These results are consistent with previous studies showing that high phosphorus inputs suppress alkaline phosphatase activity, whereas low phosphorus conditions favor higher activity [49,50]. However, given the relatively high background phosphorus content in the soil, these associations are more likely to reflect overall changes in soil biological activity rather than a direct effect on phosphorus availability. Overall, the results suggest that soil enzyme activities, particularly alkaline phosphatase, may serve as useful biological indicators associated with spring wheat growth in future studies.
In summary, both organic amendments can enhance spring wheat yield by improving soil–crop system functions, but their mechanisms differ markedly. BC delivers stable, year-to-year benefits through biomass enhancement, while HA’s effectiveness depends critically on seasonal environmental factors mediating biological activity. Soil enzymes, particularly alkaline phosphatase, can serve as important biological indicators reflecting soil biological status and nutrient cycling dynamics. These results highlight that, in the management of saline–alkaline soils, practices supporting soil biological functions should be integrated with chemical fertilization to achieve more effective productivity improvements.

4.3. Uncertainties and Implications

The application of soil amendments led to short-term increases in soil pH and salt content, likely attributed to the short duration of the study and the incomplete decomposition and inherent properties of the amendments [51,52]. Although the experimental fields in the two years were located in close proximity, differences in soil physicochemical properties were still observed, particularly in soil total phosphorus. As mentioned above, humic acid increased soil alkaline phosphatase activity, thereby influencing crop yield; however, this study lacks a systematic evaluation of other soil enzyme types and their treatment effects and has not conducted multi-year, multi-site validation across soils with different phosphorus levels. In addition, while humic acid increased soil salinity, the underlying causes remain uncertain—potentially due to intrinsic salt content in the amendment or incomplete assessment of salt distribution dynamics across soil profiles. Systematic investigations into the vertical distribution of soil salinity, the diversity of soil enzymes, and their temporal dynamics are therefore warranted.
The experimental soil was characterized by low available phosphorus (33.0–35.6 mg·kg−1), and the availability of phosphorus was limited under saline soil conditions mainly through two pathways: (i) salt cations such as Ca2+ and Mg2+ readily combine with phosphate ions, converting soluble phosphorus into insoluble forms, and (ii) salt ions compete with phosphate for membrane transport sites, thereby inhibiting phosphorus absorption [53]. Therefore, the input of phosphorus in the experimental site was relatively higher than in other regions [54,55]. Although previous studies and our results indicate that an application rate of 7.5 t ha−1 for both biochar and humic acid has strong effects on soil fertility improvement and yield enhancement [56], the substantial increase in economic input limits their large-scale adoption. However, the present study did not compare different application rates of these amendments. Future studies should therefore comprehensively consider soil fertility improvement, crop yield responses, and economic returns to determine site-specific and cost-effective application rates.
In summary, future amendment strategies must address key knowledge gaps, including long-term effects, spatial–temporal nutrient and salt dynamics, crop growth responses, and economic trade-offs, ensuring sustainable and scalable implementation.

5. Conclusions

This study demonstrates that biochar (BC) and humic acid (HA) elicit distinct responses in mildly saline–alkaline soil systems, with BC preferentially enhancing spring wheat productivity while HA improves soil quality indicators. Biochar application results in a short-term increase in soil pH, while humic acid application causes a short-term rise in soil salinity. The immediate yield benefit of BC was consistently mediated through aboveground biomass stimulation, whereas HA’s effects exhibited stronger interannual variability linked to phosphorus dynamics through alkaline phosphatase activity. Notably, we identified a decoupling between conventional soil chemical parameters and crop productivity, with soil enzymatic activity emerging as a more reliable predictor of yield potential under saline conditions. These findings highlight the necessity of considering both biological and chemical soil processes when selecting amendments for saline–alkaline agroecosystems. Future management strategies should integrate BC for immediate yield stabilization and HA for gradual soil quality improvement, though optimal application regimes require further investigation considering long-term salinity dynamics and economic feasibility.

Author Contributions

Conceptualization, L.B., X.W. and B.Z.; methodology, L.B. and S.W.; software, L.B.; validation, R.Z.; formal analysis, L.B. and X.W.; investigation, S.W. and B.L.; data curation, L.B., R.Z., S.W. and B.L.; writing—original draft preparation, L.B.; writing—review and editing, L.B., X.W. and Y.L.; visualization, L.B., R.Z. and Y.L.; supervision, B.L. and Y.L.; project administration, B.Z.; funding acquisition, B.Z. All authors have read and agreed to the published version of the manuscript.

Funding

This research is supported by the China Agricultural Research System of Oat and Buckwheat (CARS-07).

Data Availability Statement

The raw data supporting the conclusions of this article will be made available by the authors on request.

Acknowledgments

The authors sincerely thank Kevin Z. Mganga (Copernicus Institute of Sustainable Development, Utrecht University, The Netherlands) for providing technical support.

Conflicts of Interest

The authors declare that they have no conflicts of interest.

References

  1. Zhang, C.; Zhou, L.; Lv, Q.; Ma, X. A Novel Composite Amendment for Soda Saline–Alkali Soils: Reducing Alkalinity, Enhancing Nutrient Content, and Increasing Maize Yield. Agronomy 2025, 15, 2910. [Google Scholar] [CrossRef] [Scilit]
  2. Yang, S.; Hao, X.; Xu, Y.; Yang, J.; Su, D. Meta-analysis of the effect of saline-alkali land improvement and utilization on soil organic carbon. Life 2022, 12, 1870. [Google Scholar] [CrossRef] [Scilit] [PubMed]
  3. Kaushal, S.S.; Likens, G.E.; Pace, M.L.; Reimer, J.E.; Maas, C.M.; Galella, J.G.; Woglo, S.A. Freshwater salinization syndrome: From emerging global problem to managing risks. Biogeochemistry 2021, 154, 255–292. [Google Scholar] [CrossRef] [Scilit]
  4. Xia, J.; Ren, J.; Zhang, S.; Wang, Y.; Fang, Y. Forest and grass composite patterns improve the soil quality in the coastal saline-alkali land of the Yellow River Delta, China. Geoderma 2019, 349, 25–35. [Google Scholar] [CrossRef] [Scilit]
  5. Javid, M.; Ullah, S.; Amin, F.; Shah, W.; Malik, T.; Alwahibi, M.S.; Ali, B. Computing the effects of temperature and osmotic stress on the seed germination of Helianthus annuus L. by using a mathematical model. Sci. Rep. 2024, 14, 9978. [Google Scholar] [CrossRef] [Scilit]
  6. Cao, Y.; Song, H.; Zhang, L. New insight into plant saline-alkali tolerance mechanisms and application to breeding. Int. J. Mol. Sci. 2022, 23, 16048. [Google Scholar] [CrossRef] [Scilit] [PubMed]
  7. Yang, J.S.; Yao, R.J. Management and efficient agricultural utilization of salt-affected soil in China. Bull. Chin. Acad. Sci. 2015, 30, 257–265. Available online: http://zgkxyyk.alljournal.cn/ch/reader/view_full_html.aspx?file_no=2015Z120&flag=1 (accessed on 25 December 2025).
  8. Xie, H.; Li, J.; Zhang, Y.; Xu, X.; Wang, L.; Ouyang, Z. Evaluation of coastal farming under salinization and optimized fertilization strategies in China. Sci. Total Environ. 2021, 797, 149038. [Google Scholar] [CrossRef] [Scilit]
  9. Kopittke, P.M.; Menzies, N.W.; Wang, P.; McKenna, B.A.; Lombi, E. Soil and the intensification of agriculture for global food security. Environ. Int. 2019, 132, 105078. [Google Scholar] [CrossRef] [Scilit]
  10. Li, Z.; Kekeli, M.A.; Jiang, Y.; Rui, Y. Progress and Prospect of Saline-Alkaline Soil Management Technology: A Review. Appl. Sci. 2025, 15, 4567. [Google Scholar] [CrossRef] [Scilit]
  11. Chen, L.; Zhou, G.; Feng, B.; Wang, C.; Luo, Y.; Li, F.; Zhang, J. Saline-alkali land reclamation boosts topsoil carbon storage by preferentially accumulating plant-derived carbon. Sci. Bull. 2024, 69, 2948–2958. [Google Scholar] [CrossRef] [Scilit]
  12. Rengasamy, P. World salinization with emphasis on Australia. J. Exp. Bot. 2006, 57, 1017–1023. [Google Scholar] [CrossRef] [Scilit]
  13. Cui, Q.; Xia, J.; Yang, H.; Liu, J.; Shao, P. Biochar and effective microorganisms promote Sesbania cannabina growth and soil quality in the coastal saline-alkali soil of the Yellow River Delta, China. Sci. Total Environ. 2021, 756, 143801. [Google Scholar] [CrossRef] [Scilit] [PubMed]
  14. Guo, Y.; Dong, J.; Wang, J.; Meng, Q.; Ma, J.; Luqmon, S.; Liu, H. Regional adaptability and integrated evaluation of saline-alkali soil remediation technologies: A comprehensive review. Ecol. Indic. 2025, 180, 114305. [Google Scholar] [CrossRef] [Scilit]
  15. Yupeng, W.U.; Yufei, L.I.; Yanmeng, B.I.; Zhenjun, S.U.N. Responses of saline soil properties and cotton growth to different organic amendments. Pedosphere 2018, 28, 521–529. [Google Scholar] [CrossRef] [Scilit]
  16. El-Sayed, M.E.; Hazman, M.; Abd El-Rady, A.G.; Almas, L.; McFarland, M.; Shams El Din, A.; Burian, S. Biochar reduces the adverse effect of saline water on soil properties and wheat production profitability. Agriculture 2021, 11, 1112. [Google Scholar] [CrossRef] [Scilit]
  17. Kul, R.; Arjumend, T.; Ekinci, M.; Yildirim, E.; Turan, M.; Argin, S. Biochar as an organic soil conditioner for mitigating salinity stress in tomato. Soil Sci. Plant Nutr. 2021, 67, 693–706. [Google Scholar] [CrossRef] [Scilit]
  18. Ampong, K.; Thilakaranthna, M.S.; Gorim, L.Y. Understanding the role of humic acids on crop performance and soil health. Front. Agron. 2022, 4, 848621. [Google Scholar] [CrossRef] [Scilit]
  19. Bruun, E.W.; Ravenni, G.; Müller-Stöver, D.; Petersen, C.T. Small biochar particles added to coarse sandy subsoil greatly increase water retention and affect hydraulic conductivity. Eur. J. Soil Sci. 2023, 74, e13442. [Google Scholar] [CrossRef] [Scilit]
  20. Ernest, B.; Yanda, P.Z.; Hansson, A.; Fridahl, M. Long-term effects of adding biochar to soils on organic matter content, persistent carbon storage, and moisture content in Karagwe, Tanzania. Sci. Rep. 2024, 14, 30565. [Google Scholar] [CrossRef] [Scilit] [PubMed]
  21. Yang, S.; Chen, X.; Jiang, Z.; Ding, J.; Sun, X.; Xu, J. Effects of biochar application on soil organic carbon composition and enzyme activity in paddy soil under water-saving irrigation. Int. J. Environ. Res. Public Health 2020, 17, 333. [Google Scholar] [CrossRef] [Scilit] [PubMed]
  22. Amoakwah, E.; Arthur, E.; Frimpong, K.A.; Lorenz, N.; Rahman, M.A.; Nziguheba, G.; Islam, K.R. Biochar amendment impacts on microbial community structures and biological and enzyme activities in a weathered tropical sandy loam. Appl. Soil Ecol. 2022, 172, 104364. [Google Scholar] [CrossRef] [Scilit]
  23. Zhang, J.; Shen, J.L. Effects of biochar on soil microbial diversity and community structure in clay soil. Ann. Microbiol. 2022, 72, 35. [Google Scholar] [CrossRef] [Scilit]
  24. Li, X.; Wang, T.; Chang, S.X.; Jiang, X.; Song, Y. Biochar increases soil microbial biomass but has variable effects on microbial diversity: A meta-analysis. Sci. Total Environ. 2020, 749, 141593. [Google Scholar] [CrossRef] [Scilit]
  25. Luo, S.; Wang, S.; Tian, L.; Li, S.; Li, X.; Shen, Y.; Tian, C. Long-term biochar application influences soil microbial community and its potential roles in semiarid farmland. Appl. Soil Ecol. 2017, 117, 10–15. [Google Scholar] [CrossRef] [Scilit]
  26. Liu, M.; Wang, C.; Liu, X.; Lu, Y.; Wang, Y. Saline-alkali soil applied with vermicompost and humic acid fertilizer improved macroaggregate microstructure to enhance salt leaching and inhibit nitrogen losses. Appl. Soil Ecol. 2020, 156, 103705. [Google Scholar] [CrossRef] [Scilit]
  27. Fan, K.; Delgado-Baquerizo, M.; Zhu, Y.G.; Chu, H. Crop production correlates with soil multitrophic communities at the large spatial scale. Soil Biol. Biochem. 2020, 151, 108047. [Google Scholar] [CrossRef] [Scilit]
  28. Marx, M.C.; Wood, M.; Jarvis, S.C. A microplate fluorimetric assay for the study of enzyme diversity in soils. Soil Biol. Biochem. 2001, 33, 1633–1640. [Google Scholar] [CrossRef] [Scilit]
  29. Zhou, L.; Xu, S.-t.; Monreal, C.M.; Mclaughlin, N.B.; Zhao, B.-p.; Liu, J.-h.; Hao, G.-c. Bentonite-humic acid improves soil organic carbon, microbial biomass, enzyme activities and grain quality in a sandy soil cropped to maize (Zea mays L.) in a semi-arid region. J. Integr. Agric. 2022, 21, 208–221. [Google Scholar] [CrossRef] [Scilit]
  30. Zhou, Y.; Ma, H.; Xie, Y.; Jia, X.; Su, T.; Li, J.; Shen, Y. Assessment of soil quality indexes for different land use types in typical steppe in the loess hilly area, China. Ecol. Indic. 2020, 118, 106743. [Google Scholar] [CrossRef] [Scilit]
  31. Wang, S.; Gao, P.; Zhang, Q.; Shi, Y.; Guo, X.; Lv, Q.; Wu, W.; Zhang, X.; Li, M.; Meng, Q. Biochar improves soil quality and wheat yield in saline-alkali soils beyond organic fertilizer in a 3-year field trial. Environ. Sci. Pollut. Res. Int. 2023, 30, 19097–19110. [Google Scholar] [CrossRef] [Scilit] [PubMed]
  32. Zhang, L.; Bate, B.; Cui, J.; Feng, Y.; Yu, J.; Cui, Z.; Wang, H.; Li, Q. Biochar Input to Saline-Alkali Farmland Can Improve Soil Health and Crop Yield: A Meta-Analysis. Agriculture 2025, 15, 561. [Google Scholar] [CrossRef] [Scilit]
  33. Ma, L.; Li, Y.; Zhang, Y.; Li, Y.; Wei, J.; Liu, Z.; Tan, D. Synergistic Application of Humic Acid and Microbial Fertilizers Improve Soil Quality, Reshape Microbial Network, and Enhance Wheat Yield in Coastal Saline–Alkali Soils. Microorganisms 2025, 13, 2716. [Google Scholar] [CrossRef] [Scilit]
  34. Bao, S.D. Soil Agricultural Chemical Analysis, 3rd ed.; China Agricultural Press: Beijing, China, 2000; pp. 265–267. [Google Scholar]
  35. Faithfull, N.T. Methods in Agricultural Chemical Analysis: A Practical Handbook. 2002. Available online: http://www.cabi.org/cabebooks/ebook/20023165853 (accessed on 20 December 2025).
  36. Nannipieri, P.; Johnson, R.L.; Paul, E.A. Criteria for measurement of microbial growth and activity in soil. Soil Biol. Biochem. 1978, 10, 223–229. [Google Scholar] [CrossRef] [Scilit]
  37. Perez-Mateos, M.; Gonzalez-Carcedo, S. Assay of urease activity in soil columns. Soil Biol. Biochem. 1988, 20, 567–572. [Google Scholar] [CrossRef] [Scilit]
  38. Kuzyakov, Y.; Gunina, A.; Zamanian, K.; Tian, J.; Luo, Y.; Xu, X.; Guillaume, T. New approaches for evaluation of soil health, sensitivity and resistance to degradation. Front. Agric. Sci. Eng. 2020, 7, 282. [Google Scholar] [CrossRef] [Scilit]
  39. Andrews, S.S.; Karlen, D.L.; Mitchell, J.P. A comparison of soil quality indexing methods for vegetable production systems in Northern California. Agric. Ecosyst. Environ. 2002, 90, 25–45. [Google Scholar] [CrossRef] [Scilit]
  40. Zeraatpisheh, M.; Bakhshandeh, E.; Hosseini, M.; Alavi, S.M. Assessing the effects of deforestation and intensive agriculture on the soil quality through digital soil map. Geoderma 2020, 363, 114139. [Google Scholar] [CrossRef] [Scilit]
  41. Jia, R.; Fan, F.; Li, L.; Qu, D. Temporal response of bacterial community associated Fe (III) reduction to initial pH shift of paddy soils. Agronomy 2022, 12, 1304. [Google Scholar] [CrossRef] [Scilit]
  42. Ramasamy, M.; Geetha, T.; Yuvaraj, M. Role of biofertilizers in plant growth and soil health. In Nitrogen Fixation; IntechOpen: London, UK, 2020; Available online: https://www.intechopen.com/chapters/70950 (accessed on 25 December 2025).
  43. Ding, Y.; Liu, Y.; Liu, S.; Li, Z.; Tan, X.; Huang, X.; Zheng, B. Biochar to improve soil fertility. A review. Agron. Sustain. Dev. 2016, 36, 36. [Google Scholar] [CrossRef] [Scilit]
  44. Wang, X.; Ding, J.; Han, L.; Tan, J.; Ge, X.; Nan, Q. Biochar addition reduces salinity in salt-affected soils with no impact on soil pH: A meta-analysis. Geoderma 2024, 443, 116845. [Google Scholar] [CrossRef] [Scilit]
  45. Feng, W.; Sanchez-Rodriguez, A.R.; Bilyera, N.; Wang, J.; Wang, X.; Han, Y.; Li, Y. Mechanisms of biochar-based organic fertilizers enhancing maize yield on a Chinese Chernozem: Root traits, soil quality and soil microorganisms. Environ. Technol. Innov. 2024, 36, 103756. [Google Scholar] [CrossRef] [Scilit]
  46. Song, J.; Zhang, H.; Zamanian, K.; Chang, F.; Yu, R.; Wang, J.; Li, Y. Inorganic carbon accumulation in saline soils via modification effects of organic amendments on dissolved ions and enzymes activities. Catena 2024, 241, 108039. [Google Scholar] [CrossRef] [Scilit]
  47. Sun, J.; He, F.; Shao, H.; Zhang, Z.; Xu, G. Effects of biochar application on Suaeda salsa growth and saline soil properties. Environ. Earth Sci. 2016, 75, 630. [Google Scholar] [CrossRef] [Scilit]
  48. Salihi, M.S.; Hamim, H.; Serat, S.M. Impacts of humic acid on growth and yield of wheat: A review. J. Nat. Sci. Rev. 2024, 2, 87–96. [Google Scholar] [CrossRef] [Scilit]
  49. Liu, J.; Ma, Q.; Hui, X.; Ran, J.; Ma, Q.; Wang, X.; Wang, Z. Long-term high-P fertilizer input decreased the total bacterial diversity but not phoD-harboring bacteria in wheat rhizosphere soil with available-P deficiency. Soil Biol. Biochem. 2020, 149, 107918. [Google Scholar] [CrossRef] [Scilit]
  50. Lemanowicz, J. Phosphatases activity and plant available phosphorus in soil under winter wheat (Triticum aestivum L.) fertilized minerally. Pol. J. Agron. 2011, 4, 12–15. [Google Scholar]
  51. Kabir, E.; Kim, K.H.; Kwon, E.E. Biochar as a tool for the improvement of soil and environment. Front. Environ. Sci. 2023, 11, 1324533. [Google Scholar] [CrossRef] [Scilit]
  52. Smebye, A.; Alling, V.; Vogt, R.D.; Gadmar, T.C.; Mulder, J.; Cornelissen, G.; Hale, S.E. Biochar amendment to soil changes dissolved organic matter content and composition. Chemosphere 2016, 142, 100–105. [Google Scholar] [CrossRef] [Scilit]
  53. Xian, J.; Chen, X.; Wang, S.; Zhang, X.; Xu, G. Phosphorus availability in saline soil: A review. Soils 2023, 55, 474–486. Available online: http://soils.issas.ac.cn/html/tr/2023/3/tr202208100349.htm (accessed on 25 December 2025).
  54. Zhao, Z.; Gao, F.; Luo, J.; Sheng, Y.; Han, L.; Zhang, Y. Effects of different nitrogen and phosphorus fertilizer ratios on yield, quality, and nutrient use of spring wheat in the Hetao region. Soils Fertil. Sci. China 2022, 1–9. Available online: https://kns.cnki.net/verify/home?captchaType=clickWord&ident=bc397c&captchaId=e45c03fa-1066-4344-90f2-ffdcbd424aba&returnUrl=iECBDnhr716Qd6pbb7El10nguP5Sbm9UQxpzsYxSAM-JuReIJajXtFEoWu2OvDWpG0-UFZwc_rWye9NccOizSX3Ynnrv7CRwCSRPurIDIGiL91bnikdnuolBn_kzqJqgnE9tixlxkqtbaanMCVJ3v-ge9ORntfVaUE90C4SuvntbVfepPYIzc8o1_Q2AiupRxsFEAy_I-jlt6ia_nqygtzsFZKfIMmgcwgwjHICHPWASbG-uCby9s6l-no1nqaQYvfg3sIP1Dc4ptDca5qPIBAXmUusZdELLivrS1bl3MEVSovoes40wCnhOhJpEmQr1nXo2X_6CJBx0015bExUsBuBMi1a8yf73CnGmVG8ztTw%3D (accessed on 25 December 2025).
  55. Yu, R.; Li, Y.; Cao, J.; Ma, J.; Chang, F.; Song, J.; Zhang, H.; Li, X.; Li, H.; Zhang, H.; et al. Effects of fertilization management on carbon fractions in saline-alkaline soil under green manure rotation and wheat yield. Sci. Agric. Sin. 2025, 58, 4189–4202. [Google Scholar]
  56. Šimanský, V.; Wójcik-Gront, E.; Bordoloi, S.; Horák, J. Biochar and its combination with nitrogen fertilisation altered soil organic matter, humic substances, and soil structure: Short-term versus long-term changes. Environ. Geochem. Health 2025, 47, 532. [Google Scholar] [CrossRef] [Scilit] [PubMed]
Figure 1. Soil enzyme activity under biochar (BC) and humic acid (HA), as well as no amendment as control (CK), over two experimental year-sites. Two-way ANOVA was conducted for experimental year-site (Y-S) and treatment (T). Different lowercase letters within a column of the same experimental year-site indicate significant differences at p < 0.05 by Fisher’s least significant difference (LSD) test. Values are presented as means ± standard errors (n = 3). * p < 0.05, ** p < 0.01, *** p < 0.001, and NS indicates no significant difference.
Agronomy 16 00550 g001
Figure 2. The relative responses of soil biochemical properties and soil quality index (SQI) to different soil amendments. Treatments are: biochar (BC) and humic acid (HA), as well as no amendment as control (CK). Exch-K, exchangeable potassium; Avail-P, available phosphorus; AH-N, alkali-hydrolyzable nitrogen; TP, total phosphorus; TN, total nitrogen; SOM, soil organic matter; CEC, cation exchange capacity; SC, salt content; CAT, catalase; ALP, alkaline phosphatase; UE, urease. Different lowercase letters within a column of the same experimental year-site indicate significant differences at p < 0.05 by Fisher’s least significant difference (LSD) test. Values are presented as means ± standard errors (n = 3).
Agronomy 16 00550 g002
Table 1. Soil basic fertility of the two experimental sites in 2022 and 2023.
Experimental Year-SitepHBD
(g·cm−3)
SC
(g·kg−1)
CEC
(cmol·kg−1)
SOM
(g·kg−1)
TN
(g·kg−1)
TP
(g·kg−1)
AH-N
(mg·kg−1)
Avail-P
(mg·kg−1)
Exch-K
(mg·kg−1)
2022-site 18.301.442.7518.727.51.431.7015133.0257
2023-site 28.041.422.7020.123.01.721.1014735.6260
Note: BD, Soil bulk density; SC, salt content; CEC, cation exchange capacity; SOM, soil organic matter; TN, total nitrogen; TP, total phosphorus; AH-N, alkali-hydrolyzable nitrogen; Avail-P, available phosphorus; Exch-K, exchangeable potassium.
Table 3. The biomass of spring wheat at harvest under biochar and humic acid amendment.
Experimental Year-SiteTreatmentRoot
(kg·m−2)
Shoot
(kg·m−2)
Spike
(kg·m−2)
AGB
(kg·m−2)
HI
(%)
2022-site 1CK0.41 ± 0.02 b0.88 ± 0.53 ab1.71 ± 0.01 a2.60 ± 0.08 ab34.51 ± 1.75 a
Biochar0.46 ± 0.01 a0.96 ± 0.02 a1.78 ± 0.04 a2.73 ± 0.05 a33.20 ± 1.04 ab
Humic acid0.42 ± 0.01 b0.82 ± 0.02 b1.36 ± 0.04 b2.19 ± 0.09 b27.00 ± 0.45 b
2023-site 2CK0.27 ± 0.06 b1.71 ± 0.03 b2.12 ± 0.04 c3.83 ± 0.10 b30.96 ± 0.38 b
Biochar0.48 ± 0.20 a2.01 ± 0.04 a2.59 ± 0.01 b4.59 ± 0.05 ab28.11 ± 0.53 b
Humic acid0.42 ± 0.05 a1.97 ± 0.03 a2.86 ± 0.03 a4.84 ± 0.08 a34.40 ± 0.73 a
Two-way ANOVA
Experimental year-site (Y-S)ns*********ns
Treatment (T)*********
Y-S × T***********
Note: AGB, above-ground biomass; HI, harvest index. Different lowercase letters within a column of the same experimental year-site indicate significant differences at p < 0.05 by Fisher’s least significant difference (LSD) test. Values are means ± standard errors (n = 3). * p < 0.05, *** p < 0.001, and ns not significant difference.
Disclaimer/Publisher’s Note: The statements, opinions and data contained in all publications are solely those of the individual author(s) and contributor(s) and not of MDPI and/or the editor(s). MDPI and/or the editor(s) disclaim responsibility for any injury to people or property resulting from any ideas, methods, instructions or products referred to in the content.