Article

Optimized Phosphorus Inputs Enhances Maize Yield and Humus Stabilization in Albic Soils of Northeast China: Evidence from Three-Year Field Trial


1
College of Agriculture, Jilin Agricultural Science and Technology College, Jilin 132101, China
2
Chemical Engineering, University of Waterloo, Waterloo, ON N2L 3G1, Canada
*
Author to whom correspondence should be addressed.
Agronomy 2026, 16(4), 469; https://doi.org/10.3390/agronomy16040469
Submission received: 18 January 2026 / Revised: 10 February 2026 / Accepted: 15 February 2026 / Published: 18 February 2026
(This article belongs to the Section Soil and Plant Nutrition)

Abstract

Maize is a globally significant cereal crop, while Albic soils in Northeast China are characterized by low available phosphorus (P), poor humus (HS) quality, and constrained maize yield. The synergistic effects of P fertilization on maize yield and HS quality in these soils remain poorly understood. This three-year field experiment was conducted to determine the optimal P application rate for concurrently enhancing crop productivity and HS quality. Four P application rates were established: 0 kg P2O5 ha−1 (no P application, P0), 40 kg P2O5 ha−1 (low P application, LP), 80 kg P2O5 ha−1 (moderate P application, MP), and 120 kg P2O5 ha−1 (high P application, HP). Soil nutrients status, HS fractions, dissolved organic matter (DOM) fluorescence characteristics, and structural properties of humic acid (HA) were systematically analyzed following standard analytical procedures. Principal component analysis (PCA) and Pearson correlation analysis were integrated to facilitate comprehensive data interpretation. Results indicated that the MP treatment achieved the highest maize yield (12,257.1 kg ha−1) and soil organic matter (SOM, 14.8 g kg−1) content, with no further yield improvement observed under HP. The MP treatment significantly increased DOM carbon content (CDOM, 0.350 mg L−1) and its humification index (HIX, 6.80), promoting the transformation of labile DOM into stable HS. HA under MP treatment exhibited enhanced structural stability, as evidenced by a lower H/C ratio (1.72), a higher O/C ratio (0.880), and a reduced E4/E6 ratio, reflecting increased aromatic condensation and a greater abundance of oxygen-containing functional groups. Fourier transform infrared (FTIR) spectroscopy and differential thermal analysis (DTA) confirmed that MP improved the structural complexity and thermal stability of HA. In contrast, P0 and LP restricted nutrient availability and HS formation, whereas HP induced soil acidification (pH 5.68) and disrupted HS equilibrium. Principal component analysis (PCA) and correlation analysis revealed significant positive associations between the MP treatment and SOM, CDOM, and maize yield. This implied that moderate P input promoted stable soil organic carbon accumulation and nutrient availability, synergistically enhancing maize productivity—consistent with the study’s core goal of optimizing P management for concurrent yield and HS quality improvement in Albic soils. Accordingly, this study concluded that moderate P application (80 kg P2O5 ha−1) was optimal for Albic soils, synergistically enhancing both maize productivity and HS quality. These findings provided theoretical support for precise P management in sustainable agricultural systems within the Albic soil regions of Northeast China.

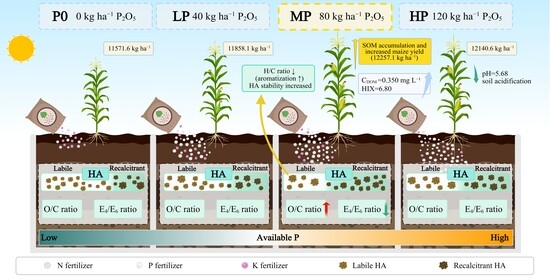
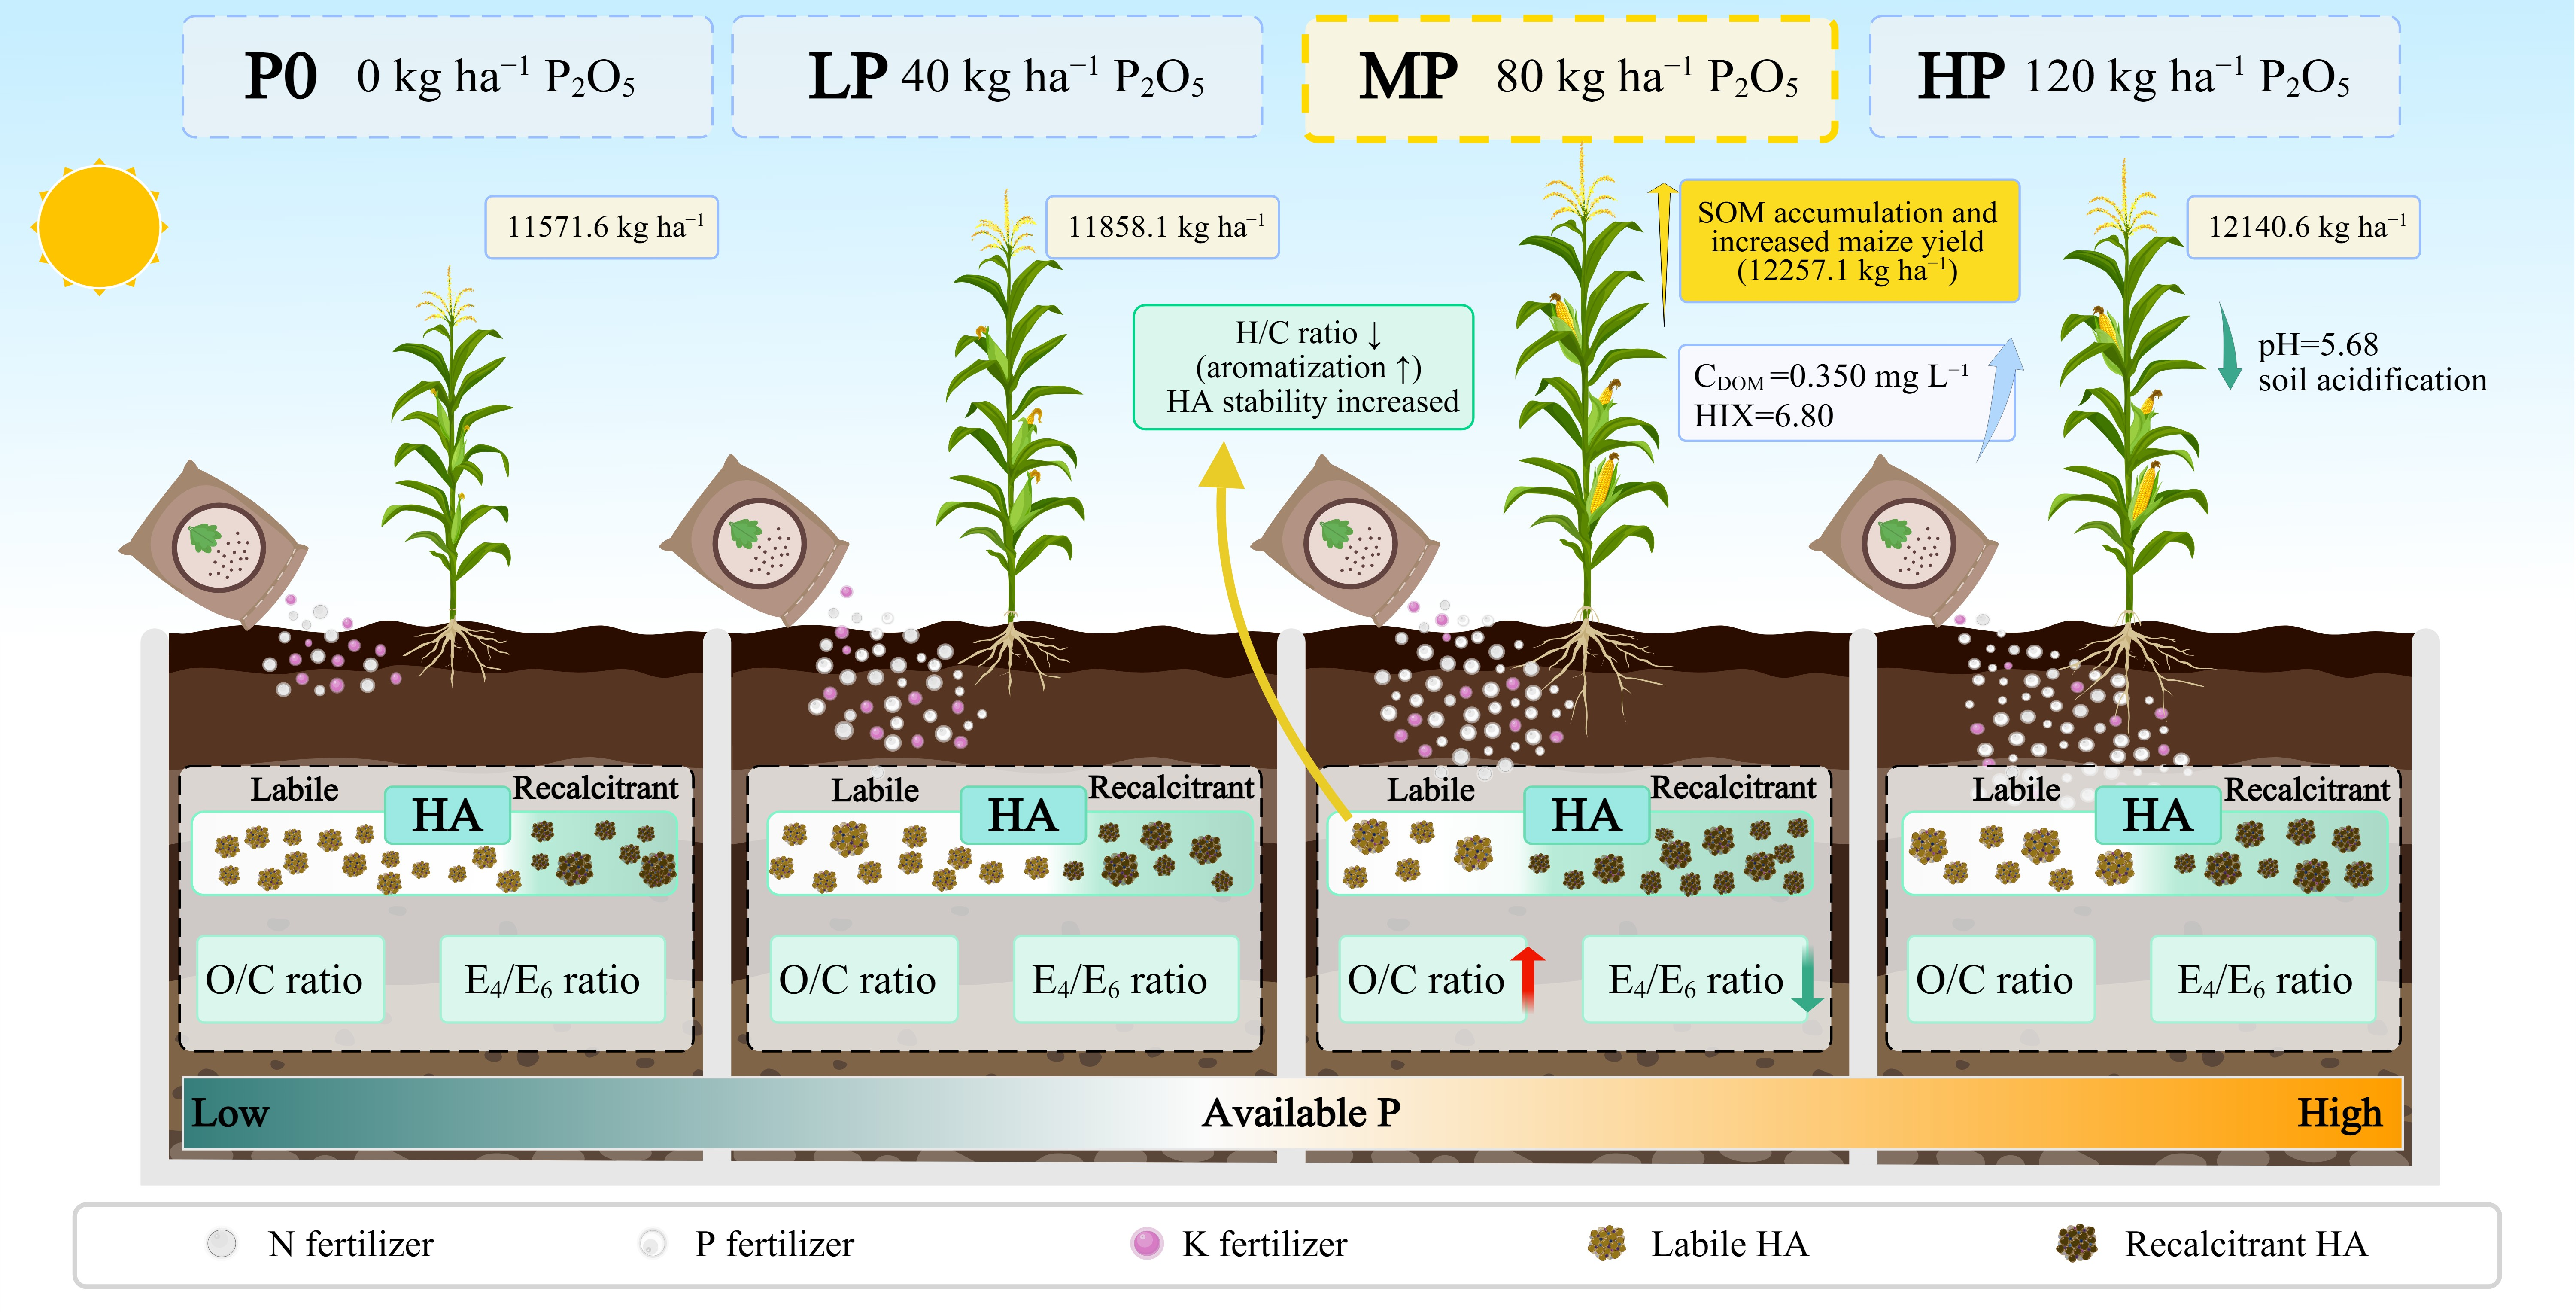
Graphical Abstract

1. Introduction

Maize ranks among the most important cereal crops worldwide, playing a pivotal role in global food security and agricultural sustainability [1]. Albic soils are widely distributed across the northeastern black soil region of China, covering approximately 5.272 million hectares [2] and accounting for a considerable proportion of the region’s arable land—underscoring their significant role in regional agricultural production and food security. Notably, these soils exhibit distinct edaphic characteristics that make them highly sensitive to phosphorus (P) availability: severe deficiency in available P, low soil organic matter (SOM) content, poor nutrient retention capacity, and inherent acidity, which collectively exacerbate P limitation and restrict maize yield potential in this key agricultural region [2,3]. Humus (HS), as the principal component of SOM, plays a critical role in improving soil physicochemical properties, enhancing nutrient availability, and regulating microbial activity, all of which are closely linked to soil fertility and crop productivity [4,5]. In Albic soils, the low HS content exacerbates soil degradation, creating a negative feedback loop that limits regional agricultural output. Given the increasing demand for food and the urgent need for soil restoration, identifying effective strategies to simultaneously improve maize yield and HS quality in Albic soils has become a priority. P fertilizer application is a common agronomic practice aimed at boosting crop yields, and previous studies have demonstrated its effectiveness in increasing maize productivity in these soils [6]. Nevertheless, the synergistic impact of P fertilization on both maize yield and HS quality remains insufficiently elucidated.
Regarding the regulatory effect of P on soil HS, inconsistencies persist in the literature concerning P’s influence on humic acid (HA). A 33-year long-term fertilization experiment on black soil demonstrated that the continuous application of P-containing compound fertilizers significantly reduced soil organic carbon (SOC) pools, as well as the C contents of HA and fulvic acid (FA) [7]. In contrast, a 35-year long-term study by Zhang et al. on black soil reported no significant difference in HA carbon (C) content between the inorganic N-P-K fertilizer treatment and the control group, attributing such discrepancies to confounding factors, including initial soil fertility levels and climatic conditions during the experimental period [8]. These inconsistencies in P–HA interactions across studies underscore the dependence on soil type and fertilization regime, which further emphasizes the need to explore P effects in Albic soils with unique edaphic constraints. With respect to humin (HM), prolonged P input was shown to significantly alter its molecular composition and reactivity [9]. Moreover, the molecular architecture of HM became increasingly complex over time. Previous studies have also established a clear correlation between soil nutrient balance—particularly P surplus or deficit—and HM structural parameters; P surplus was positively correlated with aliphatic C content and negatively correlated with aromatic C content in HM, confirming that P fertilization could indirectly influence the structural dynamics and stability of HM through modulation of soil nutrient equilibrium [9].
Despite extensive research confirming the regulatory role of P in maize yield and soil HS dynamics, existing studies lack focus on Albic soils and rarely clarify the synergistic mechanism of P on maize productivity and HS stabilization. Given the wide distribution of Albic soils across the maize belt of Northeast China and their inherent edaphic constraints (low available P and poor HS stability), the relationship between maize yield and key humic fractions in these soils under variable P application rates within the central golden maize belt of Jilin Province remains poorly characterized. Addressing this critical knowledge limitation is therefore of considerable practical significance for safeguarding regional food security and sustaining soil health in this agroecosystem. This study aimed to: (1) clarify how variable P application rates regulate maize yield and major HS fractions in Albic soils and (2) identify the optimal P application rate to achieve synergistic enhancement of maize productivity and soil quality. We hypothesized that moderate P application would promote HS stabilization and increase maize yield by alleviating soil P limitation while avoiding the induction of soil acidification. A core research question for this study was ‘What are the key mechanisms linking variable P application rates to HS structural modification and maize yield enhancement in Albic soils?’ In view of this, a three-year in situ field experiment was conducted under continuous maize monoculture, incorporating four P-gradient treatments: 0, 40, 80, and 120 kg P2O5 ha−1. All treatments received uniform applications of N fertilizer (220 kg N ha−1) and K2O fertilizer (90 kg K2O ha−1) to minimize confounding effects from non-P nutrients. Multiple complementary analytical techniques and statistical methods were used to characterize soil HS fractions, DOM properties, and HA structure, and identify the optimal P application rate. This study aimed to identify the optimal P application rate that synergistically enhances maize yield and HS quality, thereby providing scientific guidance for precise P fertilization and integrated maize–soil management in Albic soils.

2. Materials and Methods

2.1. Study Site

The experiment was conducted in a transitional zone between the Changbai Mountains and the Songnen Plain (43°58′ N, 126°29′ E; elevation: 200.7 m a.s.l.), which has a mid-temperate, subhumid monsoon climate. The region has a mean annual temperature of 3 to 5 °C, average annual precipitation of approximately 700 mm, and a frost-free period of 130 to 140 days. Solar radiation and thermal resources are sufficient to support full-cycle maize growth. The soil is classified as Albic soil with a sandy loam texture. Initial soil physicochemical properties were as follows: alkali-hydrolyzable N (116.7 mg kg−1), available P (22.6 mg kg−1), available K (190.1 mg kg−1), SOM content (13.4 g kg−1), and pH (5.63).

2.2. Experimental Materials

A mid–late maturing maize hybrid, ‘Meijiahe 517′, bred by Jilin Meijiahe Seed Industry Co., Ltd. (Changchun, Jilin, China), was used as the test cultivar. Fertilizers included urea (46% N), single superphosphate (12% P2O5), and K chloride (60% K2O), all purchased from Sinopharm Chemical Reagent Co., Ltd. (Shanghai, China).

2.3. Experimental Design

Field experiments were conducted from May 2022 to December 2024 at Jilin Agricultural Science and Technology College in Jilin City, Jilin Province, China. covering three complete maize growing seasons (2022, 2023, and 2024) to achieve a 3-year trial duration. Prior to the initiation of the experiment, the experimental site had been cultivated with maize under consistent agronomic practices in microplots since May 2022, ensuring uniform soil management across three consecutive growing seasons. Albic soils require 1–2 years to reach nutrient balance under new fertilization regimes [3], so we present third-year data to reflect steady-state responses, avoiding short-term fluctuations. Four P application rates were determined based on both local farmer practices and official recommendations in central Jilin Province. A rate of 80 kg P2O5 ha−1 aligns with the official recommended optimal P input for maize production in this region. A rate of 40 kg P2O5 ha−1 is half the optimal rate, and 120 kg P2O5 ha−1 is 1.5 times the optimal rate, reflecting common under-fertilization and over-fertilization scenarios in local agricultural practices. A blank control rate of 0 kg P2O5 ha−1 allows for a comprehensive comparison of the effects of different P input levels on maize yield and humus stability, forming a complete gradient from P deficiency to excess. Four P application rates were established: 0 kg P2O5 ha−1 (no P application, P0), 40 kg P2O5 ha−1 (low P application, LP), 80 kg P2O5 ha−1 (moderate P application, MP), and 120 kg P2O5 ha−1 (high P application, HP). N and K2O were applied uniformly across all treatments at rates of 220 kg N ha−1 and 90 kg K2O ha−1, respectively. The experiment was arranged in a randomized complete block design with three biological replicates. Each plot measured 4.00 m × 2.60 m (total area: 10.4 m2) and was separated by concrete partitions to prevent cross-contamination of irrigation water and fertilizers. Row spacing was maintained at 65 cm, with an in-row plant spacing of 23.7 cm, resulting in a planting density of 6.50 × 10⁴ plants ha−1. All other field management practices—including irrigation, weed control, pest and disease management, and chemical regulation—were standardized across treatments, with P application serving as the sole experimental variable.

2.4. Extraction of Humic Components and Determination of Their C Contents

The extraction of humic components was performed according to the method described by Zhou et al. [10]. Prior to extraction, soil samples were air-dried and passed through a 0.15 mm sieve. Initially, the sieved soil was extracted twice with deionized water (solid-to-liquid ratio = 1:20) using a 70 °C water bath shaker; the supernatant was collected as water-soluble substances (WSSs). The residual soil was further treated with a mixed solution of 0.1 M NaP2O7·10 H2O and 0.1 M NaOH (solid-to-liquid ratio = 1:20), shaken at 200 rpm for 1 h at 70 °C, and centrifuged at 3500 rpm for 20 min. The dark-brown supernatant was collected as humic-extracted acid (HE). The remaining precipitate was rinsed with deionized water to near-neutral pH, dried at 60 °C, ground through a 0.15 mm sieve, and defined as the HM fraction. A subsample of HE was acidified to pH 1.0 with 6 M HCl, stood overnight, and centrifuged at 8000 rpm for 20 min. The precipitate was dissolved in 0.1 M NaOH to near-neutral pH to obtain HA. Crude HM was sequentially fractionated into iron-bound HM (HMi), clay-bound HM (HMc), and residual HM (HMr) as follows. Crude HM was mixed with 25 mL of 1 M H2SO4, stirred at 25 °C for 2 h, centrifuged (4000 rpm, 15 min), and the residue was washed twice with distilled water. HMi was extracted with 50 mL of 0.2 M NaOH (shaken at 25 °C for 1 h, stood for 24 h, and centrifuged). The residual soil after HMi extraction was treated twice with 50 mL of 1 M HF–HCl solution (shaken at 25 °C for 2 h and centrifuged), followed by 50 mL of 1 M HF (shaken at 25 °C for 2 h and centrifuged), and washed twice with distilled water. HMc was extracted with 50 mL of 0.2 M NaOH (shaken at 25 °C for 1 h, stood for 24 h, and centrifuged; supernatant filtered into a 50 mL volumetric flask). The remaining solid was washed, dried, weighed, and sieved through a 60-mesh sieve to obtain HMr.
The C contents of WSS, HE, HA, HM, HMi, HMc, and HMr fractions (designated as CWSS, CHE, CHA, CHM, CHMi, CHMc, and CHMr) were determined using the K2Cr2O7 oxidation method with external heating. The C content of FA (CFA) was calculated as CFA = CHE − CHA. The E4/E6 ratios (ratio of the absorbances at 465 nm and at 665 nm) of HA, HMi and HMc were measured using a UV–visible spectrophotometer (TU-1900, Beijing Purkinje General Instrument Co., Ltd., Beijing, China) to assess their degree of humification. Ratios of HMi/HMc and (HMi+HMc)/HM were calculated, along with the corresponding C-normalized ratios of CHMi/CHMc and (CHMi+CHMc)/CHM (where CHM denoted the total C content in bulk HM).
HA solid samples were purified by electrodialysis, freeze-dried, ground into fine powder (<0.01 mm), and analyzed for elemental composition (C, H, O, and N) using an elemental analyzer (PE 2400II CHNS/O, PerkinElmer, Inc., Waltham, MA, USA). Structural characteristics were determined via FTIR spectroscopy (FTIR-850, Tianjin Gangdong Sci. & Tech. Development Co., Ltd., Tianjin, China; wavenumber range: 400–4000 cm−1) and simultaneous differential thermal analysis (DTA)–thermogravimetric analysis (TGA) (HQT-2, Beijing Hengjiu Scientific Instrument Factory, Beijing, China). A total of 8–15 mg of freeze-dried HA was heated from 25 °C to 1000 °C at 10 °C min−1, with heat flow and mass changes monitored.

2.5. 3D-EEM of DOM

DOM was prepared by dissolving fresh soil samples in distilled water (weight-to-volume ratio = 1:30), shaken at 25 °C for 2 h, centrifuged at 12,000 rpm for 15 min, and filtered through a 0.45 μm membrane filter. 3D-EEM spectra of DOM were acquired using a fluorescence spectrophotometer (F-7000, Hitachi High-Tech Scientific Solutions Co., Ltd. Tokyo, Japan), with excitation (Ex) and emission (Em) wavelengths ranging from 200 to 550 nm and 250 to 550 nm, respectively. Referring to Wang et al. [11], both Em and Ex slits were set to 5 nm, and scanning speed was 2400 nm min−1. Blank spectra from ultrapure water were subtracted to correct for Rayleigh and Raman scattering, and fluorescence data were analyzed using MATLAB 2020 (MathWorks, Natick, MA, USA).

2.6. Statistical Analysis

All data were processed using OriginPro 2021 and Microsoft Excel 2017. One-way analysis of variance (ANOVA) was performed using SPSS Statistics 20.0 to determine significant differences (p < 0.05). PCA validation involved Kaiser–Meyer–Olkin (KMO) and Bartlett’s sphericity tests; KMO value was 0.782 (>0.7, sufficient sampling adequacy) and Bartlett’s test p < 0.001 (confirming non-identity correlation matrix, suitable for PCA). PCA of soil HS fractions and nutrient indices in the maize system was conducted via GraphPad Prism 9.5, with z-score-standardized data to eliminate measurement unit effects. Principal components (PCs) were selected by eigenvalues > 1 and scree plot for robust variance interpretation. Data were presented as means of three replicate measurements, with standard deviations represented by error bars. Pearson correlation analysis was carried out using ChiPlot (https://www.chiplot.online/; accessed on 22 October 2025) to investigate relationships among various indicators in the Albic soil–maize system under different P treatments, and a correlation heatmap was generated accordingly.

3. Results

3.1. 3D-EEM Fluorescence Spectra of DOM

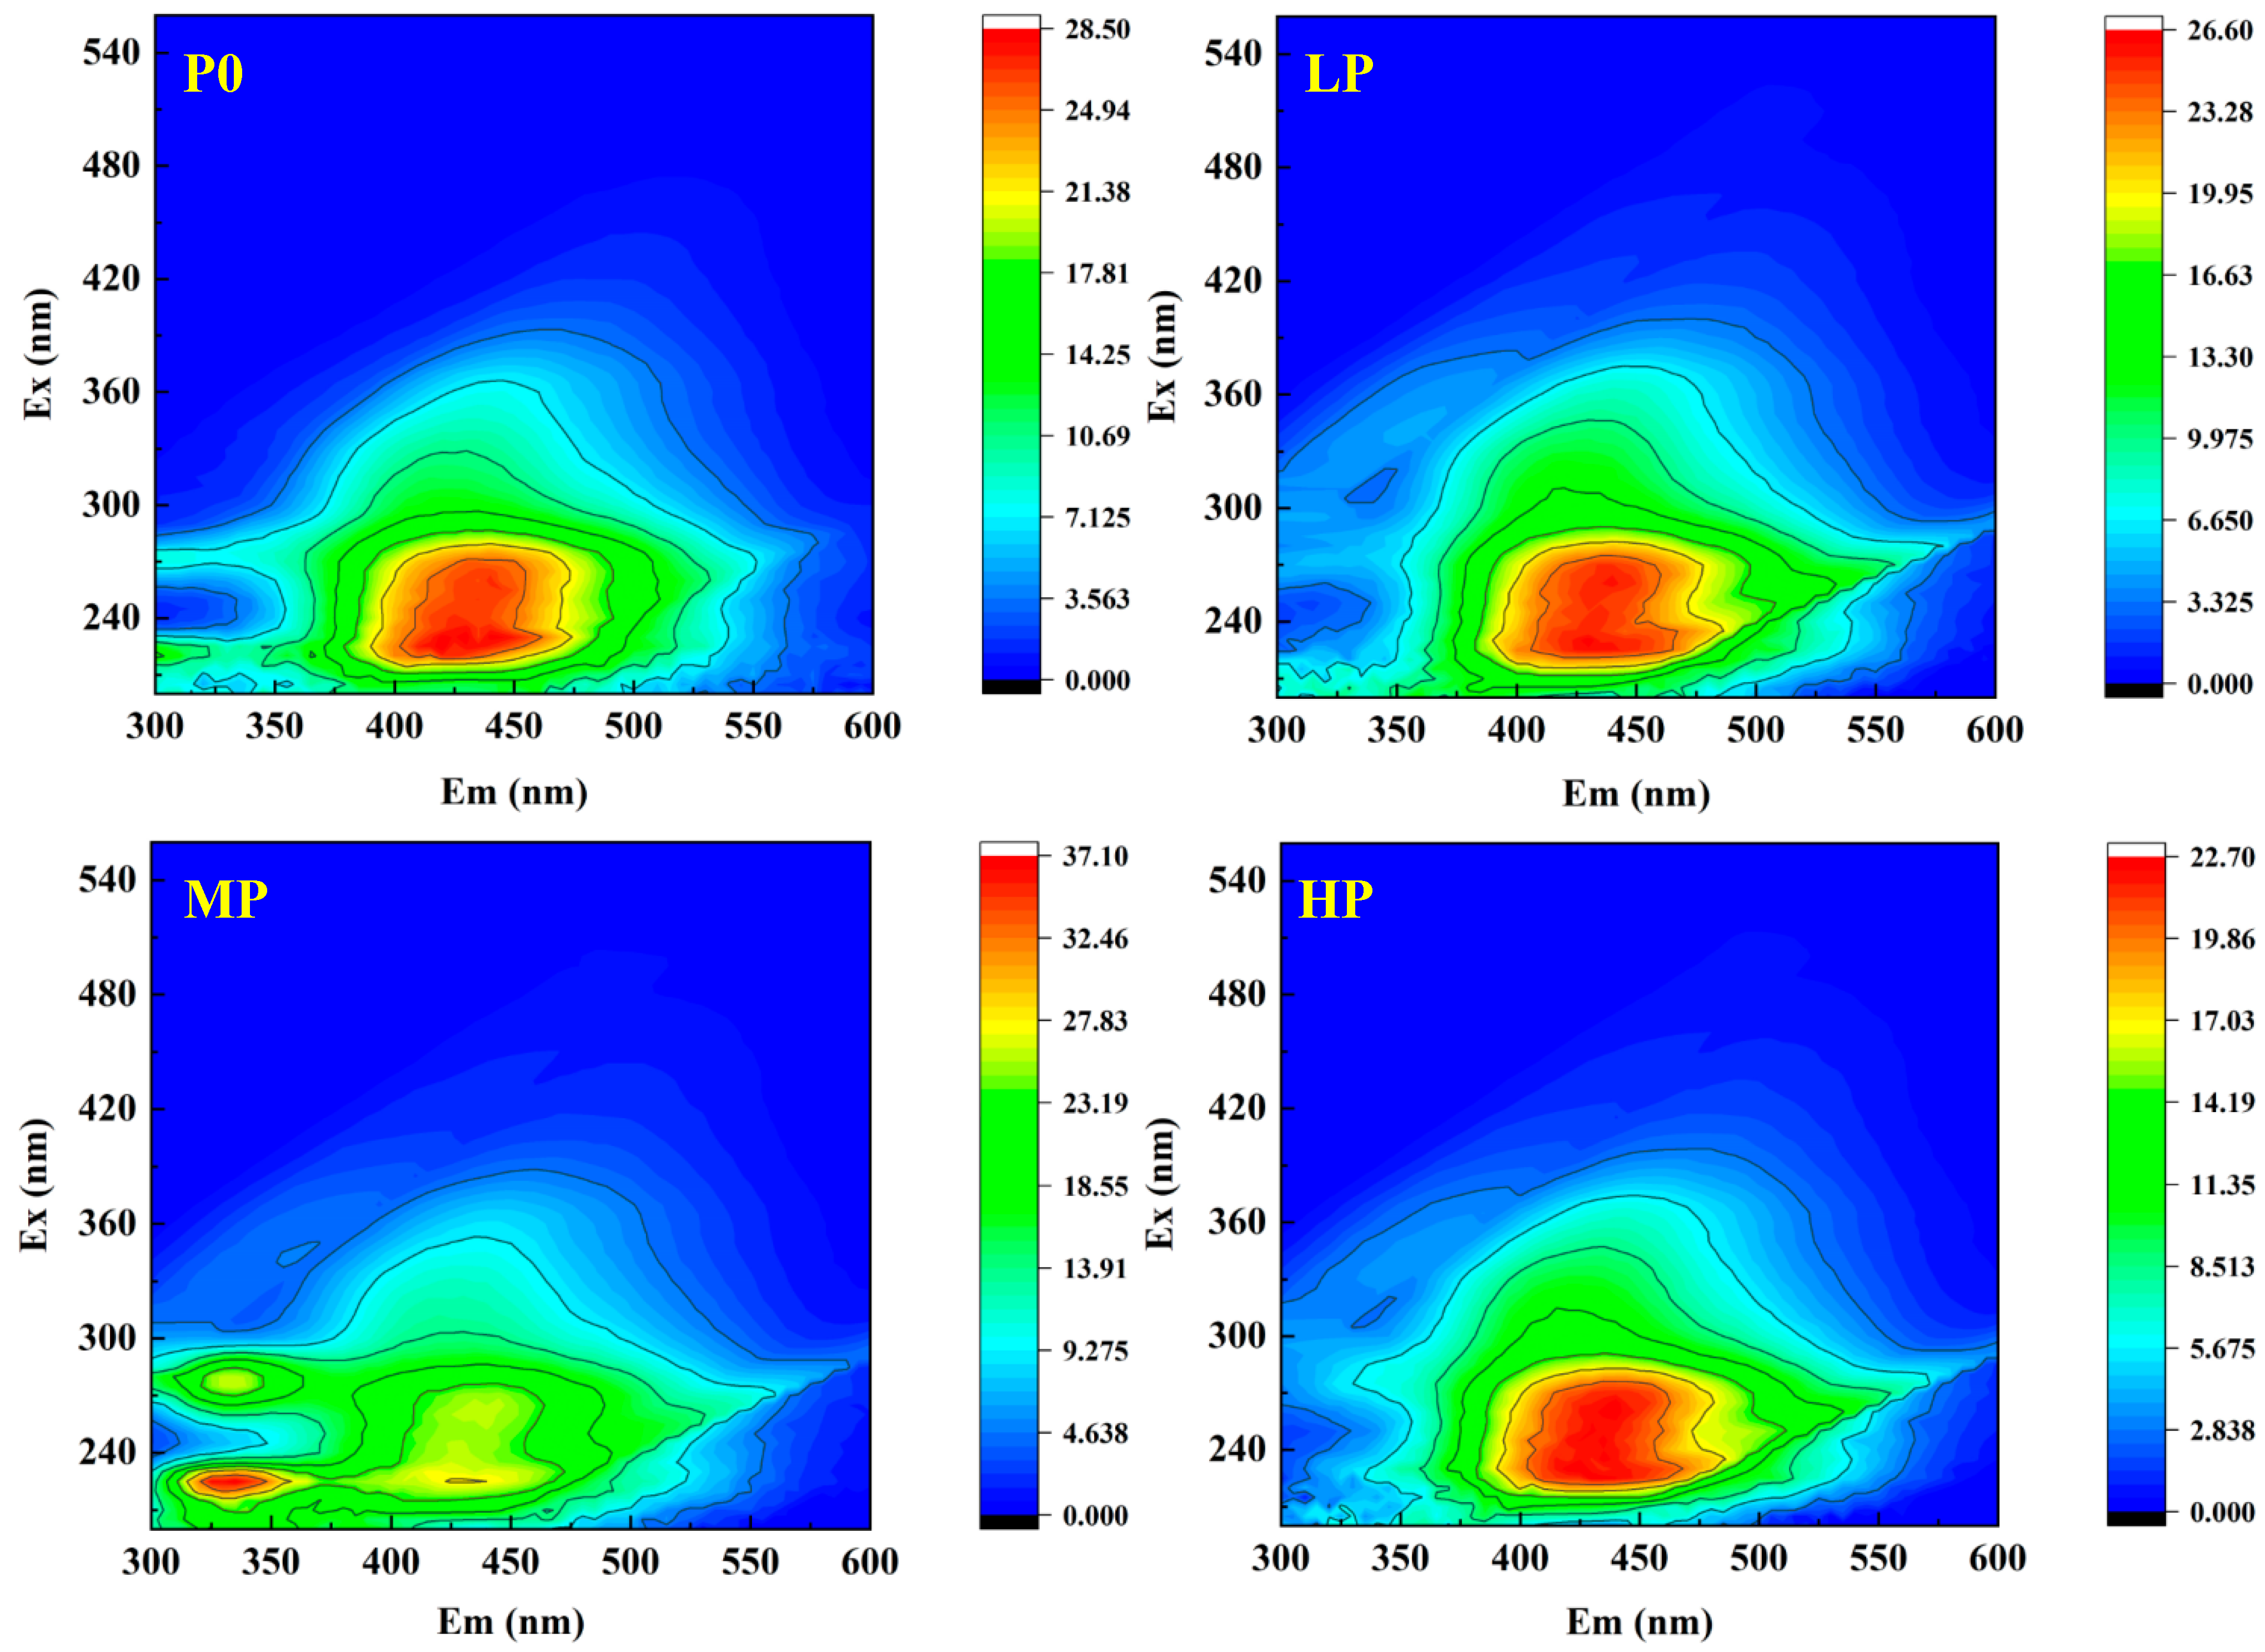
DOM, a labile C pool preferentially utilized by soil microorganisms compared to recalcitrant SOC, is primarily derived from plant residues and organic amendments [12]. P fertilization significantly altered the fluorescence profiles of DOM across treatments (Table 1, Figure 1). CDOM increased progressively from 0.270 mg L−1 in the P0 treatment to 0.350 mg L−1 in the MP treatment and remained stable under the HP treatment. FI is defined as the ratio of Em intensities at 470 and 520 nm under an Ex wavelength of 370 nm. DOM originating from plant roots, stems, and leaves is considered terrestrially derived when FI ≤ 1.4, whereas DOM with FI ≥ 1.90 is predominantly associated with microbial metabolic and degradation products (i.e., autochthonous DOM) [12]. Intermediate FI values of between 1.40 and 1.90 suggest a mixed origin from both microbial and plant sources [13]. As presented in Table 1, the FI value gradually increased from 1.91 in the P0 treatment to 2.05 in the MP treatment, followed by a slight decrease to 1.69 in the HP treatment. The fluorescence peak of DOM reflects its structural features and molecular fractions [14]. A prominent tryptophan-like fluorescence peak was observed at Ex/Em = 310/430 nm under HP treatment. The BIX serves as an indicator of recently produced DOM and is calculated as the ratio of Em intensity at 380 nm to that at 430 nm using an Ex wavelength of 310 nm. BIX reflects the proportion of autochthonous DOM within the total DOM pool [15]. BIX values remained relatively consistent across all treatments, ranging from 0.660 to 0.680, with a marginal increase observed in the MP treatment relative to others. The HIX was calculated as the ratio of the integrated fluorescence area over Em wavelengths of 435–480 nm to that over 300–345 nm at an Ex wavelength of 254 nm. Higher HIX values indicate greater degrees of DOM humification and enhanced aromaticity [16]. Similarly, higher BIX values indicate a larger proportion of recently synthesized DOM, reflecting its freshness [17]. HIX exhibited a nonlinear increase, rising from 2.88 in P0 to 6.52 in LP, further increasing to 6.80 in MP (representing a 136% increase from P0), and reaching 7.32 in HP.

3.2. Soil Nutrient Properties and Maize Yield

The three-year P fertilization experiment induced significant changes in soil nutrient dynamics and maize productivity, both of which exhibited dose-dependent responses to P inputs (Table 2). With respect to soil nutrients, available P content increased linearly with increasing P application rates, rising from 16.0 mg kg−1 in P0 treatment to 23.3 mg kg−1 in HP treatment—a 45.6% relative increase. SOM displayed a unimodal response, peaking in the MP treatment (14.8 g kg−1), representing a 51.0% increase compared to P0 (9.80 g kg−1), followed by a 10.1% decline under HP. Continuous soil acidification was observed with increasing P input, as soil pH decreased from 6.26 (P0) to 5.68 (HP). Alkali-hydrolyzed N content increased moderately by 23.3% from P0 to HP, whereas available K content declined sharply by 41.6% over the same period. Regarding maize productivity, grain yield peaked under the MP treatment (12,257.1 kg ha−1), exceeding the P0 yield by 5.92%. Notably, further increasing the P application rate to 120 kg P2O5 ha−1 did not enhance yield, indicating a saturation effect of P fertilization on maize production.

3.3. Variations in CWSS, CHE, CHA, and CHM, CHA/CFA Ratio and E4/E6 Ratio of HA

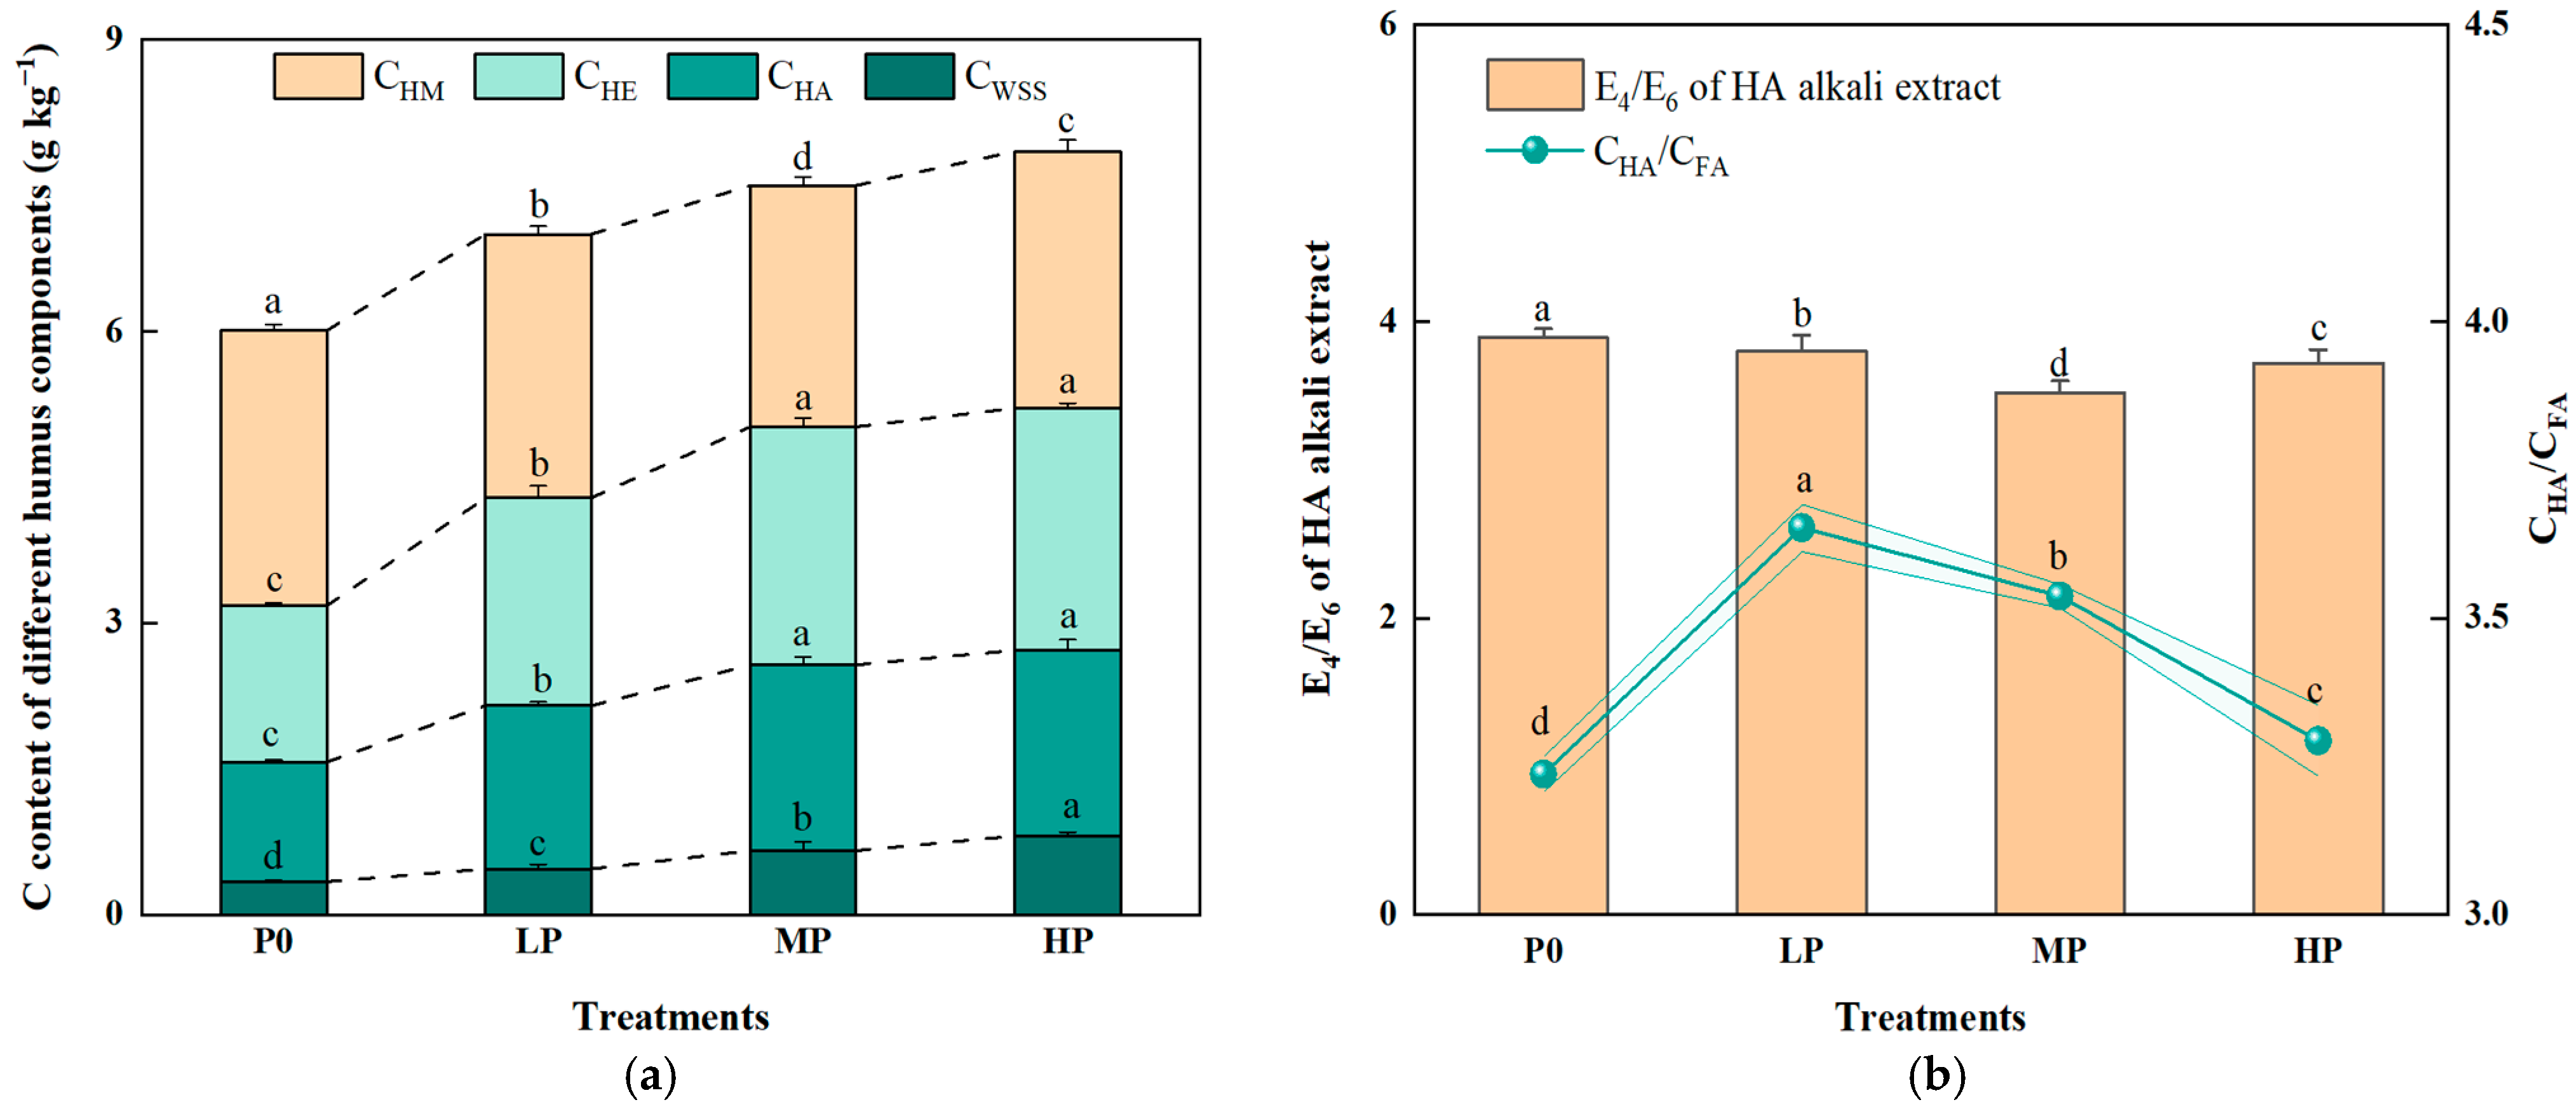
P application significantly altered the distribution and structural characteristics of HS fractions in Albic soils under maize cultivation (Figure 2a,b), with distinct dose-dependent patterns. The CWSS exhibited a significant linear increase with escalating P application rates (Figure 2a). The P0 treatment had the lowest CWSS content, which was significantly lower than all P-amended treatments, and CWSS increased progressively with higher P levels. The CHA responded to P gradients with an initial significant increase followed by stabilization (Figure 2a). Compared to the control (P0), P addition significantly enhanced CHA content across all P-amended treatments. The maximum CHA content occurred under the MP treatment, which was 55.3% higher than in P0. Moreover, CHA in MP treatment was significantly greater than that in LP treatment, but no significant difference was observed between MP and HP. CHE followed a pattern similar to CHA, showing an initial increase and subsequent stabilization with increasing P rates (Figure 2a). The CHM was significantly affected by P application, exhibiting an overall decreasing trend with a slight recovery at the highest P level (Figure 2a). The P0 treatment had the highest CHM content, which was significantly greater than all P-amended treatments. Upon initial P addition, CHM decreased significantly to 2.71 g kg−1. As P application increased to the MP level, CHM declined further to a minimum of 2.48 g kg−1—significantly lower than in LP. At the HP level, CHM rebounded slightly to 2.64 g kg−1, which was significantly higher than in MP but still significantly lower than in P0 and LP. The E4/E6 ratio of HA serves as a key indicator of HA humification degree and molecular weight; a higher E4/E6 value reflects lower humification and smaller molecular size, whereas a lower value indicates greater humification and larger molecular weight [18]. As shown in Figure 2b, the E4/E6 ratio of HA significantly decreased with increasing P application, except for a minor rebound under HP. The P0 treatment exhibited the highest E4/E6 ratio, followed by LP and HP, while MP showed the lowest value. Significant differences were observed among all treatments. The CHA/CFA ratio is an important index for assessing the quality and stability of soil HS; a higher ratio indicates greater humification and enhanced stability [19]. As illustrated in Figure 2b, this ratio initially increased significantly but subsequently declined continuously with increasing P rates. The P0 treatment had the lowest ratio. LP treatment sharply increased it to 3.65. Further increasing P to MP reduced the ratio to 3.54, and application at HP led to a further decline to 3.29. Significant differences were detected among all treatments.

3.4. CHMi, CHMc, CHMr, HMi/HMc and (HMi+HMc)/HM, E4/E6 of HMi and HMc

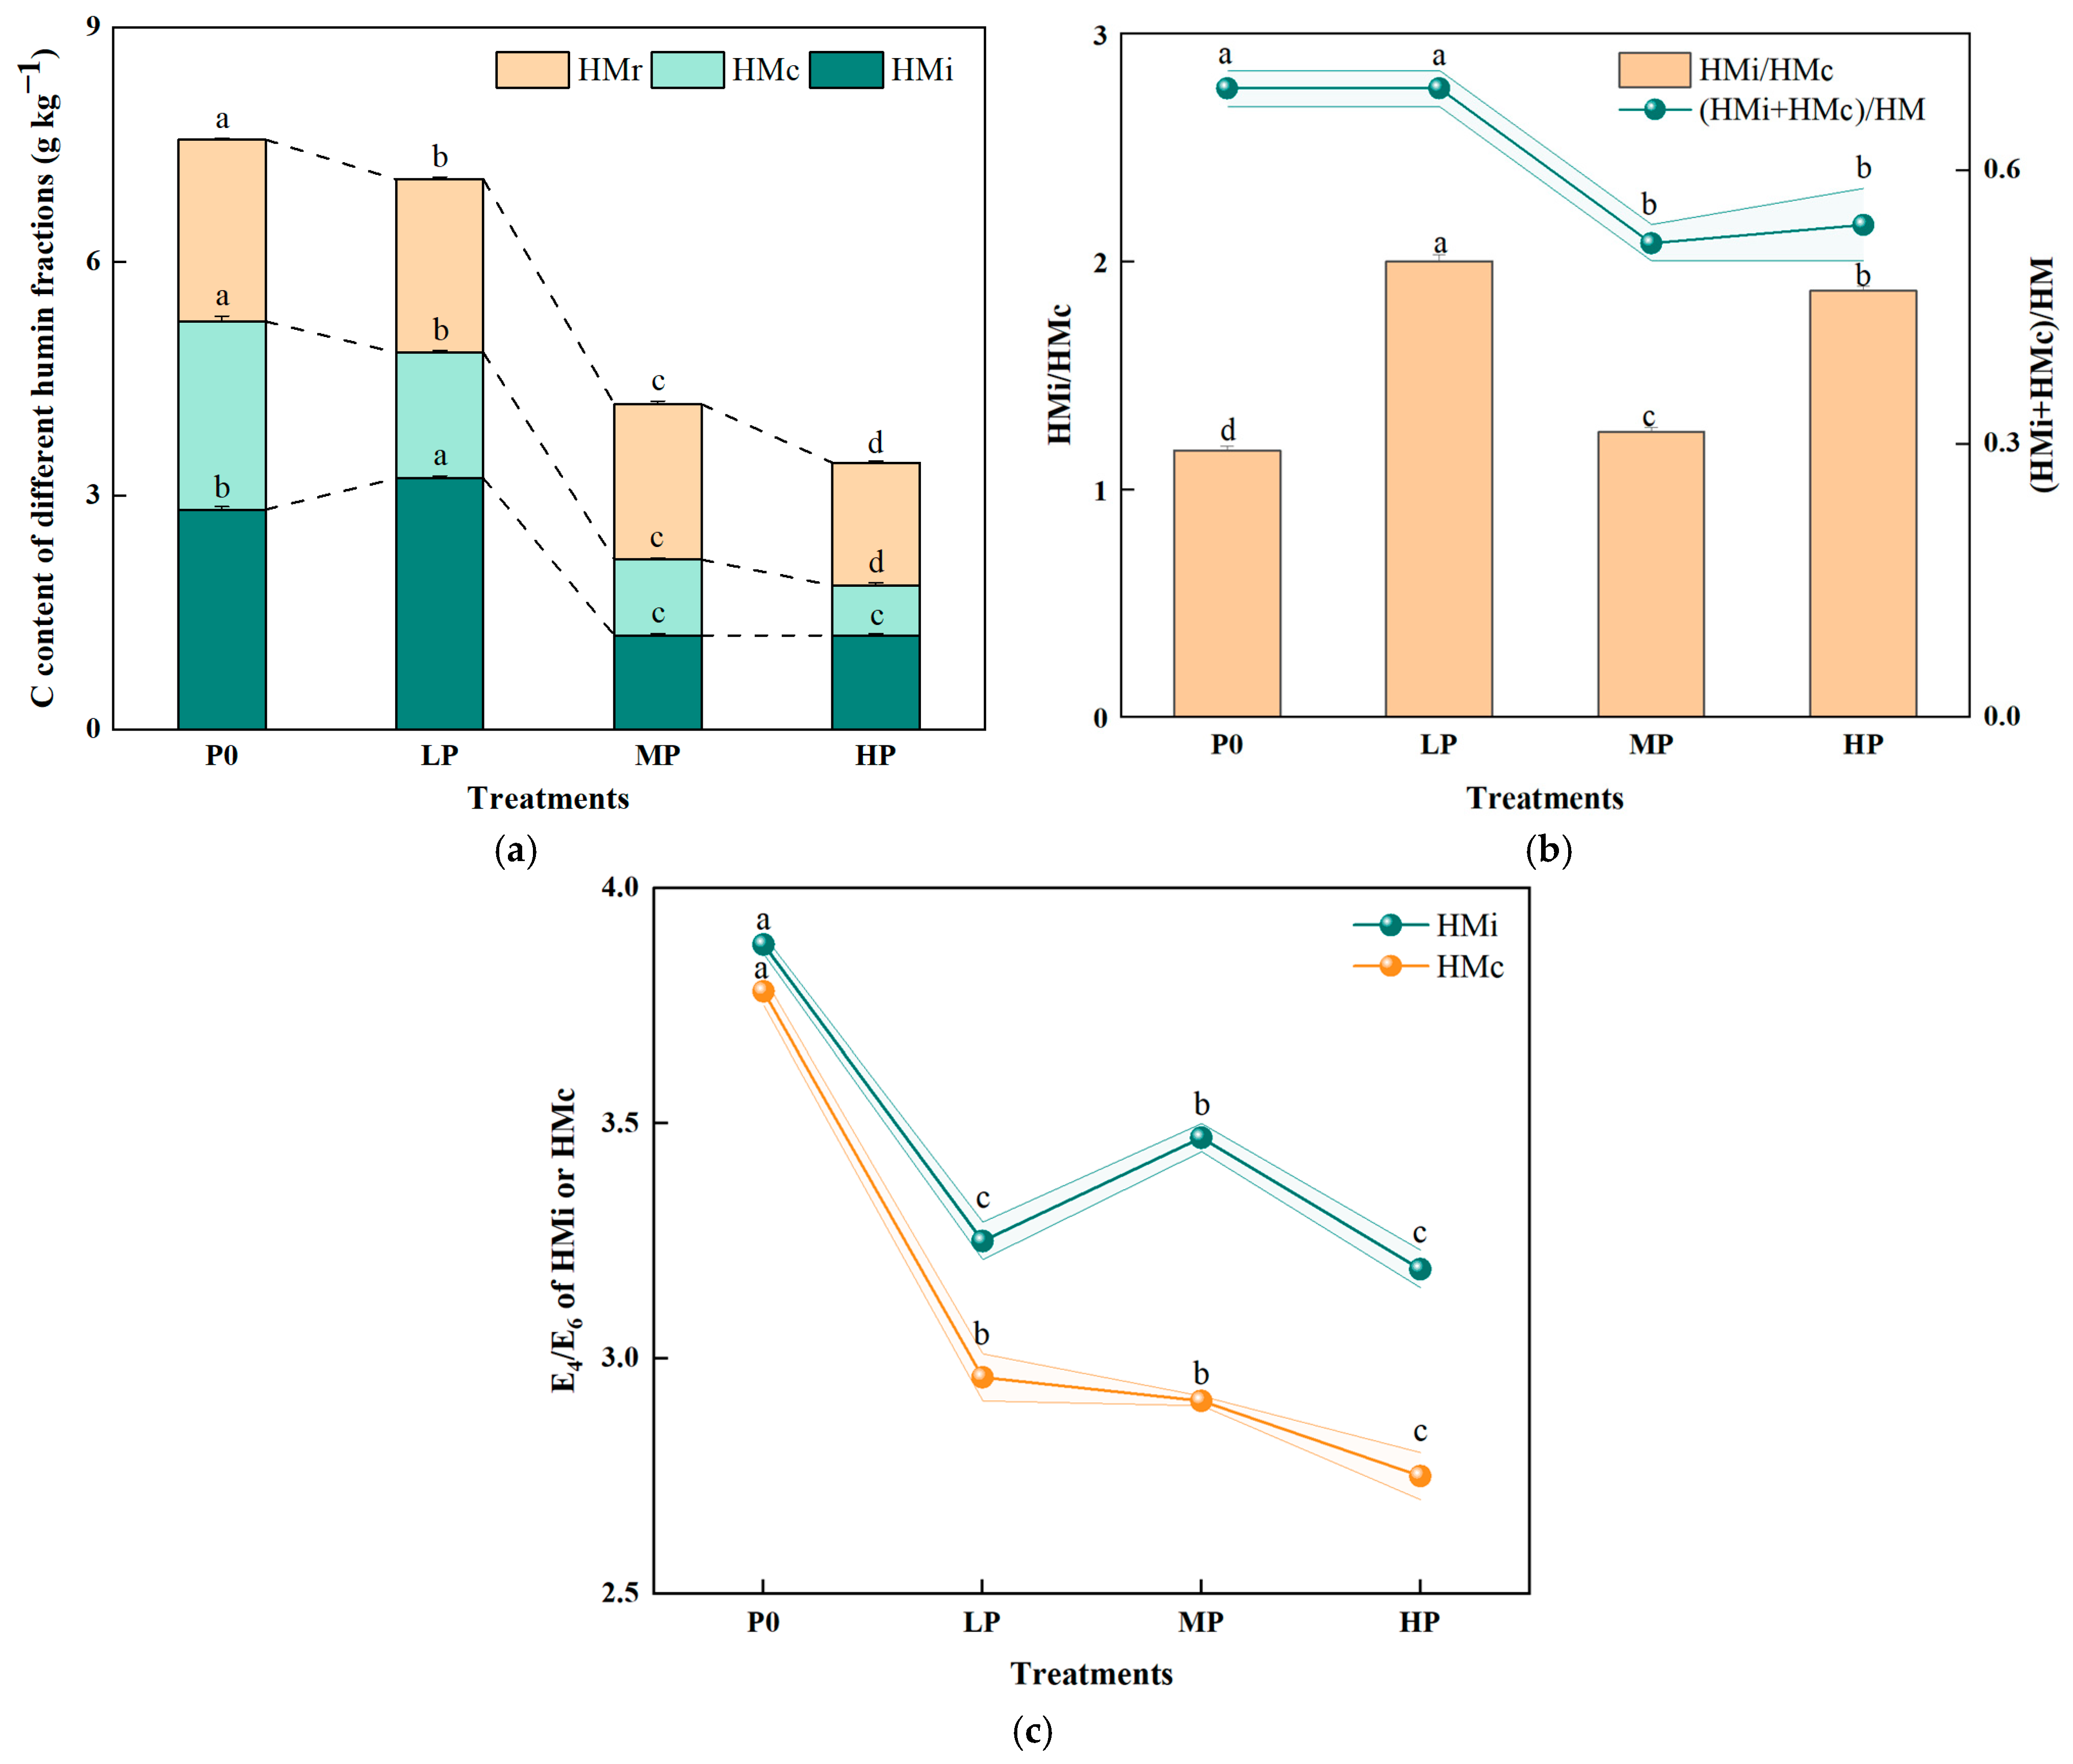
Fan et al. [20] reported that HMi, HMc, and HMr constitute the primary components of soil HM. The C contents of these fractions exhibited distinct responses to increasing P application rates (Figure 3a). CHMi initially increased significantly under low P input, reaching a maximum in the LP treatment (3.22 g kg−1, a 12.4% increase compared to P0), before declining sharply under higher P rates. At both MP and HP levels, CHMi decreased to 1.21 g kg−1, representing a substantial reduction from the peak. In contrast, CHMc showed a consistent and significant decline with increasing P application. The highest CHMc value was observed under P0, and each increment in P rate resulted in progressively lower CHMc, with statistically significant differences between adjacent treatments. Similarly, CHMr decreased monotonically as P application increased, although the rate of decline was less pronounced. The P0 treatment recorded the highest CHMr content, followed by a gradual and significant reduction across all P-amended treatments. The HMi/HMc ratio and (HMi+HMc)/HM (soluble HM ratio) are key indicators for characterizing the fractionation of soil HM [21]. The HMi/HMc ratio reflected the relative abundance of HMi versus HMc, and its variation in response to P application exhibited a non-monotonic trend, a sharp increase, followed by a significant decrease, and then a subsequent re-increase (Figure 3b). Compared with P0, LP treatment increased the HMi/HMc ratio by 70.9%, achieving the highest value. Further increasing P to MP led to a significant decline to 1.25. The (HMi+HMc)/HM ratio, which represents the proportion of soluble HM in total HM, exhibited a three-phase trend: initial stability, a marked decrease, and a slight recovery. This ratio remained unchanged between P0 and LP, indicating no significant effect at low P input. However, under MP, it decreased significantly by 24.6% to 0.520. At HP, a minor, non-significant increase occurred (0.54), which remained 21.7% lower than in P0 and LP. The E4/E6 ratio is an indicator of the molecular characteristics of HS, including molecular weight, degree of aromatic condensation, and oxygen content—lower values indicate higher molecular complexity and advanced humification [21]. The E4/E6 ratios of HMi and HMc responded differently to P fertilization (Figure 3c). For HMi, the ratio decreased under LP (3.25), slightly recovered under MP (3.47), and declined again under HP (3.19), with no significant difference between LP and HP. In contrast, the E4/E6 ratio of HMc decreased continuously and significantly with increasing P application, suggesting progressive enhancement of humification. The highest ratio was observed under P0, with LP and MP resulting in comparable reductions and HP further lowering the ratio to 2.75.

3.5. Atomic Molar Ratios and FTIR Spectra of HA

HA is primarily composed of four major elements: C, O, H, and N. These elemental compositions are used to calculate three key atomic molar ratios—H/C, O/C, and C/N—which serve as important indicators of the structural characteristics of HA, including its degree of aromatic condensation, content of oxygen-containing functional groups, and the relative distribution of C and N [22,23]. All three ratios exhibited distinct and statistically significant responses to graded P fertilization, as shown in Table 3. The H/C ratio is widely regarded as an indicator of the aromaticity and degree of condensation in HA; a lower value signifies a more condensed and aromatic C skeleton [22]. Across the P gradient, the H/C ratio followed a non-monotonic trend, initially decreasing and then increasing (Table 3). Specifically, the P0 treatment exhibited the highest H/C ratio (2.20), indicating the lowest degree of condensation and aromaticity. The LP treatment showed a slight reduction (2.06), though this difference was not statistically significant compared to P0. A marked decline occurred under the MP treatment, with the H/C ratio dropping to 1.72—a 21.8% decrease relative to P0—suggesting that moderate P application significantly enhanced the condensation and aromatic character of HA. In the HP treatment, the H/C ratio partially rebounded to 2.00. The O/C ratio reflects the abundance of oxygen-containing functional groups (e.g., carboxyl, hydroxyl (O–H), and carbonyl groups) in HA, with higher values indicating greater content of polar, oxygen-rich moieties [22]. With increasing P input, the O/C ratio remained low and stable initially, then peaked, followed by a slight decline. Both P0 and LP treatments exhibited the lowest O/C values, with no significant difference between them. The maximum O/C ratio was observed in the MP treatment, which was 14.3% higher than in P0. Under HP conditions, the O/C ratio decreased slightly to 0.850—significantly lower than in MP but still 10.4% higher than in P0. The C/N ratio provides insight into the relative proportions of C and N within the HA structure. A lower C/N ratio indicates greater N enrichment in stable, N-containing structural units such as pyrrole and pyridine rings [23]. With increasing P application, the C/N ratio displayed a biphasic response; an initial decrease followed by an increase. The LP treatment yielded the lowest C/N ratio (7.44), which was significantly lower than those observed in the P0 (8.32), MP (8.70), and HP (9.13) treatments.
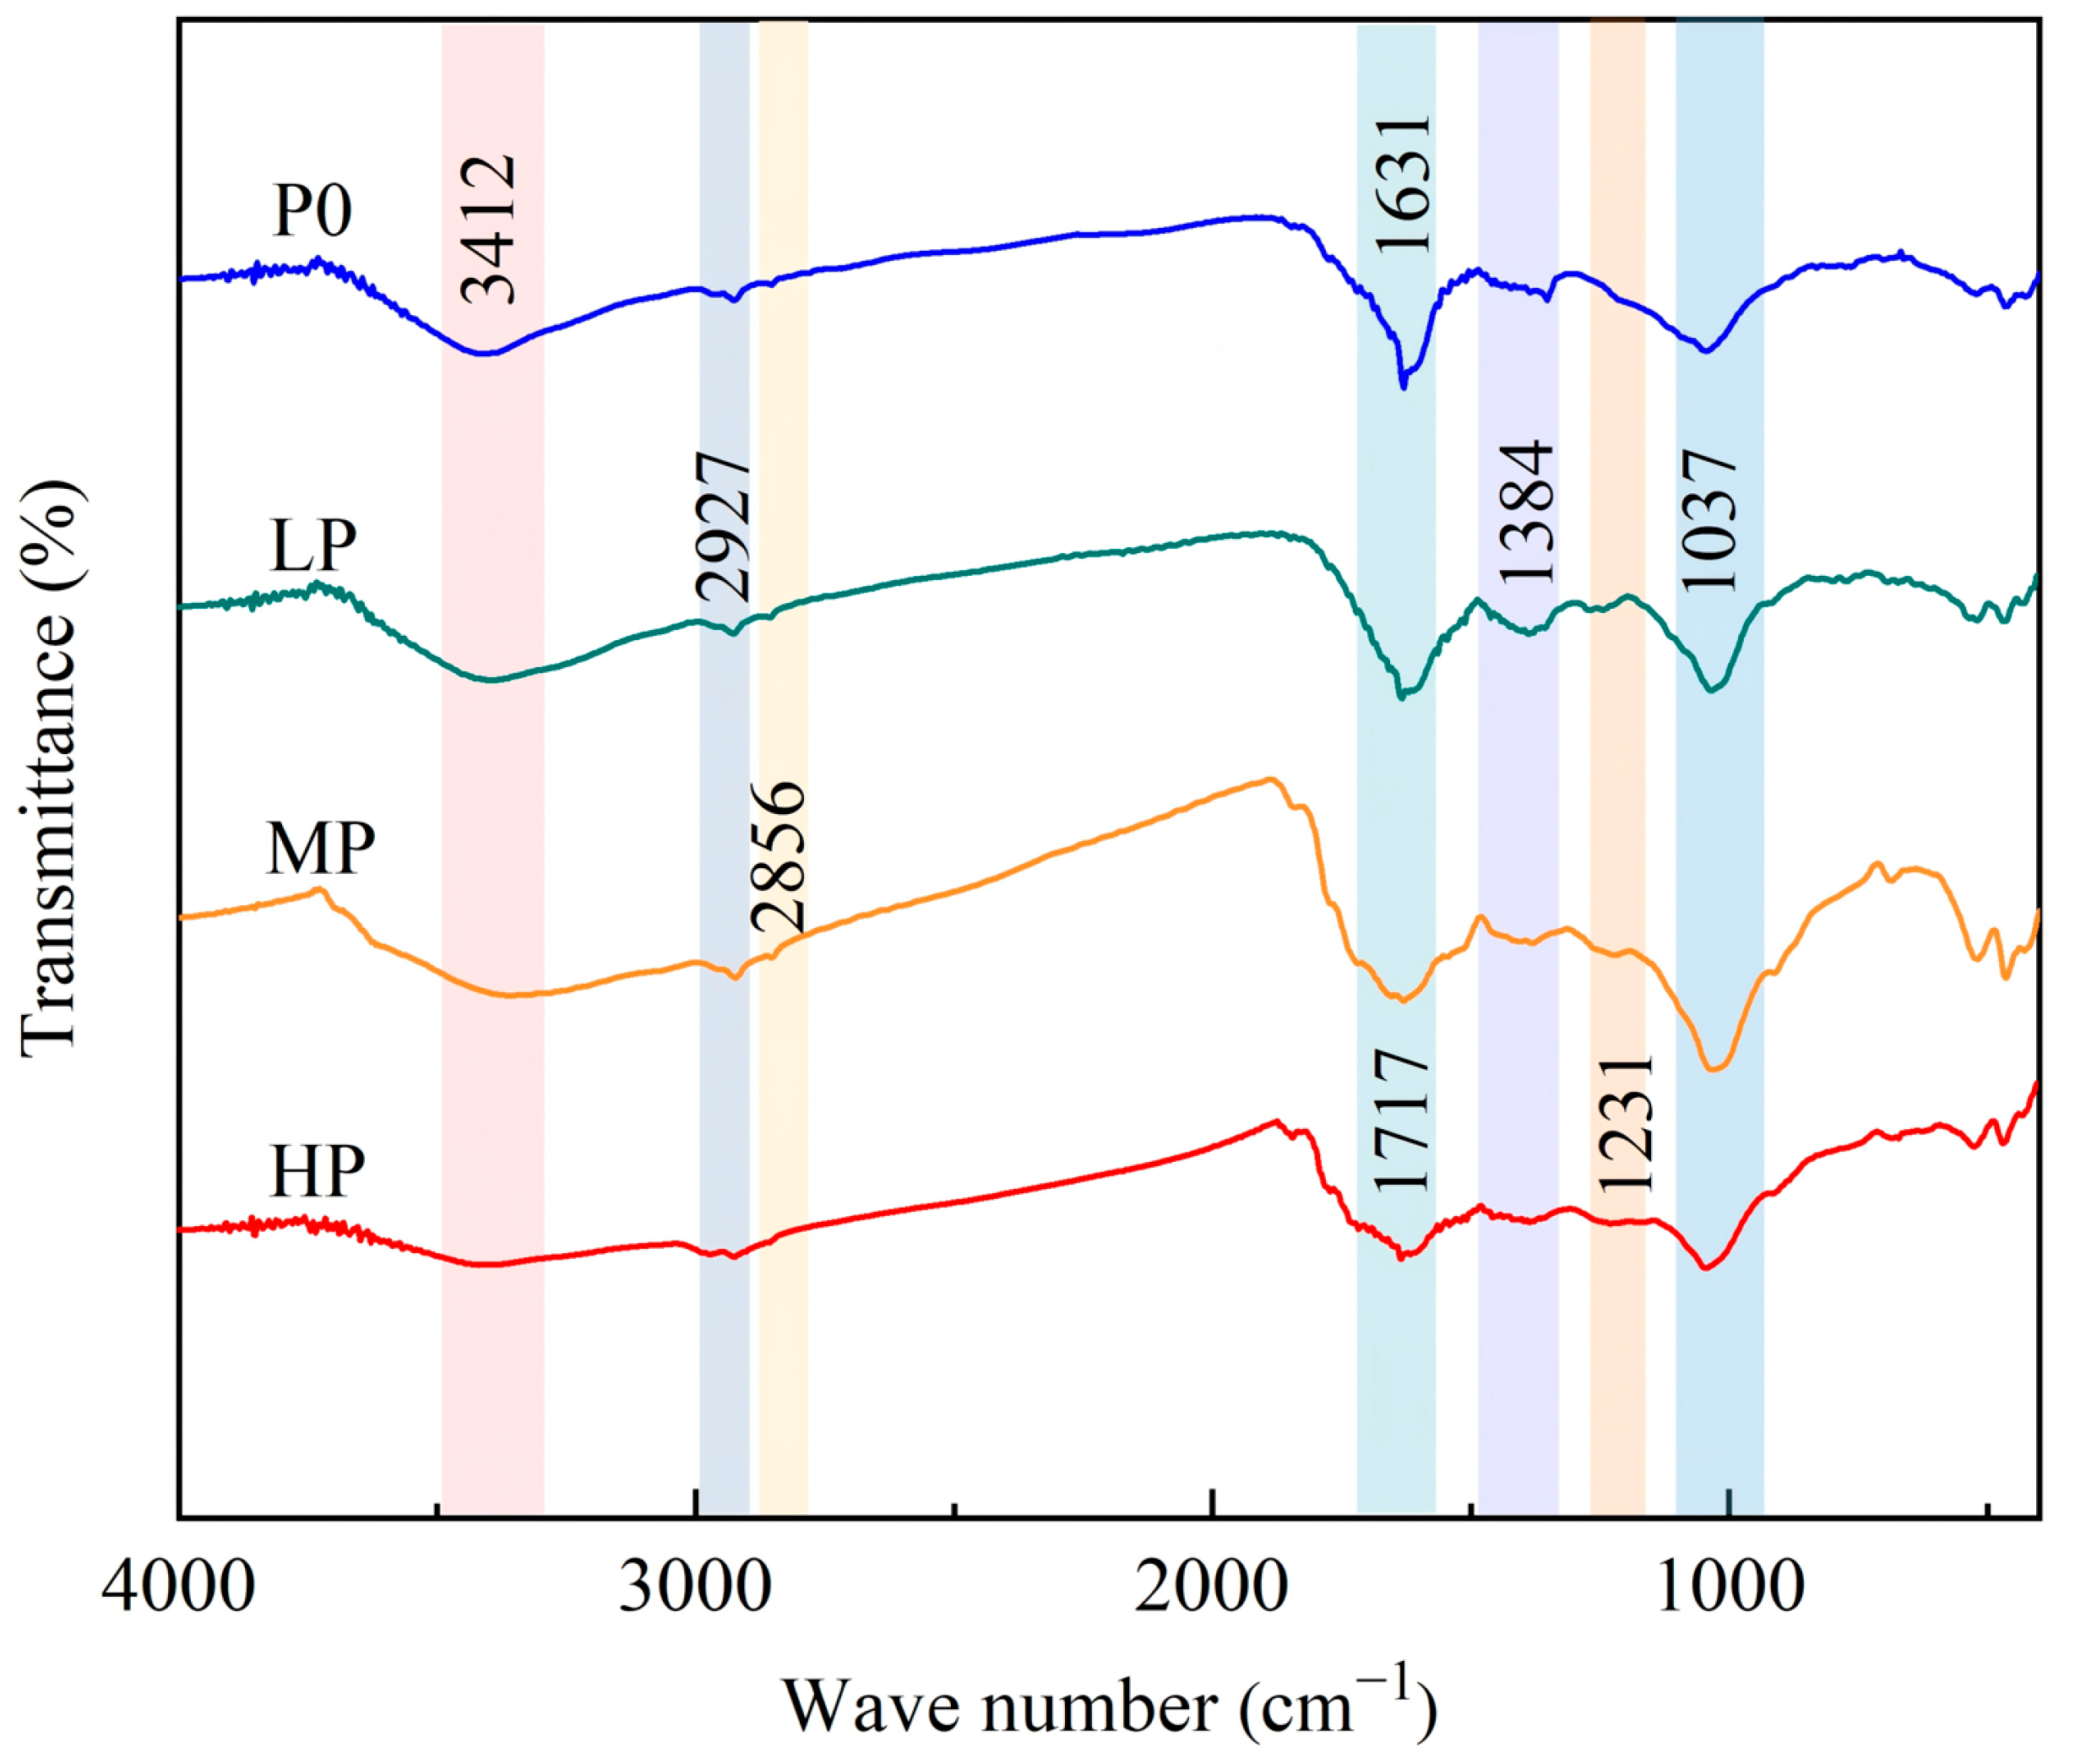
The FTIR spectra for the four P treatments are displayed in Figure 4 and semi-quantitative peak areas are summarized in Table 4. Distinct variations in absorption intensities were observed at characteristic functional group regions of HA. The primary spectral features and their corresponding vibrational assignments (based on Li et al. [24], Akbarbaglu et al. [25], and Abd El-Rahim et al. [22]) were as follows: A broad absorption band in the range of 3367–3412 cm−1 is attributed to O–H stretching vibrations in carboxylic acids, phenols, alcohols, and carbohydrates. As shown in Table 4, the relative intensity of this band was 29.0 in the P0 treatment. Compared to P0, the LP treatment significantly reduced the intensity by 19.7%, whereas both MP and HP treatments significantly increased it by 28.6% and 28.3%, respectively. Two distinct peaks at 2923–2927 cm−1 (labeled “a”) and 2856–2859 cm−1 (labeled “b”), correspond to C–H stretching vibrations in aliphatic structures (–CH2 and –CH3). For peak “a”, the intensity followed the order: LP (7.6) > P0 (6.40) > HP (5.60) > MP (5.10). Specifically, LP significantly increased the intensity by 18.8% relative to P0, while MP caused a significant decrease of 20.3%. For peak “b”, the highest intensity was observed in HP (3.00), followed by MP (2.90), P0 (2.10), and LP (1.50). Both MP and HP significantly enhanced the intensity by 38.1% and 42.9%, respectively, compared to P0, whereas LP significantly reduced it by 28.6%. The absorption peak at 1717–1720 cm−1 (labeled as “c”) arises from C=O stretching vibrations in carboxyl, aldehyde, and ester groups. The peak at 1631–1638 cm−1 (labeled as “d”) corresponds to C=C stretching in aromatic/olefinic compounds and C=O vibrations in amides (I), ketones, and quinones. For peak “c”, the intensity decreased progressively with increasing P rate: P0 (5.00) > LP (4.70) > MP (3.40) > HP (1.40). Relative to P0, HP induced the most substantial reduction (72.0%), followed by MP (32.0%), while LP showed a non-significant decrease (6.00%). In contrast, the intensity of peak “d” increased with P application: P0 (15.2) < LP (16.4) < MP (17.5) < HP (18.2). MP and HP significantly increased the intensity by 15.1% and 19.7%, respectively, compared to P0, while LP exhibited a non-significant increase (7.90%). The region 1358–1388 cm−1 is associated with C–O stretching or O–H bending vibrations of carboxyl and phenolic groups. The highest intensity was recorded in LP (11.3), followed by HP (10.8), P0 (9.30), and MP (9.00). LP significantly increased the intensity by 21.5% relative to P0, whereas MP and HP did not differ significantly from P0. The peak at 1205–1242 cm−1, assigned to C–O stretching and O–H deformation in carboxyl groups, reached its maximum in LP (11.4), which was significantly higher than in P0 (6.70, increased by 70.1%), MP (6.4, increased by 78.1%), and HP (4.30, increased by 165.1%). No significant differences were observed between P0 and MP, but both were significantly higher than HP. The region 1033–1045 cm−1 corresponds to C–O vibrations in polysaccharides. Intensity decreased with increasing P application: P0 (26.2) > LP (23.7) > HP (19.4) > MP (18.3). MP and HP significantly reduced the intensity by 30.2% and 26.0%, respectively, relative to P0, while LP showed a non-significant decrease. Previous studies have demonstrated that calculating ratios of specific peak intensities could yield more insightful information than spectral analysis alone [26]. The (a + b)/c ratio reflects the relative abundance of non-polar aliphatic moieties versus polar functional groups (e.g., carboxylic and carbonyl groups) in HA. The (a + b)/d ratio is a well-established indicator of the dominance of aliphatic over aromatic C structures in HA’s molecular framework. The (a + b)/c ratio increased markedly from 1.70 (P0) to 6.14 (HP). In contrast, the (a + b)/d ratio remained relatively stable, ranging from 0.46 to 0.56.

3.6. Thermal Stability of HA Assessed by DTA Analysis

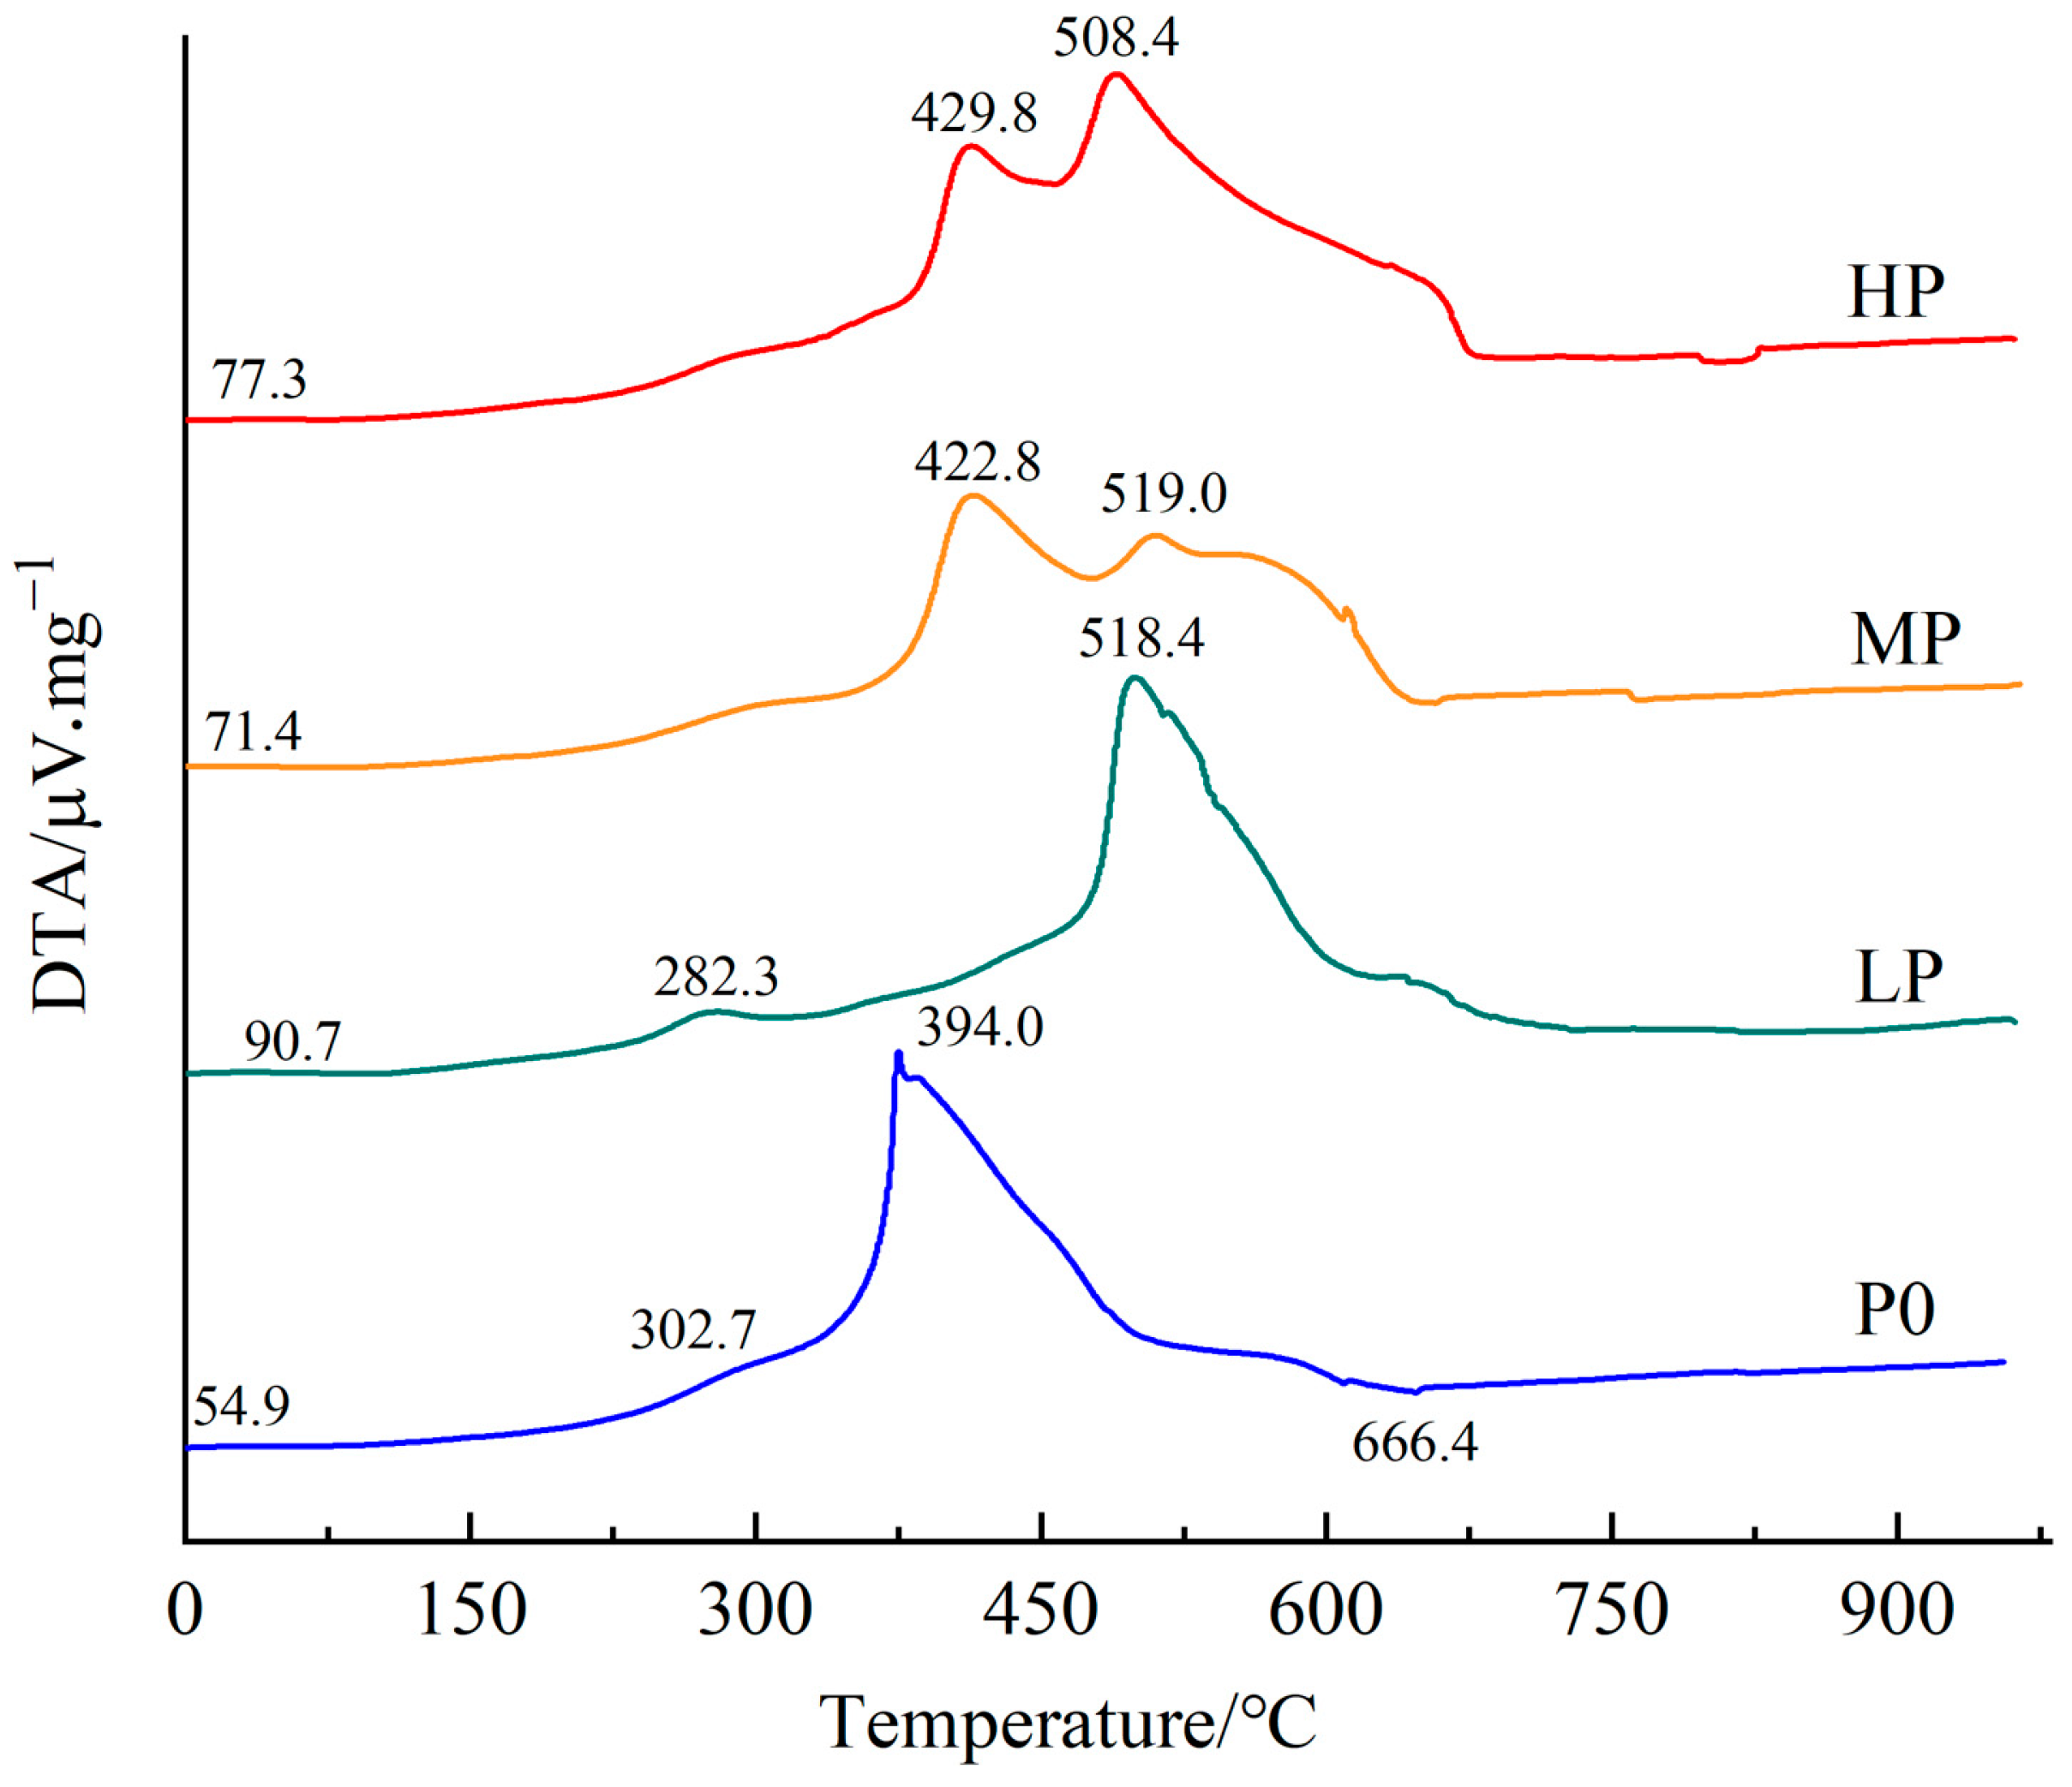
DTA, a technique that measures temperature differences between a sample and an inert reference material under controlled heating conditions, is employed to characterize the thermal transitions of HA. The DTA curves are presented in Figure 5, while semi-quantitative data on endothermic and exothermic heat release, as well as weight loss across distinct temperature intervals, are compiled in Table 5. During pyrolysis, all soil HA samples exhibited three characteristic thermal stages consistent with the typical thermal behavior of HS: low-temperature endothermic reactions (below 110 °C), mid-temperature exothermic reactions (301.52–338.14 °C), and high-temperature exothermic reactions (430.31–500.90 °C) [27,28]. In the low-temperature endothermic stage, the magnitude of endothermic heat varied significantly with P application rate. The HP treatment exhibited the highest endothermic heat (11.2 mJ mg−1), which was 3.90-fold greater than that of the P0 treatment (2.90 mJ mg−1), whereas the MP treatment showed the lowest value (2.69 mJ mg−1), marginally lower than P0 (Table 5). In the mid-temperature exothermic stage, the exothermic heat followed a clear descending order: MP (16.0 mJ mg−1) > LP (13.9 mJ mg−1) > P0 (7.87 mJ mg−1) > HP (4.88 mJ mg−1) (Table 5). The peak exothermic temperature under MP treatment was slightly lower than those under P0 and LP treatments, yet its exothermic intensity was twice that of P0. In the high-temperature exothermic stage, the MP treatment again yielded the highest exothermic heat (19.1 mJ mg−1), which was 3.1-fold higher than P0 (6.05 mJ mg−1). The HP treatment displayed an intermediate value (8.64 mJ mg−1), while the LP treatment exhibited a relatively low value (13.3 mJ mg−1, Table 5). Notably, the peak high-temperature exothermic temperature of HA under the HP treatment was higher than those under P0 and MP treatments, suggesting that elevated P application enhances the thermal stability of aromatic structures in HA. Semi-quantitative data on heat release and weight loss across temperature intervals revealed a consistent temperature-dependent pattern; gradual weight loss below 400 °C, followed by a sharp decrease above 400 °C—consistent with the onset of the high-temperature exothermic stage (Figure 5). However, the extent of weight loss varied among P treatments. In the mid-temperature interval, the LP treatment exhibited the greatest weight loss (5.35 mg), which was double that of P0 (2.66 mg), whereas the HP treatment showed the lowest (3.50 mg). In the high-temperature interval, the HP treatment resulted in a weight loss of 5.56 mg, slightly less than P0 (6.05 mg) but 2.60-fold greater than LP (2.16 mg). In the low-temperature interval, the LP treatment also showed the highest weight loss (2.47 mg), nearly 10-fold that of P0 (0.250 mg), while the MP treatment had the lowest (0.170 mg, Table 5). The semi-quantitative results presented in Table 5 further underscore key treatment effects. Relative to the P0 treatment, the MP treatment significantly enhanced exothermic heat release during both the mid-temperature and high-temperature stages. In contrast, the HP treatment increased low-temperature endothermic heat by 286.2% and maintained moderate weight loss at high temperatures. Conversely, the LP treatment promoted weight loss and exothermic heat generation in the mid-temperature range but suppressed high-temperature weight loss. These observations aligned with interpretations proposed by Abd El-Rahim et al. regarding H/M ratios [22]. The H/M ratios derived from DTA and TGA represented two distinct yet interrelated metrics; specifically, the “High Exothermic Heat/Medium Exothermic Heat” ratio and the “High Weight Loss/Medium Weight Loss” ratio, respectively. Although these ratios reflected a common underlying physical principle, they differed in dimensional characteristics due to the nature of the measured variables. The H/M ratio of exothermic heat reflected the “proportion of heat released across different temperature intervals” and was directly associated with the relative abundance of aromatic versus aliphatic structural components in HA [22]. In contrast, the H/M ratio of weight loss indicated the “proportion of mass decomposed and volatilized within specific temperature ranges,” which was indirectly related to the distribution of refractory (aromatic) and labile (aliphatic) constituents in HA. A higher value of this ratio suggested a greater proportion of thermally stable, aromatic-rich components that decomposed predominantly at elevated temperatures, thereby indicating a more recalcitrant and structurally stable HA fraction. As shown in Table 5, both H/M ratios—derived from DTA and weight loss data—exhibited consistent increasing trends with rising P application rates.

3.7. PCA and Pearson Correlation Analysis of Key Parameters in Albic Soil-Maize Fields Under Different P Application Rates

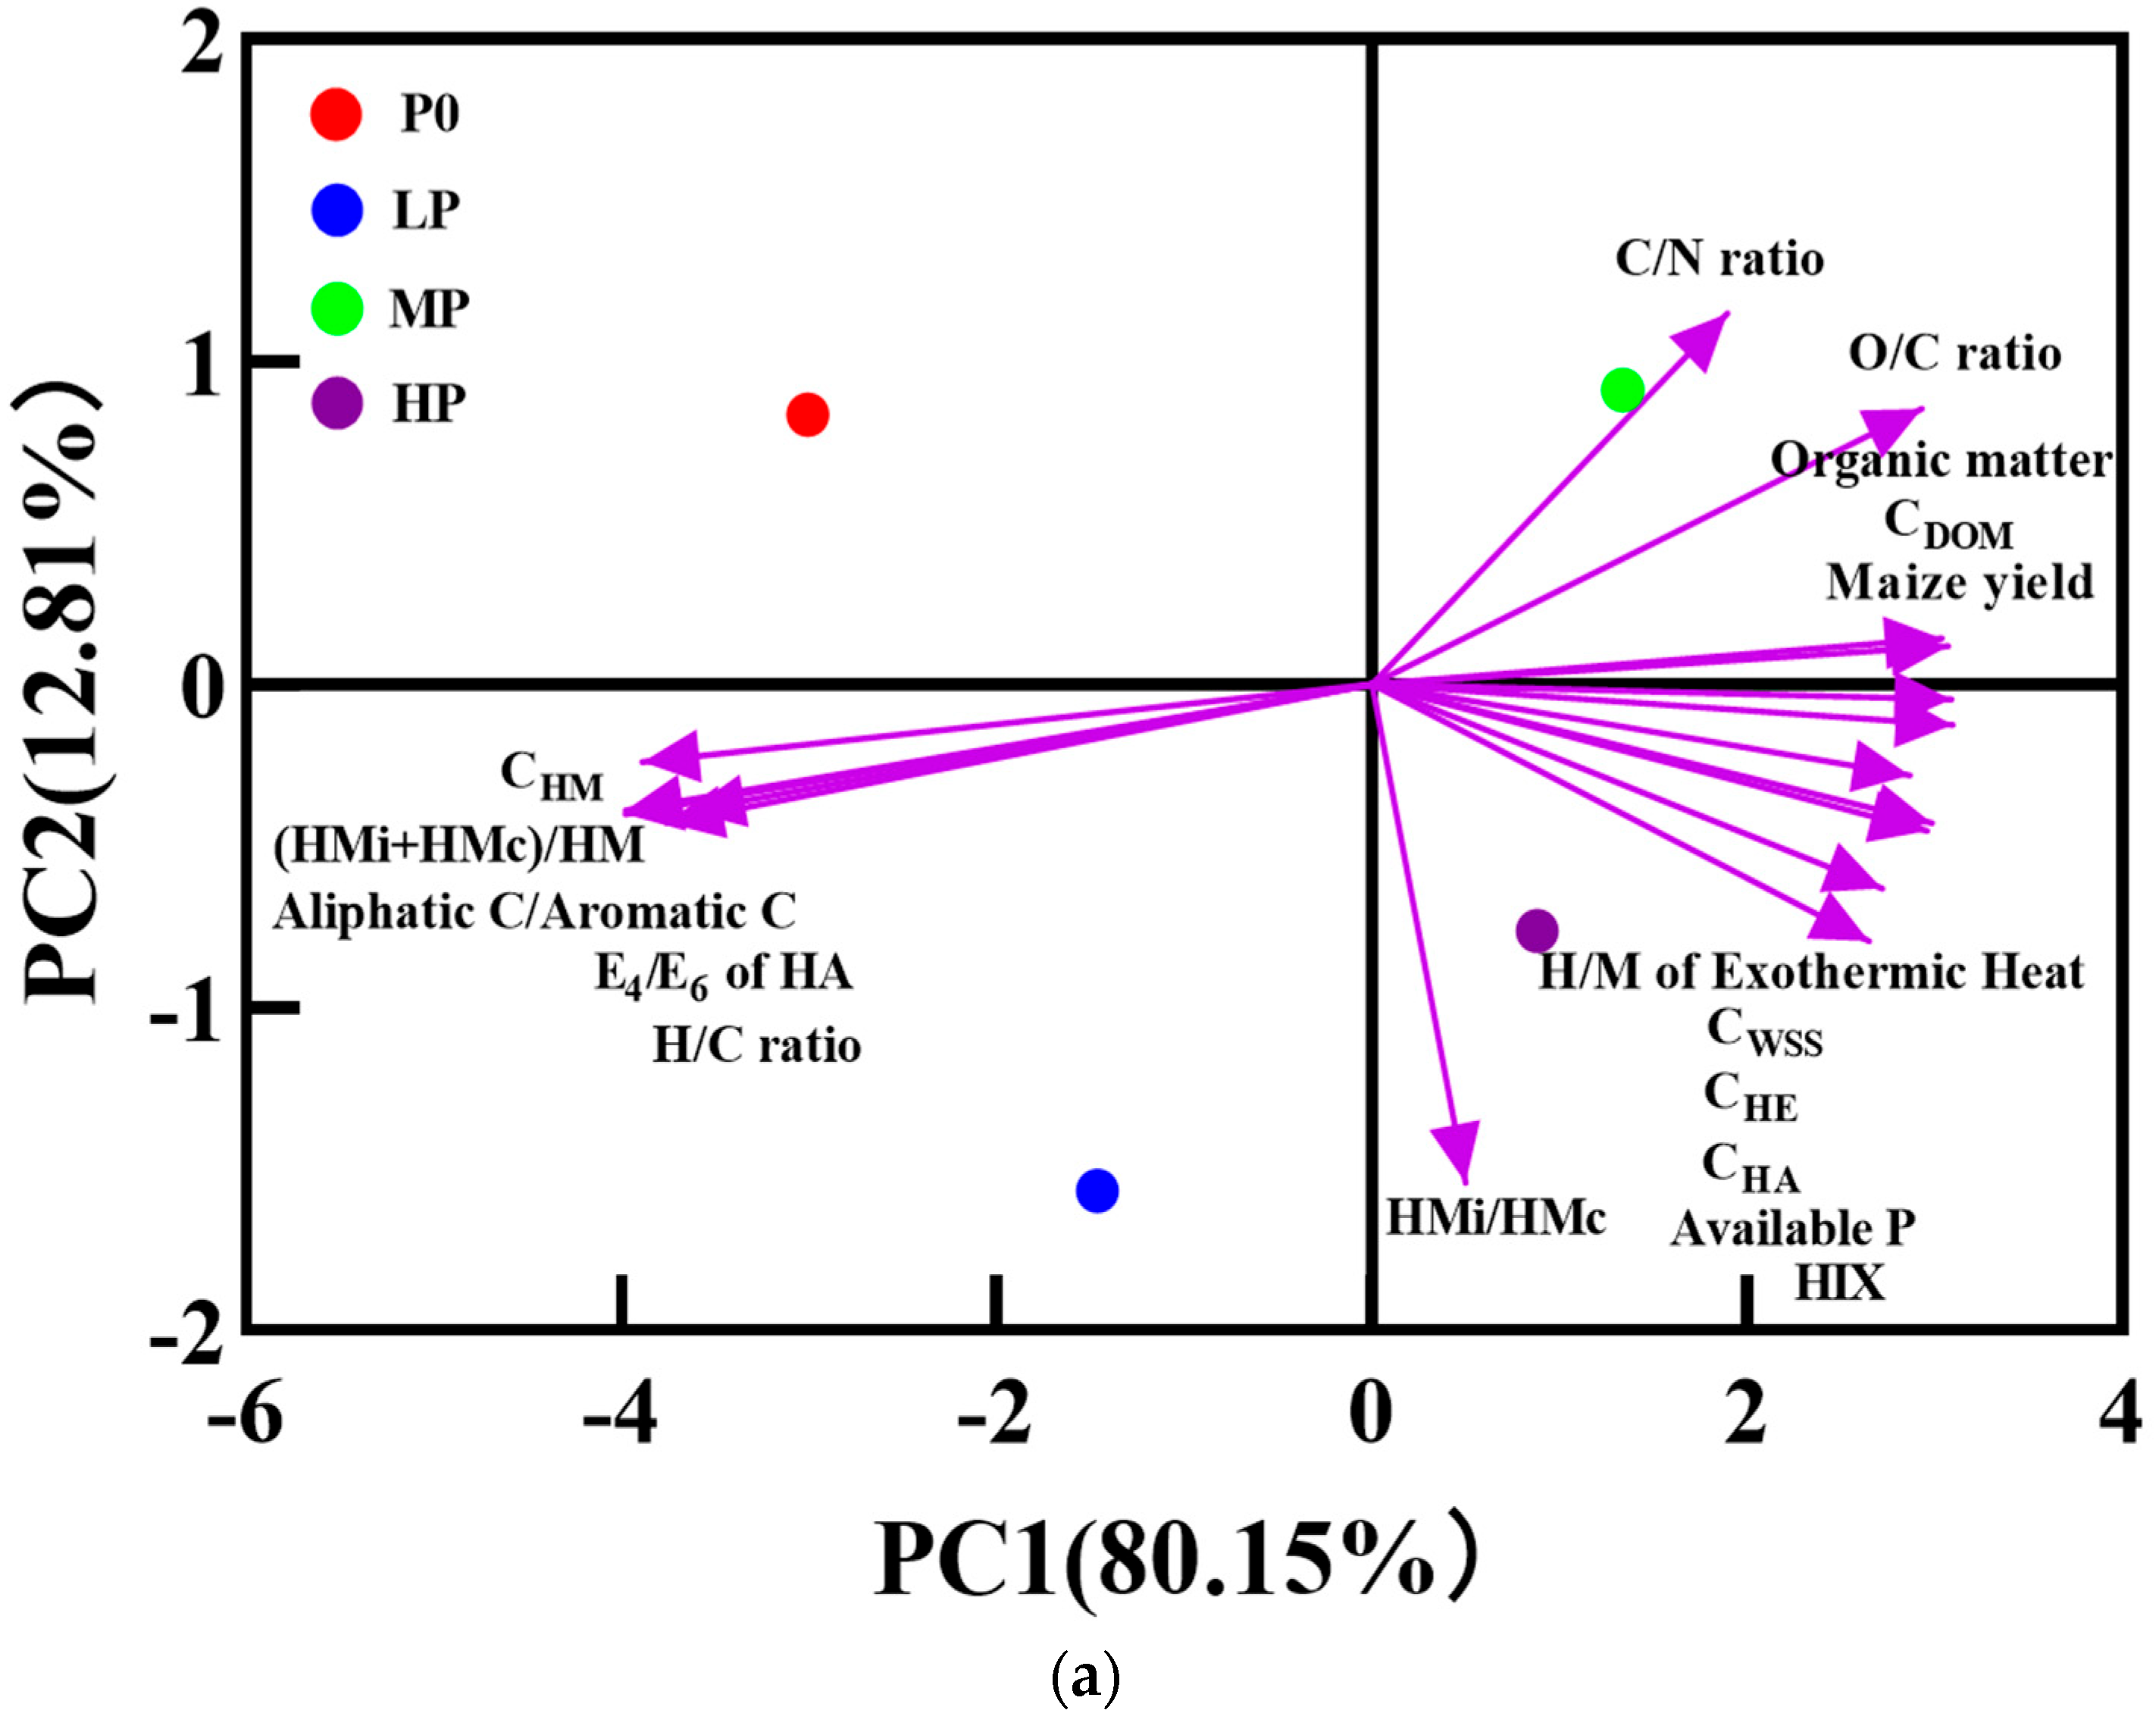
PCA of soil HS fractions and nutrient dynamics under gradient P treatments revealed that the first three principal components (PC1: 80.15%, PC2: 12.81%, and PC3: 7.04%) collectively accounted for 100% of the total variance (Table S1). As detailed in Table S2, the primary patterns of variation were as follows: PC1 was dominated by strong positive loadings from available P (loading = 0.876), SOM (0.978), maize yield (0.995), CDOM (0.989), HIX (0.853), CWSS (0.923), CHA (0.953), CHE (0.961), O/C ratio (0.944), and H/M ratio of exothermic heat (0.997). In contrast, PC1 showed strong negative loadings for CHM (−0.930), E4/E6 ratio of alkali-extracted HA (−0.899), H/C ratio (−0.871), (HMi+HMc)/HM ratio (−0.951), and aliphatic C/aromatic C ratio (−0.951). PC2 primarily reflected differentiation driven by the HMi/HMc ratio, exhibiting strong negative loading (−0.984), along with weak positive contributions from C/N ratio (0.437) and O/C ratio (0.325). PC3 captured structural aspects of SOM, characterized by positive loadings for C/N ratio (0.661), H/C ratio (0.422), and E4/E6 ratio of alkali-extracted HA (0.343), and minor negative loadings for (HMi+HMc)/HM ratio (−0.173) and aliphatic C/aromatic C ratio (−0.184). Based on composite PCA scores (Table S3), the treatments were ranked as follows: MP > HP > P0 > LP. PC1 predominantly represented soil humification efficiency and nutrient supply capacity, evidenced by its strong positive associations with SOM (0.978) and maize yield (0.995). PC2 reflected mineral–organic interaction and fractionation processes, largely governed by the HMi/HMc ratio (−0.984), whereas PC3 highlighted structural differentiation of SOM, particularly linked to variations in C/N ratio (0.661). Among all treatments, MP demonstrated superior performance, achieving the highest composite score of 3.845 (Table S3).
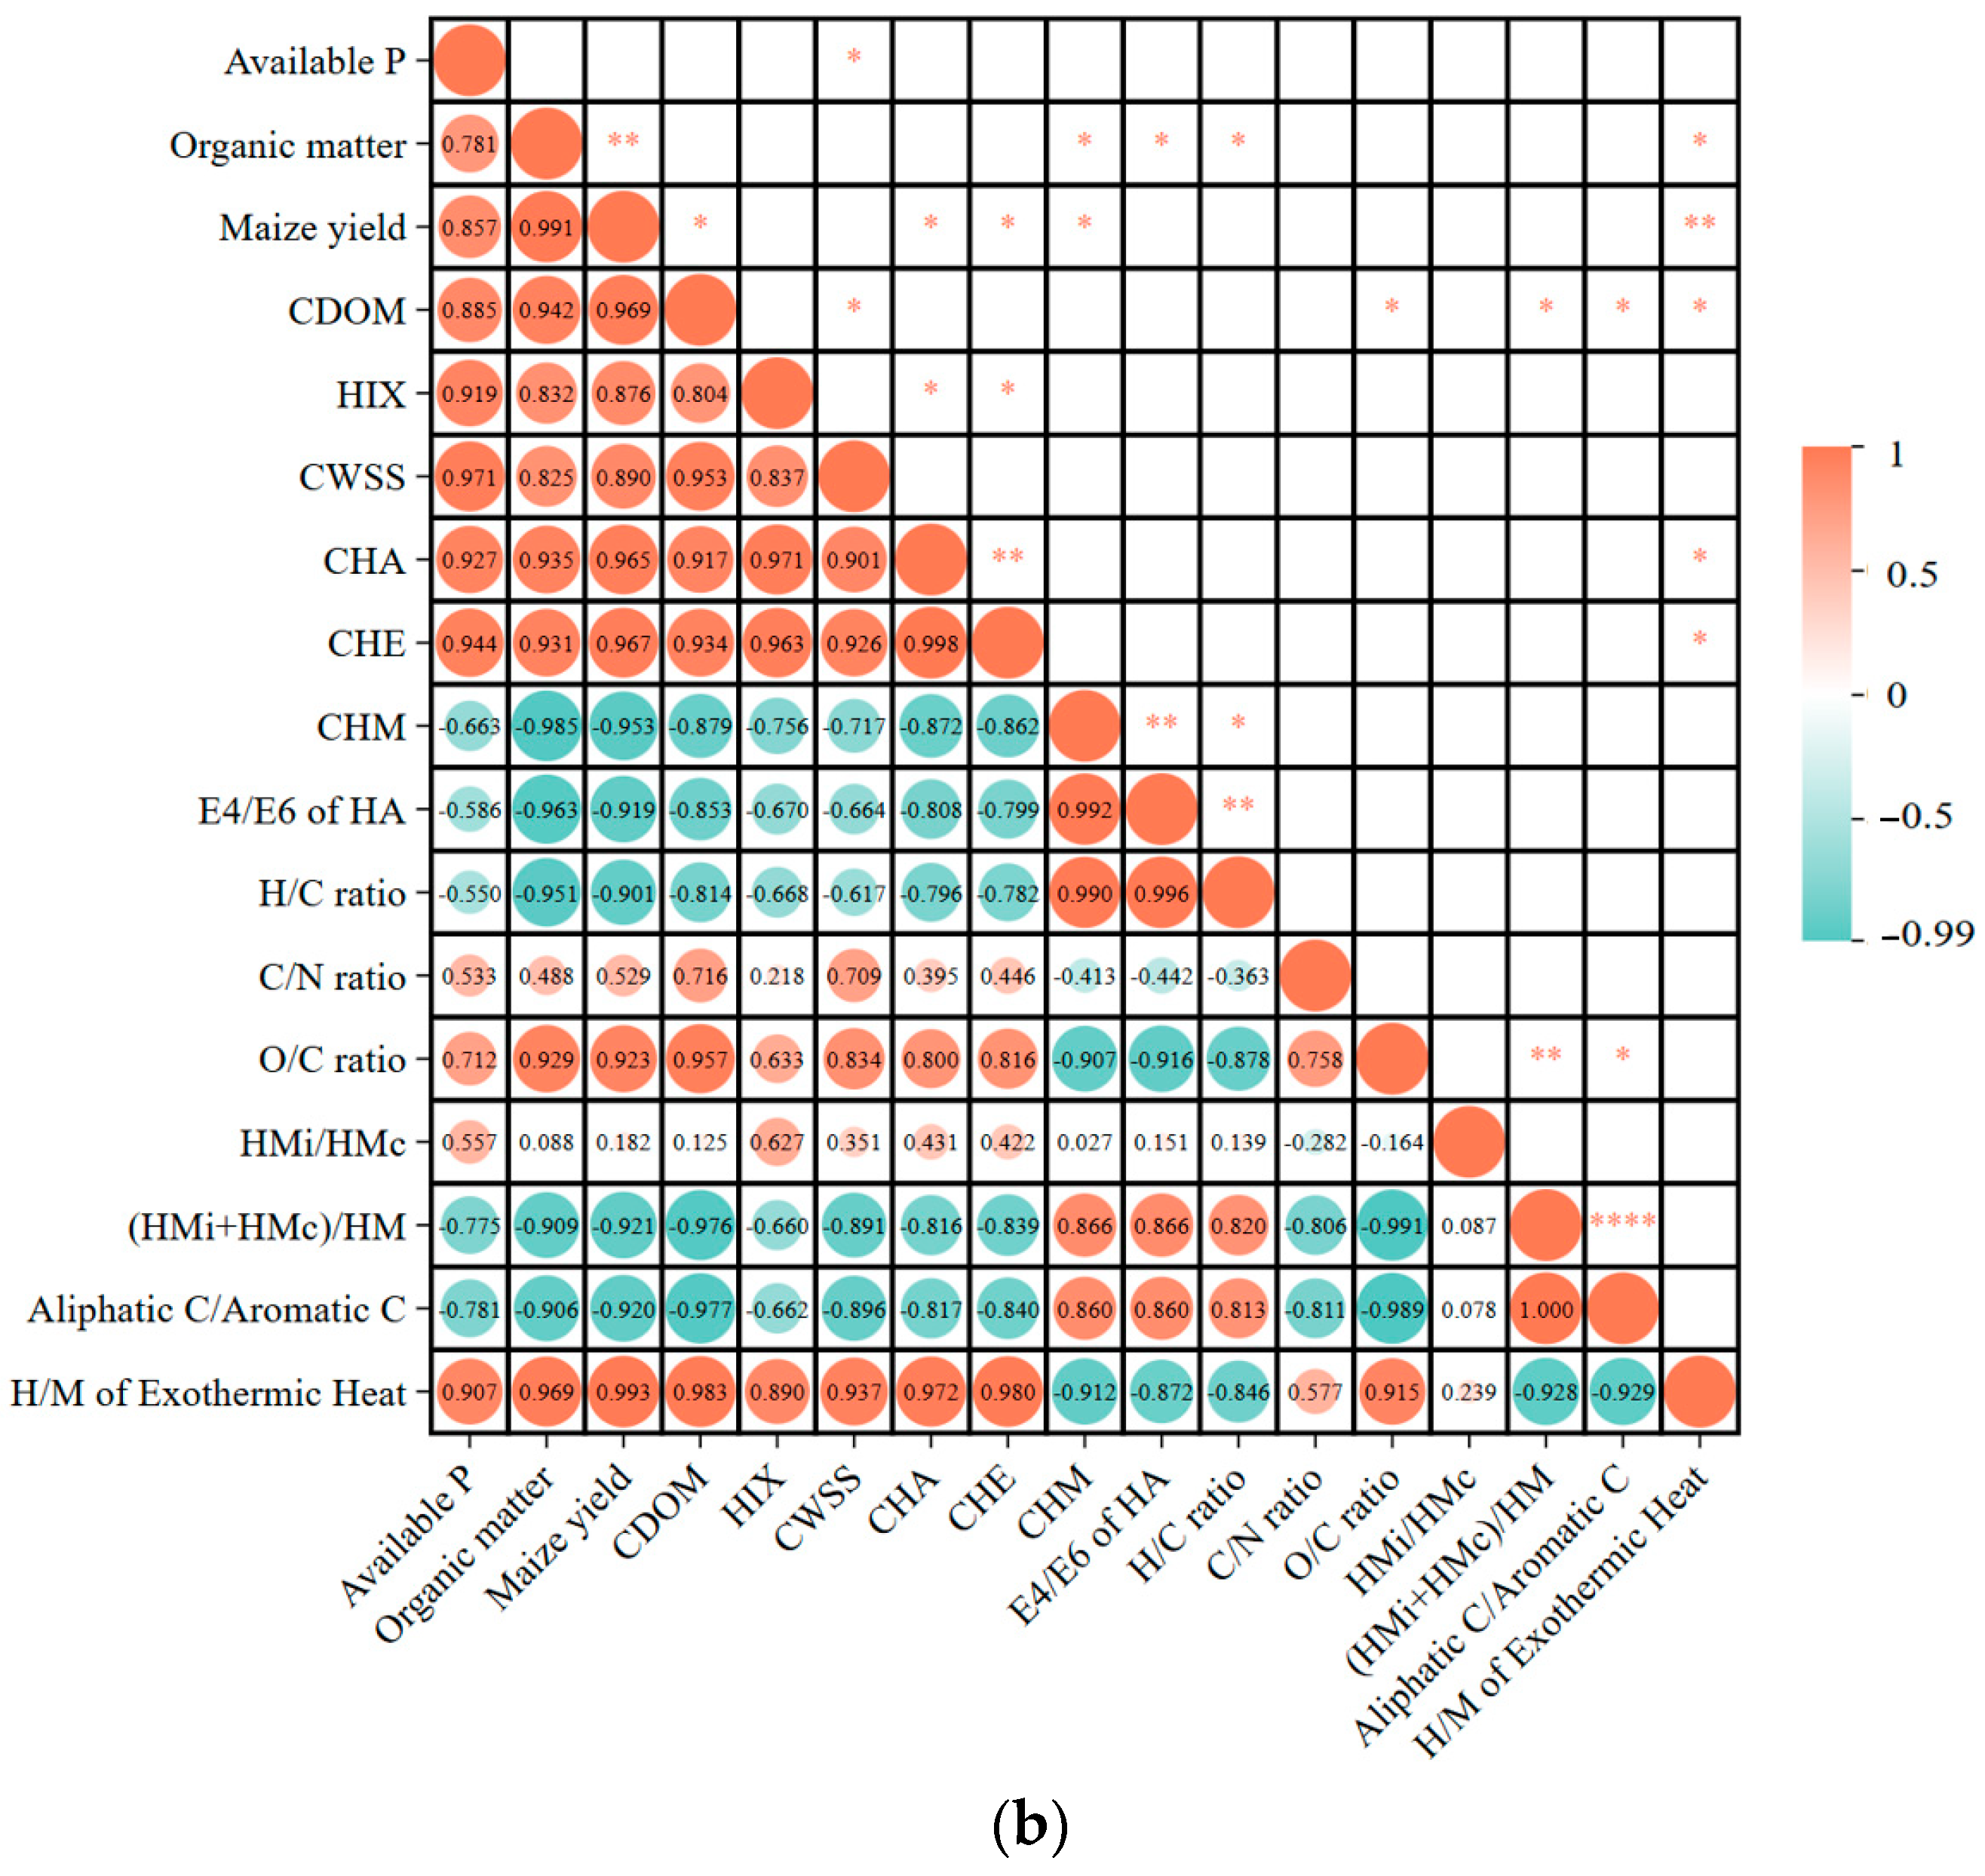
A Pearson correlation heatmap was constructed to examine the interrelationships among 17 key parameters, including maize yield, soil nutrients, HS fractions, and structural indices of HA (Figure 6b). The analysis revealed distinct clustering patterns and a full range of correlation coefficients (−1 to 1) consistent with data from three consecutive years of field trials. Notably, maize yield demonstrated extremely significant positive correlations with SOM (r = 0.991), CDOM (r = 0.969), and Olsen-P (r = 0.857). The MP treatment achieved the highest maize yield and SOM content, aligning with the results summarized in Table 2. CDOM exhibited strong positive correlations with HIX (r = 0.804) and CHA content (r = 0.917). Relative to the P0 treatment, the MP treatment increased CDOM content by 29.6% and HIX by 136%, indicating efficient transformation of labile DOM into stable HS (Table 1; Figure 1). CHA showed a significant negative correlation with the E4/E6 ratio of HA (r = −0.808), confirming that the MP treatment promoted aromatic condensation in HA. The H/C ratio, an indicator of HA aliphaticity, was negatively correlated with CHA (r = −0.796) and HIX (r =−0.668), while showing a strong positive correlation with the E4/E6 ratio (r = 0.996). CWSS was positively correlated with CHA (r = 0.926) and maize yield (r = 0.890). The CWSS content under the MP treatment (0.66 g kg−1) was 94.1% higher than under the P0 treatment, further supporting the efficient conversion of labile C into stable HA (Figure 2a). The HMi/HMc ratio displayed weak positive correlations with SOM (r = 0.088) and maize yield (r = 0.182). In the HP treatment, the HMi/HMc ratio (1.87) was 60% higher than in the P0 treatment, accompanied by a 73.4% reduction in CHMc (Figure 3a,b), suggesting limited humification efficiency. The aliphatic C/aromatic C ratio was negatively correlated with HIX (r = −0.662) and CHA (r = −0.817). Enhanced aliphatic C–H absorption under the HP treatment indicates the accumulation of labile C (Table 4). All parameters that were positively correlated with yield (maize yield, SOM, CDOM, and CHA) showed strong positive loadings on the first principal component (PC1), which accounted for 80.15% of the total variance in the PCA. In contrast, parameters negatively correlated with yield (E4/E6, H/C, and HMi/HMc ratio) exhibited negative loadings on PC1. The MP treatment had the highest PC1 score (3.845; Figure 6a), consistent with its superior ranking on the correlation heatmap. Additionally, the exothermic H/M ratio was strongly positively correlated with CHA (r = 0.972) and weakly positively correlated with the HMi/HMc ratio (r = 0.239). The exothermic H/M ratio in the MP treatment (1.19) was 54.5% higher than in the P0 treatment, confirming the enhanced thermal stability of HA (Table 5).

4. Discussion

4.1. Effects of Different P Application Rates on Soil Nutrient Properties and Maize Yield

The three-year in situ experiment revealed that P management in maize-cultivated Albic soils exerted cascading effects on nutrient dynamics, SOM stabilization, and crop productivity through dose-dependent biochemical mechanisms. A linear increase in available P concentrations highlighted the direct contribution of P inputs to enhanced P bioavailability [29]. Notably, this improvement was accompanied by progressive soil acidification, as indicated by a significant decline in soil pH. The reduction in pH likely promoted the dissolution of reducible Fe–Mn oxides, a process previously demonstrated by Zhang et al. [30], thereby enhancing P mobilization, which aligned with the observed trends in soil acidification and available P accumulation in this study. Under the HP treatment, intensified soil acidification elevated concentrations of Al3+ and H+, leading to cationic antagonism with exchangeable K+. This competitive interaction displaced K+ from colloidal binding sites, resulting in either leaching losses or transformation into less available forms [31]. In contrast, alkali-hydrolyzable N exhibited a moderate increase under HP conditions, potentially attributable to P-induced stimulation of organic N hydrolysis via increased phosphatase activity. However, nitrification was suppressed under acidic conditions, limiting the conversion of NH4+ and NO3 [32,33]. SOM displayed a unimodal response, peaking under the MP treatment and declining thereafter under HP. This pattern suggested a critical threshold of P availability; under MP, microbial necromass emerged as a key contributor to SOM formation, stabilized through organo-mineral complexation [34,35]. Such processes reinforced the dominance of necromass-derived pathways in C sequestration dynamics [36]. Excessive P application altered microbial community composition, potentially accelerating the mineralization of labile C pools and weakening physical protection within soil aggregates [37]. Maize yield responded to P fertilization with a saturation trend, reaching maximum productivity under the MP treatment, a significant improvement compared to the P0 control. The yield plateau at MP indicated an optimal P threshold beyond which additional P inputs did not enhance productivity, consistent with established principles of nutrient-use efficiency outlined by Grant et al. [38]. Importantly, excessive P application might disrupt nutrient stoichiometry and impair soil microbial activity [39,40]. The reduced yield efficiency observed under HP conditions underscored the importance of balanced fertilization strategies for optimizing both agricultural output and long-term soil health.

4.2. Effects of Different P Application Rates on CDOM and Related Fluorescence Indices

The humification dynamics of DOM were significantly influenced by P fertilization, as evidenced by 3D-EEM fluorescence spectroscopy and indices (Table 2, Figure 1). CDOM exhibited a nonlinear response to P application, increasing by 29.6% from the P0 treatment to the MP level, followed by stabilization under HP conditions (Table 1). This aligned with P adsorption saturation in soil; MP inputs promoted phosphatase-mediated mineralization of organic P, thereby enhancing labile DOM production [41]; in contrast, excessive P loading saturated Fe/Al–oxide binding sites, impairing aromatic stabilization mechanisms of DOM. The nonlinear pattern of the FI further indicated distinct P-induced shifts in DOM fractions. Under MP, the nonlinear trend in the FI further indicated distinct shifts in DOM composition across P treatments. Under MP, elevated FI values suggested a predominance of microbial-derived metabolites, consistent with prior studies showing that P enrichment in urban watersheds enhanced protein-like fluorescence associated with microbial activity [42]. Conversely, the marked decline in FI under HP conditions implied a resurgence of terrestrial DOM inputs from non-point sources. These changes reflected P-induced alterations in microbial processing efficiency, which might promote the mobilization of terrestrial C under excessive P fertilization. Notably, long-term P application intensified fluctuations in FI by reducing DOM structural complexity [43], underscoring the sensitivity of FI to stoichiometric imbalances in agricultural soils. The interaction between HIX and BIX revealed critical physicochemical thresholds governing organic–mineral interactions in Albic soils. HIX increased nonlinearly from P0 to HP, reflecting progressive aromatic condensation and stabilization of DOM (Table 1). In the MP treatment, HIX rose to 6.8, driven by P-induced desorption of FA from clay minerals and the formation of Fe/Ca-P-HA ternary complexes. This mechanism was corroborated by FTIR spectral shifts (Table 4) and reduced E4/E6 ratios (Figure 2b), both indicative of enhanced aromatic condensation in HA. However, under HP conditions, this equilibrium was disrupted. Despite persistently high HIX values, soil acidification weakened HA–mineral associations, as demonstrated by the displacement of HM from clay surfaces and increased HE concentrations (Figure 2a; [44]). Concurrently, BIX trends supported these processes—BIX peaked under MP, likely due to the release of labile organic compounds from CaCO3-bound complexes, thereby enriching autochthonous DOM (characterized by tryptophan-like fluorescence at Ex/Em = 310/430 nm; [45]). In contrast, under HP, BIX plateaued, despite a twofold increase in DOM concentration (Table 1), suggesting non-selective leaching of aliphatic compounds following saturation of mineral sorption capacity [46]. This decoupling between BIX and DOM concentration mirrored the decline in FI, indicating diminished molecular complexity of DOM under P overload [43]. Collectively, these findings highlighted a critical P threshold. Below this threshold, P altered organic–mineral interactions, facilitating the preferential leaching of simplified aliphatic compounds.

4.3. Effect of Different P Application Rates on HS Fractions

The application of P fertilizer significantly influenced the composition and distribution of soil HS fractions. This study demonstrated that MP application enhanced the stability and structural complexity of HS, whereas excessive P application disrupted the architecture of SOM [43]. P addition promoted the accumulation of WSS, with the magnitude of promotion increasing concomitantly with P application rates. A linear increase in CWSS with rising P inputs suggests enhanced solubilization or mobilization of labile C fractions, potentially mediated by P-induced alterations in soil ionic strength or chelation processes [47,48]. Both CHA and CHE exhibited an initial increase followed by stabilization, reaching peak accumulation under MP treatment. However, this trend plateaued under HP conditions, as indicated by stable CHA concentrations, implying a potential saturation threshold for P-driven humification. The stabilization of CHA under HP conditions might reflect either a shift in C allocation toward CHM or structural reorganization of HS—supported by a transient decline in CHM followed by partial recovery. Further evidence of structural transformation in HA was observed through dynamic changes in E4/E6 ratios. The initial decrease in E4/E6 ratio signifies increased molecular weight or aromatic condensation, indicative of advanced humification [49]. This was subsequently followed by partial structural relaxation, evidenced by a rebound in the E4/E6 ratio under HP treatment. Such a non-linear pattern suggested that transient P-induced molecular stabilization was succeeded by moderate structural degradation under excessive P inputs [50]. Concurrently, the CHA/CFA ratio increased up to MP treatment, highlighting the capacity of P to promote selective humification toward HA formation. The subsequent decline under HP conditions indicated gradual saturation of this P-mediated pathway. HM represents the most chemically inert and mineral-associated fraction of soil HS [51]. The subfractions exhibited differential responses to graded P fertilization, primarily mediated by P-regulated organo-mineral interaction mechanisms. The increase in CHMi under LP conditions could be attributed to limited P availability stimulating microbial secretion of Fe-chelating ligands, which facilitated the formation of stable complexes between Fe oxides and SOM. Moreover, LP conditions prevented P-induced passivation of Fe oxide surfaces, preserving their reactivity for adsorbing HS precursors [20,52,53]. In contrast, the sharp decline in CHMi under MP and HP treatments resulted from competitive ligand exchange, wherein excess phosphate anions displaced organic ligands from Fe oxide binding sites, thereby destabilizing CHMi. This effect was further intensified by P-induced dissolution of amorphous Fe oxides, reducing available binding substrates for HMi [54,55]. The continuous decrease in CHMc with increasing P input was governed by competitive adsorption; negatively charged phosphate anions exhibit strong affinity for positively charged clay surfaces, outcompeting humic ligands and thus limiting HMc formation [56,57]. Our observations on P-induced HM structural changes align with long-term findings by Li et al. [9] in black soil. They reported that continuous P fertilization reduced the infrared spectral ratio of aliphatic C to aromatic C in HM and lowered the alkyl C to alkoxy C ratio via NMR analysis. While their study focused on long-term P input in black soil, our results in Albic soils showed a similar trend—MP and HP treatments reduced labile HM components (e.g., CHMi and CHMc), confirming that P fertilization universally promotes HM stabilization. The difference lies in the response magnitude; Albic soils, with low initial SOM and high acidification risk, exhibited more pronounced HM fractionation, whereas black soil showed gradual HM structural changes over decades. This discrepancy underscores that soil type-specific edaphic properties modulate the rate and intensity of P–HM interactions. For HMr, the gradual monotonic decline with elevated P levels was primarily due to P-induced disruption of physical protection mechanisms—excess P altered soil aggregate stability and compromised the micropore integrity that sheltered recalcitrant HMr. Additionally, P-enhanced microbial activity accelerated the decomposition of labile components within HMr, although the persistence of its highly stable aromatic core constrained the overall rate of decline [20,58,59]. The HMi/HMc ratio is closely associated with soil environmental conditions, mineral composition, and anthropogenic management practices [7,8]. Specifically, this ratio serves as a sensitive indicator of molecular structural differences between the two fractions. HMi typically exhibits a relatively simple molecular configuration, whereas HMc forms more complex structures via electrostatic adsorption and coordination bonding with clay minerals [7,8,9]. Consequently, an elevated HMi/HMc ratio indicates dominance of structurally simpler HM components or preferential stabilization of HM by iron oxides. Conversely, a reduced ratio reflects enhanced adsorption of HM by clay minerals or increased internal humification within the HM pool [7,9]. These dynamics arise from the differential regulation of HMi and HMc subsystems by P. Under LP conditions, P maintained the adsorptive capacity of iron oxides while suppressing the electrostatic adsorption potential of clay minerals [10,52]. This dual mechanism promoted HMi formation and restricted HMc accumulation, ultimately yielding the highest HMi/HMc ratio among all treatments [20,53]. Under MP conditions, P significantly inhibited iron oxide carriers by impeding the coordination binding of HMi [10,54]. Meanwhile, P exerted only a mild inhibitory effect on the core adsorption sites of clay minerals, resulting in a slight reduction in CHMc accumulation [56,57]. Consequently, the HMi/HMc ratio reached its minimum value. The (HMi+HMc)/HM ratio decreased under MP and subsequently exhibited partial recovery under HP conditions, indicating that MP maximized microbial decomposition of soluble HM, whereas HP attenuated microbial decomposition intensity [53]. The E4/E6 ratios of HMi and HMc reflected the differential effects of P on HM humification (Figure 3c). The E4/E6 ratio of HMi displayed a non-monotonic response to increasing P gradients, directly reflecting molecular restructuring mediated by P-regulated interactions among minerals, microorganisms, and SOM. Negatively correlated with the degree of humification [21,49], fluctuations in this ratio indicated adaptive structural and functional adjustments of HMi. Under LP conditions, the ratio declined sharply due to P limitation. Microorganisms secreted iron-chelating ligands to form stable Fe-HMi complexes; iron oxides facilitated the polymerization of aromatic monomers; and microbes preferentially degraded aliphatic components, thereby enhancing humification [20,21,52]. Under MP conditions, the ratio partially recovered as P limitation was alleviated. Microbial proliferation generated medium-molecular-weight metabolites that diluted aromatic compounds, while Fe–organic–P ternary complexes contributed to SOM stabilization [53,54]. Under HP conditions, the ratio declined again owing to excessive P input, which induced soil acidification and anion competition from phosphate, disrupting Fe–HMi complexes and releasing labile organic components. Concurrently, acidification suppressed microbial decomposition activity and dissolution of amorphous iron oxides reduced HMi carriers, leading to enrichment of residual aromatic structures and diminished functional flexibility of HMi [31,55,56]. In contrast, the continuous decrease in the E4/E6 ratio of HMc with increasing P application indicated that P promoted the humification of mineral-bound HMc. As P displaced HMc from mineral surfaces, microorganisms preferentially decomposed low-humified HMc and resynthesized it into highly humified forms enriched in condensed aromatic rings [21]. This structural optimization of HMc partially compensated for the loss of CHM, thereby maintaining a certain level of soil C stability.

4.4. Effects of Different P Application Rates on Molecular Structure and Thermal Properties of HA

HA constitutes a core fraction of soil HS. Its structural characteristics—such as aromaticity, abundance of oxygen-containing functional groups, and thermal stability—directly influence SOC sequestration capacity, nutrient retention potential, and broader ecological functions [56]. Elemental composition (C, H, O, and N) and derived atomic molar ratios (H/C, O/C, and C/N) serve as fundamental indicators of HA’s structural condensation, aromaticity, and nutrient-binding capacity [22,23]. Yu et al. [23] observed during organic–inorganic co-composting that a decline in the H/C ratio of HA was typically associated with an increased proportion of aromatic compounds, signifying enhanced humification. This observation aligned with the findings of the present study. Under moderate P application, the H/C ratio decreased by 21.8% relative to the control, suggesting that moderate P supply significantly promoted the condensation of the HA C skeleton and the accumulation of aromatic structures. FTIR spectroscopy further corroborated this trend, revealing a marked increase in the absorption peak intensity corresponding to aromatic C=C bond vibrations under medium P treatment. Both Zhang et al. [27] and Abd El-Rahim et al. [22] confirmed that absorbance at this wavenumber served as a direct proxy for aromatic content in HA. Concurrently, DTA demonstrated that the moderate P treatment yielded the highest heat release (19.05 mJ mg−1) during the high-temperature exothermic phase, which corresponded to the thermal degradation of aromatic structures, as previously established by Gonet and Cieslewicz [28]. Under high P application, the H/C ratio slightly rebounded, likely due to the disruption of metabolic equilibrium in humification-related microbial communities caused by excessive inorganic P fertilization. Sinsabaugh et al. [57] proposed that excessive inorganic nutrients could suppress phenol oxidase activity, thereby impairing the polymerization of aromatic precursors. However, the H/C ratio under high P treatment (2.00) remained 9.1% lower than that under the no-P treatment. This finding was supported by both FTIR spectroscopy and DTA results; the intensity of the aromatic C=C bond absorption peak was higher under high P than under no-P conditions, and the heat release during the high-temperature exothermic phase reached 8.64 mJ mg−1, exceeding the 6.05 mJ mg−1 observed in the no-P treatment. These data indicated that while high P supply attenuated the P-induced increase in aromatic structural content, it did not reverse it. The O/C ratio reflects the abundance of polar, oxygen-containing functional groups (e.g., –COOH, –OH, and carbonyl C=O) in HA. Under P0 and LP treatments, the O/C ratio remained low and stable, suggesting limited oxidation of HA precursors and consequently reduced formation of O-containing functional groups. This observation aligned with FTIR data, which showed significantly lower absorption intensities for carboxyl and O–H groups under P0 and LP compared to MP treatment. Abd El-Rahim et al. [22] have explicitly associated these wavenumbers with stretching vibrations of O-containing functional groups. From a thermal analysis perspective, the medium-temperature exothermic stage in DTA is primarily linked to the decomposition of oxygen-containing functional groups and aliphatic components [28]. The lower O/C ratios under P0 and LP corresponded to reduced heat release during this stage, indicating fewer labile oxygen-containing moieties. In contrast, the O/C ratio under MP treatment was highest—14.3% greater than under P0—suggesting optimal accumulation of O-containing functional groups. Consistently, the moderate-temperature heat release under MP (16.01 mJ mg−1) significantly exceeded that under P0, attributable to the extensive decomposition and associated energy release from such functional groups. The slight decline in the O/C ratio under high P relative to MP likely resulted from accelerated HA condensation, which incorporated O-containing functional groups into the internal aromatic matrix, thereby reducing their surface exposure. Zhang et al. [27] noted that highly condensed HA structures tended to contain more embedded functional groups. The C/N ratio of HA reflected the relative distribution of C and N within its molecular framework; a lower C/N ratio implies preferential incorporation of N into stable, N-rich structures rather than in labile aliphatic amides. The lowest C/N ratio occurred under low P treatment, indicating that limited P availability promoted the integration of N into stable HA fractions. This is consistent with FTIR results showing elevated absorption intensity for amide groups—including amide carbonyl stretching—under low P. DTA data further revealed that the low C/N ratio under low P coincided with a heat release of 13.3 mJ mg−1, higher than under no-P conditions, suggesting synchronous decomposition of N-bearing structures with aromatic rings. The C/N ratio increased progressively under medium and high P treatments, driven primarily by enhanced synthesis of aromatic C. As indicated by H/C ratio data, moderate and high P significantly increased the proportion of aromatic structures [57]; the rapid accumulation of aromatic C led to a relative enrichment of C content, thus elevating the C/N ratio. In DTA, the high C/N ratio under MP corresponded to the highest heat release (19.05 mJ mg−1) due to the breakdown of abundant aromatic C structures. Similarly, the high P treatment exhibited a high C/N ratio and moderate high-temperature heat release (8.64 mJ mg−1), reinforcing the association between elevated C/N values and increased aromatic C content.
FTIR spectroscopy enables the direct characterization of functional group compositions in HA. Temporal variations in FTIR spectra revealed that P fertilization induced significant stoichiometric and functional group reconfigurations within HA, reflecting a continuum of molecular restructuring processes driven by P-mediated chemical interactions. Specifically, FTIR analysis showed that the stretching vibration intensity of O–H bonds in phenols, alcohols, carboxylic acids, and carbohydrates decreased under LP conditions but was substantially restored under MP to HP conditions. This nonlinear response indicated that P concentration regulated the reconstruction of the hydrogen bond network and modulated the bioavailability of O–H groups [58,59]. Initial P inputs likely disrupted hydrogen-bonded HA aggregates through competitive binding of P for mineral surfaces and chelation-induced conformational masking of O–H functionalities, whereas elevated P application promoted O–H enrichment via oxidative recondensation of aromatic moieties and Fe/Al coordination-driven stabilization of lignin-derived polyphenols [60,61]. The asymmetric and symmetric aliphatic C–H stretching signals at peak a and peak b further underscored the structural plasticity of HA. At peak a, a transient increase in aliphatic signals under LP, followed by a decline under MP, suggested initial accumulation of alkyl chains—potentially due to partial decomposition of labile organic precursors—followed by progressive oxidation or abiotic cleavage under prolonged P exposure [62,63]. The behavior of peak b further confirmed that P dosage exerted a differential regulatory effect on aliphatic C–H moiety abundance. Concurrently, a consistent reduction in the intensities of C=O bonds (carboxylic, ester, ketone, or aldehyde) and polysaccharide-associated C–O signals indicated depletion of O-rich polar functionalities mediated by P. Notably, peak c intensity decreased non-significantly by 6.0% under LP, while MP and HP treatments led to significant reductions of 32.0% and 72.0%, respectively, relative to the P0 control. Similarly, polysaccharide C–O intensity exhibited a non-significant 9.5% decrease under LP, with more pronounced reductions of 30.2% and 26.0% under MP and HP, respectively. These observations aligned with potential decarboxylation or ester hydrolysis pathways, wherein P anions might accelerate acid-catalyzed degradation of carboxyl groups or disrupt metal–carboxylate coordination complexes [48,62,63,64]. Two additional spectral regions further supported P-mediated HA restructuring: one corresponding to C–O stretching or O–H bending vibrations of carboxyl or phenolic groups, and another to C–O stretching and O–H deformation of carboxyl functionalities. Between 1358 and 1388 cm−1, signal intensity was highest under LP, followed by HP, P0, and MP. In the 1205–1242 cm−1 range, LP exhibited the highest intensity, with no significant difference between P0 and MP, both of which were significantly higher than HP. A linear increase in vibrational intensity of aromatic or olefinic C=C and amide I/ketone/quinone/C=O or COO groups—from 15.2% in P0 to 18.2% in HP—strongly supported selective preservation of conjugated aromatic systems as a dominant pathway, enhanced by P-mediated suppression of aliphatic segment degradation [65,66]. Notably, LP induced only a non-significant 7.9% increase in peak d intensity relative to P0, indicating limited aromatic enrichment under low P supply. The enhancement of aromatic structures, coupled with attenuation of aliphatic components, was further supported by the stable (a + b)/d ratio, suggesting a maintained equilibrium between aliphatic and aromatic domains across P levels. In contrast, the significant increase in the (a + b)/c ratio highlighted a shift toward nonpolar aliphatic dominance relative to polar carboxyl and carbonyl groups. This stoichiometric imbalance implies that P inputs preferentially destabilize polar oxidized functionalities while preserving or reorganizing hydrophobic alkyl and aromatic matrices. Collectively, these spectral patterns revealed a dual role of P; moderate fertilization initially disrupted the hydrophilic architecture of HA through loss of carboxyl groups and degradation of aliphatic components, whereas sustained HP conditions promoted recondensation into aromatic-enriched, structurally decoupled systems. This pattern was consistent with this study’s observation that MP application enhanced HA aromatic condensation—characterized by increased C=C absorption and a lower H/C ratio—and was aligned with prior work by Olusegun et al. [67] These authors reported that exclusive application of inorganic N-P-K fertilizers increased HA structural complexity and aromaticity in a 35-year long-term trial. Notably, Olusegun et al. [67] also observed that combined organic–inorganic P fertilization enriched aliphatic groups in HA, with the 2920/1720 cm−1 ratio increasing by 35.5% and 209% compared to sole inorganic and organic fertilizer treatments, respectively—in contrast to this study’s findings that MP application reduced aliphatic C absorption. This discrepancy was likely attributed to two context-dependent factors: (1) the fertilization regime (sole inorganic P application in this study versus combined organic–inorganic P fertilization in theirs) and (2) soil type (this study’s low SOM Albic soil versus their tropical agricultural soil). Such molecular restructuring of HA likely reduced its solubility and redox activity, thereby modulating its functional role in nutrient retention and C stabilization. These cross-study comparisons highlighted that P-induced HA structural changes are not universal but were modulated by soil properties and fertilization strategies. This study’s results specifically validated the efficacy of sole inorganic P application in promoting HA aromaticization in Albic soils.
The DTA profiles of HA under different P fertilization regimes exhibited distinct thermal behavior, reflecting P-dependent structural reorganization and stability thresholds within the HA matrix. A marked increase in low-temperature endothermic heat was observed with escalating P application rates, reaching a maximum under HP and a minimum under MP, suggesting progressive accumulation of loosely bound volatile components in the HP treatment. [68]. In contrast, the MP regime appeared to suppress the retention of these volatiles by enhancing the stability of the hydrogen-bonded water network. This effect might be attributed to P-induced alterations in the hydrophilic domains of HA, where phosphate anions disrupted hydrogen-bonding networks or promoted the adsorption of polar organic fragments with low thermal stability [69,70,71]. The enhanced volatile release under HP conditions coincided with increased structural heterogeneity, as indicated by dual exothermic peaks at 400 °C and 550 °C, which likely corresponded to distinct combustion phases associated with labile alkyl moieties and more refractory aromatic clusters, respectively [68]. Mid-temperature exothermic energy displayed a unimodal response, peaking at MP (16.01 mJ mg−1), suggesting that moderate P supply optimizes oxidative degradation reactivity within this thermal range [72]. Notably, the exothermic heat followed a clear descending order: MP > LP > P0 > HP. The LP treatment also exhibited a secondary exothermic peak, indicative of moderate P-induced accumulation of aliphatic side chains, likely corresponding to the combustion of such chains or partially condensed aromatic structures. This implied that MP conditions fostered a balanced configuration between structural complexity and thermal lability. In contrast, HP not only yielded the lowest mid-temperature exothermic heat but also exhibited a peak temperature 12 °C higher than MP, consistent with reduced aliphatic content and early-stage aromatic condensation. At high temperatures, exothermic behavior further underscored P-dependent divergence; MP again showed the highest exothermic heat, HP demonstrated intermediate values, and LP exhibited relatively low exothermic activity, accompanied by a 64.3% reduction in weight loss compared to P0. Under MP, high-temperature exothermic heat increased by 215% relative to P0, concurrent with a shift in the H/C ratio of residual char, indicating intensified aromatic condensation and carbonization. This stabilization suggested that P-mediated cross-linking or oxidative coupling among aromatic units promoted the formation of recalcitrant, graphene-like domains resistant to high-temperature decomposition. Notably, HA from the HP treatment exhibited the highest peak temperature in the high-temperature exothermic phase, exceeding those of both P0 and MP, providing direct evidence of enhanced thermal stability in its aromatic framework.
Despite the increased Em of low-temperature volatiles under HP conditions, the cumulative exothermic energy decreased to 24.72 mJ mg−1, suggesting a structural trade-off; excessive P led to the fragmentation of HA into less cohesive hybrid systems composed of labile alkyl fragments and thermostable aromatic cores, thereby constraining the energetic yield from high-temperature combustion pathways. TGA further elucidated this dichotomy. In the low-temperature range, LP exhibited the highest weight loss, whereas MP showed the lowest, indicating that LP promoted the generation of labile volatile components. In the mid-temperature range, LP again displayed the greatest mass loss, while HP had the least, consistent with the accumulation of aliphatic side chains under LP conditions. In the high-temperature range, HP exhibited slightly lower weight loss than P0 but 2.6-fold higher than LP, demonstrating that HP preserves aromatic structures despite partial fragmentation. The significant reduction in the H/M ratio under MP conditions reflected enhanced retention of aromatic moieties. It was essential to differentiate between two types of H/M ratios: the DTA-derived H/M ratio, which directly indicated the relative abundance of aromatic versus aliphatic structures, and the TGA-derived H/M ratio, which indirectly reflected the mass proportion of aromatics to aliphatics. Both metrics increased progressively from LP to HP, signifying a systematic enhancement in aromatic component content with increasing P application. However, HA under HP conditions displayed destabilized thermal behavior, characterized by disproportionate volatile release at lower temperatures and reduced energy output at elevated temperatures. This paradox—marked by heightened mass loss in early stages alongside preserved residual aromatic integrity—suggested that excessive P disrupted the structural coherence of HA, likely through competitive ligand displacement, resulting in molecular fragmentation into domains with divergent thermal stabilities [64]. Collectively, these thermal transitions illustrated a continuum along the P gradient. LP favored the accumulation of labile aliphatic components with limited aromatic condensation; MP enhanced aromatic stability via oxidative coupling and organo-mineral interactions, maximizing exothermic heat release at mid- and high-temperature ranges, reducing the H/M ratio, and minimizing low-temperature volatilization; HP induced molecular fragmentation, promoting the coexistence of labile alkyl segments and stable aromatic cores.

4.5. Comprehensive Evaluation

To verify the robustness of the statistical results, a sensitivity analysis of the PCA was conducted, focusing on three key aspects: (1) Data standardization impact: Z-score normalization was compared with min–max normalization, and the PC1/PC2 loadings showed a correlation coefficient of 0.96, indicating that the PCA results were insensitive to normalization methods. (2) Outlier influence: Removal of potential outliers did not alter the ranking of treatment scores (MP > HP > P0 > LP) or the direction of key indicator loadings, confirming the stability of the results. (3) Indicator selection sensitivity: Exclusion of any single indicator did not reduce the cumulative variance explained by the first three PCs, demonstrating that the PCA conclusions were not overly dependent on individual variables. PCA revealed that MP treatment achieved integrated optimization of soil HS functions. Specifically, MP improved humification efficiency, promoted the accumulation of SOM and CHA, and enhanced nutrient availability, ultimately supporting higher maize yields. These outcomes aligned with the strong positive loadings of these variables on the first principal component (PC1). In contrast, HP treatment demonstrated a trade-off effect; although it accelerated the degradation of aliphatic C and promoted structural differentiation of SOM, it disrupted the balance between mineral-associated and free HS fractions. This imbalance was reflected in its negative score on the second principal component (PC2), likely due to excessive P inducing soil colloid flocculation and over-accumulation of HMc. The P0 treatment exhibited limited functional development, as indicated by the lowest PC1 score, stemming from insufficient humification and poor nutrient supply capacity—consequences of P deficiency restricting microbial activity and thus impairing the transformation of SOM into bioavailable forms. The LP treatment showed overall functional inadequacy across all principal components, attributable to suboptimal P input failing to meet microbial demands for nutrient cycling and HS synthesis, leading to reduced SOM accumulation and unbalanced HS fractionation. The third principal component (PC3), positively associated with the C/N ratio, captured the degree of chemical structural differentiation in SOM. The highest PC3 score under HP suggested that elevated P inputs promoted N mineralization, increased the C/N ratio, and accelerated SOM turnover. Nevertheless, this benefit was counteracted by the deterioration of mineral–organic associations, resulting in a lower overall functional performance compared to MP. A comprehensive evaluation ranked the treatments in the following order: MP > HP > P0 > LP (Table S3). The superior performance of the MP treatment was attributed to its optimal coordination of humification efficiency (PC1), mineral–organic fraction balance (PC2), and SOM structural stability (PC3). Appropriate P input not only provided a necessary nutrient foundation for microbial humification but also prevented the detrimental effects of excessive P on soil colloid stability. In contrast, both P-deficient and P-excessive treatments failed to achieve this synergistic balance, underscoring that moderate P application represented the most effective strategy for enhancing soil HS functionality and nutrient dynamics. Pearson correlation analysis quantified pairwise relationships among key indicators. Maize yield exhibited highly significant positive correlations with SOM, CDOM, and Olsen P. This robust three-way correlation directly confirmed the synergistic enhancement of the “soil nutrient supply–HS accumulation–crop productivity” nexus under optimal P input—a pattern consistent with PCA, in which all these variables showed strong positive loadings on PC1. Specifically, the MP treatment, which achieved the highest maize yield and SOM content (Table 2), functioned as the central coordination node for this synergistic effect. Adequate yet non-excessive P application promoted SOM accumulation and CDOM formation, while sufficient Olsen P ensured nutrient availability to support both microbial humification processes and crop nutrient uptake. This finding further explained why the MP treatment ranked highest in both comprehensive PCA scores and productivity-related indices derived from heatmap analysis.
The heatmap also revealed tight couplings between HS components and their transformation pathways. CDOM showed strong positive correlations with the HIX and CHA. Quantitatively, compared to the P0 treatment, the MP treatment increased CDOM content by 29.6% and HIX by 136% (Table 1; Figure 1), reflecting a highly efficient conversion of labile DOM into stable HS. This observation complemented the interpretation of PC1 in PCA; while PCA identified CDOM and CHA as key positive contributors to PC1, the correlation coefficients (r values) from the heatmap quantify the strength of their mutual enhancement, confirming that P input accelerated the transformation of labile DOM into stable HA. With respect to the structural characteristics of HA, CHA exhibited a significant negative correlation with the HA E4/E6 ratio. Given that a lower E4/E6 ratio indicated greater aromatic condensation and a higher degree of humification, this negative correlation confirmed that MP application specifically promoted aromaticization of HA. This result aligned with PCA findings showing that PC1 was associated with a reduced H/C ratio. Furthermore, the H/C ratio showed negative correlations with CHA and HIX, and a positive correlation with the E4/E6 ratio. These interrelationships formed a coherent structural index chain initiated by MP application, leading sequentially to decreased H/C ratio (indicating reduced aliphaticity), decreased E4/E6 ratio (indicating increased aromaticity), and ultimately elevated CHA and HIX values (indicating enhanced humification). This index chain provided a more detailed mechanistic framework than the broader component-level interpretation offered by PCA alone. CWSS showed positive correlations with CHA and maize yield. The CWSS content under the MP treatment was 94.1% higher than under the P0 treatment (Figure 2a), indicating that MP facilitated the conversion of labile C into stable CHA, thereby mitigating the risk of labile C loss observed in other treatments. This observation is consistent with PCA results for PC2, where the MP treatment maintained an optimal mineral–organic balance, as efficient utilization of labile C supported both microbial activity and HS stabilization. In contrast, the heatmap highlighted a critical limitation of HP input. The ratio of HMi/HMc showed only weak positive correlations with SOM (r = 0.088) and maize yield (r = 0.182). The HP treatment exhibited a 60% higher HMi/HMc ratio than the P0 treatment, accompanied by a 73.4% reduction in CHMc (Figure 3a,b). This suggested that excessive P disrupted the HMi–HMc equilibrium in mineral-bound HS, resulting in the loss of stable CHMc and potentially impairing long-term SOM sequestration—not due to strong correlations, but due to imbalanced fractions. This phenomenon directly explained the negative PC2 score observed for the HP treatment in PCA (indicating disrupted mineral–organic fractionation), with the heatmap providing complementary evidence through observed shifts in HS fractions rather than correlation strength. The aliphatic C to aromatic C ratio exhibited a strong negative correlation with HIX and CHA, indicating that a lower ratio corresponds to more stable HS. The HP treatment increased aliphatic C–H absorption by 18.8% relative to the P0 treatment (Table 4), suggesting that excessive P application led to the accumulation of labile aliphatic C. This finding was consistent with the PC3 results obtained from PCA, indicating that although the HP treatment enhanced the structure of SOM, it concurrently disrupted the mineral–organic associations. Furthermore, the H/M exothermic ratio was positively correlated with CHA and negatively correlated with the HMi/HMc ratio. In the MP treatment, the H/M ratio was 54.5% higher than in the P0 treatment (Table 5), confirming that moderate P input not only promoted CHA accumulation but also enhanced the thermal stability of HA. These thermal stability data—revealed exclusively through heatmap analysis—added a new dimension to the PCA findings, linking structural stability to thermal resilience. A key strength of the heatmap analysis lied in its ability to validate PCA outcomes through direct correlation metrics. All parameters showing positive correlations in the heatmap (maize yield, SOM, CDOM, CHA, and H/M ratio) displayed strong positive loadings on PCA’s PC1 (accounting for 80.15% of total variance), whereas those with negative correlations (E4/E6 ratio, H/C ratio, HMi/HMc ratio, and aliphatic C/aromatic C ratio) exhibited negative loadings on PC1. Moreover, the MP treatment ranked highest in the heatmap analysis, consistent with its superior comprehensive scores in the PCA (Figure 6). This cross-validation underscored the reliability of both analytical methods; PCA captured macroscale variation patterns within the soil system, while the heatmap elucidated the underlying microscale quantitative mechanisms. Together, they formed a robust evidence chain supporting the optimal role of moderate P input.

5. Conclusions

This study demonstrated that the moderate P application rate achieved the highest maize yield (12,257.1 kg ha−1) and SOM content (14.8 g kg−1), with no additional yield benefit observed under HP. The MP treatment significantly increased CDOM content (0.350 mg L−1) and HIX of DOM (6.80), reflecting efficient transformation of labile DOM into stable HS. HA under moderate P exhibited enhanced structural stability, characterized by a lower H/C ratio (1.72), higher O/C ratio (0.880), and reduced E4/E6 ratio, indicative of increased aromatic condensation and greater abundance of oxygen-containing functional groups. FTIR and DTA analyses confirmed that MP promoted aromatic enrichment, thereby enhancing HA structural complexity and thermal stability. In contrast, no-P-application and low-P-application treatments restricted nutrient availability and limited HS formation, while HP induced soil acidification (pH 5.68), decreased available K, and impaired HS balance. PCA and correlation analyses revealed that MP was strongly associated with SOM, CDOM, and maize yield, optimizing humification efficiency and nutrient cycling. This study concluded that moderate P application was optimal for Albic soils, synergistically improving maize productivity and HS quality by enhancing HA structural stability and promoting DOM transformation. To implement precise P management based on this study’s findings: (1) prioritize soil testing of available P, SOM, and pH—for Albic soils with initial available P of 20–25 mg kg−1, apply 80 kg P2O5 ha−1 to match the optimal MP treatment; (2) maintain the N/P2O5/K2O ratio of 220:80:90 to avoid nutrient imbalance-induced soil degradation; (3) conduct annual monitoring of soil-available P and pH—if available P exceeds 30 mg kg−1 or pH drops below 5.8, adjust P input downward to prevent accumulation and acidification risks. These findings provided theoretical support for precise P management strategies aimed at achieving sustainable agriculture in Albic soil regions of Northeastern China.

Supplementary Materials

The following supporting information can be downloaded at https://www.mdpi.com/article/10.3390/agronomy16040469/s1, Table S1. Eigenvalues of principal components, contribution rate and cumulative contribution rate. Table S2. Load matrix of each principal component. Table S3. Average score, sort and comprehensive evaluation of principal components at different P application rates.

Author Contributions

J.G.: investigation, visualization, and writing—original draft; H.C.: conceptualization and data curation; D.D.: investigation and formal analysis; H.G.: investigation and formal analysis; J.W.: investigation and visualization; M.W.: investigation and formal analysis; J.P.: investigation and formal analysis; N.W.: supervision, writing—original draft, and writing–review and editing. All authors have read and agreed to the published version of the manuscript.

Funding

This work was supported by the Innovation and Entrepreneurship Training Program for College Students in Jilin Province (Grant No. S202511439011).

Data Availability Statement

Data will be made available on request.

Conflicts of Interest

The authors declare no conflicts of interest.

References

  1. Swapna, G.; Jadesha, G.; Mahadevu, P. Sweet corn–a future healthy human nutrition food. Int. J. Curr. Microbiol. Appl. Sci. 2020, 9, 3859–3865. [Google Scholar] [CrossRef]
  2. Dong, F.; Zhang, Z.; Jiang, F.; Wang, J.; Wang, Q.; Li, L.; Peng, X. Spatial distribution of the buried depth and thickness of albic soil albic layer in Sanjiang plain and its influencing factors. Acta Pedofil. Sin. 2025, 62, 362–374. (In Chinese) [Google Scholar]
  3. Xiu, L.; Zhang, W.; Sun, Y.; Wu, D.; Meng, J.; Chen, W. Effects of biochar and straw returning on the key cultivation limitations of albic soil and soybean growth over 2 years. Catena 2019, 173, 481–493. [Google Scholar] [CrossRef]
  4. Gerke, J. The central role of soil organic matter in soil fertility and carbon storage. Soil Syst. 2022, 6, 33. [Google Scholar] [CrossRef]
  5. Devika, J.; Rani, B.; Gladis, R.; Priya, G.; Sarada, S. Impact of humic substances on carbon sequestration and soil resilience. Int. J. Environ. Clim. Change 2025, 15, 387–402. [Google Scholar] [CrossRef]
  6. Xu, X.; Mi, Q.; Liu, D.; Fu, S.; Wang, X.; Guo, D.; Zhou, W. Effect of phosphorus fertilizer rate on phosphorus fractions contents in calcareous soil and phosphorus accumulation amount in crop. Chin. J. Eco-Agric. 2021, 29, 1857–1866. (In Chinese) [Google Scholar]
  7. Gao, J.; Wang, L.; Luo, J.; Gao, H.; Qiu, W.; Li, Q.; Zhang, X.; Zhu, P.; Peng, C.; Jiao, Y.; et al. Long-term fertilizer application induces changes in carbon storage and distribution, and the consequent color of black Soil. J. Soil Sci. Plant Nutr. 2024, 24, 905–913. [Google Scholar] [CrossRef]
  8. Zhang, J.; Wang, J.; An, T.; Wei, D.; Chi, F.; Zhou, B. Effects of long-term fertilization on soil humic acid composition and structure in black Soil. PLoS ONE 2017, 12, e0186918. [Google Scholar] [CrossRef] [PubMed]
  9. Li, Z.; Chi, F.; Zhang, J.; Kuang, E.; Su, Q. Effects of long-term localized fertilization on nutrient balance and dynamic change of humic molecular structure in black soil. Spectrosc. Spect. Anal. 2018, 38, 3875–3882. (In Chinese) [Google Scholar]
  10. Zhou, Y.; Selvam, A.; Wong, J.W.C. Evaluation of humic substances during co-composting of food waste, sawdust and Chinese medicinal herbal residues. Bioresour. Technol. 2014, 168, 229–234. [Google Scholar] [CrossRef]
  11. Wang, D.; Mao, Y.; Mai, L.; Yu, Z.; Lin, J.; Li, Q.; Yuan, J.; Li, G. Insight into humification of mushroom residues under addition of Rich-N sources: Comparing key molecular evolution processes using EEM-PARAFAC and 2D-FTIRCOS analysis. J. Environ. Manag. 2023, 329, 117079. [Google Scholar] [CrossRef]
  12. Qiu, Q.; Wu, L.; Ouyang, Z.; Li, B.; Xu, Y.; Wu, S.; Gregorich, E.G. Effects of plant-derived dissolved organic matter (DOM) on soil CO2 and N2O emissions and soil carbon and nitrogen sequestrations. Appl. Soil Ecol. 2015, 96, 122–130. [Google Scholar] [CrossRef]
  13. Liu, X.; Cao, H.; Miao, C.; Li, L.; Zhou, H.; Lv, Y. Three-dimensional fluorescence spectra of dissolved organic matter in Fluvo-Aquic soil profile under long term composting treatment. Spectrosc. Spectr. Anal. 2023, 43, 674–684. (In Chinese) [Google Scholar]
  14. Liu, B.; Wu, R.; Xue, B.; Gao, R.; An, H.; Liu, L.; Ndzana, G.M.; Du, L.; Kamran, M. Effects of nutrient addition on the composition and chemical characteristics of soil dissolved organic matter in a desert steppe in northern China. Land Degrad. Dev. 2023, 35, 1365–1380. [Google Scholar] [CrossRef]
  15. Wilson, H.F.; Xenopoulos, M.A. Effects of agricultural land use on the composition of fluvial dissolved organic matter. Nat. Geosci. 2009, 2, 37–41. [Google Scholar] [CrossRef]
  16. Li, Q.; Guo, X.; Chen, L.; Li, Y.; Yuan, D.; Dai, B.; Wang, S. Investigating the spectral characteristic and humification degree of dissolved organic matter in saline-alkali soil using spectroscopic techniques. Front. Earth Sci.-PRC 2017, 11, 76–84. [Google Scholar] [CrossRef]
  17. Hu, T.; Zheng, K.; Luo, M.; Xie, J.; Qi, Y.; Xu, Y.; Chen, D. Probing the optical and molecular properties of sedimentary dissolved organic matter in the laminated diatom mats from the southern Mariana Trench. Glob. Planet. Change 2024, 234, 104386. [Google Scholar] [CrossRef]
  18. Kagan, K.; Goraj, W.; Kuźniar, A.; Kruczyńska, A.; Sochaczewska, A.; Słomczewski, A.; Wolińska, A. Exploring the synergy between humic acid substances, dehydrogenase activity and soil fertility. Agronomy 2024, 14, 1031. [Google Scholar] [CrossRef]
  19. Balík, J.; Suran, P.; Černý, J.; Sedlář, O.; Kulhánek, M.; Procházková, S. Changes in soil organic matter content and quality after application of different organic and mineral fertilisers in 27 years long-term field experiments on luvisol. Front. Soil Sci. 2025, 5, 1540137. [Google Scholar] [CrossRef]
  20. Fan, C.; Song, X.; Chang, J.; Wang, Y.; Zhang, J. Chemical compositions and copper (II) adsorption properties of sequentially extracted humic substances, including different humin fractions. Fresenius Environ. Bull. 2018, 27, 6485–6499. [Google Scholar]
  21. Li, K.; Dou, S.; Han, X. Distribution characteristics of humin in soil aggregate without fertilization for long time. J. Jilin Agric. Sci. 2013, 38, 52–54, 80. (In Chinese) [Google Scholar]
  22. Abd El-Rahim, M.G.; Dou, S.; Althobiti, R.A.; Ali, G.A. Split application of biochar for humic acids structural characteristics enhancement during chicken manure composting. Bull. Chem. Soc. Ethiop. 2025, 39, 1493–1508. [Google Scholar] [CrossRef]
  23. Yu, H.; Li, P.; Bo, G.; Shen, G. Studies on the humic acid structure and microbial nutrient restriction mechanism during organic-inorganic co-composting. J. Environ. Manag. 2024, 353, 120186. [Google Scholar] [CrossRef]
  24. Li, X.; Xing, M.; Yang, J.; Zhao, L.; Dai, X. Organic matter humification in vermifiltration process for domestic sewage sludge treatment by excitation–emission matrix fluorescence and Fourier transform infrared spectroscopy. J. Hazard. Mater. 2013, 261, 491–499. [Google Scholar] [CrossRef]
  25. Akbarbaglu, Z.; Ramezani, A.; Rafati, A.; Mazloomi, N.; Jafari, S.M.; Hesarinejad, M.A.; Khaleghi, F.; Sarabandi, K. Bio-functional, antibacterial, ACE and DPP-IV inhibitory activities of thyme, flax and apple pollen-peptides by controlled enzymolysis. J. Agric. Food Res. 2025, 19, 101617. [Google Scholar] [CrossRef]
  26. Li, H.H.; Zhang, T.; Shaheen, S.M.; Abdelrahman, H.; Ali, E.F.; Bolan, N.S.; Li, G.X.; Rinklebe, J. Microbial inoculants and struvite improved organic matter humification and stabilized phosphorus during swine manure composting: Multivariate and multiscale investigations. Bioresour. Technol. 2022, 351, 126976. [Google Scholar] [CrossRef]
  27. Zhang, X.; Dou, S.; Ndzelu, B.S.; Guan, X.W.; Zhang, B.Y.; Bai, Y. Effects of different corn straw amendments on humus composition and structural characteristics of humic acid in black soil. Commun. Soil Sci. Plant Anal. 2019, 51, 107–117. [Google Scholar] [CrossRef]
  28. Gonet, S.S.; Cieslewicz, J. Differential thermal analysis of sedimentary humic acids in the light of their origin. Environ. Int. 1998, 24, 629–636. [Google Scholar] [CrossRef]
  29. Zhang, W.; Wang, Q.; Wu, Q.; Zhang, S.; Zhu, P.; Peng, C.; Huang, S.; Wang, B.; Zhang, H. The response of soil Olsen-P to the P budgets of three typical cropland soil types under long-term fertilization. PLoS ONE 2020, 15, e0230178. [Google Scholar] [CrossRef]
  30. Zhang, S.; Yang, X.; Hsu, L.; Liu, Y.; Wang, S.; White, J.R.; Shaheen, S.M.; Chen, Q.; Rinklebe, J. Soil acidification enhances the mobilization of phosphorus under anoxic conditions in an agricultural soil: Investigating the potential for loss of phosphorus to water and the associated environmental risk. Sci. Total Environ. 2021, 793, 148531. [Google Scholar] [CrossRef] [PubMed]
  31. Du, L.; Zhang, Z.; Chen, Y.; Wang, Y.; Zhou, C.; Yang, H.; Zhang, W. Heterogeneous impact of soil acidification on crop yield reduction and its regulatory variables: A global meta-analysis. Field Crops Res. 2024, 319, 109643. [Google Scholar] [CrossRef]
  32. Chen, Y.; Sun, T.T.; Qian, H.Y.; Fan, J.B.; He, Y.Q.; Sun, B. Nitrogen mineralization as a result of phosphorus supplementation in long-term phosphate deficient soil. Appl. Soil Ecol. 2016, 106, 24–32. [Google Scholar] [CrossRef]
  33. Grant, C.; Rose, L.J.; Van Zwieten, L.; Rose, M.T. Low pH of a high carbon gleysol contributes to nitrification inhibition resulting in low N2O soil emissions and limited effectiveness of nitrification inhibitors. Soil Syst. 2020, 4, 75. [Google Scholar]
  34. Miltner, A.; Zheng, T.; Liang, C.; Kästner, M. Microbial necromass as a source for soil organic matter formation-implications for soil processes. In Proceedings of the EGU General Assembly 2020, Online, 4–8 May 2020. EGU2020-13094. [Google Scholar]
  35. Li, Y.; Xiao, M.; Wei, L.; Liu, Q.; Zhu, Z.; Yuan, H.; Wu, J.; Yuan, J.; Wu, X.; Kuzyakov, Y.; et al. Bacterial necromass determines the response of mineral-associated organic matter to elevated CO2. Biol. Fert. Soils 2024, 60, 327–340. [Google Scholar]
  36. Camenzind, T.; Mason-Jones, K.; Mansour, I.; Rillig, M.C.; Lehmann, J. Formation of necromass-derived soil organic carbon determined by microbial death pathways. Nat. Geosci. 2023, 16, 115–122. [Google Scholar] [CrossRef]
  37. Zhang, Q.; Li, X.; Liu, J.; Liu, J.; Han, L.; Wang, X.; Liu, H.; Xu, M.; Yang, G.; Ren, C.; et al. The contribution of microbial necromass carbon to soil organic carbon in soil aggregates. Appl. Soil Ecol. 2023, 190, 104985. [Google Scholar] [CrossRef]
  38. Grant, C.; Bittman, S.; Montreal, M.; Plenchette, C.; Morel, C. Soil and fertilizer phosphorus: Effects on plant P supply and mycorrhizal development. Can. J. Plant Sci. 2005, 85, 3–14. [Google Scholar] [CrossRef]
  39. Jamir, T.I.; Sharma, Y.K.; Uchoi, A. Nutrient composition, uptake, yield and phosphorus use efficiency of black gram as influenced by soil amendments and phosphorus in acidic soil of nagaland. Agric. Sci. Dig. 2025, 45, 606–612. [Google Scholar]
  40. Forstner, S.J.; Wechselberger, V.; Stecher, S.; Müller, S.; Keiblinger, K.M.; Wanek, W.; Schleppi, P.; Gundersen, P.; Tatzber, M.; Gerzabek, M.H.; et al. Resistant soil microbial communities show signs of increasing phosphorus limitation in two temperate forests after long-term nitrogen addition. Front. For. Glob. Change 2019, 2, 73. [Google Scholar]
  41. Lidbury, I.D.E.A.; Scanlan, D.J.; Murphy, A.R.J.; Christie-Oleza, J.A.; Aguilo-Ferretjans, M.M.; Hitchcock, A.; Daniell, T.J. A widely distributed phosphate-insensitive phosphatase presents a route for rapid organophosphorus remineralization in the biosphere. Proc. Natl. Acad. Sci. USA 2022, 119, e2118122119. [Google Scholar]
  42. Lyu, L.; Liu, G.; Shang, Y.; Wen, Z.; Hou, J.; Song, K. Characterization of dissolved organic matter (DOM) in an urbanized watershed using spectroscopic analysis. Chemosphere 2021, 277, 130210. [Google Scholar] [CrossRef]
  43. Zhang, Z.J.; Liang, L.Y.; Huang, E. Phosphorus fertilization alters complexity of paddy soil dissolved organic matter. J. Integr. Agric. 2020, 19, 2301–2312. [Google Scholar] [CrossRef]
  44. Wang, X.; Han, Y.; Cao, Y.; Ni, Y.; Wang, D.; Luan, Y. The formation, stabilization mechanism, and environmental impacts of persistent free radicals in soil humic substances. Agronomy 2025, 15, 602. [Google Scholar] [CrossRef]
  45. Sierra, M.M.D.; Giovanela, M.; Parlanti, E.; Soriano-Sierra, E.J. Fluorescence fingerprint of fulvic and humic acids from varied origins as viewed by single-scan and excitation/emission matrix techniques. Chemosphere 2005, 58, 715–733. [Google Scholar] [CrossRef]
  46. Kang, S.; Xing, B. Humic acid fractionation upon sequential adsorption onto goethite. Langmuir 2008, 24, 2525–2531. [Google Scholar] [CrossRef]
  47. Liu, X.; Zhang, Y.; Wang, Z.; Chen, Z. The contribution of organic and chemical fertilizers on the pools and availability of phosphorus in agricultural soils based on a meta-analysis. Eur. J. Agron. 2024, 156, 127144. [Google Scholar] [CrossRef]
  48. Rawat, P.; Das, S.; Shankhdhar, D.; Shankhdhar, S.C. Phosphate-solubilizing microorganisms: Mechanism and their role in phosphate solubilization and uptake. J. Soil Sci. Plant Nutr. 2020, 21, 49–68. [Google Scholar] [CrossRef]
  49. Ali, J.; Li, Y.; Wang, X.; Zhao, J.; Xi, N.; Zhang, Z.; Xia, X. Climate-zone-dependent effect mechanism of humic acid and fulvic acid extracted from river sediments on aggregation behavior of graphene oxide. Sci. Total Environ. 2020, 721, 137682. [Google Scholar] [CrossRef] [PubMed]
  50. Chen, Y.; Senesi, N.; Schnitzer, M. Information provided on humic substances by E4/E6 ratios. Soil Sci. Soc. Am. J. 1977, 41, 352–358. [Google Scholar] [CrossRef]
  51. Dai, D.; Sun, H.; Huang, Y.; Gao, J.; Song, B.; Gao, H.; Lu, B.; Wang, S. Distribution patterns of humus and mineral composition in dark-brown, meadow, and paddy soils in northeast China. Agronomy 2025, 15, 2108. [Google Scholar] [CrossRef]
  52. Antelo, J.; Arce, F.; Avena, M.; Fiol, S.; López, R.; Macías, F. Adsorption of a soil humic acid at the surface of goethite and its competitive interaction with phosphate. Geoderma 2007, 138, 12–19. [Google Scholar] [CrossRef]
  53. Guardado, I.; Urrutia, O.; García-Mina, J.M. Size distribution, complexing capacity, and stability of phosphate–metal–humic complexes. J. Agric. Food Chem. 2006, 55, 408–413. [Google Scholar] [CrossRef]
  54. Cui, Y.; Moorhead, D.L.; Wang, X.; Xu, M.; Wang, X.; Wei, X.; Zhu, Z.; Ge, T.; Peng, S.; Zhu, B.; et al. Decreasing microbial phosphorus limitation increases soil carbon release. Geoderma 2022, 419, 115868. [Google Scholar] [CrossRef]
  55. Hill, H. Competitive sorption between glyphosate and inorganic phosphate on clay minerals and low organic matter soils. J. Radioanal. Nucl. Chem. 2001, 249, 385–390. [Google Scholar] [CrossRef]
  56. Almendros, G.; González-Pérez, J.A. Soil organic carbon sequestration mechanisms and the chemical nature of soil organic matter—A review. Sustainability 2025, 17, 6689. [Google Scholar] [CrossRef]
  57. Sinsabaugh, R.L. Phenol oxidase, peroxidase and organic matter dynamics of soil. Soil Biol. Biochem. 2010, 42, 391–404. [Google Scholar] [CrossRef]
  58. Wang, J.; Wei, Z.; Zhao, Y.; Xia, X.; Cui, J.; Li, S. The strategies for improving phosphorus-use efficiency in plant cell. Soil Sci. Plant Nutr. 2024, 71, 53–60. [Google Scholar] [CrossRef]
  59. Iwata, T.; Watanabe, A.; Iseki, M.; Watanabe, M.; Kandori, H. Strong donation of the hydrogen bond of tyrosine during photoactivation of the BLUF domain. J. Phys. Chem. Lett. 2011, 2, 1015–1019. [Google Scholar] [CrossRef]
  60. Li, T.; Shi, F.; Ju, Y.; Ding, Z. Facet-dependent adsorption of phosphate on hematite nanoparticles: Role of singly coordinated hydroxyl. Water 2023, 15, 4070. [Google Scholar] [CrossRef]
  61. Zhai, Y.; Zhang, L.; Gao, M.; Zhang, X.; Ruan, Z.; Zhao, Y.; Wei, C.; Ma, Y.; Chen, W. Effects of P fertilizer application on nitrogen, phosphorus, potassium content as well as acid phosphatase and polyphenol oxidase activities in flue-cured tobacco. Soil Fertil. Sci. China 2014, 2014, 53–57. [Google Scholar]
  62. Mori, T.; Ishizuka, S.; Konda, R.; Wicaksono, A.; Heriyanto, J.; Hardjono, A.; Ohta, S. Phosphorus addition reduced microbial respiration during the decomposition of Acacia mangium litter in South Sumatra, Indonesia. Tropics 2015, 24, 113–118. [Google Scholar] [CrossRef]
  63. Matsumoto, K.; Kawamura, K.; Uchida, M.; Shibata, Y. Radiocarbon content and stable carbon isotopic ratios of individual fatty acids in subsurface soil: Implication for selective microbial degradation and modification of soil organic matter. Geochem. J. 2007, 41, 483–492. [Google Scholar] [CrossRef]
  64. Aguiar, D.; Melo, V.F.; Nogueira, M.A.; Corrêa, R.S. The role of microbial mechanisms on the availability of soil phosphorus from fixed and structural mineral fractions. J. Soil Sci. Plant. Nut. 2024, 24, 8192–8207. [Google Scholar] [CrossRef]
  65. Gajda, M.; Gajda, Ł.; Kupka, T.; Kar, T. Local aromaticity in polyacenes manifested by individual proton and carbon shieldings: DFT mapping of aromaticity. Magn. Reson. Chem. 2019, 58, 145–153. [Google Scholar] [CrossRef]
  66. Wang, C.; Li, T.; Dippold, M.A.; Guggenberger, G.; Kuzyakov, Y.; Banfield, C.C.; Muhr, J.; Dorodnikov, M. Alternate wetting-drying had no preferences for rice P uptake but increased microbial P allocation to phospholipids: Evidence from dual 32P and 33P labeling. Soil Biol. Biochem. 2024, 191, 109359. [Google Scholar] [CrossRef]
  67. Olusegun, O.S. Nitrogen (N) and phosphorus (P) fertilizer application on maize (Zea mays L.) growth and yield at Ado-Ekiti, South-west, Nigeria. Afr. J. Agric. Res. 2015, 6, 22–29. [Google Scholar] [CrossRef]
  68. Lu, X.Q.; Hanna, J.V.; Johnson, W.D. Evidence of chemical pathways of humification: A study of aquatic humic substances heated at various temperatures. Chem. Geol. 2001, 177, 249–264. [Google Scholar] [CrossRef]
  69. Xing, B.; Ouyang, M.; Graham, N.; Yu, W. Enhancement of phosphate adsorption during mineral transformation of natural siderite induced by humic acid: Mechanism and application. Chem. Eng. J. 2020, 393, 124730. [Google Scholar] [CrossRef]
  70. Tipping, E.; Cooke, D. The effects of adsorbed humic substances on the surface charge of goethite (α-FeOOH) in freshwaters. Geochim. Cosmochim. Acta 1982, 46, 75–80. [Google Scholar] [CrossRef]
  71. Kundu, A.; Fingerhut, B.P.; Elsaesser, T. Hydration structure and dynamics of phosphoric acid and its anions—Ultrafast 2D-IR spectroscopy and ab initio molecular dynamics simulations. J. Chem. Phys 2024, 161, 084503. [Google Scholar] [CrossRef]
  72. Wang, G.; Dai, Y.; Yang, H.; Xiong, Q.; Wang, K.; Zhou, J.; Li, Y.; Wang, S. A review of recent advances in biomass pyrolysis. Energy Fuels 2020, 34, 15557–15578. [Google Scholar] [CrossRef]
Figure 1. 3D-EEM fluorescence spectra of DOM under four P fertilization rates. Note: Four P application treatments were applied: 0 (no P application, P0), 40 (low P application, LP), 80 (moderate P application, MP), and 120 (high P application, HP) kg P2O5 ha−1.
Agronomy 16 00469 g001
Figure 2. Influence of varying P application rates on CWSS, CHE, CHA, CHM, CHA/CFA ratio and E4/E6 ratio of HA alkali extract in maize field. Note: (a) shows the carbon content of different humus fractions (CWSS, CHE, CHA, and CHM) under different P application rates; (b) shows the E4/E6 ratio of HA alkali extract and CHA/CFA ratio under different P application rates. Lowercase letters (a–d) indicate significant differences among treatments for the same HS fraction (p < 0.05, one-way ANOVA followed by LSD test; n = 3).
Agronomy 16 00469 g002
Figure 3. (a) Influence of varying P application rates on different HM fractions in maize field; (b) influence of varying P application rates on the ratios of HMi/HMc and (HMi+HMc)/HM; and (c) influence of varying P application rates on the E4/E6 ratios of HMi and HMc. Note: Different lowercase letters indicated significant differences among treatments (one-way ANOVA followed by LSD test, p < 0.05). Treatments: P0 (0 kg P2O5 ha−1), LP (40 kg P2O5 ha−1), MP (80 kg P2O5 ha−1), and HP (120 kg P2O5 ha−1). Abbreviations: iron-bound humin (HMi), clay-bound humin (HMc), and residual humin (HMr).
Agronomy 16 00469 g003
Figure 4. Influence of varying P application rates on the FTIR spectra of HA. Note: Treatments are designated as follows: P0 (0 kg P2O5 ha−1), LP (40 kg P2O5 ha−1), MP (80 kg P2O5 ha−1), and HP (120 kg P2O5 ha−1).
Agronomy 16 00469 g004
Figure 5. Effect of varying P application rates on DTA curve of soil HA.
Agronomy 16 00469 g005
Figure 6. PCA and Pearson correlation analysis of key parameters in Albic soil maize fields under different P application rates. Note: (a) PCA score plot (dots) and loading plot (arrows) illustrated the distribution of treatments and the contribution of individual parameters; proximity of scores indicated similarity in parameter profiles. (b) Pearson correlation heatmap depicting pairwise correlations among 17 variables. Color scale represented Pearson’s r coefficient (−1 = blue/negative correlation; 1 = red/positive correlation). * p < 0.05; ** p < 0.01; **** p < 0.0001 (statistically significant); color intensity corresponded with correlation strength.
Agronomy 16 00469 g006aAgronomy 16 00469 g006b
Table 1. Effects of different P application rates on the fluorescence indices of DOM.
TreatmentsCDOM (mg L−1)FIBIXHIX
P00.270 ± 0.01 c1.91 ± 0.07 ab0.660 ± 0.01 b2.88 ± 0.25 c
LP0.290 ± 0.01 b2.00 ± 0.06 a0.660 ± 0.01 b6.52 ± 0.28 b
MP0.350 ± 0.02 a2.05 ± 0.09 a0.680 ± 0.01 a6.80 ± 0.31 ab
HP0.350 ± 0.01 a1.69 ± 0.08 c0.660 ± 0.01 b7.32 ± 0.26 a
Note: Four P application rates were implemented: 0 (no P application, P0), 40 (low P application, LP), 80 (moderate P application, MP), and 120 (high P application, HP) kg P2O5 ha−1; n = 3. Data were presented as means ± standard deviation (SD). Different lowercase letters in the same column denoted statistically significant differences among treatments (Duncan’s multiple range test, p < 0.05). Abbreviations: CDOM (C contents of dissolved organic matter), FI (fluorescence index), BIX (autochthonous contribution), HIX (humification index).
Table 2. Effects of different amounts of P application rates on soil nutrient properties and maize yield.
TreatmentsAlkali-Hydrolyzed N
(mg kg−1)
Available P
(mg kg−1)
Available K
(mg kg−1)
SOM
(g kg−1)
pH ValueMaize Yield
(kg ha−1)
P081.1 ± 3.2 d16.0 ± 1.1 d256.0 ± 12.1 a9.8 ± 0.3 c 6.26 ± 0.05 a11,571.6 ± 227 d
LP88.0 ± 2.8 c19.4 ± 1.3 c295.0 ± 15.3 b11.7 ± 0.5 b 6.18 ± 0.04 b11,858.1± 195 c
MP98.4 ± 2.1 b20.6 ± 0.9 b172.4 ± 10.7 c 14.8 ± 0.4 a6.11 ± 0.03 c12,257.1 ± 318 a
HP100.0 ± 1.9 a23.3 ± 1.2 a149.6 ± 11.5 d 13.3 ± 0.6 b5.68 ± 0.06 d12,140.6 ± 274 b
Note: Lowercase letters (a–d) indicated significant differences among treatments for the same HS fraction (p < 0.05, one-way ANOVA followed by LSD test; n = 3).
Table 3. Influence of varying P application rates on the atomic molar ratios of HA.
TreatmentsH/C RatioC/N RatioO/C Ratio
P02.20 ± 0.07 a8.32 ± 0.45 ab0.770 ± 0.03 c
LP2.06 ± 0.05 ab7.44 ± 0.30 c0.770 ± 0.02 c
MP1.72 ± 0.03 c8.70 ± 0.39 a0.880 ± 0.02 b
HP2.00 ± 0.06 b9.13 ± 0.48 a0.850 ± 0.01 a
Note: Treatments: P0 (0 kg P2O5 ha−1), LP (40 kg P2O5 ha−1), MP (80 kg P2O5 ha−1), and HP (120 kg P2O5 ha−1). Different lowercase letters in the same column indicated significant differences among treatments (p < 0.05, Duncan’s multiple range test).
Table 4. The relative intensities (% of total area) of FTIR absorption peaks in HA under different P application rates (cm−1).
Treatments3367–34122923–2927 a2856–2859 b1717–1720 c1631–1638 d1358–13881205–12421033–1045(a + b)/c(a + b)/d
P029.0 6.40 2.10 5.00 15.2 9.30 6.70 26.2 1.70 0.560
LP23.3 7.60 1.50 4.70 16.4 11.3 11.4 23.7 1.94 0.560
MP37.3 5.10 2.90 3.40 17.5 9.00 6.40 18.3 2.35 0.460
HP37.2 5.603.00 1.40 18.2 10.8 4.30 19.4 6.14 0.470
Note: Treatments were designated as follows: P0 (0 kg P2O5 ha−1), LP (40 kg P2O5 ha−1), MP (80 kg P2O5 ha−1), and HP (120 kg P2O5 ha−1). The labels a–d correspond to the characteristic FTIR absorption peaks of HA: (a) 2923–2927 cm−1, C–H stretching vibration of aliphatic –CH2 groups; (b) 2856–2859 cm−1, C–H stretching vibration of aliphatic –CH3 groups; (c) 1717–1720 cm−1, C=O stretching vibration of carboxyl, aldehyde and ester groups; (d) 1631–1638 cm−1, C=C stretching vibration of aromatic/olefinic compounds and C=O vibration of amide I, ketones and quinones.
Table 5. Effect of varying P application rates on heat release and weight loss of soil HA.
DTA (mJ mg−1) Weight Lost (mg)
TreatmentsEndothermic HeatExothermic HeatH/MEndothermic HeatExothermic HeatH/M
LowMediumHigh LowMediumHigh
P02.907.876.050.770 0.2502.666.052.27
LP6.9113.913.30.950 2.475.352.160.40
MP2.6916.019.11.190.1703.784.541.20
HP11.2 4.888.641.77 2.543.505.561.59
Disclaimer/Publisher’s Note: The statements, opinions and data contained in all publications are solely those of the individual author(s) and contributor(s) and not of MDPI and/or the editor(s). MDPI and/or the editor(s) disclaim responsibility for any injury to people or property resulting from any ideas, methods, instructions or products referred to in the content.