Article

Optimizing Diversified Crop Rotation Strategies Under Temperature and Precipitation Change Scenarios in a Typical Agro-Pastoral Ecotone Using the APSIM Model


1
China Meteorological Administration Meteorological Observation Centre, Beijing 100081, China
2
Institute of Bio- and Geosciences, Agrosphere (IBG-3), Forschungszentrum Jülich GmbH, 52428 Jülich, Germany
3
State Key Laboratory of Environment Characteristics and Effects for Near-Space, Beijing Institute of Technology, Beijing 100081, China
4
Institute of Applied Ecology, Chinese Academy of Sciences, Shenyang 110016, China
*
Author to whom correspondence should be addressed.
Agronomy 2026, 16(3), 381; https://doi.org/10.3390/agronomy16030381

Submission received: 29 December 2025 / Revised: 27 January 2026 / Accepted: 3 February 2026 / Published: 4 February 2026
(This article belongs to the Special Issue Adaptations and Responses of Cropping Systems to Climate Change)

Abstract

Future climate change poses unprecedented challenges to agricultural production worldwide. Therefore, designing region-specific rotation patterns is crucial for achieving synergies among multiple objectives, including agricultural productivity and ecological conservation. Based on a long-term field experiment in the Northern Agro-pastoral Ecotone of China, we calibrated and validated the Agricultural Production Systems Simulator (APSIM) and simulated rotation patterns involving four representative crops under eight climate scenarios, including warming, extreme precipitation, and combined temperature–precipitation changes. Analysis combined with carbon footprint assessment was employed to quantitatively evaluate the productivity, ecological benefits, and economic returns of different rotation patterns. The results showed that warming generally reduced crop productivity and economic returns, weakened soil carbon sequestration, and increased net carbon emissions across rotation patterns. Increasing intensity of extreme precipitation further constrained the capacity of rotation patterns to enhance yields, improve incomes, and reduce carbon emissions. Under scenarios of warming and extreme precipitation, the faba bean–oat rotation pattern was found to be the most effective for increasing crop yields, while the faba bean–potato rotation is beneficial for enhancing the incomes from local agriculture. The potato–faba bean rotation pattern was most effective for environmental sustainability due to low net carbon emissions. The findings provide a scientific basis for developing diversified planting strategies with synergistic multi-objectives in the Northern Agro-pastoral Ecotone of China, contributing to food security and sustainable agricultural development under a changing climate focused on changes in temperature and precipitation. Nevertheless, the potential effects of rising atmospheric CO2 concentrations may be incorporated in future studies.

1. Introduction

The global climate system is undergoing significant changes, mainly characterized by rising temperatures and a clear increase in the frequency and intensity of extreme climate events [1]. According to the Sixth Assessment Report of the IPCC, nearly 10% of land that is currently suitable for the cultivation of major food crops is projected to become unsuitable by the middle of this century [2]. The Northern Agro-pastoral Ecotone of China is of exceptional importance because of its geographic position and ecological functions, and it plays a vital role in ensuring national food security [3]. Nevertheless, this region has long faced challenges related to simplified cropping patterns, low and unstable cropland productivity, and the degradation of ecosystem services [4,5]. Over the past five decades, local temperatures have shown a continuous upward trend, with an average increase of 0.4 °C per decade [6]. Although total precipitation has remained relatively stable, the occurrence of extreme rainfall events has increased noticeably [7]. Consequently, a key challenge for sustainable agricultural development in this region is how to design crop production patterns that are well adapted to their specific natural resources, climate conditions, and farming practices under ongoing climate change.
In recent years, growing evidence of global climate change has highlighted the necessity to adopt cropping systems that require fewer resources and show greater resistance to damage from extreme weather events [8,9]. Crop rotation provides an effective approach to improve both the agronomic and socio-economic performance of agricultural production, while allowing better adjustment to changing climatic, biological, and soil conditions [10,11]. Crop rotation offers multiple advantages, including increased and more stable productivity, improved soil nutrient cycling, a lower carbon footprint of farmland, and the alleviation of continuous cropping constraints, thereby emerging as a practical and effective innovative cropping pattern [12,13,14,15]. Accordingly, increasing research efforts have focused on identifying suitable crop rotation patterns for different agroecological regions, particularly systems that integrate cereals, legumes, and forage crops [16,17,18]. In parallel, studies examining the effects of climate change on rotation systems have indicated that cropping patterns are likely to undergo substantial changes under future climatic conditions [8,19]. At the macro scale, climate change is driving a northward shift in suitable cultivation areas and crop varieties within rotation systems, while at the micro scale, rising temperatures accelerate crop growth and development, affecting yields and promoting changes in crop species composition [20]. Nevertheless, under future climate change scenarios, information on yield variability, carbon emissions, and economic returns of diversified crop rotations remains extremely limited, particularly for the Northern Agro-pastoral Ecotone of China.
Crop system models are widely used to simulate the responses of different crops to variations in environmental, management, and soil conditions, including those associated with climate change [21,22,23]. These models provide powerful tools for simulating and evaluating the effects of key drivers of crop performance, such as climate and soil factors, within rotation systems. The Agricultural Production Systems Simulator (APSIM) is among the most extensively applied process-based models for simulating crop production, risk management, and crop adaptation across a range of cropping systems. Based on a soil-centered framework, APSIM effectively represents cropping system dynamics by simulating crop growth, management practices, yields, and their interactions with water and temperature, while also supporting flexible management options and informed decision-making [24]. By explicitly linking crop growth processes with soil water dynamics, APSIM has been successfully applied to predict the productivity of a wide range of crop types, including maize, wheat, soybean, and other major agronomic crops [25,26,27,28]. However, studies that simulate and validate diversified crop rotation systems incorporating multiple crop species and fallow periods under climate change conditions remain limited [22,23,29,30].
In this study, using a calibrated and validated APSIM model, we aimed to quantify changes in crop yield, ecological function, and economic performance across 228 crop rotation patterns under eight climate change scenarios. The overall objective was to identify optimal diversified rotation patterns for the Northern Agro-pastoral Ecotone of China that enhance crop productivity. The specific objectives were to: (i) calibrate and validate APSIM model parameters across rotation patterns; (ii) evaluate the productivity, ecological, and economic outcomes of different rotation patterns; (iii) quantify the relationships among crop yield, carbon emissions, economic returns, and climate change.

2. Materials and Methods

2.1. Study Area Description

A long-term crop rotation experiment was conducted at the Zhangbei Oat Science and Technology Backyard (41.34° N, 114.91° E) in Hebei Province, which is located at the margin of the agro-pastoral ecotone during 2017–2021. The site experiences an average growing-season temperature of 16.2 °C (mainly June–September) and annual precipitation of 296.0 mm, and primarily supports drought-tolerant crops such as cereals, legumes, potatoes, and rapeseed. The resulting data were used for calibration and validation of the APSIM model. Experimental plots were arranged using a randomized complete block design, with each plot covering an area of 24 m2 (2.4 m × 10.0 m). The field experiment included the following 11 rotation treatments: oat–potato, oat–flax, oat–faba bean, oat–potato–faba bean, oat–flax–faba bean, oat–potato–flax–faba bean, oat–potato–flax–fallow, oat–flax–potato–faba bean, oat–flax–potato–fallow, oat–potato–fallow–flax–faba bean, and oat–flax–fallow–potato–faba bean, each replicated four times. Flax was grown for oil production, and potatoes were propagated using tubers for direct consumption. Crop management practices are summarized in Table A1. Crop yields were measured at physiological maturity. Yields of oat and flax were determined by harvesting a 1 m2 quadrat from each plot, whereas yields of faba bean and potato were obtained by harvesting two-row sections per plot.

2.2. Model Overview and Parameterization

APSIM version 7.10 was used in this study. The model framework consists of four main modules [24]: (1) a crop component that simulates key growth and development processes for more than 30 crop types, including faba bean, potato, and oat; (2) a soil component that represents the movement and transformation of soil carbon, nitrogen, and water; (3) a management component that enables the specification of field practices such as sowing, harvesting, irrigation, and fertilization, as well as the use of conditional management rules; and (4) a central engine that links and coordinates these components.

2.2.1. Model Database Development

The meteorological parameters consisted of daily solar radiation (MJ/m2), maximum and minimum temperature (°C), and precipitation (mm), together with the longitude and latitude of the simulation site, all of which were obtained from the China Meteorological Data Service Center (https://data.cma.cn/ accessed on 2 May 2025). Key soil parameters included the lower limit (LL15), saturated water content (SAT), drained upper limit (DUL), and soil bulk density (BD). Soil bulk density was measured directly in the field, whereas the remaining soil parameters were obtained from published sources [31]. Crop management information covered cultivar characteristics, phenology, yield, sowing date, row spacing, and harvest details for the four crops, all of which were derived from field observations. Table 1 presents the original parameter values used in the APSIM crop modules.

2.2.2. Model Calibration and Validation

Model calibration was performed using a trial-and-error approach and subsequently validated against yield data from the five-year crop rotation experiment (Table A2). Growing degree days for key crop development stages were derived from observed phenological records and daily air temperature data. The performance of the model simulations was evaluated using the root mean squared error (RMSE), normalized root mean squared error (NRMSE), and mean absolute error (MAE), which were calculated as follows:
RMSE   =   1 n i = 1 n ( Y obs Y sim ) 2
NRMSE = 1 n i = 1 n ( Y obs Y sim ) 2 Y mean
MAE = | Y sim Y obs | n
where Yobs represents the observed crop yield, Ysim represents the simulated crop yield, Ymean represents the mean of the observed crop yields, and n represents the sample size. Lower values of RMSE and NRMSE correspond to smaller average differences between simulated and observed crop yields, indicating higher simulation accuracy. Likewise, a lower MAE reflects a smaller deviation of the simulated mean from the observed mean, also indicating improved model accuracy.

2.3. Design of Diversified Crop Rotation Patterns

This study generated systematic permutations of four crops (oat, potato, faba bean, and flax) and fallow across a 10-year sequence from 2012 to 2021. To reflect local farming practices, a constraint was applied that limited fallow to no more than two occurrences within each decade, resulting in a total of 228 distinct rotation patterns. These patterns were classified into five categories: two-crop rotations, three-crop rotations, four-crop rotations, three-crop rotations with fallow, and four-crop rotations with fallow.

2.4. Regional Climate Change Trends

The Sixth Assessment Report of the IPCC projects that insufficient reductions in global greenhouse gas emissions in the coming decades could result in a global temperature increase of 2 °C to 4 °C during this century, with serious implications for global food production. Based on this projection, a control treatment (CK) along with three warming treatments were set up: T1, representing a plausible near-term of 2 °C increase; T2, corresponding to a 4 °C increase under high-emission scenarios; and T3, denoting a 6 °C increment as an extreme scenario. These elevated temperatures were maintained throughout the year. Analysis of surface meteorological records from Zhangbei County, Hebei Province, for the period 2012–2021 showed that average precipitation from July to September was 88.9 mm, with a maximum of 242.3 mm, a minimum of 22.0 mm, and a maximum single-day rainfall of 57.6 mm. On this basis, two extreme precipitation treatments were defined, with a monthly total of 300 mm and maximum single-event precipitation set as E1 (150 mm) and E2 (300 mm), reflecting plausible future intensification of precipitation extremes. Total precipitation was evenly distributed over 30 days with identical controlled intervals. These extreme precipitation simulations were applied during July to September each year, while precipitation in other months remained unchanged. Furthermore, two combined treatments were formulated. The first, namely T1E1, entailed a 2 °C warming in tandem with a maximum single-event precipitation of 150 mm, representing a plausible near-term climate scenario. The second, named T1E2, involved a 2 °C warming coupled with a maximum single-event precipitation of 300 mm to assess warming–precipitation interactions under more extreme precipitation conditions.
Based on the eight climate change scenarios described above, meteorological data from Zhangbei County, from 2012 to 2021 were processed for model simulations. For each of the 228 rotation patterns, a 10-year yield simulation was conducted from 2012 to 2021, with the crop sequence in each rotation strictly following the order defined by its system name until the full 10-year simulation period was completed.

2.5. Evaluation Method for Crop Rotation Patterns

2.5.1. Energy Equivalent Yield Calculation

Because different crops produce non-equivalent products (e.g., grains, tubers, and oilseeds) with substantial differences in water content and edible fraction, crop yields were converted into energy equivalent yield to improve comparability among diversified rotation patterns, which were calculated as follows:
E   =   10 3 Y · e
where E represents the energy equivalent yield, Y represents the crop yield per unit area, and e represents the energy content per unit mass, calculated as 15.9 KJ/g for oat, 4.2 KJ/g for potato, 16.7 KJ/g for faba bean, and 16.3 KJ/g for flax [32].

2.5.2. Carbon Footprint Assessment

The life cycle assessment (LCA) approach was used to evaluate the carbon footprint associated with agricultural inputs across different rotation patterns. The carbon footprint was defined as the sum of carbon emissions resulting from various inputs in the agricultural production process, such as fertilizers and pesticides, and was calculated as follows [33,34]:
CF a   =   CF i =   G i × δ i
where CFa represents the total carbon emissions from agricultural production, CFi represents the carbon emissions associated with individual agricultural inputs in the production process, including pesticides, fertilizers, and machinery, Gi represents the application rate of each carbon source, and δi represents the corresponding carbon emission coefficient for each source (Table 2).
Soil N2O emissions, including both direct and indirect components, were mainly attributed to nitrogen fertilizer application and were calculated as follows [37]:
CF N 2 O = DCF N 2 O + GCF N 2 O + LCF N 2 O
DCF N 2 O = N × F 1 × 44 / 28 × 298
GCF N 2 O = N × F G × F 2 × 44 / 28 × 298
LCF N 2 O = N × F L × F 3 × 44 / 28 × 298
where DCFN2O represents the direct N2O emissions from nitrogen fertilizer application, GCFN2O represents the indirect emissions from nitrogen deposition, and LCFN2O represents the indirect emissions resulting from nitrogen leaching. F1, F2, and F3 represent the emission factors for the different N2O emission pathways, with values of 0.01, 0.01, and 0.0075, respectively. FG and FL represent the fractions of applied fertilizer nitrogen lost through NH3 volatilization and soil leaching, with values of 0.1 kg/kg and 0.3 kg/kg, respectively. The factor 44/28 was used to convert N2O to N2O–N, and 298 was used to convert N2O emissions to CO2 equivalents. All emission factors were derived from the 2006 IPCC Guidelines for National Greenhouse Gas Inventories.
The carbon footprint per unit area of crop production was calculated as follows [37]:
CF =   CF a + CF N 2 O

2.5.3. Calculation of Net Carbon Emissions

The soil organic carbon stock was calculated as follows:
SOCstock = SOCcontent × BD × H × 100
ΔSOC = SOCstock-tSOCstock-0
where SOCstock represents the soil organic carbon stock, BD represents the soil bulk density, H represents the soil layer thickness, and 100 represents a unit conversion factor; SOCstock-0, SOCstock-t, and ΔSOC represent the initial soil organic carbon stock, the soil organic carbon stock after 10 years of rotation, and the soil carbon sequestration, respectively.
The net carbon emissions were calculated as follows:
C = CF − ΔSOC

2.5.4. Calculation of Ecological Economic Benefits

Total income was calculated based on the rotational yield and purchase price of each crop. Total expenditure was determined according to the input expenses incurred during agricultural production, including fertilizers, seeds, pesticides, and labor. The net income was calculated as follows:
I n e t   =   I t o t a l E t o t a l
where Inet, Itotal, and Etotal represent the net income, total income, and total expenditure for each rotation pattern, respectively.
According to statistics from China Carbon Emission Trading Network (http://www.tanpaifang.com accessed on 15 July 2023), the current average price in China’s domestic carbon trading market is 51.66 CNY per metric ton of carbon. Based on this value, the comprehensive benefit was calculated as follows:
E c   =   C × P c
B c o m = I n e t E c
where Ec represents the carbon emission cost for each rotation pattern, Pc represents the carbon trading price; and Bcom represents the comprehensive benefit.

3. Results

3.1. APSIM Simulation Calibration

Overall, the NRMSE values between simulated and measured yields for all four crops within the rotation patterns remained below 20%, indicating good agreement between simulations and observations (Table 3). For the oat yield simulation, the RMSE, NRMSE and MAE values were 107.2 kg/hm2, 4.3%, and 78.1 kg/hm2, respectively. For the potato yield simulation, these values were 947.3 kg/hm2, 15.4%, and 925.1 kg/hm2, respectively. For faba bean yield simulation, RMSE was 336.1 kg/hm2, NRMSE being 11.8%, and the MAE modeled to be 279.4 kg/hm2. Finally, in the flax yield simulation, values of 101.8 kg/hm2, 7.9%, and 89.7 kg/hm2 were obtained.

3.2. Comprehensive Performance Evaluation of Different Rotation Patterns

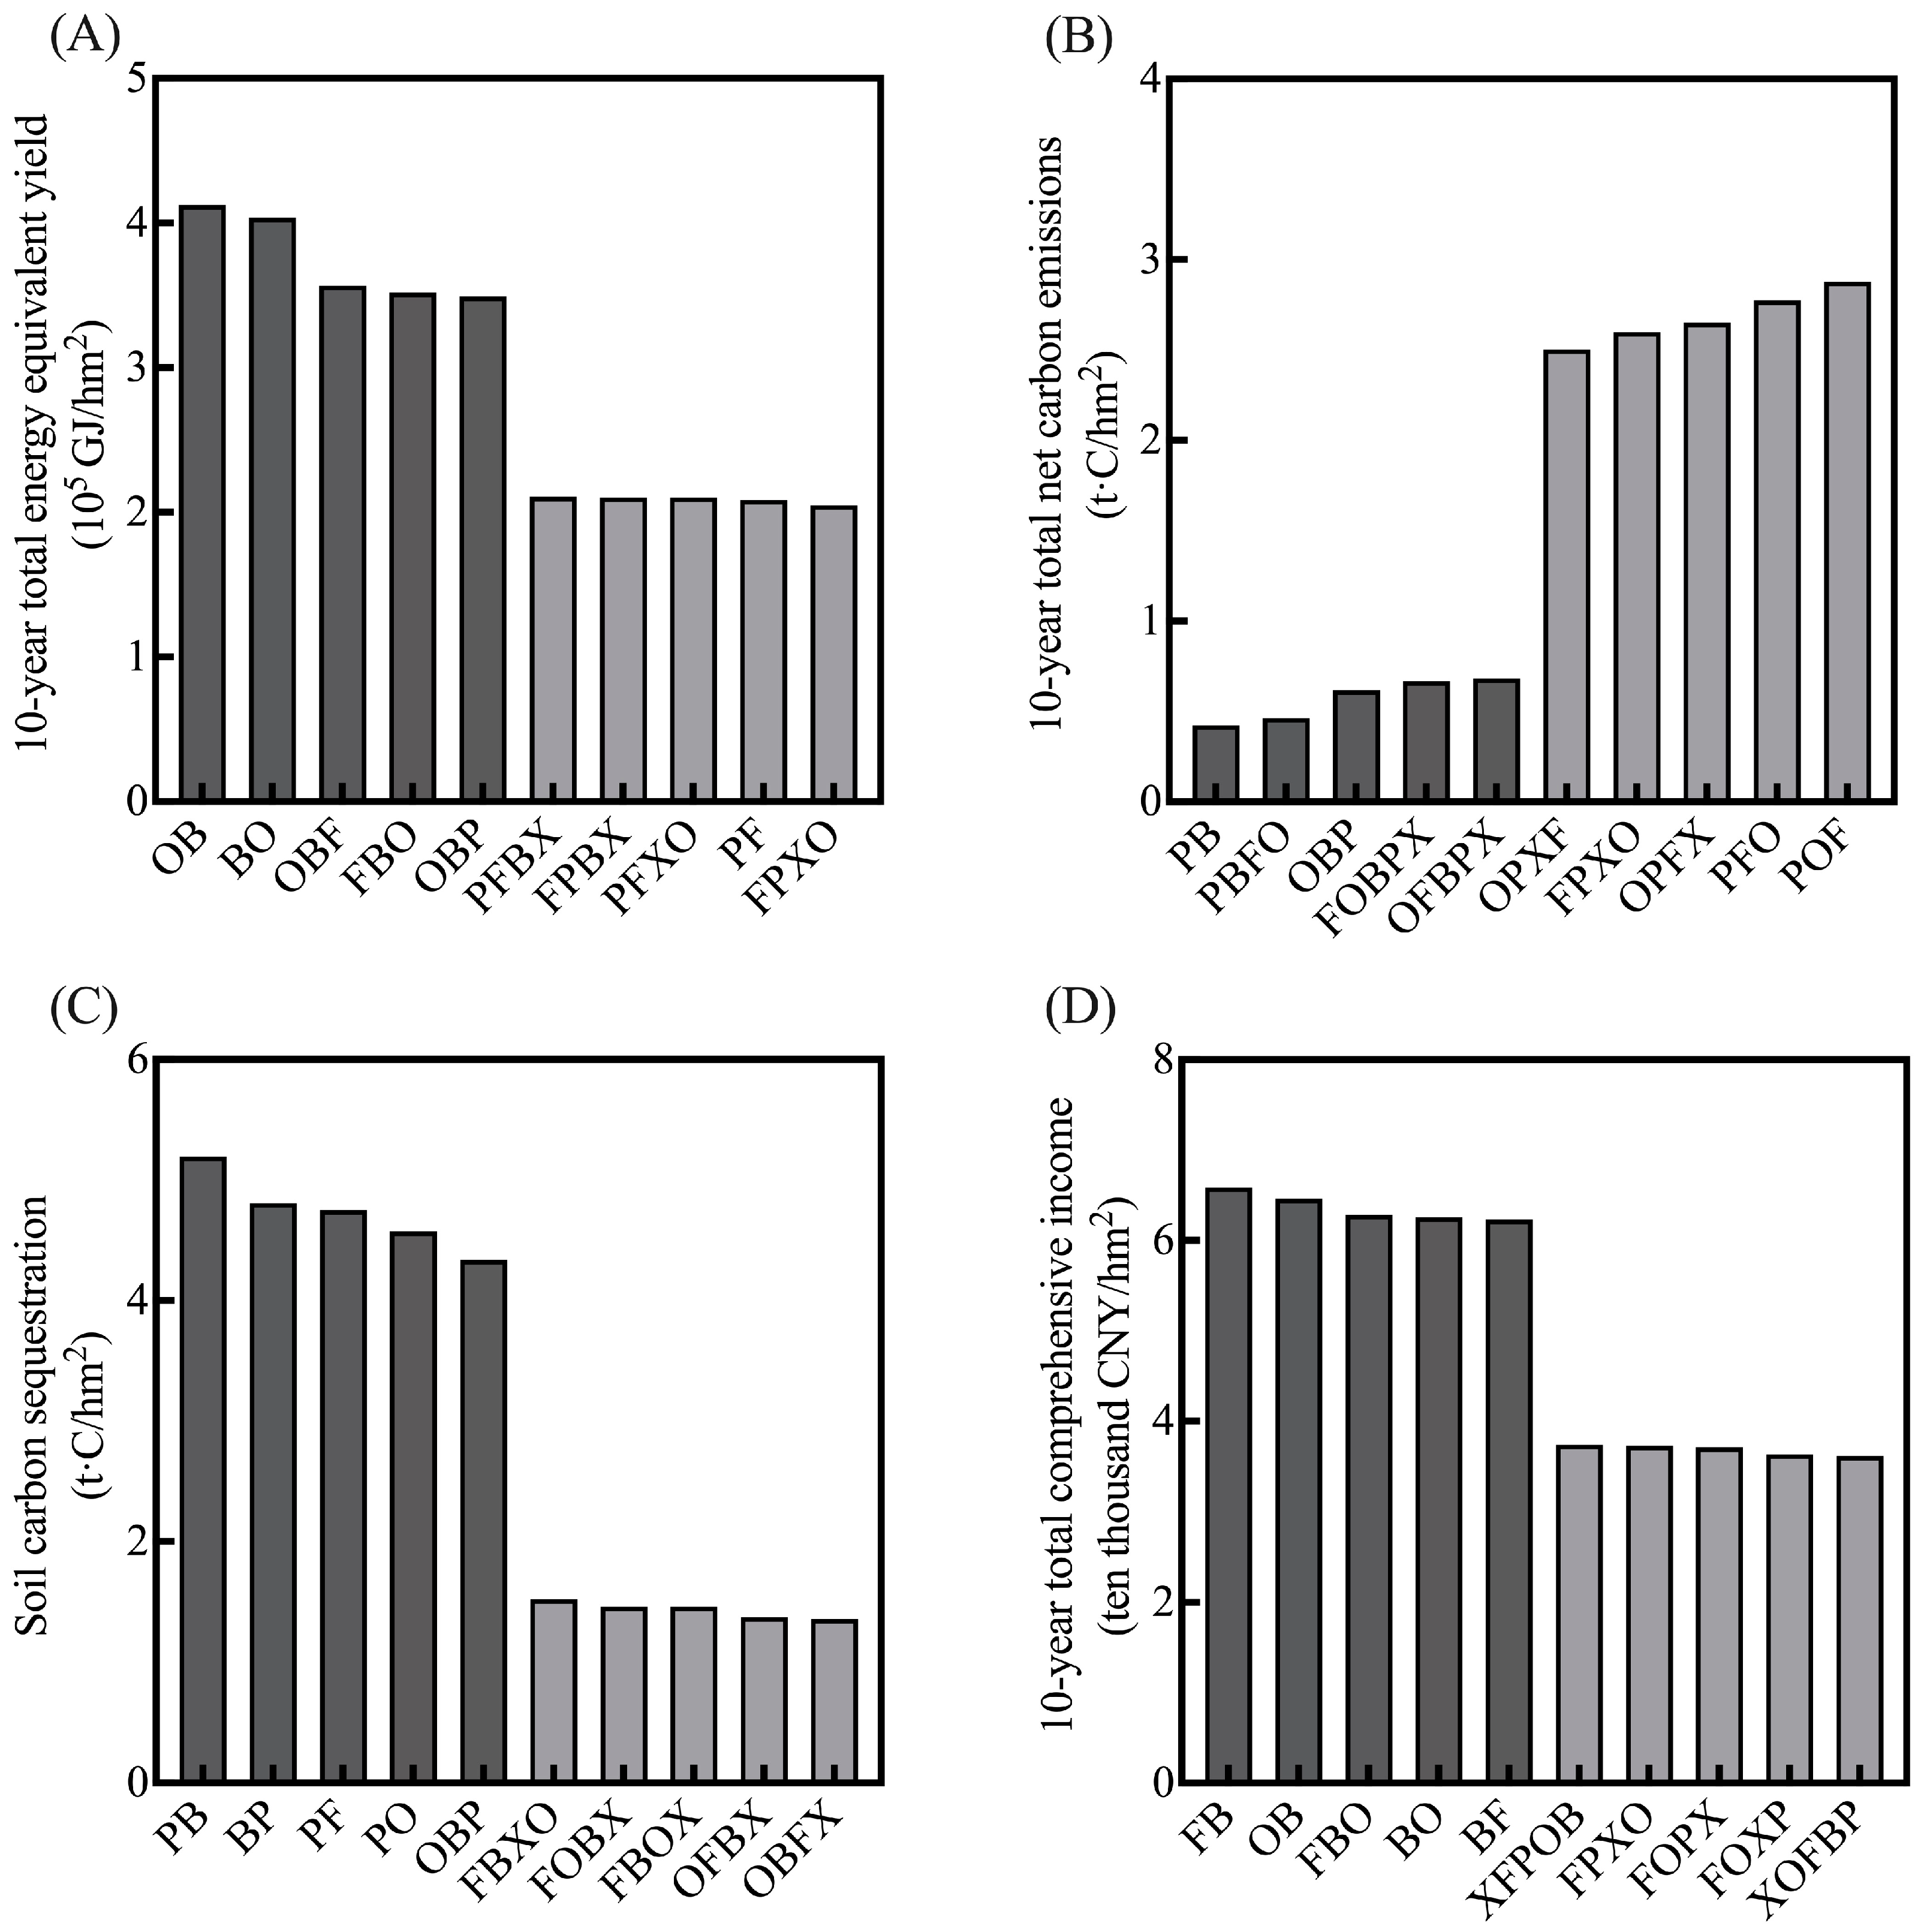
Following the calibration and evaluation of the APSIM model, 10-year yields of 228 rotation patterns involving four crops were simulated using local meteorological data from 2012 to 2021. A comparative analysis of energy equivalent yield, net carbon emissions, soil carbon sequestration, and comprehensive benefit is shown in Figure 1A. The results indicated that the OB, BO, and OBF rotation patterns achieved relatively high total 10-year energy equivalent yields of 4.1 × 10⁵, 4.0 × 10⁵, and 3.6 × 10⁵ GJ/hm2, respectively. Compared with FPXO, which showed the lowest yield, these values represent increases of 101.4%, 97.0%, and 74.1%, respectively.
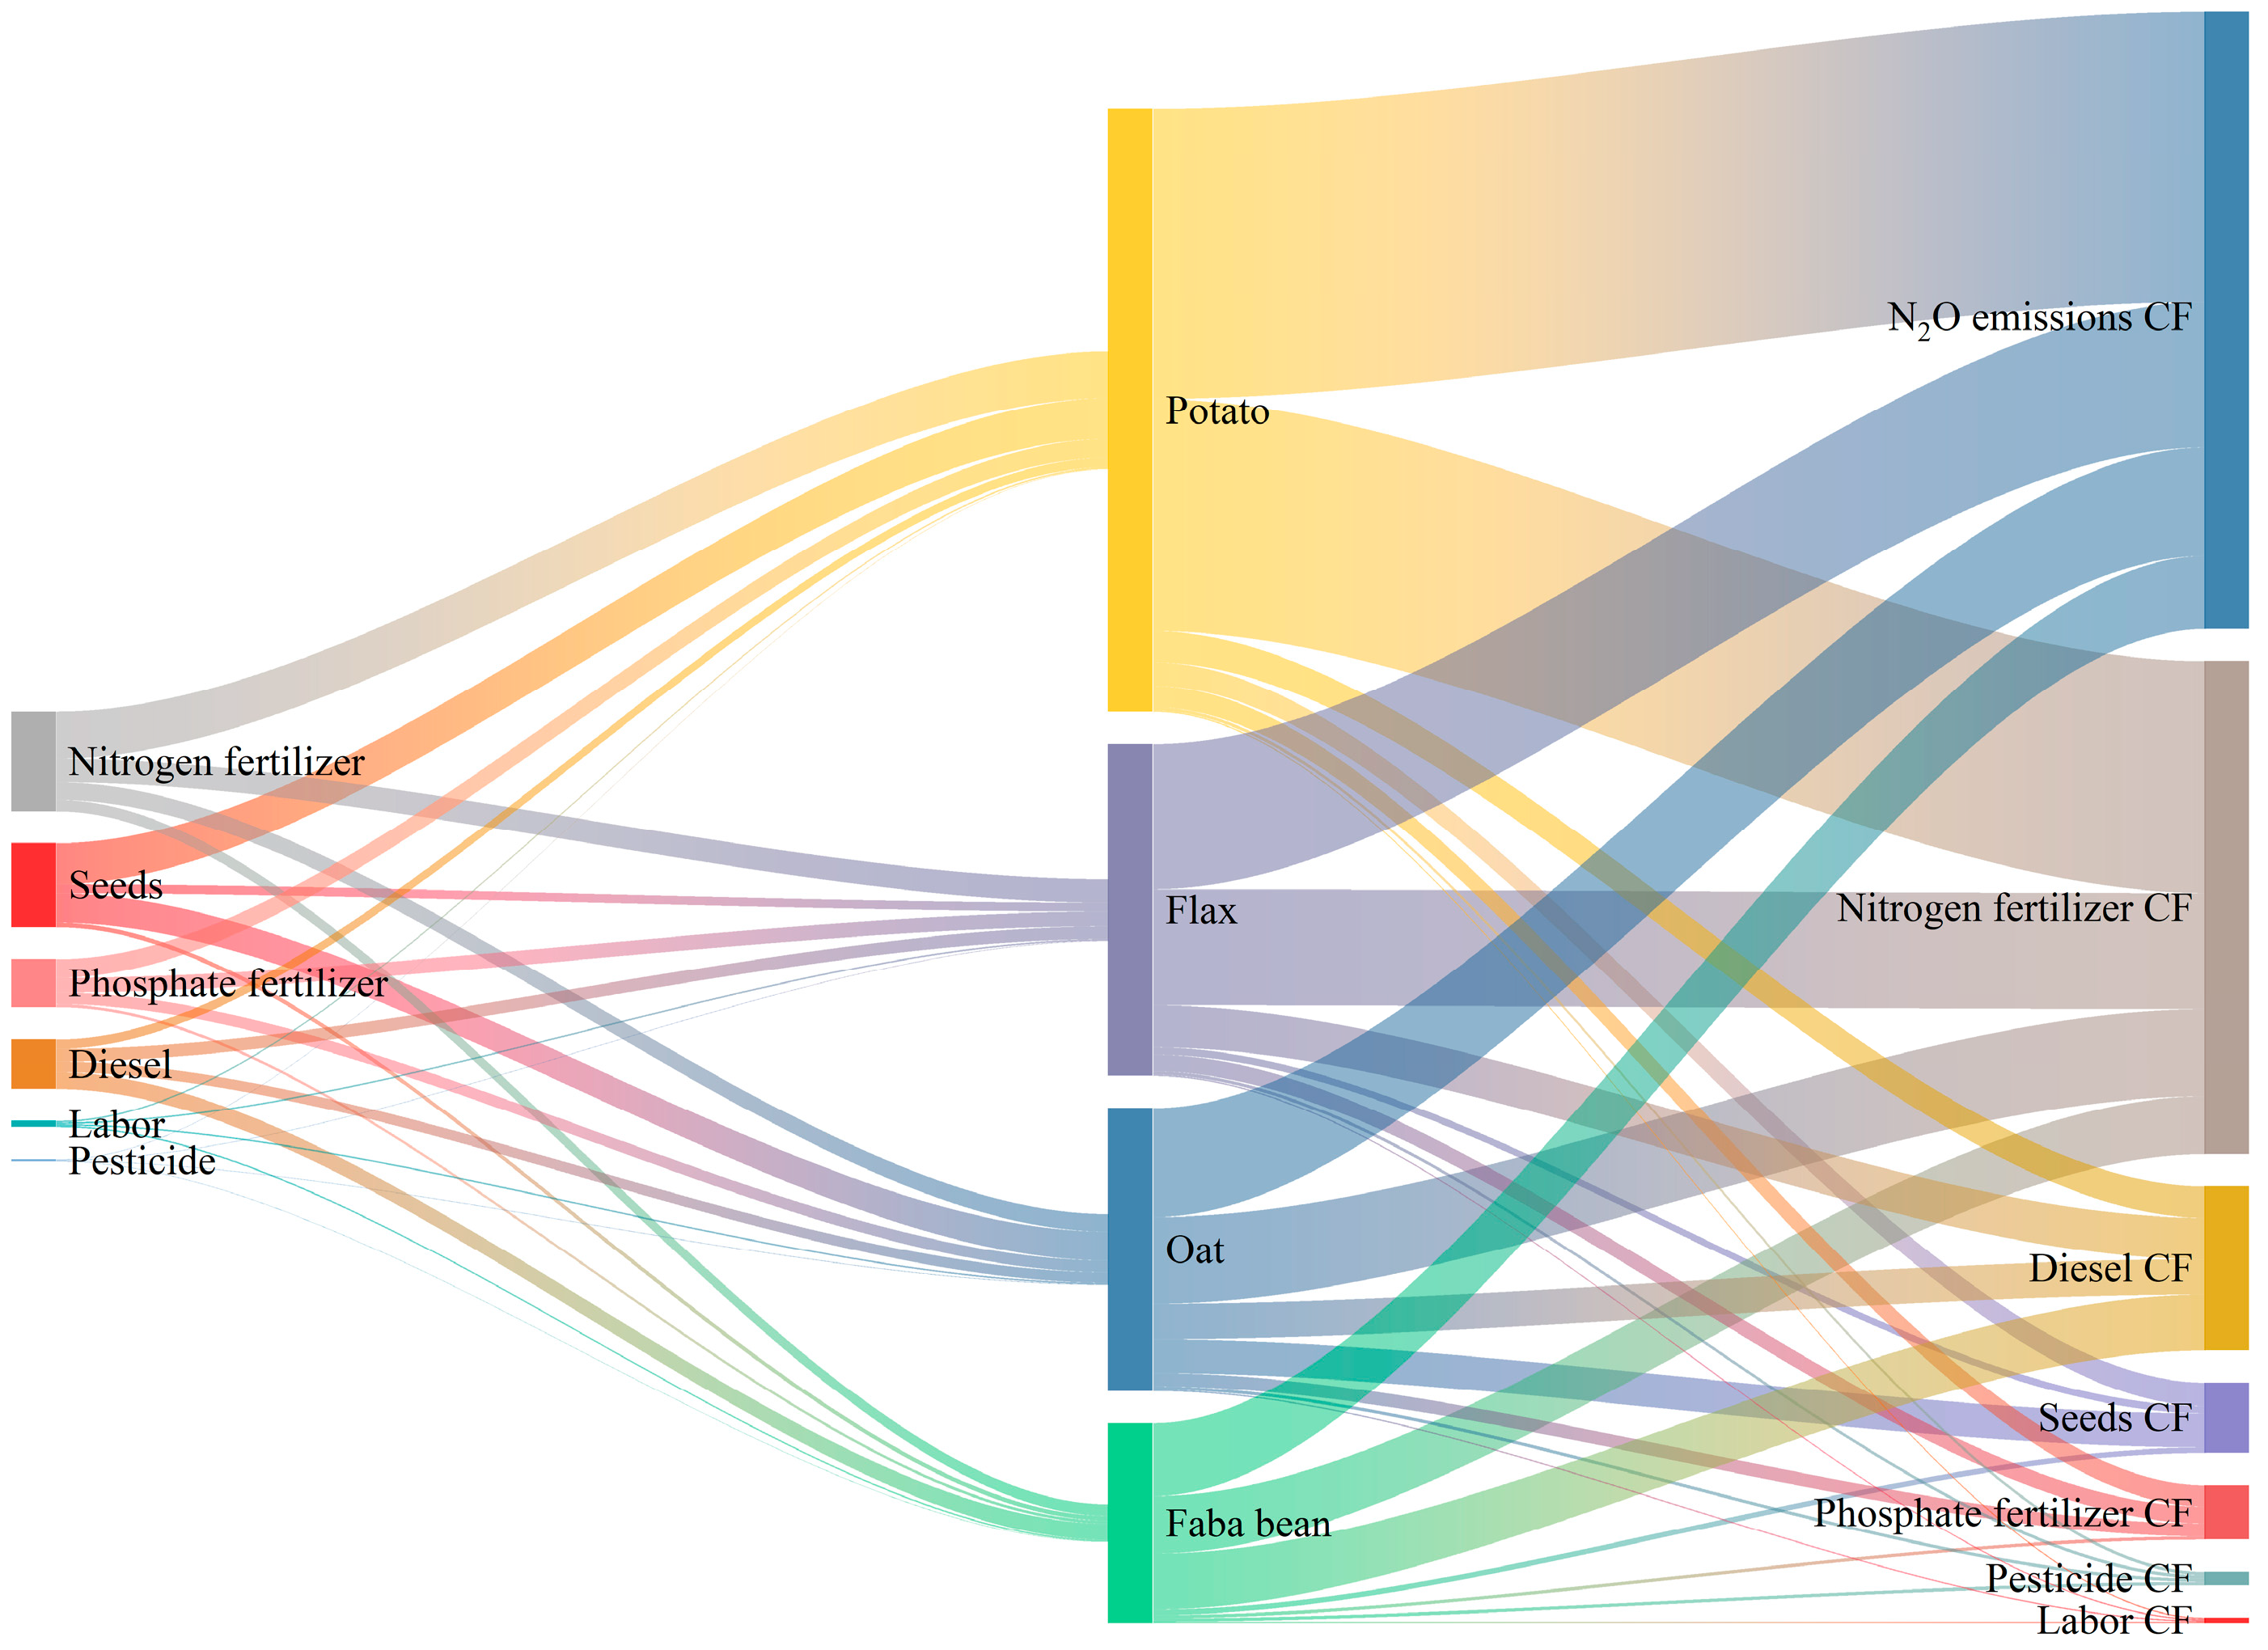
Based on agricultural inputs and associated N2O emissions within the crop rotation patterns, the annual carbon footprints of oat, potato, faba bean, and flax were calculated as 1451.7, 3095.3, 1025.1, and 1701.3 kg·CO2/hm2, respectively (Figure 2). Among these crops, potato exhibited the highest annual carbon footprint, which was three times greater than that of faba bean. This difference was mainly attributed to the higher application rates of nitrogen and phosphorus fertilizers for potato production, reaching approximately 336 kg/hm2. The intensive use of nitrogen fertilizer led to substantial N2O emissions from cropland, making this a major contributor to the relatively high 10-year total carbon footprint of rotation patterns that included potato.
Among the 228 rotation patterns, PB, PBFO, and OBP exhibited relatively low 10-year net carbon emissions (Figure 1B), with values of 0.4, 0.5, and 0.6 t·C/hm2, respectively. Compared with POF, which showed the highest net carbon emission, these values correspond to reductions of 85.3%, 83.9%, and 78.5%, respectively. The soil organic carbon stock in the 0–10 cm soil layer varied markedly among the different rotation patterns. Among all patterns, PB, BP, and PF achieved relatively high levels of carbon sequestration, with values of 5.2, 4.8, and 4.8 t·C/hm2, respectively (Figure 1C). These values were 2.8, 2.5, and 2.5 times higher than that of OBFX, which exhibited the lowest soil organic carbon stock.
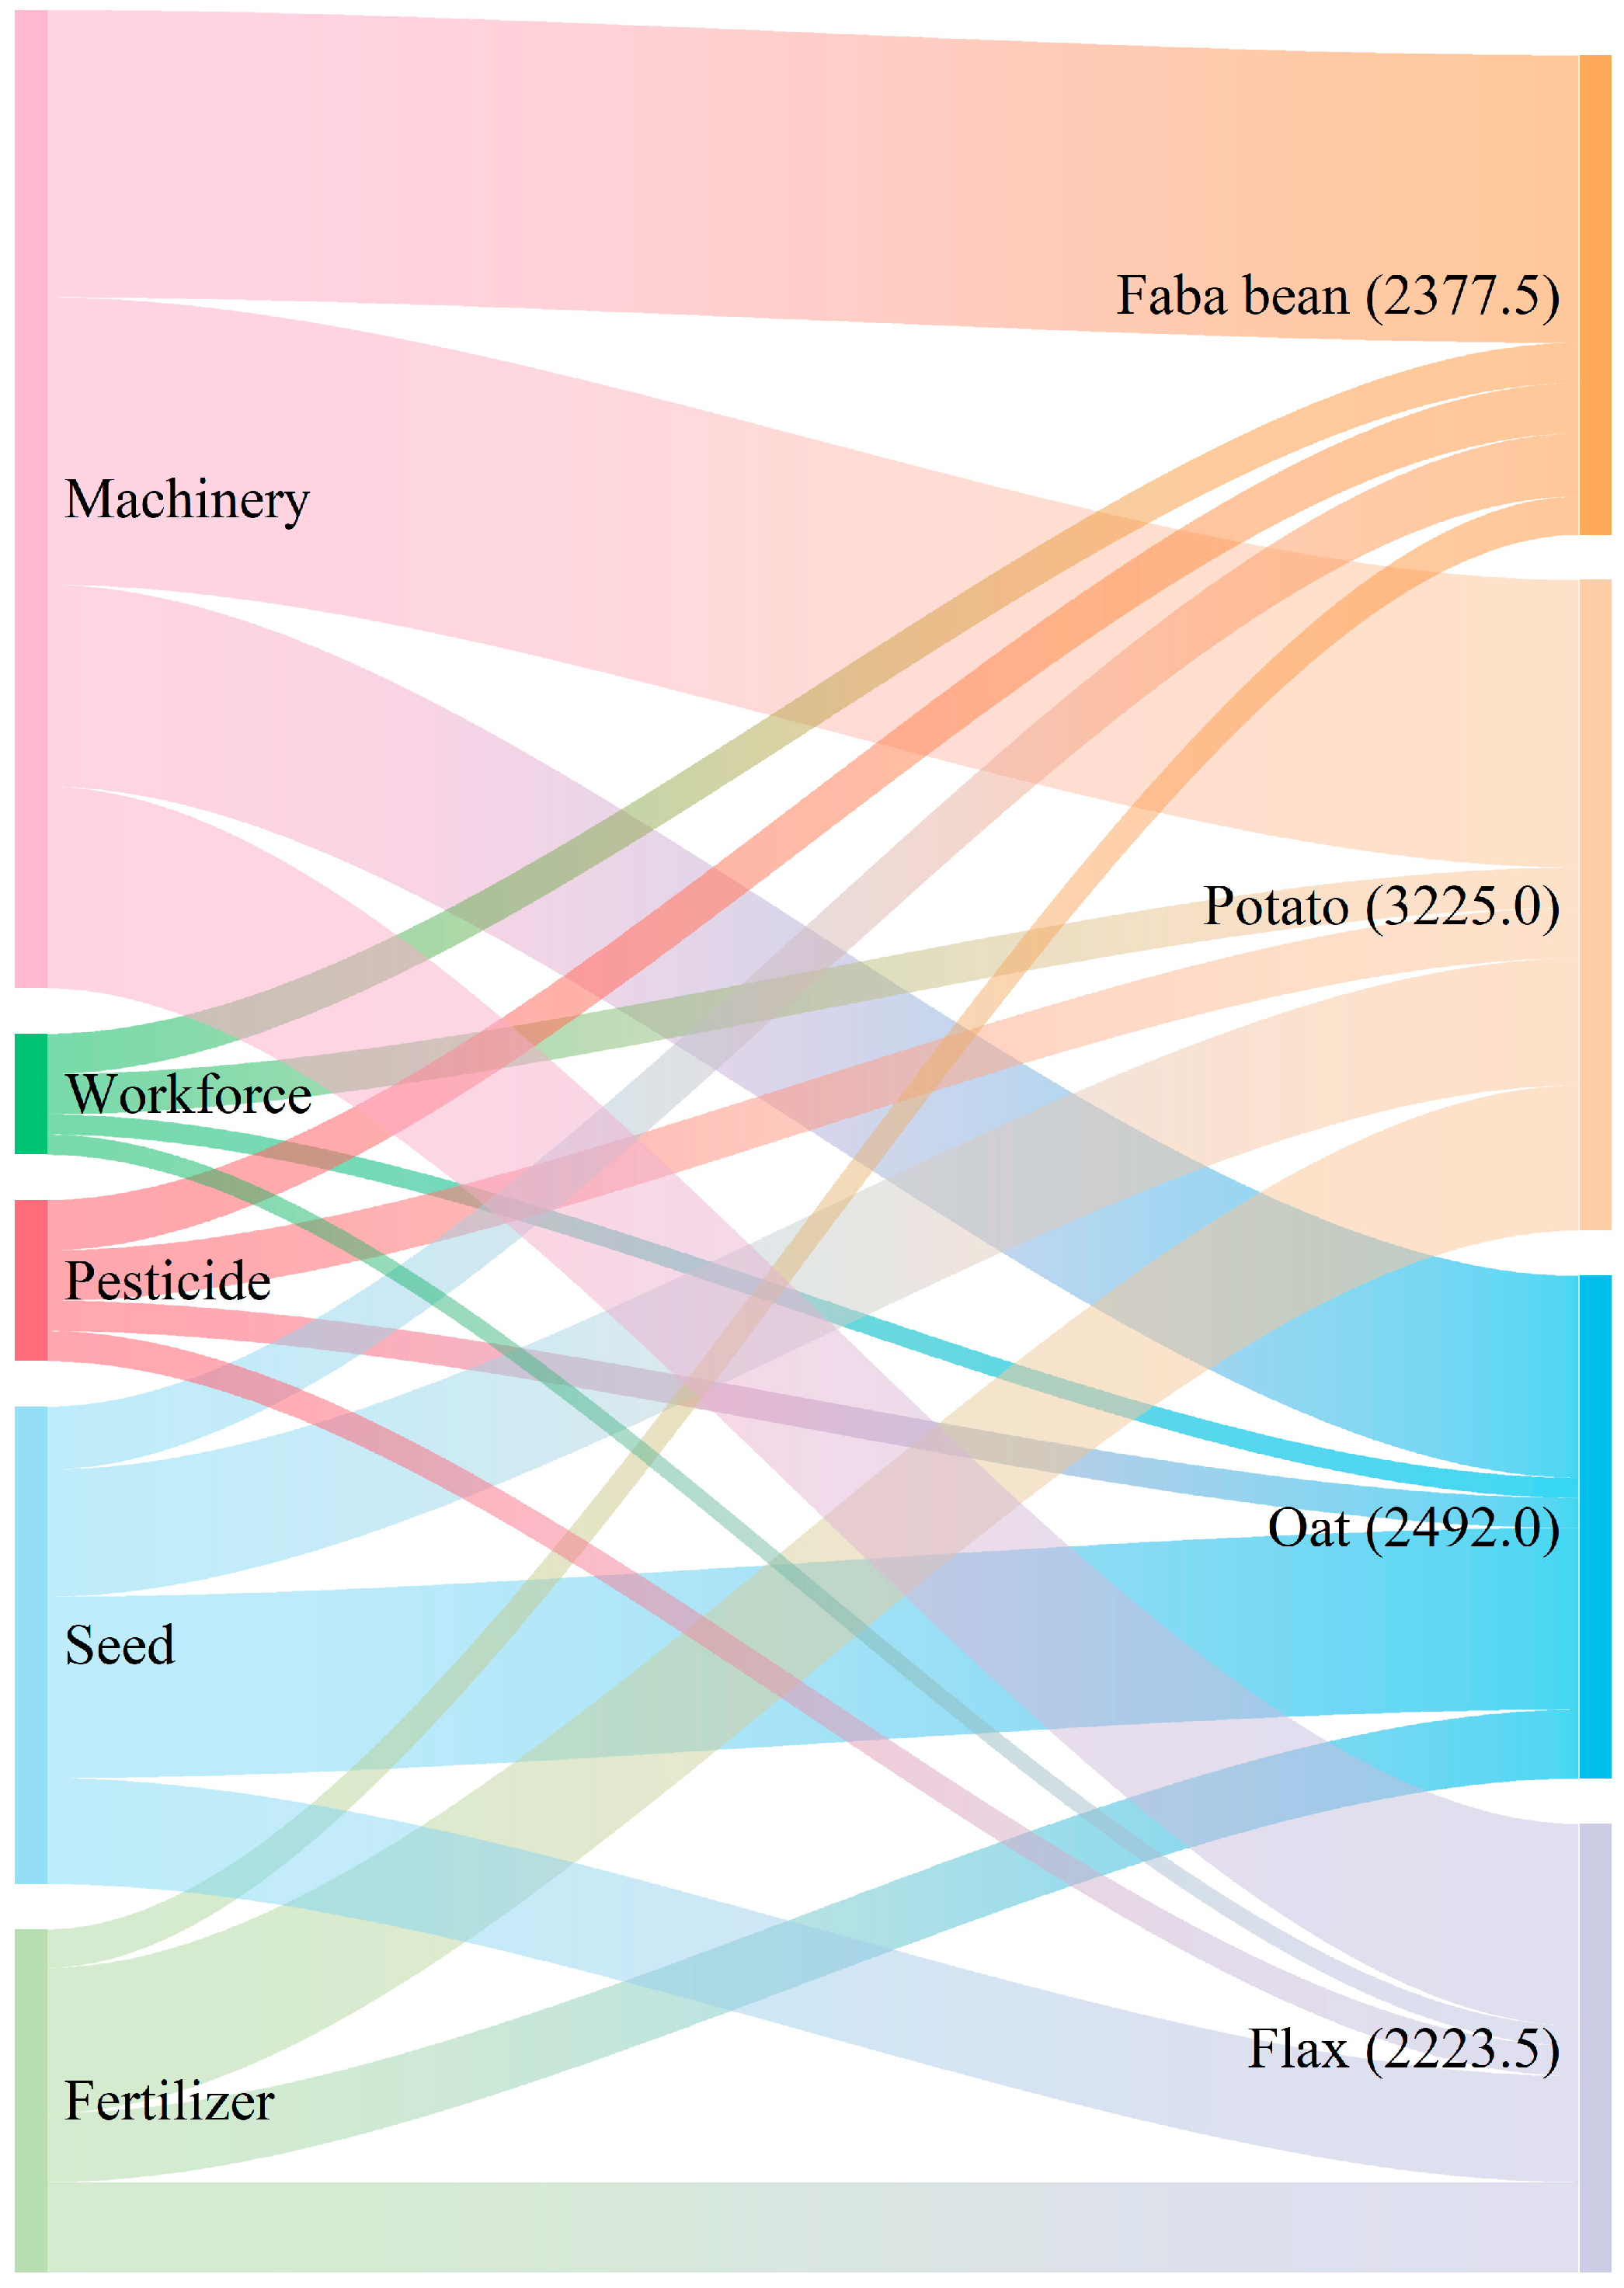
With respect to the composition of capital investment (Figure 3), the four crops differed markedly in the proportion of inputs allocated to seeds, pesticides, machinery, and fertilizers. Potato had the highest total input cost, reaching 3225.0 CNY/hm2, whereas the other three crops showed relatively similar total input costs. Among the 228 rotation patterns, FB, OB, and FBO achieved relatively high 10-year total comprehensive incomes, with values of 6.6, 6.5, and 6.3 CNY/hm2, respectively (Figure 1D).

3.3. Impact of Climate Change on the Average Comprehensive Benefit of 228 Rotation Patterns

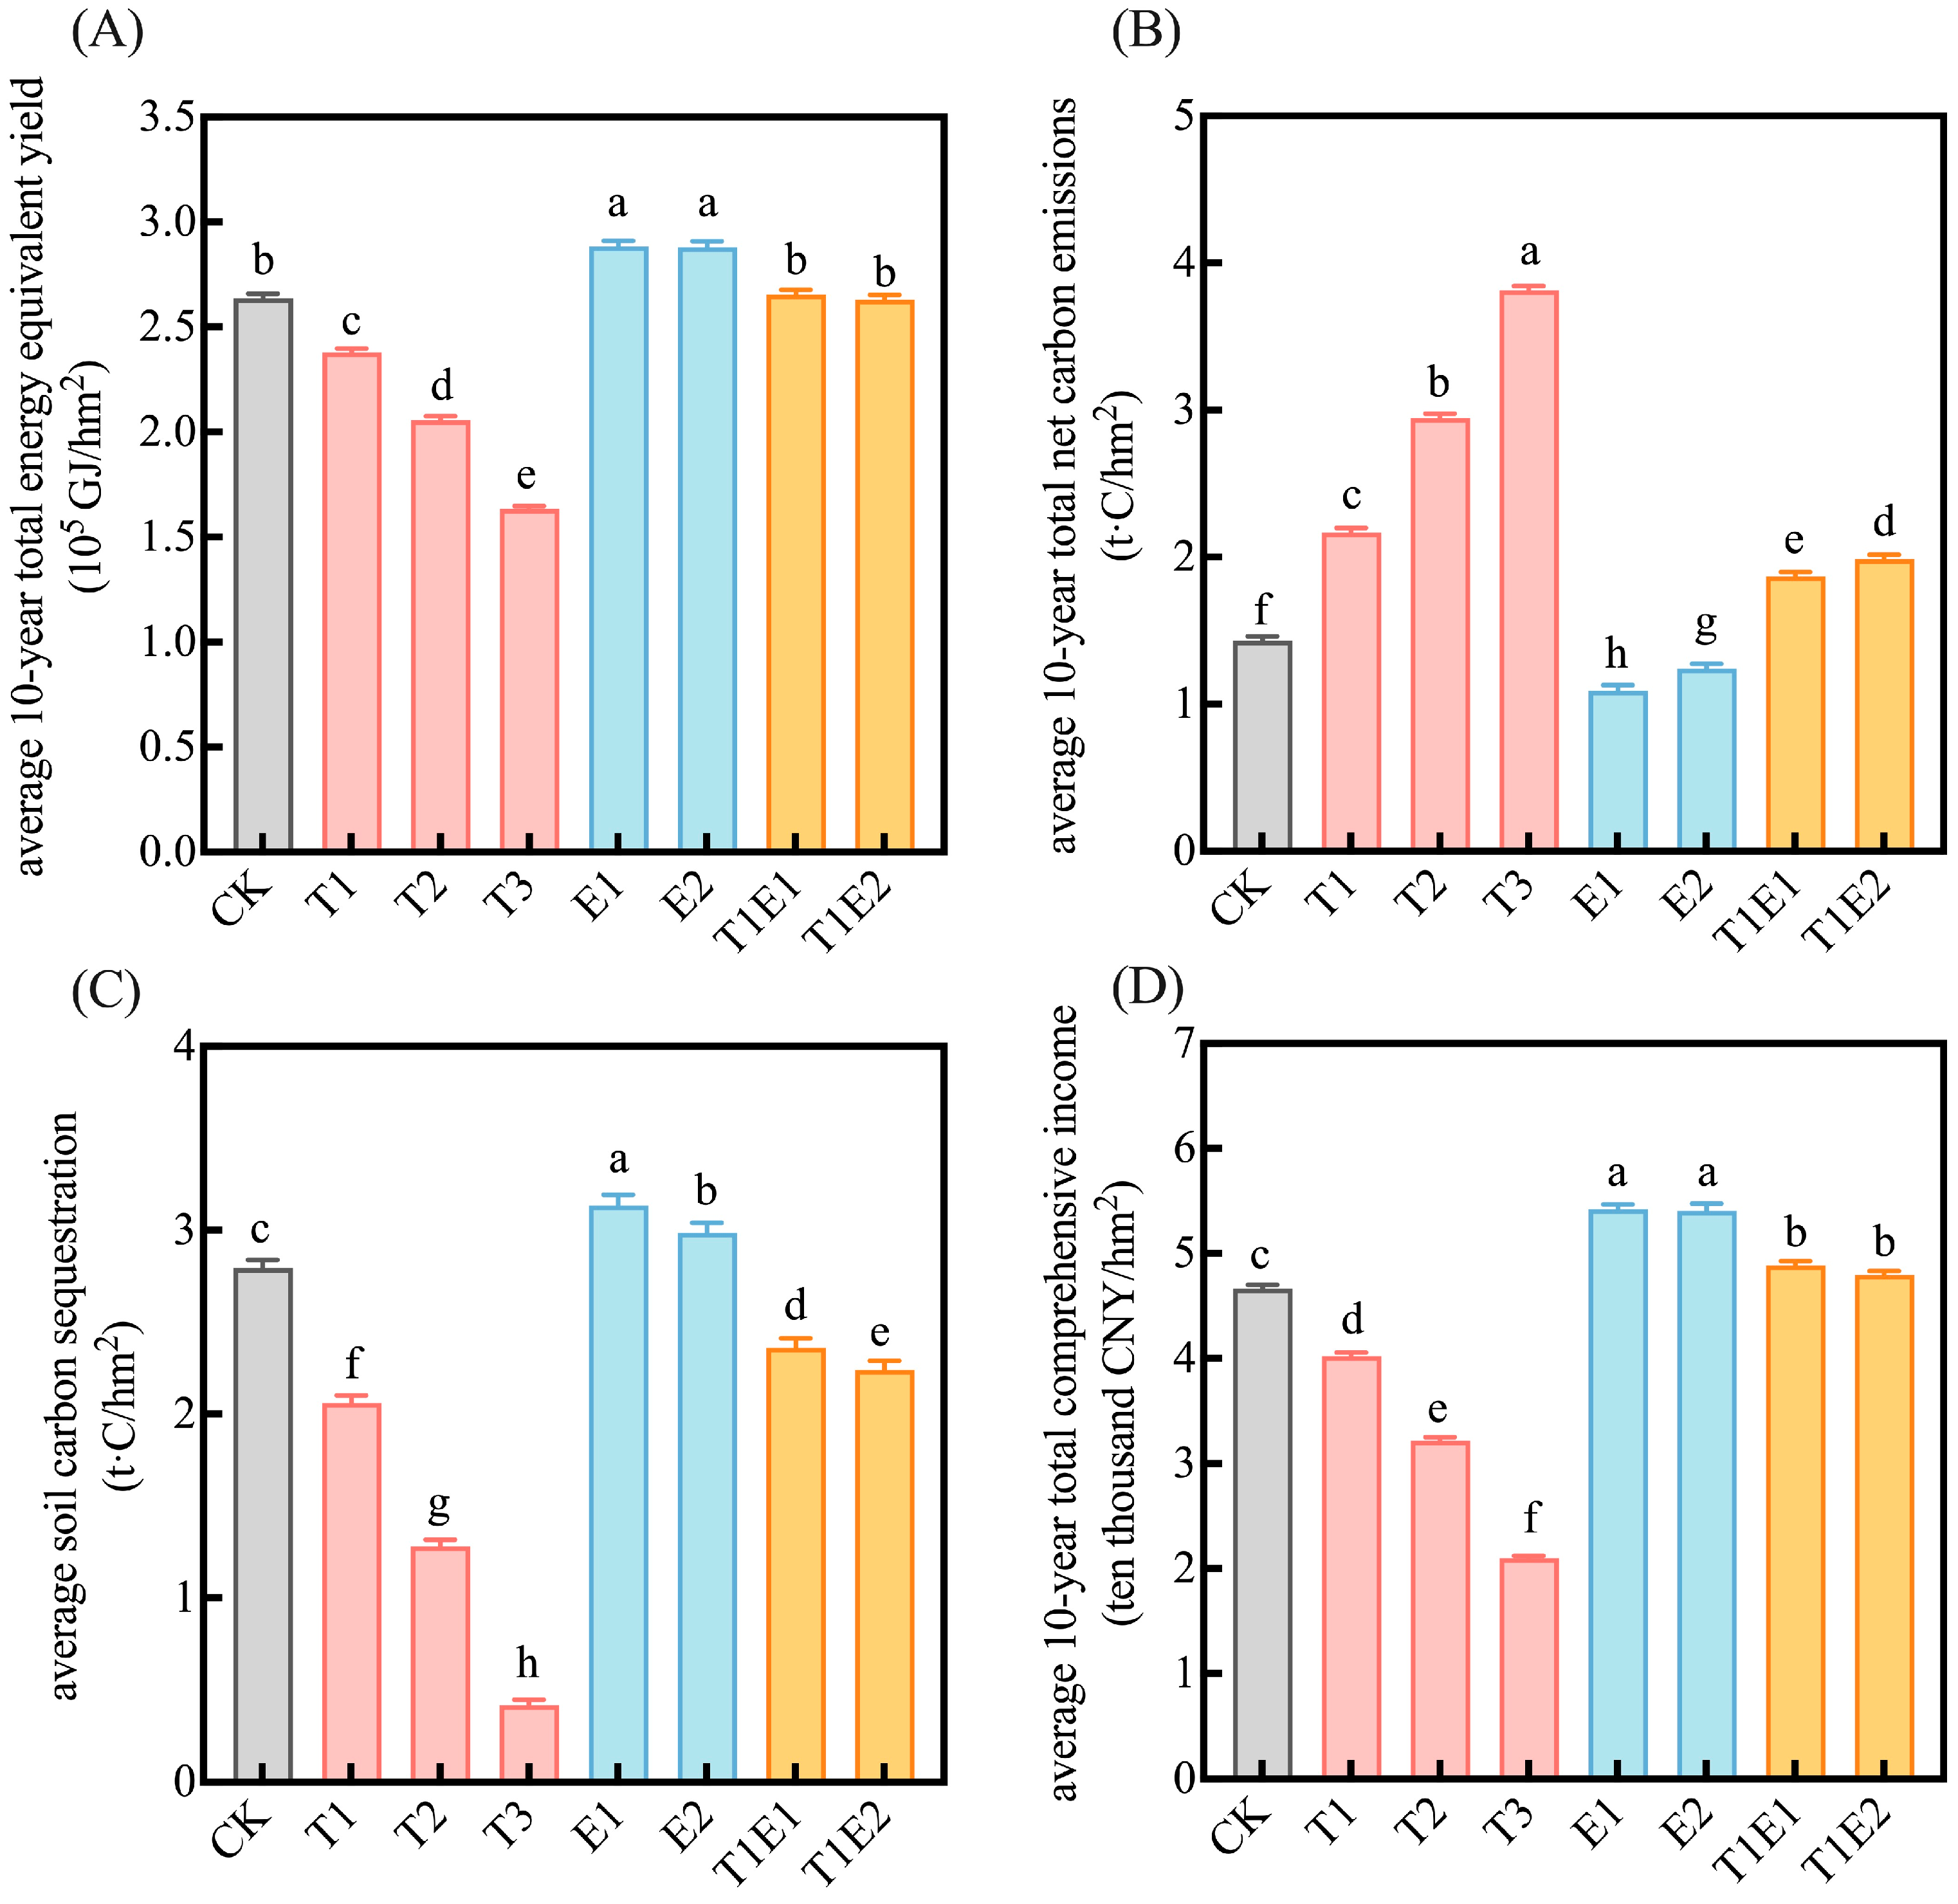
In terms of energy equivalent yield (Figure 4A), compared with the CK, the average 10-year total energy equivalent yields across 228 rotation patterns decreased by 9.9%, 22.0%, and 38.0% under the T1, T2, and T3 climate scenarios, respectively. In contrast, under the E1 and E2 climate scenarios, the average 10-year total energy equivalent yields increased by 9.4% and 9.2%, respectively. Among the eight climate change scenarios, E1 showed the highest average 10-year total energy equivalent yield at 2.9 × 10⁵ GJ/hm2, whereas T3 showed the lowest average value at 1.6 × 10⁵ GJ/hm2.
In terms of net carbon emissions (Figure 4B), compared with the CK, the average 10-year total net carbon emissions across 228 rotation patterns increased by 51.2%, 105.6%, and 165.9% under the T1, T2, and T3 climate scenarios, respectively. In contrast, under the E1 and E2 climate scenarios, the average 10-year total net carbon emissions decreased by 23.7% and 13.4%, respectively. Among the eight climate change scenarios, E1 showed the lowest average 10-year total net carbon emission at 1.1 t·C/hm2, whereas T3 showed the highest average value at 3.8 t·C/hm2.
In terms of soil carbon sequestration (Figure 4C), compared with the CK, the average soil carbon sequestration across 228 rotation patterns decreased by 26.3%, 54.2%, and 85.1% under the T1, T2, and T3 climate scenarios, respectively. In contrast, under the E1 and E2 climate scenarios, the average soil carbon sequestration increased by 12.2% and 6.9%, respectively. Among the eight climate change scenarios, E1 showed the highest average soil carbon sequestration at 3.1 t·C/hm2, whereas T3 showed the lowest average value at 0.4 t·C/hm2.
In terms of comprehensive income (Figure 4D), compared with the CK, the average 10-year total comprehensive income across 228 rotation patterns decreased by 13.6%, 31.0%, and 55.0% under the T1, T2, and T3 climate scenarios, respectively. In contrast, under the E1 and E2 climate scenarios, the average 10-year total comprehensive incomes increased by 16.4% and 16.0%, respectively. Among the eight climate change scenarios, E1 showed the highest average 10-year total comprehensive income at 5.4 ten thousand CNY/hm2, whereas T3 showed the lowest average value at 2.1 ten thousand CNY/hm2.

3.4. Combined Effects of Warming and Extreme Precipitation on Different Rotation Patterns

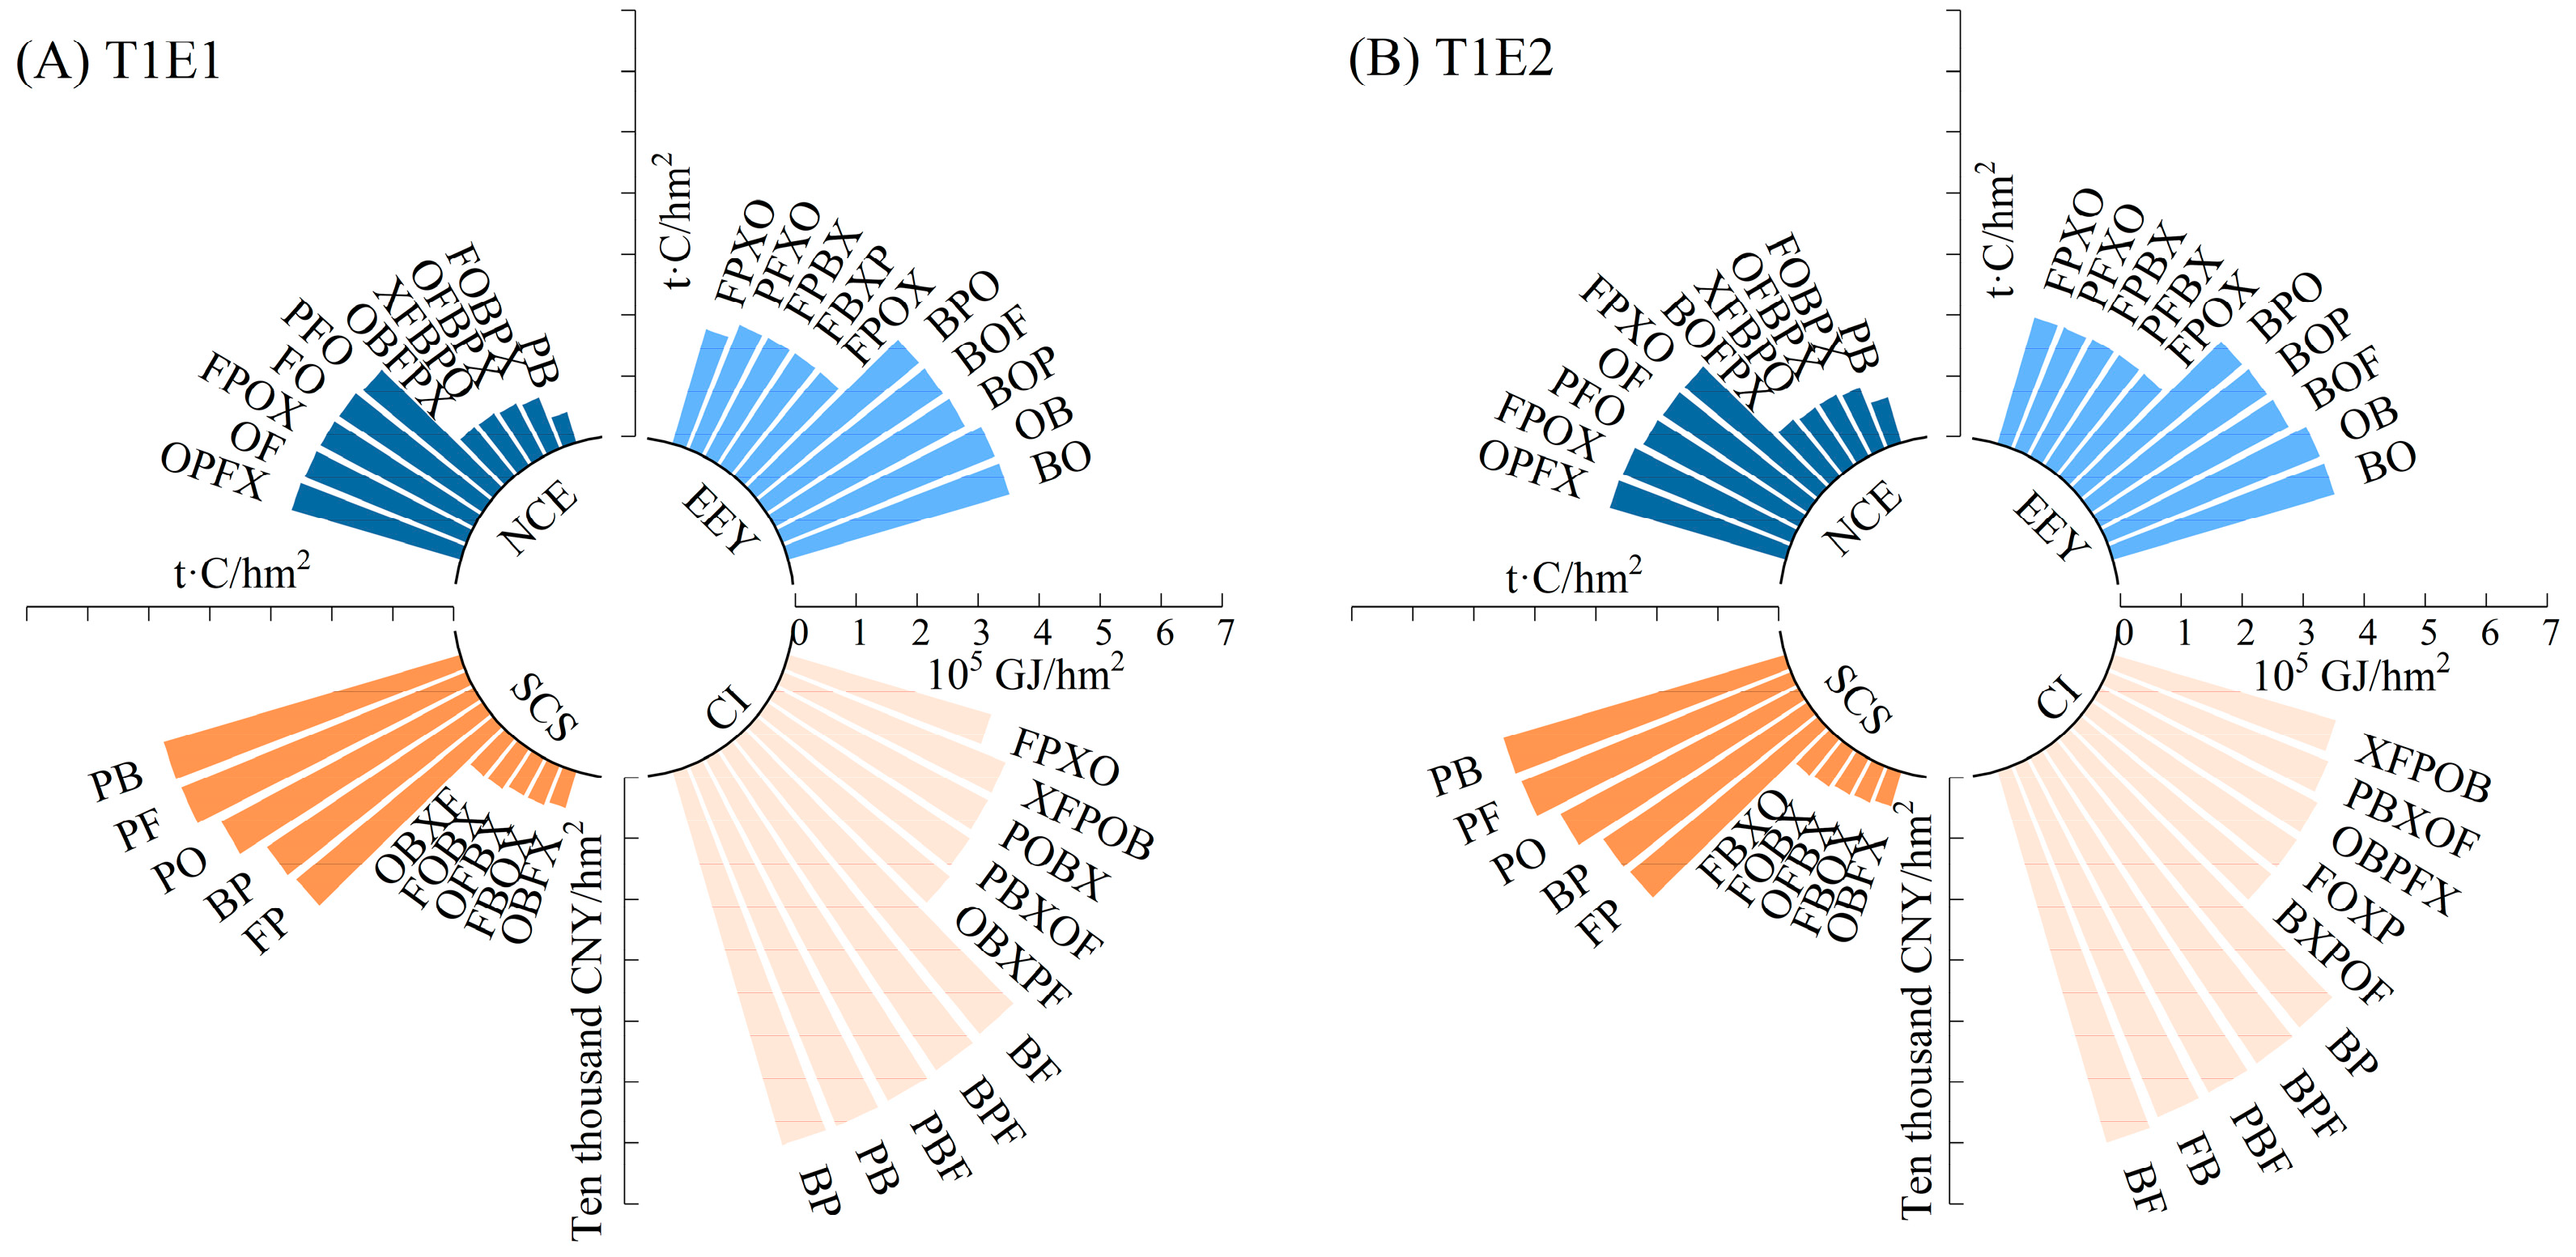
Under the T1E1 climate scenario (Figure 5A), the faba bean–oat, oat–faba bean, and faba bean–oat–potato rotation patterns showed relatively high 10-year total energy equivalent yields among the 228 patterns, with values of 3.8 × 10⁵, 3.8 × 10⁵ and 3.5 × 10⁵ GJ/hm2, respectively. The potato–faba bean, flax–oat–faba bean–potato–fallow, and oat–flax–faba bean–potato–fallow rotation patterns showed relatively low 10-year total net carbon emissions, with values of 0.5, 0.9, and 1.0 t·C/hm2, respectively. In terms of soil carbon sequestration, the potato–faba bean, potato–flax, and potato–oat rotation patterns ranked relatively high, with values of 5.1, 5.1, and 4.7 t·C/hm2, respectively. The faba bean–potato, potato–faba bean, and potato–faba bean–flax rotation patterns achieved relatively high 10-year total comprehensive incomes, with values of 6.4 ten thousand CNY/hm2.
Under the T1E2 climate scenario (Figure 5B), the faba bean–oat, oat–faba bean, and faba bean–oat–flax rotation patterns showed relatively high 10-year total energy equivalent yields among the 228 patterns, with values of 3.8 × 10⁵, 3.8 × 10⁵ and 3.5 × 10⁵ GJ/hm2, respectively. The potato–faba bean, flax–oat–faba bean–potato–fallow, and oat–flax–faba bean–potato–fallow rotation patterns showed relatively low 10-year total net carbon emissions, with values of 0.8, 1.1, and 1.2 t·C/hm2, respectively. In terms of soil carbon sequestration, the potato–faba bean, potato–flax, and potato–oat rotation patterns ranked relatively high, with values of 4.8, 4.8, and 4.4 t·C/hm2, respectively. The faba bean–flax, flax–faba bean, and potato–faba bean–flax rotation patterns achieved relatively high 10-year total comprehensive incomes, with values of 6.4, 6.3, and 6.2 ten thousand CNY/hm2, respectively.

4. Discussion

4.1. Model Performance

Our results showed that, for all four crops examined, the model achieved NRMSE values below 20% when simulated yields were compared with observed data, indicating good agreement. This suggests that the APSIM model can be effectively applied to simulate diverse rotation patterns in the Northern Agro-pastoral Ecotone of China. This conclusion is consistent with previous studies that have successfully applied APSIM to simulate soybean, maize, and wheat yields across different locations, management practices, and rotation systems [22]. Yield predictions for potato exhibited a slightly higher NRMSE, which aligns with earlier findings indicating that the model may not fully represent the complex interactions among different crop components within rotation systems [38]. In addition, model input parameters are influenced by environmental conditions and thus subject to uncertainty, which may affect the magnitude of simulated crop yields across different rotation systems.

4.2. Comprehensive Benefit Assessment of 228 Rotation Patterns

Farmers in the Northern Agro-pastoral Ecotone of China currently mainly adopt crop rotation systems that integrate potato with coarse cereals, legumes, and oil crops [39]. Using the APSIM model, we compared the superior rotation patterns identified in this study with the dominant potato–oat and potato–flax rotation systems currently practiced in the region. In terms of productivity, the oat–faba bean rotation pattern achieved the highest 10-year total energy-equivalent yield in this study. Compared with the conventional potato–oat and potato–flax rotation patterns, yields increased by 42.2% and 97.8%, respectively. Regarding ecological performance, the potato–faba bean rotation pattern exhibited the lowest 10-year net carbon emissions. Emission reductions of 74.0% and 76.3% were achieved relative to the potato–oat and potato–flax patterns, respectively. Previous research comparing three rotation patterns composed of four crops reported that a winter wheat–summer maize–winter fallow–spring sweet potato rotation achieved the lowest average annual carbon emissions [40]. Compared with this previously identified optimal pattern, the potato–faba bean rotation pattern identified in this study achieved an approximate 72.4% reduction in average annual carbon emissions. In terms of economic performance, the flax–faba bean rotation pattern produced the highest 10-year comprehensive income. Income increased by 55.6% and 46.9% compared with the potato–oat and potato–flax patterns, respectively. Overall, relative to the rotation patterns currently practiced in the region, the rotation strategies proposed in this study demonstrated improved performance in productivity, ecological benefits, and economic incomes, providing useful references for promoting appropriate crop rotation patterns in the Northern Agro-pastoral Ecotone of China.
Our results showed that all five rotation patterns with the highest 10-year total energy equivalent yields included faba bean. This outcome can be explained by the nitrogen inputs associated with the legume, including biological nitrogen fixation and nitrogen-rich crop residues, which improved soil nitrogen availability. In addition, faba bean generally requires less soil water uptake than non-leguminous crops, leaving relatively higher residual soil moisture for subsequent crops [16,41,42]. Moreover, previous studies examining yield responses to crop rotation have shown that rotation systems can increase crop yields by an average of about 20% compared with continuous monocropping [43].
In this study, the annual carbon footprint of the four crops followed a descending order of potato, flax, oat, and faba bean. Among them, faba bean exhibited the lowest carbon footprint, which can be largely attributed to the effective use of biological nitrogen fixation when legumes are included in rotation systems. This process reduces carbon emissions associated with the production and application of nitrogen fertilizers [44,45]. In contrast, potato requires relatively large inputs of nitrogen, phosphorus, and potassium to maintain normal growth, leading to substantial fertilizer use that contributes noticeably to its higher carbon footprint [46,47]. Previous studies focusing on emission reduction through crop rotation have similarly shown that combining crops with different resource requirements, together with appropriate crop arrangement and field management, can effectively reduce carbon emissions from cropping systems [48,49,50].
From the perspective of improving agricultural income, rotation patterns based on faba bean achieved relatively higher 10-year total comprehensive income. This is mainly because faba bean requires lower fertilizer inputs, resulting in a total production cost of only 2377.5 CNY/hm2. In contrast, potato production represents a high-input and low-return option. Although potato yields are substantially higher than those of faba bean and flax, its market price is relatively low, which leads to reduced comprehensive income in rotation patterns that include potato. In addition, previous studies have shown that crop rotation can effectively alleviate continuous cropping constraints and reduce the occurrence of pests and diseases. It can also improve water use efficiency and decrease fertilizer demand. These effects help lower expenditures on pesticides and fertilizers, thereby increasing net income [13,51].

4.3. Impact of Climate Change on 228 Rotation Patterns

Shaped by both geographic and climatic conditions, the Northern Agro-pastoral Ecotone of China is characterized by complex and variable climate patterns, as well as a high frequency of extreme weather events [52,53]. The simulation results showed that, with increasing temperature and intensity of extreme precipitation, the average 10-year total energy equivalent yield across the 228 rotation patterns exhibited a declining trend, which is consistent with previous findings [54,55,56]. This response may be partly explained by excessive soil moisture, such as waterlogging, ponding, and flooding, which can induce soil oxygen stress and subsequently reduce crop yields [54]. In addition, rising temperatures tend to increase yield variability and elevate the risk of yield loss. This is likely because accelerated crop development under warmer conditions shortens the growth period and limits biomass accumulation and final yield formation [57]. The yield increases observed under the E1 and E2 scenarios reflect the water-limited nature of the Northern Agro-pastoral Ecotone of China. In these scenarios, substantially higher precipitation (300 mm/month), compared with the local growing-season average (88.9 mm/month), increased total water supply and likely alleviated soil moisture constraints. Overall, the Northern Agro-pastoral Ecotone of China represents a region that is highly sensitive to climate change, where increases in temperature and extreme precipitation intensity can substantially influence crop yields across different rotation patterns.
Climatic conditions influence crop growth, physiological processes, and soil microbial activity, which together affect carbon emissions during crop production [58]. Our results showed that, compared with the CK, the average 10-year total net carbon emissions across the 228 rotation patterns increased significantly with rising mean annual temperature, which is consistent with previous findings [59]. Elevated temperatures may lead to increased emissions of greenhouse gases such as carbon dioxide and nitrous oxide by accelerating both photosynthetic and respiratory processes in crops [60]. In addition, increasing the intensity of extreme precipitation had a positive effect on the average 10-year total net carbon emissions across the 228 rotation patterns, in line with earlier studies [61,62]. On the one hand, higher precipitation levels may suppress soil respiration because anaerobic conditions can limit microbial activity [62]. On the other hand, more intense precipitation can increase water infiltration depth and prolong soil moisture retention, thereby enhancing the availability of easily decomposed organic substrates, accelerating soil carbon mineralization, and increasing carbon emissions [63,64]. Moreover, future increases in temperature and extreme precipitation are likely to encourage farmers to adjust production inputs, such as seeds, fertilizers, pesticides, and labor, to reduce the risks associated with climate variability. These adjustments are expected to affect the carbon-related economic performance of agricultural systems while simultaneously increasing production costs [65,66]. Consistent with this expectation, our results indicate an overall declining trend in 10-year total comprehensive income under climate change scenarios.
In the Northern Agro-pastoral Ecotone, where water availability is limited, the adoption of well-designed and diversified rotation patterns can effectively improve resource use efficiency, reduce soil wind erosion, and enhance crop yields, thereby strengthening resilience to climate change [20]. Previous research using the APSIM model evaluated six rotation patterns composed of four crops under eleven climate scenarios with varying precipitation and temperature conditions in this region and found that the corn–oat rotation achieved relatively higher yields [23]. However, the adaptation of cropping patterns to the combined pressures of rising temperatures and extreme precipitation events remains insufficiently explored [67,68]. The results of this study clarify the response patterns of 228 rotation systems to future climate change and identify diversified cropping strategies that are better suited to projected climatic conditions in the Northern Agro-pastoral Ecotone of China. These findings provide a theoretical basis for selecting appropriate rotation patterns that meet regional objectives for productivity, ecological sustainability, and economic performance. Furthermore, it should be noted that the climate scenarios in this study did not incorporate changes in atmospheric CO2 concentration. This decision was based on the consideration that temperature and precipitation were the dominant drivers of differential crop responses, while CO2 fertilization effects are generally uniform and insufficiently validated in the APSIM for several crops included in the rotations [69].

5. Conclusions

The APSIM model showed reliable performance in simulating the yields of oat, potato, faba bean, and flax in the Northern Agro-pastoral Ecotone of China. We found that rotation patterns that included faba bean generally achieved higher comprehensive benefits. Changes in temperature and precipitation patterns had a significant negative influence on the yields of all four crops. Across the 228 rotation patterns, energy equivalent yield, comprehensive benefit, and soil carbon sequestration declined with increasing temperature and extreme precipitation intensity, while net carbon emissions showed an overall increasing trend. Furthermore, an integrated assessment of the 228 rotation patterns under combined warming and extreme precipitation scenarios identified the faba bean–oat and oat–faba bean rotations as achieving relatively high energy equivalent yields, the potato–faba bean and flax–oat–faba bean–potato–fallow rotations as exhibiting relatively low net carbon emissions, and the faba bean–potato and faba bean–flax rotations as demonstrating higher comprehensive incomes. These six rotation patterns therefore represent promising options for promoting suitable cropping systems in the future Northern Agro-pastoral Ecotone.
In addition, this study integrates a process-based crop model with carbon footprint and economic assessments to support multi-objective evaluation of rotation patterns under climate change. The results may inform farmers and policy makers seeking to improve productivity, reduce carbon emissions, and promote sustainable agriculture. Future work could further examine parameter uncertainty, assessment under scenarios with changes in atmospheric CO2 concentration, and incorporate climate model-based scenarios to strengthen scenario-based assessments.

Author Contributions

Conceptualization, D.W.; methodology, S.W. and S.L.; formal analysis, S.W. and Y.L. (Yue Li); resources, S.L.; writing—original draft preparation, S.W.; visualization, Y.L. (Yue Li); validation and data curation, Y.L. (Yanan Li); writing—review and editing, J.J., D.W. and R.B.; supervision, R.B.; funding acquisition, J.J. All authors have read and agreed to the published version of the manuscript.

Funding

This research was funded by the Decision-making Meteorological Service Project of China Meteorological Administration, grant number JCQX2024009 and the Natural Science Foundation of China, grant number 41805027.

Data Availability Statement

The raw data supporting the conclusions of this article will be made available by the authors on request.

Acknowledgments

We thank the Zhangbei Oat Science and Technology Backyard in Hebei Province for providing long-term crop rotation experimental data.

Conflicts of Interest

The authors declare no conflicts of interest.

Appendix A

Table A1. Crop management practices for different crops.
CropsSowing DateHarvest DateSeeding Rate per HectareSeeding Row Spacing (cm)
OatMid-MayEarly September150 kg25
PotatoMid-MayEarly September6000 seedlings67
Faba beanMid-MayEarly September24 kg40
FlaxMid-MayEarly September45 kg40
Table A2. Crop varieties and experimental years used for model calibration and validation.
CropsSpeciesCalibration YearVerification Year
OatBaxiao No. 120172019
PotatoJizhangshu No. 8 Original Seed20182020
Faba beanBa fababean No. 120192021
FlaxBaxuan No. 320182020

References

  1. Papalexiou, S.M.; Montanari, A. Global and Regional Increase of Precipitation Extremes Under Global Warming. Water Resour. Res. 2019, 55, 4901–4914. [Google Scholar] [CrossRef]
  2. IPCC. Climate Change 2021: The Physical Science Basis Working Group I Contribution to the Sixth Assessment Report of the Intergovernmental Panel on Climate Change, 6th ed.; Cambridge University Press: Cambridge, UK, 2023. [Google Scholar]
  3. Gao, S.Q.; Duan, R.; Wang, H.S.; Li, A.; Shi, Y.; Jing, H.C.; Fang, J.Y. Farming-Pastoral Ecotone of Northern China Plays Important Role in Ensuring National Food Security. Bull. Chin. Acad. Sci. 2021, 36, 643–651. [Google Scholar] [CrossRef]
  4. Yang, Y.J.; Wang, K.; Liu, D.; Zhao, X.Q.; Fan, J.W. Effects of Land-Use Conversions on the Ecosystem Services in the Agro-pastoral Ecotone of Northern China. J. Clean. Prod. 2020, 249, 119360. [Google Scholar] [CrossRef]
  5. Bai, Y.; Liu, Y.; Yuan, X. Tracing the Agro-Pastoral Ecotone Transition in Northern China from the Human-Earth System Perspective. J. Geogr. Sci. 2025, 35, 783–799. [Google Scholar] [CrossRef]
  6. Cui, T.R.; Han, G.E.; Zhang, L.F. Analysis on the Changes of 50 Years Climate Resources on Bashang Region in North-West of Hebei: In the Case of Zhangbei County. J. Shanxi Agric. Sci. 2017, 45, 819–824. [Google Scholar] [CrossRef]
  7. Zhang, J.T.; He, L.H.; Li, J.B.; Zhang, C.Y.; Zhang, M.R.; Yang, L.; Yan, X.J.; Xie, X.Y.; Wang, H.C.; Long, L.X.; et al. Preliminary Study on the Characteristics and Causes of the “23.7” Extreme Rainstorm in Hebei. Trans. Atmos. Sci. 2023, 46, 884–903. [Google Scholar] [CrossRef]
  8. Costa, A.; Bommarco, R.; Smith, M.E.; Bowles, T.; Gaudin, A.C.; Watson, C.A.; Alarcón, R.; Berti, A.; Blecharczyk, A.; Calderon, F.J.; et al. Crop Rotational Diversity Can Mitigate Climate-Induced Grain Yield Losses. Glob. Change Biol. 2024, 30, e17298. [Google Scholar] [CrossRef]
  9. Smith, M.E.; Bommarco, R.; Vico, G. Rethinking Crop Rotational Benefits Under Climate Change: Beyond the Growing Season. Glob. Change Biol. 2025, 31, e70012. [Google Scholar] [CrossRef]
  10. Cong, W.F.; Zhang, C.C.; Li, C.J.; Wang, G.Z.; Zhang, F.S. Designing Diversified Cropping Systems in China: Theory, Approaches and Implementation. Front. Agric. Sci. Eng. 2021, 8, 362–372. [Google Scholar] [CrossRef]
  11. Liang, Z.Y.; Xu, Z.; Cheng, J.L.; Ma, B.; Cong, W.F.; Zhang, C.C.; Zhang, F.S.; van der Werf, W.; Groot, J.C.J. Designing Diversified Crop Rotations to Advance Sustainability: A Method and an Application. Sustain. Prod. Consum. 2023, 40, 532–544. [Google Scholar] [CrossRef]
  12. Wang, Y.; Sun, F.; Ding, D. Benefit Analysis of Structural Adjustment of “Grain Change Feed” in Northern of Hebei Province of Beijing-Tianjin-Hebei Region. Chin. J. Agric. Resour. Reg. Plan. 2019, 11, 158–165. [Google Scholar] [CrossRef]
  13. Garbelini, L.G.; Debiasi, H.; Junior, A.A.B.; Franchini, J.C.; Coelho, A.E.; Telles, T.S. Diversified Crop Rotations Increase the Yield and Economic Efficiency of Grain Production Systems. Eur. J. Agron. 2022, 137, 126528. [Google Scholar] [CrossRef]
  14. Li, Y.; Li, L.J.; Sui, P.; Liu, X.F.; Zhang, T.T.; Li, X.T. Crop Rotation to Diversify the Soil Microbiome in the Semi-Arid Area of Inner Mongolia, China. Arch. Agron. Soil Sci. 2023, 69, 1161–1176. [Google Scholar] [CrossRef]
  15. Al-Musawi, Z.K.; Vona, V.; Kulmány, I.M. Utilizing Different Crop Rotation Systems for Agricultural and Environmental Sustainability: A Review. Agronomy 2025, 15, 1966. [Google Scholar] [CrossRef]
  16. Shah, K.K.; Modi, B.; Pandey, H.P.; Subedi, A.; Aryal, G.; Pandey, M.; Shrestha, J. Diversified Crop Rotation: An Approach for Sustainable Agriculture Production. Adv. Agric. 2021, 2021, 8924087. [Google Scholar] [CrossRef]
  17. Lu, Y.W.; Li, S.G.; Zhao, Y.; Cui, J.H.; Liu, J.J. Study on the Yield and Economic Benefits of Millet and Mung Bean Rotation Model. J. Anhui Agric. Sci. 2024, 52, 29–33+59. [Google Scholar] [CrossRef]
  18. Na, R.S.; Liang, Q.W.; Yang, X.F.; Xiang, K.F.; Yu, X.R.; Yu, Y. Benefit Analysis of Different Alfalfa Rotation Systems in Horqin Sandy Land. Heilongjiang Anim. Sci. Vet. Med. 2025, 9, 128–133. [Google Scholar] [CrossRef]
  19. Zhou, J.; Zhu, P.; Kluger, D.M.; Lobell, D.B.; Jin, Z. Changes in the Yield Effect of the Preceding Crop in the US Corn Belt Under a Warming Climate. Glob. Change Biol. 2024, 30, e17556. [Google Scholar] [CrossRef]
  20. Liu, H.; Xiong, W.; Li, Y.C.; Yang, D. Advances of Impacts and Adaptation of Climate Change on Crop Rotations in China. Chin. J. Agrometeorol. 2017, 38, 613–631. [Google Scholar] [CrossRef]
  21. Brown, H.; Huth, N.; Holzworth, D. Crop Model Improvement in APSIM: Using Wheat as A Case Study. Eur. J. Agron. 2018, 100, 141–150. [Google Scholar] [CrossRef]
  22. Yang, X.; Zheng, L.; Yang, Q.; Wang, Z.K.; Cui, S.; Shen, Y. Modelling the Effects of Conservation Tillage on Crop Water Productivity, Soil Water Dynamics and Evapotranspiration of a Maize-Winter Wheat-Soybean Rotation System on the Loess Plateau of China Using APSIM. Agric. Syst. 2018, 166, 111–123. [Google Scholar] [CrossRef]
  23. Yang, X.; Jia, P.F.; Hou, Q.Q. Investigating the Impacts of Climate Change on the Production of Crop and Forage Rotational Fields in the Agro-Pastoral Interlaced Zone in Northern-China. J. Shanxi Agric. Univ. (Nat. Sci. Ed.) 2022, 42, 77–89. [Google Scholar] [CrossRef]
  24. Holzworth, D.P.; Huth, N.I.; deVoil, P.G.; Zurcher, E.J.; Herrmann, N.I.; McLean, G.; Chenu, K.; van Oosterom, E.J.; Val, S.; Murphy, C.; et al. APSIM–Evolution Towards a New Generation of Agricultural Systems Simulation. Environ. Model. Softw. 2014, 62, 327–350. [Google Scholar] [CrossRef]
  25. Baum, M.E.; Sawyer, J.E.; Nafziger, E.D.; Huber, I.; Thorburn, P.J.; Castellano, M.J.; Archontoulis, S.V. Evaluating and Improving APSIM’s Capacity in Simulating Long-Term Corn Yield Response to Nitrogen in Continuous-and Rotated-Corn Systems. Agric. Syst. 2023, 207, 103629. [Google Scholar] [CrossRef]
  26. Briak, H.; Kebede, F. Wheat (Triticum aestivum) Adaptability Evaluation in A Semi-Arid Region of Central Morocco Using APSIM Model. Sci. Rep. 2021, 11, 23173. [Google Scholar] [CrossRef]
  27. Pembleton, K.G.; Radanielson, A.M. Validating APSIM for the Northern Territory of Australia: An environment with challenging weather and soils. Agron. J. 2024, 116, 1357–1370. [Google Scholar] [CrossRef]
  28. Singh, R.J.; Ward, P.R.; Oliver, Y. Modelling the Long-Term Effects of Wheat Monoculture vs. Wheat in Diversified Crop Sequences Managed with Varied Crop Residue Amounts on Water-Use and Grain Yields in a Mediterranean Dryland. Plant Soil 2025, 1–20. [Google Scholar] [CrossRef]
  29. Yang, X.; Li, Z.; Cui, S.; Cao, Q.; Deng, J.Q.; Lai, X.F.; Shen, Y.Y. Cropping System Productivity and Evapotranspiration in the Semiarid Loess Plateau of China Under Future Temperature and Precipitation Changes: An APSIM-Based Analysis of Rotational vs. Continuous Systems. Agric. Water Manag. 2020, 229, 105959. [Google Scholar] [CrossRef]
  30. Peng, Y.X.; Zhang, F.X.; Zhang, S.; Li, Z.Z.; Cao, S.M.; Luo, C.X.; Yu, F. Using APSIM to Optimize Corn Nitrogen Fertilizer Application Levels in Alfalfa-Corn Rotation System in Northeast China. Field Crops Res. 2024, 318, 109596. [Google Scholar] [CrossRef]
  31. Tang, J.Z.; Xiao, D.P.; Bai, H.Z. Yield and Water Use Efficiency of Potato at Different Irrigation Levels in Agro-Pastoral Ecotone Under Future Climate Change. Trans. Chin. Soc. Agric. Eng. 2020, 36, 103–112. [Google Scholar] [CrossRef]
  32. Chen, F. Agricultural Ecology, 2nd ed.; China Agricultural University Press: Beijing, China, 2011; p. 316. [Google Scholar]
  33. Chen, Z.D.; Li, F.B.; Feng, J.F.; Zhou, X.Y.; Xu, C.C.; Ji, L.; Fang, F.P. Study on Carbon Footprint for Rice-wheat Rotation System in the Lower Reaches of Yangtze River: Based on the Life Cycle Assessment. Chin. J. Agric. Resour. Reg. Plan. 2019, 40, 81–90. [Google Scholar] [CrossRef]
  34. Li, Y.; Wang, Y.; He, Q.; Yang, Y. Calculation and Evaluation of Carbon Footprint in Mulberry Production: A Case of Haining in China. Int. J. Environ. Res. Public Health 2020, 17, 1339. [Google Scholar] [CrossRef] [PubMed]
  35. Liu, X.H.; Xu, W.X.; Li, Z.J.; Chu, Q.; Yang, X.; Chen, F. The Missteps, Improvement and Application of Carbon Footprint Methodology in Farmland Ecosystems with the Case Study of Analyzing the Carbon Efficiency of China’s Intensive Farming. Chin. J. Agric. Resour. Reg. Plan. 2013, 34, 1–11. [Google Scholar] [CrossRef]
  36. Gan, Y.T.; Liang, C.; Huang, G.B.; Malhi, S.S.; Brandt, S.A.; Katepa-Mupondwa, F. Carbon Footprint of Canola and Mustard is a Function of the Rate of N Fertilizer. Int. J. Life Cycle Assess. 2012, 17, 58–68. [Google Scholar] [CrossRef]
  37. Chen, Z.D.; Xu, C.C.; Ji, L.; Fang, F.P. Spatial and Temporal Changes in Carbon Footprint for Oilseed Rape Production in the Middle and Lower Reaches of Yangtze River during 2004–2015. Chin. J. Eco-Agric. 2019, 27, 1105–1114. [Google Scholar] [CrossRef]
  38. Luo, X.L.; Sun, Y.; Liu, L.M.; Wang, L.M.; Gao, X.N. Response of Potato Growth and Yield to Drought Scenarios Based on APSIM-Potato in the Single-Cropping Region in Northern China. Potato Res. 2024, 67, 1775–1796. [Google Scholar] [CrossRef]
  39. Zhang, Y. Evaluation of Comprehensive Benefits of Mixed Grain Cultivation in Hebei Province. Master’s Thesis, Hebei Agricultural University, Hebei, China, 2023. [Google Scholar]
  40. Zheng, M.J.; Zhang, J.T.; Cui, Y.Z.; Yao, H.P.; Jia, X.L.; Li, Y. Carbon Footprint Evaluation of Cereal-Bean, Cereal-Potato Rotation Modes Based on Wheat-Maize Cropping System in North China Plain. Acta Agric. Boreali-Sin. 2022, 37, 81–89. [Google Scholar] [CrossRef]
  41. Qiao, M.J.; Sun, R.B.; Wang, Z.X.; Dumack, K.; Xie, X.G.; Dai, C.C.; Wang, E.; Zhou, J.Z.; Sun, B.; Peng, X.H.; et al. Legume Rhizodeposition Promotes Nitrogen Fixation by Soil Microbiota Under Crop Diversification. Nat. Commun. 2024, 15, 2924. [Google Scholar] [CrossRef]
  42. Zang, H.D.; Yang, X.C.; Feng, X.M.; Qian, X.; Hu, Y.G.; Ren, C.Z.; Zeng, Z.H. Rhizodeposition of Nitrogen and Carbon by Mungbean (Vigna radiata L.) and Its Contribution to Intercropped Oats (Avena nuda L.). PLoS ONE 2015, 10, e0121132. [Google Scholar] [CrossRef]
  43. Zhao, J.; Chen, J.; Beillouin, D.; Lambers, H.; Yang, Y.D.; Smith, P.; Zeng, Z.H.; Olesen, J.E.; Zang, H.D. Global Systematic Review with Meta-Analysis Reveals Yield Advantage of Legume-Based Rotations and Its Drivers. Nat. Commun. 2022, 13, 4926. [Google Scholar] [CrossRef]
  44. Cai, S.Y.; Pittelkow, C.M.; Zhao, X.; Wang, S.Q. Winter Legume-Rice Rotations Can Reduce Nitrogen Pollution and Carbon Footprint While Maintaining Net Ecosystem Economic Benefits. J. Clean. Prod. 2018, 195, 289–300. [Google Scholar] [CrossRef]
  45. Stagnari, F.; Maggio, A.; Galieni, A.; Pisante, M. Multiple Benefits of Legumes for Agriculture Sustainability: An Overview. Chem. Biol. Technol. Agric. 2017, 4, 2. [Google Scholar] [CrossRef]
  46. Nityamanjari, M. Effect of Fertilizers on Growth and Productivity of Potato-A review. Int. J. Agric. Sci. 2018, 10, 5183–5186. [Google Scholar] [CrossRef]
  47. Khaembah, E.N.; Cichota, R.; Vogeler, I. Simulation of Management Strategies to Mitigate Nitrogen Losses from Crop Rotations in Southland, New Zealand. J. Sci. Food Agric. 2021, 101, 4241–4249. [Google Scholar] [CrossRef]
  48. Xiao, H.; van Es, H.M.; Amsili, J.P.; Shi, Q.Q.; Sun, J.B.; Chen, Y.Q.; Sui, P. Lowering Soil Greenhouse Gas Emissions Without Sacrificing Yields by Increasing Crop Rotation Diversity in the North China Plain. Field Crops Res. 2022, 276, 108366. [Google Scholar] [CrossRef]
  49. Yang, X.L.; Gao, W.S.; Zhang, M.; Chen, Y.Y.; Sui, P. Reducing Agricultural Carbon Footprint Through Diversified Crop Rotation Systems in the North China Plain. J. Clean. Prod. 2014, 76, 131–139. [Google Scholar] [CrossRef]
  50. Yang, X.L.; Xiong, J.R.; Du, T.S.; Ju, X.T.; Gan, Y.T.; Li, S.; Xia, L.L.; Shen, Y.J.; Pacenka, S.; Steenhuis, T.S.; et al. Diversifying Crop Rotation Increases Food Production, Reduces Net Greenhouse Gas Emissions and Improves Soil Health. Nat. Commun. 2024, 15, 198. [Google Scholar] [CrossRef]
  51. Volsi, B.; Higashi, G.E.; Bordin, I.; Telles, T.S. The Diversification of Species in Crop Rotation Increases the Profitability of Grain Production Systems. Sci. Rep. 2022, 12, 19849. [Google Scholar] [CrossRef]
  52. Li, S.; An, P.L.; Pan, Z.H.; Wang, F.T.; Li, X.M.; Liu, Y. Farmers’ Initiative on Adaptation to Climate Change in the Northern Agro-Pastoral Ecotone. Int. J. Disaster Risk Reduct. 2015, 12, 278–284. [Google Scholar] [CrossRef]
  53. Wang, X.Y.; Li, Y.Q.; Chen, Y.P.; Lian, J.; Luo, Y.Q.; Niu, Y.Y.; Gong, X.W.; Yu, P.D. Temporal and Spatial Variation of Extreme Temperatures in an Agro-Pastoral Ecotone of Northern China from 1960 to 2016. Sci. Rep. 2018, 8, 8787. [Google Scholar] [CrossRef]
  54. Li, Y.; Guan, K.Y.; Schnitkey, G.D.; DeLucia, E.; Peng, B. Excessive Rainfall Leads to Maize Yield Loss of a Comparable Magnitude to Extreme Drought in the United States. Glob. Change Biol. 2019, 25, 2325–2337. [Google Scholar] [CrossRef]
  55. Rezaei, E.E.; Webber, H.; Asseng, S.; Boote, K.; Durand, J.L.; Ewert, F.; Martre, P.; Maccarthy, D.S. Climate Change Impacts on Crop Yields. Nat. Rev. Earth Environ. 2023, 4, 831–846. [Google Scholar] [CrossRef]
  56. Tang, J.Z.; Bai, H.Z.; Zhang, S.H.; Xiao, D.P.; Tianzhu, Z.; Li Liu, D.; Wang, B.; Feng, P.Y. Adaptations of Potato Production to Future Climate Change by Optimizing Planting Date, Irrigation and Fertilizer in the Agro-Pastoral Ecotone of China. Clim. Risk Manag. 2024, 44, 100604. [Google Scholar] [CrossRef]
  57. Fatima, Z.; Ahmed, M.; Hussain, M.; Abbas, G.; Ul-Allah, S.; Ahmad, S.; Ahmed, N.; Ali, M.A.; Sarwar, G.; Haque, E.L.; et al. The Fingerprints of Climate Warming on Cereal Crops Phenology and Adaptation Options. Sci. Rep. 2020, 10, 18013. [Google Scholar] [CrossRef] [PubMed]
  58. Xing, Y.Y.; Wang, X.K. Impact of Agricultural Activities on Climate Change: A Review of Greenhouse Gas Emission Patterns in Field Crop Systems. Plants 2024, 13, 2285. [Google Scholar] [CrossRef]
  59. Moore, C.E.; Meacham-Hensold, K.; Lemonnier, P.; Slattery, R.A.; Benjamin, C.; Bernacchi, C.J.; Lawson, T.; Cavanagh, A.P. The Effect of Increasing Temperature on Crop Photosynthesis: From Enzymes to Ecosystems. J. Exp. Bot. 2021, 72, 2822–2844. [Google Scholar] [CrossRef]
  60. Muhammad, I.; Lv, J.Z.; Wang, J.; Ahmad, S.; Farooq, S.; Ali, S.; Zhou, X.B. Regulation of Soil Microbial Community Structure and Biomass to Mitigate Soil Greenhouse Gas Emission. Front. Microbiol. 2022, 13, 86882. [Google Scholar] [CrossRef]
  61. Sun, Y.R.; Liu, C.; Zhao, M.; Liu, L.; Liang, S.Q.; Wang, Y.J.; Chen, Y.M. Influence of Extreme Rainfall Events on Soil Carbon Release in the Loess Hilly Region, China. Catena 2023, 220, 106652. [Google Scholar] [CrossRef]
  62. Wen, Y.; Freeman, B.; Ma, Q.X.; Evans, C.D.; Chadwick, D.R.; Zang, H.D.; Jones, D.L. Raising the Groundwater Table in the Non-Growing Season Can Reduce Greenhouse Gas Emissions and Maintain Crop Productivity in Cultivated Fen Peats. J. Clean. Prod. 2020, 262, 121179. [Google Scholar] [CrossRef]
  63. Moyano, F.E.; Manzoni, S.; Chenu, C. Responses of Soil Heterotrophic Respiration to Moisture Availability: An Exploration of Processes and Models. Soil Biol. Biochem. 2013, 59, 72–85. [Google Scholar] [CrossRef]
  64. Zhao, M.; Guo, S.L.; Wang, R. Diverse Soil Respiration Responses to Extreme Precipitation Patterns in Arid and Semiarid Ecosystems. Appl. Soil Ecol. 2021, 163, 103928. [Google Scholar] [CrossRef]
  65. Chen, H.; Wang, J.X.; Huang, J.K. Policy Support, Social Capital, and Farmers’ Adaptation to Drought in China. Glob. Environ. Change-Hum. Policy Dimens. 2014, 24, 193–202. [Google Scholar] [CrossRef]
  66. Erbas, B.C.; Solakoglu, E.G. In the Presence of Climate Change, the Use of Fertilizers and the Effect of Income on Agricultural Emissions. Sustainability 2017, 9, 1989. [Google Scholar] [CrossRef]
  67. Teixeira, E.I.; de Ruiter, J.; Ausseil, A.G.; Daigneault, A.; Johnstone, P.; Holmes, A.; Tait, A.; Ewert, F. Adapting Crop Rotations to Climate Change in Regional Impact Modelling Assessments. Sci. Total Environ. 2018, 616, 785–795. [Google Scholar] [CrossRef]
  68. Zhang, Q.; Li, J.F.; Singh, V.P.; Xiao, M.Z. Spatio-Temporal Relations Between Temperature and Precipitation Regimes: Implications for Temperature-Induced Changes in the Hydrological Cycle. Glob. Planet. Change 2013, 111, 57–76. [Google Scholar] [CrossRef]
  69. Vanuytrecht, E.; Thorburn, P.J. Responses to atmospheric CO2 concentrations in crop simulation models: A review of current simple and semicomplex representations and options for model development. Glob. Change Biol. 2017, 23, 1806–1820. [Google Scholar] [CrossRef]
Figure 1. The energy equivalent yield (A), net carbon emissions (B), soil carbon sequestration (C) and comprehensive income (D) of different crop rotation patterns. Because of the large number of rotation patterns, only a subset of results is presented. For each evaluation factor, the 228 rotation patterns were ranked according to their values, and the top five (Dark gray) and bottom five (Light gray) patterns were selected for display. In the figure, O denotes oat, P denotes potato, B denotes faba bean, F denotes flax, and X denotes fallow.
Agronomy 16 00381 g001
Figure 2. Production inputs and annual carbon footprint of four crops. Line width represents the amount of production input (kg/hm2) and the annual carbon footprint (kg·CO2/hm2).
Agronomy 16 00381 g002
Figure 3. Proportions of capital investment for four crops within crop rotation patterns. Line width represents the capital investment (CNY/hm2).
Agronomy 16 00381 g003
Figure 4. Effects of eight climate change scenarios on the energy equivalent yield (A), net carbon emissions (B), soil carbon sequestration (C) and comprehensive income (D) of 228 crop rotation patterns. Different letters indicate significant differences among treatments (p < 0.05), bars represent standard error (n = 228). CK, real climate scenario; T1, +2 °C warming; T2, +4 °C warming; T3, +6 °C warming; E1, maximum single-event precipitation of 150 mm; E2, maximum single-event precipitation of 300 mm; T1E1, +2 °C warming combined with 150 mm precipitation; T1E2, +2 °C warming combined with 300 mm precipitation.
Agronomy 16 00381 g004
Figure 5. Comprehensive benefits of 228 rotation patterns under the T1E1 (A) and T1E2 (B) climate scenarios. Because of the large number of rotation patterns, only a subset of results is shown. For each evaluation factor, the 228 rotation patterns were ranked by their values, and the top five and bottom five patterns were selected for presentation. EEY denotes 10-year total energy equivalent yield, NCE denotes 10-year total net carbon emissions, SCS denotes soil carbon sequestration, and CI denotes 10-year total comprehensive income.
Agronomy 16 00381 g005
Table 1. Calibrated APSIM parameters for four crops.
CropsParameters *Values
Oaty_tt_end_of_juvenile180
y_tt_floral_initiation400
y_tt_flowering120
y_height1500
Rue1.5–1.65
Potatoy_tt_emergence160
tt_earlytuber480
tt_senescing410
y_height500
Rue0.6–1.8
Faba beany_tt_end_of_juvenile381
y_tt_floral_initiation120
y_tt_flowering500
y_height1500
Rue0.95–1.15
Flaxy_tt_end_of_juvenile418
y_tt_floral_initiation250
y_tt_flowering150
y_height1500
Rue1.35
* y_tt_end_of_juvenile denotes thermal time required from end of juvenile stage to floral initiation (°C·d), y_tt_floral_initiation denotes thermal time required from floral initiation stage to flowering (°C·d), y_tt_flowering denotes thermal time required in flowering to start of grain filling (°C·d), y_height denotes maximum plant height (mm), and rue denotes radiation use efficiency (g/MJ). y_tt_emergence denotes degree days from emergence to vegetation (°C·d), tt_earlytuber denotes degree days from early tuber to senescing (°C·d), tt_senescing denotes degree days from senescing to senesced (°C·d).
Table 2. Carbon emission parameters of agricultural inputs in crop rotation.
ItemsEmission ParametersUnitsSources
Nitrogen fertilizer4.96kg·CO2/kgLiu et al. [35]
Phosphate fertilizer1.14kg·CO2/kgLiu et al. [35]
Pesticide6.58kg·CO2/kgLiu et al. [35]
Diesel3.32kg·CO2/kgLiu et al. [35]
Oat seeds *1.16kg·CO2/kgLiu et al. [35]
Potato seeds0.58kg·CO2/kgCLCD 0.7
Faba bean seeds *1.18kg·CO2/kgLiu et al. [35]
Flax seeds *0.83kg·CO2/kgGan et al. [36]
Labor0.86kg·CO2/d·personLiu et al. [35]
* The carbon emission parameters for oat, faba bean, and flax seeds were estimated based on the values for wheat, soybean, and rapeseed, respectively.
Table 3. Comparison of simulated and observed yields for different crops.
CropsRMSE (kg/hm2)NRMSEMAE (kg/hm2)
Oat107.24.3%78.1
Potato947.315.4%925.1
Faba bean336.111.8%279.4
Flax101.87.9%89.7
Disclaimer/Publisher’s Note: The statements, opinions and data contained in all publications are solely those of the individual author(s) and contributor(s) and not of MDPI and/or the editor(s). MDPI and/or the editor(s) disclaim responsibility for any injury to people or property resulting from any ideas, methods, instructions or products referred to in the content.