Article

Variability of Chlorophyll and Carotenoid Content in the Forest Grass Melica uniflora Retz.

by
Anna Paszkiewicz-Jasińska
1,
Zuzanna Jakubowska
1,
Wojciech Stopa
1,
Waldemar Zielewicz
2 and
Barbara Wróbel
1,*
1
Institute of Technology and Life Sciences–National Research Institute, Falenty, 3 Hrabska Avenue, 05-090 Raszyn, Poland
2
Department of Grassland and Natural Landscape Sciences, Poznań University of Life Sciences, Wojska Polskiego 28, 60-637 Poznań, Poland
*
Author to whom correspondence should be addressed.
Agronomy 2026, 16(3), 339; https://doi.org/10.3390/agronomy16030339

Submission received: 29 December 2025 / Revised: 27 January 2026 / Accepted: 27 January 2026 / Published: 29 January 2026
(This article belongs to the Collection Crop Physiology and Stress)

Abstract

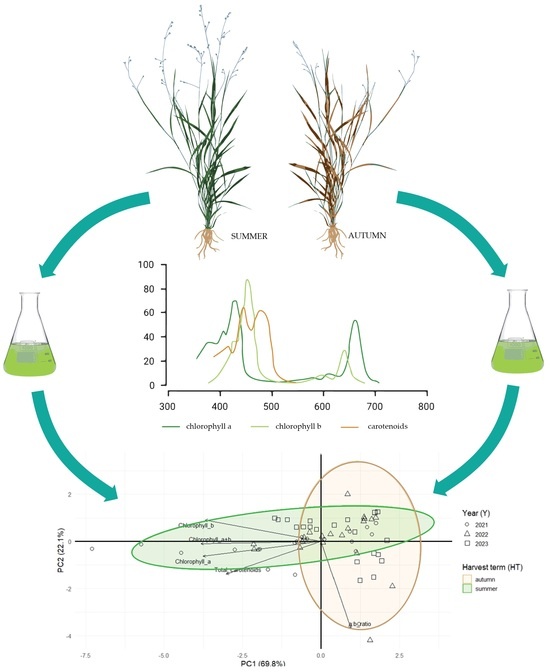
Chlorophylls and carotenoids are key plant metabolites involved in photosynthesis, stress responses, and antioxidant activity. This study aimed to examine intrapopulation variability in Melica uniflora Retz. (wood melick), focusing on chlorophyll and carotenoid content in relation to the developmental stage and environmental conditions. Research was carried out over three consecutive years (2021–2023) in the Ślęża Massif near Sobótka, Lower Silesia, Poland. Leaf blades samples were collected annually from ten natural forest sites at two time points: summer (July) and autumn (October), and analyzed for chlorophyll a, chlorophyll b, and total carotenoids using spectrophotometry. Statistical analyses, including ANOVA, were used to assess the effects of year, harvest time, and site on pigment concentrations. The average (±SD) pigment content in M. uniflora was 1.44 ± 0.73 mg∙g−1 DM for chlorophyll a, 0.67 ± 0.40 mg∙g−1 DM for chlorophyll b, and 0.46 ± 0.28 mg∙g−1 DM for total carotenoids. Among the factors studied, year and developmental stage had the strongest statistically significant influence on chlorophyll and carotenoid levels, while site-specific differences contributed to intrapopulation variability to a lesser extent (p < 0.001). Interestingly, the first year of the study showed higher average pigment levels across both harvest times. Summer-collected plants had higher concentrations of all pigments than those collected in autumn. Differences among sites further indicated intrapopulation variability within this species. These findings provide new insights into the natural variability of photosynthetic metabolites in forest grasses and may serve as a reference for studies on the adaptive and biochemical responses of woodland plant species to environmental factors.

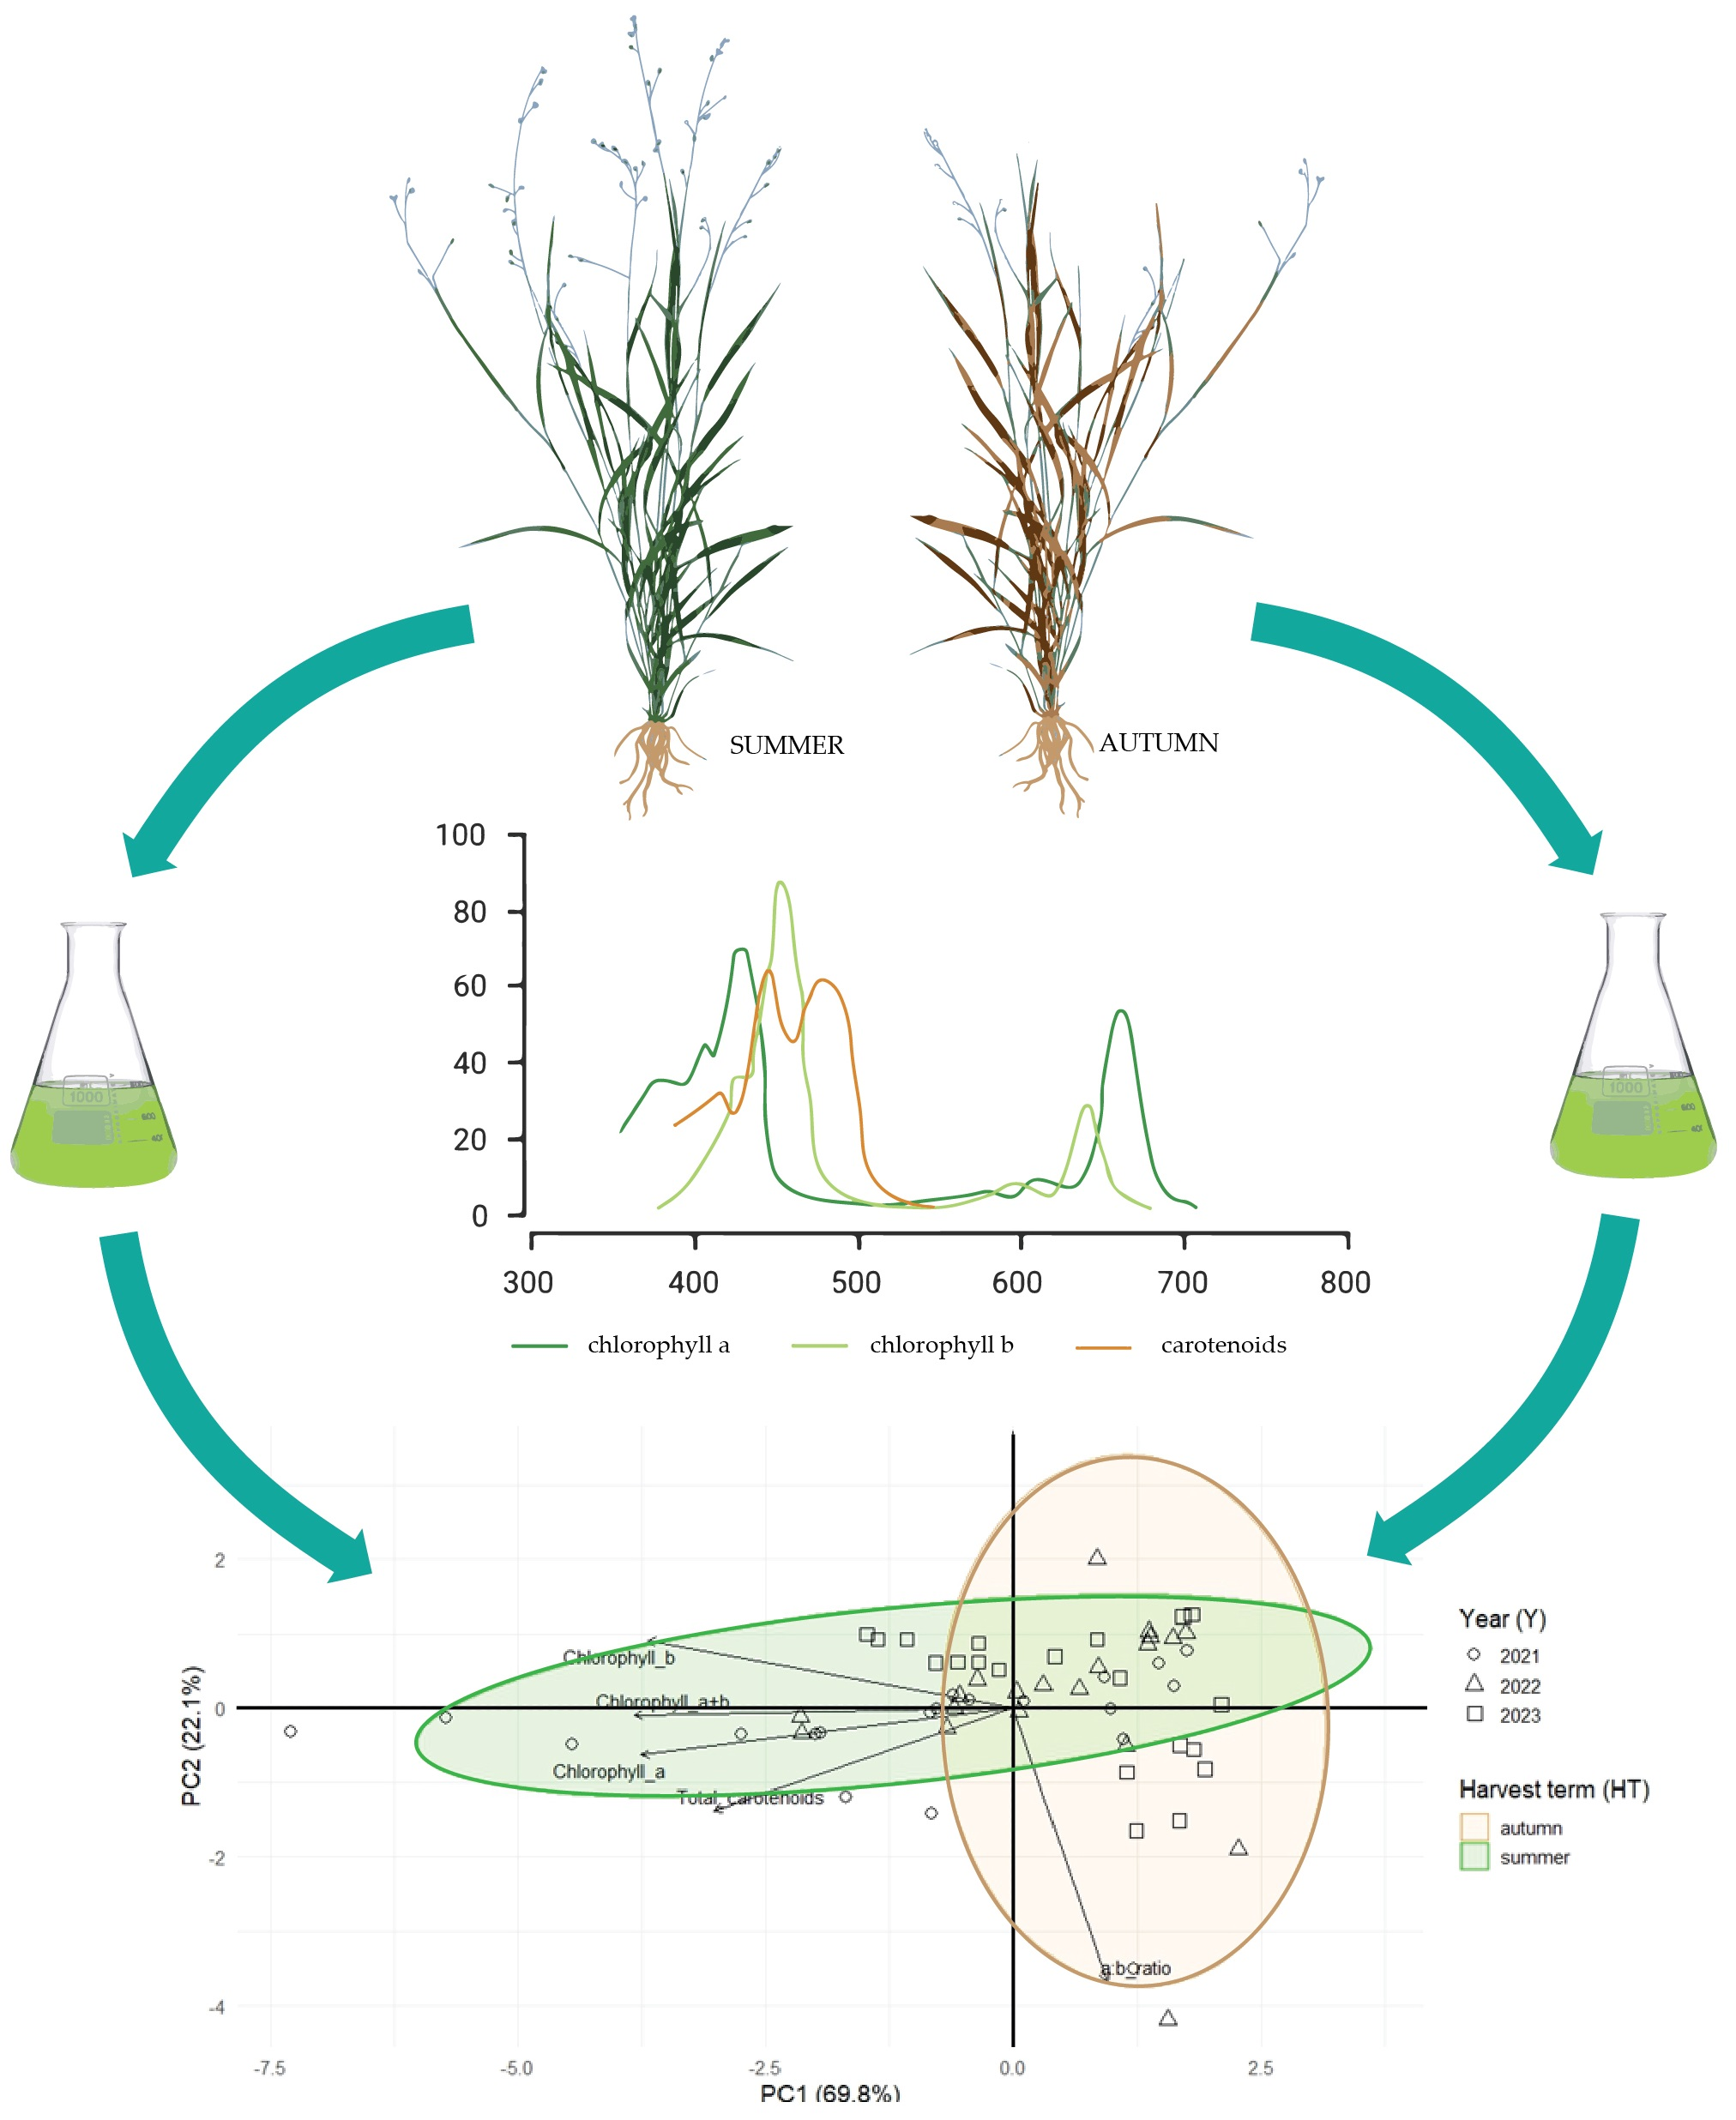
Graphical Abstract

1. Introduction

Plant pigments such as chlorophylls and carotenoids are essential metabolites involved in photosynthesis and plant responses to environmental conditions. These compounds also play important roles as bioactive molecules with antioxidant properties, contributing to the overall phytochemical profile of plants. Photosynthetic pigments, including chlorophyll a, chlorophyll b, and carotenoids, enable plants to convert sunlight into chemical energy [1,2]. Chlorophyll a serves as the primary pigment, absorbing light mainly in the red and blue regions of the spectrum, while chlorophyll b complements it by broadening the range of light absorption and enhancing the efficiency of light utilization. In addition to enhancing light capture, carotenoids protect plants from oxidative damage by functioning as antioxidants. The levels of these pigments directly affect photosynthetic efficiency and overall plant health, which in turn influence growth and productivity. Moreover, chlorophyll and its semi-synthetic derivatives have been used in traditional therapies, including wound healing and anti-inflammatory treatments, and exhibit antimicrobial, anti-mutagenic, anti-carcinogenic, and chemopreventive properties [3,4,5].
Maintaining optimal concentrations of photosynthetic pigments is crucial for plant survival under varying environmental conditions, ensuring proper nutrition and adaptation to abiotic stresses such as drought or excessive light. Beyond their role in photosynthesis, chloroplasts are also involved in the synthesis of phytohormones and a variety of secondary metabolites that help plants cope with environmental stresses, including drought, salinity, and high light intensity [6]. Monitoring chlorophyll content can therefore serve as an early indicator of stress, allowing for the evaluation of plant physiological status in different habitats. Understanding pigment variability is thus essential not only for assessing photosynthetic performance but also for exploring the adaptive and biochemical potential of plants.
Previous studies have shown that the content of photosynthetic pigments in forest grasses is closely linked to environmental conditions within the forest [7,8]. Limited light availability in these environments often results in lower chlorophyll a and b levels compared with grasses growing in open areas. Under such reduced light conditions, grasses can increase the chlorophyll b to a ratio, enhancing their ability to utilize the available light. Additionally, forest grasses may exhibit higher carotenoid levels, which help protect them from oxidative stress. Seasonal changes in factors such as day length and temperature further influence pigment variability, generally leading to higher levels in spring and summer and lower levels in autumn [7].
The genus Melica L. comprises about 90 recognized species of long-day flowering perennials that grow in dense clumps or spread through rhizomes [9]. Melica L. exhibits several traits that make it a promising model for Pooideae grasses, including relatively short generation times, perennial growth, and notable variation in physiology and morphology [10]. In Poland, the genus is represented by five native species, two of which are forest species. One of these is M. uniflora Retz. (wood melick), a perennial grass commonly found in deciduous forests throughout Europe, primarily in shaded habitats [11,12]. M. uniflora is characteristic of the Galio odorati–Fagetum community (Rübel 1930 ex Sougnez & Thill, 1959), which represents the poorest form of beech forest. The dominant species in this community is Fagus L., accompanied by Quercus L. and Carpinus L. [13]. Beyond its ecological role as ground cover that prevents soil erosion and serves as a potential food source for forest fauna [14,15], M. uniflora has attracted limited attention of physiology researchers.
As a dominant understory species in shaded forest habitats, the photosynthetic performance of M. uniflora is closely linked to its ability to maintain carbon dioxide assimilation under low and seasonally variable light conditions. Variation in the content of photosynthetic pigments may therefore reflect adaptive responses to the understory microclimate and contribute to the ecological functioning of this species as forest ground cover. Despite its ecological importance, information on the physiological and biochemical characteristics of M. uniflora remains scarce. No studies have yet investigated the content and variability of photosynthetic pigments in this species under natural forest conditions. This study therefore provides the first quantitative assessment of photosynthetic pigment content in M. uniflora, examining within-population variability in relation to plant developmental stage and prevailing weather conditions. We hypothesized that photosynthetic pigment variation in M. uniflora reflects the combined influence of meteorological conditions, plant developmental stage, and habitat-specific environmental factors, which jointly regulate photosynthetic acclimation in forest understory species.
The present study was designed to address the following research questions: (i) how do the contents of chlorophyll a, chlorophyll b, and total carotenoids in M. uniflora vary across years, seasons, and forest sites under natural conditions; (ii) to what extent are these variations associated with plant developmental stage and interannual weather variability; and (iii) do seasonal changes in pigment composition, including the chlorophyll a:b ratio, reflect adaptive responses to understory environmental conditions.

2. Materials and Methods

2.1. Study Area

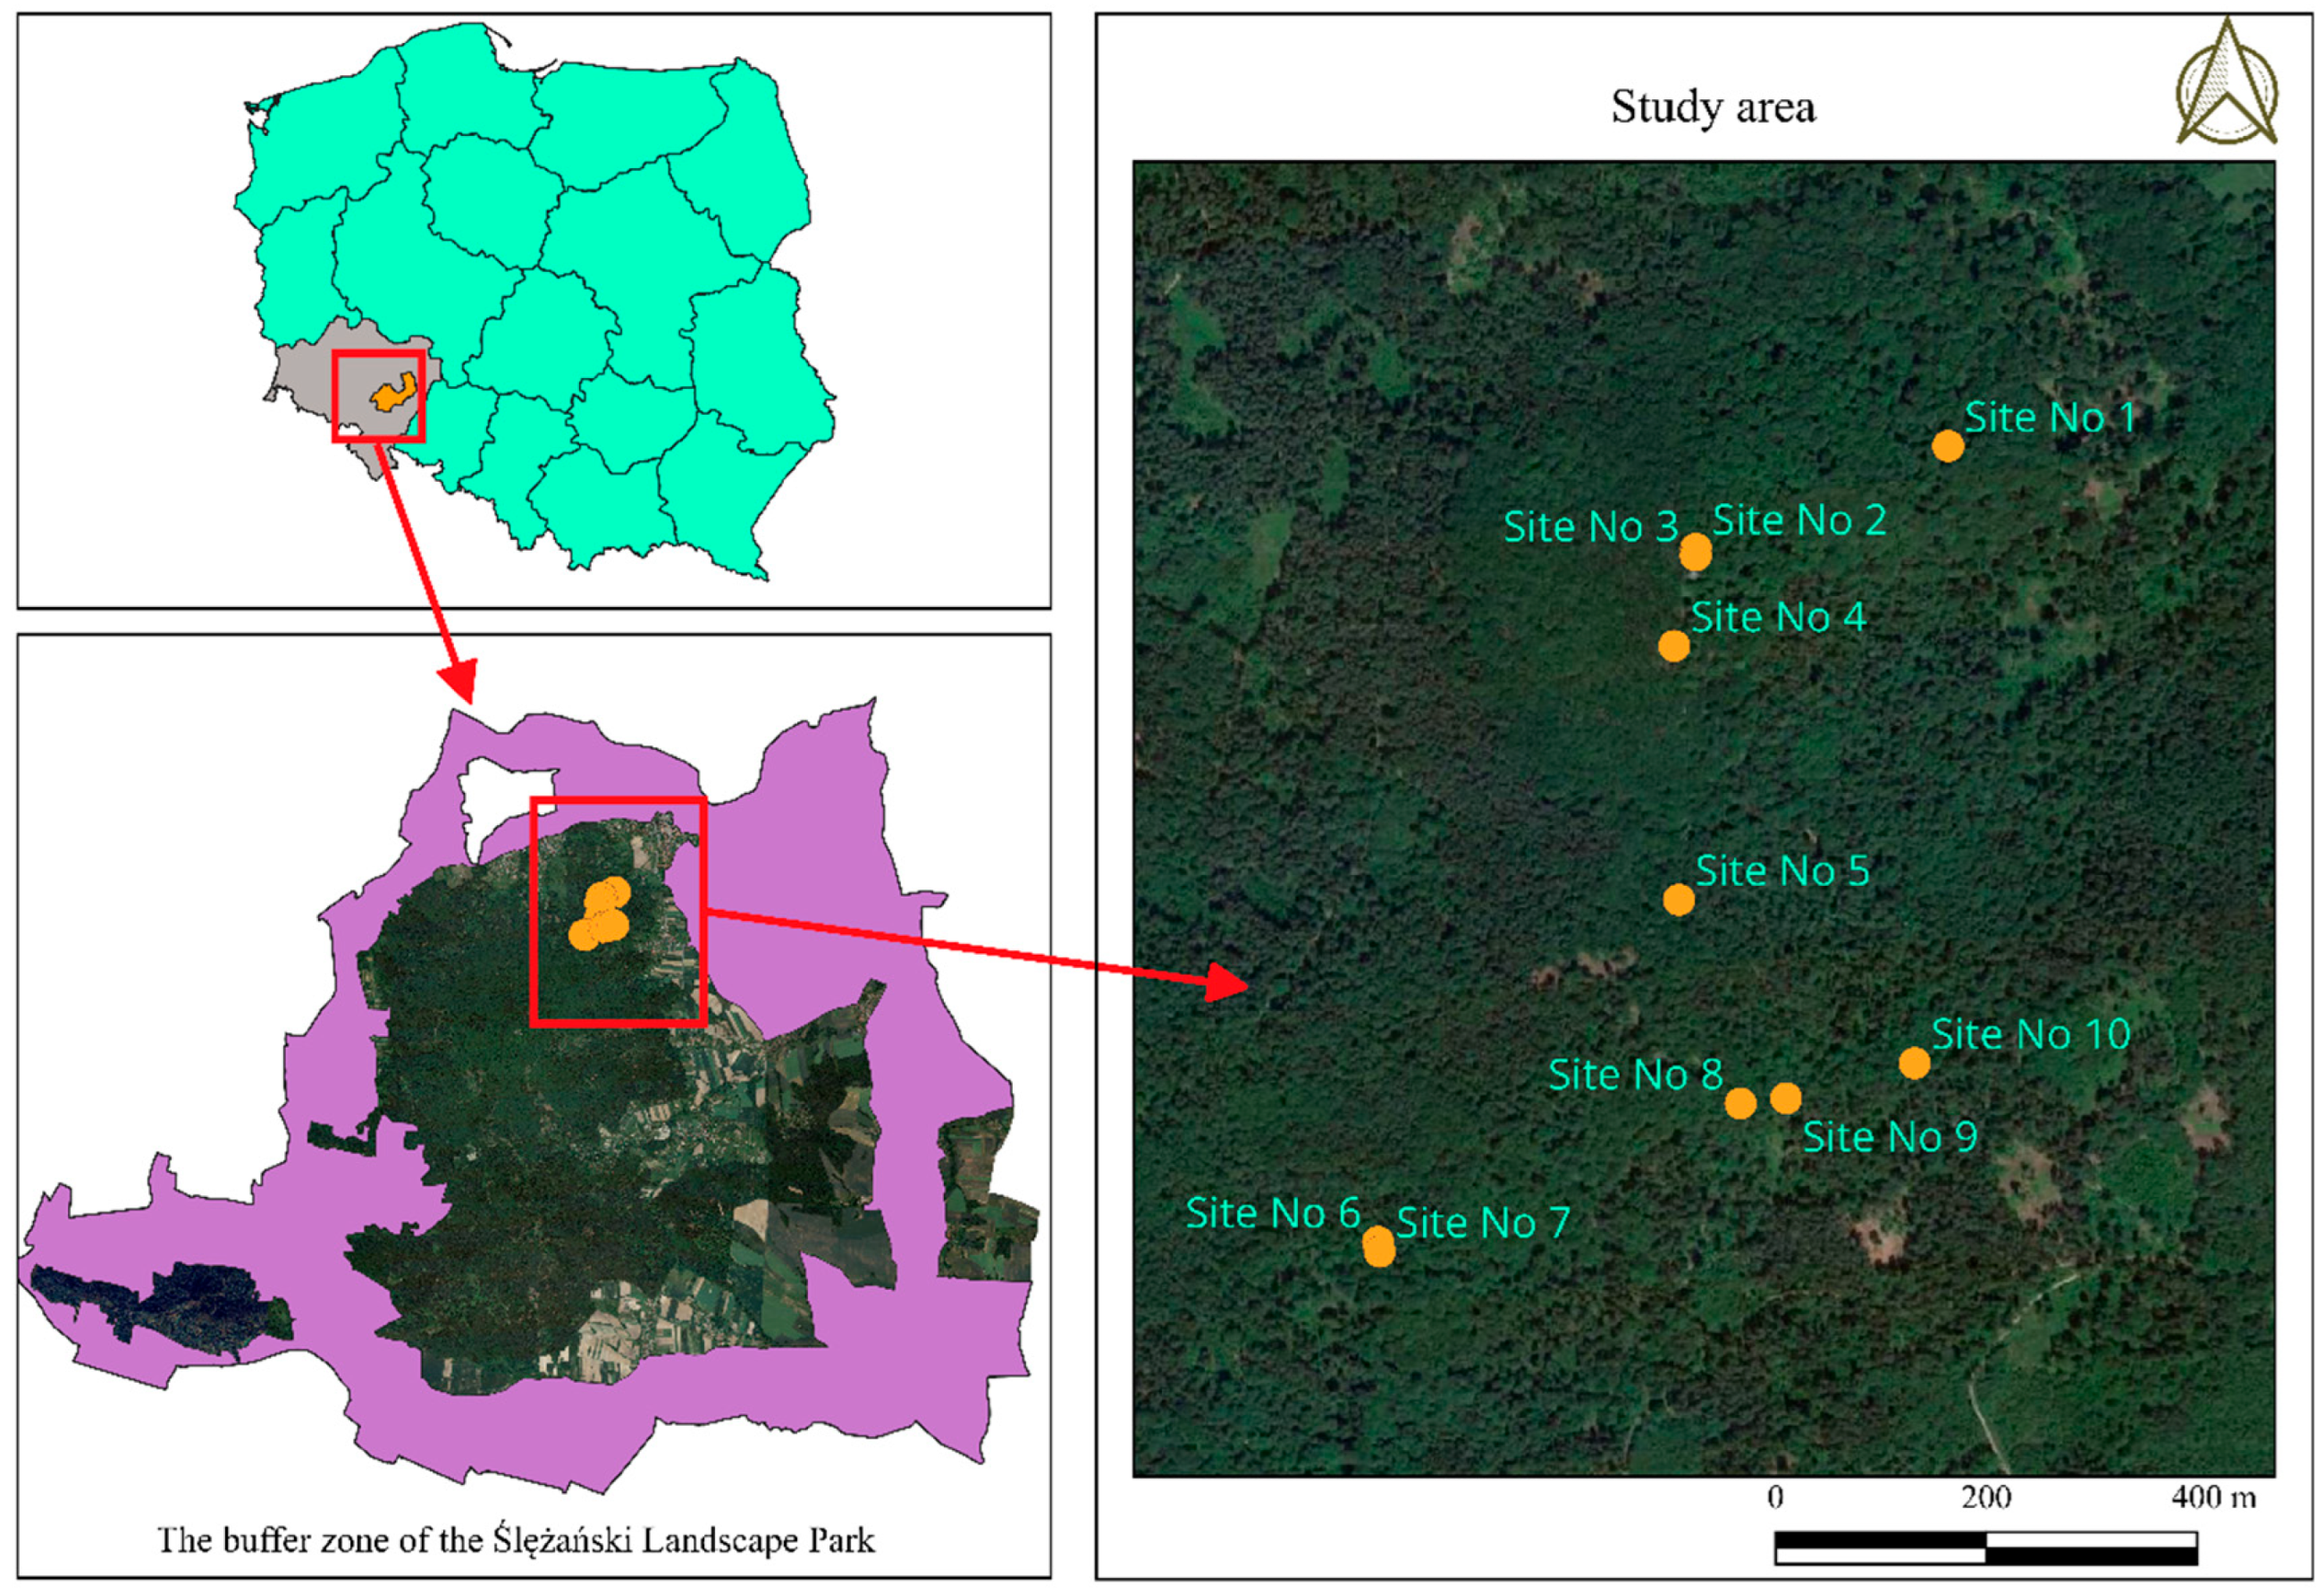
The study was carried out in natural forest habitats within the Ślęża Massif, near the town of Sobótka (50°53′55″ N, 16°44′40″ E) in the Lower Silesian Province, Poland (Figure 1). The Ślęża Massif lies within the Ślężański Landscape Park, which was established to protect the area’s natural and scenic values as well as its cultural and historical heritage. Forests cover approximately 5500 hectares of the park, representing 67% of its total area, while the surrounding buffer zone is predominantly used for agriculture.
The Ślęża Massif is the highest elevation in the Sudeten Foreland. From a physical-geographical perspective, it belongs to the Sudetes and Sudeten Foreland subprovince, within the Bohemian Massif province, and is part of the Non-Alpine Central Europe megaregion [16]. Approximately 84% of the area is forested, mainly with acidophilous beech forests, while a smaller part consists of other forest types, including fertile beech forests.

2.2. Collection of Plant Material

From 2021 to 2023, plant material was collected from ten research points within a single population of M. uniflora in forest habitats of the Ślęża Massif (hereafter referred to as “research sites”). In the first year (2021), site selection was carried out using the marching method described by Küchler [17], which involves traversing the study area on foot to locate the target species. Each selected site was marked with numbered markers to ensure consistent sampling from the same locations in subsequent years. Additionally, the coordinates of each site were recorded using a GPS Trimble Juno SB (Westminster, CO, USA). The characteristics of the research sites are presented in Table 1.
Plant material was collected annually from each site (location) on two occasions: in July, during full generative development, and in October, at the stage of seed maturation. At each location (sites 1–10), three samples were collected per sampling date. Each sample consisted of twenty leaf blades of M. uniflora, taken from the middle portion of the generative shoot. The healthy leaf blades were collected from the middle level of the height of generative shoots of M. uniflora plants. The samples were put in sealed paper envelopes with the site number and date of harvest. The samples were transported to the laboratory for the analysis of chlorophyll a, chlorophyll b, and total carotenoid content.

2.3. Analysis of Chlorophyll and Carotenoid Pigment Content

The leaves were dried in complete darkness, under paper at room temperature, without the use of lamps or dryers. The leaf blades, after being air-dried in relative darkness (totaling 0.20 g), were milled and extracted by shaking with 30 mL of 80% acetone for 45 min at room temperature. The resulting solution was filtered, and the volume was adjusted to 50 mL with the same solvent. Chlorophyll a and chlorophyll b content in the air-dried biomass was determined following the methods of Lichtenthaler and Alan [18] and Lichtenthaler and Buschmann [19]. The BioTek Instruments, Epoch 2 (Winooski, VT, USA) spectrometer was used to conduct analyses. The samples were filtered through Whatman filter paper (No. 1) (Merck KGaA, Darmstadt, Germany) because it is commonly used in the extraction of plant pigments and is fully chemically compatible with 80% acetone, with particle retention of >11 μm. Absorbance was measured using at wavelengths of 470, 646, and 663 nm. The pigment concentrations were then calculated using the following formulas:
The coefficients wa (chlorophyll a), wb (chlorophyll b) and wk (total carotenoids) were calculated:
w a   =   12.21 · A 663     2.81 · A 646
w b = 20.13 · A 646   5.03 · A 663
w k = 1000 · A 470   3.27 · w a   104 · w b 229
Chlorophyll a content was calculated [mg∙g−1 DM]:
a = w a ·   V 1000 · m
Chlorophyll b content was calculated [mg∙g−1 DM]:
b = w b ·   V 1000 · m
Total carotenoids content was calculated [mg∙g−1 DM]:
k = w k ·   V 1000 · m
where
  • m—sample mass [g]
  • wa—coefficient for chlorophyll a
  • wb—coefficient for chlorophyll b
  • wk—content of total carotenoids [mg∙g−1 DM]
  • V—volume [mL]
  • a—content of chlorophyll a [mg∙g−1 DM]
  • b—content of chlorophyll b [mg∙g−1 DM]
  • k—content of total carotenoids [mg∙g−1 DM]
  • A—absorbance of the test solution

2.4. Soil Analysis

Soil samples were collected from each test site in the first year (2021) from the topsoil layer (0–10 cm). The following parameters were analyzed: nitrogen (N) content using the modified Kjeldahl method; total phosphorus (P) content using the colorimetric method with ammonium heptamolybdate and sodium metabisulfite; potassium (K) content using the emission method; magnesium (Mg) and calcium (Ca) contents using atomic absorption spectrometry (S Series AA spectrometer, Thermo Fisher Scientific, Waltham, MA, USA); soil pH in 1 mol KCl using the potentiometric method [20].

2.5. Meteorological Data Sources

The meteorological data used in this study come from the publicly accessible archive provided by OpenWeatherMap.org [21]. The Selyaninov hydrothermal coefficient (HTC) [22] was calculated using the following formula, based on these meteorological data:
HTC   =   P 10 Σ t
where
  • P—the total monthly rainfall [mm],
  • Ʃt—the monthly total of average daily air temperatures > 0 °C.

2.6. Statistical Analyses

The data were first assessed for normality using the Shapiro–Wilk test and for homogeneity of variance with Levene’s test. Following these checks, a three-way analysis of variance (ANOVA) was conducted to examine the effects of year (Y), harvest time (HT), and research site (location, L), as well as their interactions (Y × HT, Y × L, HT × L, and Y × HT × L) on pigment content. All factors were treated as fixed effects. Significant effects were further explored using Tukey’s pairwise comparisons at a 5% significance level. Principal Component Analysis (PCA) and Redundancy Analysis (RDA) were carried out to explore multivariate patterns in the dataset. All graphs and statistical analyses were conducted using Statgraphics 18 and R Studio 4.5.1 software.

3. Results

3.1. Weather Conditions

Table 2 summarizes the weather conditions, including temperature and precipitation, observed during the study period from 2021 to 2023. It also includes the calculated Selyaninov hydrothermal coefficient (HTC) [22].
The year with the highest average temperature during the growing season was 2023, while 2021 recorded the lowest average temperatures. Precipitation was greatest in 2023, totaling 580 mm, followed by 522 mm in 2021 and 501 mm in 2022. In all three years, August consistently had the highest precipitation levels. These observations are in line with the Selyaninov hydrothermal coefficient (HTC), which classified August as quite humid throughout the study period. According to the HTC, the 2021 growing season was considered quite dry, whereas the 2022 and 2023 seasons were classified as dry. The most pronounced variation occurred in 2021, when August was categorized as quite humid and October as extremely dry.

3.2. Soil Conditions at the Study Sites

The analysis showed that soil fertility and pH varied among the different locations where M. uniflora was found (Table 3).
The greatest variation in a given trait in the studied population was observed for Ca, where there was 95.9% variation between locations. The smallest variation was observed for K (20.4) and pH (26.4). All parameters showed at least moderate variability (>15%), while N, P, Mg, and Ca can be classified as high (>35%).

3.3. Chlorophyll a and Chlorophyll b Content

The chlorophyll content in the leaf blades of M. uniflora showed significant variation over the three-year study period. It depended on the year of study, harvest time and site (location), with all main effects and their interactions being statistically significant (Table 4). Among the analyzed factors, the harvest date had the strongest influence on the content of photosynthetic pigments. In all years of the study and at all sites, the concentrations of the assessed photosynthetic pigments were higher in summer than in autumn. In contrast, the chlorophyll a:b ratio was higher in autumn than in summer, indicating seasonal changes in the proportion of pigments between sampling dates.
In addition to temporal variability, chlorophyll content also differed between the studied sites. Site 7 was characterized by the highest concentrations of both chlorophyll a and chlorophyll b, while lower pigment contents were recorded at the other sites. The lowest values were found at sites 4 and 5. Similar relationships were observed for total chlorophyll content (a + b) (Table 4). The analysis also revealed a significant interaction between year and harvest date (Table 5). In 2021, the differences between summer and autumn were particularly pronounced, with samples collected in summer characterized by significantly higher concentrations of chlorophyll a, chlorophyll b and, as a result, chlorophyll a + b. In 2022 and 2023, the differences between the dates were less pronounced but still statistically significant. The variability of the chlorophyll a:b ratio was also influenced by the interaction between the year and the collection date. The highest values were recorded in autumn 2023, and the lowest in summer of the same year (Table 5).
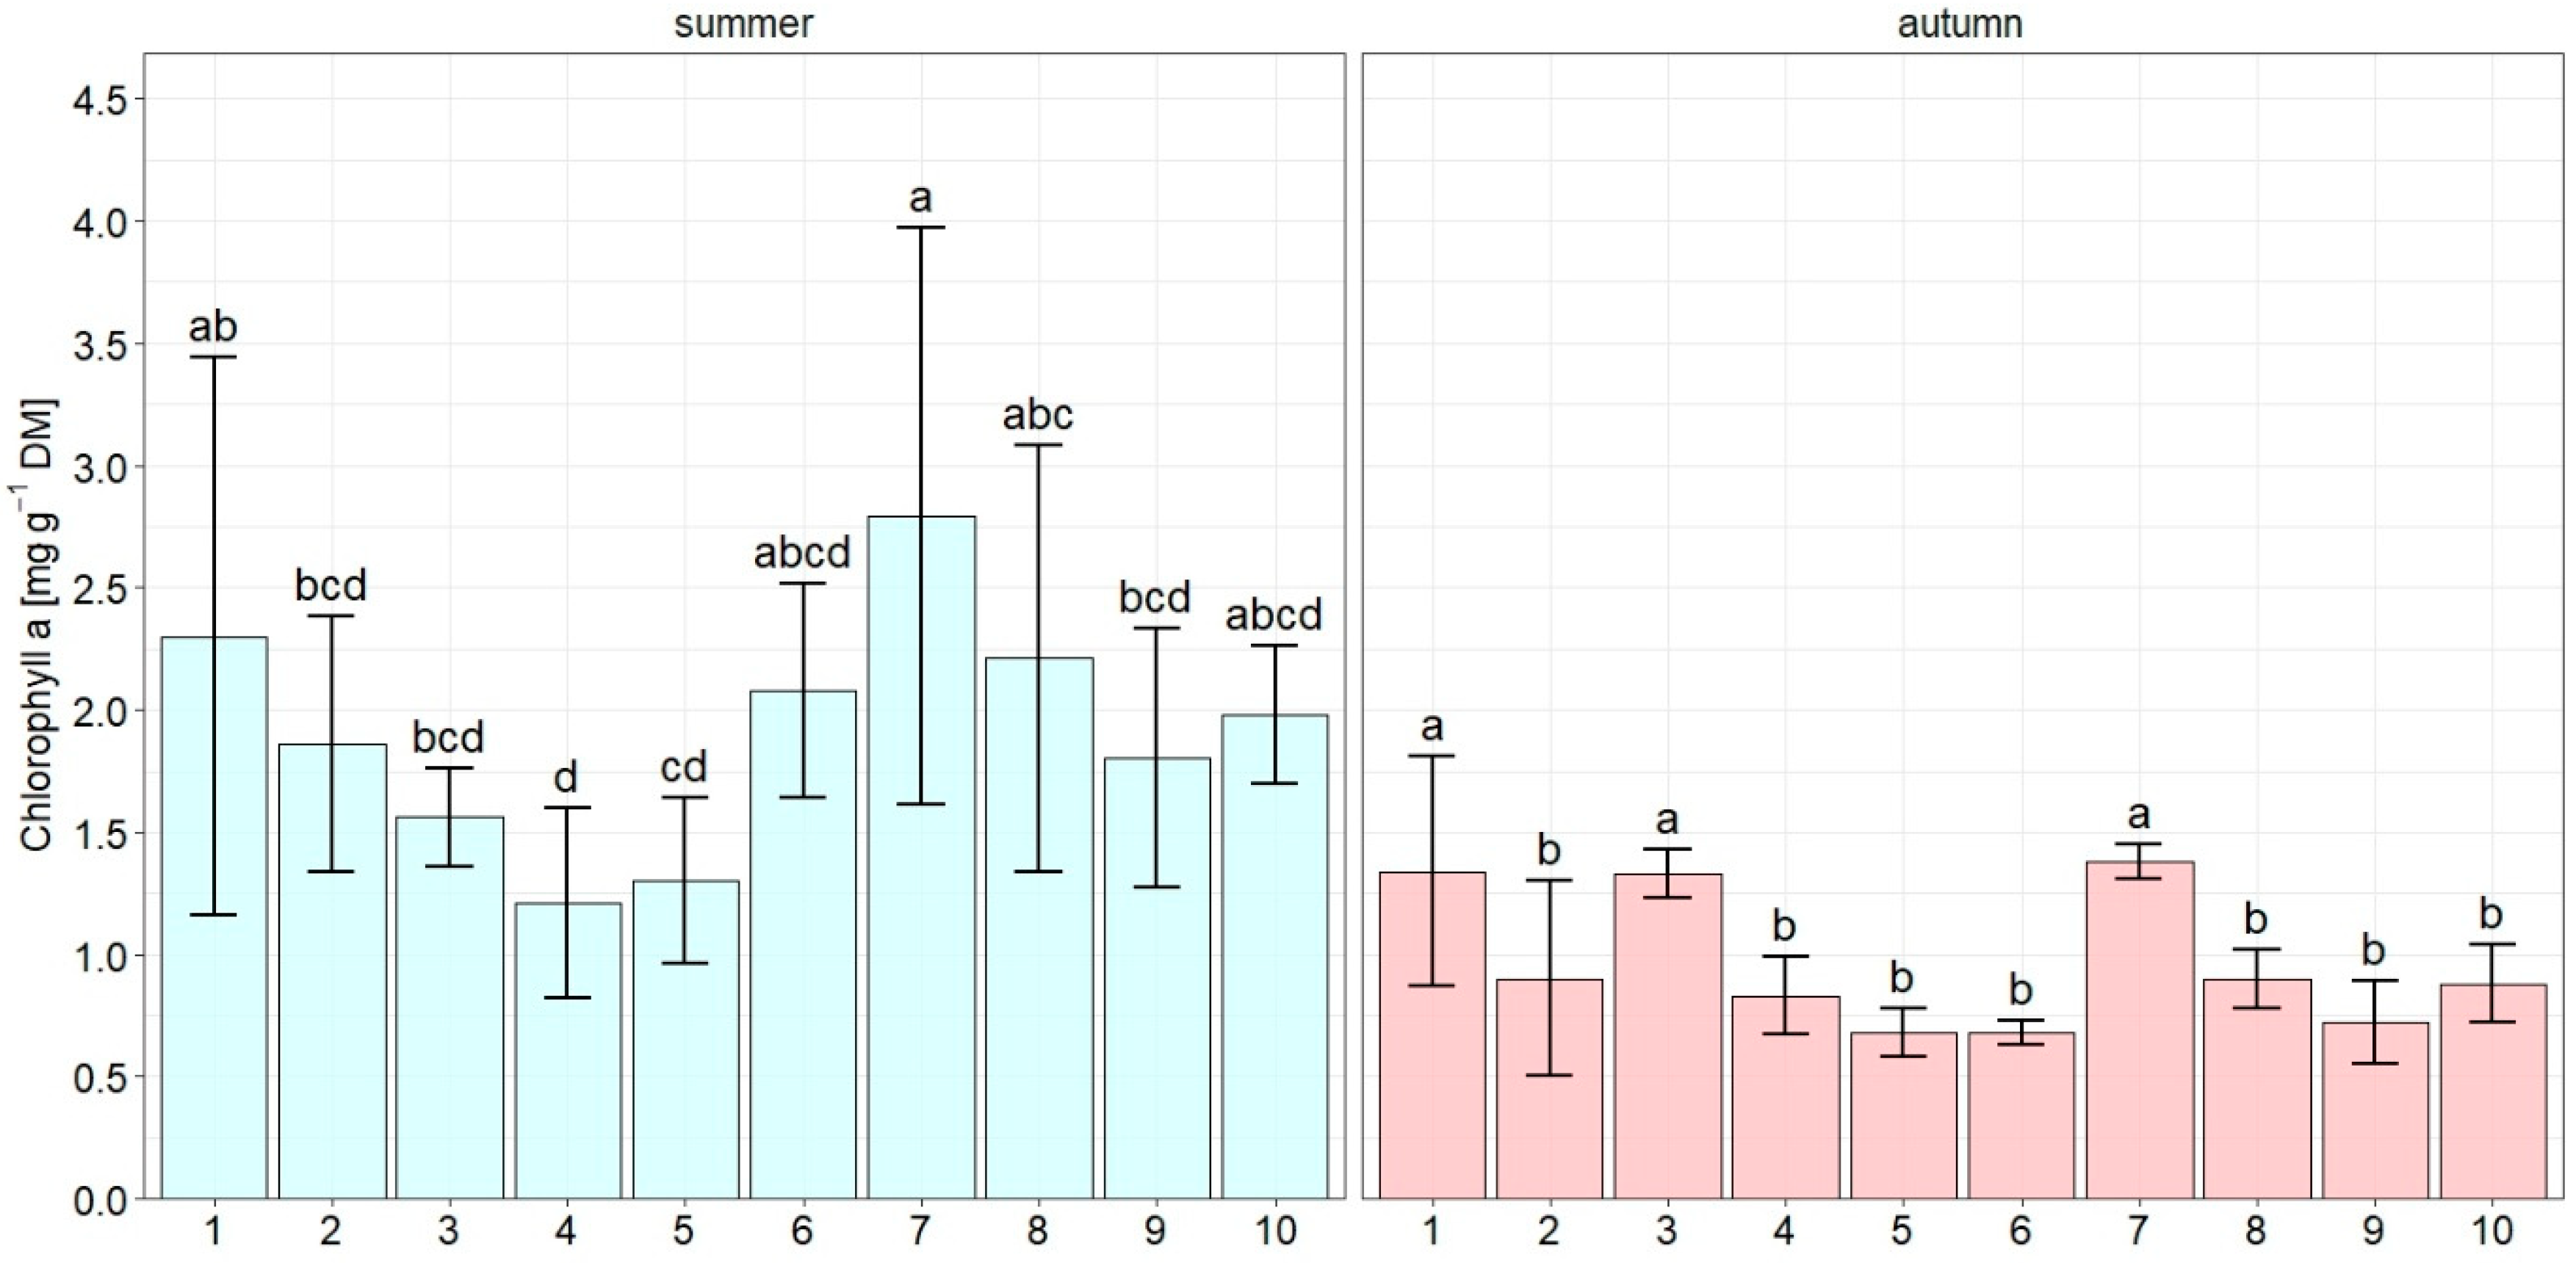
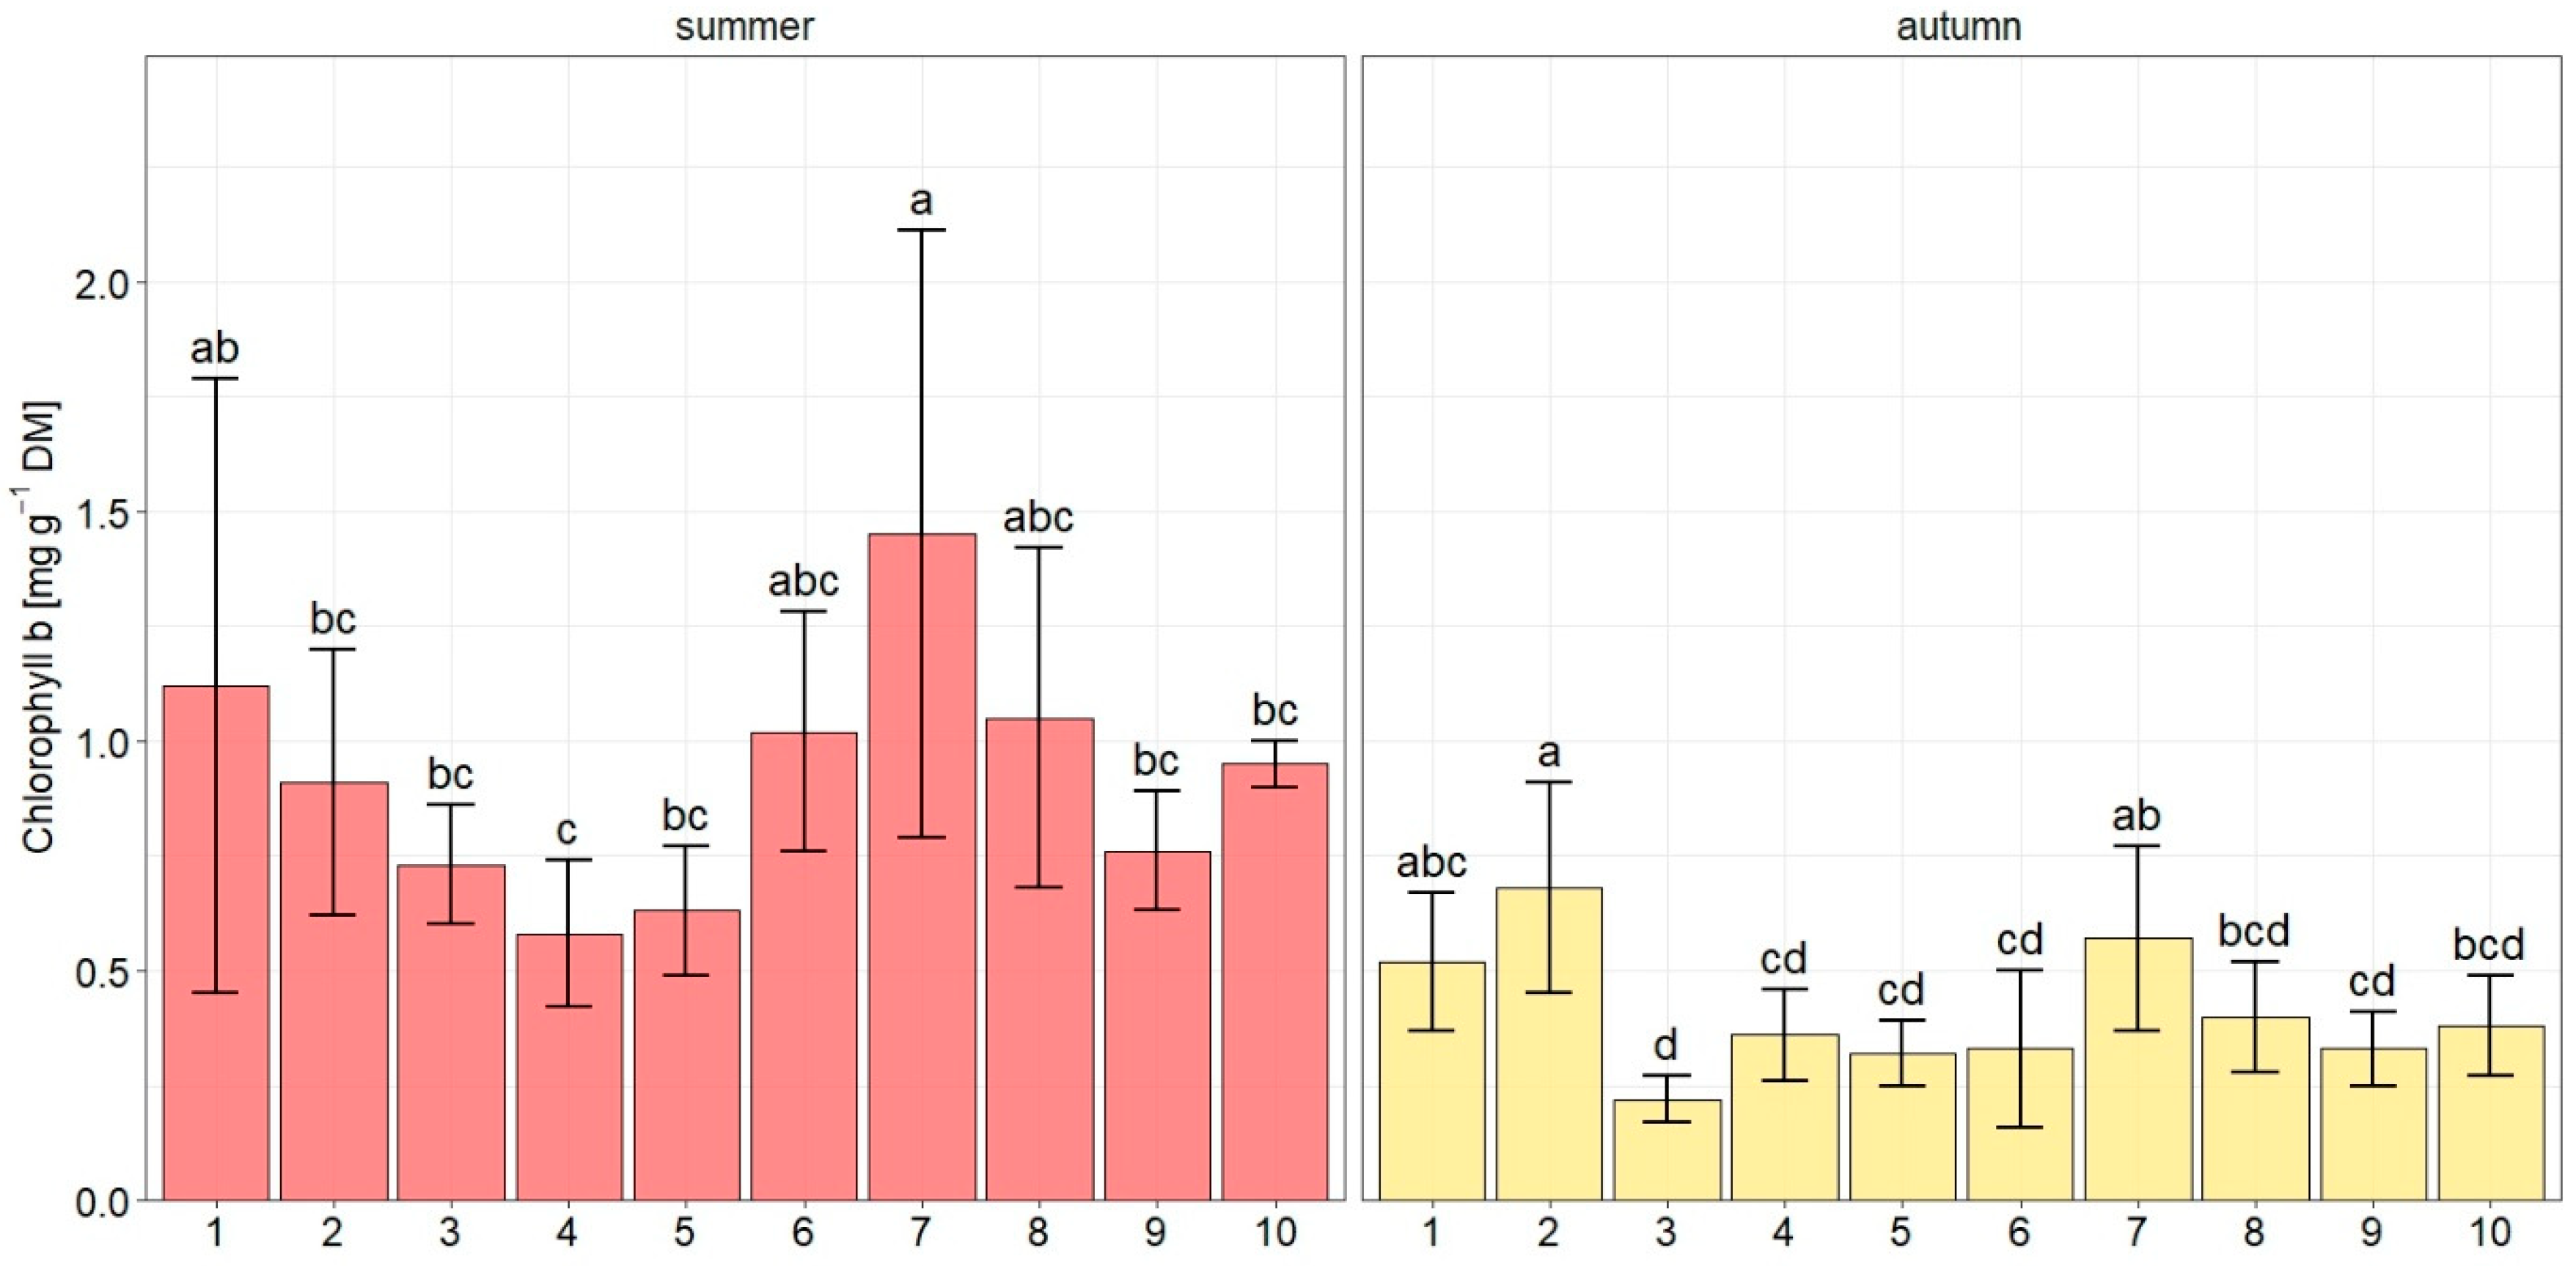
A significant interaction between harvest date and location was also demonstrated, indicating that spatial variation in both chlorophyll a (Figure 2) and chlorophyll b (Figure 3) content depended on the sampling season. During the summer, chlorophyll a content showed clear variation between sites, with the highest values recorded at site 7 and the lowest at site 4. In autumn, the range of spatial variation in chlorophyll a content was significantly smaller, indicating a more even level of this pigment between sites (Figure 2).
A similar relationship was observed for chlorophyll b. In summer, its content was more spatially diverse, with the highest values at site 7 and the lowest at site 4. In autumn, the differences in chlorophyll b content between individual sites were less noticeable (Figure 3).

3.4. Total Carotenoids Content

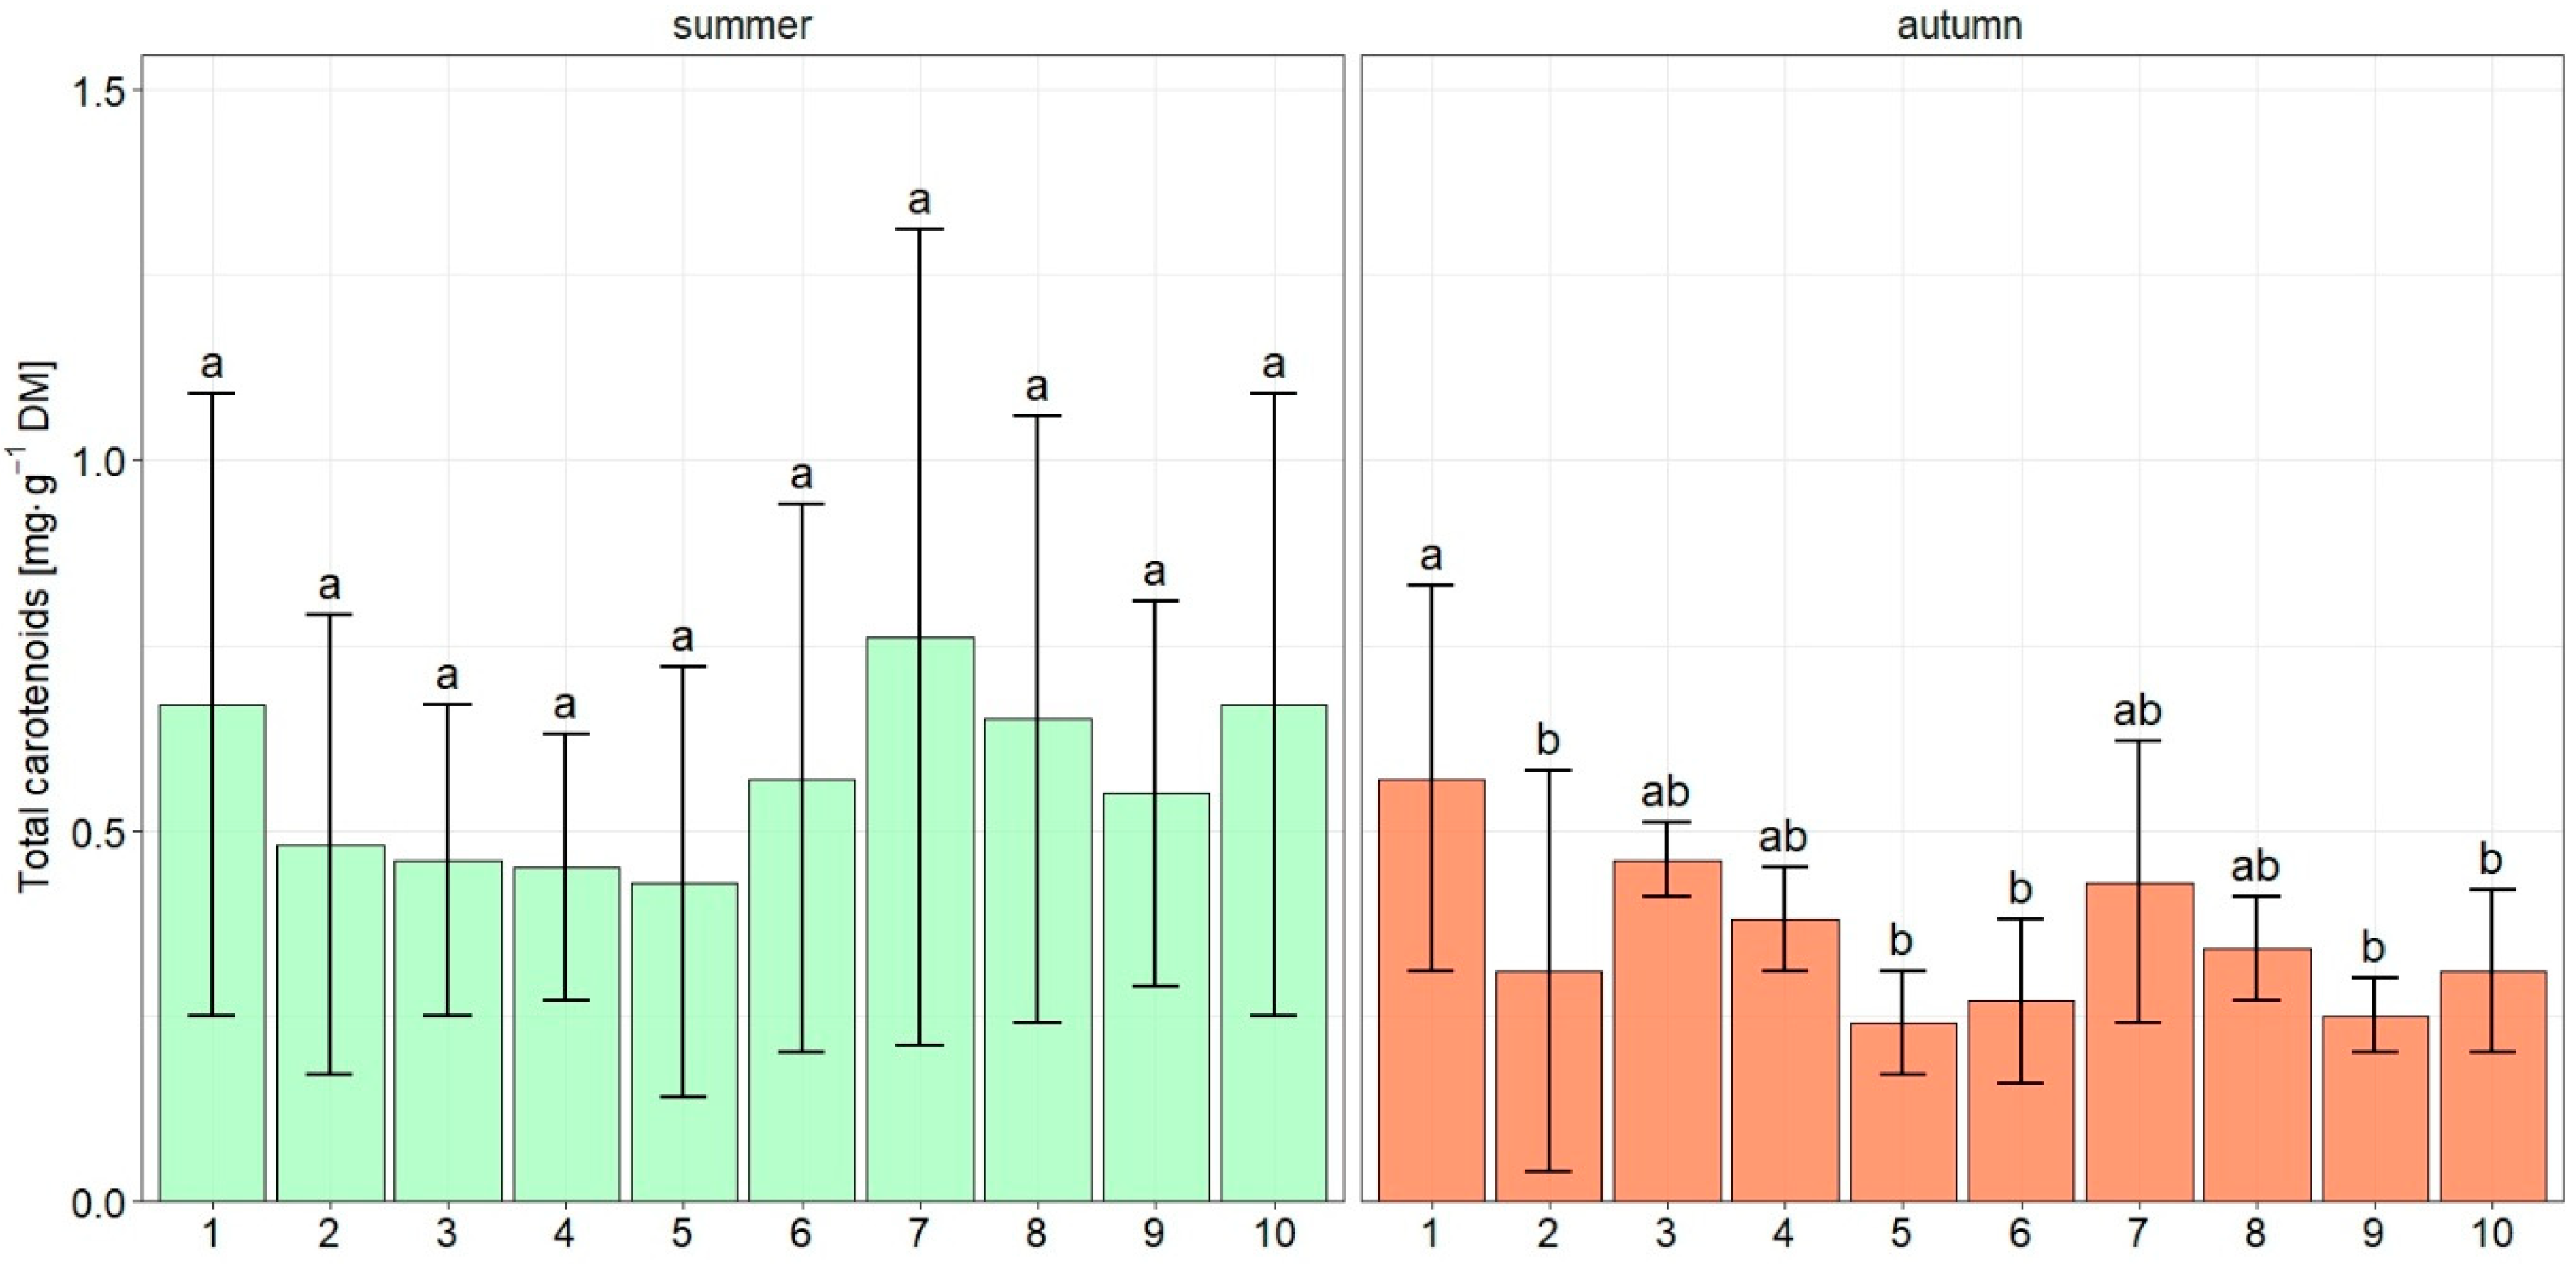
The carotenoid content in the leaf blades of M. uniflora showed significant variation over the three-year study period. It depended on the year of the study, the harvest date and the location, and the results obtained were statistically significant, as were their interactions (Table 4). Among the analyzed factors, the years of research had the strongest impact on carotenoid content. The highest carotenoid content was found in the first year (2021) and the lowest in the last year of research (2023). The sampling date and location also had a significant impact on carotenoid content. Carotenoid levels were higher in summer than in autumn. In addition to variability between years and sampling dates, carotenoid content also differed significantly between the locations studied. The leaf blades of plants from sites 1 and 7 had the highest carotenoid content, while those from site 5 had the lowest (Table 4). The analysis also revealed a significant interaction between the year of the study and the date of plant material collection in the first two years of the study (Table 5). In 2021, the differences between summer and autumn were particularly pronounced, with samples collected in summer having a significantly higher content than those collected in autumn. In 2022, the differences between the dates were less pronounced but still statistically significant. In the last year of the study, the harvest date had no significant effect on carotenoid content. A significant interaction between harvest time and location was also demonstrated, but only in autumn (Figure 4). In autumn, carotenoid content showed significant variation between site 7 (with the highest carotenoid content) and sites 2, 5, 6, 9, and 10 (the lowest values).

3.5. Principal Component Analysis (PCA)

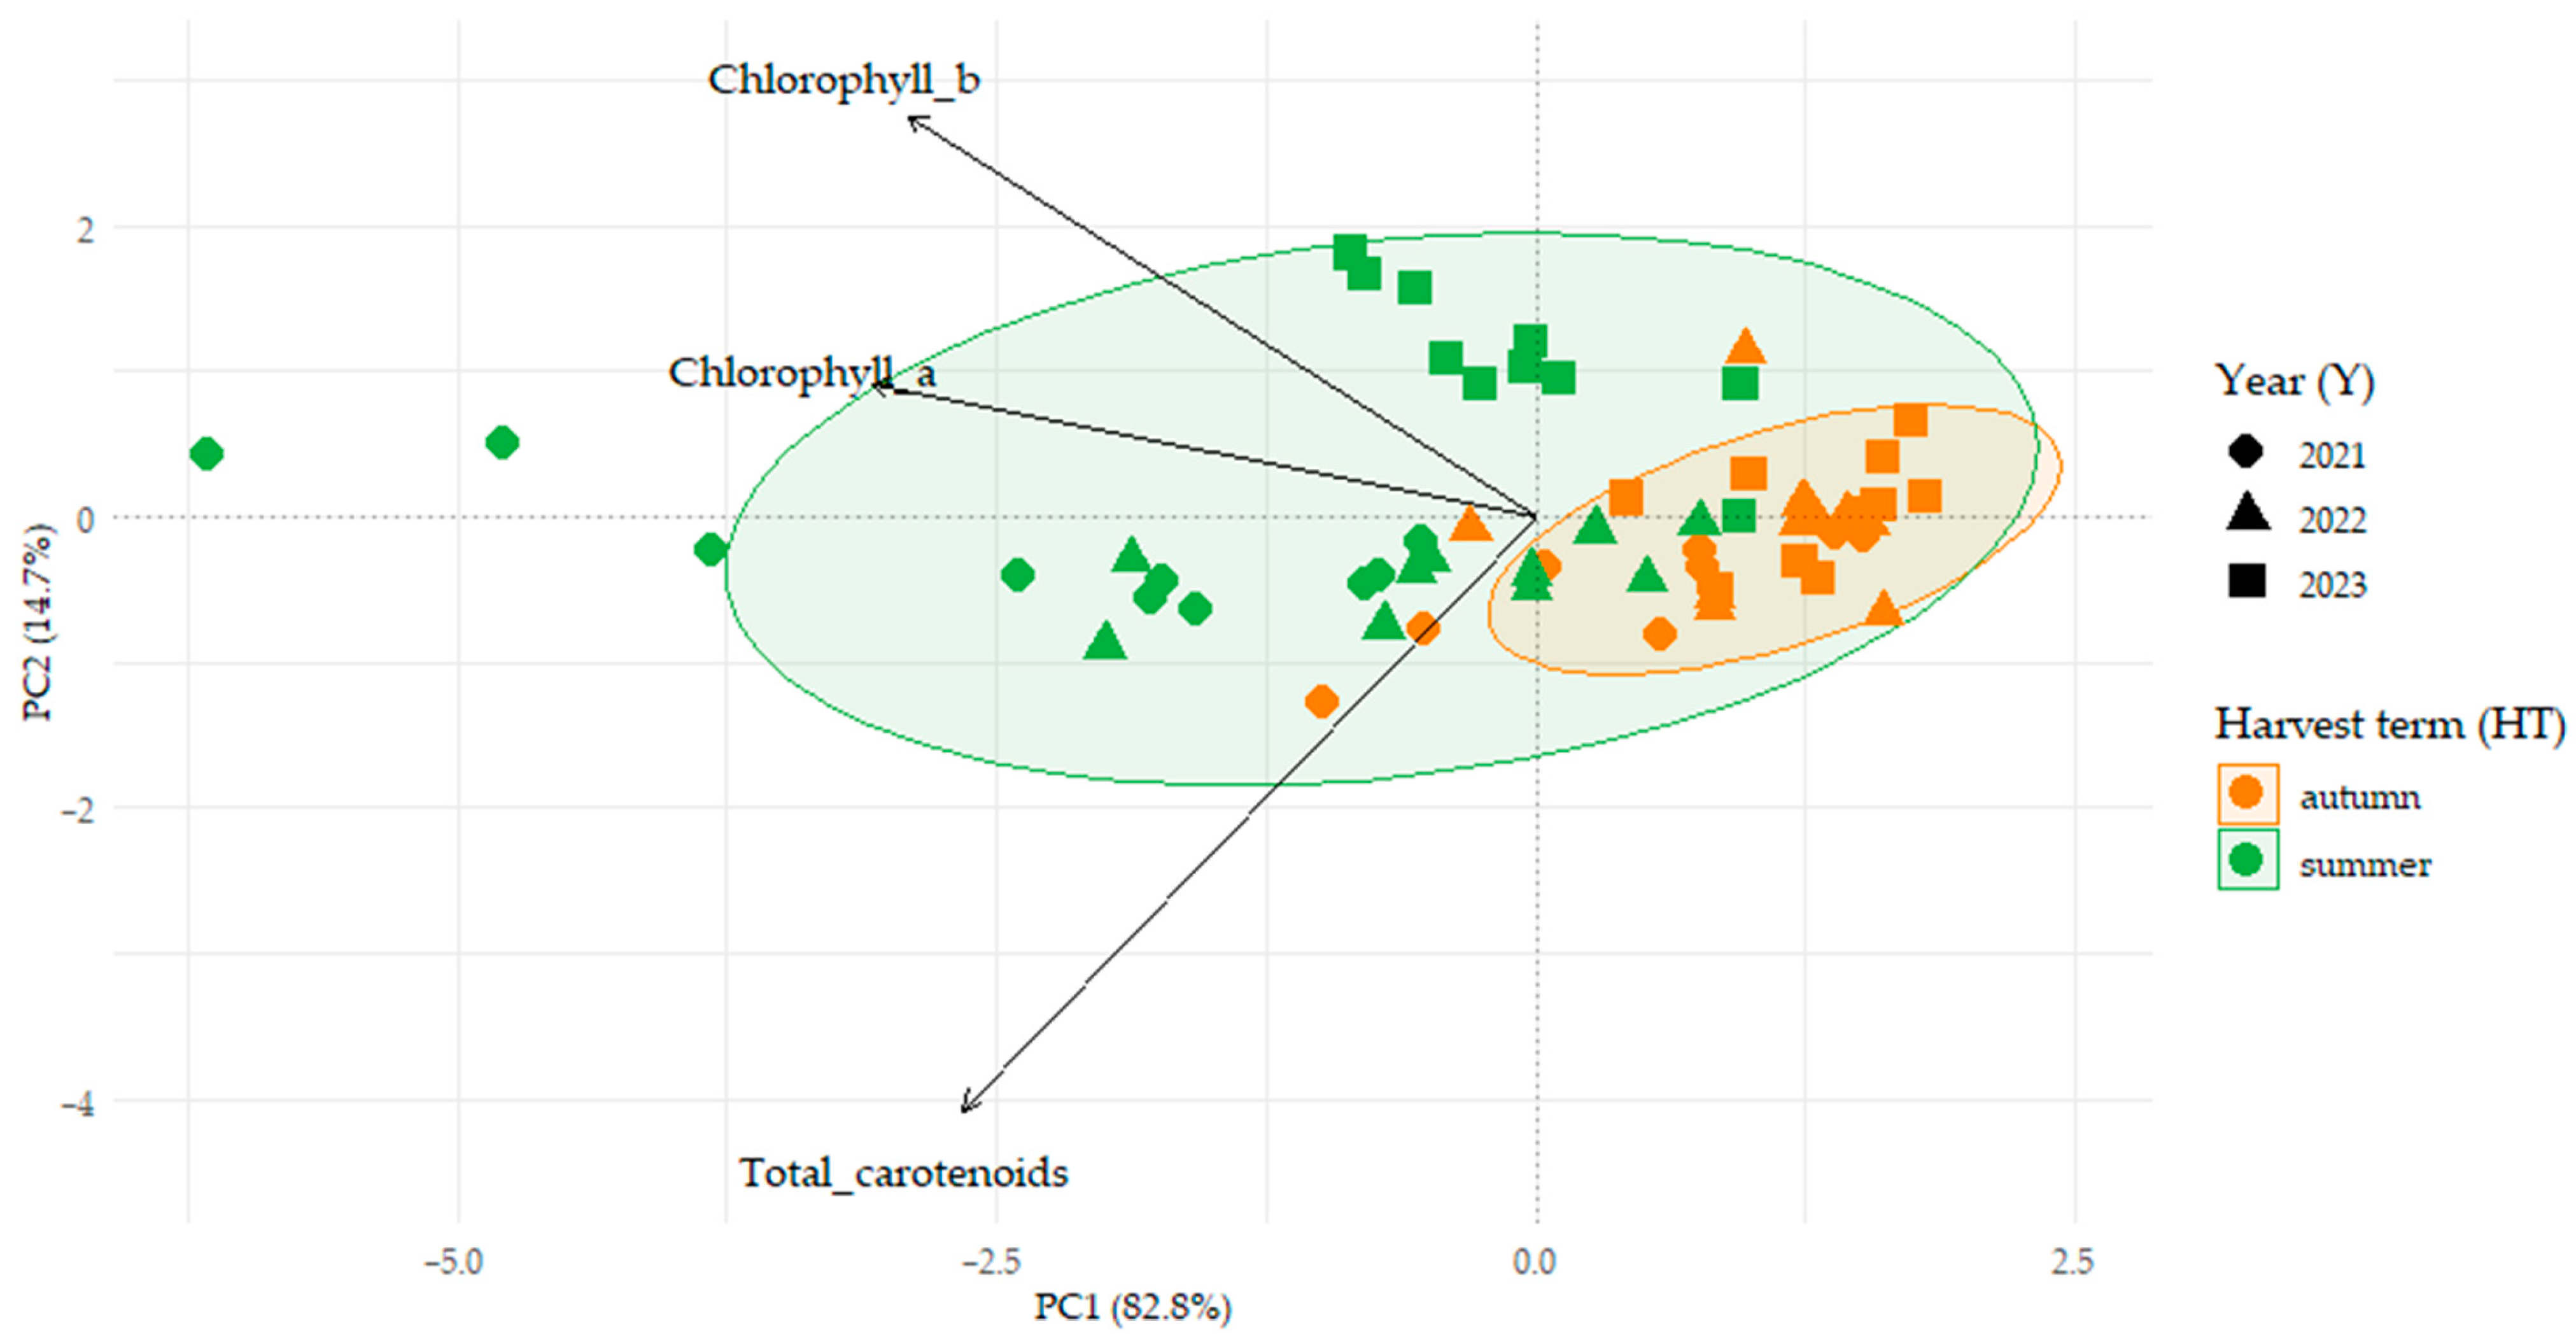
The first two principal components explain collectively 97.5% of the total variance in the dataset (Figure 5). First principal component (primary) accounts for 82.8% of the variance and is strongly correlated with concentrations of most of the parameters studied. Second principal component (secondary) explains additional 14.7% of the variance and is predominantly driven by total carotenoids content. The PCA biplot reveals a distinct separation of group centroids along the PC1 axis, suggesting significant seasonal shifts in pigment composition between summer and autumn. The 95% confidence ellipse for the autumn harvest is substantially smaller and almost entirely contained within the summer season range. The shift in autumn samples in the opposite direction of the pigment vectors, coupled with their dense clustering (small ellipse), might suggests a process of seasonal homogenization.
To investigate whether the variability in pigment composition could be explained by soil chemical properties, a redundancy analysis (RDA) was performed. The RDA model explained 9.8% of the observed variability, but the permutation ANOVA test showed that this relationship was not statistically significant (F = 0.964, p = 0.502). This suggests that soil factors were not the main driver of variability in pigment content under the studied conditions.

4. Discussion

4.1. Photosynthetic Pigments in Forest Grasses

So far, most studies have focused on the content of photosynthetic pigments in forage grass species, while only a few have examined chlorophyll and carotenoid levels in the leaves of forest grasses in Poland [7,14], particularly those belonging to the genus Melica L. [8]. Our study contributes to this body of knowledge by demonstrating how environmental conditions, harvest date, and site location influence the concentrations of chlorophyll a, chlorophyll b, and total carotenoids in the leaf blades of M. uniflora. To our knowledge, this is the first study to provide a comprehensive assessment of seasonal and site-specific pigment variability in this species under natural forest conditions.
It is well known that light plays a key role in regulating the content of photosynthetic pigments in plants. Under shaded conditions, the chlorophyll content per unit of leaf mass usually increases, together with a higher proportion of chlorophyll b, while the share of carotenoids tends to decrease [23]. Forest grasses typically exhibit higher chlorophyll content than other grass species [7,8], which enables them to make better use of the limited light available in forest understories. This elevated chlorophyll concentration represents an important adaptation that allows forest plants to survive and grow under the low-light conditions typical of wooded environments [23]. Thanks to this adaptation, these plants can photosynthesize efficiently even under low-light conditions. Light affects chlorophyll content in forest grasses by triggering different strategies depending on its intensity. Under low light, grasses may increase their chlorophyll content to maximize light absorption, a trait known as shade tolerance. However, in excessive light, chlorophyll can be damaged, causing stress and reducing content, or the plant may need to protect itself through other adaptations, such as thicker waxy layers on leaves. Higher concentrations of carotenoids in plants may also serve as a protective mechanism against stress caused by excessive exposure to light [24].
In the leaf blades of M. uniflora, the chlorophyll a content ranged from 0.43 to 4.37 mg∙g−1 DM, chlorophyll b from 0.12 to 2.31 mg∙g−1 DM, and total carotenoids from 0.06 to 1.40 mg∙g−1 DM. Comparing our results with those from other studies is not straightforward, as we used a specific procedure in which pigment analysis was performed on dried material, whereas previous studies on forest grasses of the genus Melica L. [7,8] analyzed fresh samples.
Previous research by Zielewicz and Kozłowski [7] demonstrated that forest grass species generally exhibit high chlorophyll levels, with chlorophyll a content nearly three times greater than that of chlorophyll b. In our study, the chlorophyll a:b ratio remained relatively stable throughout the research period, averaging 2.48 (±1.30). These findings are consistent with other studies on forest grasses. For instance, Zielewicz et al. [8] reported a chlorophyll a:b ratio ranging from 2.7 to 3.2 in M. nutans, another species of the genus Melica L. Taken together, these results indicate that, despite methodological differences, the patterns of pigment distribution and adaptation to low-light forest environments are broadly consistent within the genus, while our study provides new insights into seasonal dynamics, site-specific variability, and the influence of environmental factors on pigment stability.

4.2. Effect of Year of Study

The contents of chlorophyll a, chlorophyll b, and total chlorophyll (a + b) were the highest in the first year of the study (2021) and the lowest in the second year (2022). A similar trend was observed for carotenoids, with the highest values recorded in 2021 and the lowest in 2023. Quantitative changes in pigment levels in leaf tissues are known to occur in response to fluctuations in environmental conditions [25,26]. Such variation may be linked to climatic factors, as Poland is located in a temperate transitional climate zone characterized by considerable variability in temperature and precipitation [27]. Periods of drought, in particular, have a strong impact on the growth and yield of forage grasses, as well as on the functioning of the photosynthetic apparatus during the early stages of growth [28].
The marked variation in chlorophyll and total carotenoid concentrations observed over the three years highlights the influence of annual environmental fluctuations on pigment accumulation. The substantially higher levels of chlorophyll a, chlorophyll b, and total carotenoids recorded in 2021 suggest the environmental conditions in that year including a balanced distribution of rainfall and the highest average Selyaninov’s hydrothermal coefficient (HTC = 1.12), created favorable water and temperature conditions for pigment synthesis. In contrast, 2022 exhibited lower pigment contents, likely due to drier conditions in spring and early summer (HTC 0.46–0.80), while 2023 showed uneven rainfall and lower overall HTC (1.03), which may have imposed stress on photosynthetic activity. This link between meteorological factors and pigment accumulation supports the view that interannual changes in temperature, rainfall, and other climatic factors can strongly affect plant physiological processes. According to previous studies [29,30,31], drought stress reduces chlorophyll and carotenoid contents, alters the chlorophyll b to chlorophyll a ratio, and significantly decreases photosynthetic activity. Similarly, Zielewicz et al. [8] reported that drought stress in forest environments significantly reduced chlorophyll pigment and β-carotene concentrations in the leaves of M. uniflora.

4.3. Effect of Harvest Time

As expected, the developmental stage at which M. uniflora plants were harvested had a clear effect on photosynthetic pigment content. Higher levels of chlorophyll a, chlorophyll b, and total carotenoids were recorded in July, when the grasses were in full generative development. At this early harvest stage, however, the chlorophyll a:b ratio was lower. This finding is consistent with the expectation that photosynthetic pigments reach their peak during periods of active growth [32].
In contrast, the lower pigment levels observed in the late autumn harvest reflect a decline as the growing season progresses and plants enter senescence [33]. The reduction in chlorophyll content in grass leaves during autumn results from the onset of senescence, reduced chlorophyll synthesis due to shorter photoperiod and lower temperatures, and the active enzymatic degradation of pigments associated with nutrient remobilization. Leaf senescence is a developmentally programmed process involving coordinated physiological and biochemical changes, including the activation of chlorophyll catabolic pathways and the controlled degradation of photosynthetic pigments. During this process, chlorophyll is enzymatically broken down via the pheophorbide a oxygenase (PAO)/phyllobilin pathway, involving key enzymes such as chlorophyllase, pheophytin pheophorbide hydrolase, and pheophorbide a oxygenase [34,35]. This pattern aligns with general plant physiological processes, in which degradation of photosynthetic pigments and increased flavonoid synthesis are typical in later stages of growth, as plants redirect resources toward seed production and other reproductive functions [36].
Senescence in grasses is an energy-intensive, tightly regulated process that ultimately leads to the functional decline and death of specific plant organs, including leaves [37]. Its progression is accompanied by transcriptional regulation of senescence-associated genes and increased enzymatic activity responsible for pigment catabolism, facilitating nutrient remobilization from aging tissues [38,39]. Chlorophyll degradation is typically followed by the breakdown of other macromolecules, including carotenoids and proteins. In our study, we observed nearly a twofold decline in total carotenoid levels between July and October in both 2021 and 2022. In the final year of the study, however, the differences in total carotenoid levels between these two harvest times were not significant. Variation in pigment levels across growth stages and research sites also demonstrates how plants optimize the capture and use of solar energy (Table 5).

4.4. Effect of Location and Microenvironmental Conditions

Significant differences in pigment content across research sites highlight the influence of local environmental conditions. The higher levels of chlorophyll and carotenoids observed at sites 1 and 7, compared with other locations, suggest that these sites may provide more favorable microhabitats or better soil conditions that support pigment synthesis. By contrast, the lower pigment levels recorded at sites 3, 4, 5, and 9 likely reflect less optimal conditions, such as poorer soils or reduced light availability, which may limit pigment accumulation.
Variation in chlorophyll and carotenoid content among sites within a single plant population can also arise from intrapopulation variability (Table 5). This indicates that even in the same environment, individual plants may differ in pigment levels, potentially due to genetic diversity [40]. In order understand these differences better, detailed chemical analyses are required. Such analyses should assess not only chlorophyll and carotenoid contents but also their dynamics across different growth stages. These studies could provide valuable insights into the mechanisms by which plants adjust to varying environmental conditions, including differences in light availability.
The significant interactions between study year, harvest date, and location highlight the complex interplay of these factors, particularly in how chlorophyll a and b levels change with plant development. This suggests that environmental and biological conditions work together to shape pigment accumulation, underlining the importance of considering multiple factors when studying pigment content.

4.5. Implications and Future Research Directions

A potential limitation of this study is the use of dried leaf material, which may cause partial loss of photosynthetic pigments during sample preparation. However, as all samples were processed under identical conditions, the observed patterns are considered to reflect relative biological differences rather than methodological bias. Future research comparing fresh and dried material could further validate pigment assessments under natural forest conditions.
In order to understand the role of light in forest understory habitats better, controlled experiments along light intensity gradients are recommended. Such studies would help disentangle the effects of light availability from other environmental drivers, including temperature, soil conditions, and competition. In addition, expression analyses of key genes involved in chlorophyll and carotenoid biosynthesis and degradation could elucidate the molecular mechanisms underlying pigment variability in M. uniflora.
Further targeted research on chlorophyll and carotenoid variability would enhance our understanding of plant adaptation strategies and improve models of photosynthesis across ecosystems. These findings emphasize the value of accounting for multiple environmental drivers when investigating pigment dynamics, which is essential for understanding plant health and adaptability. Future studies should also examine additional factors, such as soil nutrient availability and plant competition, to provide a more complete picture of pigment behavior. Including these variables could refine predictions of photosynthetic performance and energy-use efficiency across different ecosystems. Future research should also integrate transcriptomic analyses to explore the regulatory expression of pigment synthesis and degradation genes, providing insights into the molecular mechanisms underlying seasonal and environmental changes in pigment content. In addition, long-term monitoring studies are needed to assess the impact of climate variability and climate change on pigment accumulation in forest and forage grasses.

5. Conclusions

The concentrations of chlorophylls and carotenoids in M. uniflora leaves exhibited considerable variation within the population, indicating a high degree of metabolic plasticity in this species. Among the factors studied, annual meteorological conditions and the developmental stage of the plants had the strongest influence on chlorophyll and carotenoid levels, while differences among sites contributed to intrapopulation variability to a lesser extent. The highest average contents of chlorophyll a, chlorophyll b, and carotenoids were recorded in the first year of the study, likely reflecting more favorable weather conditions. Plants sampled in summer contained higher concentrations of all pigments compared with those collected in autumn, highlighting the seasonal dynamics of photosynthetic metabolism. Significant differences in pigment content between different sites further confirmed intrapopulation variability within M. uniflora. These results offer a new perspective on pigment dynamics in forest grasses and other understory species, highlighting the stability of chlorophyll content across seasons and sites. They also point to the potential of M. uniflora as an indicator species for ecological restoration, as well as the practical value of tracking pigment variability in woodland ecosystems. Future research could combine transcriptomic analyses to explore the regulation of pigment synthesis and degradation genes with long-term monitoring to evaluate the impacts of climate variability and climate change on pigment accumulation in forest and forage grasses.

Author Contributions

Conceptualization, A.P.-J., Z.J. and B.W.; methodology, A.P.-J., Z.J., W.Z. and B.W.; software, W.S.; validation, A.P.-J., B.W. and W.S.; formal analysis, W.S. and B.W.; investigation, A.P.-J., Z.J. and W.S.; resources, A.P.-J.; data curation, Z.J.; writing—original draft preparation, A.P.-J., Z.J. and B.W.; writing—review and editing, W.Z. and B.W.; visualization, W.S.; supervision, B.W.; project administration, A.P.-J.; funding acquisition, A.P.-J. and B.W. All authors have read and agreed to the published version of the manuscript.

Funding

This research received no external funding.

Institutional Review Board Statement

Not applicable.

Informed Consent Statement

Not applicable.

Data Availability Statement

The original contributions presented in this study are included in the article. Further inquiries can be directed to the corresponding author.

Conflicts of Interest

The authors declare no conflicts of interest.

References

  1. Zulfiqar, S.; Sharif, S.; Saeed, M.; Tahir, A. Role of carotenoids in photosynthesis. In Carotenoids: Structure and Function in the Human Body; Springer: Cham, Switzerland, 2021; pp. 147–187. [Google Scholar] [CrossRef]
  2. Hashimoto, H.; Uragami, C.; Cogdell, R.J. Carotenoids and photosynthesis. Subcell. Biochem. 2016, 79, 111–139. [Google Scholar] [CrossRef]
  3. Solymosi, K.; Mysliwa–Kurdziel, B. Chlorophylls and their derivatives used in food industry and medicine. Mini Rev. Med. Chem. 2017, 17, 1194–1222. [Google Scholar] [CrossRef]
  4. Hayes, M.; Ferruzzi, M.G. Update on the bioavailability and chemopreventative mechanisms of dietary chlorophyll derivatives. Nutr. Res. 2020, 81, 19–37. [Google Scholar] [CrossRef]
  5. Martins, T.; Barros, A.N.; Rosa, E.; Antunes, L. Enhancing health benefits through chlorophylls and chlorophyll-rich agro-food: A comprehensive review. Molecules 2023, 28, 5344. [Google Scholar] [CrossRef] [PubMed]
  6. Song, Y.; Feng, L.; Alyafei, M.A.M.; Jaleel, A.; Ren, M. Function of chloroplasts in plant stress responses. Int. J. Mol. Sci. 2021, 22, 13464. [Google Scholar] [CrossRef] [PubMed]
  7. Zielewicz, W.; Kozłowski, S. Występowanie barwników chlorofilowych i karotenowych w trawach leśnych. Łąkarstwo Pol. 2011, 14, 161–170. (In Polish) [Google Scholar]
  8. Zielewicz, W.; Wróbel, B.; Niedbała, G. Quantification of chlorophyll and carotene pigments content in mountain melick (Melica nutans L.) in relation to edaphic variables. Forests 2020, 11, 1197. [Google Scholar] [CrossRef]
  9. Fjellheim, S.; Young, D.A.; Paliocha, M.; Johnsen, S.S.; Schubert, M.; Preston, J.C. Major niche transitions in Pooideae correlate with variation in photoperiodic flowering and evolution of CCT domain genes. J. Exp. Bot. 2022, 73, 4079–4093. [Google Scholar] [CrossRef] [PubMed]
  10. Khodaverdi, M.; Mullinger, M.D.; Shafer, H.R.; Preston, J.C. Melica as an emerging model system for comparative studies in temperate Pooideae grasses. Ann. Bot. 2023, 132, 1175–1190. [Google Scholar] [CrossRef] [PubMed]
  11. Tyler, T. Large-scale geographic patterns of genetic variation in Melica nutans, a widespread Eurasian woodland grass. Plant Syst. Evol. 2002, 236, 73–87. [Google Scholar] [CrossRef]
  12. Mirek, Z.; Piękoś-Mirkowa, H. Trawy gór. In Księga Polskich Traw, 1st ed.; Frey, L., Ed.; Instytut Botaniki im. W. Szaffera PAN: Kraków, Poland, 2007; pp. 203–228. (In Polish) [Google Scholar]
  13. Matuszkiewicz, W. Przewodnik do Oznaczania Zbiorowisk Roślinnych Polski; Wydawnictwo Naukowe PWN: Warszawa, Poland, 2007; Volume 3, pp. 406–407. (In Polish) [Google Scholar]
  14. Kozłowski, S.; Zielewicz, W.; Swędrzyński, A.; Olejarnik, Ł. Właściwości chemiczne traw leśnych. Łąkarstwo Pol. 2012, 15, 109–118. (In Polish) [Google Scholar]
  15. Paszkiewicz-Jasińska, A.; Wróbel, B.; Stopa, W.; Jakubowska, Z.; Steinhoff-Wrześniewska, A.; Zielewicz, W. Nutritional status of wood melick (Melica uniflora Retz.) in a natural forest stand in south-western Poland. Forests 2023, 14, 1605. [Google Scholar] [CrossRef]
  16. Kondracki, J. Geografia Fizyczna Polski; Państwowe Wydawnictwo Naukowe: Warszawa, Poland, 1978. (In Polish) [Google Scholar]
  17. Küchler, A.W. A comprehensive method of mapping vegetation. Ann. Assoc. Am. Geogr. 1955, 45, 404–412. [Google Scholar] [CrossRef]
  18. Lichtenthaler, H.K.; Alan, R. Determinations of total carotenoids and chlorophylls a and b of leaf extracts in different solvents. Biochem. Soc. Trans. 1983, 11, 591–592. [Google Scholar] [CrossRef]
  19. Lichtenthaler, H.K.; Buschmann, C. Chlorophylls and carotenoids: Measurement and characterization by UV–VIS spectroscopy. Curr. Protoc. Food Anal. Chem. 2001, 1, F4.3.1–F4.3.8. [Google Scholar] [CrossRef]
  20. PN-EN ISO 10390:2022-09; Soil, Treated Biowaste and Sludge—Determination of pH. Polish Committee for Standardizations: Warsaw, Poland, 2022.
  21. OpenWeather. OpenWeatherMap. Available online: https://openweathermap.org/ (accessed on 20 June 2025).
  22. Selyaninov, G.T. Methods of agricultural climatology. Agric. Meteorol. 1930, 22, 4–20. [Google Scholar]
  23. Ivanov, L.A.; Ronzhina, D.A.; Yudina, P.K.; Zolotareva, N.V.; Kalashnikova, I.V.; Ivanova, L.A. Seasonal dynamics of the chlorophyll and carotenoid content in the leaves of steppe and forest plants on species and community level. Russ. J. Plant Physiol. 2020, 67, 453–462. [Google Scholar] [CrossRef]
  24. Kim, D.H.; Son, S.; Jung, J.Y.; Lee, J.C.; Kim, P.G. Photosynthetic characteristics and chlorophyll content of Cypripedium japonicum in its natural habitat. For. Sci. Technol. 2022, 18, 160–171. [Google Scholar] [CrossRef]
  25. Esteban, R.; Barrutia, O.; Artetxe, U.; Fernandez-Marin, B.; Hernandez, A.; Garcia-Plazaola, J.I. Internal and external factors affecting photosynthetic pigment composition in plants: A meta-analytical approach. New Phytol. 2015, 206, 268–280. [Google Scholar] [CrossRef]
  26. Zunzunegui, M.; Diaz-Barradas, M.C.; Jauregui, J.; Rodriguez, H.; Alvarez-Cansino, L. Season-dependent and independent responses of Mediterranean scrub to light conditions. Plant Physiol. Biochem. 2016, 102, 80–91. [Google Scholar] [CrossRef]
  27. Skowera, B.; Kulig, B.; Grygierzec, W.; Ziernicka-Wojtaszek, A.; Ziółkowska, E.; Lepiarczyk, A. The effect of meteorological conditions on the course of development stages and yield of winter wheat in southern Poland. J. Water Land Dev. 2024, 60, 157–166. [Google Scholar] [CrossRef]
  28. Borawska-Jarmułowicz, B.; Mastalerczuk, G.; Dąbrowski, P.; Tuchowska, Ż.; Kalaji, H. Influence of induced drought on photosynthetic performance in Dactylis glomerata varieties during the early growth stage. J. Water Land Dev. 2024, 60, 194–208. [Google Scholar] [CrossRef]
  29. Bai, Y.; Yan, R.; Dai, J.; Wei, Z.; Xia, J.; Yang, H.; Schellenberg, M. Soil moisture impact on biomass partitioning and relative chlorophyll content for legume–grass mixtures in a controlled environment. Appl. Ecol. Environ. Res. 2023, 21, 439–450. [Google Scholar] [CrossRef]
  30. Fariaszewska, A.; Aper, J.; Van Huylenbroeck, J.; De Swaef, T.; Baert, J.; Pecio, Ł. Physiological and biochemical responses of forage grass varieties to mild drought stress under field conditions. Int. J. Plant Prod. 2020, 14, 335–353. [Google Scholar] [CrossRef]
  31. Murtaza, G.; Rasool, F.; Habib, R.; Javed, T.; Sardar, K.; Ayub, M.M.; Ayub, M.A.; Rasool, A. A review of morphological, physiological and biochemical responses of plants under drought stress conditions. Imp. J. Interdiscip. Res. 2016, 2, 1600–1606. [Google Scholar]
  32. Ložienė, K.; Chochlovaitė, I. Effect of Phenological Stage and Leaf Age on Changes of Chlorophyll and Carotenoid Contents in Some Weeds and Invasive Species. Molecules 2025, 30, 3788. [Google Scholar] [CrossRef] [PubMed]
  33. Mattila, H.; Valev, D.; Havurinn, V.; Khorobrykh, S.; Virtanen, O.; Antinluoma, M.; Mishra, K.B.; Tyystjärvi, E. Degradation of chlorophyll and synthesis of flavonols during autumn senescence—The story told by individual leaves. AoB Plants 2018, 10, ply028. [Google Scholar] [CrossRef]
  34. Kuai, B.; Chen, J.; Hörtensteiner, S. The biochemistry and molecular biology of chlorophyll breakdown. J. Exp. Bot. 2018, 69, 751–767. [Google Scholar] [CrossRef]
  35. Tanaka, A.; Ito, H. Chlorophyll degradation and its physiological function. Plant Cell Physiol. 2025, 66, 139–152. [Google Scholar] [CrossRef]
  36. Zhang, K.; Xie, H.; Wen, J.; Zhang, J.; Wang, Z.-Y.; Xu, B.; Chai, M. Leaf senescence in forage and turf grass: Progress and prospects. Grass Res. 2024, 4, e004. [Google Scholar] [CrossRef]
  37. Woo, H.R.; Kim, H.J.; Nam, H.G.; Lim, P.O. Plant leaf senescence and death—Regulation by multiple layers of control and implications for aging in general. J. Cell Sci. 2013, 126, 4823–4833. [Google Scholar] [CrossRef] [PubMed]
  38. Li, X.; Zhang, W.; Niu, D.; Liu, X. Effects of abiotic stress on chlorophyll metabolism. Plant Sci. 2024, 342, 112030. [Google Scholar] [CrossRef] [PubMed]
  39. Zhou, M.; Yang, J. Delaying or promoting? Manipulation of leaf senescence to improve crop yield and quality. Planta 2023, 258, 48. [Google Scholar] [CrossRef]
  40. Liatukas, Ž.; Lemežienė, N.; Butkutė, B.; Cesevičienė, J.; Dabkevičienė, G. Chlorophyll values as a measure of genetic variation of switchgrass (Panicum virgatum L.) populations under cool temperate climate conditions. Zemdirb.-Agric. 2015, 102, 159–166. [Google Scholar] [CrossRef]
Figure 1. Location of study sites in Ślężański Landscape Park.
Agronomy 16 00339 g001
Figure 2. Average chlorophyll a content [mg∙g−1 DM] for different combinations of harvest term and location. Values within the same harvest term marked with at least one same letter are not significantly different. Error bars represents standard deviation (SD). Abbreviations: DM—dry matter.
Agronomy 16 00339 g002
Figure 3. Average chlorophyll b content [mg∙g−1 DM] for different combinations of harvest term and location. Values within the same harvest term marked with at least one same letter are not significantly different. Error bars represent standard deviation (SD). Abbreviations: DM—dry matter.
Agronomy 16 00339 g003
Figure 4. Average total carotenoids content [mg∙g−1 DM] for different combinations of harvest term and location. Values within the same harvest term marked with at least one same letter are not significantly different. Error bars represent standard deviation (SD). Abbreviations: DM—dry matter.
Agronomy 16 00339 g004
Figure 5. Principal component analysis (PCA) biplot.
Agronomy 16 00339 g005
Table 1. Characteristics of study sites.
(a) Sites 1–5
Site No12345
Coordinates (N)50°53′16.7″50°53′13.3″50°53′13.1″50°53′10.3″50°53′02.5″
Coordinates (E)16°43′56.5″16°43′44.4″16°43′44.4″16°43′43.5″16°43′44.1″
Altitude [m. a.s.l.]335411413414381
ExpositionNENNSN
(b) Sites 610
Site No678910
Coordinates (N)50°52′51.7″50°52′51.4″50°52′56.3″50°52′56.5″50°52′57.7″
Coordinates (E)16°43′30.0″16°43′30.1″16°43′47.4″16°43′49.6″16°43′55.8″
Altitude [m. a.s.l.]389390368367358
ExpositionSWSWSESESE
Table 2. Weather conditions and Selyaninov hydrothermal coefficient (HTC).
MonthAverage Air Temperature [°C]Total Rainfall [mm]Selyaninov’s HTC
202120222023202120222023202120222023
March5.55.87.33216491.030.461.04
April7.48.69.06151771.681.301.30
May13.116.214.09140351.670.600.49
June20.720.919.24364790.550.800.97
July21.621.021.610073751.190.860.82
August18.321.821.11441531491.991.801.73
September16.214.619.83980340.601.390.44
October11.614.213.81325810.260.431.47
Average/Sum14.315.415.75225015801.121.111.03
Abbreviations: HTC—Selyaninov hydrothermal coefficient; value HTC—period: 0.40—extreme dry, 0.41–0.70—very dry, 0.71–1.00—dry, 1.01–1.30—quite dry, 1.31—1.60—optimum, 1.61–2.00—quite humid, 2.01–2.50—humid, 2.51–3.0—very humid, >3.00—extremely humid.
Table 3. Characteristics of soil conditions.
Site No12345678910CV
[%]
Soil reaction
pH
3.64.93.84.13.92.43.55.86.13.926.4
N
g·100 g−1 soil
0.5070.6780.9710.3320.6350.7270.7240.7640.5010.20936.8
P
g·100 g−1 soil
0.0160.030.010.0210.020.0270.0380.0140.0140.01145.2
K
g·100 g−1 soil
0.0050.0050.0040.0030.0040.0050.0040.0040.0030.00320.4
Mg
g·100 g−1 soil
0.0130.0470.0160.0170.020.0070.0110.0330.0370.01659.5
Ca
g·100 g−1 soil
0.0710.3340.3050.0440.0490.0190.0850.3790.430.01995.9
Abbreviations: CV—coefficient of variation.
Table 4. Average values of chlorophyll and total carotenoids pigment content in M. uniflora leaf blades.
FactorFactor LevelExamined Parameters
Chlorophyll a [mg∙g−1 DM]Chlorophyll b [mg∙g−1 DM]Total Carotenoids [mg∙g−1 DM]Chlorophyll a + b
[mg∙g−1 DM]
a:b Ratio
Y20211.81 ± 0.97 a0.81 ± 0.53 a0.68 ± 0.28 a2.61 ± 1.47 a2.53 ± 1.24 a
20221.17 ± 0.49 c0.58 ± 0.25 c0.48 ± 0.21 b1.75 ± 0.68 c2.38 ± 1.54 a
20231.33 ± 0.51 b0.62 ± 0.33 b0.23 ± 0.09 c1.95 ± 0.82 b2.54 ± 1.11 a
HTsummer1.91 ± 0.73 a0.92 ± 0.39 a0.57 ± 0.32 a2.83 ± 1.11 a2.12 ± 0.35 b
autumn0.96 ± 0.33 b0.41 ± 0.18 b0.36 ± 0.18 b1.38 ± 0.40 b2.85 ± 1.74 a
L11.82 ± 0.90 b0.82 ± 0.52 b0.62 ± 0.30 a2.64 ± 1.40 a2.47 ± 0.87 b
21.38 ± 0.63 de0.79 ± 0.26 b0.40 ± 0.30 ef2.17 ± 0.82 cd1.75 ± 0.57 c
31.45 ± 0.19 cd0.48 ± 0.28 d0.46 ± 0.13 bc1.92 ± 0.44 ef4.27 ± 2.49 a
41.02 ± 0.33 f0.47 ± 0.17 d0.41 ± 0.13 cd1.50 ± 0.47 g2.33 ± 0.88 bc
50.99 ± 0.39 f0.48 ± 0.19 d0.34 ± 0.20 f1.46 ± 0.57 g2.13 ± 0.49 bc
61.38 ± 0.77 de0.68 ± 0.41 c0.42 ± 0.28 cd2.06 ± 1.16 de2.45 ± 1.31 b
72.09 ± 1.03 a1.01 ± 0.62 a0.59 ± 0.39 a3.10 ± 1.64 a2.30 ± 0.74 bc
81.56 ± 0.86 c0.73 ± 0.41 bc0.49 ± 0.30 b2.28 ± 1.26 c2.42 ± 1.31 b
91.26 ± 0.65 e0.55 ± 0.26 d0.40 ± 0.23 cde1.81 ± 0.87 f2.43 ± 0.98 b
101.43 ± 0.60 cd0.67 ± 0.30 c0.49 ± 0.32 b2.10 ± 0.89 de2.29 ± 0.68 bc
Average1.44 ± 0.740.67 ± 0.400.46 ± 0.282.10 ± 1.102.48 ± 1.30
Interactions
Y × HTp<0.001<0.001<0.001<0.001<0.001
Y × Lp<0.001<0.001<0.001<0.001<0.001
HT × Lp<0.001<0.001<0.001<0.001<0.001
Y × HT × Lp<0.001<0.001<0.001<0.001<0.001
Values in columns marked with at least one same letter are not significantly different. Abbreviations: Y—year of study, HT—harvest time, L—research site location.
Table 5. Average values of chlorophyll and total carotenoids pigment content for year of study and harvest time.
Year of StudyHarvest TimeExamined Parameters
Chlorophyll a [mg∙g−1 DM]Chlorophyll b [mg∙g−1 DM]Total
Carotenoids [mg∙g−1 DM]
Chlorophyll a + b [mg∙g−1 DM]a:b Ratio
2021summer2.51 ± 0.85 a1.17 ± 0.52 a0.87 ± 0.22 a3.68 ± 1.35 a2.26 ± 0.53 ab
autumn1.10 ± 0.38 c0.44 ± 0.16 d0.48 ± 0.19 c1.55 ± 0.46 c2.80 ± 1.64 ab
2022summer1.50 ± 0.42 b0.70 ± 0.20 c0.62 ± 0.18 b2.20 ± 0.61 b2.13 ± 0.15 b
autumn0.85 ± 0.32 c0.45 ± 0.23 d0.33 ± 0.12 d1.30 ± 0.40 c2.63 ± 2.16 ab
2023summer1.72 ± 0.38 b0.89 ± 0.23 b0.22 ± 0.06 d2.61 ± 0.60 b1.96 ± 0.19 ab
autumn0.94 ± 0.24 c0.34 ± 0.14 d0.25 ± 0.12 d1.28 ± 0.28 c3.11 ± 1.34 a
Values in columns marked with at least one same letter are not significantly different.
Disclaimer/Publisher’s Note: The statements, opinions and data contained in all publications are solely those of the individual author(s) and contributor(s) and not of MDPI and/or the editor(s). MDPI and/or the editor(s) disclaim responsibility for any injury to people or property resulting from any ideas, methods, instructions or products referred to in the content.