Article

Anaerobic Digestate as a Fertiliser: A Comparison of the Nutritional Quality and Gaseous Emissions of Raw Slurry, Digestate, and Inorganic Fertiliser


1
Rothamsted Research, West Common, Harpenden AL5 2JQ, UK
2
Department of Civil, Environmental and Geomatic Engineering, University College London (UCL), Gower St, London WC1E 6BT, UK
*
Author to whom correspondence should be addressed.
Agronomy 2026, 16(3), 287; https://doi.org/10.3390/agronomy16030287
Submission received: 25 November 2025 / Revised: 9 January 2026 / Accepted: 19 January 2026 / Published: 23 January 2026
(This article belongs to the Section Soil and Plant Nutrition)

Abstract

Anaerobic digestate (AD) has the potential to partially replace inorganic fertiliser, containing readily available nitrogen and other macro- and micronutrients. However, these properties vary with the feedstock. The objectives of this study were to analyse the chemical composition of AD materials and measure their effects on plant growth and greenhouse gas emissions. Anaerobic digestate came from a conventional reactor using vegetable waste and maize as feedstock (‘food AD’) and from a biogas system on a smallholder dairy farm using manure feedstock (‘manure AD’). Undigested cattle slurry (‘manure slurry’) and a complete mineral fertiliser were used as controls. These were applied to wheat plants grown in a glasshouse. Wheat grown with the food AD had a higher yield than the complete mineral fertiliser control, even when applied at a lower rate of nitrogen. Wheat grown with both the food AD and manure AD had macronutrient concentrations equal to or higher than the complete mineral fertiliser treatment. Furthermore, the wheat P concentration was significantly greater with the manure AD treatment, which was unrelated to a biomass dilution effect. However, food AD caused high ammonia emissions, and residual methane was emitted with manure AD, indicating incomplete digestion in the latter. Optimal yields and reduced greenhouse emissions were obtained with mixtures of AD and mineral fertiliser in a 1:1 ratio, indicating the potential to greatly reduce the costs and environmental impact of fertiliser application.

1. Introduction

Organic amendments (OAs) are widely used in agriculture because they are known to promote soil fertility and yield increases in many crops [1,2,3,4,5]. They also increase soil organic carbon [6,7], helping to recycle “waste” within the food production process while increasing nutrient use efficiency [8], therefore making the whole production system more sustainable. However, their use can also contribute to nutrient pollution in surface and ground water, and gaseous emissions from the use of OAs can contribute to carbon dioxide (CO2), nitrous oxide (N2O), methane (CH4), and ammonia (NH3) in the atmosphere [9,10,11]. These effects are dependent on the characteristics of the organic amendment, including its nutrient content and mineralisation dynamics, and the interactions with other system components and processes.
One increasingly available OA is anaerobic digestate (AD), which has the potential to be a beneficial addition or even a replacement for inorganic fertiliser, containing readily available macro- and micronutrients, and considerable organic matter, which can contribute to overall soil health. AD is a by-product of biogas production and contains about 90% water and 10% solids (about ¼ inorganic solids and ¾ organic solids), although these values can vary considerably, depending on feedstock and other factors [12]. Nitrogen (N) and phosphorus (P) are important macronutrients in AD [12]. Ammonium (NH4+) is produced through hydrolysis during digestion (in the acidogenesis stage) and increases in concentration compared to the feedstock, so that ammonium is often >50% of total N in AD [12,13,14]. In studies comparing multiple different digestates, the NH4+-N abundance varies considerably, between 60 and 90% [12], 44 and 81% [13], and 39 and 88% [14]. The majority of organic N is in the solid fraction, and the majority of NH4+ is in the liquid fraction [12], but still, there can be between 26 and 49% NH4+ in the solid fraction [13]. Digestate also contains significant quantities of other macro- and micronutrients, sometimes more readily available or other times immobilised compared to the original feedstock [12]. Limited P availability is a known occurrence with AD because digestate is alkaline and favours the formation of insoluble Ca–phosphate complexes [15,16]. Consequently, the majority of P will remain in the solid fraction [17].
Anaerobic digestion converts carbon compounds to CH4 and CO2 so that the remaining digestate has a lower C:N ratio and is more recalcitrant to further decomposition [13,18]. Therefore, AD could be a useful slow-release crop fertiliser, whilst also increasing the soil organic carbon content without excessive N losses from degradation/mineralisation. However, there are also risks of increased GHG emissions of residual CH4, NH3, and hydrogen sulphide (H2S) from digestate.
Many studies have assessed the carbon and nitrogen content and mineralisation dynamics of different AD types, and their consequences for nitrogen availability [12,13,14,16,18,19,20]. However, relatively few studies have looked at the effects of AD on crop nutrition other than nitrogen uptake and yield effects. Hafner et al. [18] observed greater wheat yield compared to the mineral nitrogen-only control after the second year of application of different types of AD, and the yield was highest with food waste AD. Likewise, Ref. [21] observed equal yield and greater N uptake and tiller number with the application of two types of digestate compared to the mineral fertiliser control. This latter study also measured the K, Ca, and Mg in the wheat tissue; however, no differences between the digestate treatment and the control were observed.
Industrial biogas plants typically utilise high-energy feedstock such as maize, sorghum and other grasses. This produces a nutrient-rich digestate which can be used as fertiliser. However, there are problems with the transport of such a high volume of liquid waste, frequently requiring further processing to separate the solid and liquid fractions, which is also challenging. On the other hand, small-scale, on-farm biogas systems do not have the problem of transportation, but may have other limitations associated with the suitability of feedstock material and reactor conditions for optimal fermentation. The use of anaerobic digestate as a fertiliser will, therefore, vary with the type of feedstock and the type of biodigester used [22].
The biogas plants utilised for this study were both located in Lincolnshire, UK, but varied considerably in their design and operation, as described below. A comparative study of the chemical characteristics and effects of the AD from the biogas plants on wheat growth and nutritional content and gaseous emissions was conducted in a glasshouse experiment at Rothamsted Research, Harpenden, UK. The objectives of the study were as follows: (1) to characterise the chemical characteristics of the different AD materials and an undigested control, (2) to analyse the effect of these materials on plant growth and greenhouse gas emissions, and (3) to compare their respective effects with pure mineral fertiliser and with mineral fertiliser/AD mixtures.

2. Materials and Methods

2.1. Organic Materials

The experiment compared (a) fresh cow manure slurry pre-anaerobic digestion (coded as ‘manure slurry’) and (b) post-anaerobic digestion (coded as ‘manure AD’) from a 15 m3 biodigester (Located at a small dairy farm (approx. 20 cows) in Lincolnshire, UK. The reactor was designed and installed by EcoNomad Solutions Ltd., Harpenden, UK (www.economad.co.uk), operating under mesophilic conditions (c. 25 °C).), with (c) the liquid fraction (i.e., the fibre and liquid fractions had been separated at the biogas plant) of AD derived from maize (~75%) and vegetable food waste (~25%) (coded as ‘food AD’) digested in a municipal biogas plant (Staples Vegetables, Boston, UK), all of which were used as fertiliser for wheat grown in a glasshouse at Rothamsted Research, Harpenden, UK. These treatments are identified throughout this study as organic amendments (or organic manures/OM as abbreviation in figures and tables), and compared with treatments of pure inorganic fertiliser and mixtures, composed of both inorganic and organic fertilisers (see below for combination ratios).
Slurry and digestate samples (about ten kg) were obtained directly from the reactors, transported and stored under refrigeration until the moment of use and analysis. Sub-samples of the three amendments (food AD, manure slurry, and manure AD) (these are identified in the tables below as Food/maize AD, manure slurry, and manure AD, respectively) were centrifuged to separate the solid (sludge) and liquid fractions for chemical analysis. The separate fractions were analysed for dry matter content, with the total carbon (C) and nitrogen (N) content of the solid matter/sludge analysed by Dumas (LECO TruMac Combustion Analyser, St, Joseph, MI, USA). The liquid supernatant (after centrifugation) of the amendments was analysed for pH in water (ISO 10523); soluble nitrogen (NH4+, NO3, NO2) and phosphate (PO4) with colorimetry (Skalar SAN PLUS); total organic carbon (TOC) with UV oxidation (Shimadzu TOC-V WP, Kyoto, Japan); and total elemental concentrations with ICP-OES (Inductively Coupled Plasma Optical Emission Spectrometer; Agilent 5900 SVDV, Santa Clara, CA, USA) and ICP-MS (Mass Spectrometer; NexION 300X, Perkin Elmer, Waltham, MA, USA). The dry matter and total C and N concentrations of fresh manure (for reference only) were also analysed by LECO following freeze-drying (this was for comparison with the manure slurry, but only the slurry and not the fresh manure was used in the glasshouse experiment).

2.2. Glasshouse Experiment

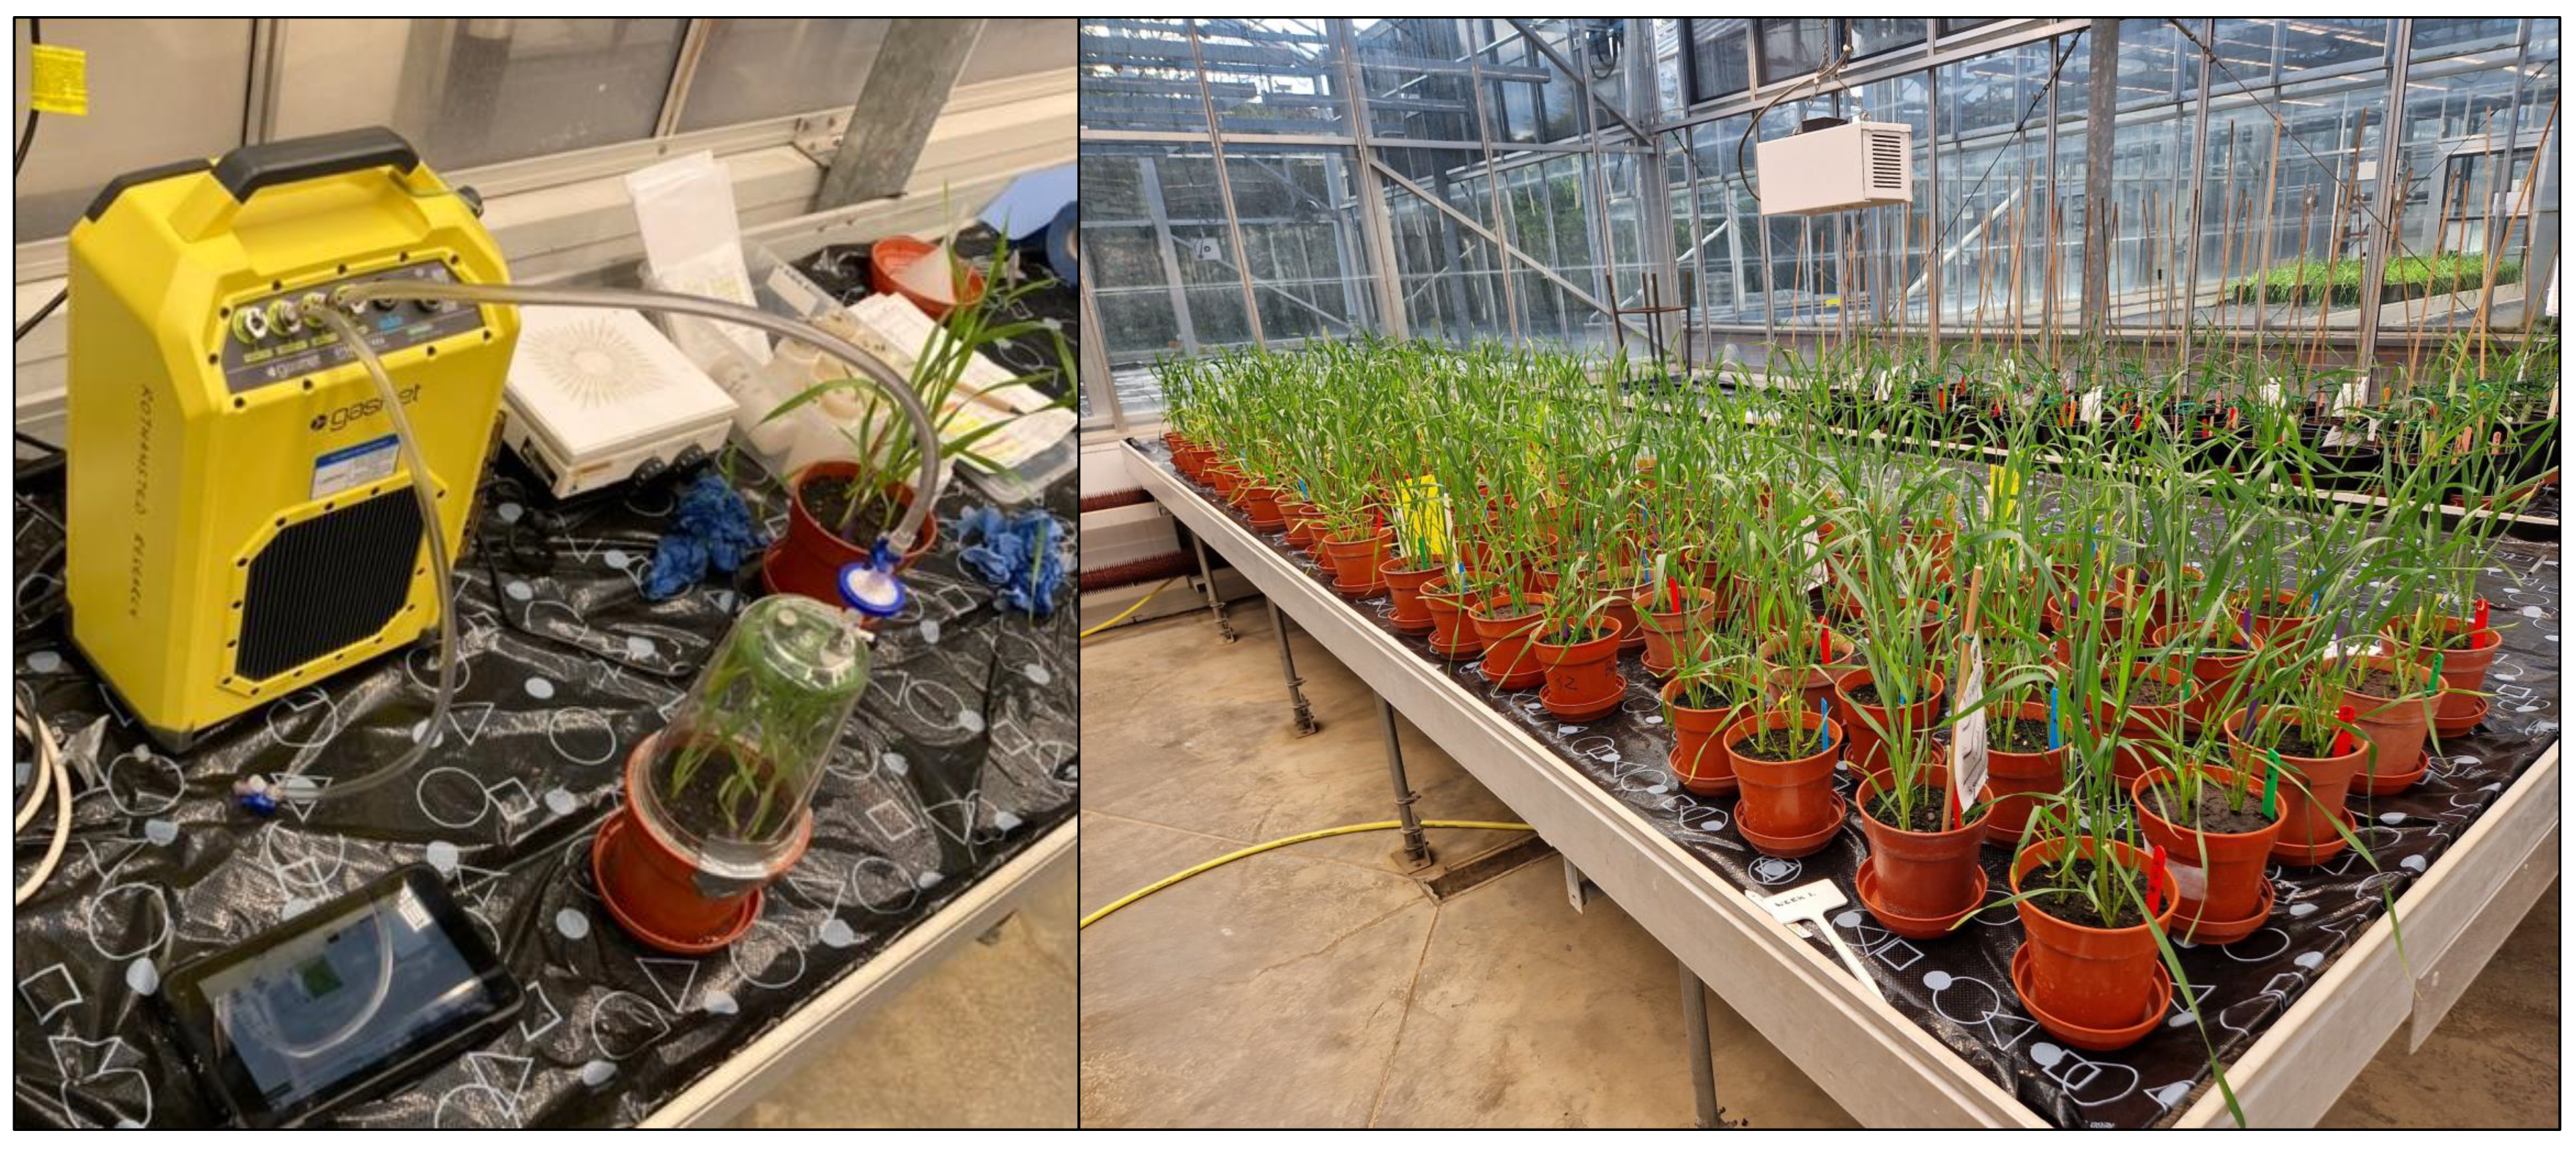
The glasshouse experiment was conducted between October 2023 and January 2024. Seeds of the spring wheat (Triticum aestivum, L.) variety Bob White were first sieved to a uniform size of 3.25–3.75 mm. The seeds were pre-germinated in pellet trays in a standard in-house compost mix (Petersfield Products, Leicester, UK; www.petersfieldgrowing.com) and transplanted after 7 days to the full-size pots (1.5 litre, 15 cm diameter). Three plants were transplanted per pot, again filled with standard in-house compost mix. Pots in trays (i.e., a saucer which retains liquid) were arranged according to a balanced complete plot design, with 5 replications per treatment. The whole experiment was located in the same glasshouse on 1 bench (Figure 1).
The glasshouse was heated to 20 °C day/15 °C night with no supplementary lighting. Tap water was added regularly directly to the trays, with occasional watering of the pot. At 21 days after sowing (DAS), before stem elongation, different fertiliser treatments were added to the pots (Table 1). The NH4+ content of the materials was used to calculate rates of fertiliser application in the glasshouse experiment. The liquid amendments were applied to the pots at 3 different rates of NH4+: 140 (OM1) < 240 (OM2) < 300 (OM3) mg NH4+ kg−1 soil (coded as ‘Full org’). Half of the pots received only half the rate of organic amendment plus nutritionally complete inorganic fertiliser (containing all plant-essential macro- and micronutrients) at 240 mg NH4+; 75 mg phosphorus (P); 60 mg potassium (K); 26 mg sulphur (S); 19 mg magnesium (Mg); 1.8 mg manganese (Mn) kg−1 soil (also as solution)—so, the total available N applied was 310 (OM1), 360 (OM2), 390 (OM3) mg NH4+ kg−1 soil (coded as ‘N2 + ½ org’). There were also control pots receiving no organic amendment but with nutritionally complete inorganic fertiliser applied at 240 mg NH4+ kg−1 soil (coded as ‘N2’) and also pots receiving no nitrogen fertiliser (coded as ‘N0’). The amendments were applied over 5 consecutive days, with an equal proportion added to the pot each day, adding up to the total N rate. This was performed because the moisture content of the amendments was so high that there would otherwise be over-watering.
Crop biomass (yield in weight) and nutrition (see ICP-OES in methods above) were measured in straw and grain at maturity of the three plants per pot. Nitrogen use efficiency (%) was calculated as grain nitrogen uptake (grain N concentration × grain yield)/NH4+-N applied.
Gaseous emissions were measured only from the pots receiving the OM2 rate of amendment: ‘Full Org’ (total 240 mg NH4 kg−1 soil was applied); ‘N2 + ½ org’ (total 360 mg NH4 kg−1 soil was applied, where 240 mg NH4 kg−1 soil was applied with inorganic fertiliser, and 120 mg NH4 kg−1 soil with organic fertiliser); and the control treatments with no organic amendment—‘N2’ (total 240 mg NH4 kg−1 soil was applied) and ‘N0’ (none). Emissions were analysed daily over the 5 days of application using a Gasmet FTIR analyser (GT5000 Terra; Gasmet, Karlsruhe, Germany) following procedures described by Zhang and Torres-Ballesteros [23]; immediately after amendment application, the gas chamber was sealed onto the pot using tape, and the chamber was then left on for 2 min before a 3 min measurement period. The gas measurement setup is shown in Figure 1.

2.3. Statistical Analysis

Statistical significance of treatment effects (organic amendment type; organic amendment rate; and added inorganic fertiliser) was analysed using a balanced two-way ANOVA test in Genstat v22 (VSN International Ltd., Hemel Hempstead, UK).

3. Results

3.1. Organic Amendment Chemical Properties

Food AD contained ~3% total N, and manure AD and manure slurry contained ~4% total N in the dry matter. Concentrations of NH4 in the liquid fraction were much lower (>0.2%) but accounted for 50% of the total N in the food AD, for 36% in the manure AD and 51% in the manure slurry (Table 2). Albeit, NH4 was 5× higher in the food AD compared to the manure AD and slurry liquid fractions—~1500 and 300 mg kg−1, respectively. NO3 was low in all materials, which is typical for anaerobic digestate [12,15]. Dry matter (DM) content, total organic carbon (TOC), and other macro- and micronutrients were also significantly higher in food waste AD compared to manure AD and slurry, with some notable exceptions outlined below.
Calcium (Ca) concentration was similar in all the materials, reflecting the alkaline pH (>7) of all the materials. However, magnesium (Mg) concentration was three times greater in manure slurry and manure AD than in food AD, probably due to the high intake of Mg in cattle diets. Interestingly, phosphate (PO4) and total P concentration were of equal proportion in the manure AD and slurry, whereas in the food AD, PO4 concentration was half that of the total P concentration.
The identical C/N ratio and similar C and N concentrations in the dry matter and liquid supernatant of the manure slurry and manure AD indicated a similar level of mineralisation/maturity in the pre- and post-digestion materials.
The fresh manure was not used as an amendment in the glasshouse experiment, but the chemical composition was analysed for comparison. This showed that the fresh manure had a smaller proportion of total N than either the manure slurry or manure AD at 2%, which, together with the higher C/N ratio, indicated a lower suitability as a replacement for inorganic N fertiliser (Table 2).

3.2. Organic Amendments Applied as Fertiliser to Wheat in a Glasshouse Study

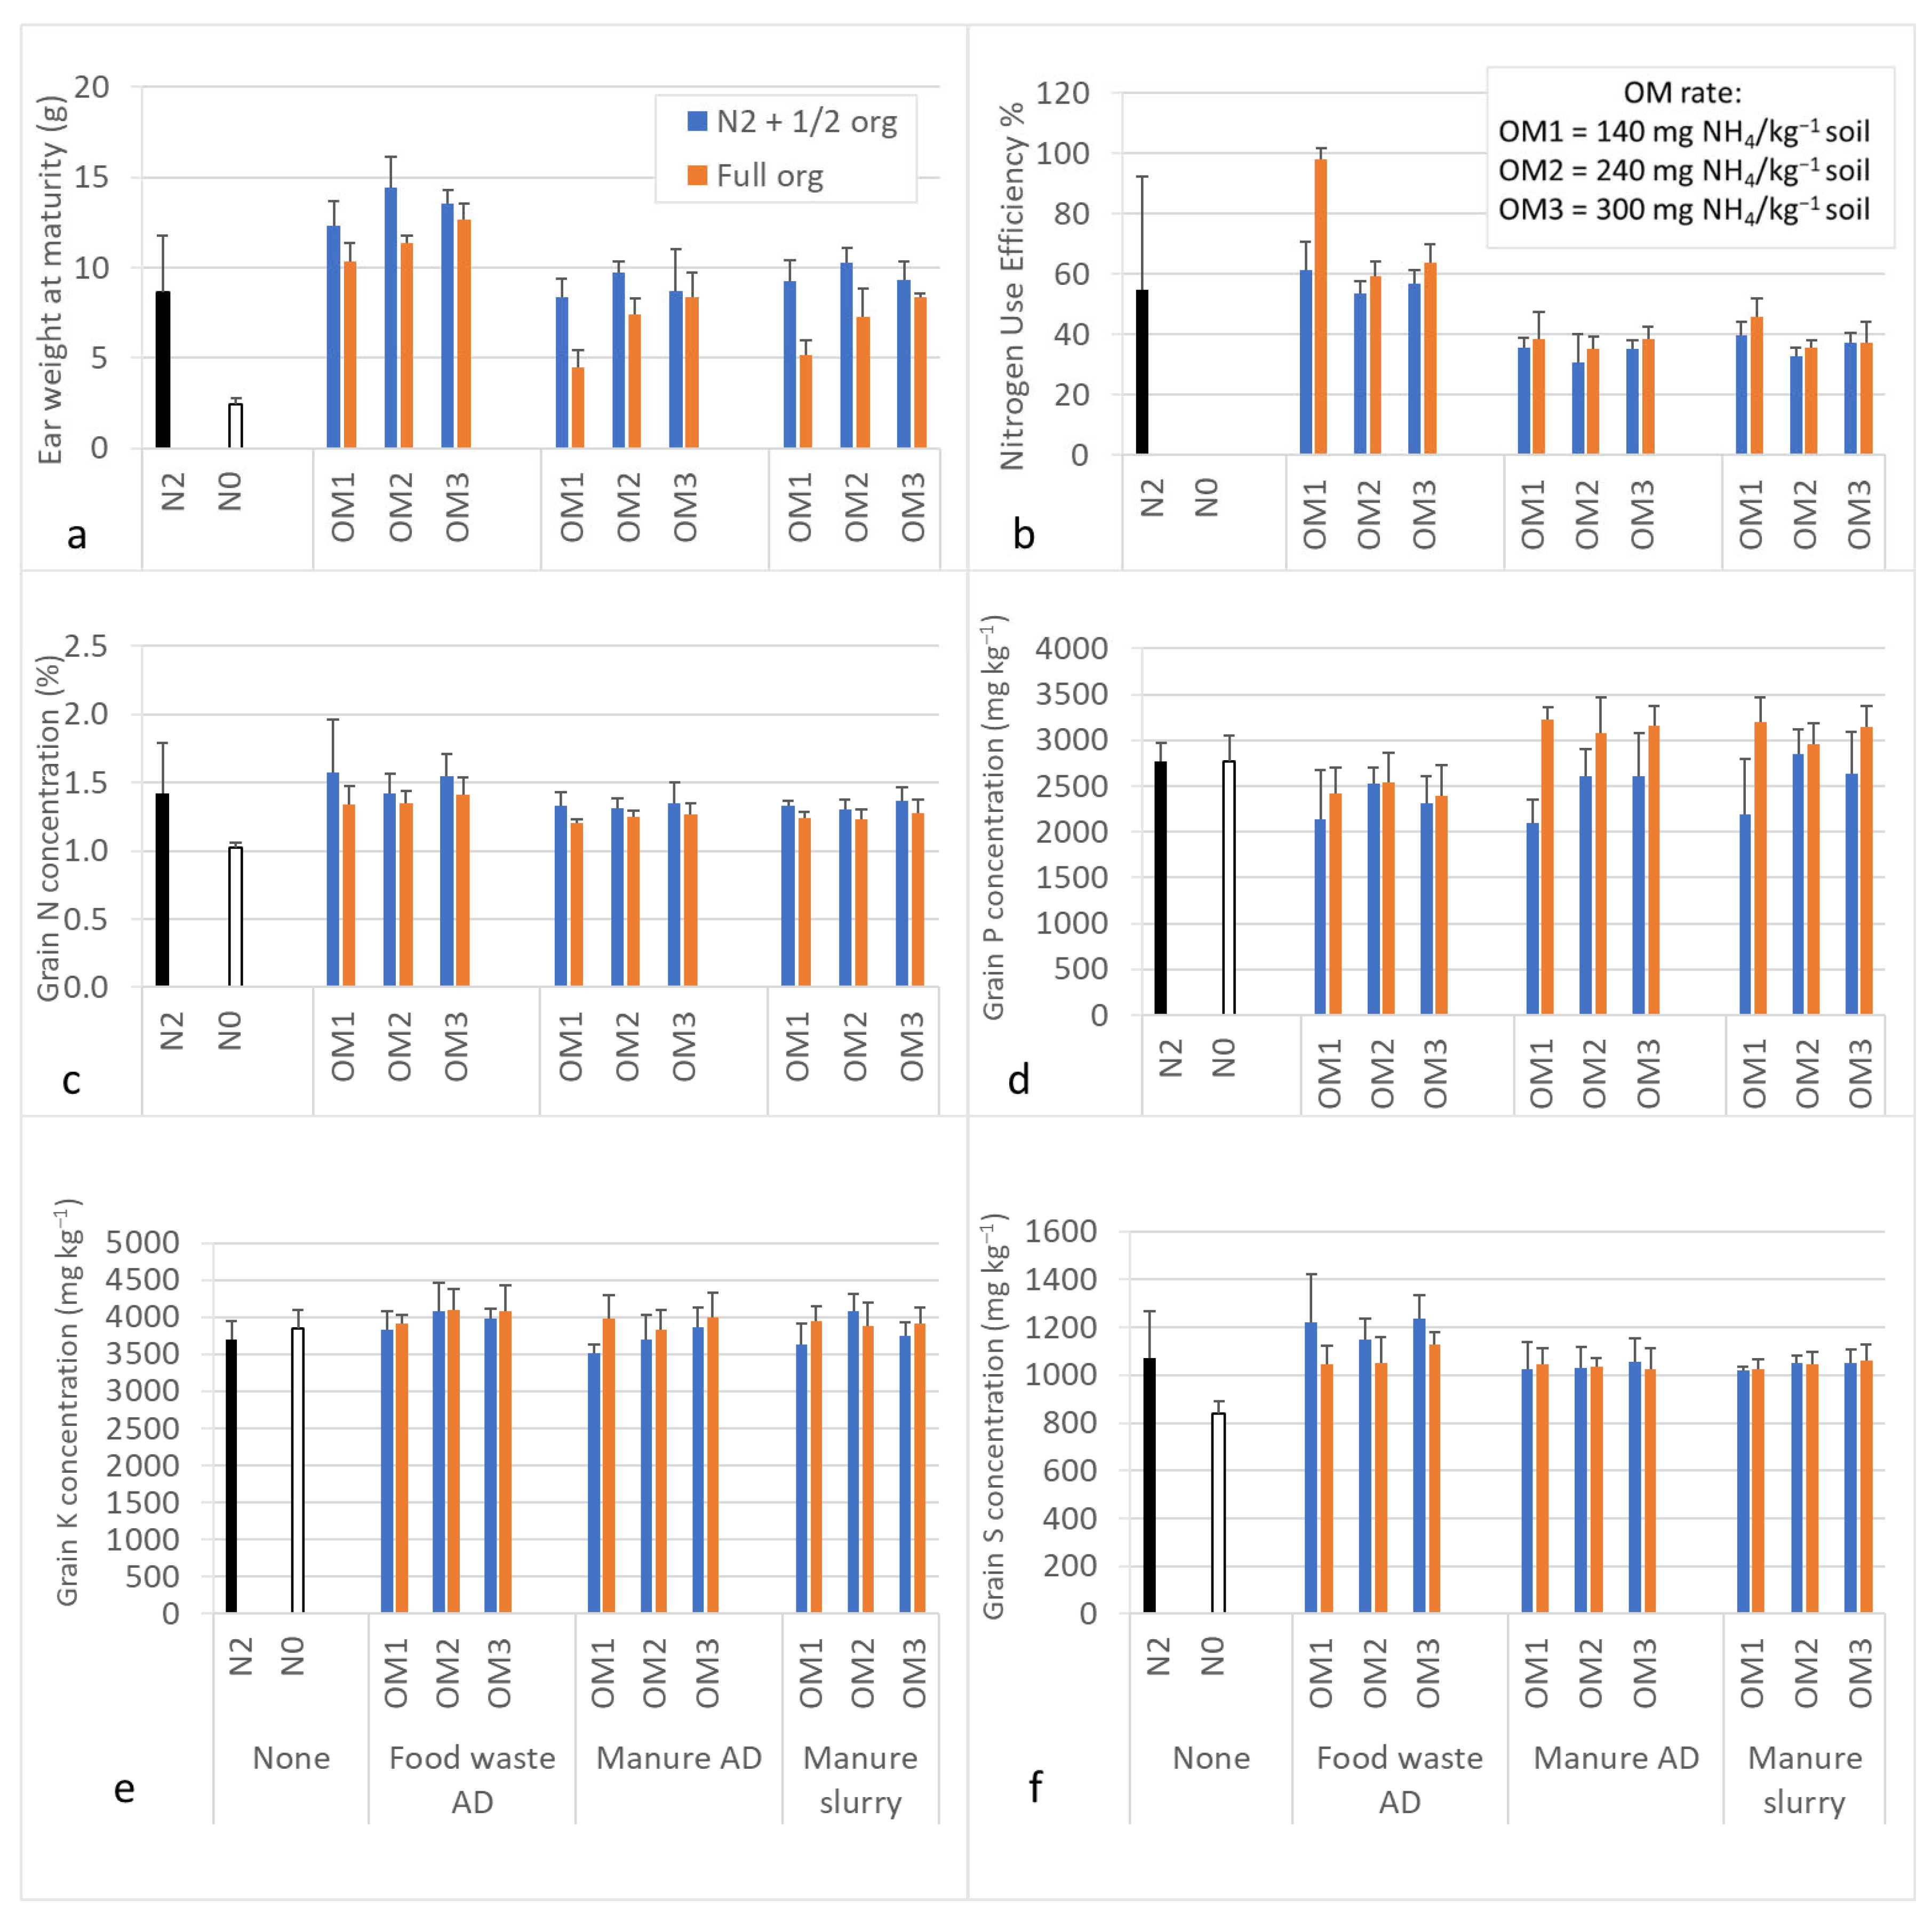
With the organic amendment-only treatments (‘Full org’/orange bars), there was an increase in yield with a higher rate of amendment (Figure 2a). There was a higher grain yield with the food AD fertiliser compared to the N2 control treatment (240 mg NH4+ kg−1 soil), even when the food AD was applied at a lower rate of 140 mg NH4+ kg−1 soil. There was also a higher yield with the food AD compared to the manure slurry and manure AD treatments. However, the manure slurry and AD did have equal yield to the N2 control treatment when applied at the highest rate (OM3; 300 mg NH4+ kg−1 soil); so a slightly higher concentration of available N was needed to achieve equal yield to the inorganic fertiliser. Higher yields were observed with the full rate of inorganic fertiliser + half rate organic fertiliser (‘N2 + ½ org’/blue bars) compared to organic fertiliser-only (‘Full org’/orange bars); however, this is to be expected given that the former received 55%, 33%, and 23% greater NH4+ at OM1, OM2, and OM3, respectively. Therefore, to evaluate N uptake relative to the rate of N applied, nitrogen use efficiency (NUE) was calculated (Figure 2b). This shows that the full organic fertiliser treatments had slightly better NUE compared to the mixed inorganic and organic fertiliser, especially with the food waste AD applied at a low rate. Less significant differences were observed for the manure AD and manure slurry treatments. The ANOVA shows a significant effect on grain yield of OM type (F = 55, p < 0.001); OM rate (F = 5, p < 0.001); and the addition of inorganic fertiliser (F = 60, p < 0.001). ANOVA also shows a significant effect on NUE of OM type (46, p < 0.001); OM rate (F = 5, p < 0.001); and the addition of inorganic fertiliser (F = 14, p < 0.001).
The grain concentration of macronutrients N, K, and S was very consistent across the treatments, except for lower grain N concentration with the zero-fertiliser control (‘N0’), suggesting that the organic fertilisers provided nutrition equal to the complete macro- and micronutrient-balanced inorganic fertiliser treatment (Figure 2c–f). There was a slightly higher grain N concentration with the mixed organic and inorganic fertiliser treatments (‘N2 + ½ org’/blue bars) compared to the organic fertiliser-only treatments (‘Full org’/orange bars), but this is to be expected given that the former applied higher NH4+ rates. However, there was a higher P concentration in the plants receiving manure-based amendments compared to the other treatments (Figure 2d). This was especially evident in the straw of treatments receiving the manure AD, which had a P concentration ~2× greater than with food AD and with manure slurry (Supplementary Figure S1). This greater P concentration does not appear to be due to biomass dilution of nutrient content, i.e., a higher straw biomass causing lower nutrient concentration. The straw K concentration was also greater with the addition of all organic amendments compared to the inorganic fertiliser and zero fertiliser controls (Supplementary Figure S1). However, this lower P concentration with food AD clearly did not limit the yield.
ANOVA shows a significant effect of OM type on grain concentration of N (F = 6, p < 0.001); P (F = 13, p < 0.001); K (F = 3, p < 0.05); and S (F = 9, p < 0.001). There was a significant effect of OM rate on grain concentration of P (F = 2, p < 0.05) and K (F = 2, p < 0.05). Inorganic fertiliser had a significant effect on grain concentration of N (F = 16, p < 0.001); P (F = 25, p < 0.001); K (F = 4, p < 0.05); and S (F = 11, p < 0.001). Therefore, the largest effects on grain nutrient content were from the addition of inorganic fertiliser treatment. ANOVA shows a significant effect of OM type on straw concentration of P (F = 26, p < 0.001) and K (F = 23, p < 0.001). There was also a significant effect of OM rate on straw K concentration (F = 2, p < 0.05). Finally, added inorganic fertiliser had a significant effect on straw concentration of P (F = 20, p < 0.001); K (F = 21, p < 0.001); and S (F = 7, p < 0.01) but not on straw N concentration.
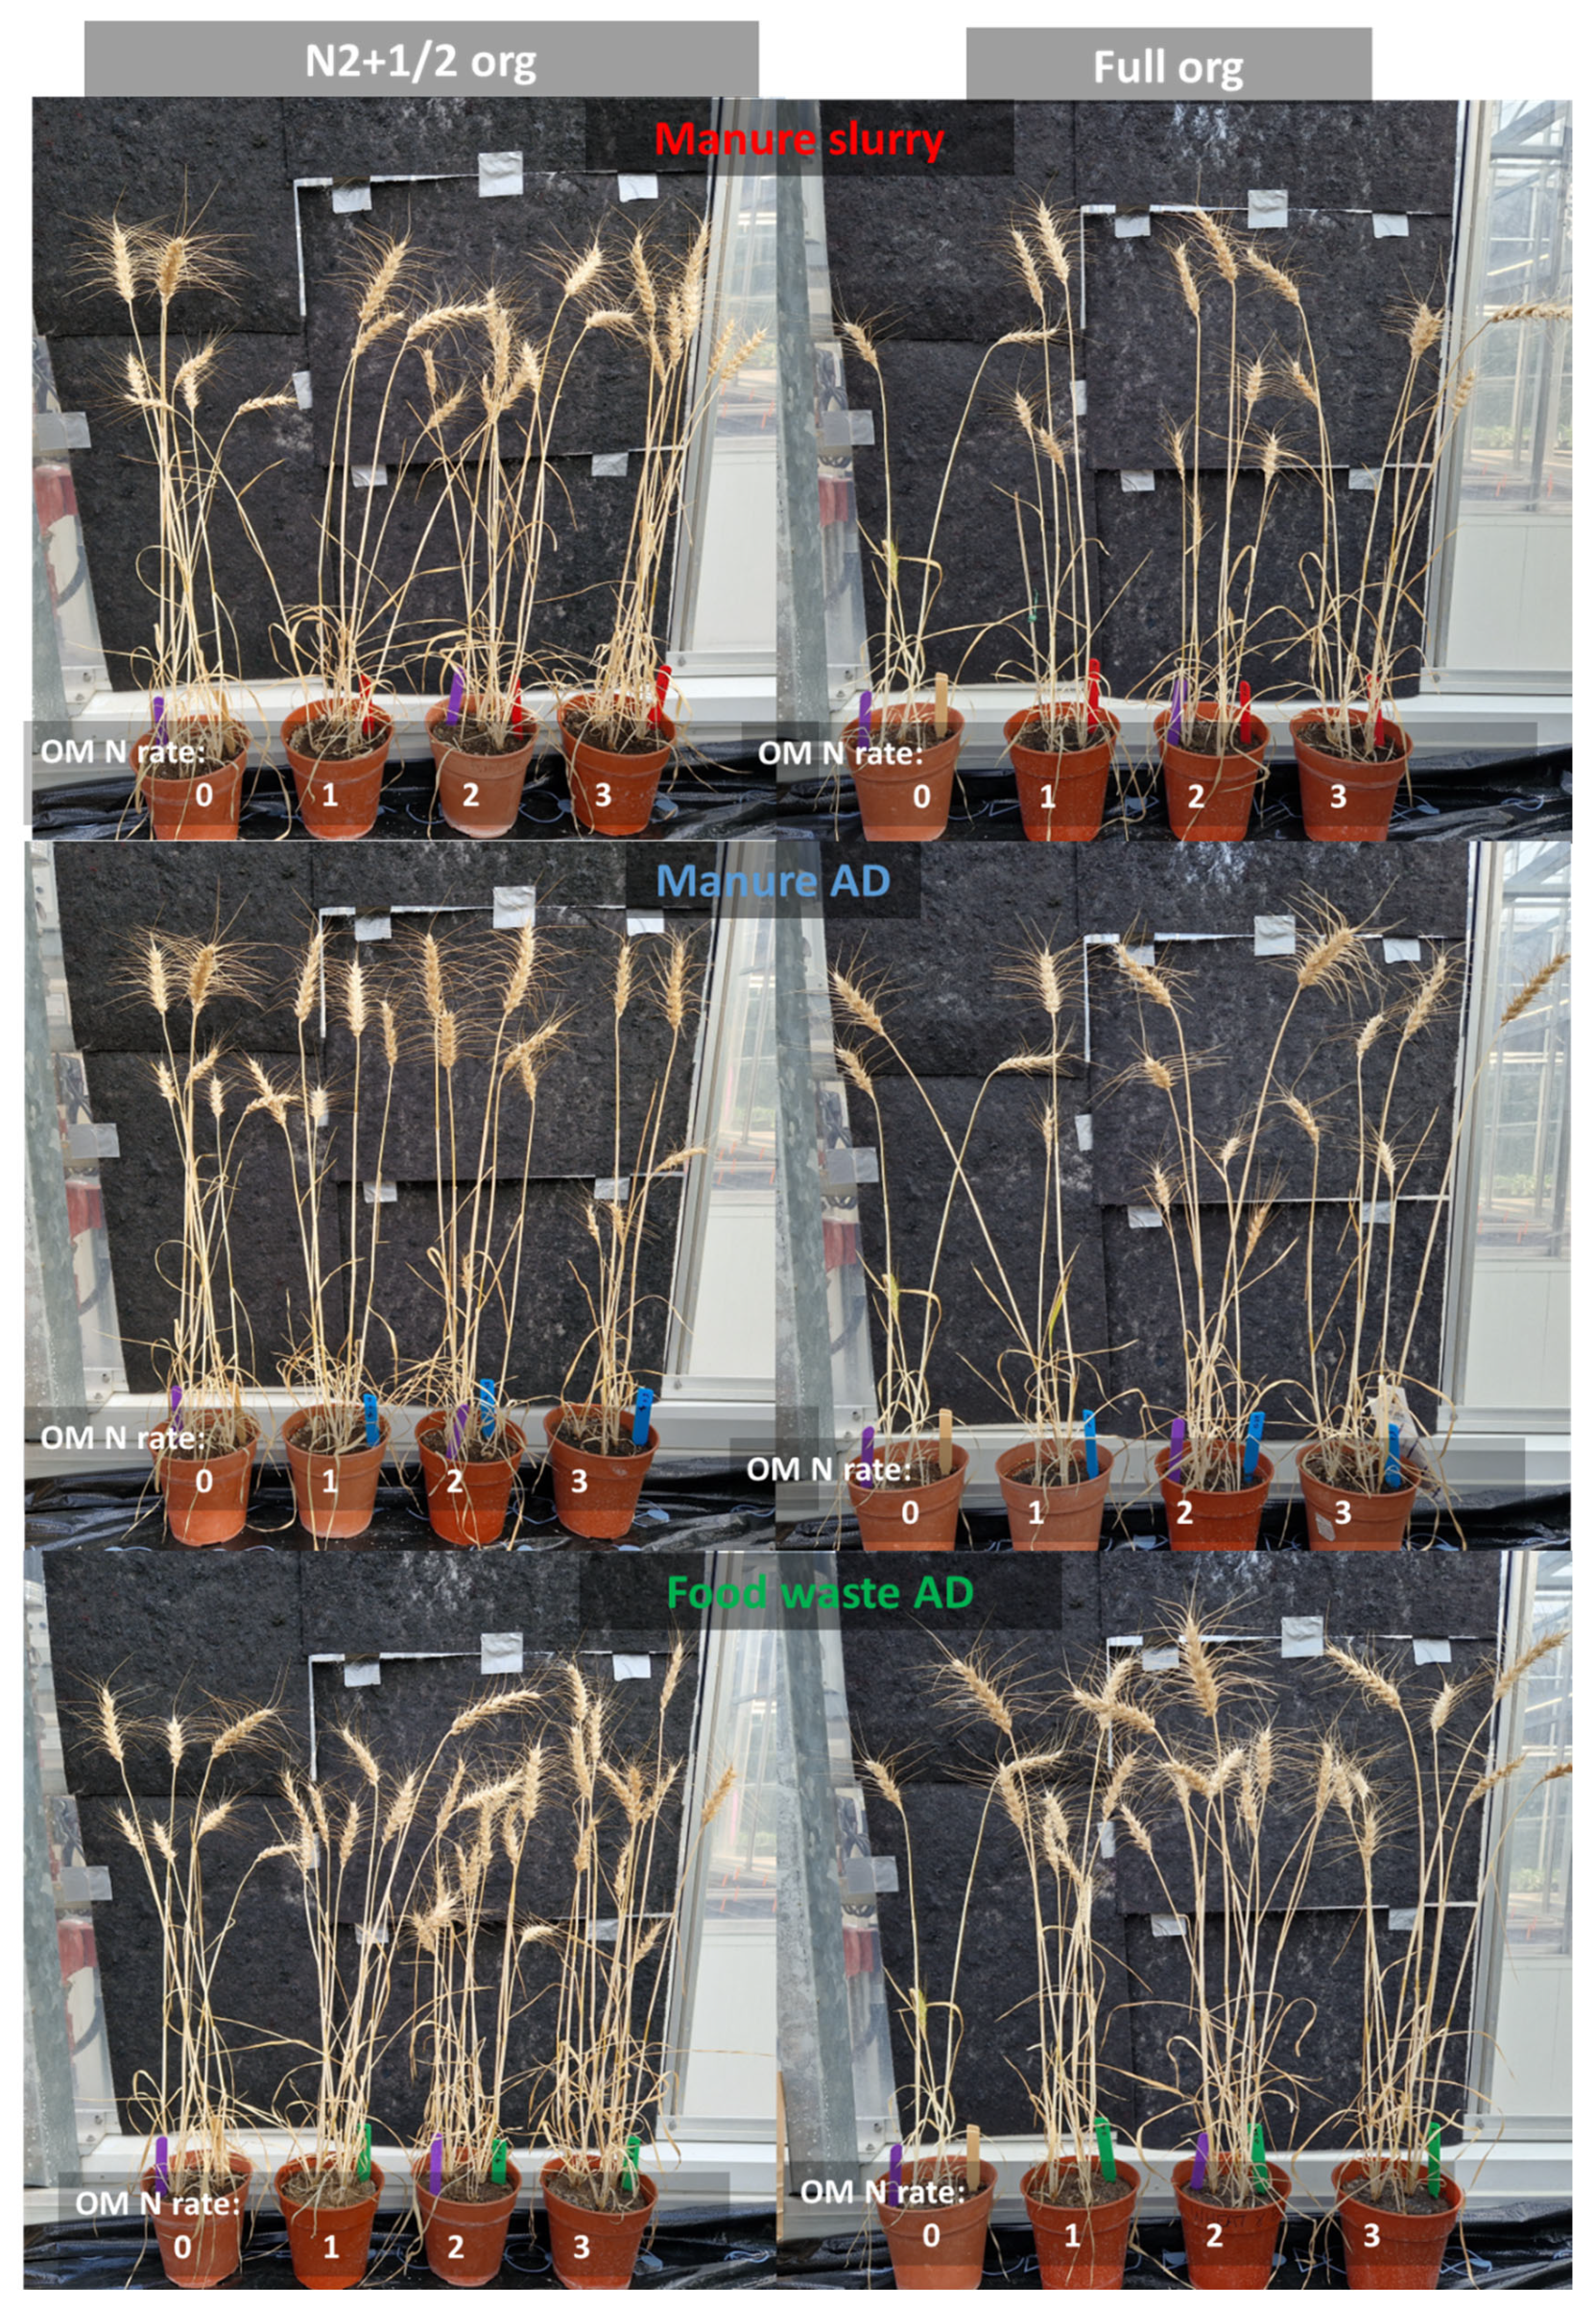
The effects of the different organic and mixed fertiliser treatments on crop growth are also shown in Figure 3, clearly demonstrating the superior growth with food waste AD, whereas better growth with manure slurry and manure AD was achieved when combined with inorganic N (N2 + ½ org).

3.3. The Effect of Organic Amendments on Greenhouse Gas Emissions

Gaseous emissions were measured only from the pots receiving the OM2 rate of amendment treatments ‘Full Org’ (total 240 mg NH4 kg−1 soil was applied); ‘N2 + ½ org’ (total 360 mg NH4 kg−1 soil was applied, where 240 mg NH4 kg−1 soil was applied with inorganic fertiliser, and 120 mg NH4 kg−1 soil with organic fertiliser); and the control treatments with no organic amendment—‘N2’ (total 240 mg NH4 kg−1 soil was applied) and ‘N0’ (none).
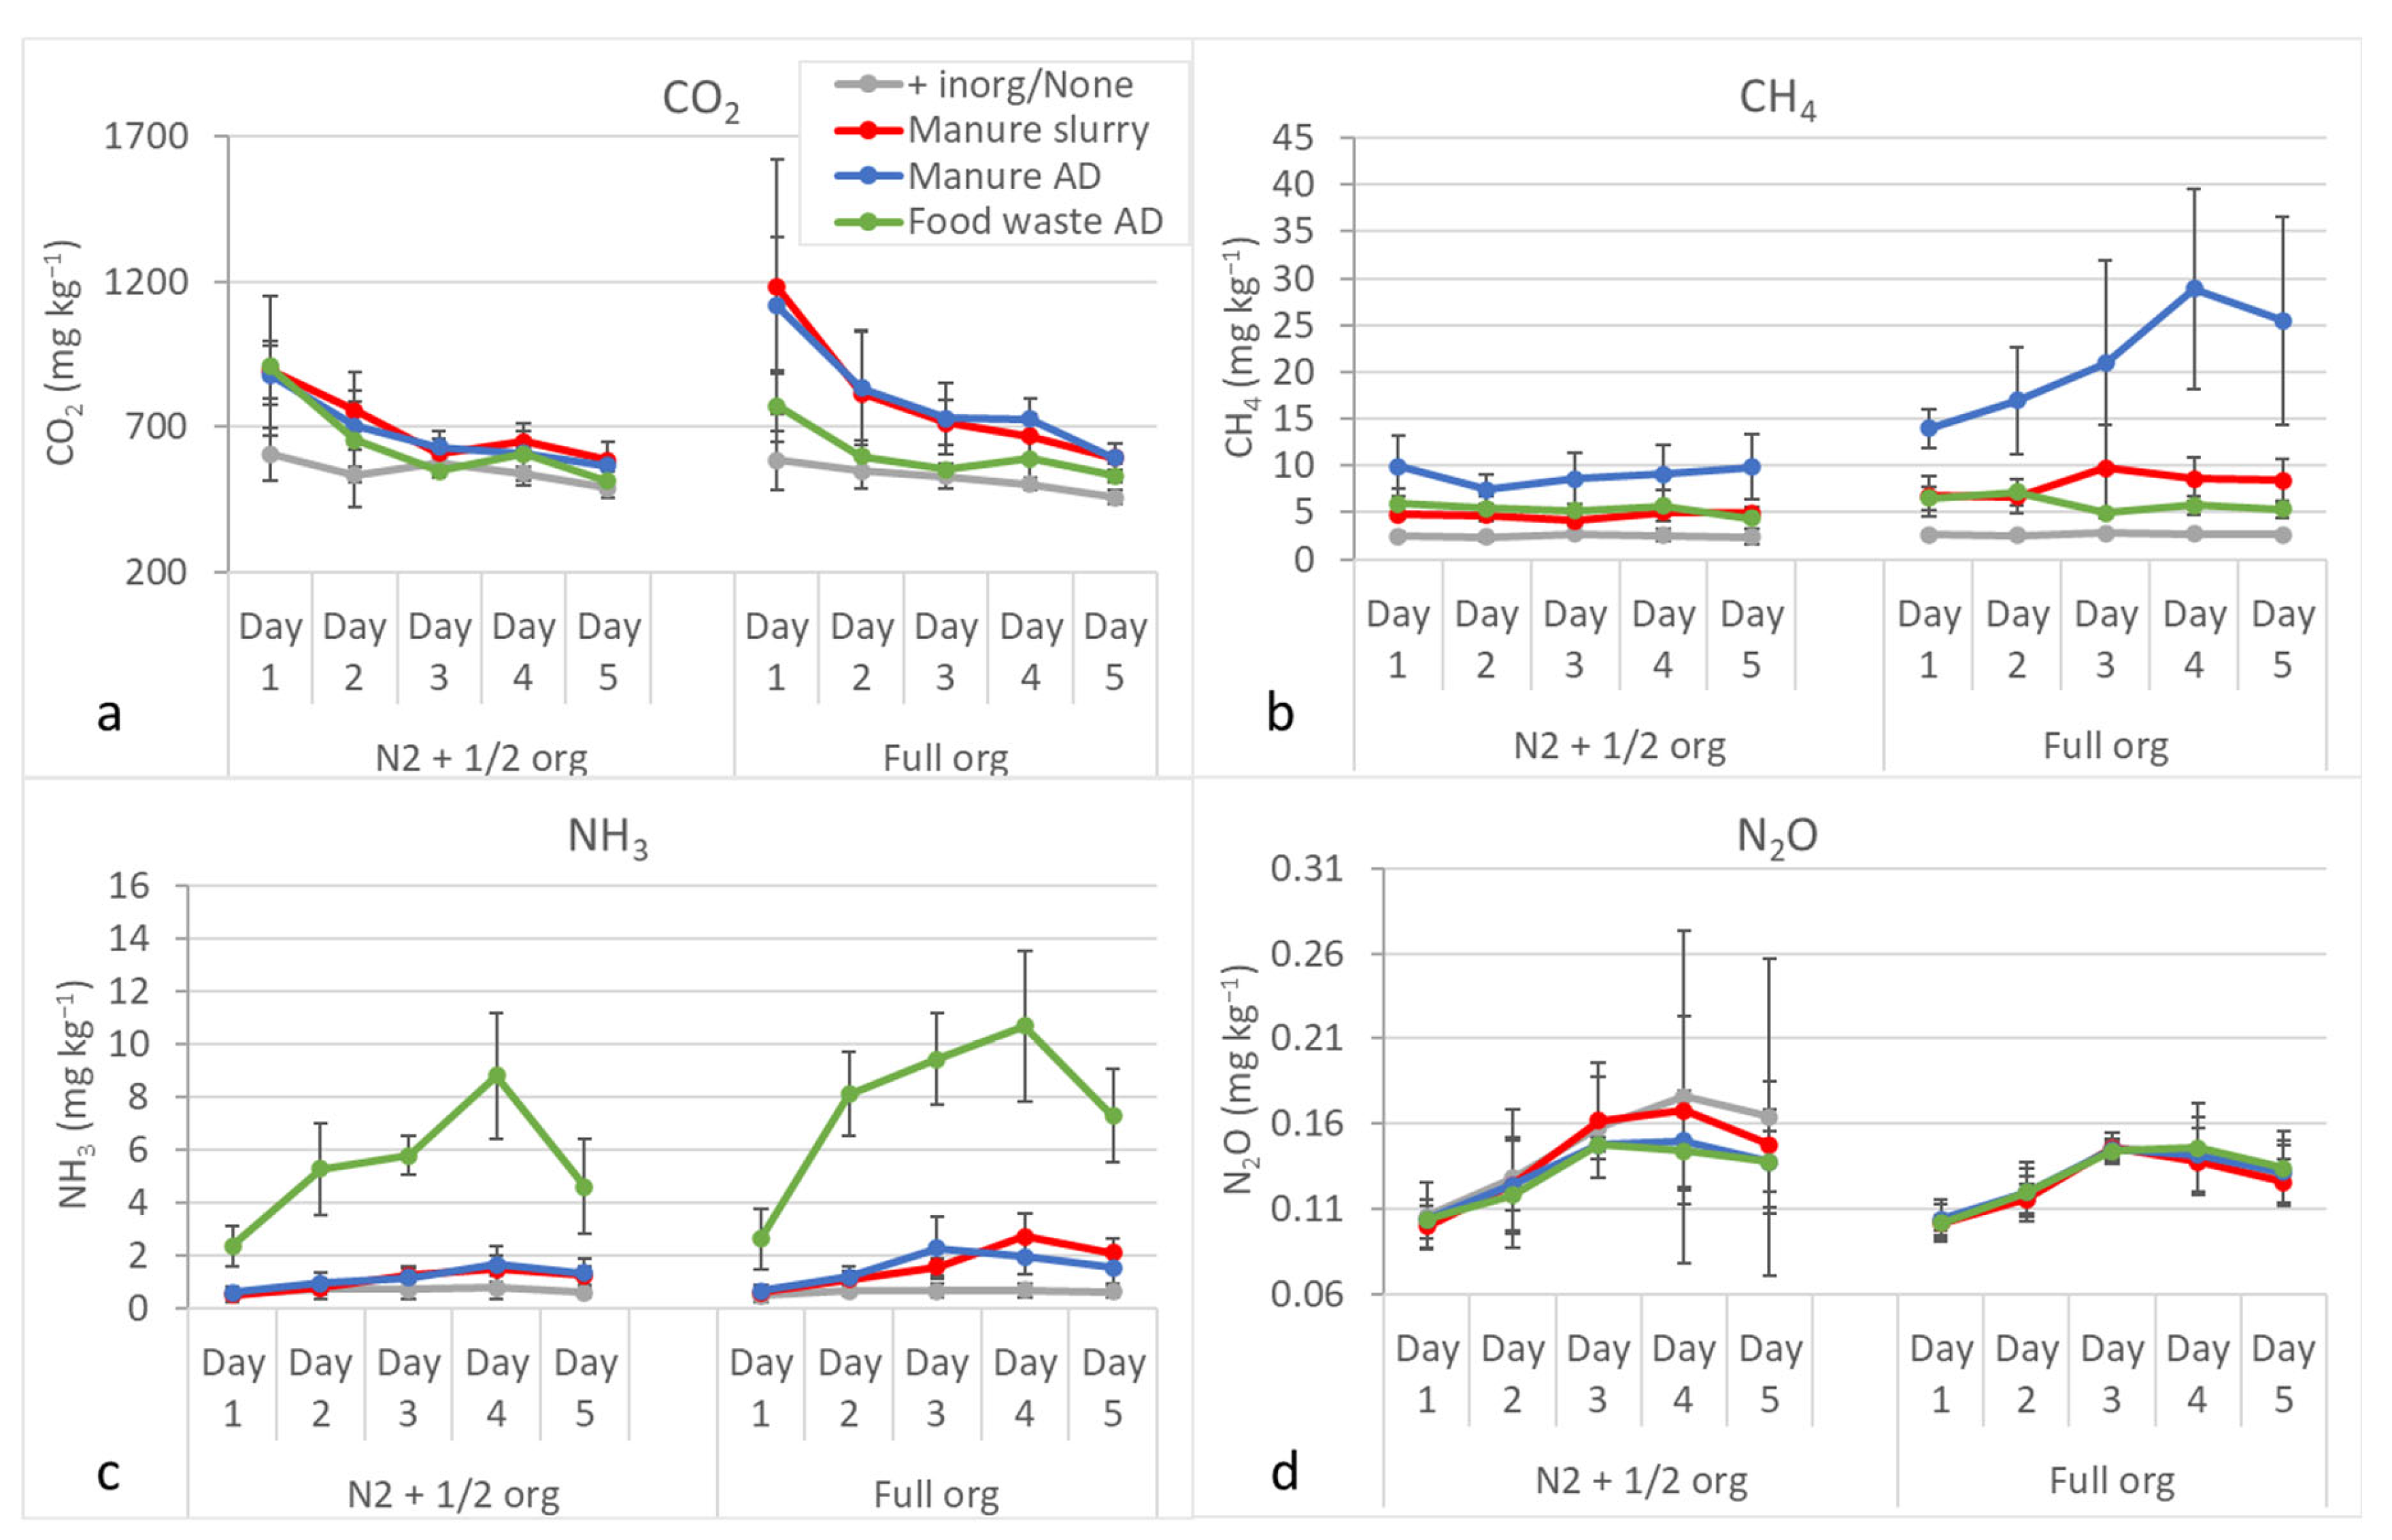
More NH4+ was applied with the N2 + ½ org treatments (i.e., mixed treatments) than the full organic treatments; however, generally, there was not much difference between the two in emissions, except in the specific instances outlined below. Emissions of CH4 were significantly greater with manure AD compared to all the other treatments at an average of 21 mg kg−1 per day (Figure 4a). However, the methane emissions of the manure AD treatments were much reduced when combined with inorganic N applications (N2 + ½ org). NH3 emissions were significantly greater with food waste AD at an average of 8 mg kg−1 per day or 17% over 5 days as a proportion of the total NH4 applied (Figure 4b). CO2 emissions were greater with both manure AD and manure slurry at the full rate of application at an average of 800 mg kg−1 per day compared to the other treatments, but again the emissions were reduced when combined with inorganic N applications (N2 + ½ org) (Figure 4c). N2O emissions were low but were greater with mineral-only fertiliser and slurry when applied with the mineral fertiliser compared to either of the AD treatments (Figure 4d). The ANOVA shows a significant effect of OM type on emission of NH3 (F = 181, p < 0.001); CO2 (F = 8, p < 0.001); and CH4 (F = 102, p < 0.001), but no effect on N2O. The ANOVA shows a significant effect of the added inorganic fertiliser on emission of NH3 (F = 7, p < 0.001); CO2 (F = 3, p < 0.05); CH4 (F = 37, p < 0.001) and N2O (F = 2, p < 0.05). Note that the emissions were only measured for five days and that they, therefore, represent short-term, application-related fluxes and not seasonal emissions.

4. Discussion

4.1. Effect of Fertiliser Treatments on Grain Yields and Nutrient Uptake

The yields of the plants grown with the food AD were significantly higher than those grown with the manure AD, manure slurry, and inorganic fertiliser only, even though they were applied at equal rates of available N/NH4+ (Figure 2). Furthermore, the nitrogen use efficiency with food AD was equal to the inorganic fertiliser-only treatment, and significantly better than the inorganic fertiliser when applied at the lowest rate. Likewise, in field experiments, equal yield with digestate or inorganic fertiliser application has been observed [18], and the highest achievable yields were reported by combining organic and inorganic fertilisers by [5]. The higher yield with food AD does not appear to be explained by the higher concentration and uptake of other macronutrients (P, K, S, etc.), because the concentrations of these macronutrients in the straw (partially in Supplementary Figure S1) and grain were very consistent across the fertiliser treatments, and in fact P availability was lower with food AD—as discussed below. However, it is possible that the calculated total N in the food AD available for crop uptake was underestimated, because the rates of N applied were based on the readily available NH4+ content in the liquid supernatant, whereas some N might have been released from the mineralisation of sludge/DM (5% DM content in the food AD compared to 0.7–1.4% in the manure-based amendments). There was sufficient time for mineralisation from the solid fraction to occur over the course of the 4-month glasshouse experiment, and most digestates continue mineralisation after application to varying extents [12,14]. Furthermore, analysis of the liquid fraction of digestate coming from multiple biogas plants showed higher total nitrogen content in the sludge than liquid supernatant after centrifugation, ranging from 0.34 to 0.65% and 0.17–0.37%, respectively, and also higher NH4 content in the sludge [12]. Another, more speculative possibility is the content of plant growth-promoting bacteria in some ADs, which was described by Qi et al. [24] and depends on the digestion conditions and feedstocks.
The application of the manure slurry and manure AD without the addition of inorganic fertiliser at the highest rate of application (300 mg NH4+ kg−1 soil) did achieve equal yields to the inorganic fertiliser applied at 240 mg NH4+ kg−1 soil; therefore, a slightly higher rate of N was needed with the manure products compared to mineral fertiliser only (Figure 2). A possible explanation for the higher rate of N needed is that some of the dissolved N in the manure slurry and AD was immobilised by microbial activity in the AD [14], because, as described below in Section 4.2, there was likely to have been greater decomposable organic matter remaining in the manure AD compared to the food AD. A further increase in the N rate with the OM3 (N2 + ½ Org) treatments (390 mg NH4+ kg−1 soil) did not increase yields significantly more, indicating that N was not a limiting factor at the highest rate.
The grain concentration of all macronutrients was equal across the treatments, including the inorganic fertiliser control, which was a complete balanced nutrient fertiliser with all required macro- and micronutrients (Figure 2). Therefore, the organic fertilisers have the potential to supply all the required nutrients and replace multiple chemical fertilisers with a single product. However, with the manure-based amendments, the crop P concentration, particularly in the straw (Supplementary Figure S1), was much higher than with the other treatments, which was unrelated to biomass dilution. In general, limited P availability is a known occurrence with AD because digestate has high alkalinity and consequently phosphate forms insoluble Ca–phosphate complexes [15,16]. However, there was no significant difference in the pH between the organic fertilisers studied here. And the food AD had 3× higher total P than soluble phosphate-P in the supernatant, whereas in the manure-based amendments these concentrations were equal (Table 2). This indicates that the phosphate had precipitated in the food AD but not in the manure AD. The greater soluble P in the manure-based fertilisers can probably be explained by the 3× higher Mg content compared to the food AD (Table 2). Struvite, which is a P mineral formed in the presence of Mg and NH4+, is much more soluble and plant-available than Ca–phosphate minerals [15]. Likewise, Mg in organic manure has previously been shown to increase P availability from digestate [15].

4.2. Characteristics of the Organic Amendments and Effects on Gas Emissions

The NH4 in the liquid supernatant of the AD studied here accounted for 36 to 51% of the total N (Table 2), which is similar to previous reports, e.g., 40–60% [18], 44–80% [13], and 50% [19]. It is still possible that some NH4 was in the solid fraction, but the NH4 in the solid fraction was not measured separately. However, given the small amount of DM in all three ADs used, this would be a small error. The total N measured here in the DM (3–4%) does accord with typical measurements of AD: 3–16% [18]; 1–5% [21]; 5–8% [13]; and 3–14% [19].
The manure slurry and manure AD showed a very similar chemical composition to one another, e.g., an NH4 content of ~300 mg kg−1 and a C:N ratio of 10:1, the only small difference being that the manure AD had slightly higher dry matter content than the slurry—1.4% and 0.7%, respectively (Table 2). This difference in dry matter content is not as high as is typical in digestate, which usually loses considerable water compared to the feedstock [15]. Typically, AD also has a lower C:N ratio (~10:1) than the feedstock due to the release of CH4 and CO2 [18] during the digestion, and digestates are characterised by stable/recalcitrant OM with low mineralisation rates [25]. For example, the food AD feedstock, composed of 75% maize biomass and 25% vegetable waste, would have had a C:N ratio > 40:1 pre-digestion [26], which was reduced to 16:1 in the AD analysed here (Table 2). The NH4 content of the liquid fraction of AD from multiple biogas plants ranged from 1160 to 2900 mg kg−1 [12], which is much higher than the 300 mg kg−1 in the manure AD of this study, but is close to the values observed here in the food AD (~1500 mg kg−1). The similar chemical composition of the manure slurry and manure AD indicates that digestion of the manure feedstock was not extensive/complete. But cattle slurry digestate, compared to other types of AD, has been shown to contain more biodegradable OM after digestion [14]. And it should be noted that in the small reactor used here, extra water is added to the slurry to further liquidise the manure slurry feedstock.
The incomplete digestion of the manure AD can be explained by relatively low digestion temperatures (mesophilic conditions, c. 25 °C) and insufficient retention times of the pilot reactor used on the smallholder dairy farm, compared to the large-scale commercial reactor used in producing the food AD, which was operating in the thermophilic range. It is also likely that there was insufficient carbon in the manure feedstock, i.e., a low C:N ratio inhibiting microbial activity. The optimum C:N ratio of the feedstock for anaerobic digestion is thought to be in the range of 20–30:1 [26]. The addition of material with a high C:N ratio, such as straw, would, therefore, potentially increase digestion of the manure-based feedstock [26]. Similarly, a review study concluded that manure should be mixed with high-energy waste to enhance fermentation effectiveness [22] (Chojnacka and Moustakas, 2024). Therefore, with increased digestion, there would be greater breakdown of the organic matter, increased dissolved NH4+, and reduced CH4 emissions.
The gas emission data showed higher CH4 emissions with the manure AD compared to all the other treatments, and both manure slurry and AD had higher CO2 emissions than the food AD treatment, which again confirms incomplete digestion in the manure feedstock (Figure 3). The same data also showed that the food AD rapidly volatilised NH3 on application; this emission was 17% of the total ammonium in the AD over the 5 days of application (Figure 3). Ammonia is rapidly converted to N2O, a GHG, or to NO3 in the soil, which is then rapidly leached. Inorganic N fertiliser did not have such high emissions of CH4 or NH3. However, the inorganic N fertiliser and manure slurry did have higher N2O emissions than either of the AD materials. N2O is ~273× more potent than CO2 as a GHG. Likewise, in a study comparing manure, slurry, and digestate with inorganic N fertiliser in a field trial, it was found that only slurry had N2O emissions equal to inorganic fertiliser, and manure and digestate emissions were much lower over 3 years [27]. Similarly, N2O emissions were found to be much lower with combined organic and urea N fertiliser treatments compared to urea fertiliser only, applied at the same N rate, and this trend was observed both in a field trial and in data simulated with the DNDC model [28]. In summary, with manure and food AD, there is the potential for elevated emissions of different GHGs compared to inorganic fertiliser. Albeit, in the case of manure AD, this can probably be reduced with enhanced digestion (i.e., larger reactors with longer retention times and a greater C:N ratio of the feedstock), and the treatments also indicate much reduced CH4 emissions with combined inorganic and organic fertiliser applications (N2 + ½ Org) (Figure 3).
Regarding the use of AD as a fertiliser, it should be noted that digestate tends to be very diluted (the amendments contained < 0.2% NH4, Table 2); therefore, to make applications feasible, either larger volumes need to be applied or mixtures with inorganic fertiliser (as described in this study) should be implemented to achieve optimal nutrient concentrations (which was also observed to reduce potential GHG emissions).
Finally, it should be considered that synthetic nitrogen fertiliser is very energy-intensive to produce and transport, having a very high carbon footprint, whereas organic amendments, if not otherwise utilised, would emit GHG and leachates anyway, whilst also being a renewable energy source when used in anaerobic digesters.

5. Conclusions

Both the food AD- and manure-based products tested in this study have the potential to fully or partially replace complete nutrient-balanced inorganic fertiliser in terms of achieving equal or higher yield and equal crop nutrient content, including N, P, K, and S. However, with the manure slurry and AD, the application of a slightly higher concentration of available N was needed to achieve yields equal to those of inorganic fertiliser. Our results indicate that the combined use of inorganic and organic fertilisers did produce the best results with regard to yield, nutrient use efficiency, and GHG emissions, not including likely beneficial results on soil health. An interesting finding was that with the manure-based fertilisers, particularly the AD, there was increased P concentration in the plant tissue, which was unrelated to any biomass dilution effects and probably explained by the 3× greater Mg concentration of the fertiliser, which can increase P availability. Regarding the AD from the small-scale on-farm digester, further process optimisation is needed with more complete digestion of manure-based feedstock (i.e., by extending retention time, increasing reaction temperatures, or increasing feedstock C:N ratio), which is part of the ongoing project.

Supplementary Materials

The following supporting information can be downloaded at https://www.mdpi.com/article/10.3390/agronomy16030287/s1.

Author Contributions

Conceptualisation, I.A., C.L.T. and S.M.H.; methodology, S.M.H. and C.L.T.; formal analysis, C.L.T.; investigation, C.L.T. and I.A.; data curation, C.L.T.; writing—original draft preparation, C.L.T.; writing—review and editing, I.A., S.M.H. and C.L.T.; visualisation, C.L.T.; supervision, S.M.H.; project administration, C.L.T. and I.A.; funding acquisition, I.A. and C.L.T. All authors have read and agreed to the published version of the manuscript.

Funding

This research was funded by the Biotechnology and Biological Sciences Research Council (BBSRC, UK) grant number [BBS/E/RH/230003B; BBS/E/RH/230003C] and the Royal Academy of Engineering (RAEng).

Data Availability Statement

The raw data supporting the conclusions of this article will be made available by the authors upon request; some IP restrictions apply.

Acknowledgments

The authors would like to express their appreciation to Ahimsa Dairy Farms and EcoNomad Solutions for allowing access to their fully operational biodigester. All the authors declare that they did not use generative AI or AI-assisted technologies in the study or during the manuscript preparation.

Conflicts of Interest

The authors declare no conflicts of interest.

Abbreviations

AD (anaerobic digestate); OA (organic amendments); GHG (greenhouse gas).

References

  1. Dawe, D.; Dobermann, A.; Ladha, J.K.; Yadav, R.L.; Bao, L.; Gupta, R.K.; Lal, P.; Panaullah, G.; Sariam, O.; Singh, Y.; et al. Do organic amendments improve yield trends and profitability in intensive rice systems? Field Crops Res. 2003, 83, 191–213. [Google Scholar] [CrossRef]
  2. Gopinath, K.A.; Saha, S.; Mina, B.L.; Harit Pande Kundu, S.; Gupta, H.S. Influence of organic amendments on growth, yield and quality of wheat and on soil properties during transition to organic production. Nutr. Cycl. Agroecosystems 2008, 82, 51–60. [Google Scholar] [CrossRef]
  3. Hijbeek, R.; Ittersum, M.K.; Berge, H.F.M.; Gort, G.; Spiegel, H.; Whitmore, A.P. Do organic inputs matter—A meta-analysis of additional yield effects for arable crops in Europe. Plant Soil 2017, 411, 293–303. [Google Scholar] [CrossRef]
  4. Thomas, C.L.; Acquah, G.E.; Whitmore, A.P.; McGrath, S.P.; Haefele, S.M. The Effect of Different Organic Fertilizers on Yield and Soil and Crop Nutrient Concentrations. Agronomy 2019, 9, 776. [Google Scholar] [CrossRef]
  5. Albano, X.; Whitmore, A.P.; Sakrabani, R.; Thomas, C.L.; Sizmur, T.; Ritz, K.; Harris, J.; Pawlett, M.; Watts, C.; Haefele, S.M. Effect of organic amendments on yields, yield potential and nitrogen use efficiency in a cereal-based cropping system. J. Soil Sci. Plant Nutr. 2023, 23, 2122–2137. [Google Scholar] [CrossRef]
  6. Mohanty, M.; Sinha, N.K.; Sammi Reddy, K.; Chaudhary, R.S.; Subba Rao, A.; Dalal, R.C.; Menzies, N.W. How Important is the Quality of Organic Amendments in Relation to Mineral N Availability in Soils? Agric. Res. 2013, 2, 99–110. [Google Scholar] [CrossRef]
  7. Poulton, P.; Johnston, J.; Macdonald, A.; White, R.; Powlson, D. Major limitations to achieving “4 per 1000” increases in soil organic carbon stock in temperate regions: Evidence from long-term experiments at Rothamsted Research, United Kingdom. Glob. Change Biol. 2018, 24, 2563–2584. [Google Scholar] [CrossRef]
  8. Vaneeckhaute, C.; Styles, D.; Prade, T.; Adams, P.; Thelin, G.; Rodhe, L.; Gunnarsson, I.; D’Hertefeldt, T. Closing nutrient loops through decentralized anaerobic digestion of organic residues in agricultural regions: A multi-dimensional sustainability assessment. Resour. Conserv. Recycl. 2018, 136, 110–117. [Google Scholar] [CrossRef]
  9. Zaman, M.; Blennerhassett, J.D. Effects of the different rates of urease and nitrification inhibitors on gaseous emissions of ammonia and nitrous oxide, nitrate leaching and pasture production from urine patches in an intensive grazed pasture system. Agric. Ecosyst. Environ. 2010, 136, 236–246. [Google Scholar] [CrossRef]
  10. Reay, D.S.; Davidson, E.A.; Smith, K.A.; Smith, P.; Melillo, J.M.; Dentener, F.; Crutzen, P.J. Global agriculture and nitrous oxide emissions. Nat. Clim. Change 2012, 2, 410–416. [Google Scholar] [CrossRef]
  11. Charles, A.; Rochette, P.; Whalen, J.K.; Angers, D.A.; Chantigny, M.H.; Bertrand, N. Agriculture, Ecosystems and Environment Global nitrous oxide emission factors from agricultural soils after addition of organic amendments: A meta-analysis. Agric. Ecosyst. Environ. 2017, 236, 88–98. [Google Scholar] [CrossRef]
  12. Czekala, W. Digestate as a source of nutrients: Nitrogen and its fractions. Water 2022, 14, 4067. [Google Scholar] [CrossRef]
  13. Moller, K.; Muller, T. Effects of anaerobic digestion on digestate nutrient availability and crop growth: A review. Eng. Life Sci. 2012, 123, 242–257. [Google Scholar] [CrossRef]
  14. Alburquerque, J.A.; de la Fuente, C.; Bernal, M.P. Chemical properties of anaerobic digestates affecting C and N dynamics in amended soils. Agric. Ecosyst. Environ. 2012, 160, 15–22. [Google Scholar] [CrossRef]
  15. Vanden Nest, T.; Amery, F.; Fryda, L.; Boogaerts, C.; Bilbao, J.; Vandecasteele, B. Renewable P sources: P use efficiency of digestate, processed animal manure, compost, biochar and struvite. Sci. Total Environ. 2021, 750, 141699. [Google Scholar] [CrossRef]
  16. Weimers, K.; Bergstrand, K.-J.; Hultberg, M.; Hakan, A. Liquid Anaerobic Digestate as Sole Nutrient Source in Soil less Horticulture—Or Spiked With Mineral Nutrients for Improved Plant Growth. Front. Plant Sci. 2022, 13, 770179. [Google Scholar] [CrossRef]
  17. Bolzonella, D.; Fatone, F.; Gottardo, M.; Frison, N. Nutrients recovery from anaerobic digestate of agro-waste: Techno-economic assessment of full scale applications. J. Environ. Manag. 2018, 216, 111–119. [Google Scholar] [CrossRef]
  18. Hafner, F.; Hartung, J.; Moller, K. Digestate Composition Affecting N Fertiliser Value and C Mineralisation. Waste Biomass Valorization 2022, 13, 3445–3462. [Google Scholar] [CrossRef]
  19. Sharifi, M.; Baker, S.; Hojabri, L.; Hajiaghaei-Kamrani, M. Short-term nitrogen dynamics in a soil amended with anaerobic digestate. Can. J. Soil Sci. 2019, 99, 173–181. [Google Scholar] [CrossRef]
  20. Béghin-Tanneau, R.; Guerin, F.; Guiresse, M.; Kleiber, D.; Scheiner, J.D. Carbon sequestration in soil amended with anaerobic digested matter. Soil Tillage Res. 2019, 192, 87–94. [Google Scholar] [CrossRef]
  21. Hallat-Sanchez, J.; Smith, J.; Norton, G.J. Impact of adding anaerobic digestate to soil and consequences on crop performance. Agronomy 2023, 13, 2889. [Google Scholar] [CrossRef]
  22. Chojnacka, K.; Moustakas, K. Anaerobic digestate management for carbon neutrality and fertilizer use: A review of current practices and future opportunities. Biomass Bioenergy 2024, 180, 106991. [Google Scholar] [CrossRef]
  23. Zhang, X.; Torres-Ballesteros, A. Soil Structure and Gas Emissions from Soil under Different Management Regimes at Long-Term Experimental Sites; NERC Environmental Information Data Centre: Lancaster, UK, 2023. [Google Scholar] [CrossRef]
  24. Qi, G.; Pan, Z.; Sugawa, Y.; Andriamanohiarisoamanana, F.J.; Yamashiro, T.; Iwasaki, M.; Kawamoto, K.; Ihara, I.; Umetsu, K. Comparative fertiliser properties of digestates from mesophilic and thermophilic anaerobic digestion of dairy manure: Focusing on plant growth promoting bacteria (PGPB) and environmental risk. J. Mater. Cycles Waste Manag. 2018, 20, 1448–1457. [Google Scholar] [CrossRef]
  25. Viaene, J.; Agneessens, L.; Capito, C.; Ameloot, N.; Reubens, B.; Willekens, K.; Vandecasteele, B.; De Neve, S. Co-ensiling, co-composting and anaerobic co-digestion of vegetable crop residues: Product stability and effect on soil carbon and nitrogen dynamics. Sci. Hortic. 2019, 220, 214–225. [Google Scholar] [CrossRef]
  26. Ituen, E.U.U.; Etim, G.F. Carbon-Nitrogen Ratio as a Basis for the Selection of Substrates for Optimum Biogas Production. Adv. Sci. Technol. 2012, 6, 33–38. [Google Scholar]
  27. Kitamura, R.; Sugiyama, C.; Yasuda, K.; Nagatake, A.; Yuan, Y.; Du, J.; Yamaki, N.; Taira, K.; Kawai, M.; Hatano, R. Effects of Three Types of Organic Fertilizers on Greenhouse Gas Emissions in a Grassland on Andosol in Southern Hokkaido, Japan. Front. Sustain. Food Syst. 2021, 5, 649613. [Google Scholar] [CrossRef]
  28. Zhou, H.; Wang, Y.; Wang, J.; Liu, H.; Li, H.; Guo, Y. Effects of Long-Term Organic–Inorganic Nitrogen Application on Maize Yield and Nitrogen-Containing Gas Emission. Agronomy 2023, 13, 848. [Google Scholar] [CrossRef]
Figure 1. Experimental setup in controlled glasshouse: gaseous emissions testing with a Gasmet analyser controlled using a tablet (left) and general layout of a selection of potted wheat crops used in the trials (right).
Agronomy 16 00287 g001
Figure 2. Mean (+standard deviation) of grain yield (a), nitrogen use efficiency (b), and grain macronutrient content (cf) in wheat plants grown in a glasshouse at 5 pots per treatment. The treatments were food AD, manure AD, and manure slurry, at full organic amendment application (‘Full org’; orange bars), full inorganic fertiliser application (at 240 mg NH4/kg−1 soil) plus half rate of organic fertiliser (‘N2 + ½ org’; blue bars), and controls with only inorganic fertiliser (at 240 mg NH4/kg−1 soil, ‘N2’; black bars) or no fertiliser at all (‘N0’; white bars). The organic fertiliser was applied at 3 rates based on the available N content: 140 (OM1) < 240 (OM2) < 300 (OM3) mg NH4 kg−1 soil. Where the inorganic fertiliser was applied, it contained all plant-essential macro- and micronutrients.
Agronomy 16 00287 g002
Figure 3. A random selection of the pots with wheat plants grown in a glasshouse with food waste AD, manure slurry, and manure AD, at a full organic amendment application (‘Full org’), a full inorganic fertiliser application plus a half rate of organic fertiliser (‘N2 + ½ org’), and controls with no organic fertiliser but with inorganic fertiliser (‘N2’) or no inorganic fertiliser (‘N0’). Organic fertiliser was applied at 4 rates (0, 1, 2, 3) based on the available N content: 0, 140 (OM1) < 240 (OM2) < 300 (OM3) mg NH4 kg−1 soil. Where inorganic fertiliser was applied, it was at a rate of 240 mg NH4 kg−1 soil along with all the other plant-essential macro- and micronutrients.
Agronomy 16 00287 g003
Figure 4. Mean (±standard deviation) emissions of CO2 (a), CH4 (b), NH3 (c), and N2O (d), from the treatments applied to wheat plants grown in a glasshouse at 5 pots per treatment. Pots received either a full organic amendment of manure slurry, manure AD, and food AD at the OM2 rate of 240 mg NH4 kg−1 soil (‘Full org’), or received a half rate of organic amendment of 120 mg NH4 kg−1 soil plus an inorganic fertiliser rate of 240 mg NH4 kg−1 soil (‘N2 + ½ org’). Control pots received an inorganic fertiliser rate of 240 mg NH4 kg−1 soil (‘N2’) and no fertiliser (‘N0’). Note that in the case of the control ‘N2’, this is seen on the ‘N2 + ½’ org plot panel, and the control ‘N0’ is seen on the Full org plot panel. Gaseous emissions from pots were measured over 5 days for a 3 min period daily. Where inorganic fertiliser was applied, it contained all plant-essential macro- and micronutrients.
Agronomy 16 00287 g004
Table 1. Overview of all the treatments applied: food anaerobic digestate (AD); manure AD; manure slurry; and control N2 and N0 (no organic amendment), consisting of different organic N sources and rates, different inorganic N rates and additional complete macro/micronutrients.
MaterialOrganic N Rate (mg NH4+/kg Soil)Inorganic N Rate (mg NH4+/kg Soil)Total N Applied (mg NH4+/kg Soil)Other Macro/MicronutrientsCode
Food AD1400140NoOM1 Full Org
2400240NoOM2 Full Org
3000300NoOM3 Full Org
Food AD70240310YesOM1 N2 + ½ Org
120240360YesOM2 N2 + ½ Org
150240390YesOM3 N2 + ½ Org
Manure AD1400140NoOM1 Full Org
2400240NoOM2 Full Org
3000300NoOM3 Full Org
Manure AD70240310YesOM1 N2 + ½ Org
120240360YesOM2 N2 + ½ Org
150240390YesOM3 N2 + ½ Org
Manure slurry1400140NoOM1 Full Org
2400240NoOM2 Full Org
3000300NoOM3 Full Org
Manure slurry70240310YesOM1 N2 + ½ Org
120240360YesOM2 N2 + ½ Org
150240390YesOM3 N2 + ½ Org
Control N20240240YesN2
Control N0000NoN0
Table 2. Chemical, nutritional, and dry matter (DM) concentrations of the separated solid matter/sludge and the liquid supernatant of food AD, manure AD, and manure slurry used in the glasshouse study. Also showing DM content and total C and N content of fresh manure (not used in the glasshouse study). ‘Slurry’ refers to raw manure diluted with water (including rain).
PropertiesFood/Maize ADManure ADManure SlurryFresh Manure
Solid matter/sludge
Dry matter of AD (%)5.21.40.721
Total C of DM (%)44434244
Total N of DM (%)2.84.34.32
C:N ratio of DM16101022
Liquid supernatant
TOC (mg kg−1)2710499527/
pH7.77.77.4/
NH4+ (mg kg−1)1547339315/
NO3 + NO2 (mg kg−1)00.150.12/
PO4 (mg kg−1)571315/
P (mg kg−1)1251514/
K (mg kg−1)3338458451/
S (mg kg−1)1001518/
Ca (mg kg−1)256234229/
Mg (mg kg−1)51150138/
Fe (mg kg−1)380.50.6/
Zn (mg kg−1)2.90.050.05/
Mn (mg kg−1)1.70.10.1/
Disclaimer/Publisher’s Note: The statements, opinions and data contained in all publications are solely those of the individual author(s) and contributor(s) and not of MDPI and/or the editor(s). MDPI and/or the editor(s) disclaim responsibility for any injury to people or property resulting from any ideas, methods, instructions or products referred to in the content.