Article

Evaluation of Yield Potential and Quality of Daikon (Raphanus sativus L. convar. acanthiformis Sazon.) Cultivars Under Different Sowing Dates

1
Agrobiological Faculty, National University of Life and Environmental Sciences of Ukraine, 15 Heroyiv Oborony Str., UA 03041 Kyiv, Ukraine
2
Faculty of Engineering and Information Technologies, Latvia University of Life Sciences and Technologies, 2 Liela Str., LV-3001 Jelgava, Latvia
3
Institute of Water Problems and Land Reclamation, National Academy of Agrarian Sciences of Ukraine, 37 Vasylkivska Str., UA 03022 Kyiv, Ukraine
*
Author to whom correspondence should be addressed.
Agronomy 2026, 16(3), 282; https://doi.org/10.3390/agronomy16030282
Submission received: 9 December 2025 / Revised: 14 January 2026 / Accepted: 19 January 2026 / Published: 23 January 2026
(This article belongs to the Section Farming Sustainability)

Abstract

Climate variability necessitates the optimization of sowing dates for vegetable crops to stabilize yields and mitigate abiotic stress risks. This study aimed to evaluate the effect of sowing dates on the productivity of daikon radish (Raphanus sativus L. convar. acanthiformis Sazon.) cultivars Gulliver and Minowase under medium-podzolic, light loamy soil conditions with a pH (pHKCl) of 6.74 during the period 2022–2024. Field experiments were conducted across four sowing dates (ranging from July to early August), accounting for the hydrothermal conditions of the growing season. Effective air temperatures ranged from 428 to 950 °C, with precipitation levels between 36.9 and 252.3 mm. It was established that the sowing date significantly influenced daikon yield (p < 0.001). A significant positive correlation was identified between yield and precipitation (r = 0.76–0.84; p < 0.05), whereas the correlation between yield and the sum of effective temperatures was weak to moderate and predominantly negative (r = −0.62 to −0.10). The highest yields were achieved with sowing in the third ten-day period of July: 54.6 t ha−1 for the Gulliver cultivar and 58.9 t ha−1 for the Minowase cultivar. The Minowase cultivar consistently outperformed Gulliver in terms of yield and exhibited higher ecological plasticity under fluctuating hydrothermal conditions. These findings confirm the feasibility of optimizing sowing dates as an effective adaptive tool for enhancing the stability of daikon production amidst climate change.

1. Introduction

Global food and energy crises, alongside climate change, necessitate sustainable land use and crop adaptation [1,2]. With the population projected to exceed 10 billion by 2050, food security faces threats from demographic pressure and disruptions like wars or pandemics [3,4,5,6]. In this context, vegetable growing is vital for economic stability and public health [7,8,9]. However, insufficient consumption currently contributes to over 2.6 million annual deaths due to chronic diseases [10,11].
Determining the optimal sowing date is critical for yield forecasting and maximizing resource efficiency [12,13,14]. Incorrect timing can nullify the benefits of fertilizers and irrigation [15]. Optimizing sowing dates acts as an adaptation strategy to mitigate heat stress [16], regulate pest populations [17], and ensure optimal light for photosynthesis [18]. This approach minimizes biomass loss from water stress [19,20] and improves biochemical quality [21,22]. Furthermore, daikon serves as an effective intermediate crop for sustainable soil management [23].
Daikon (Raphanus sativus L. convar. acanthiformis Sazon.) is a widely cultivated cool-season crop [24,25,26] valued for the nutritional and medicinal properties of its roots, leaves, and pods [27,28,29,30,31]. However, environmental constraints strongly influence its quality. High temperatures and long days induce premature bolting and pungency [32], while early sowing (e.g., July) increases root pithiness compared to later dates [33]. Lower temperatures (4 °C) favor root biomass accumulation, whereas higher temperatures (18/14 °C) shift development toward leaf formation [26]. Consequently, sowing times must be adjusted regionally [34] to avoid defects caused by moisture deficits [33].
In the Ukrainian Forest Steppe, a temperature rise of 0.7–0.9 °C [35] is shifting climatic zones northward [36]. While this extends the vegetation period, it intensifies moisture deficits and negatively affects productivity [37,38]. These changes require immediate adaptation measures [39], including the selection of heat-tolerant varieties [40] and the alignment of harvest times with market demand [41].
In modern agronomy, the sowing date acts as a complex indicator of the photothermal conditions of ontogenesis. Understanding the physiological response of daikon to day length and temperature is critical for ensuring stable production amidst climate change.
The aim of this research was to determine the impact of the sowing date on daikon yield, identify the governing climatic factors, and establish the optimal sowing window to ensure stable, high-quality productivity. Additionally, the study provides a comparative analysis of the yield performance between the Gulliver and Minowase varieties.

2. Materials and Methods

2.1. Site Description, Climate, and Soil Characteristics

The experimental study was carried out between 2022 and 2024 at the National University of Life and Environmental Sciences of Ukraine (NULES), in cooperation with the Ulbroka Research Centre of the Latvia University of Life Sciences and Technologies (LBTU). The field experiment was carried out at experimental sites with approximate geographic coordinates of 50°22′42.21″ N, 30°30′05.17″ E, at an altitude of 158 m above sea level.
The soil of the experimental plot is characterized as dark gray, medium-podzolic, light loamy, with a soil pH (pHKCl) of 6.74 (Table 1), which corresponds to a neutral reaction. The humus horizon is 24–28 cm. The experimental plot is characterized by a medium humus (soil organic matter) content of 2.71%. According to the test results, nutrient concentrations are as follows: nitrate nitrogen (NO3) at 6.42 mg/kg and ammonium nitrogen (NH4) at 11.72 mg kg−1 (medium fertility class); available phosphorus (P2O5) content is 568.83 mg kg−1, which is a very high level; and available potassium (K2O) content is 152.93 mg kg−1, which corresponds to a high level. The soil is characterized by a medium sum of exchangeable bases, ranging from 6.8 to 8.6 meq 100 g−1. The physical clay content is 20–21%, and the bulk density is 1.36–1.38 g cm−3. The groundwater table depth exceeds 7 m.
Soil samples were analyzed for their physicochemical and agrochemical properties using standardized methods, in accordance with national (DSTU) and international (ISO) protocols [43,44,45,46]:
-
Soil pH (Exchangeable Acidity): Potentiometric determination was performed in a 1 M KCl suspension with a soil-to-solution ratio of 1:5, following ISO 10390:2021 (adopted as DSTU ISO 10390:2022). Measurements were conducted using a calibrated glass electrode pH meter.
-
Mineral Nitrogen ( N O 3 and N H 4 + ): The content of nitrate and ammonium nitrogen was determined according to DSTU 4729:2007 (modified by the NSC ISSAR). Nitrates were measured using the ion-selective electrode method, while ammonium nitrogen was determined colorimetrically using Nessler’s reagent.
-
Available Phosphorus (P2O5) and Exchangeable Potassium (K2O): These macronutrients were extracted using the Chirikov modified method (DSTU 4115-2002) with 0.5 M acetic acid (CH3COOH) at a 1:5 soil-to-solution ratio. Phosphorus concentration was quantified spectrophotometrically via the molybdenum blue complex method, and potassium was determined using flame photometry.
-
Soil Organic Matter (SOM): The total organic carbon (humus) content was determined by the Tyurin method as specified in DSTU 4289:2004 (clause 8.1). This procedure involves the wet oxidation of organic matter with a potassium dichromate (K2Cr2O7) and sulfuric acid (H2SO4) solution, followed by photometric measurement of Cr3+ concentration.
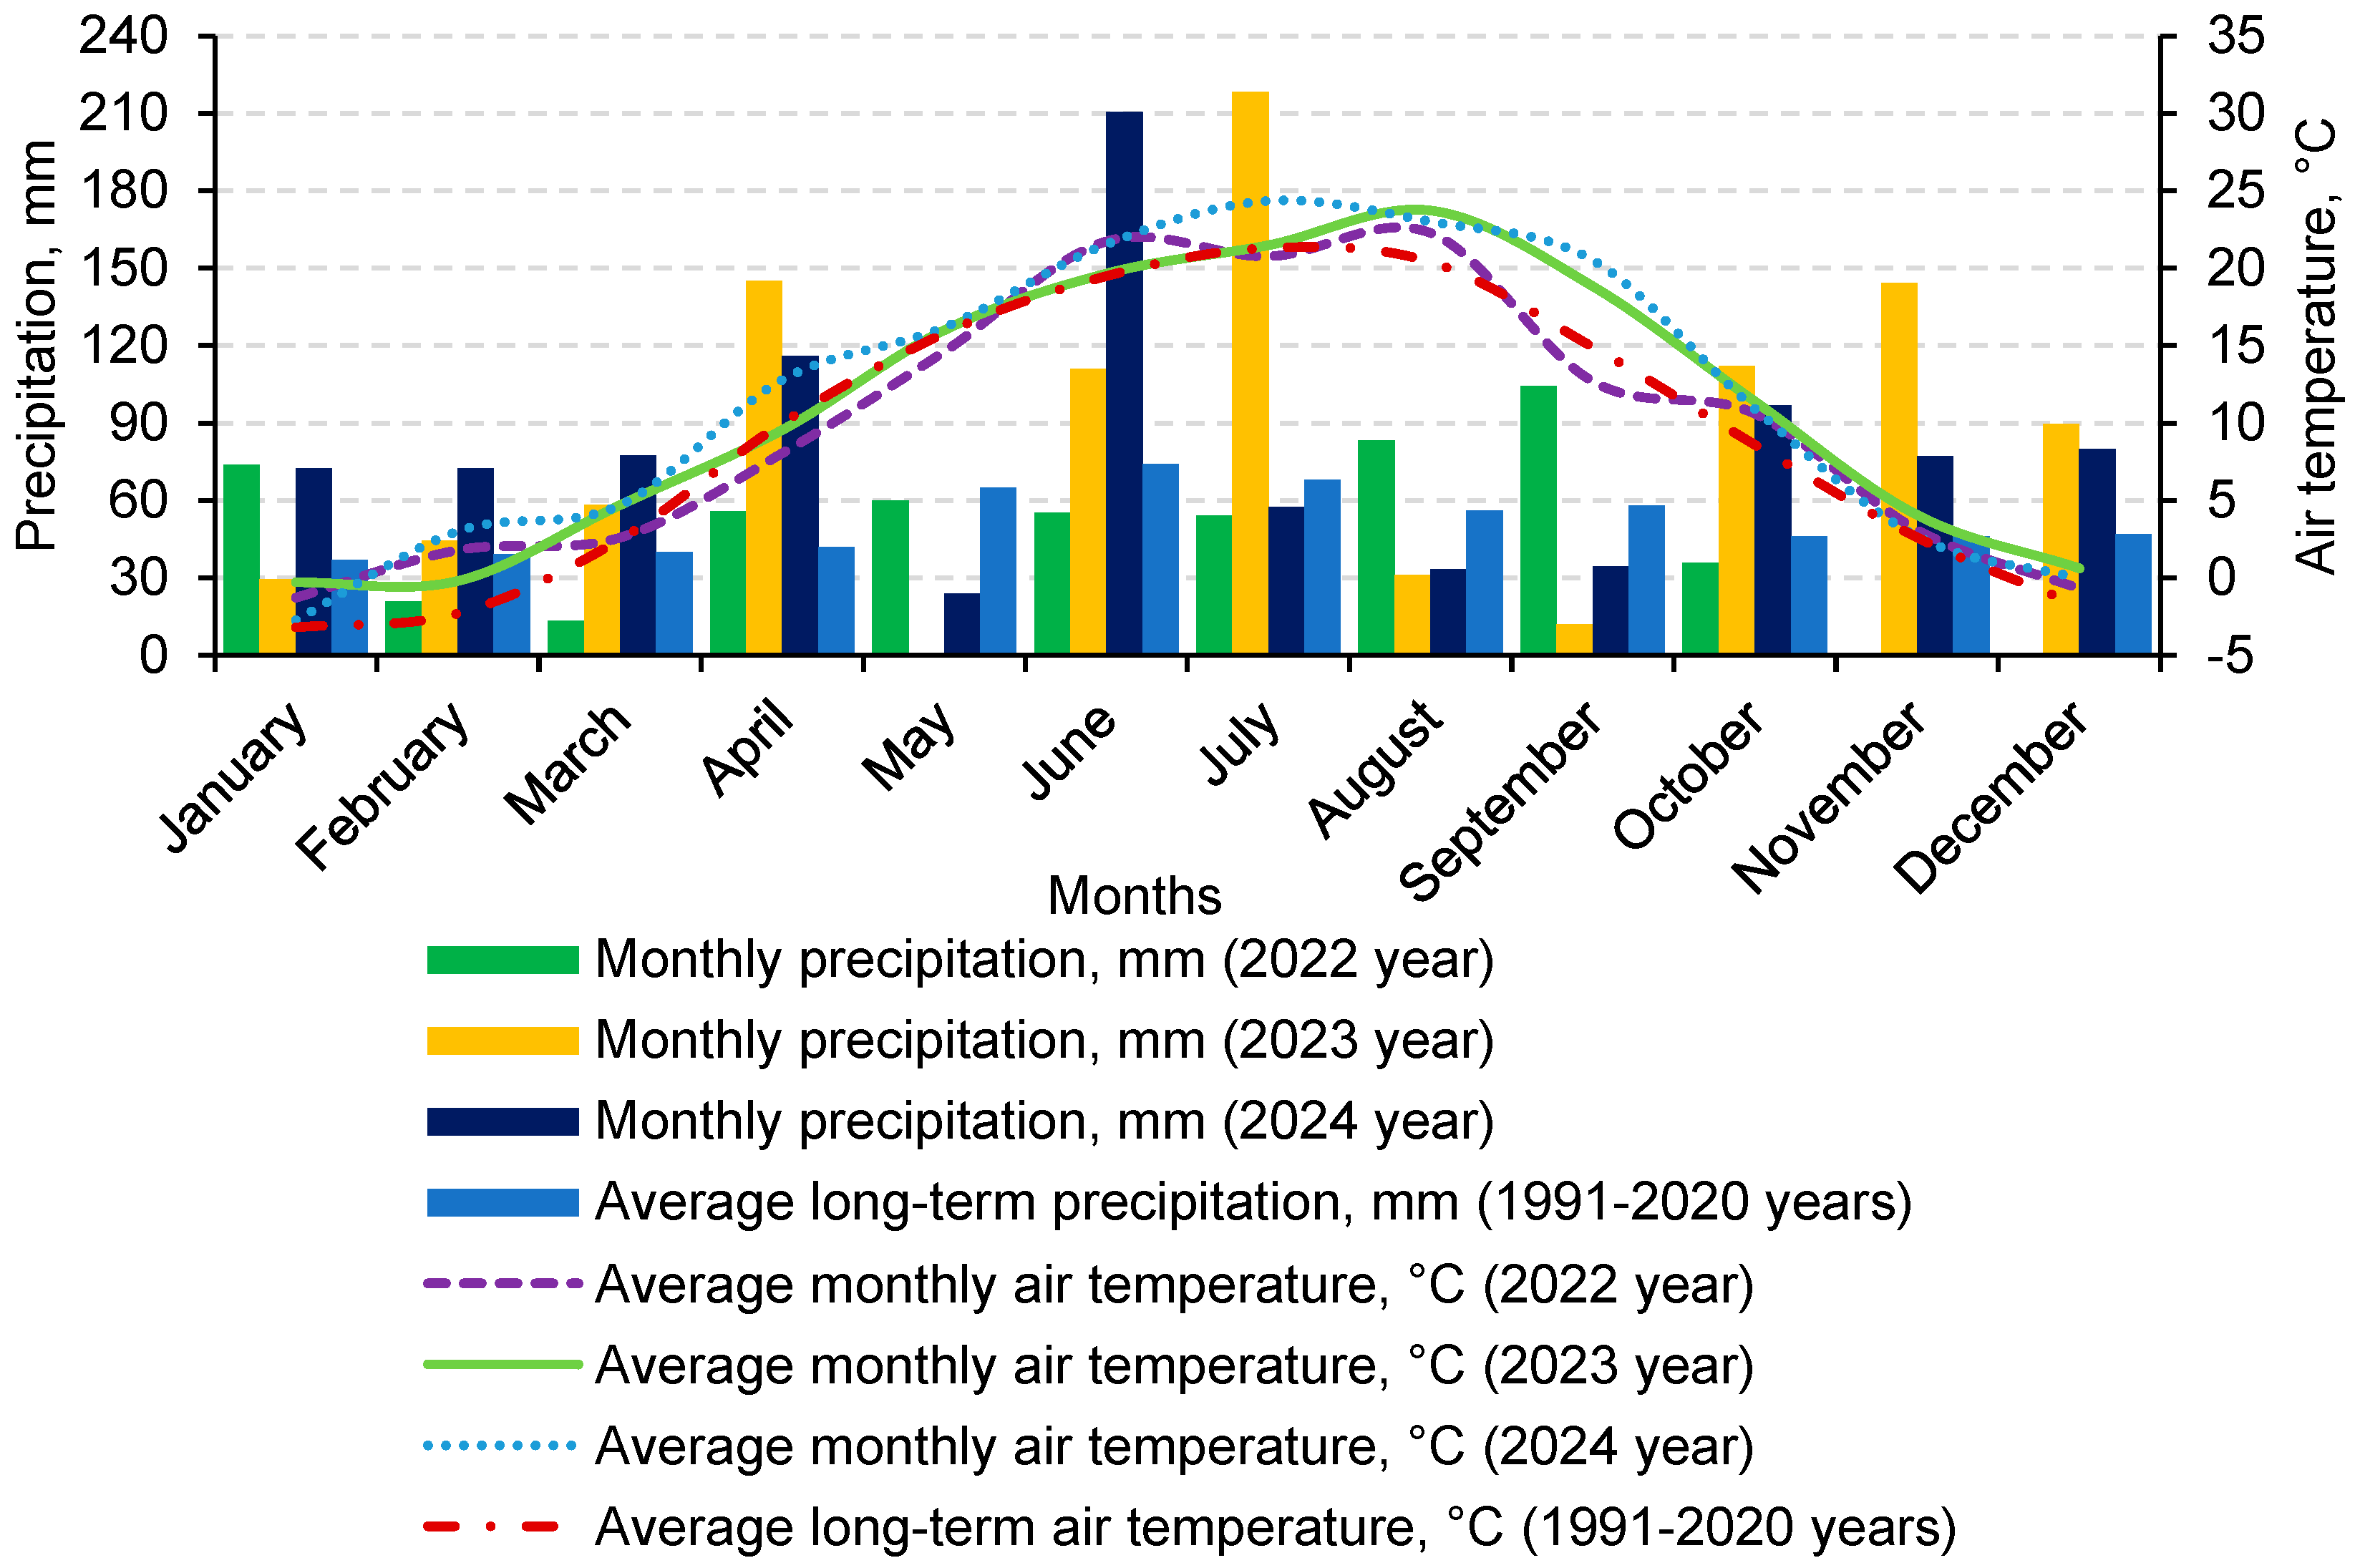
During the experimental period (July–October) in 2022–2024, the thermal regime consistently exceeded long-term averages by 0.9–2.6 °C, with the maximum temperatures recorded in August (22.3–23.7 °C) and an unstable temperature distribution in September (12.7–20.5 °C) (Figure 1). Precipitation during the active vegetation of daikon was unevenly distributed: while July and August were characterized by moderate moisture, the autumn months (September–October) saw a range of 50.2 to 81.5 mm, with October specifically exceeding historical norms by 35.5 mm. Such excessive soil moisture during these final stages of ontogenesis induced soil hypoxia, restricting root respiration and dry matter accumulation. The resulting waterlogging triggered root cracking, increased the risk of pathogenesis, and impaired the storage life of daikon due to intensive metabolic degradation of tissues. Furthermore, these conditions at the late stages of vegetation complicated harvesting and diminished the overall marketable quality of the yield.

2.2. Plant Material and Experimental Factors

In Ukraine’s commercial daikon cultivation, only a limited number of varieties are widely grown, with Gulliver and Minowase being the most prevalent. These specific varieties were selected for the research as they belong to different maturity groups: Gulliver is early-maturing (35–50 days), while Minowase is mid-maturing (60–70 days). The scientific focus was on a comparative evaluation of varieties with different genetic and geographical origins—the domestic Gulliver (Nasko) and the foreign-bred Minowase (Satimex)—which are characterized by distinct adaptive properties and economic traits.
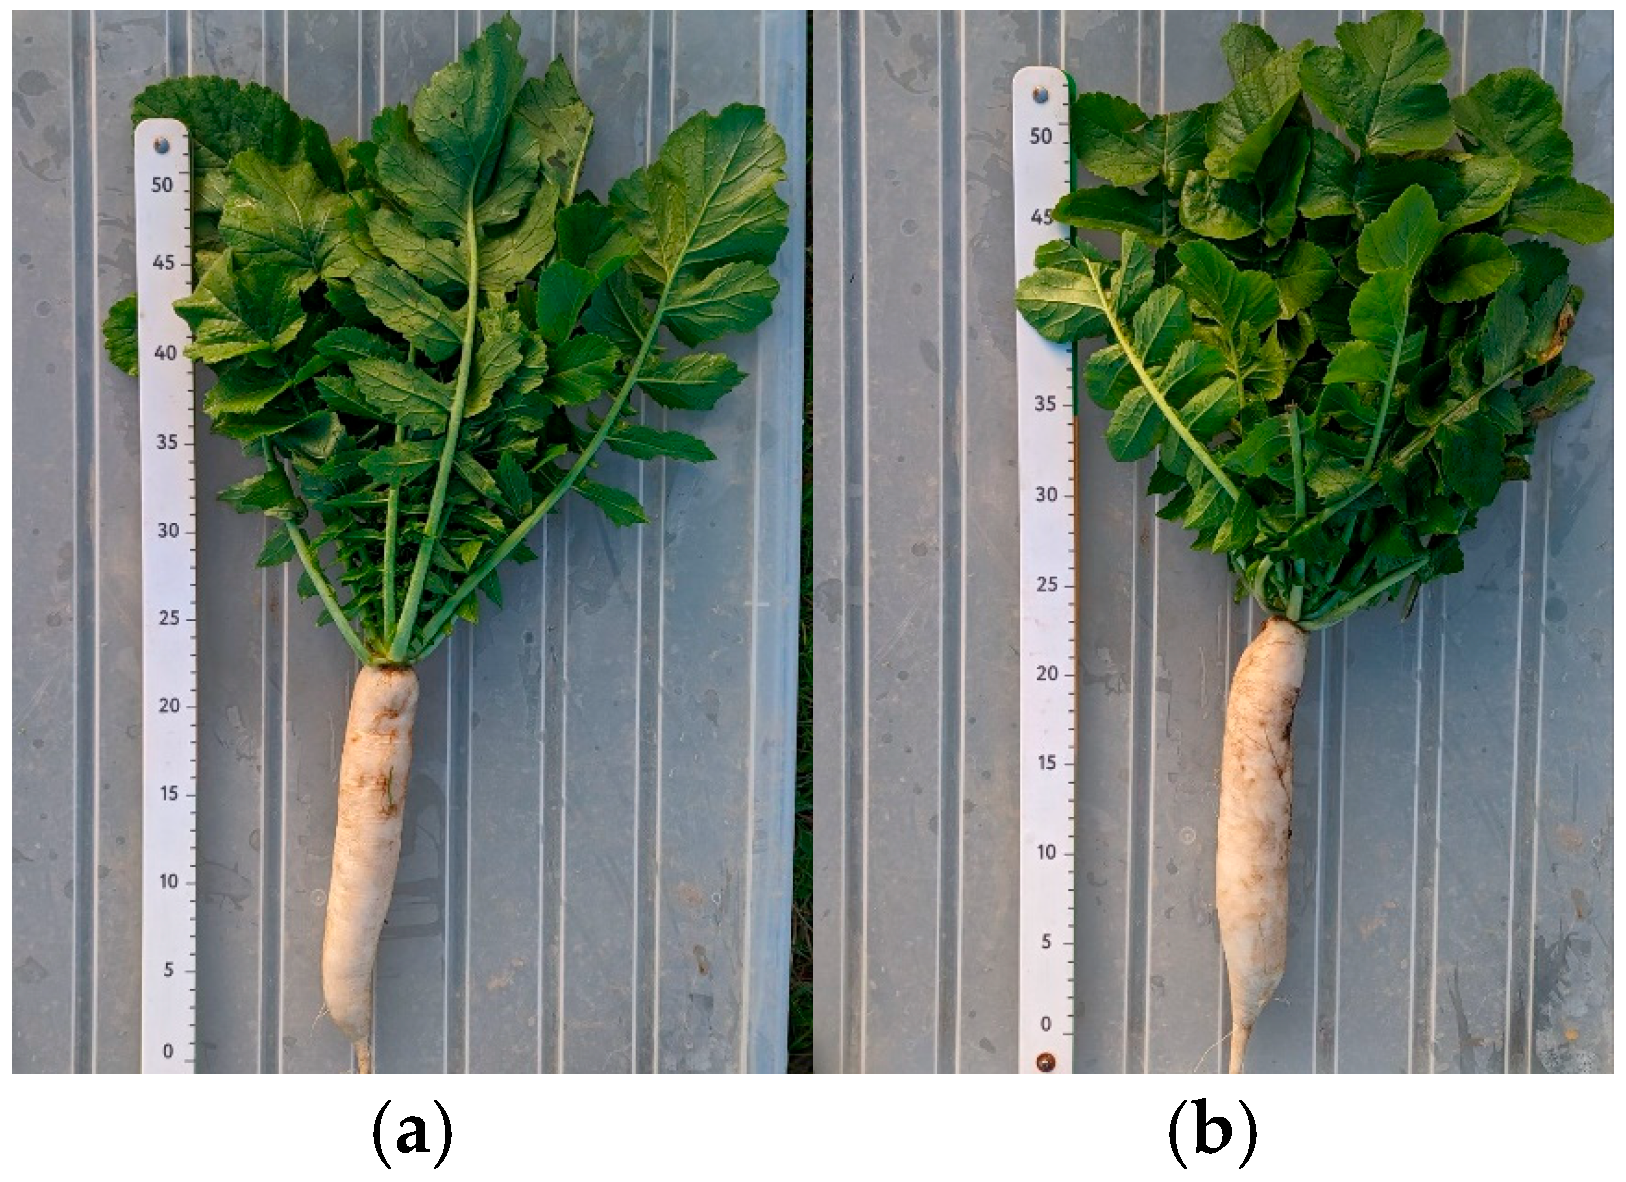
The experiment was designed as a two-factor trial. Factor A (variety) included Gulliver and Minowase. The Gulliver variety was designated as the control because it is a well-established domestic cultivar recognized for its stable yield across Ukraine. Factor B (sowing date) consisted of four levels: the first, second, and third ten-day periods of July, and the first ten-day period of August (Figure 2). The second ten-day period of July was designated as the control, as it represents the traditionally recommended agro-climatic window for daikon cultivation in the Forest Steppe zone of Ukraine. This selection allowed for a comparative analysis of how shifting sowing dates toward later or earlier periods affects crop performance and the specific adaptive responses of the studied varieties in the context of contemporary climate trends.
Since daikon is a long-day crop, it is crucial to establish a sowing date that ensures active growth occurs during periods of shortening daylight. This prevents premature flowering (bolting). Furthermore, selecting the correct date helps avoid the peak emergence period of the cabbage root fly (Delia floralis Fal.), thereby minimizing plant damage. Temperature reduction and increased air and soil moisture are also critical, as these factors prevent the development of bitterness and pithiness in the root crops. At the same time, sowing dates, depending on the length of the growing season, determine the harvest timing; it is essential that the roots reach marketable size and remain suitable for storage without overmaturing.
The research was conducted in three-fold spatial replication (on-site) with randomization and temporal repetition (during the years 2022, 2023, 2024). The registered area of the plot is 5 m2. The seeds were sown by hand, the plant placement pattern 45 × 10 cm. The seeding depth was 4–6 cm.

2.3. Experimental Design and Field Management

The experiments were conducted during 2022–2024 on different plots within the same crop rotation to maintain methodological consistency and avoid the effects of soil fatigue. Cucumber served as the preceding crop, followed by daikon cultivated annually as a catch crop. Pre-sowing soil preparation included the removal of crop residues and rotary tilling to a depth of 20–22 cm. This tillage method ensured a fine-aggregated structure of the root zone, which is a decisive factor for the unimpeded elongation and proper morphological development of daikon roots. Crop management involved regular inter-row cultivation. Pest control (specifically against the cabbage fly, Delia radicum) was conducted using the biological insecticide Aktofit (active ingredient—aversectin C, 0.2%).

2.4. Sampling and Morphometric Measurements

The studied daikon cultivars belong to different maturity groups: the early-maturing Gulliver and the mid-maturing Minowase, which necessitated a differentiated approach to determining their technical maturity at 50 and 60 days after emergence, respectively. Harvesting was carried out at the BBCH 49 stage, when the roots reached their typical cultivar-specific form and size [47]. Harvesting within these timeframes is optimal: earlier harvesting leads to yield loss due to undersized roots (mall-sized fraction), while later harvesting results in a decline in commercial quality caused by over-ripening, pithiness (cavity formation), and an increased risk of disease infection.
The pre-harvest phase involved visual monitoring of the experimental plots, followed by the determination of plant density. The boundaries of each plot were clearly demarcated. Harvesting was performed using the total harvest method, conducted separately for each experimental unit. To minimize experimental errors, harvesting across the test plots and buffer strips was carried out sequentially by replication. All field operations were completed within 1–2 days to ensure environmental homogeneity. The yield structure was analyzed by fractionating the produce into marketable and non-marketable components, with further classification into standard and non-standard products. The weight of each fraction was determined using the strain-gauge (tensometric) weighing method. Particular attention was paid to the unification of sample preparation, specifically by ensuring uniform foliage trimming of the root crops across all experimental treatments. The average weight of root crops was determined in 10 kg samples for each replication separately. The quantity of the root crops was counted and the average mass of the marketable root crops was determined with an accuracy of one gram. In each replication of the variant there was made a complete analysis of the unmarketable root crops. The unmarketable roots were sorted into those affected by diseases, those damaged by pests, cracked, blooming, undersized (the root crops that had not reach he marketable size in diameter of 3 cm), and the deformed root crops.

2.5. Biochemical Analysis

The biochemical analyses were conducted in the Laboratory of the Ukrainian Institute of Plant Varieties, using generally accepted methods, namely, the dry matter in accordance with DSTU 7804:2015; the total sugar—DSTU 4954:2008; ascorbic acid—DSTU ISO 6557-2:2014 [48,49,50]:
1. Determination of Dry Matter Content. The dry matter content was determined by drying the samples to a constant weight. From a representative homogenized sample of vegetables, at least two subsamples of 25–50 g each were weighed with an accuracy of 0.01 g into pre-weighed porcelain or Petri dishes. The dishes were then placed in a drying oven preheated to 120 °C. Upon loading, the temperature typically decreased, and the samples were maintained at 100–102 °C for 20–30 min to inactivate enzymatic processes.
Subsequently, the material was dried at 60–70 °C until it reached an air-dry state (indicated by the characteristic brittleness of the material). Final drying was conducted at 100 °C for 4 h. After cooling in a desiccator, the dishes were weighed and re-dried for 1 h at the same temperature. This procedure was repeated until a constant mass was achieved, with a maximum permissible difference between two weighings of 0.01–0.02 g.
2. Determination of Ascorbic Acid (Vitamin C). The method was based on the reducing properties of ascorbic acid. The indicator 2,6-dichlorophenolindophenol (blue dye) was reduced to a colorless compound by plant extracts containing vitamin C. Acidic plant extracts were titrated with a standard solution of the dye until a faint pink coloration appeared, resulting from an excess of the indicator in an acidic medium.
3. Quantitative Determination of Sugars. The quantitative determination of sugars was based on the ability of reducing sugars (containing a free aldehyde or ketone group) to reduce copper (II) sulfate to copper (I) oxide in an alkaline medium. The copper (I) oxide precipitate was then dissolved in iron (III) sulfate in the presence of sulfuric acid. During this reaction, the copper (I) oxide was oxidized by iron, reducing it to Fe (II), which was subsequently titrated with a potassium permanganate solution. The disaccharide content was determined using the same procedure following preliminary hydrolysis with dilute mineral acids.
Note: Since the sugar concentration in the solution is not directly proportional to the mass of the copper (I) oxide precipitate (due to the partial decomposition of monosaccharides and Fehling’s solution during heating), calculations were performed using Bertrand’s tables. These tables provide an empirically established relationship between the precipitate mass and the glucose content. Strict adherence to the standardized conditions (temperature, heating duration, and solution concentrations) was maintained to ensure the accuracy of the results.

2.6. Organoleptic (Sensory) Evaluation

The taste of the varieties was assessed by tasting fresh root crops immediately after their harvesting. For tasting there were used typical root vegetables of this variety, healthy and normally developed. They were cut across and each taster was given one segment of each root crop vegetable. The overall tasting score was given in points as a summary assessment of the attractiveness of the appearance, consistency, juiciness and taste of the root vegetable pulp. The overall tasting score was given in points as a summary assessment of the attractiveness of the appearance, consistency, juiciness and taste of the root vegetable pulp. The taste qualities were determined by a nine-point scale: 1—very tasteless; 3—tasteless; 5—average; 7—tasty; 9—very tasty. The consistency of the pulp was also determined: very tender, tender, rough; juiciness: very juicy, juicy, not juicy.

2.7. Statistical Analysis

Statistical analysis of the research data was performed using Statistica 13.1 (StatSoft, Inc., Tulsa, OK, USA) and JASP (Version 0.95.4, JASP Team, 2025). The normality of the data distribution was verified through a visual analysis of Normal Probability Plots of Residuals and the Shapiro–Wilk test. Since the model residuals followed a normal distribution, a three-way Analysis of Variance (Factorial ANOVA) was applied to determine the influence of the studied factors. Data visualization and the construction of charts were carried out using Microsoft Excel 2024 (Microsoft Corp., Redmond, WA, USA).
To identify specific differences between the daikon varieties, Tukey’s Honestly Significant Difference (HSD) post hoc test was employed. Differences were considered statistically significant at p < 0.05 (incorporating the Bonferroni correction where applicable). The direction and strength of the relationships between the studied parameters were established by calculating the Pearson correlation coefficient [51].

3. Results

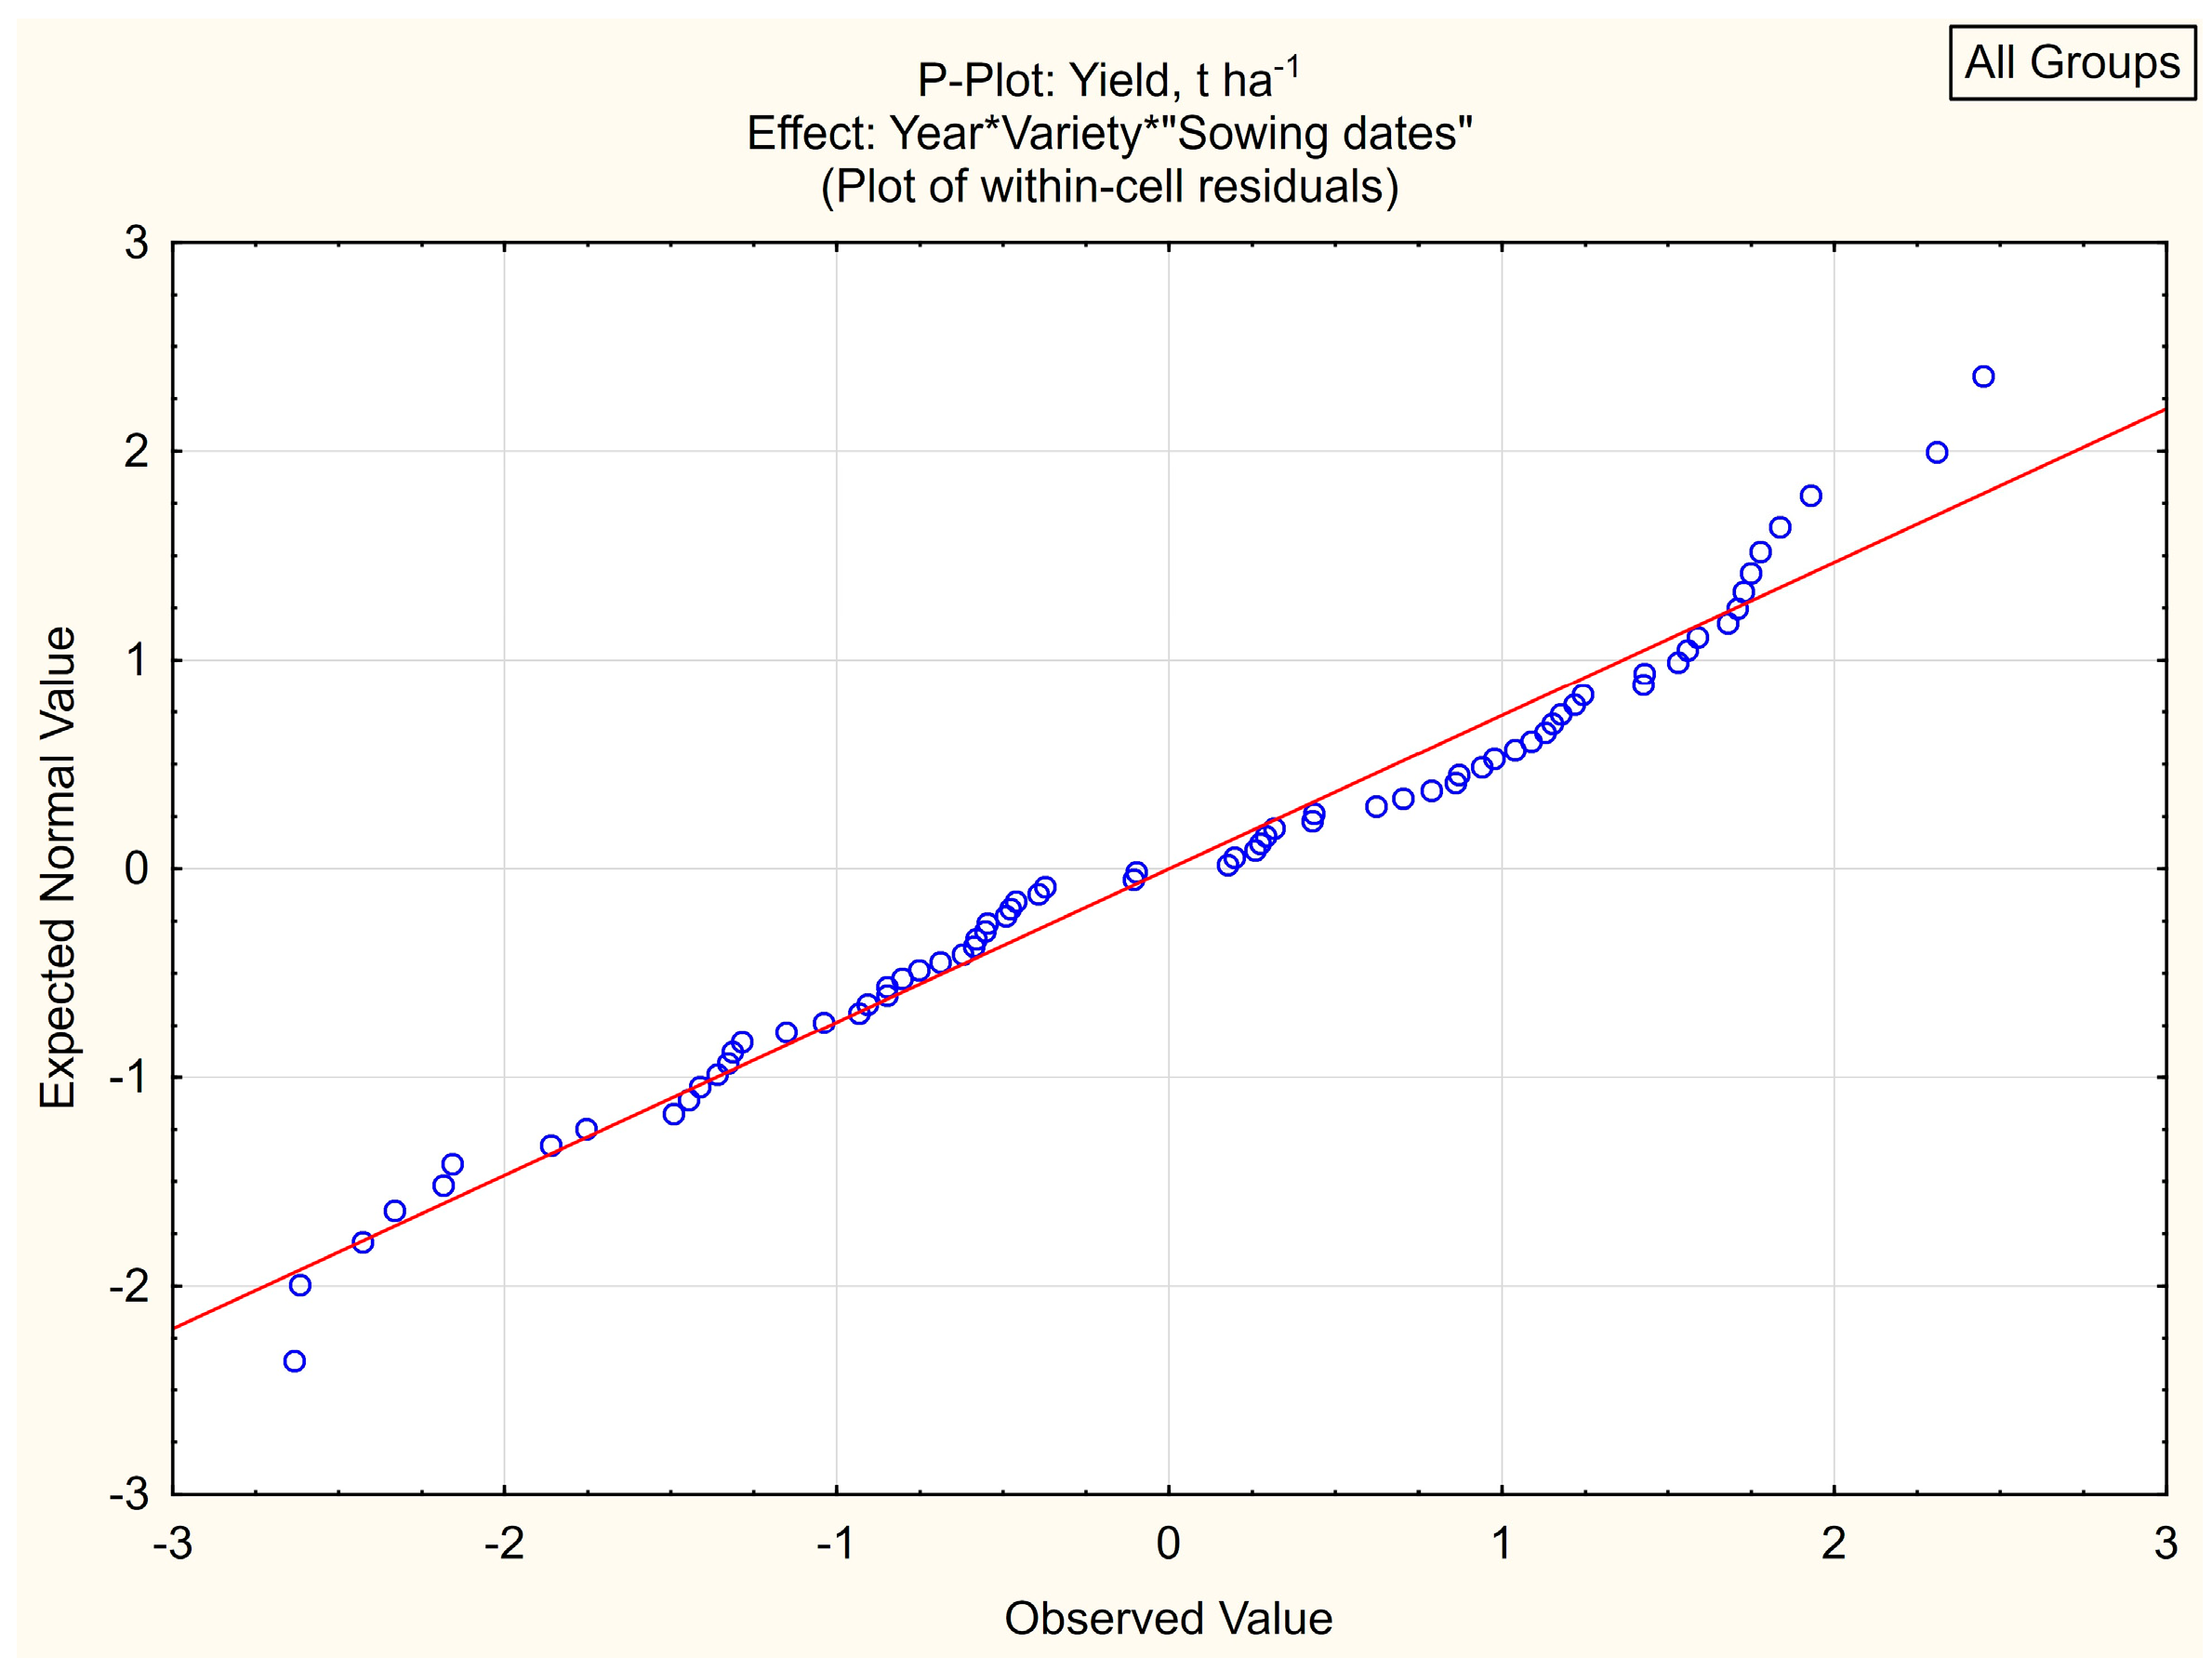
The Normal Probability Plot (P-Plot) confirms the normal distribution of yield residuals across the studied factors: year, variety, and sowing date (Figure 3). Since most experimental points (blue circles) are aligned along the diagonal reference line without significant deviations, this indicates statistical homogeneity of the data and justifies the use of ANOVA for evaluating the research results.
The ANOVA results indicate that the dominant factor influencing yield is the sowing date (F = 134.4). In combination with variety (F = 99.4) and year (F = 13.4), it determines the formation of crop productivity, with all mentioned factors showing high statistical significance (p < 0.001) (Table 2). It is worth noting the significant interaction between the “Year × Sowing date” factors, which suggests the absence of a universal calendar date for sowing and emphasizes the need for its adaptation to the hydrothermal conditions of a specific year. In contrast, the non-significant interaction between year and variety (p = 0.75) confirms the stability of the variety’s genetic potential regardless of the growing season conditions.
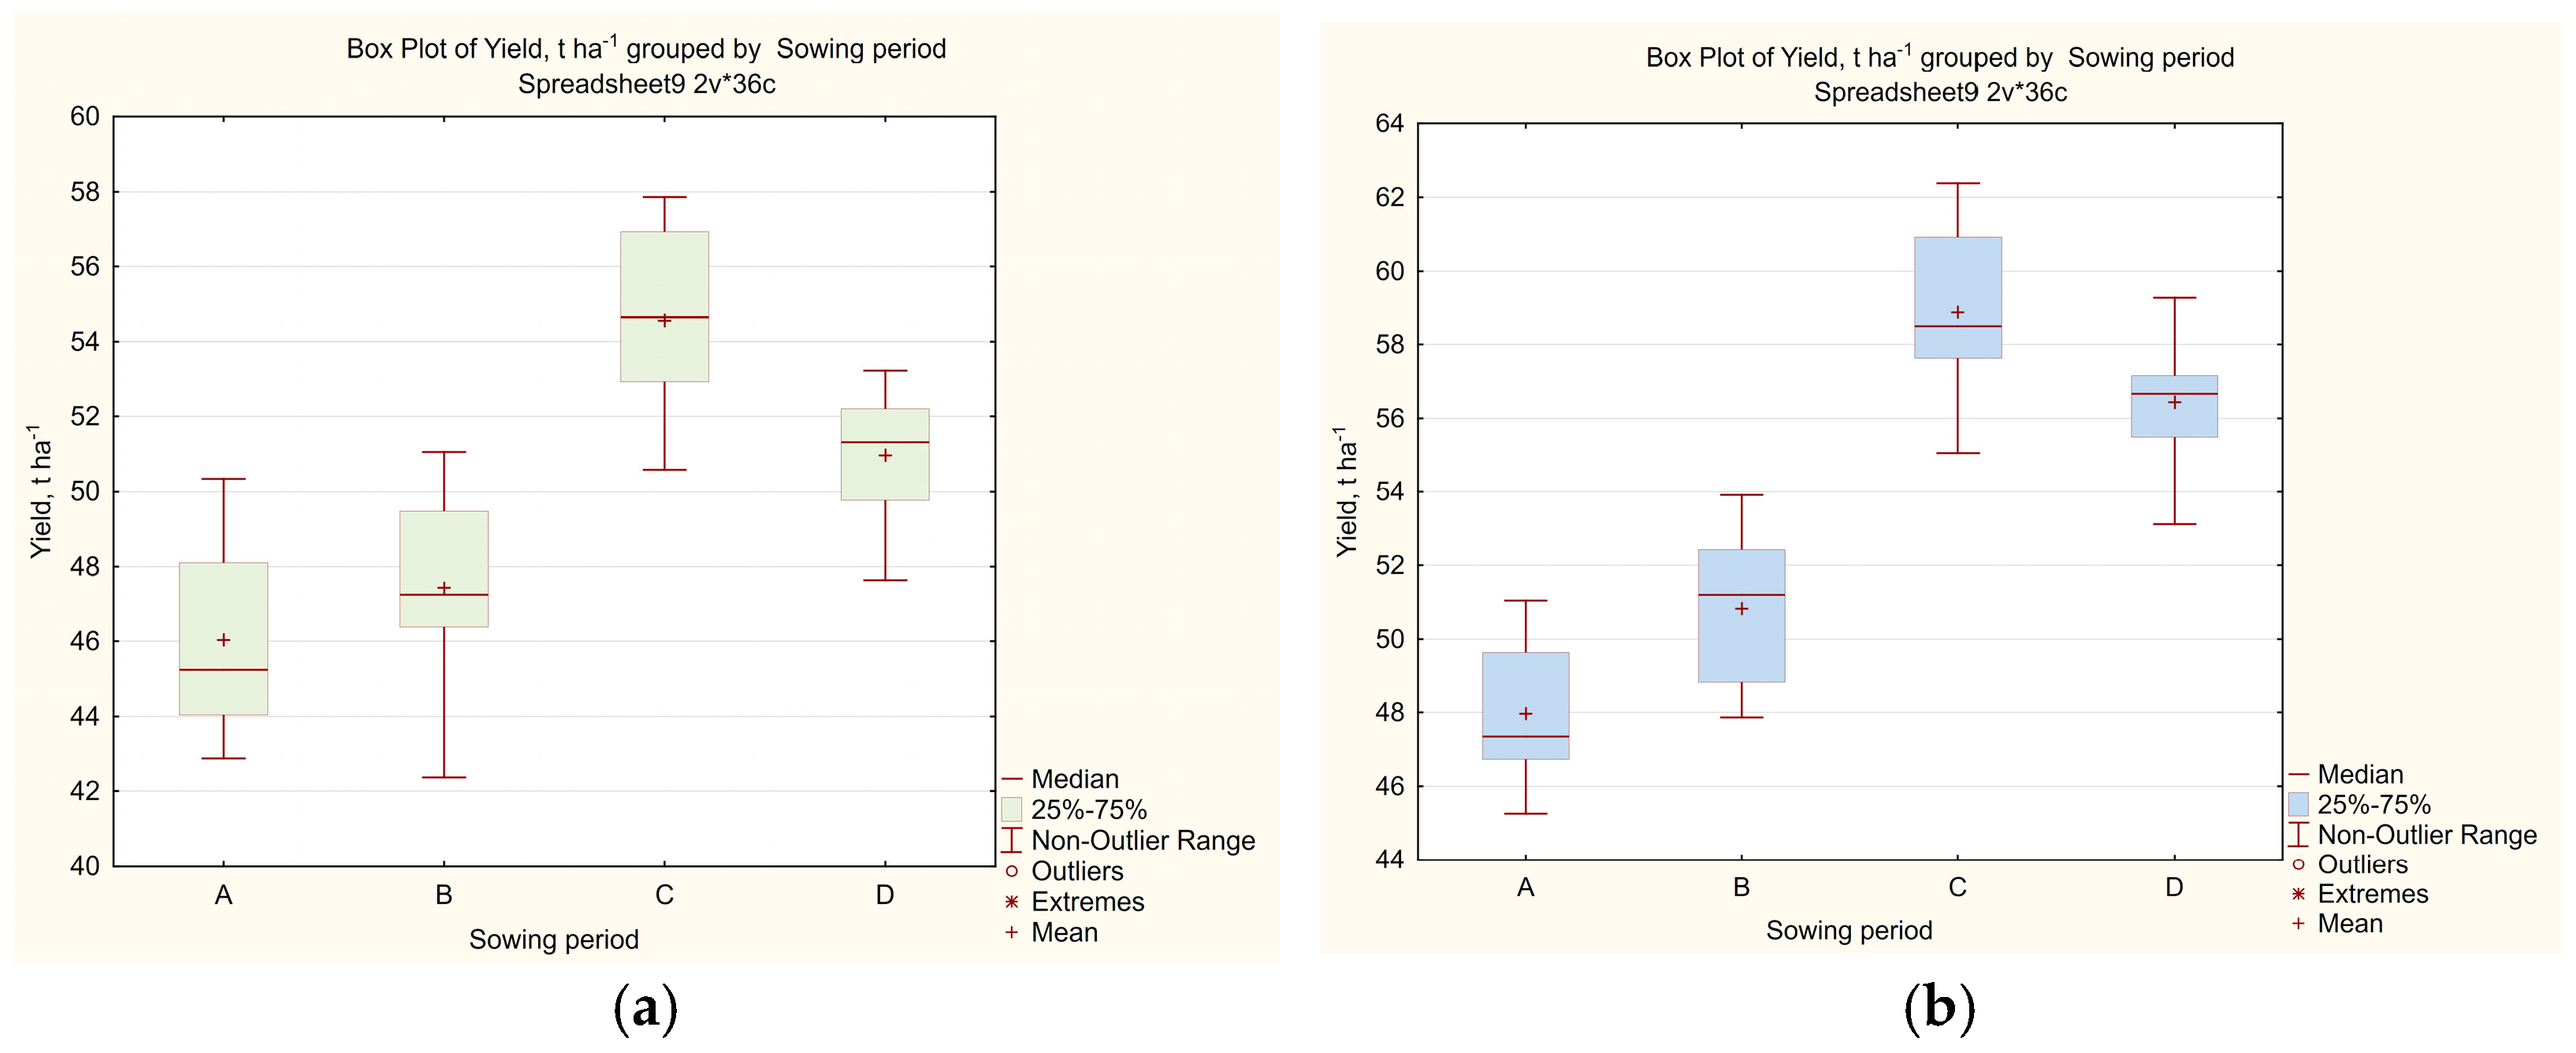
The box plot analysis shows that the yield of the daikon varieties at different sowing dates does not show any outliers but fails the normality test because the mean and median are at different points of distribution (Figure 4).
During the 2022–2024 period of sowing and harvesting of daikon, depending on the variety and sowing time, the sum of effective air temperatures (over 10 °C) fluctuated between 428 and 950 °C, and the sum of precipitation ranged from 36.9 to 252.3 mm. The results of the correlation analysis indicate that precipitation levels are the primary factor influencing the yield of both daikon radish cultivars (Table 3). This is confirmed by a statistically significant positive correlation, which is particularly pronounced for the Gulliver cultivar during July sowings (r = 0.803–0.839, p < 0.01) and for the Minowase cultivar during early August sowings (r = 0.759, p < 0.05). The study further revealed that the impact of cumulative temperatures above 10 °C on daikon yield depends on both the cultivar and the sowing period. For the Gulliver cultivar, the negative impact of temperature diminishes when sowing is shifted from early July (r = −0.598) to August, when the correlation becomes neutral. The Minowase cultivar exhibits higher thermal sensitivity during July sowings, demonstrating a moderate negative correlation (r = −0.620–−0.627), which is neutralized when transitioning to August sowing (r = 0.272). Although the temperature factor is not a critical limiting factor (p > 0.05), later sowing dates are more favorable for both cultivars due to the reduction in heat stress on the plants.
Regression analysis established a quantitative relationship between yield and hydrothermal conditions: an increase in the cumulative effective air temperatures by every 10 °C resulted in a yield reduction of 0.075 t ha−1 for the Gulliver variety cultivar during early July sowing. For the Minowase cultivar, this decrease ranged from 0.049 to 0.051 t ha−1. In contrast, the impact of precipitation was positive: every additional 10 mm of moisture increased the yield of the Gulliver variety cultivar by 0.173–0.296 t ha−1, with a peak increase of 3.0 t ha−1 during mid-July sowing. For the Minowase variety cultivar, the yield increased by 0.229–0.531 t ha−1, depending on the specific sowing date.
According to factor A (variety), growing the Minowase variety, compared to the Gulliver variety, gives a significant increase in the root crop yield at all sowing dates (Table 4, Appendix A). The lowest yield deviation of 2.0 t ha−1 or 4.3% for the Minowase variety, in relation to the Gulliver variety, was noted when sowing in the first ten days of July, and the yield indicator was 48.0 t ha−1. Sowing of the Minowase variety in the second and third ten-day periods of July provided a yield of 50.8–58.9 t ha−1, which was characterized as an intermediate value (3.4–4.3 t ha−1 or 7.2–7.9%) in deviation from the Gulliver variety. On the whole, the Minowase variety, when sown in the first ten days of August (the yield 56.4 t ha−1), gives the greatest increase in the yield by 5.4 t ha−1 or 10.6%, compared to the control (Gulliver variety).
The influence of factor B (sowing date) on the yield of the Gulliver variety is as follows: sowing in the first ten days of July provided a smaller increase in the yield by 1.4 t ha−1 or 3.0%, compared to the control (second ten days of July) with an average yield of 46.0 t ha−1; however, sowing in the third ten days of July allowed obtaining the highest yield of 54.6 t ha−1, which is 7.2 t ha−1 or 15.2% more than the control; sowing in the first ten days of August also provided a higher yield (51.0 t ha−1) by 3.6 t ha−1 or 7.6%, compared to the control.
As experience showed, the Minowase variety responded to sowing dates similarly to the Gulliver variety. When sowing the Minowase variety in the first ten days of July, the yield was 48.0 t ha−1, which is 2.8 t ha−1 or 5.5% less than the control variant (second ten days of July). High yield (56.4–58.9 t ha−1) of the Minowase variety was achieved by sowing in the third ten-day period of July and the first ten-day period of August, which exceeded the control by 5.6–8.1 t ha−1 or 11.0–15.9%. An analysis of the interaction of factors A (variety) and B (sowing date) showed that, to achieve the maximum yield of 58.9 t ha−1, the best combination of these factors is sowing the Minowase variety in the third ten-day period of July.
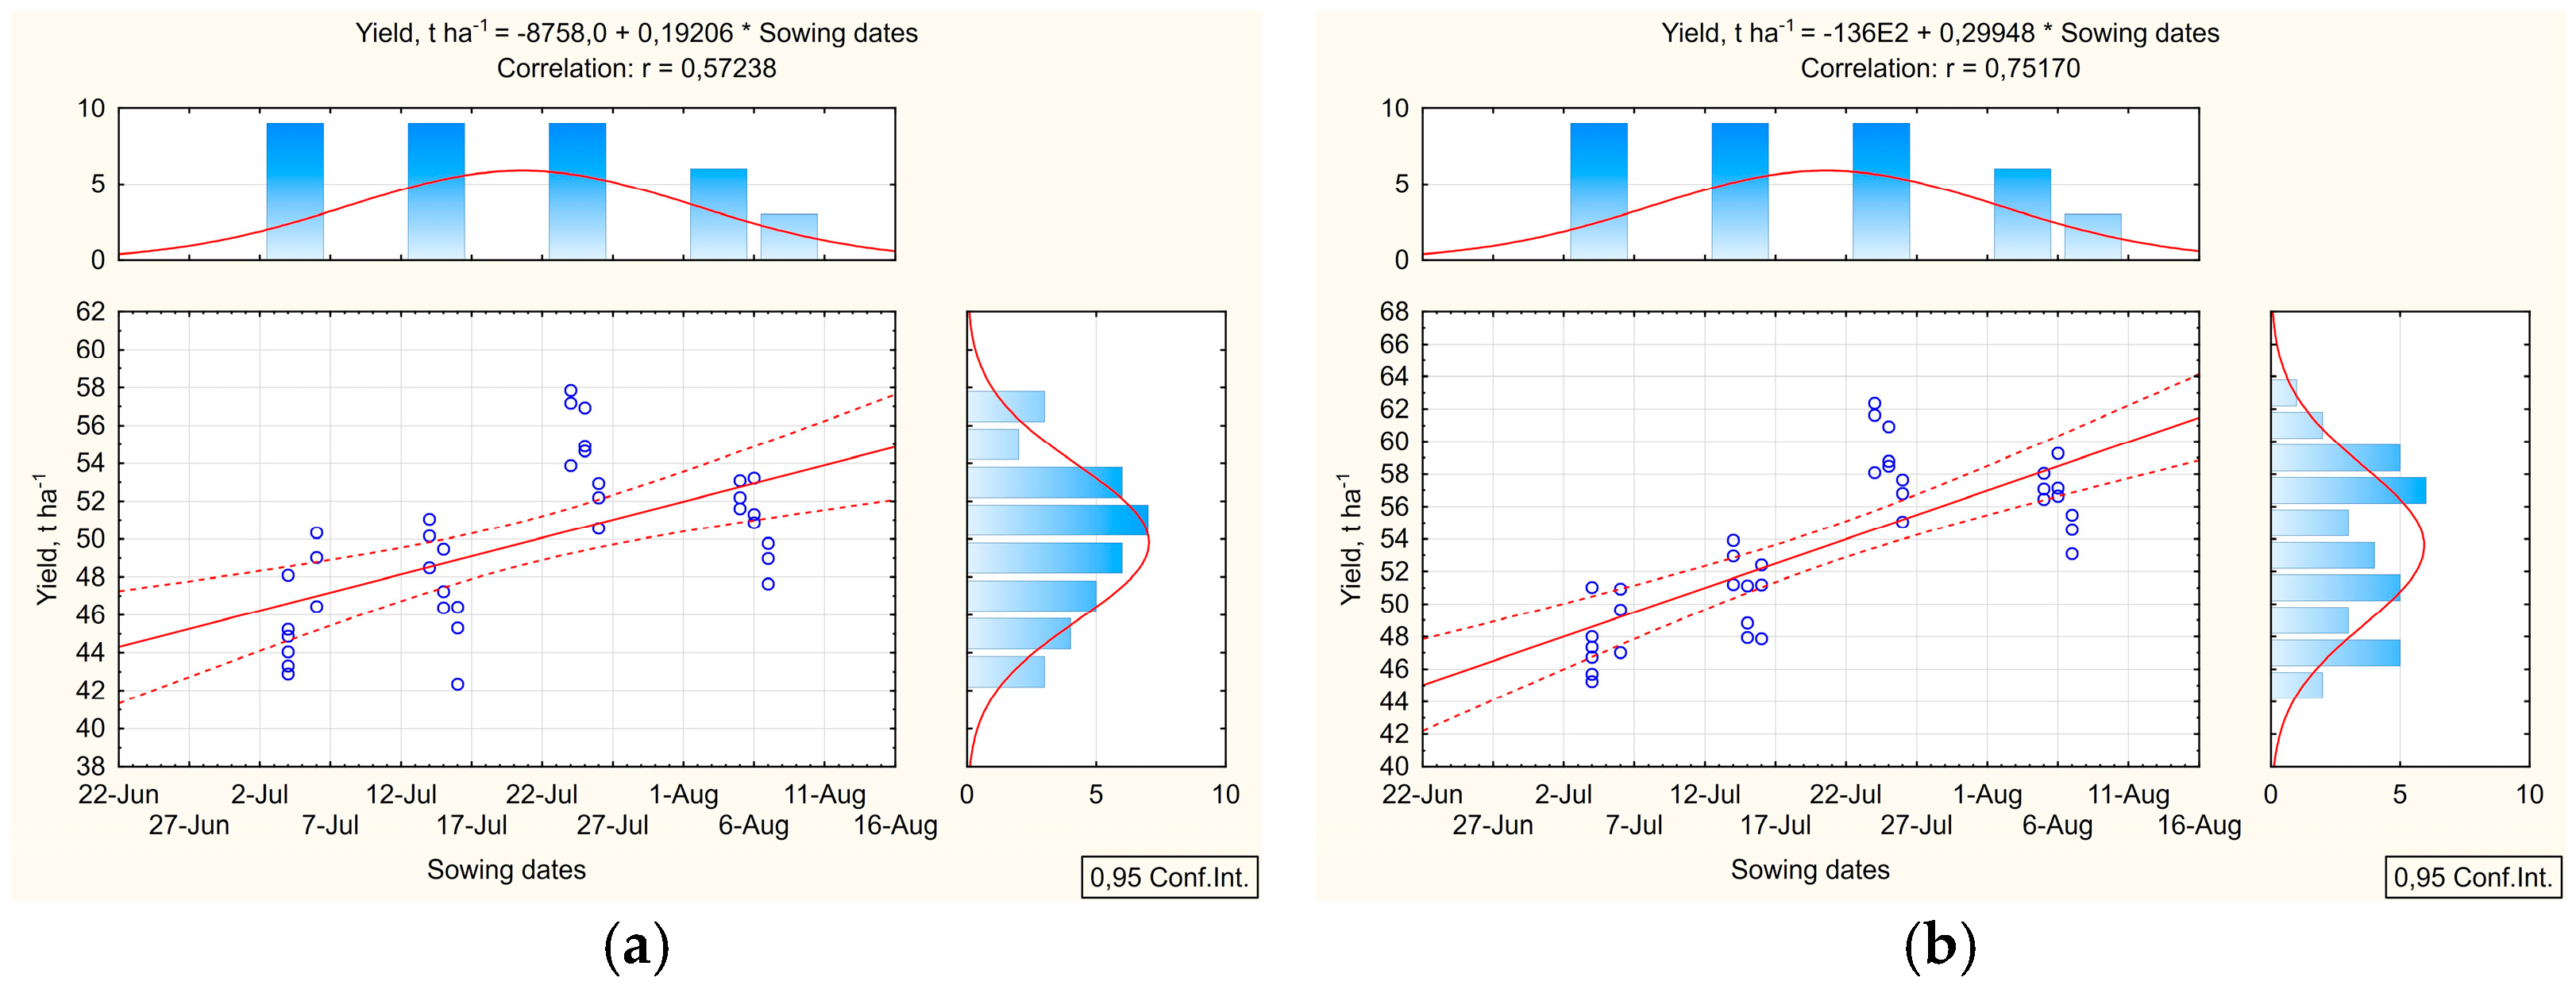
A direct correlation was found between daikon yield and sowing dates (r = 0.57; 0.75), indicating a moderate to strong relationship. The calculated regression coefficient shows that with a 10-day shift in the sowing date, the yield for the Gulliver variety changes by 1.92 t ha−1, and for the Minowase variety, by 2.99 t ha−1 (Figure 5).
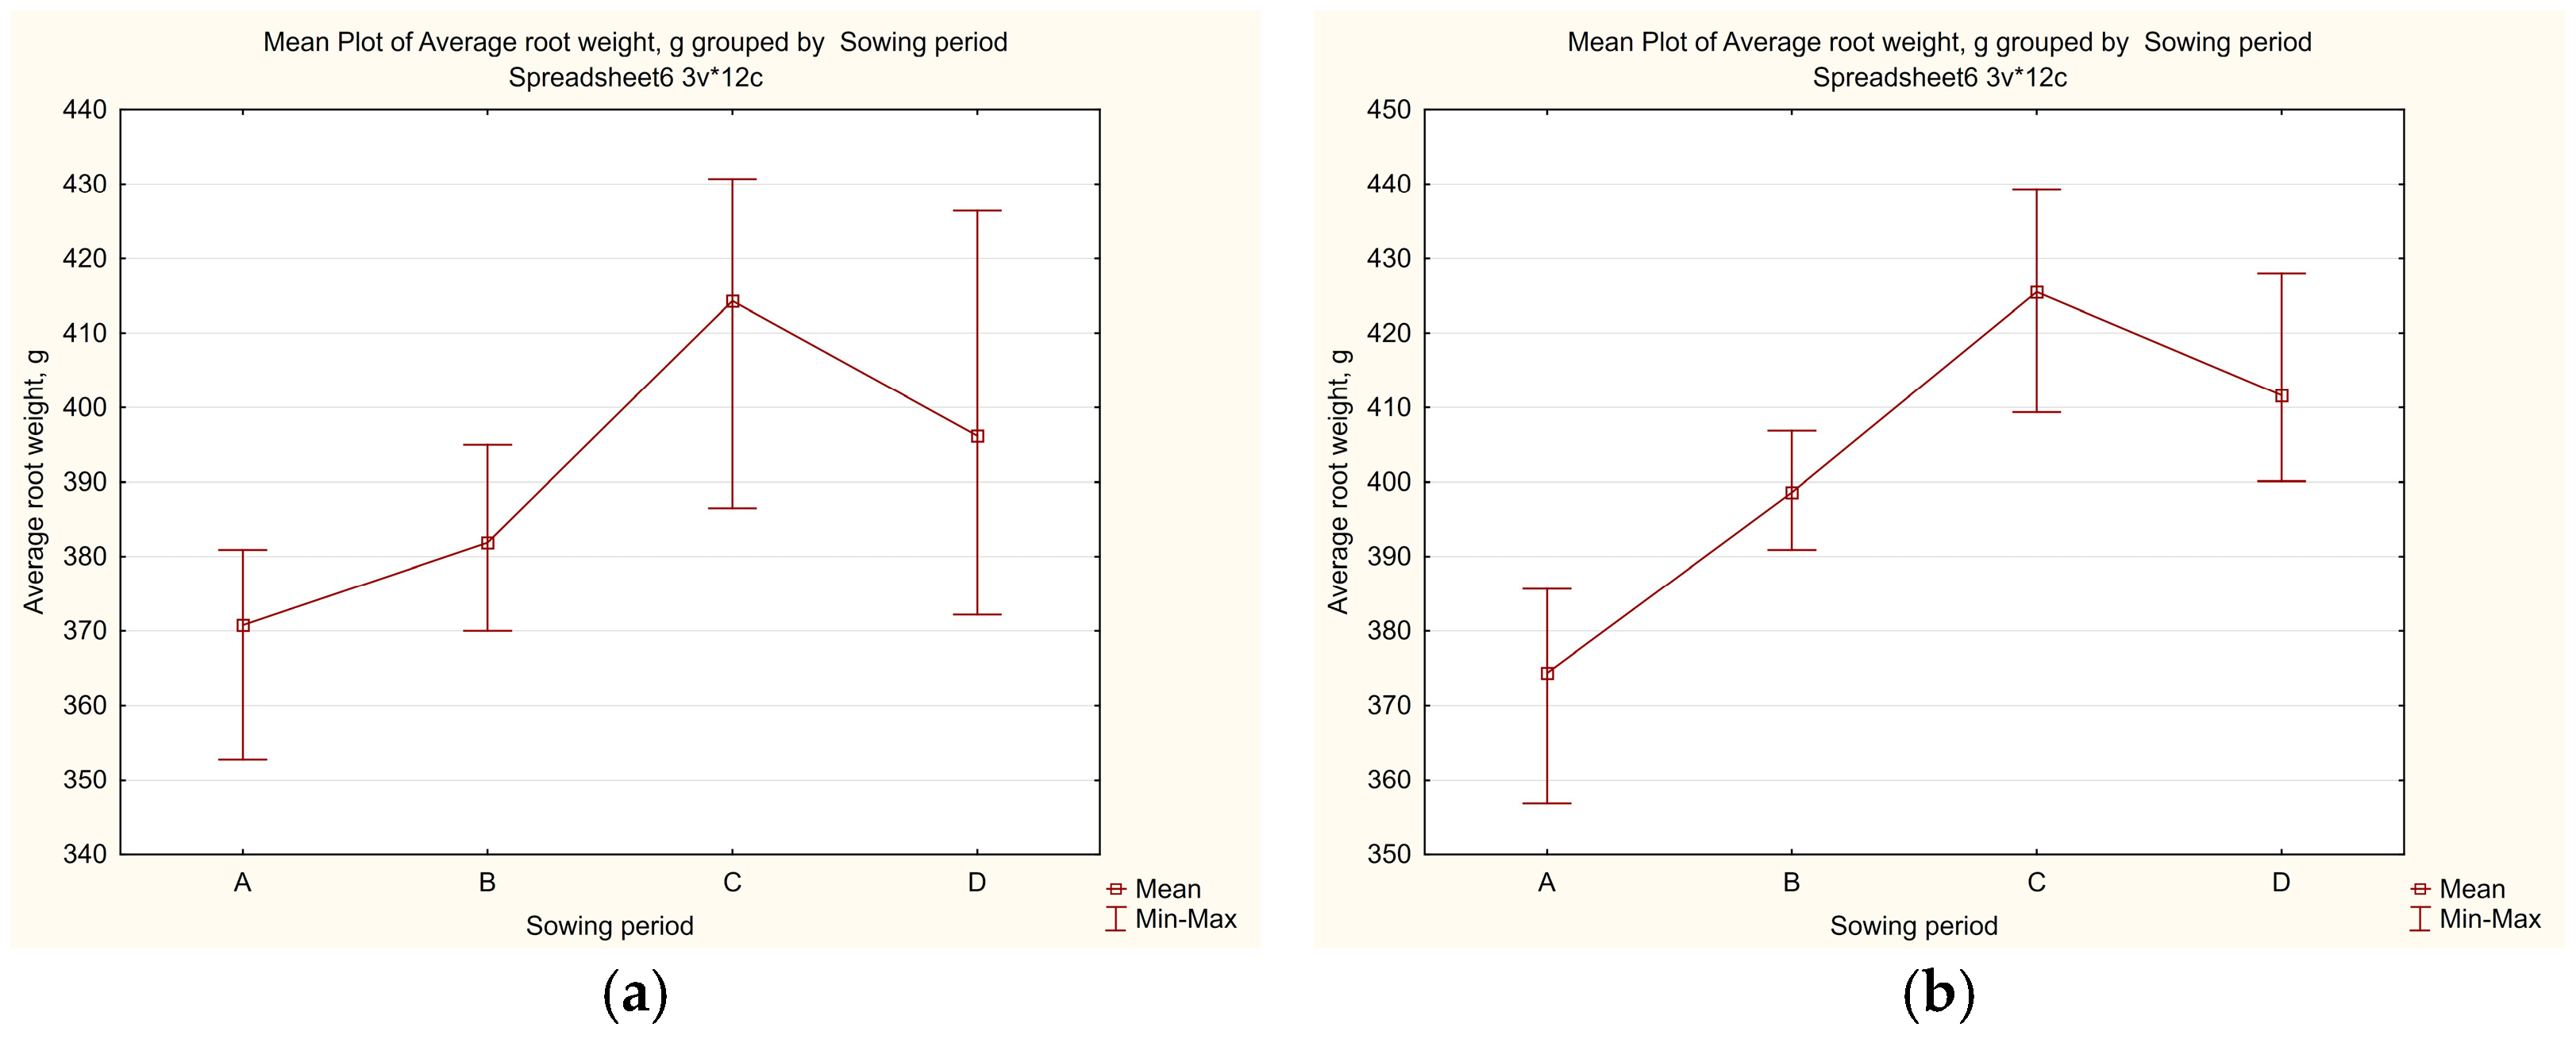
The obtained results showed a higher average root crop mass at all sowing dates for the Minowase variety compared to the Gulliver variety (Figure 6). When sowing in the first ten days of July, this indicator was at the control level, and the deviation relative to the control was only 3.0 g or 0.8%. A significant deviation in the average root crop mass (12.0–17.0 g or 2.9–4.5%) was ensured by sowing at a later date.
Both the earlier and the later sowing dates for daikon significantly affect the average mass of the root crop. Thus, for the Gulliver variety, the lowest average root crop mass of 371 g, which is 11.0 g or 2.9% less than the control, was achieved by sowing in the first ten days of July. The maximum average root crop mass, which reached 414 g, 32.0 g or 8.4% higher than the control (second ten-day period of July), was obtained when sowing in the third ten-day period of July. Further sowing in the first ten days of August led to a decrease in the average root crop mass to 396 g, but this figure was by 14.0 g or 3.7% higher than the figures for the control sowing period (second ten days of July).
The dependence of the average root crop mass for the Minowase variety on the sowing date also shows significant variations. The lowest value (374 g), which is 11.0 g or 2.9% less than in the control, was recorded when sowing in the first ten days of July. The highest value (426 g), which exceeded the control variant by 27.0 g or 6.8%, was obtained when sowing in the third ten-day period of July. Sowing in the first ten days of August also provided a larger root crop mass (412 g), which is 13.0 g or 3.3% more than the control.
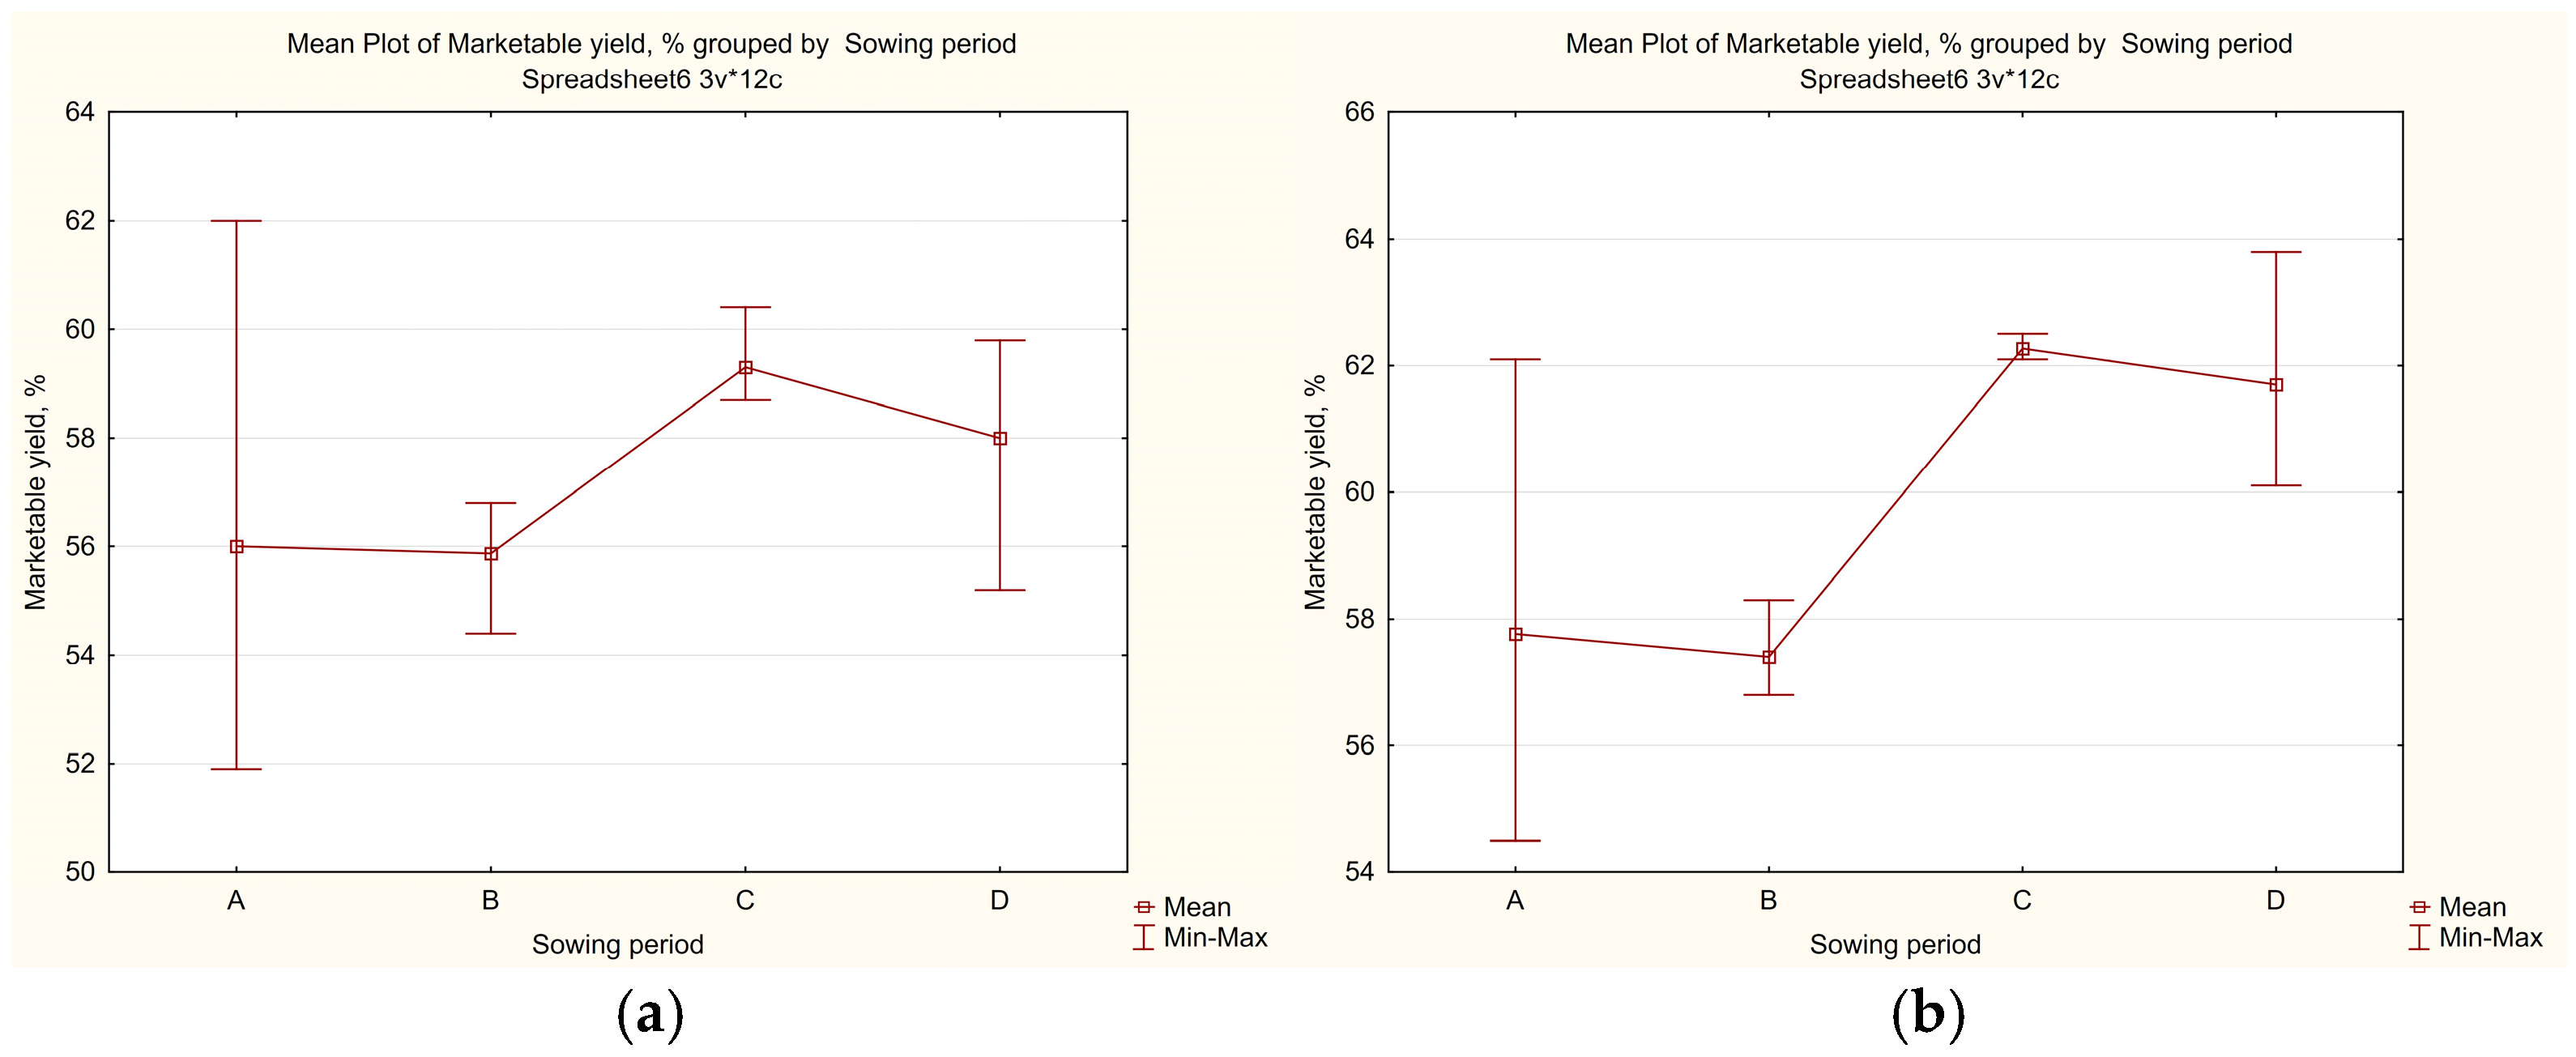
The results indicate that the interaction of varieties and the sowing dates was significant for the marketability of the root crops (Figure 7). Regardless of the sowing date, the Minowase variety demonstrated higher marketability of the root crops, compared to the Gulliver variety. The difference in marketability of the root crops between the investigated varieties was 1.5–3.7 (%).
For the Gulliver variety, the minimum marketability of the root crops (55.9%) was observed when sowing in the second ten-day period of July, while the maximum value (59.3%) was observed in the third ten-day period of July. High marketability of the root crops (58.0%) was ensured also by sowing in the first ten days of August. The marketability of the root crops, when sown in the first ten days of July, did not differ significantly from the control.
Analysis of the Minowase variety showed that the lowest marketability of the root crops (57.4%) was observed when sowing in the second ten days of July. However, the maximum value (62.3%) was achieved when sowing in the third ten-day period of July. It is important to note that sowing in the first ten days of August also ensured a high level of marketability (61.7%). Sowing in the first ten days of July ensured the marketability of root crops at the control level.
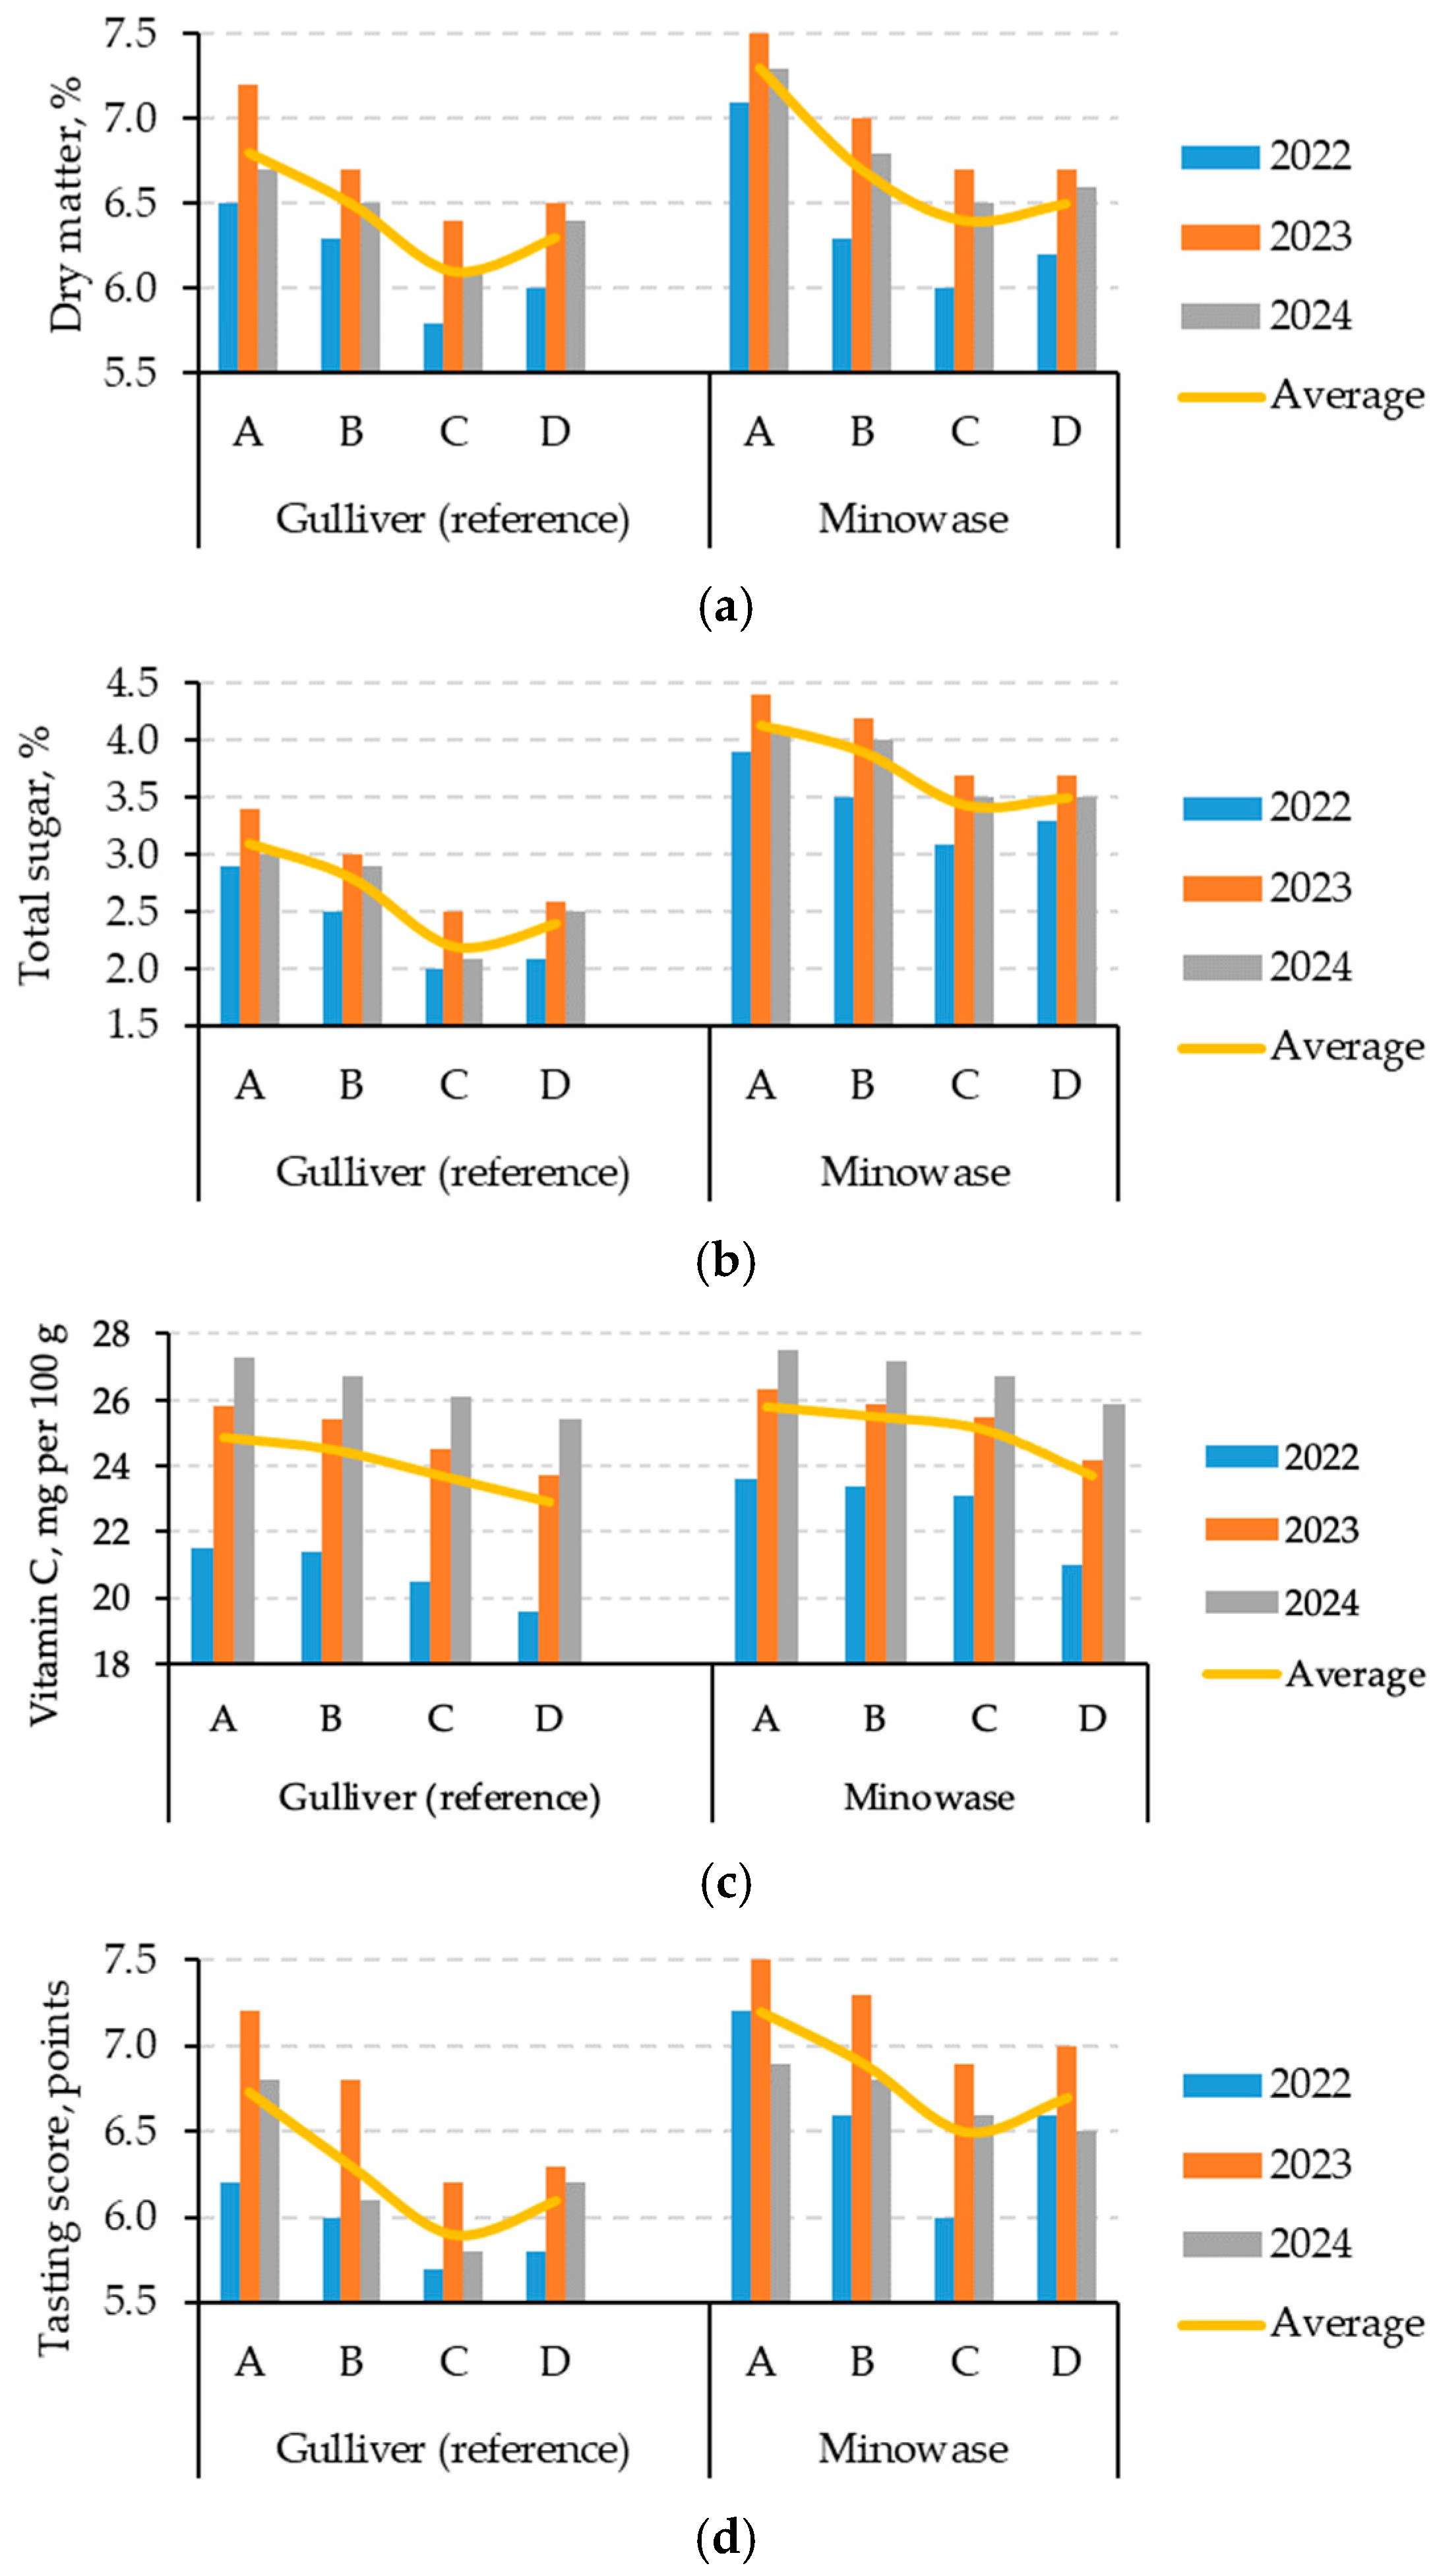
Among the varieties presented, the Minowase variety stands out due to its better biochemical composition (dry matter 6.4–7.3%, total sugar 3.4–4.1%, vitamin C 23.5–25.8 mg per 100 g) and higher tasting score (6.5–7.2 points).
Variations in the biochemical composition of the root crops were observed at different sowing dates. When the Gulliver variety was sown in the first ten days of July, the highest dry matter (6.8%), total sugar (3.1%), and vitamin C (24.9 mg per 100 g) contents were observed, which were 0.3%, 0.3%, and 0.4 mg per 100 g higher, respectively, than in the control (second ten days of July) (Figure 8). In the control variant (the second ten-day period of July) the root crops were characterized by a slight decrease in biochemical parameters (dry matter content 6.5%, total sugar 2.8%, vitamin C 24.5 mg per 100 g), compared to the earliest sowing date. With each subsequent sowing date the negative dynamics of biochemical parameters were noted. Compared with the control (second ten-day period of July), the dry matter content decreased by 0.2–0.4%, total sugar by 0.4–0.6%, and vitamin C by 0.8–1.6 mg per 100 g. Although sowing in the first ten-day period of August shows a slight improvement in the dry matter and total sugar content, compared with the third ten-day period of July, the general trend of decreasing the quality remains unchanged. The organoleptic analysis showed that the highest tasting scores (6.7 points) were received by the root crops of the Gulliver variety, grown when sown in the third ten-day period of July.
For the Minowase variety it is possible also to highlight the sowing option in the first ten-day period of July, which was characterized by a high content of dry matter (7.3%), total sugar (4.1%) and vitamin C (25.8 mg per 100 g). Notably, these figures surpassed the results of the control sowing date, with dry matter increasing by 0.6%, total sugar by 0.2%, and vitamin C by 0.3 mg per 100 g. However, further delaying the sowing until the first ten days of August triggered a sharp decline in these indicators. A similar trend was evident in the sensory evaluation: the early July sowing secured the peak score of 7.2 points, establishing the clear superiority of this sowing window for enhancing root crop quality.
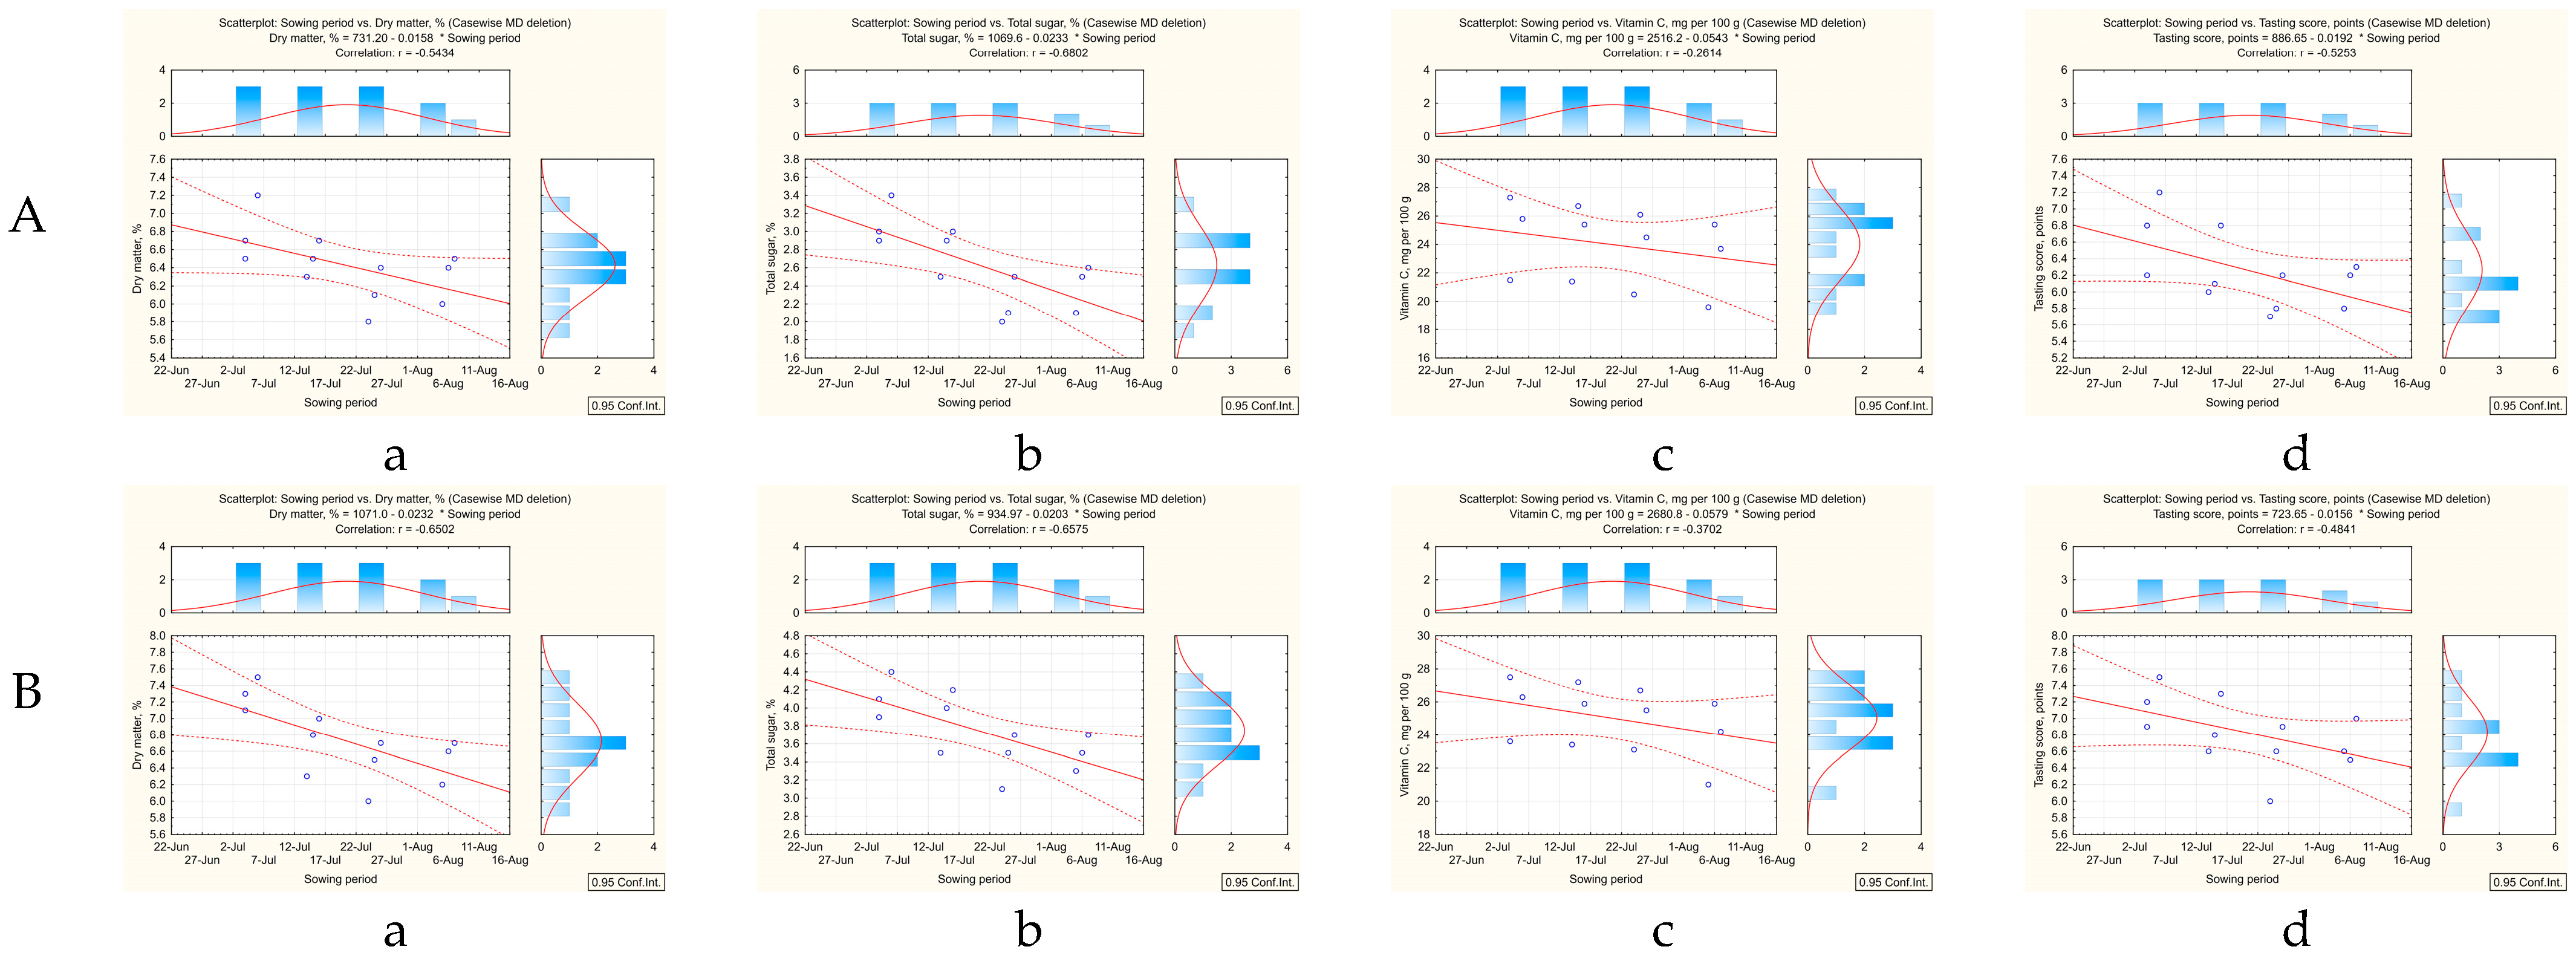
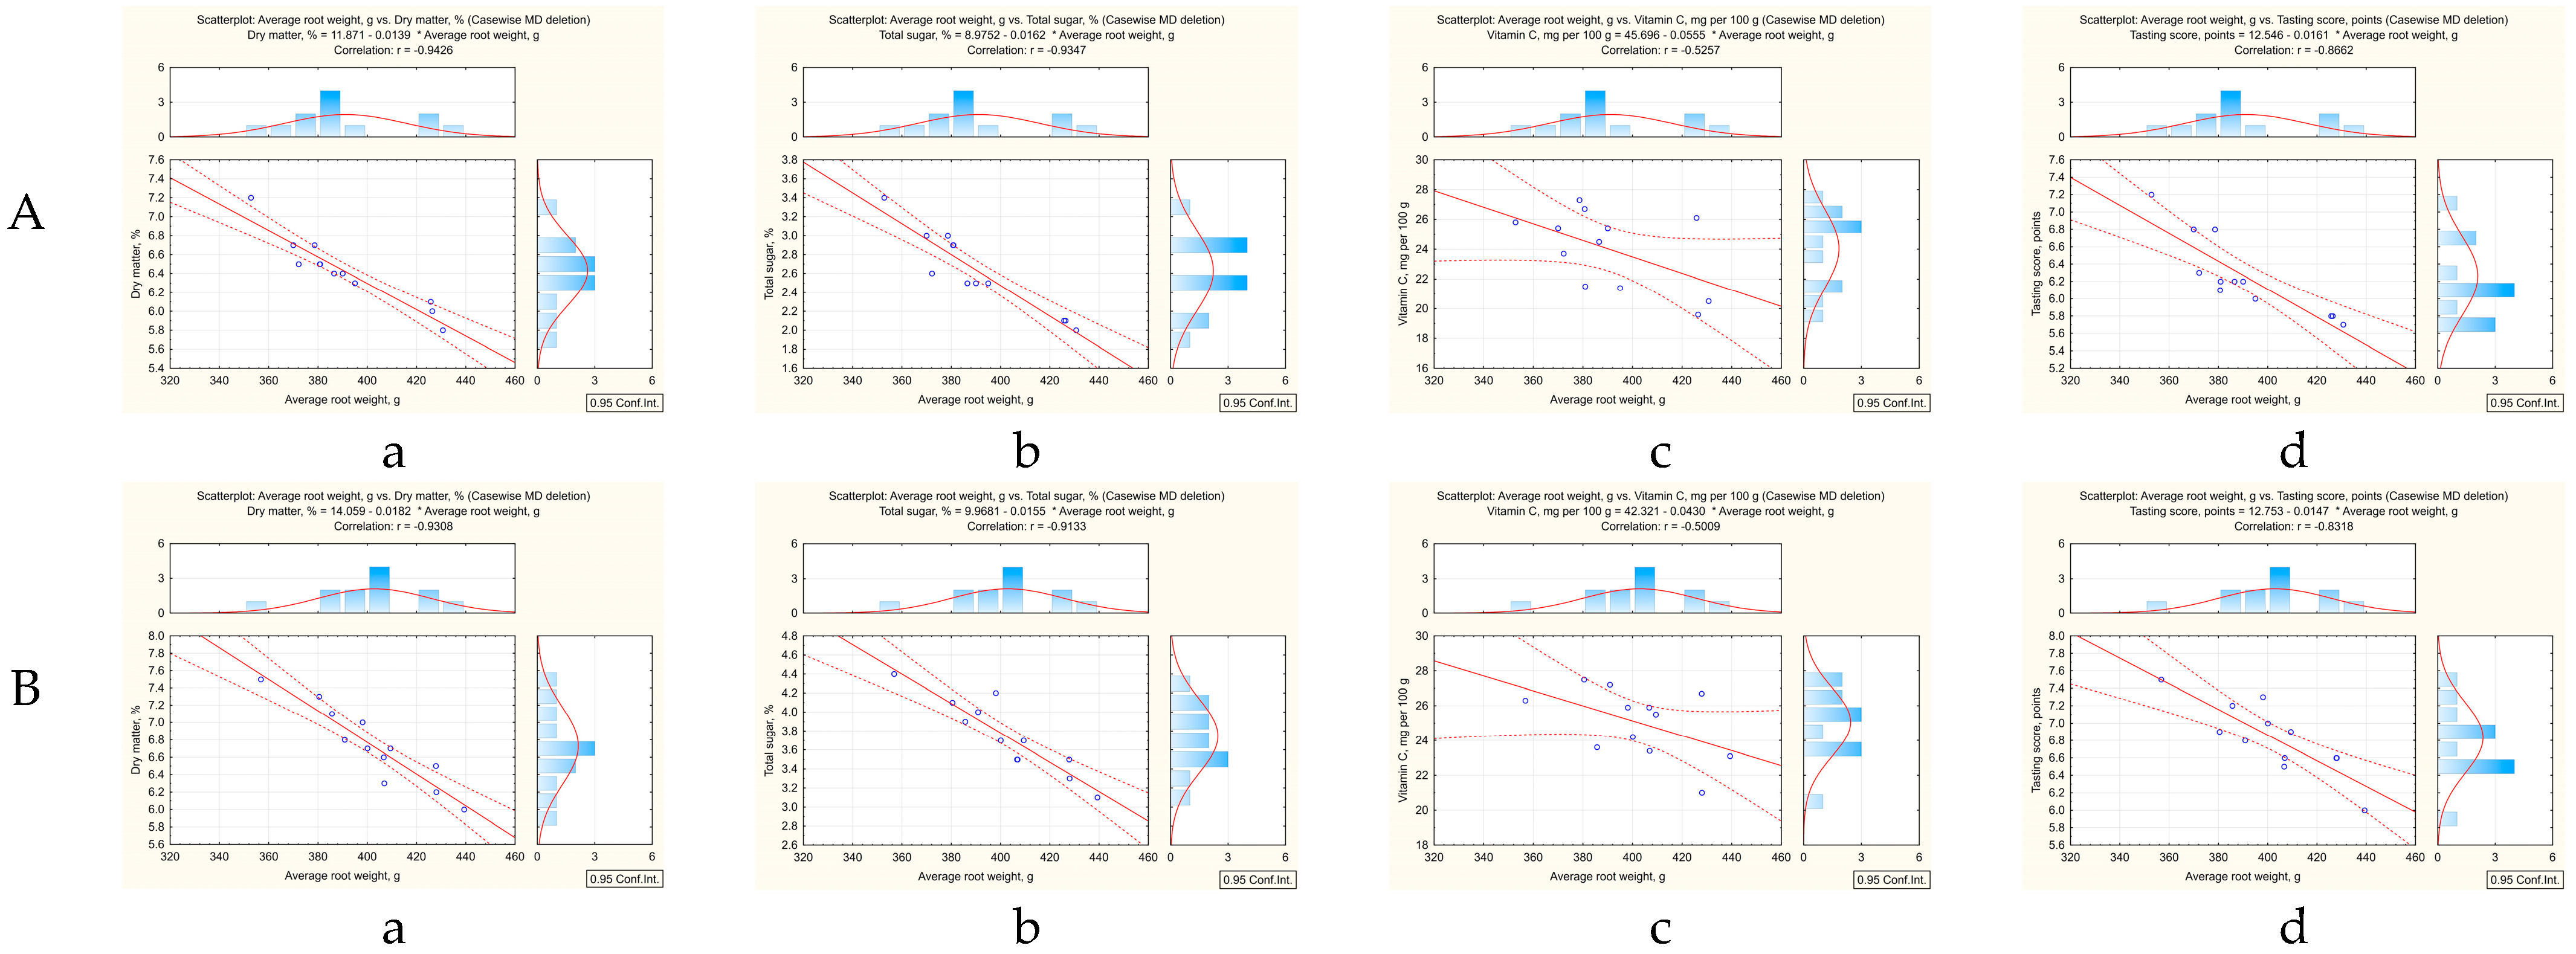
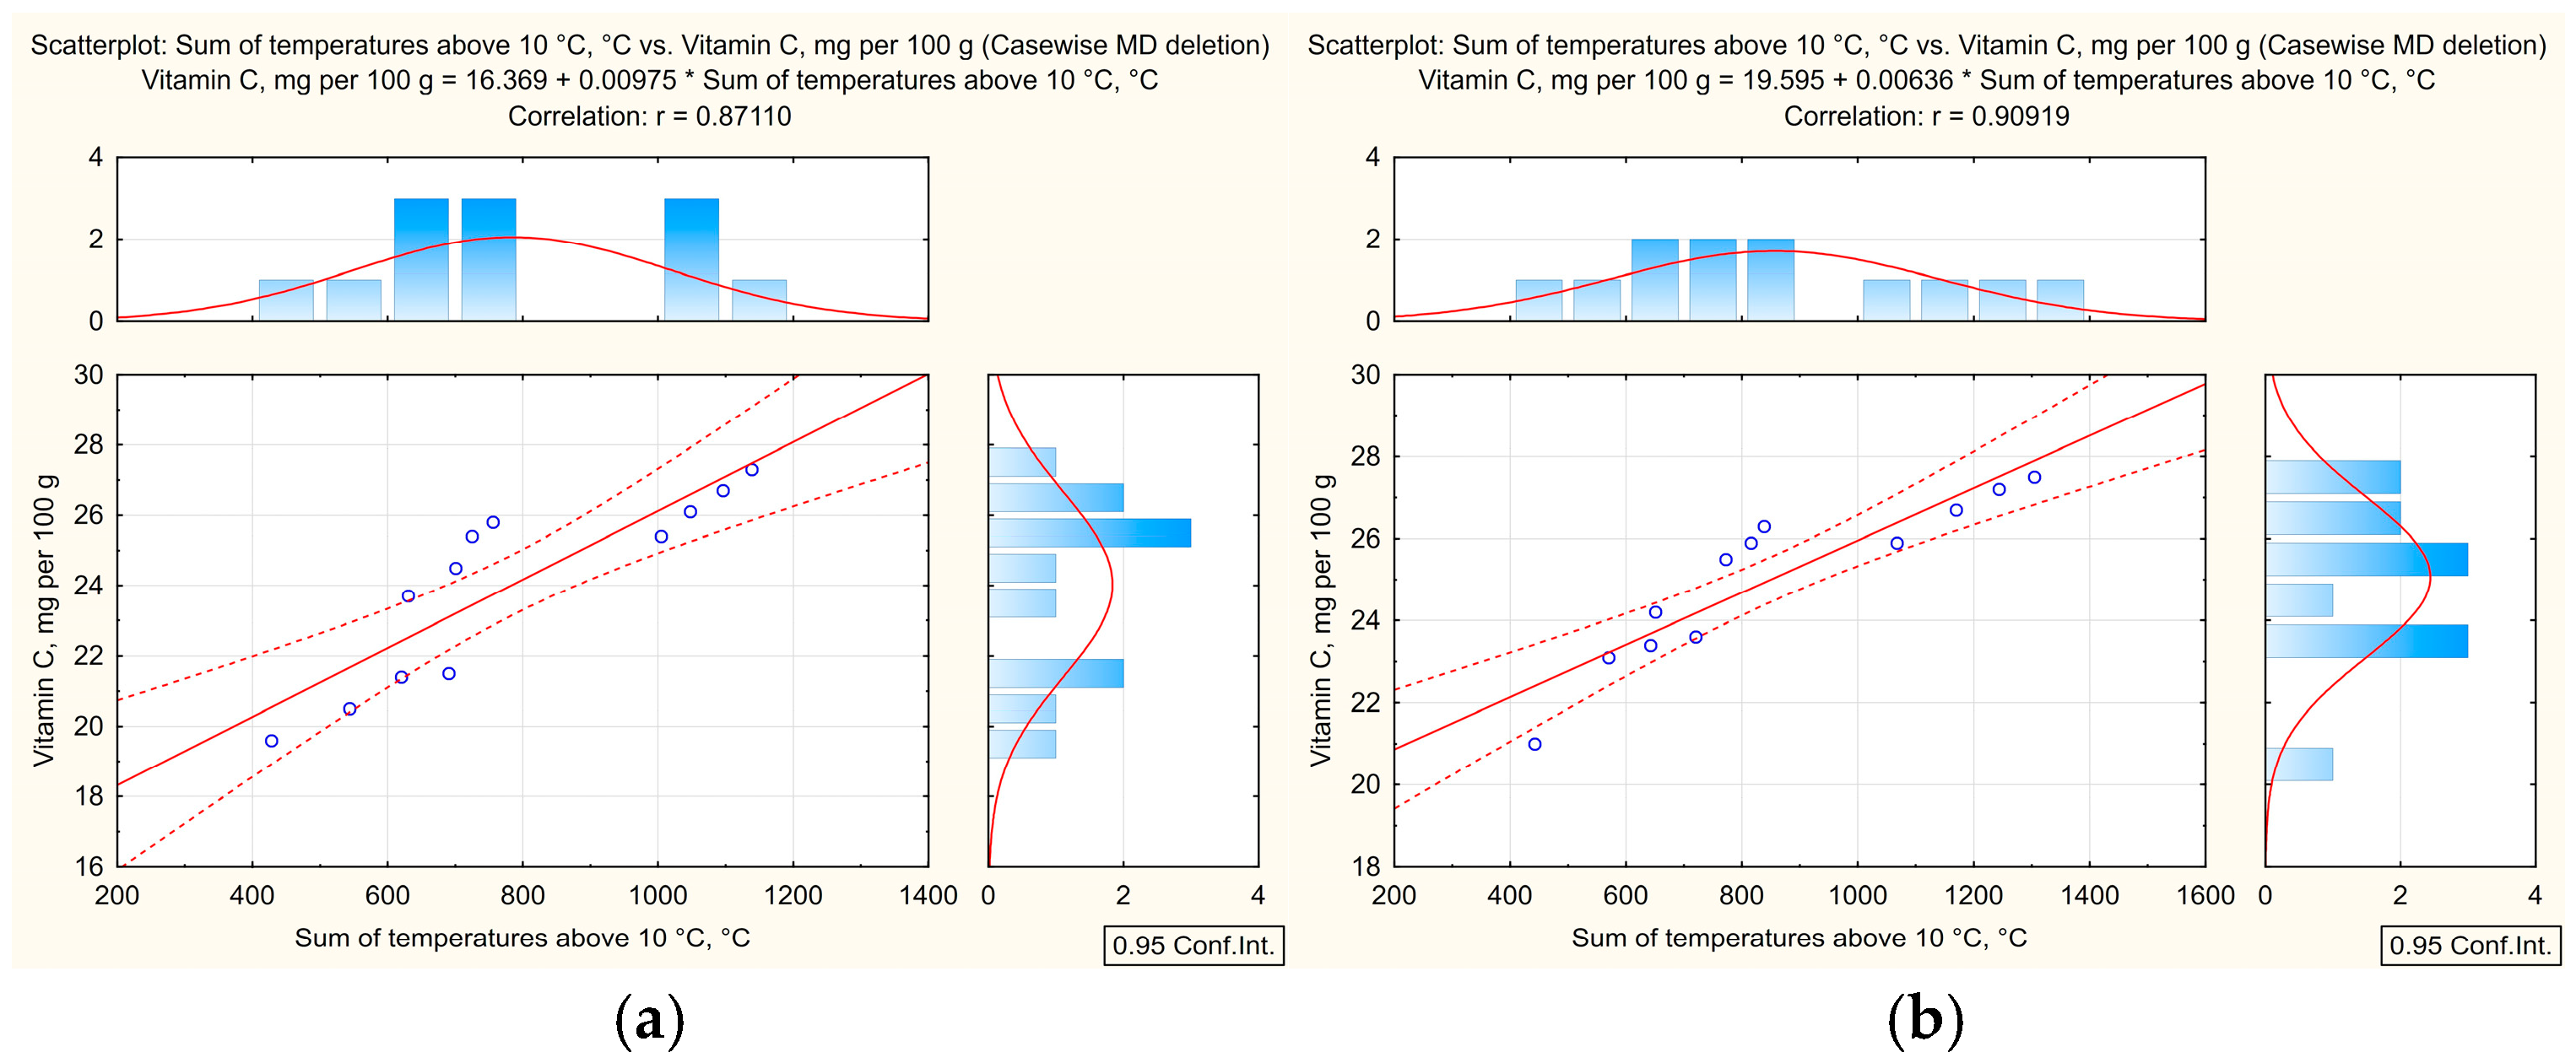
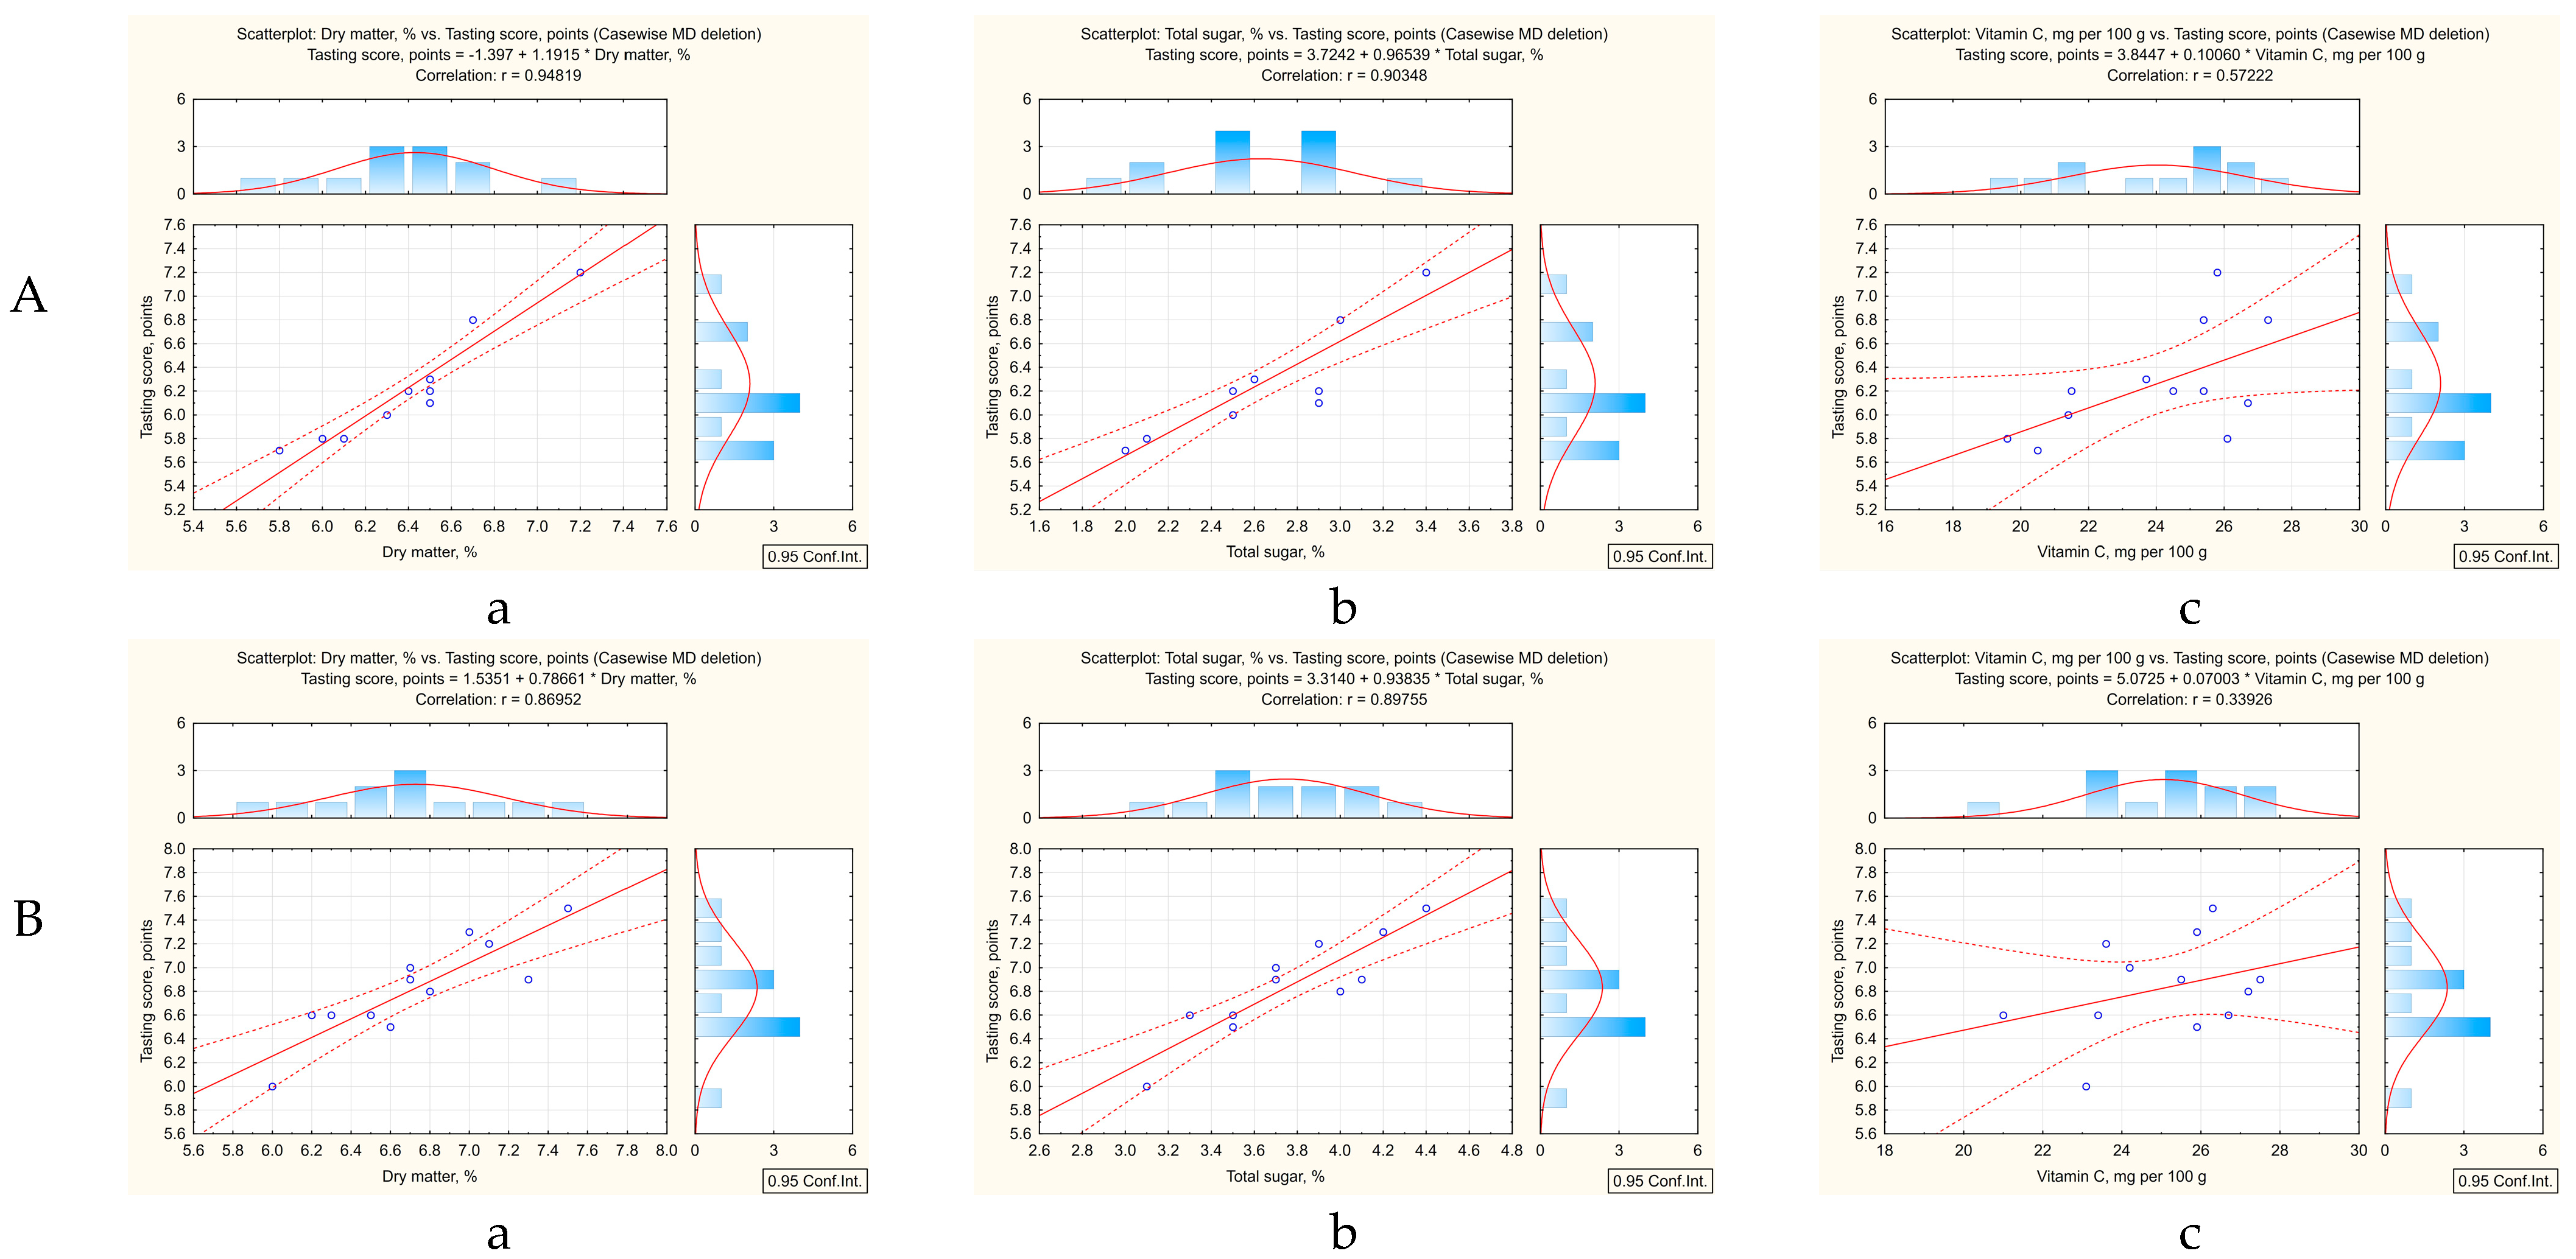
It has been established that the sowing dates have an inverse correlation with biochemical parameters and the tasting assessment. The strength of a correlation for the Gulliver variety was as follows: a strong correlation with total sugar (r = −0.68); a moderate correlation with dry matter (r = −0.54) and tasting score (r = −0.52); and a weak correlation with vitamin C (r = −0.26). For the Minowase variety the relationship was strong with dry matter (r = −0.65), total sugar (r = −0.66), vitamin C (r = −0.37) and tasting score (r = −0.48). There is an inverse relationship between the root crop mass and the biochemical indicators. The strength of relationships for the investigated varieties was as follows: a strong relationship with the content of the dry matter (r = −0.93; −0.94) and total sugar (r = −0.91; −0.93), and a medium relationship with vitamin C (r = −0.50; −0.53). A strong inverse correlation was also found between the tasting score and the average root crop mass (r = −0.83; −0.87). It should be noted that there is a strong direct relationship (r = 0.87; 0.91) between the vitamin C content and the total air temperature (more than 10 °C). At the same time, a strong linear correlation is observed between the tasting score and the dry matter content (r = 0.87; 0.95) and total sugar (r = 0.90; 0.90), while a moderate linear relationship was found with vitamin C (r = 0.34; 0.57) (Appendix B).
The regression analysis revealed that with a 10-day shift in the sowing date for the Gulliver variety (control), the dry matter content decreases by 0.16%, total sugar by 0.23%, vitamin C by 0.54 mg per 100 g, and the tasting score by 0.19 points (Figure 9). For the Minowase variety these indicators decreased by 0.23% (dry matter), 0.20% (total sugar), 0.58 mg per 100 g (vitamin C) and 0.16 points (tasting score), respectively.
Using the derived regression equations, it was found that, with an increase in the average root mass by 10 g, the dry matter content of daikon varieties decreased by 0.14% for the Gulliver variety and by 0.18% for the Minowase variety. The total sugar content decreased by 0.16% for the Minowase and Gulliver varieties. The vitamin C content decreases by 0.43 mg per 100 g in the Minowase variety and by 0.56 mg per 100 g in the Gulliver variety. The tasting score decreases by 0.15 points for the Minowase variety and by 0.16 points for the Gulliver variety (Figure 10).
At the same time it was found that an increase in the sum of the air temperatures (over 10 °C) for every 10 °C contributes to an increase in the vitamin C content by 0.06 in the Minowase variety and by 0.39 mg per 100 g in the Gulliver variety (Figure 11).
The results of the regression analysis indicate that an increase in the biochemical indicators of the daikon has a positive effect on its taste qualities (Figure 12). Thus, with an increase in the dry matter by 1%, the total sugar by 1% and vitamin C by 1 mg per 100 g, the tasting score of the Gulliver variety increases by 1.19 points, 0.97 points and 0.10 points, respectively, and for the Minowase variety, increases of 0.79 points, 0.94 points and 0.07 points, respectively.

4. Discussion

Daikon productivity and quality are primarily governed by the interaction between genetics and thermal regimes. While the optimal temperature for germination ranges from 20 to 30 °C [24], our findings confirm that the intensive growth phase requires cooler conditions (10–15.5 °C) to ensure high root quality [52]. Synchronizing sowing dates is essential to bypass mid-summer temperature peaks, which trigger physiological disorders such as branching, spongy pith, and internal browning [33].
We identified that sowing in the third ten-day period of July serves as an effective climate adaptation strategy. This timing aligns the critical root formation stage with the favorable temperatures and optimal diurnal fluctuations of September [53]. Conversely, early July sowing exposes plants to heat stress (20.0–26.6 °C) in August, forcing the redirection of carbohydrates from root storage to respiratory metabolism [54].
The transition to the generative phase is a major driver of yield loss. As a long-day plant, photoperiods exceeding 14 h stimulate flowering [55], whereas summer sowing under shortening days promotes biomass accumulation in the roots [26]. Premature bolting leads to tissue lignification and reduced root mass [56], a trait negatively correlated with total yield [57]. Understanding the physiological drivers of such changes necessitates considering the genetic factors that inhibit generative development [58]. While a direct analysis of the RsFLC2 gene in the studied cultivars was beyond the scope of this work, existing literature confirms its pivotal role as a biological safeguard. This genetic mechanism likely accounts for the reduced temperature sensitivity and prevents premature bolting in late-maturing forms [59].
The synergy between sowing date and cultivar selection is the ultimate determinant of productivity [60]. In our study, the Minowase variety achieved a maximum yield of 58.9 t ha−1, significantly outperforming the Gulliver (54.6 t ha−1). This regional success mirrors global trends, where optimal sowing windows vary from mid-October in India [60] and Iraq [61] to spring months in Nepal [57], emphasizing that varietal selection must be precisely synchronized with local climate dynamics [62,63,64].
Environmental factors profoundly influence the biochemical profile of daikon. We observed a strong positive correlation between carbohydrates and phenolic compounds, suggesting that sugars (primarily sucrose and glucose) serve as energy precursors for secondary metabolite synthesis [65,66]. While light intensity impacts ascorbic acid levels [67], our varieties showed lower Vitamin C values (22.9–25.8 mg per 100 g) compared to previous reports [68], with a direct correlation to the sum of active air temperatures.
From a commercial standpoint, Minowase maintained superior organoleptic properties compared to Gulliver [69]. To mitigate climatic risks, integrating crop monitoring—such as leaf area index analysis and linear regression yield models—allows for high-precision management and sustainable production [70,71,72].
Furthermore, the integration of healthy diet perspectives [73] and the selection of varieties suitable for long-term storage [74,75] can enhance the economic value of root crops. Advanced breeding strategies aimed at higher yield and better quality [76], combined with the optimized sowing dates identified in this study, provide a robust framework for the sustainable production of daikon in an era of changing climatic conditions.

5. Conclusions

This study confirms that optimizing sowing dates is a key adaptive management tool for stabilizing daikon production under increasing temperatures and growing hydrothermal variability in medium-podzolic, light loamy soil conditions. Shifting sowing dates from early July (first to second ten-day period) to late July and early August improved the synchronization of critical growth stages with cooler and more favorable moisture conditions. This shift ensured a consistent yield advantage of approximately 7.6–15.9% compared to earlier sowing dates. When sown during the third ten-day period of July to the first ten-day period of August—a period characterized by a more balanced hydrothermal regime—average yields ranged from 51.0 to 58.9 t ha−1. Moisture availability during root crop formation remained the primary factor for yield stability. A strong positive correlation between yield and precipitation (r = 0.56–0.76) emphasizes that water supply is the main limiting factor under current climate change, while accumulated heat played a secondary role. These findings highlight that adaptive scheduling, rather than resource intensification, forms the basis for sustainable crop formation. Variety selection further enhanced adaptive capacity: the Minowase variety demonstrated a consistent yield advantage of 4.3–10.6%, higher marketable yield (by 1.8–3.7%), and superior biochemical quality, indicating high ecological plasticity under a changing climate. Thus, the combination of climate-adjusted sowing dates and adaptive genotypes represents an effective path toward climate-resilient vegetable production. Future research should focus on expanding agro-climatic zones, incorporating a broader genetic diversity of daikon varieties, and integrating sowing schedules with moisture management practices and projected climate scenarios to enhance the resilience of daikon production.

Author Contributions

Conceptualization, I.F., A.R., A.A. and I.B.; methodology, I.F., D.V., I.B. and O.Z.; software, I.F.; validation, O.K., M.R. and O.S.; formal analysis, O.K., M.R. and I.H.; investigation, I.F.; I.B. and I.H.; resources, O.K. and I.H.; data curation, A.A., D.V. and O.S.; writing—original draft preparation, I.F., O.K., A.A., D.V. and A.R.; writing—review and editing, A.A., I.B. and A.R.; visualization, O.S., O.Z., I.F. and O.K.; supervision, A.A.; project administration, A.A. and I.F.; funding acquisition, A.R. All authors have read and agreed to the published version of the manuscript.

Funding

This research was funded by the scientific project “Develop innovative technologies for growing low-spreading vegetable crops” (state registration number: 0122U001637), which was supported by the Ministry of Education and Science of Ukraine.

Data Availability Statement

The original contributions presented in this study are included in the article. Future inquiries can be directed to the corresponding author.

Acknowledgments

During the preparation of this manuscript, the authors used the large language model Gemini 2.5 Flash (developed by Google) for text editing (grammar, structure, spelling, punctuation, and formatting). The authors have reviewed and edited the output and take full responsibility for the content of this publication.

Conflicts of Interest

The authors declare no conflicts of interest.

Appendix A

Table A1. Results of the variance analysis of the yield of the daikon varieties, using Tukey’s HSD test, depending on sowing dates (2022–2024).
Cell No.YearVarietySowing DatesYield, t ha−1
Mean
1234567891011
172024GulliverA43.7*
102023GulliverB44.7**
12022GulliverA45.8***
212024MinowaseA46.1***
182024GulliverB47.7****
52022MinowaseA48.6****
92023GulliverA48.6****
122023GulliverD48.8 ***
132023MinowaseA49.2 ***
222024MinowaseB49.3 ***
22022GulliverB49.9 ***
142023MinowaseB50.5 ****
202024GulliverD51.8 ****
112023GulliverC51.9 ****
42022GulliverD52.3 *****
62022MinowaseB52.7 ******
162023MinowaseD54.4 ******
192024GulliverC55.5 *****
32022GulliverC56.3 *****
152023MinowaseC56.5 *****
82022MinowaseD57.2 ****
242024MinowaseD57.7 ***
232024MinowaseC59.4 **
72022MinowaseC60.7 *
Notes: Tukey HSD test; variable Yield, t ha−1; Homogenous Groups, alpha = 0.05000; Error: Between MS = 5.5816, df = 48.000. Treatments sharing at least one common column of asterisks (*) are considered homogeneous, indicating no statistically significant difference between them. Conversely, the complete absence of common columns with asterisks between treatments indicates a significant (statistically proven) difference at the alpha = 0.05 level.

Appendix B

Table A2. A correlation matrix of biochemical indicators in the daikon varieties (2022–2024).
Variable Dry Matter, %Total Sugar, %Vitamin C, mg per 100 gTasting Score, PointsAverage Root Weight, gSum of Temperatures Above 10 °C, °CPrecipitation Amount, mmSowing Period
Gulliver
1. Dry matter, %n
Pearson’s r
p-value
Covariance
2. Total sugar, %n12
Pearson’s r0.961 ***
p-value<0.001
Covariance0.150
3. Vitamin C, mg per 100 gn1212
Pearson’s r0.606 *0.545
p-value0.0370.067
Covariance0.5760.609
4. Tasting score, pointsn121212
Pearson’s r0.948 ***0.903 ***0.572
p-value<0.001<0.0010.052
Covariance0.1580.1780.683
5. Average root weight, gn12121212
Pearson’s r−0.942 ***−0.934 ***−0.521−0.866 ***
p-value<0.001<0.0010.082<0.001
Covariance−8.461−9.861−33.46−9.767
6. Sum of temperatures above 10 °C, °Cn1212121212
Pearson’s r0.3180.3230.871 ***0.251−0.231
p-value0.3140.306<0.0010.4320.470
Covariance27.0032.24528.826.74−1325
7. Precipitation amount, mmn121212121212
Pearson’s r0.1980.262−0.3110.230−0.033−0.370
p-value0.5380.4100.3250.4720.9180.237
Covariance4.4006.864−49.426.424−50.06−5251
8. Sowing periodn12121212121212
Pearson’s r−0.543−0.680 *−0.261−0.5250.444−0.279−0.473
p-value0.0680.0150.4120.0790.1490.3800.120
Covariance−2.484−3.657−8.542−3.017136.9−814.7−361.9
Minowase
1. Dry matter, %n
Pearson’s r
p-value
Covariance
2. Total sugar, %n12
Pearson’s r0.948 ***
p-value<0.001
Covariance0.164
3. Vitamin C, mg per 100 gn1212
Pearson’s r0.622 *0.631 *
p-value0.0310.028
Covariance0.5460.479
4. Tasting score, pointsn121212
Pearson’s r0.870 ***0.898 ***0.339
p-value<0.001<0.0010.281
Covariance0.1580.1410.269
5. Average root weight, gn12121212
Pearson’s r−0.931 ***−0.914 ***−0.500−0.834 ***
p-value<0.001<0.0010.098<0.001
Covariance−9.461−8.045−22.28−7.670
6. Sum of temperatures above 10 °C, °Cn1212121212
Pearson’s r0.4620.4290.909 ***0.110−0.341
p-value0.1310.164<0.0010.7330.278
Covariance57.9146.58499.712.49−2173
7. Precipitation amount, mmn121212121212
Pearson’s r0.1100.104−0.3270.074−0.287−0.343
p-value0.7340.7480.3000.8190.3650.274
Covariance2.7862.280−36.371.705−370.6−5464
8. Sowing periodn12121212121212
Pearson’s r−0.650 *−0.657 *−0.370−0.4840.653 *−0.311−0.424
p-value0.0220.0200.2360.1110.0210.3250.170
Covariance−3.648−3.192−9.102−2.457185.9−1093−301.7
Note: * p < 0.05, *** p < 0.001.

References

  1. Kalenska, S. Food security and innovative solutions in crop production. Plant Soil Sci. 2022, 13, 14–26. [Google Scholar] [CrossRef]
  2. Vermeulen, S.J.; Dinesh, D.; Howden, S.M.; Cramer, L.; Thornton, P.K. Transformation in practice: A review of empirical cases of transformational adaptation in agriculture under climate change. Front. Sustain. Food Syst. 2018, 2, 65. [Google Scholar] [CrossRef]
  3. Vasylieva, N.; Harvey, J. The effect of urbanization on food security and agricultural sustainability. Econ. Sociol. 2021, 14, 76–88. [Google Scholar] [CrossRef]
  4. Wahab, S.; Muzammil, K.; Nasir, N.; Khan, M.S.; Ahmad, M.F.; Khalid, M.; Ahmad, W.; Dawria, A.; Reddy, L.K.V.; Busayli, A.M. Advancement and new trends in analysis of pesticide residues in food: A comprehensive review. Plants 2022, 11, 1106. [Google Scholar] [CrossRef]
  5. Murdad, R.; Muhiddin, M.; Osman, W.H.; Tajidin, N.E.; Haida, Z.; Awang, A.; Jalloh, M.B. Ensuring urban food security in Malaysia during the COVID-19 pandemic–Is urban farming the answer? A review. Sustainability 2022, 14, 4155. [Google Scholar] [CrossRef]
  6. Aboltins, A.; Rucins, A.; Bobos, I.; Fedosiy, I.; Komar, O.; Zavadska, O.; Sych, Z.; Havrys, I.; Retman, M.; Zavgorodniy, V. Evaluation of Productivity and Morphological Variability of Asparagus Cowpea (Vigna unguiculata (L.) Walp. subsp. sesquipedalis (L.) Verdc.) Cultivars Intended for Vegetable Production . Agronomy 2024, 14, 2906. [Google Scholar] [CrossRef]
  7. Bobos, I.; Komar, O.; Fedosiy, I.; Havrys, I.; Retman, M. Research on the impact of planting schemes on the trait variability of Vigna varieties (Vigna unguiculata (L.) Walp. subsp. sesquipedalis (L.) Verdc.). Sci. Horiz. 2024, 27, 54–63. [Google Scholar] [CrossRef]
  8. Rajasree, V.; Pugalendhi, L. Breeding vegetables for nutritional security. In Veganism—A Fashion Trend or Food as a Medicine; IntechOpen: London, UK, 2021. [Google Scholar] [CrossRef]
  9. Kaur Dhillon, H.; Singh, H.; Pathak, M.; Singh Dhillon, T. Vegetables: Potential role for nutritional security. J. Plant Nutr. 2024, 47, 3298–3315. [Google Scholar] [CrossRef]
  10. Bashir, R.; Tabassum, S.; Rashid, A.; Rehman, S.; Adnan, A.; Ghaffar, R. Bioactive Components of Root Vegetables; IntechOpen: London, UK, 2022. [Google Scholar] [CrossRef]
  11. Fedosiy, I.; Bobos, I.; Zavadska, O.; Komar, O.; Tonkha, O.; Furdyha, M.; Polishchuk, S.; Arak, M.; Olt, J. Research into properties of blue melilot and fenugreek cultivated using different sowing times. Agron. Res. 2022, 20, 103–123. [Google Scholar] [CrossRef]
  12. FAO. Sustainable Crop Production and Climate Resilience: Guidelines for Adaptation; Food and Agriculture Organization of the United Nations: Rome, Italy, 2022. [Google Scholar]
  13. IPCC. Climate Change and Land: Summary for Policymakers; Intergovernmental Panel on Climate Change: Geneva, Switzerland, 2023. [Google Scholar]
  14. Qiao, S.; Harrison, S.P.; Prentice, I.C.; Wang, H. Optimality-based modelling of wheat sowing dates globally. Agric. Syst. 2023, 206, 103608. [Google Scholar] [CrossRef]
  15. Jacobs, A.A. Plant Guide for Oilseed Radish (Raphanus sativus L.); USDA-Natural Resources Conservation Service: Washington, DC, USA, 2012.
  16. Guo, D.; Chen, C.; Li, X.; Wang, R.; Ding, Z.; Ma, W.; Wang, X.; Li, C.; Zhao, M.; Li, M.; et al. Adjusting sowing date improves the photosynthetic capacity and grain yield by optimizing temperature condition around flowering of summer maize in the North China Plain. Front. Plant Sci. 2022, 13, 934618. [Google Scholar] [CrossRef] [PubMed]
  17. Patra, S.; Rai, S.; Chakraborty, D.; Sangma, R.H.; Majumder, S.; Kuotsu, K.; Chakraborty, M.; Baiswar, P.; Singh, B.K.; Roy, A.; et al. Impact of Weather Variables on Radish Insect Pests in the Eastern Himalayas and Organic Management Strategies. Sustainability 2024, 16, 2946. [Google Scholar] [CrossRef]
  18. Chutimanukul, P.; Piew-ondee, P.; Dangsamer, T.; Thongtip, A.; Janta, S.; Wanichananan, P.; Thepsilvisut, O.; Ehara, H.; Chutimanukul, P. Effects of Light Spectra on Growth, physiological responses, and antioxidant capacity in five Radish varieties in an indoor vertical farming system. Horticulturae 2024, 10, 1059. [Google Scholar] [CrossRef]
  19. Henschel, J.M.; de Azevedo Soares, V.; Figueiredo, M.C.; Dos Santos, S.K.; Dias, T.J.; Batista, D.S. Radish (Raphanus sativus L.) growth and gas exchange responses to exogenous ascorbic acid and irrigation levels. Vegetos 2023, 36, 566–574. [Google Scholar] [CrossRef]
  20. Acevedo, A.F.G.; da Silva Marques, I.C.; Dellabiglia, W.J.; Ferraz, A.K.L.; Basílio, L.S.P.; Broetto, F. Silicon as a mitigator of water deficit stress in radish crop. Sci. Hortic. 2022, 291, 110600. [Google Scholar] [CrossRef]
  21. Chaudhari, R.H.; Mali, P.C.; Parulekar, Y.R.; Salvi, B.R.; Mahadik, S.G. Effect of consecutive sowings and spacing on growth and yield of radish. Int. J. Hortic. Food Sci. 2022, 4, 19–23. [Google Scholar] [CrossRef]
  22. Gaplaev, M.S.; Terekbaev, A.A.; Madaev, A.A.; Eldarov, I.B. Root crops and daikon seeds yield in relation to sowing time, methods of cultivation and cultivar features in conditions of the North-Eastern Caucasus. AgroSMART 2019, 2019, 904–911. [Google Scholar] [CrossRef]
  23. Brewer, M.; Kadyampakeni, D.M.; Kanissery, R.; Kwakye, S. Evaluation of the nitrogen uptake efficacy of daikon radish under greenhouse conditions on sandy soils. Agrosyst. Geosci. Environ. 2024, 7, e20508. [Google Scholar] [CrossRef]
  24. Khusanov, N.; Boboyev, S.; Razzakova, S.; Shoira, N.; Juliyev, M.; Turabayev, A. Raphanus sativus L. and its determination of planting dates based on seed germination in different ecological environments of Uzbekistan. E3S Web Conf. 2024, 497, 03029. [Google Scholar] [CrossRef]
  25. Jin, D.; Lu, Z.; Song, X.; Ahammed, G.J.; Yan, Y.; Chen, S. Improvement of yield and quality properties of radish by the organic fertilizer application combined with the reduction of chemical fertilizer. Agronomy 2024, 14, 1847. [Google Scholar] [CrossRef]
  26. Sirtautas, R.; Samuoliene, G.; Brazaityte, A.; Duchovskis, P. Temperature and photoperiod effects on photosynthetic indices of radish (Raphanus sativus L.). Agriculture 2011, 98, 57–61. [Google Scholar]
  27. Gamba, M.; Asllanaj, E.; Raguindin, P.F.; Glisic, M.; Franco, O.H.; Minder, B.; Bussler, W.; Metzger, B.; Kern, H.; Muka, T. Nutritional and phytochemical characterization of radish (Raphanus sativus): A systematic review. Trends Food Sci. Technol. 2021, 113, 205–218. [Google Scholar] [CrossRef]
  28. Mari, S.N.; Zhang, L.; Kaleri, A.A.; Jatoi, F.A.; Solangi, M.R.M. Cultivation of Exotic Radish Varieties in Climatic Condition of Tando Jam. Annu. Methodol. Arch. Res. Rev. 2025, 3, 139–149. [Google Scholar]
  29. Swe, K.M.; Chowdhury, M.; Reza, M.N.; Ali, M.; Kiraga, S.; Islam, S.; Chung, S.; Hong, S.J. Physical and strength properties of radish and Chinese cabbage. Precis. Agric. Sci. Technol. 2022, 4, 91–106. [Google Scholar] [CrossRef]
  30. Khan, R.S.; Khan, S.S.; Siddique, R. Radish (Raphanus sativus): Potential antioxidant role of bioactive compounds extracted from radish leaves—A review. Pak. J. Med. Health Sci. 2022, 16, 2. [Google Scholar] [CrossRef]
  31. Noreen, S.; Khalid, W.; Khan Niazi, M.; Javed, M.; Aziz, A.; Raza, A.; Khalid, M.Z.; Chamba, M.V.M. Application of radish pods in households and effect of their active components against different diseases: A review. Int. J. Food Prop. 2023, 26, 2039–2054. [Google Scholar] [CrossRef]
  32. Pathak, M.; Barik, S.; Das, S.K. Impact of climate change on root crops production. Adv. Res. Veg. Prod. Under A Chang. Clim. 2021, 1, 125–148. [Google Scholar] [CrossRef]
  33. Manzoor, A.; Bashir, M.A.; Naveed, M.S.; Cheema, K.L.; Cardarelli, M. Role of different abiotic factors in inducing pre-harvest physiological disorders in radish (Raphanus sativus). Plants 2021, 10, 2003. [Google Scholar] [CrossRef]
  34. Bisht, A.; Krishna, V.; Savita. Production Technology of Underutilized Vegetables of Brassicaceae Family. In Production Technology of Underutilized Vegetable Crops; Springer International Publishing: Cham, Switzerland, 2023; pp. 173–237. [Google Scholar] [CrossRef]
  35. Chaika, V.M.; Havei, I.; Miniailo, A. Influence of climate changes on dominants number, distribution and harmfulness of entomocomplexes of winter wheat in the forest-steppe of Ukraine. Plant Soil Sci. 2018, 268, 304–311. [Google Scholar]
  36. Prokopenko, K.; Udova, L. Ukrainian agriculture: Challenges and ways of development under the climate change. Econ. Forecast. 2017, 1, 92–107. [Google Scholar] [CrossRef]
  37. Kalenska, S.; Yeremenko, O.; Novictska, N.; Yunyk, A.; Honchar, L.; Cherniy, V.; Stolayrchuk, T.; Kalenskyi, V.; Scherbakova, O.; Rigenko, A. Enrichment of field crops biodiversity in conditions of climate changing. Ukr. J. Ecol. 2019, 9, 19–24. [Google Scholar]
  38. Skrypnyk, A.; Zhemoyda, O.; Klymenko, N.; Galaieva, L.; Koval, T. Econometric analysis of the impact of climate change on the sustainability of agricultural production in Ukraine. J. Ecol. Eng. 2021, 22, 275–288. [Google Scholar] [CrossRef]
  39. Tsytsyura, Y. Adaptive strategy of agriculture of the right-bank Ukrainian forest-steppe in the conditions of climate change. Agric. For. 2017, 5, 25–33. [Google Scholar]
  40. Dhand, A.; Garg, N. Genotype × environment interaction using AMMI and MTSI analysis for growth and yield attributes of radish (Raphanus sativus L.) under high temperature stress conditions of north Indian plains. Sci. Hortic. 2023, 313, 111880. [Google Scholar] [CrossRef]
  41. Singh, A.; Rattan, P.; Sharma, N. Effect of date of sowing and spacing on growth and yield of radish (Raphanus sativus L.) cv. Pusa Chetki. Indian J. Pure Appl. Biosci. 2021, 9, 211–221. [Google Scholar] [CrossRef]
  42. DSTU 4362:2004; Soil Quality. Indicators of Soil Fertility. State standard of Ukraine: Kyiv, Ukraine, 2006.
  43. ISO 10390:2021; Soil, Treated Biowaste and Sludge—Determination of pH. International Organization for Standardization: Geneva, Switzerland, 2021.
  44. DSTU 4729:2007; Soil quality. Determination of Nitrate and Ammonium Nitrogen in the Modification of the NSC ISSAR Named After O.N. Sokolovsky. State standard of Ukraine: Kyiv, Ukraine, 2008.
  45. DSTU 4115:2002; Soils. Determination of Mobile Phosphorus and Potassium Compounds by the Modified Chirikov Method. State standard of Ukraine: Kyiv, Ukraine, 2003.
  46. DSTU 4289:2004; Soil Quality. Methods for Determining Organic Matter (Tyurin Method). State standard of Ukraine: Kyiv, Ukraine, 2005.
  47. Bleiholder, H.; Weber, E.; Lancashire, P.; Feller, C.; Buhr, L.; Hess, M.; Wicke, H.; Hack, H.; Meier, U.; Klose, R.; et al. Growth stages of mono-and dicotyledonous plants. BBCH Monogr. 2001, 158. [Google Scholar]
  48. DSTU 7804:2015; Products of Processing of Fruits and Vegetables. Methods for Determination of Dry Substances or Moisture. State Standard Ukrainy: Kyiv, Ukraine, 2015.
  49. DSTU 4954:2008; Products of Processing of Fruits and Vegetables. Methods for Determination of Sugars. State Standard Ukrainy: Kyiv, Ukraine, 2008.
  50. DSTU ISO 6557-2:2014; Fruits, Vegetables and Derived Products. Determination of Ascorbic Acid Content. Part 2: Routine Methods. State Standard Ukrainy: Kyiv, Ukraine, 2014.
  51. Nageswara, R.G. Statistics for Agricultural Sciences, 3rd ed.; BSP Books Pvt. Ltd.: Hyderabad, India, 2018. [Google Scholar]
  52. Ghimire, S.; Adhikari, B.; Pandey, S.; Belbase, K.; Lamichhane, S.; Pathak, R. Effect of different organic manure on growth and yield of radish in Deukhuri, Dang, Nepal. Acta Sci. Agric 2020, 4, 1–5. [Google Scholar]
  53. Shimizu, H. Effect of day and night temperature alternations on plant morphogenesis. Environ. Control. Biol. 2007, 45, 259–265. [Google Scholar] [CrossRef]
  54. Bakhshandeh, E.; Gholamhossieni, M. Modelling the effects of water stress and temperature on seed germination of radish and cantaloupe. J. Plant Growth Regul. 2019, 38, 1402–1411. [Google Scholar] [CrossRef]
  55. Hu, T.; Wei, Q.; Wang, W.; Hu, H.; Mao, W.; Zhu, Q.; Bao, C. Genome-wide identification and characterization of CONSTANS-like gene family in radish (Raphanus sativus). PLoS ONE 2018, 13, e0204137. [Google Scholar] [CrossRef]
  56. Nie, S.; Li, C.; Xu, L.; Wang, Y.; Huang, D.; Muleke, E.M.; Sun, X.; Xie, Y.; Liu, L. De novo transcriptome analysis in radish (Raphanus sativus L.) and identification of critical genes involved in bolting and flowering. BMC Genom. 2016, 17, 389. [Google Scholar] [CrossRef]
  57. Luitel, B.P.; Bhusal, Y.; Bhandari, B.B. Evaluation of radish (Raphanus sativus L.) varieit in different sowing dates for of-season production at dailekh. J. Agric. Environ. 2024, 25, 117–125. [Google Scholar]
  58. Mitsui, Y.; Yokoyama, H.; Nakaegawa, W.; Tanaka, K.; Komatsu, K.; Koizuka, N.; Okuzaki, A.; Matsumoto, T.; Takahara, M.; Tabei, Y. Epistatic interactions among multiple copies of FLC genes with naturally occurring insertions correlate with flowering time variation in radish. AoB Plants 2023, 15, plac066. [Google Scholar] [CrossRef] [PubMed]
  59. Han, K.; Ahn, H.I.; Yang, H.B.; Lee, Y.R.; Lee, E.S.; Lee, J.; Jang, C.-S.; Kim, D.S. Identification of Genetic Loci Associated with Bolting Time in Radish (Raphanus sativus L.) by QTL Mapping and GWAS. Agronomy 2024, 14, 2700. [Google Scholar] [CrossRef]
  60. Kaur, A.; Singh, N. Effect of Sowing Time on Different Radish Varieties (Raphanus sativus L.). J. Krishi Vigyan 2022, 11, 162–166. [Google Scholar] [CrossRef]
  61. Al–Juboori, A.A.; Al-hamdani, S.; Hamdon, M. Effect of sowing date on growth and yield of four radish (Raphanus sativus L.) varieties. Mesop. J. Agric. 2019, 47, 96. [Google Scholar] [CrossRef]
  62. Panwar, N.S.; Mishra, A.C.; Uniyal, S.P.; Pandey, V.; Bali, R.S. Effect of date of sowing on yield and quality of radish (Raphanus sativus L.) cultivars under rainfed mid-hill conditions of Uttarakhand. Ann. Agri Bio Res. 2013, 18, 360–363. [Google Scholar]
  63. Dhaliwal, M.S.; Klair, J.S. Sowing date affects development and root yield of radish. Int. J. Veg. Sci. 2008, 13, 75–93. [Google Scholar] [CrossRef]
  64. Lavanya, A.V.N.; Vani, V.S.; Reddy, P.S.S.; Shashikala, P. Effect of sowing dates and spacing on growth and root yield of radish cv. pusa chetki. Indian J. Pure Appl. Biosci. 2017, 5, 1774–1779. [Google Scholar]
  65. Kang, J.N.; Kim, J.S.; Lee, S.M.; Won, S.Y.; Seo, M.S.; Kwon, S.J. Analysis of phenotypic characteristics and sucrose metabolism in the roots of Raphanus sativus L. Front. Plant Sci. 2021, 12, 716782. [Google Scholar] [CrossRef]
  66. Park, C.H.; Ki, W.; Kim, N.S.; Park, S.Y.; Kim, J.K.; Park, S.U. Metabolic profiling of white and green radish cultivars (Raphanus sativus). Horticulturae 2022, 8, 310. [Google Scholar] [CrossRef]
  67. David, I. Analysis of Physiological and Biochemical Parameters in the Radish (Raphanus sativus L.) Obtained in Different Cultivation Systems. Grassroots J. Nat. Resour. 2024, 7, 41–62. [Google Scholar] [CrossRef]
  68. Jambalsuren, B.; Dondog, P. Biochemical analysis of radish and beet species. Mong. J. Agric. Sci. 2023, 16, 31–36. [Google Scholar] [CrossRef]
  69. Dahal, K.M.; Bhattarai, D.R.; Sharma, M.D.; Poudel, B. Evaluation of radish (Raphanus sativus L.) varieties under shade-net condition for yield and quality. Nepal. Hortic. 2021, 15, 16–23. [Google Scholar] [CrossRef]
  70. Dang, L.M.; Min, K.; Nguyen, T.N.; Park, H.Y.; Lee, O.N.; Song, H.K.; Moon, H. Vision-based white radish phenotypic trait measurement with smartphone imagery. Agronomy 2023, 13, 1630. [Google Scholar] [CrossRef]
  71. Kim, B.; Hur, O.; Lee, J.E.; Assefa, A.D.; Ko, H.C.; Chung, Y.J.; Rhee, J.; Hahn, B.S. Characterization of phenotypic traits and evaluation of glucosinolate contents in radish germplasms (Raphanus sativus L.). Korean J. Plant Resour. 2021, 34, 575–599. [Google Scholar] [CrossRef]
  72. Kim, D.W.; Yun, H.S.; Jeong, S.J.; Kwon, Y.S.; Kim, S.G.; Lee, W.S.; Kim, H.J. Modeling and testing of growth status for Chinese cabbage and white radish with UAV-based RGB imagery. Remote Sens. 2018, 10, 563. [Google Scholar] [CrossRef]
  73. Brouwer, I.D.; van Liere, M.J.; de Brauw, A.; Dominguez-Salas, P.; Herforth, A.; Kennedy, G.; Lachat, C.; Omosa, E.B.; Talsma, E.F.; Vandevijvere, S.; et al. Reverse thinking: Taking a healthy diet perspective towards food systems transformations. Food Secur. 2021, 13, 1497–1523. [Google Scholar] [CrossRef]
  74. Zavadska, O.; Bobos, I.; Fedosiy, I.; Podpriatov, H.; Komar, O.; Mazur, B.; Olt, J. Suitability of various onion (Allium cepa) varieties for drying and long-term storage. Agron. Res. 2022, 19, 1675–1690. [Google Scholar] [CrossRef]
  75. Pusik, L.; Pusik, V. Study of the storage of daicon roots depending on the type of packaging. Veg. Melon Grow. 2025, 77, 93–105. [Google Scholar] [CrossRef]
  76. Singh, B.K. Radish (Raphanus sativus L.): Breeding for higher yield, better quality and wider adaptability. Adv. Plant Breed. Strateg. Veg. Crops 2021, 8, 275–304. [Google Scholar] [CrossRef]
Figure 1. Analysis of the air temperature and precipitation dynamics in 2022–2024.
Agronomy 16 00282 g001
Figure 2. General view of the root crop and rosettes of the leaves of the variety: (a) Gulliver, (b) Minowase, 2022.
Agronomy 16 00282 g002
Figure 3. Normal probability plot of residuals for yield.
Agronomy 16 00282 g003
Figure 4. The box plot illustrating the yield of the daikon varieties Gulliver (a) and Minowase (b) at different sowing dates: (A) the 1st ten-day period of July; (B) the 2nd ten-day period of July; (C) the 3rd ten-day period of July; (D) the 1st ten-day period of August (2022–2024).
Agronomy 16 00282 g004
Figure 5. The correlation analysis of the relationship between the yield of daikon varieties Gulliver (a) and Minowase (b), and the sowing dates (2022–2024).
Agronomy 16 00282 g005
Figure 6. Dynamics of the average mass of the root crops of the daikon varieties Gulliver (a) and Minowase (b) depending on the sowing date: (A) the 1st ten-day period of July; (B) the 2nd ten-day period of July; (C) the 3rd ten-day period of July; (D) the 1st ten-day period of August (2022–2024).
Agronomy 16 00282 g006
Figure 7. Dynamics of marketability of the root crops of daikon varieties Gulliver (a) and Minowase (b). depending on the sowing date: (A) the 1st ten-day period of July; (B) the 2nd ten-day period of July; (C) the 3rd ten-day period of July; (D) the 1st ten-day period of August (2022–2024).
Agronomy 16 00282 g007
Figure 8. Impact of sowing date on the biochemical parameters of daikon root crops (dry matter (a), total sugar (b), vitamin C (c), tasting assessment (d)) (2022–2024). The first ten days of July (A); The second ten days of July (B); The third ten days of July (C); The first ten days of August (D).
Agronomy 16 00282 g008
Figure 9. Dependence of biochemical indicators (dry matter (a); total sugar (b); vitamin C (c) and tasting score (d)) on the sowing dates of the Gulliver (A) and Minowase (B) varieties (2022–2024).
Agronomy 16 00282 g009
Figure 10. Dependence of biochemical indicators (dry matter (a); total sugar (b); vitamin C (c) and tasting score (d)) on the average root mass of the Gulliver (A) and Minowase (B) varieties (2022–2024).
Agronomy 16 00282 g010
Figure 11. Correlation dependence of the vitamin C content in the daikon root crops of the Gulliver (a) and Minowase (b) varieties on the sum of the air temperatures (2022–2024).
Agronomy 16 00282 g011
Figure 12. Dependence of the tasting score of the Gulliver (A) and Minowase (B) varieties on the biochemical indicators (dry matter (a); total sugar (b); vitamin C (c)) (2022–2024).
Agronomy 16 00282 g012
Table 1. Physicochemical properties and nutrient status of the soil.
Parameter (Units)(1) Test Results(2) Expanded Uncertainty(3) Fertility Class Range(3) Interpretation
Soil pH (pHKCl)6.740.026.1–7.0Neutral
Soil Organic Matter (Humus), %2.710.172.1–3.0Medium
Nitrate Nitrogen (NO3), mg kg−16.420.1016–24Medium
Ammonium Nitrogen (NH4), mg kg−111.720.12
Available Phosphorus (P2O5), mg kg−1568.831.89>200Very high
Available Potassium (K2O), mg kg−1152.933.10121–180High
Note: (1) Results are reported on an air-dry basis; (2) Expanded uncertainty was calculated by multiplying the reproducibility standard deviation (determined via the modified Horwitz-Thompson equation) by a coverage factor of k = 2 (95% confidence level); (3) Soil fertility indicators are based on DSTU 4362:2004 (Soil Quality: Soil Fertility Indicators) [42].
Table 2. Results of a three-way ANOVA of the effects of year, variety, and sowing date on yield.
EffectssDegr. of FreedomMSFp
Year69234.513.40.000 *
Variety2571256.599.40.000 *
Sowing dates10413347134.40.000 *
Year × Variety120.70.30.75
Year × Sowing dates124620.780.000 *
Variety × Sowing dates303103.90.015 *
Year × Variety × Sowing dates18631.20.347
Note: *—significant at the 0.05 level.
Table 3. Correlation analysis of the relationship between the daikon yield and the agrometeorological indicators (the sum of air temperatures and total precipitation) in 2022–2024.
Factor A, VarietyFactor B, Sowing DateVariablenPearson’s rpCovariance
GulliverFirst ten-day period of JulyYield, t ha−1—Sum of temperatures above 10 °C, °C9−0.5980.089−329.2
Yield, t ha−1—Precipitation amount, mm90.803 **0.009148.8
Second ten-day period of July Yield, t ha−1—Sum of temperatures above 10 °C, °C9−0.1030.792−60.02
Yield, t ha−1—Precipitation amount, mm90.839 **0.00516.73
Third ten-day period of JulyYield, t ha−1—Sum of temperatures above 10 °C, °C90.0350.92819.40
Yield, t ha−1—Precipitation amount, mm90.5610.11672.30
First ten-day period of AugustYield, t ha−1—Sum of temperatures above 10 °C, °C90.0350.92916.51
Yield, t ha−1—Precipitation amount, mm90.5880.09670.64
MinowaseFirst ten-day period of JulyYield, t ha−1—Sum of temperatures above 10 °C, °C9−0.6200.075−354.92
Yield, t ha−1—Precipitation amount, mm90.6240.07376.71
Second ten-day period of July Yield, t ha−1—Sum of temperatures above 10 °C, °C9−0.6270.071−367.90
Yield, t ha−1—Precipitation amount, mm90.6480.05938.25
Third ten-day period of JulyYield, t ha−1—Sum of temperatures above 10 °C, °C9−0.0940.810−59.27
Yield, t ha−1—Precipitation amount, mm90.6020.08690.09
First ten-day period of AugustYield, t ha−1—Sum of temperatures above 10 °C, °C90.2720.480137.99
Yield, t ha−1—Precipitation amount, mm90.759 *0.01862.76
Note: * p < 0.05, ** p < 0.01.
Table 4. Descriptive statistics of the yield of the daikon variety depending on the sowing dates (2022–2024).
EffectLevel of
Factor
Level of
Factor
Level of
Factor
NYield, t ha−1
Mean
Yield, t ha−1
Std.Dev.
Yield, t ha−1
Std.Err
Yield, t ha−1
−95%
Yield, t ha−1
95%
Total 7251.64.840.5750.5052.78
Year2022 2452.94.911.0050.8655.01
Year2023 2450.63.800.7848.9752.18
Year2024 2451.45.551.1349.0653.74
VarietyMinowase 3653.54.850.8151.8855.17
VarietyGulliver 3649.84.080.6848.3751.13
Sowing datesA 1847.02.520.5945.7548.25
Sowing datesB 1849.12.950.7047.6650.60
Sowing datesC 1856.73.220.7655.1158.32
Sowing datesD 1853.73.340.7952.0455.36
Year × Variety2022Minowase 1254.85.011.4551.6257.98
Year × Variety2022Gulliver 1251.14.221.2248.3953.76
Year × Variety2023Minowase 1252.73.420.9950.4854.82
Year × Variety2023Gulliver 1248.53.020.8746.5850.42
Year × Variety2024Minowase 1253.15.941.7149.3556.90
Year × Variety2024Gulliver 1249.74.741.3746.6652.69
Year × Sowing dates2022A 647.22.461.0044.6249.78
Year × Sowing dates2022B 651.31.950.7949.2653.34
Year × Sowing dates2022C 658.53.121.2755.2361.77
Year × Sowing dates2022D 654.82.771.1351.8457.66
Year × Sowing dates2023A 648.91.810.7447.0050.80
Year × Sowing dates2023B 647.63.751.5343.6651.54
Year × Sowing dates2023C 654.22.761.1351.3057.10
Year × Sowing dates2023D 651.63.231.3248.2154.99
Year × Sowing dates2024A 644.91.630.6643.1946.61
Year × Sowing dates2024B 648.51.700.6946.7250.28
Year × Sowing dates2024C 657.52.430.9954.9060.00
Year × Sowing dates2024D 654.83.441.4151.1458.36
Variety × Sowing datesMinowaseA 948.02.140.7146.3349.61
Variety × Sowing datesMinowaseB 950.82.190.7349.1552.51
Variety × Sowing datesMinowaseC 958.92.380.7957.0460.70
Variety × Sowing datesMinowaseD 956.41.840.6155.0257.85
Variety × Sowing datesGulliverA 946.02.620.8744.0248.05
Variety × Sowing datesGulliverB 947.42.700.9045.3649.51
Variety × Sowing datesGulliverC 954.62.450.8252.6856.45
Variety × Sowing datesGulliverD 951.01.870.6249.5352.41
Year × Variety × Sowing dates2022MinowaseA348.62.211.2843.1054.10
Year × Variety × Sowing dates2022MinowaseB352.71.370.7949.2956.11
Year × Variety × Sowing dates2022MinowaseC360.72.301.3354.9966.41
Year × Variety × Sowing dates2022MinowaseD357.20.810.4755.1859.22
Year × Variety × Sowing dates2022GulliverA345.82.091.2140.6150.99
Year × Variety × Sowing dates2022GulliverB349.91.300.7546.6753.13
Year × Variety × Sowing dates2022GulliverC356.32.131.2351.0161.59
Year × Variety × Sowing dates2022GulliverD352.30.740.4350.4654.14
Year × Variety × Sowing dates2023MinowaseA349.22.001.1644.2254.18
Year × Variety × Sowing dates2023MinowaseB350.52.361.3644.6356.37
Year × Variety × Sowing dates2023MinowaseC356.51.320.7653.2359.77
Year × Variety × Sowing dates2023MinowaseD354.41.200.6951.4257.38
Year × Variety × Sowing dates2023GulliverA348.61.981.1443.6953.51
Year × Variety × Sowing dates2023GulliverB344.72.091.2139.5149.89
Year × Variety × Sowing dates2023GulliverC351.91.210.7048.8954.91
Year × Variety × Sowing dates2023GulliverD348.81.080.6246.1351.47
Year × Variety × Sowing dates2024MinowaseA346.11.100.6343.3748.83
Year × Variety × Sowing dates2024MinowaseB349.31.650.9545.2053.40
Year × Variety × Sowing dates2024MinowaseC359.41.330.7756.0962.71
Year × Variety × Sowing dates2024MinowaseD357.71.400.8154.2361.17
Year × Variety × Sowing dates2024GulliverA343.71.040.6041.1146.29
Year × Variety × Sowing dates2024GulliverB347.71.600.9243.7351.67
Year × Variety × Sowing dates2024GulliverC355.51.240.7252.4158.59
Year × Variety × Sowing dates2024GulliverD351.81.250.7248.6954.91
Notes: N shows the number of replications for each experimental variant (variety (Gulliver, Minowase)) n = 2; sowing date (A—First ten-day period of July, B—Second ten-day period of July, C—Third ten-day period of July, D—First ten-day period of August) n = 4; spatial replication n = 3; temporal replication (years) n = 3 (2022, 2023, 2024); Mean—average yield; Std.Dev.—standard deviation, indicating the range of data relative to the mean; Std.Err.—standard error of the mean, which characterizes the accuracy of the estimate of the sample mean; The −95.00% and +95.00% columns reflect the lower and upper limits of the 95% confidence interval, which allows estimating the range in which the true average yield for the general population lies.
Disclaimer/Publisher’s Note: The statements, opinions and data contained in all publications are solely those of the individual author(s) and contributor(s) and not of MDPI and/or the editor(s). MDPI and/or the editor(s) disclaim responsibility for any injury to people or property resulting from any ideas, methods, instructions or products referred to in the content.