Article

Evaluation of Resource Efficiency and Environmental Impact in a Plant Factory Using an Ion-Selective Electrode-Based Precision Nutrient Management System

1
Department of Biosystems Engineering, College of Agriculture and Life Sciences, Seoul National University, Seoul 08826, Republic of Korea
2
Integrated Major in Global Smart Farm, College of Agriculture and Life Sciences, Seoul National University, Seoul 08826, Republic of Korea
3
Department of Bio-Industrial Machinery Engineering, Gyeongsang National University, Jinju 52828, Republic of Korea
4
Gyeongnam Aerospace & Defense Institute of Science and Technology, Gyeongsang National University, Jinju 52828, Republic of Korea
5
Institute of Agricultural and Biosystems Engineering, College of Engineering and Agro-Industrial Technology, University of the Philippines Los Baños, Los Baños 4031, Philippines
*
Author to whom correspondence should be addressed.
These authors contributed equally to this work.
Agronomy 2026, 16(2), 232; https://doi.org/10.3390/agronomy16020232
Submission received: 15 December 2025 / Revised: 13 January 2026 / Accepted: 13 January 2026 / Published: 19 January 2026

Abstract

Plant factories enable stable crop production, but face sustainability challenges due to intensive resource consumption. In particular, studies that quantitatively analyze nutrient use in plant cultivation and assess the environmental burdens remain scarce. To address this, this study developed and evaluated a precision nutrient management system using ion-selective electrodes (ISEs) for closed hydroponic lettuce cultivation. The system’s performance was compared with a conventional EC-based approach in terms of resource use efficiency and environmental impact using life cycle assessment (LCA). The ISE-based system effectively maintained NO3, K, and Ca concentrations within target ranges (root mean square error (RMSE) < 52 mg·L−1), producing healthy crops without the physiological disorders (tip-burn) observed in the EC-based control, while the EC-based system showed higher total fresh weight, which implies that the increase in fresh weight may not necessarily correspond to marketable yield due to the nutrient imbalances. In terms of efficiency, the ISE-based system improved water-use efficiency (WUE) by 48.4% and fertilizer-use efficiency (FUE) by 24.5%. Furthermore, LCA revealed that the ISE-based system reduced greenhouse gas emissions by 8% and freshwater ecotoxicity by 64% per kg of lettuce, primarily by extending the nutrient solution reuse period threefold. The results suggest that ion-specific precision management has the potential to enhance the sustainability and resource efficiency of plant factories.

1. Introduction

Agriculture is one of the most important global industries, but it is also a significant contributor to environmental issues and climate change, accounting for 19~29% of total global greenhouse gas (GHG) emissions [1]. When considering the entire agricultural value chain, including production, transportation, processing, and consumption, the sector’s greenhouse gas emissions increase to between 26% [2] and 37% [3], underscoring its substantial impact on global environmental sustainability. Furthermore, global agricultural land is expected to decrease in the future [4], and climate change is anticipated to lead to reduced crop yields and increased food spoilage as a direct consequence [5]. As a result, plant factories are being proposed as a viable solution to address pressing global challenges, including the rising food demand, climate change, resource depletion, and environmental pollution [6].
Plant factories offer year-round stable production by controlling all environmental factors regardless of external weather and can deliver higher crop productivity and improved resource efficiency relative to conventional agriculture [6,7]. Additionally, they offer advantages such as higher crop productivity and improved resource efficiency compared to traditional agriculture [8]. However, the high cropping intensity and year-round production cycles of plant factories lead to high energy demands and intensive use of water and fertilizers, raising concerns about their environmental sustainability [9]. To evaluate the sustainability of plant factories requires looking beyond energy use to address the environmental impacts of resource inputs and waste outputs [10,11]. For example, inorganic fertilizers consume substantial energy during the production process, and the discharge of nutrient solutions containing fertilizers can lead to eutrophication and ecotoxicity [12]. Therefore, evaluation of the environmental impact of nutrient management is essential for the sustainable operation of plant factories.
In this context, life cycle assessment (LCA) can serve as a critical tool not just for comparing farming systems, but also for evaluating internal management strategies. By quantifying specific impact categories—such as global warming potential and freshwater eutrophication—LCA enables a rigorous comparison between precision nutrient management and conventional methods, verifying whether improved fertilizer efficiency translates into tangible environmental benefits [9,13]. While research efforts have been made to improve water-use efficiency in plant factories to address waste generation from intensive resource use [14], studies focusing on enhancing fertilizer resource efficiency remain scarce. Furthermore, there is a lack of quantitative assessments evaluating the impact of improved fertilizer efficiency through precision management using the LCA approach.
Nutrient management in closed hydroponics for plant factories is conventionally managed based on the pH and electrical conductivity (EC) of the nutrient solution within target ranges [15]. However, because EC only reflects the aggregate ionic content, it cannot distinguish between deficient and excessive nutrient components in the solution, often leading to nutrient imbalance [16,17]. Across successive reuse cycles, such an imbalance can lead to the accumulation or depletion of specific ions, resulting in nutritional disorders and a negative impact on quality. Consequently, it leads to frequent solution replacement, with subsequent resource losses and wastewater burdens [18].
To address these challenges, real-time ion monitoring using ion-selective electrodes (ISEs) was introduced [19,20]. While ISEs still face challenges such as signal drift, ion interference, and a finite sensor lifespan (e.g., ~60 days for PVC membrane-based ISEs), prior studies demonstrated that field applicability can be improved through the two-point normalization. However, they have largely been confined to greenhouse or laboratory settings. Specifically, evidence remains limited for long-term operation in plant factory environments, multi-channel simultaneous sensing, and quantitative evaluation of resource-use efficiency and environmental impacts of plant factory systems through LCA [11,21].
Accordingly, this study evaluates an ISE-based precision nutrient management approach in a closed hydroponic plant factory, wherein the concentrations of major nutrient ions (NO3, K, Ca) are monitored in real time and individual fertilizer salts are dosed precisely; its resource-use performance—water-use efficiency [22] and fertilizer-use efficiency (FUE)—is compared to conventional EC-based management under identical cultivation conditions. Furthermore, to compare the sustainability of these two management strategies, an LCA with cradle-to-gate system boundaries—covering facility construction, operation, water and fertilizer inputs, and effluent/disposal—is conducted to quantitatively determine the environmental impacts of the two management strategies.

2. Materials and Methods

2.1. Preparation of NO3, K, and Ca Ion-Selective Electrodes

ISEs for nitrate (NO3), potassium (K), and calcium (Ca) were fabricated using polyvinyl chloride (PVC) membranes following established formulations reported in previous studies [21]. PVC membrane disks (2.5 mm diameter) were mounted onto PVC electrode bodies (44 mm length) using tetrahydrofuran as the membrane solvent. The internal filling solutions consisted of 0.01 M NaNO3 and 0.01 M NaCl for NO3 ISEs, 0.01 M KCl for K ISEs, and 0.1 M CaCl2 for Ca ISEs.
A silver wire (1 mm diameter, model 265594, Sigma-Aldrich, St. Louis, MO, USA) coated with Ag/AgCl ink (model 01164, ALS, Tokyo, Japan) served as the internal reference element. All ISEs were operated in conjunction with a double-junction external reference electrode (Orion 900200, Thermo Fisher Scientific, Waltham, MA, USA) to obtain simultaneous electromotive force (EMF) measurements. This configuration ensured stable potential readings across electrodes. For clarity, the ions detected by each ISE are hereafter referred to as NO3, K, and Ca.

2.2. Development of the Precision Nutrient Solution Management System

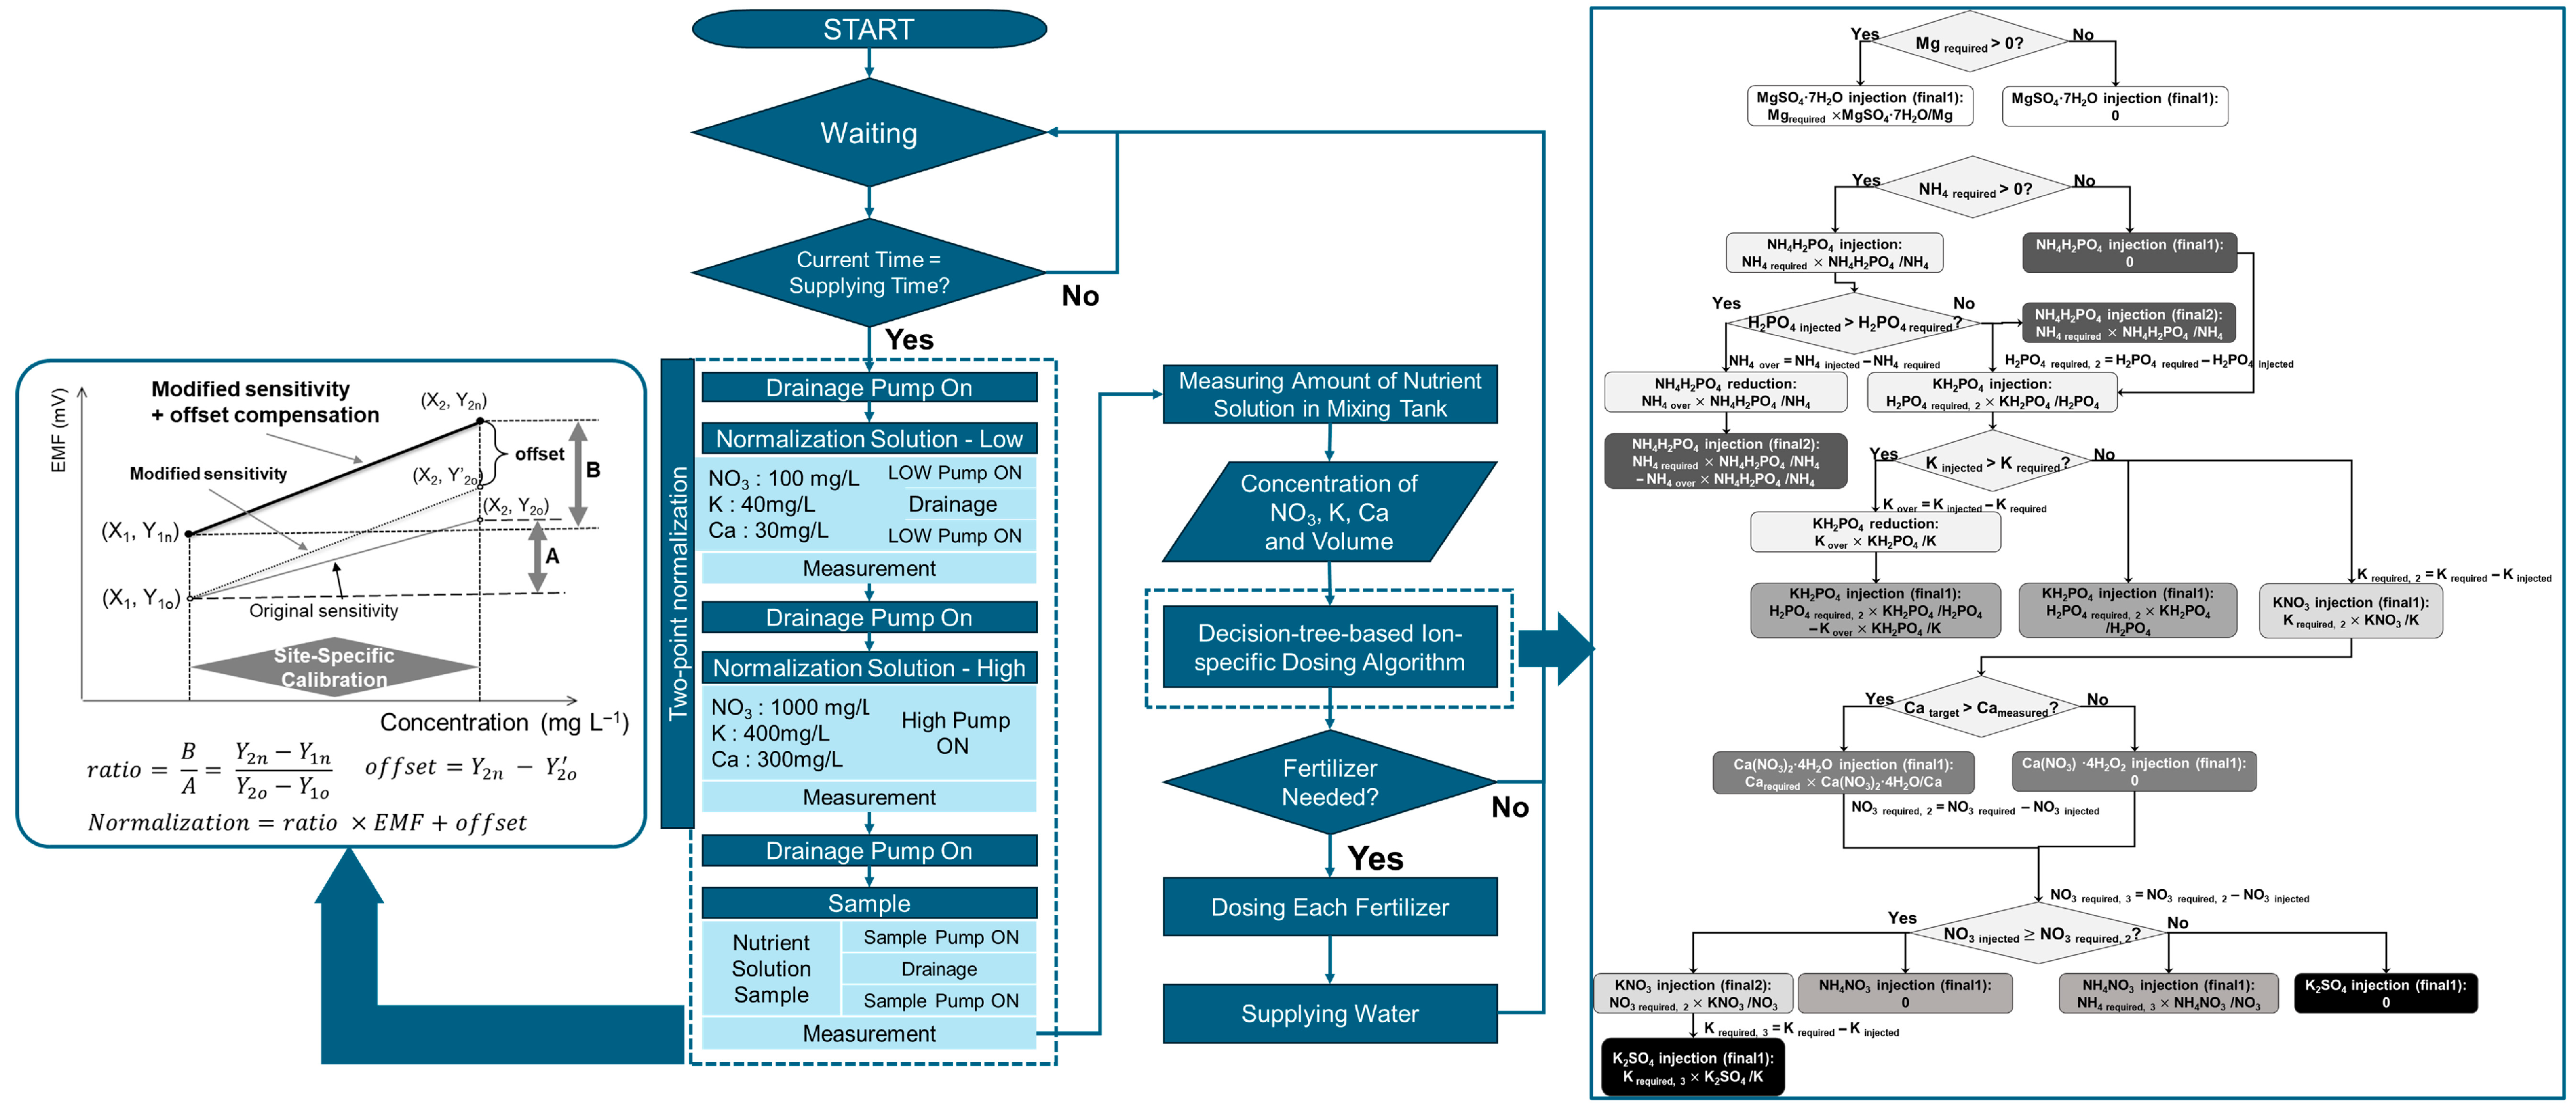
The precision nutrient solution management system was developed based on the design concept proposed in previous studies [19,21]. To ensure consistency with previous dosing algorithm [21], ‘ion-selective’ is used for the sensing hardware (ISEs), and ‘ion-specific’ for the dosing algorithm. The system enables automated data collection, ISE rinsing, and drainage for both normalization solutions and sample solutions. Based on the measured data, individual fertilizer application is conducted. This process is illustrated in Figure 1.
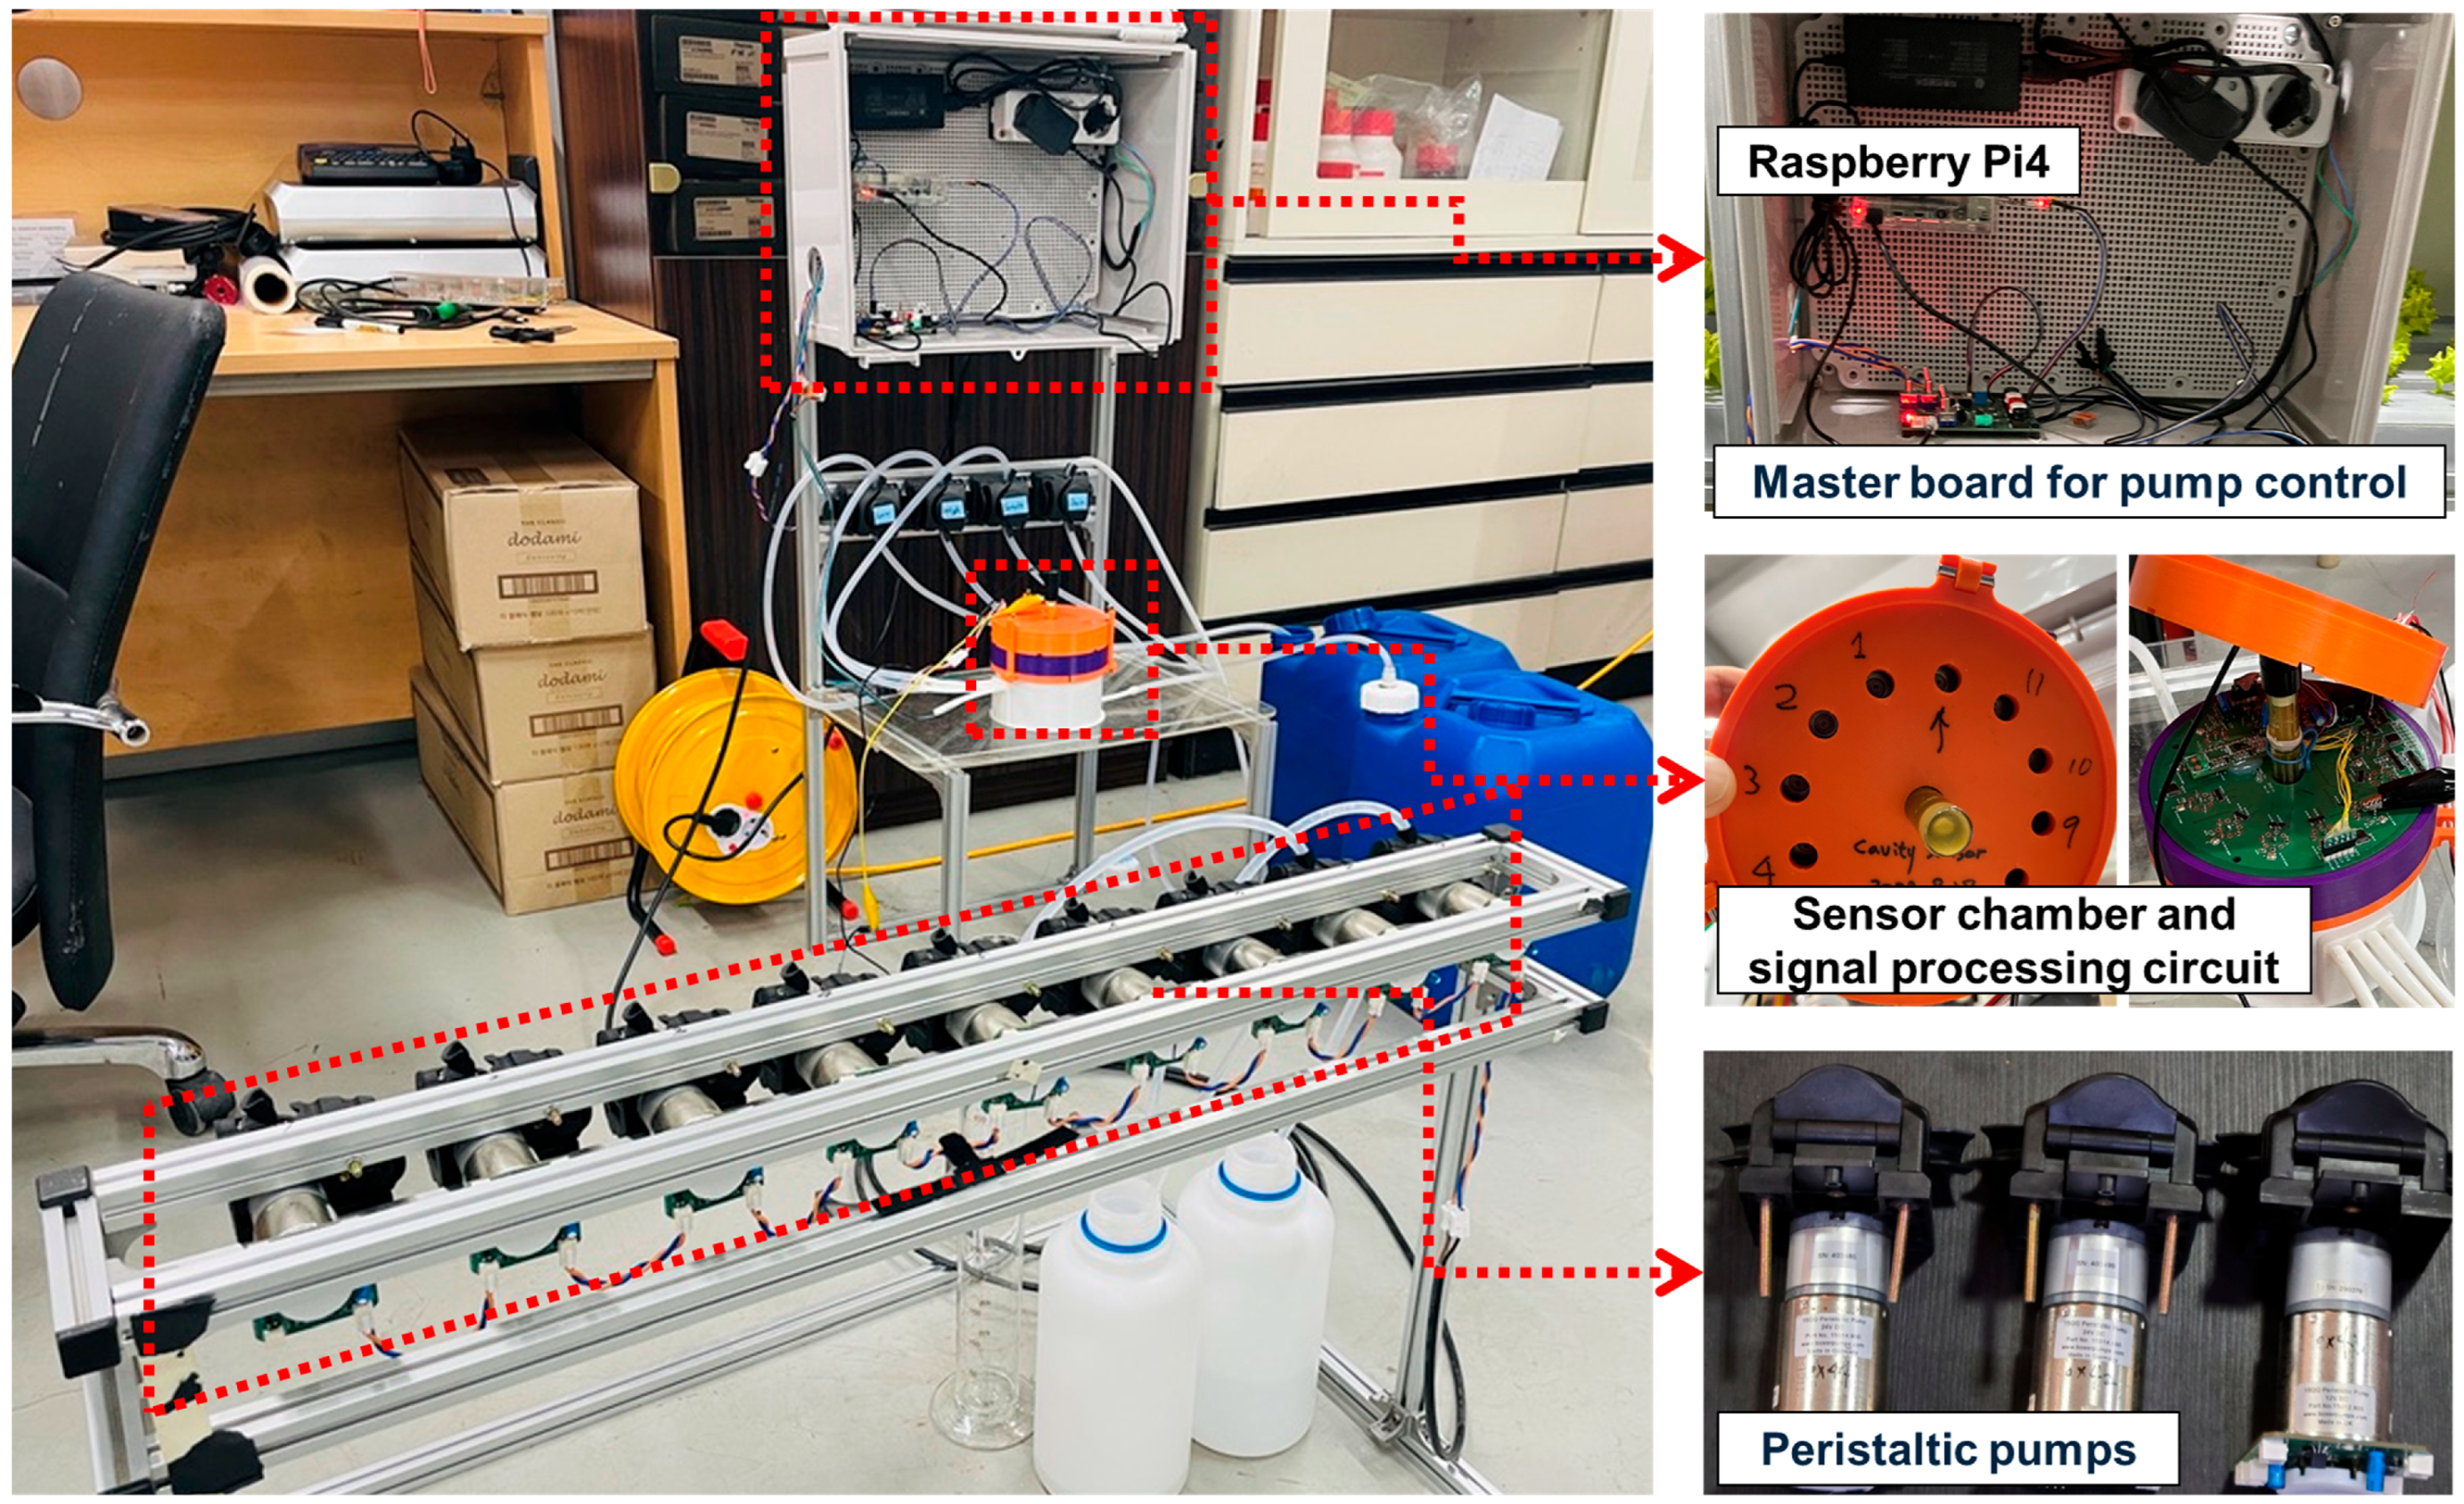
The hardware configuration of the precision nutrient management system consists of an ion monitoring module, a fertilizer supply module, and a control and data processing module (Figure 2). The ion monitoring module comprises multiple ISEs, a double-junction reference electrode, a signal processing circuit, and an analog-to-digital converter (ADC). It is designed to ensure stable simultaneous measurements of multiple ISEs by incorporating signal amplification and noise filtering circuits. The fertilizer supply module consists of eight peristaltic pumps (15QQ peristaltic pump, Boxer GmbH, Ottobeuren, Germany) and a master–slave board-based pump control system (LibERGON, Seoul, Republic of Korea), as required by the decision tree-based ion-specific dosing algorithm [21], which utilizes eight types of fertilizers: Ca(NO3)2·4H2O, KH2PO4, NH4H2PO4, KNO3, NH4NO3, MgSO4·7H2O, and K2SO4, as well as micronutrients. The control and data processing module is implemented using a Python v.3.9-based program, which performs ISE signal processing, two-point normalization, and calculation of individual fertilizer requirements using the decision tree-based ion-specific dosing algorithm. This enables real-time adjustment of nutrient solution ion concentrations through hardware control. For two-point normalization, two normalization solutions were used for NO3 (100 and 1000 mg L−1), K (30 and 300 mg L−1), and Ca (40 and 400 mg L−1) to determine the slope and offset values.

2.3. Monitoring Performance

Before applying the nutrient management system to lettuce cultivation, its measurement performance was evaluated using a set of unknown nutrient solutions. Following two-point normalization, ion concentrations of NO3, K, and Ca in five unknown samples were measured, with a stabilization time of 120 s for each ISE. three NO3 ISEs, three K ISEs, and two Ca ISEs were simultaneously operated in the electrode measurement chamber alongside a double-junction reference electrode.
All measurements were conducted at room temperature (21–23 °C) to minimize temperature-induced variations in electrode potential. The measured ion concentrations were compared against reference values obtained using ion chromatography performed by an accredited water quality analysis center (NICEM, Seoul, Republic of Korea). This comparison was used to assess the accuracy and reliability of the developed ISE-based monitoring system.

2.4. Application of the Precision Nutrient Management System to Lettuce Cultivation in a Plant Factory

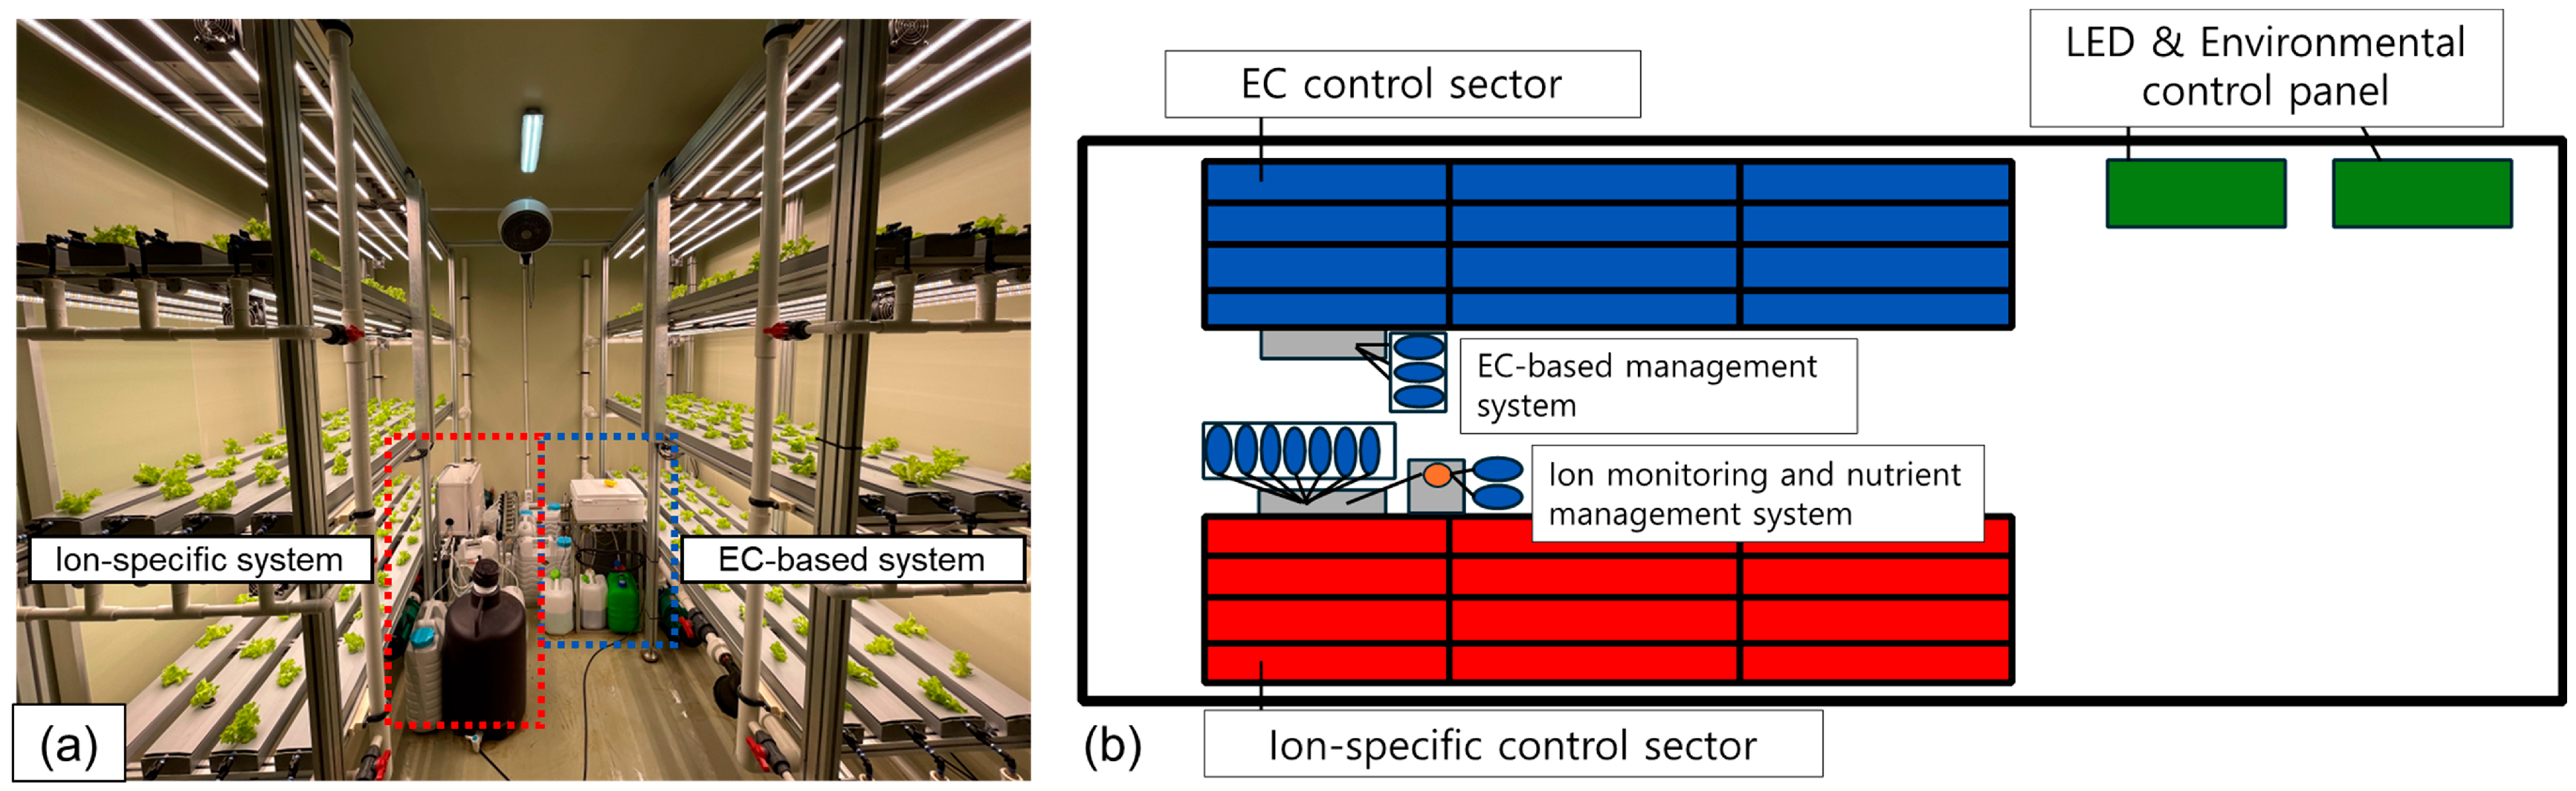
An application test for lettuce cultivation was conducted at a container-type plant factory testbed located on the experimental farm of Seoul National University (Suwon, Gyeonggi, Republic of Korea, latitude 37.3° N, longitude 127.0° E). The cultivation method used was the nutrient film technique (NFT), and an embedded system-based environmental control module, as shown in Figure 3a, was implemented. Artificial lighting was provided using 400–700 nm full-spectrum LEDs (Future Green, Yongin, Gyeonggi, Republic of Korea). A 220 V 1-horsepower pump circulated the nutrient solution from the mixing tank to the NFT beds. The cultivation system consisted of two separate three-layer NFT beds, with a maximum cultivation capacity of 144 plants per group, totaling 288 plants for the entire system. The mixing tank had a total capacity of 120 L (with a working volume of 101.3 L), and individual dosing tanks for stock solutions were 5 L each. A bypass pipe was installed to prevent overflow caused by the excess nutrient solution added to the mixing tank due to raw water input. Additionally, an ultrasonic level sensor was incorporated to enable precise monitoring of the mixing tank’s water level.
For air circulation within the plant factory, a circulator was installed at the top center of the testbed for overall airflow, while 24 V DC fans were mounted on each bed layer to create micro-airflows. Temperature and humidity were controlled using air conditioners, and sensors were installed for real-time monitoring and regulation of indoor conditions. An embedded-based control module was integrated, enabling remote management through wired LAN and Wi-Fi. Additionally, each module was configured to support remote access via virtual network computing (RealVNC, Cambridge, UK). The cultivation beds inside the plant factory were divided into treatment and control groups, enabling the application of two different nutrient management systems—an ion-specific management and an electrical conductivity (EC)-based management system—within the same cultivation environment, as shown in Figure 3b.
Ezabel lettuce (Lactuca sativa ‘Ezabel’) was selected for the cultivation experiment. A total of 288 seedlings were transplanted, providing 144 plants for each of the treatment (ion-specific) and control (EC-based) groups (n = 144 per group). The photoperiod was set to 18 h of light and 6 h of darkness, and the temperature conditions were maintained between 18 °C and 20 °C, considering the optimal growth range of 15–20 °C for lettuce. The photoperiod was also adjusted to account for summer conditions, avoiding turning on the lighting from 12 PM to 6 PM to reduce cooling load and power consumption during peak temperature hours. The cultivation period was set to four weeks after transplanting, considering the typical 30–40-day growing period for lettuce. The experiments were conducted three times over 12 weeks in August, September, and October without replacing the nutrient solution to align with the fundamental goal of ion-specific nutrient management: achieving zero discharge [21]. Target concentrations for the nutrient solution were fixed at 434 mg/L for NO3, 156 mg/L for K, and 80 mg/L for Ca, with the target water level in the mixing tank set to 101.3 L.
Ion monitoring was conducted by collecting drainage into the mixing tank at 4 PM when the lights turned off, in accordance with the photoperiod. Based on the ion concentrations in the drained solution and the volume of remaining solution, the required amounts of individual fertilizers were calculated. Following the addition of individual fertilizers, water was supplied to reach the target level. Ion monitoring and dosing were carried out during the dark period to prevent nutrient deficiencies during the growth phase. The concentrations of individual fertilizers are shown in Table 1.
Crops were cultivated under the same conditions using an EC-based system for comparison with ion-specific management. During the cultivation period, the nutrient solution’s target pH and EC were set to ranges recommended for lettuce cultivation: pH 6–7 and EC 1.2–1.7 dS/m, within the general recommendations of pH 5.5–7 and EC 1.0–2.0 dS/m. An EC sensor (KF Co., Ltd., Anseong, Republic of Korea) and a pH sensor (ECFC7252203B, Thermo Scientific Eutech, Singapore) were connected to a commercial transmitter (KF Co., Ltd., Anseong, Republic of Korea). A peristaltic pump (24 V 15QQ, Boxer pumps, Ottobeuren, Germany) was used to supply commercial EC solutions (Daeyu stock solution A and B, Daeyu Co., Ltd., Goesan, Republic of Korea) and a phosphate solution for pH adjustment to the mixing tank. The concentrations of solutions A, B, and the acidic solution are shown in Table 2. At 4 PM, the circulation pump was stopped to collect the drainage from the cultivation beds into the mixing tank, after which water was supplied to the target level. The diluted nutrient solution’s EC and pH levels were measured. If the EC or pH deviated from the target range, solutions A, B, and the phosphoric acid solution were added. Due to the high concentration and acidity of these solutions, the adjustment volumes were small and had minimal impact on the overall nutrient solution volume. Therefore, EC and pH adjustments were conducted after refilling the mixing tank with water. The nutrient solution was newly prepared at the start of each cultivation cycle and discarded after the cultivation period.
To compare the ion-specific management system and the EC-based system, water-use efficiency (WUE) and fertilizer-use efficiency (FUE) were utilized. WUE, established by Briggs and Shantz [23], represents the measured biomass per unit of water consumed, allowing for comparisons across various crop production systems, including greenhouse and field production. Similarly, FUE evaluates the measured biomass per unit of fertilizer used. In this study, WUE and FUE were calculated over the full cultivation cycle using Equation (1) for water consumption and Equation (2) for fertilizer consumption relative to crop yield.
W U E = T o t a l   y i e l d   [ g   F W ] W a t e r   c o n s u m p t i o n   [ L ]
F U E = T o t a l   y i e l d   [ g   F W ] F e r t i l i z e r   c o n s u m p t i o n   [ g ]

2.5. Evaluation of Environmental Impacts Using Life Cycle Assessment

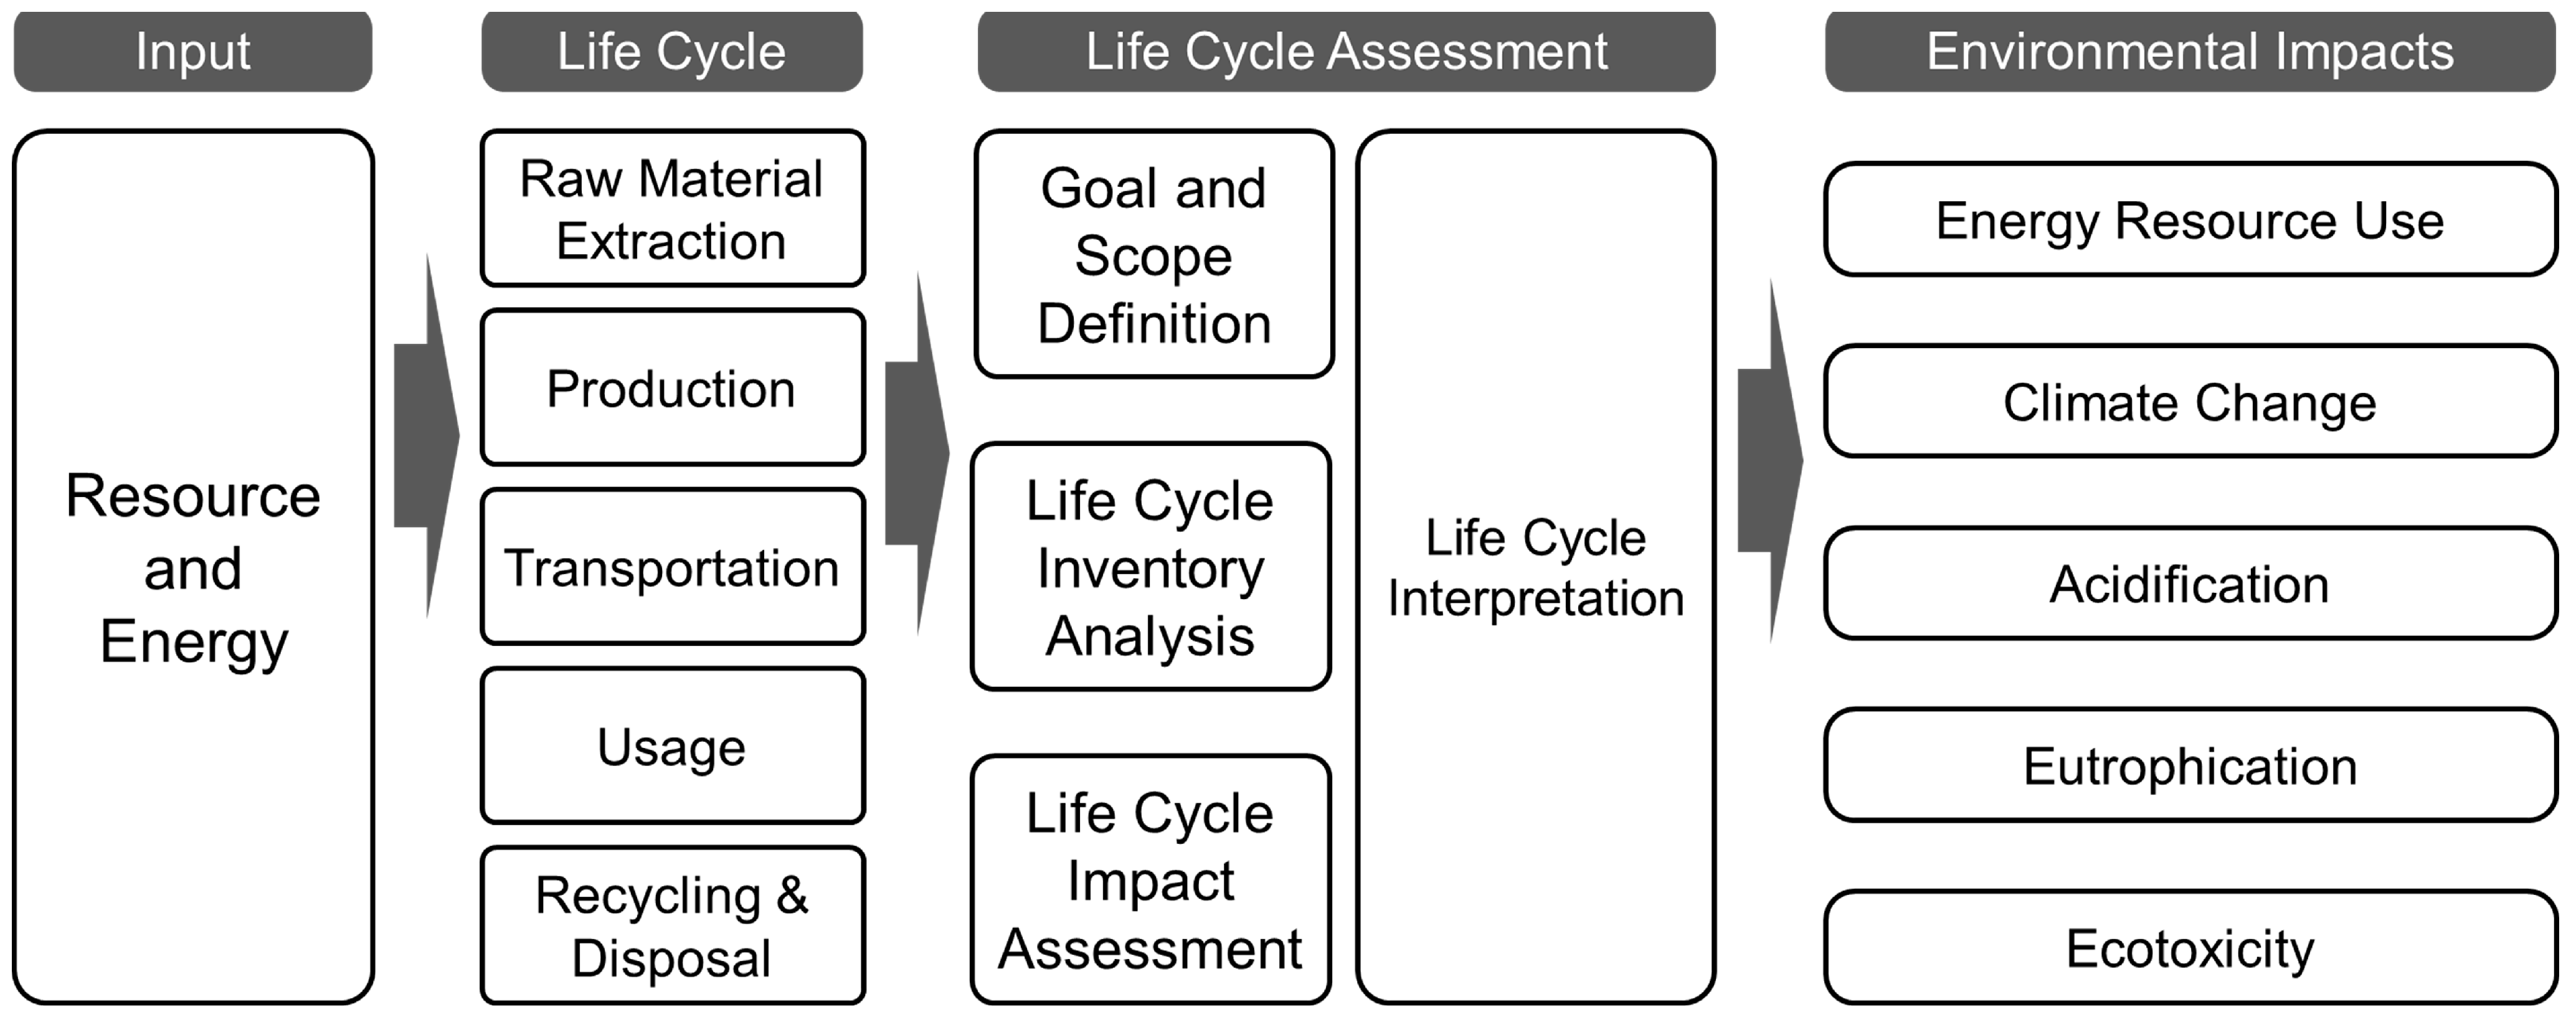
The precision nutrient management system developed for a closed hydroponic system and the EC-based system applied in the plant factory were quantitatively compared in terms of energy consumption, nutrient solution usage, total biomass, and waste generation during cultivation. Life cycle assessment (LCA) was employed for this analysis. LCA systematically evaluates the environmental impacts associated with a product or service throughout its entire life cycle, from raw material extraction to disposal, based on the framework provided by ISO 14040 and ISO 14044 standards [24,25]. This assessment considers all stages, including raw material extraction, production, transportation, usage, disposal, and recycling, focusing on resource consumption and pollutant emissions. The primary objective of LCA is to quantify environmental impacts and enhance sustainability. LCA comprises four main stages: (1) goal and scope definition to set evaluation objectives and boundaries; (2) inventory analysis to quantify resource inputs and emissions; (3) impact assessment to evaluate environmental effects; and (4) interpretation to analyze results for informed decision-making (Figure 4).
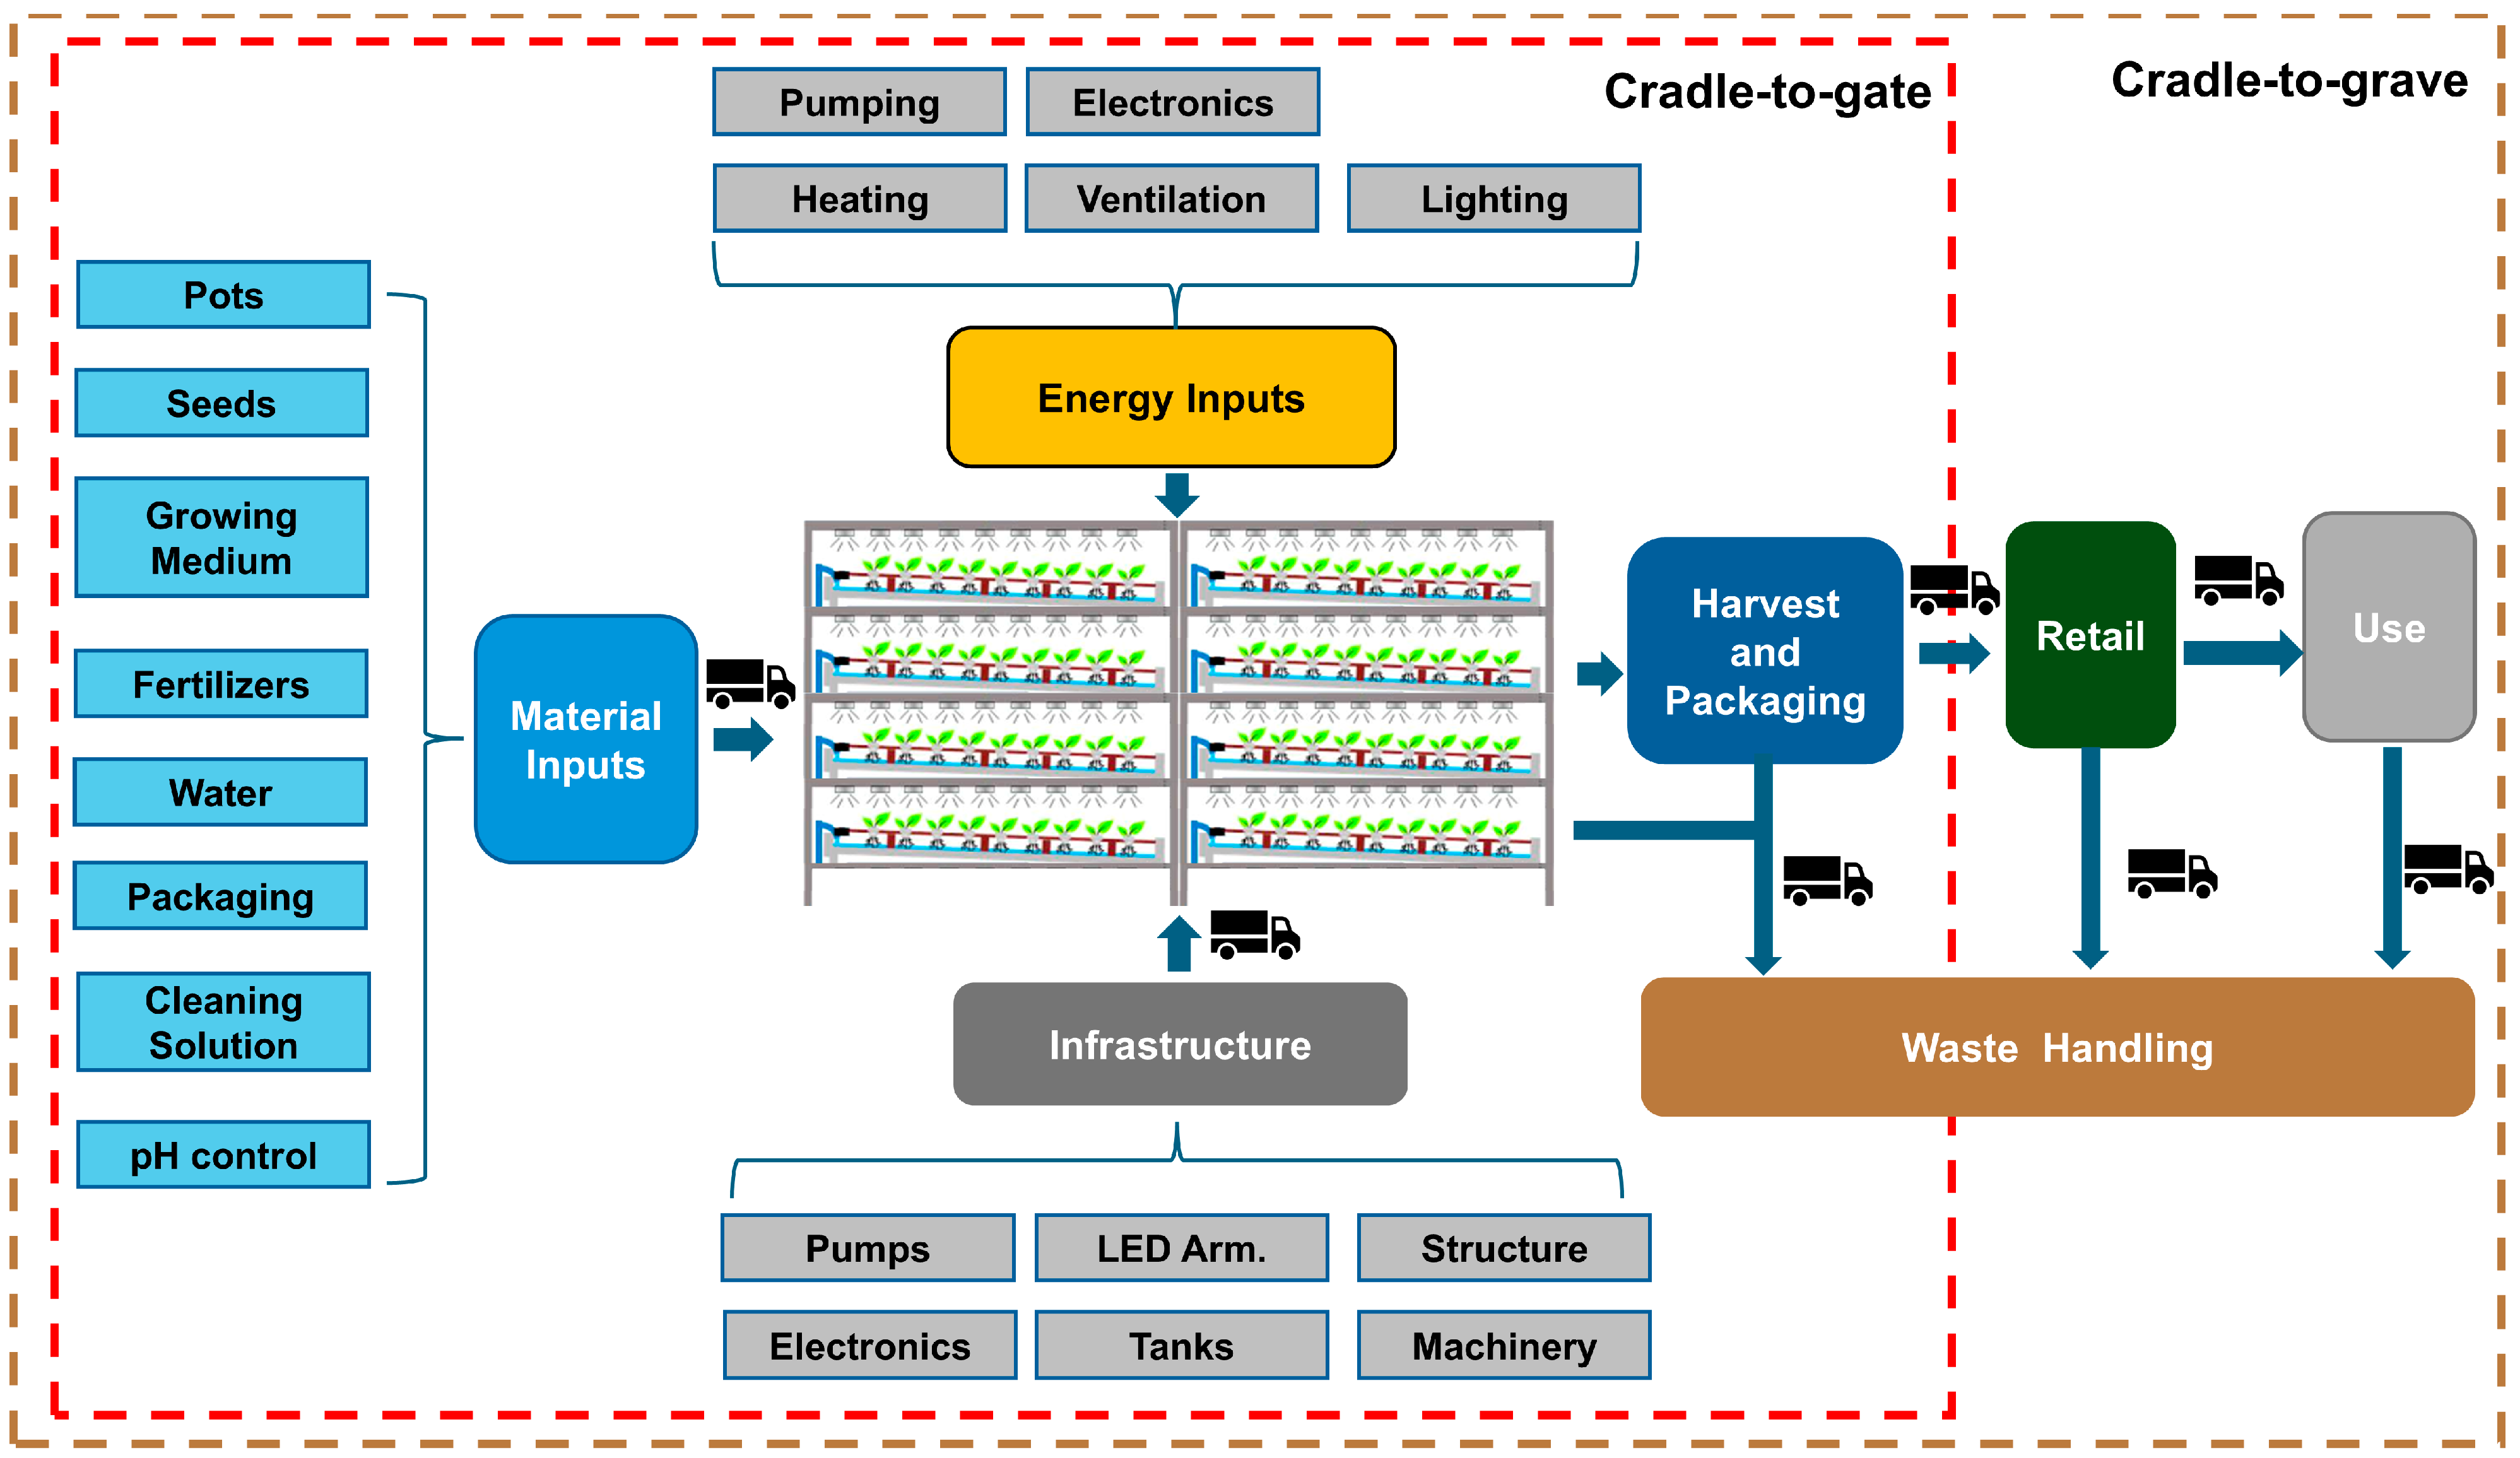
The system boundaries are generally divided into cradle-to-grave and cradle-to-gate approaches. In this study, a cradle-to-gate method was adopted, focusing specifically on the cultivation and production stages without extending the analysis to the crop consumption phase. The system boundary details are depicted in Figure 5.
The resources and energy inputs for LCA were quantified through the life cycle inventory (LCI). The lifespan of materials was defined based on reported studies [11]: aluminum (30 years); polypropylene tubes, tanks, and cultivation beds (10 years); UV lamps (20 years); pumps (10 years); and LEDs (8 years). For LEDs, following a previous study [26], a weight distribution of 80% aluminum, 10% plastic, 5% diodes, and 5% wiring was assumed. Regarding crop harvest, the total fresh weight was measured and used as the production output, without considering the marketable quality. OpenLCA v. 2.0.3 (GreenDelta, Berlin, Germany) was employed for LCA, using Ecoinvent v. 3.10 and Agribalyse v. 3.1.1 databases, assessed via the Environmental Footprint v. 3.0 LCIA method.

2.6. Statistical Analysis

Statistical analyses were performed to compare the total fresh weight, water-use efficiency (WUE), and fertilizer-use efficiency (FUE) of the ion-specific nutrient management system and the conventional EC-based system. To evaluate significant differences between the two treatment groups, independent two-sample t-tests (Student’s t-test) were conducted. All statistical analyses were carried out using SAS software (Version 9.4, SAS Institute Inc., Cary, NC, USA).

3. Results

3.1. System Validation

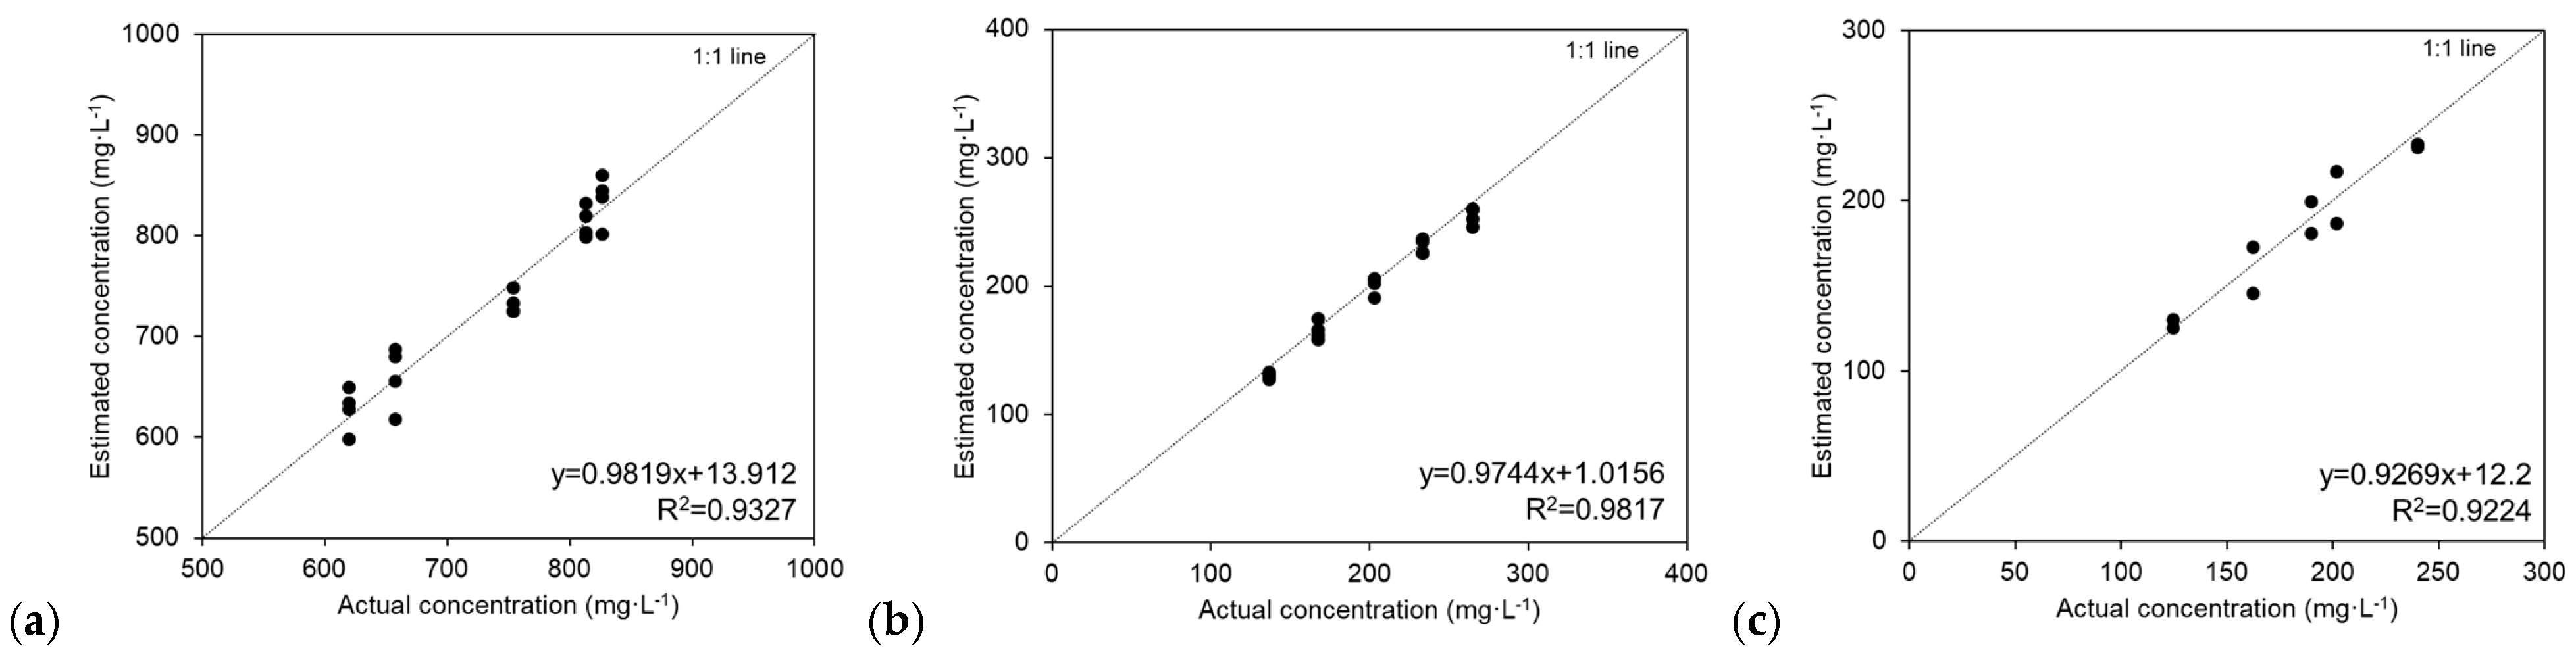
Figure 6a illustrates the system’s performance in estimating NO3 concentrations in unknown samples, demonstrating a strong linear correlation with ion chromatography (slope: 0.98, coefficient of determination (R2): 0.93, and root mean square error (RMSE): 21.8 mg·L−1). Similarly, the system’s performance in estimating K concentrations showed a slope of 0.97, R2 of 0.98, and RMSE of 7.43 mg·L−1 (Figure 6b). For Ca, the results indicated a slope of 0.92, R2 of 0.92, and RMSE of 10.85 mg·L−1 (Figure 6c). These results demonstrate the system’s applicability to lettuce cultivation in plant factories.

3.2. Evaluation of Lettuce Growth and Physiology Under Different Nutrient Management Strategies

For lettuce cultivation, the target nutrient concentrations for the specific management system were set to NO3: 434 mg/L, K: 156 mg/L, and Ca: 80 mg/L. The EC-based management system was adjusted to maintain a pH range of 6–7 and an EC range of 1.2–1.7 dS/m.
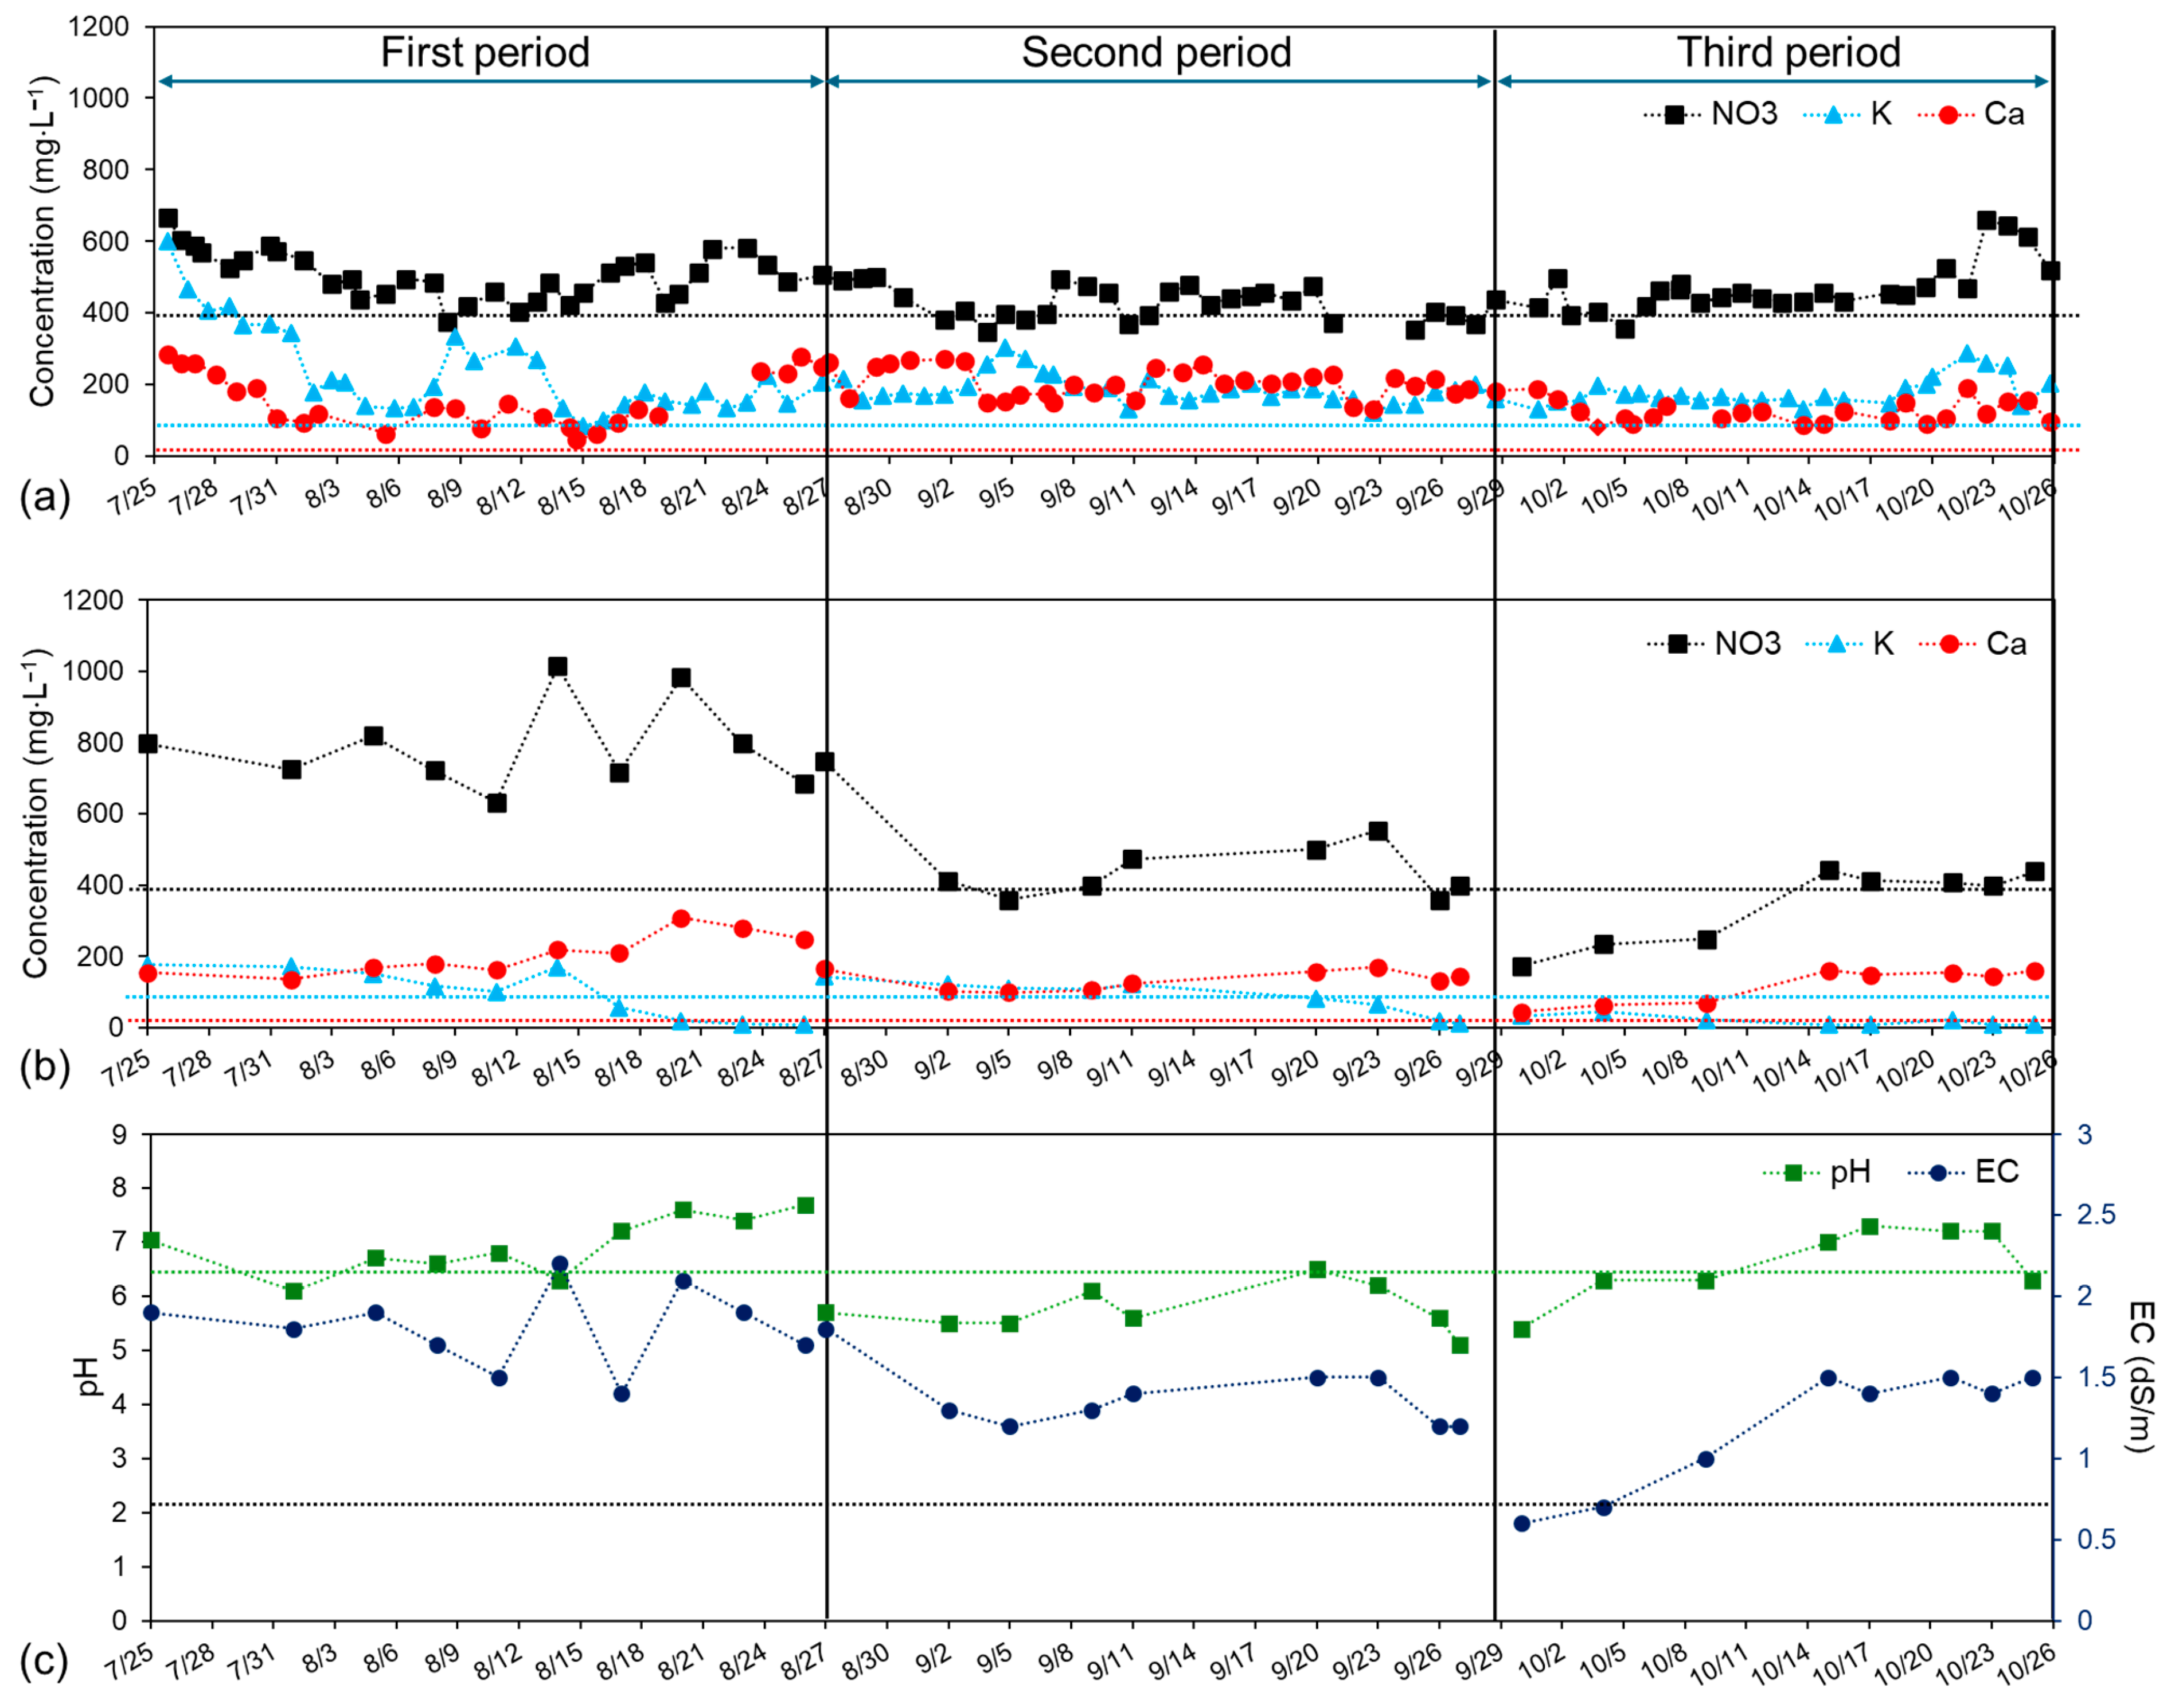
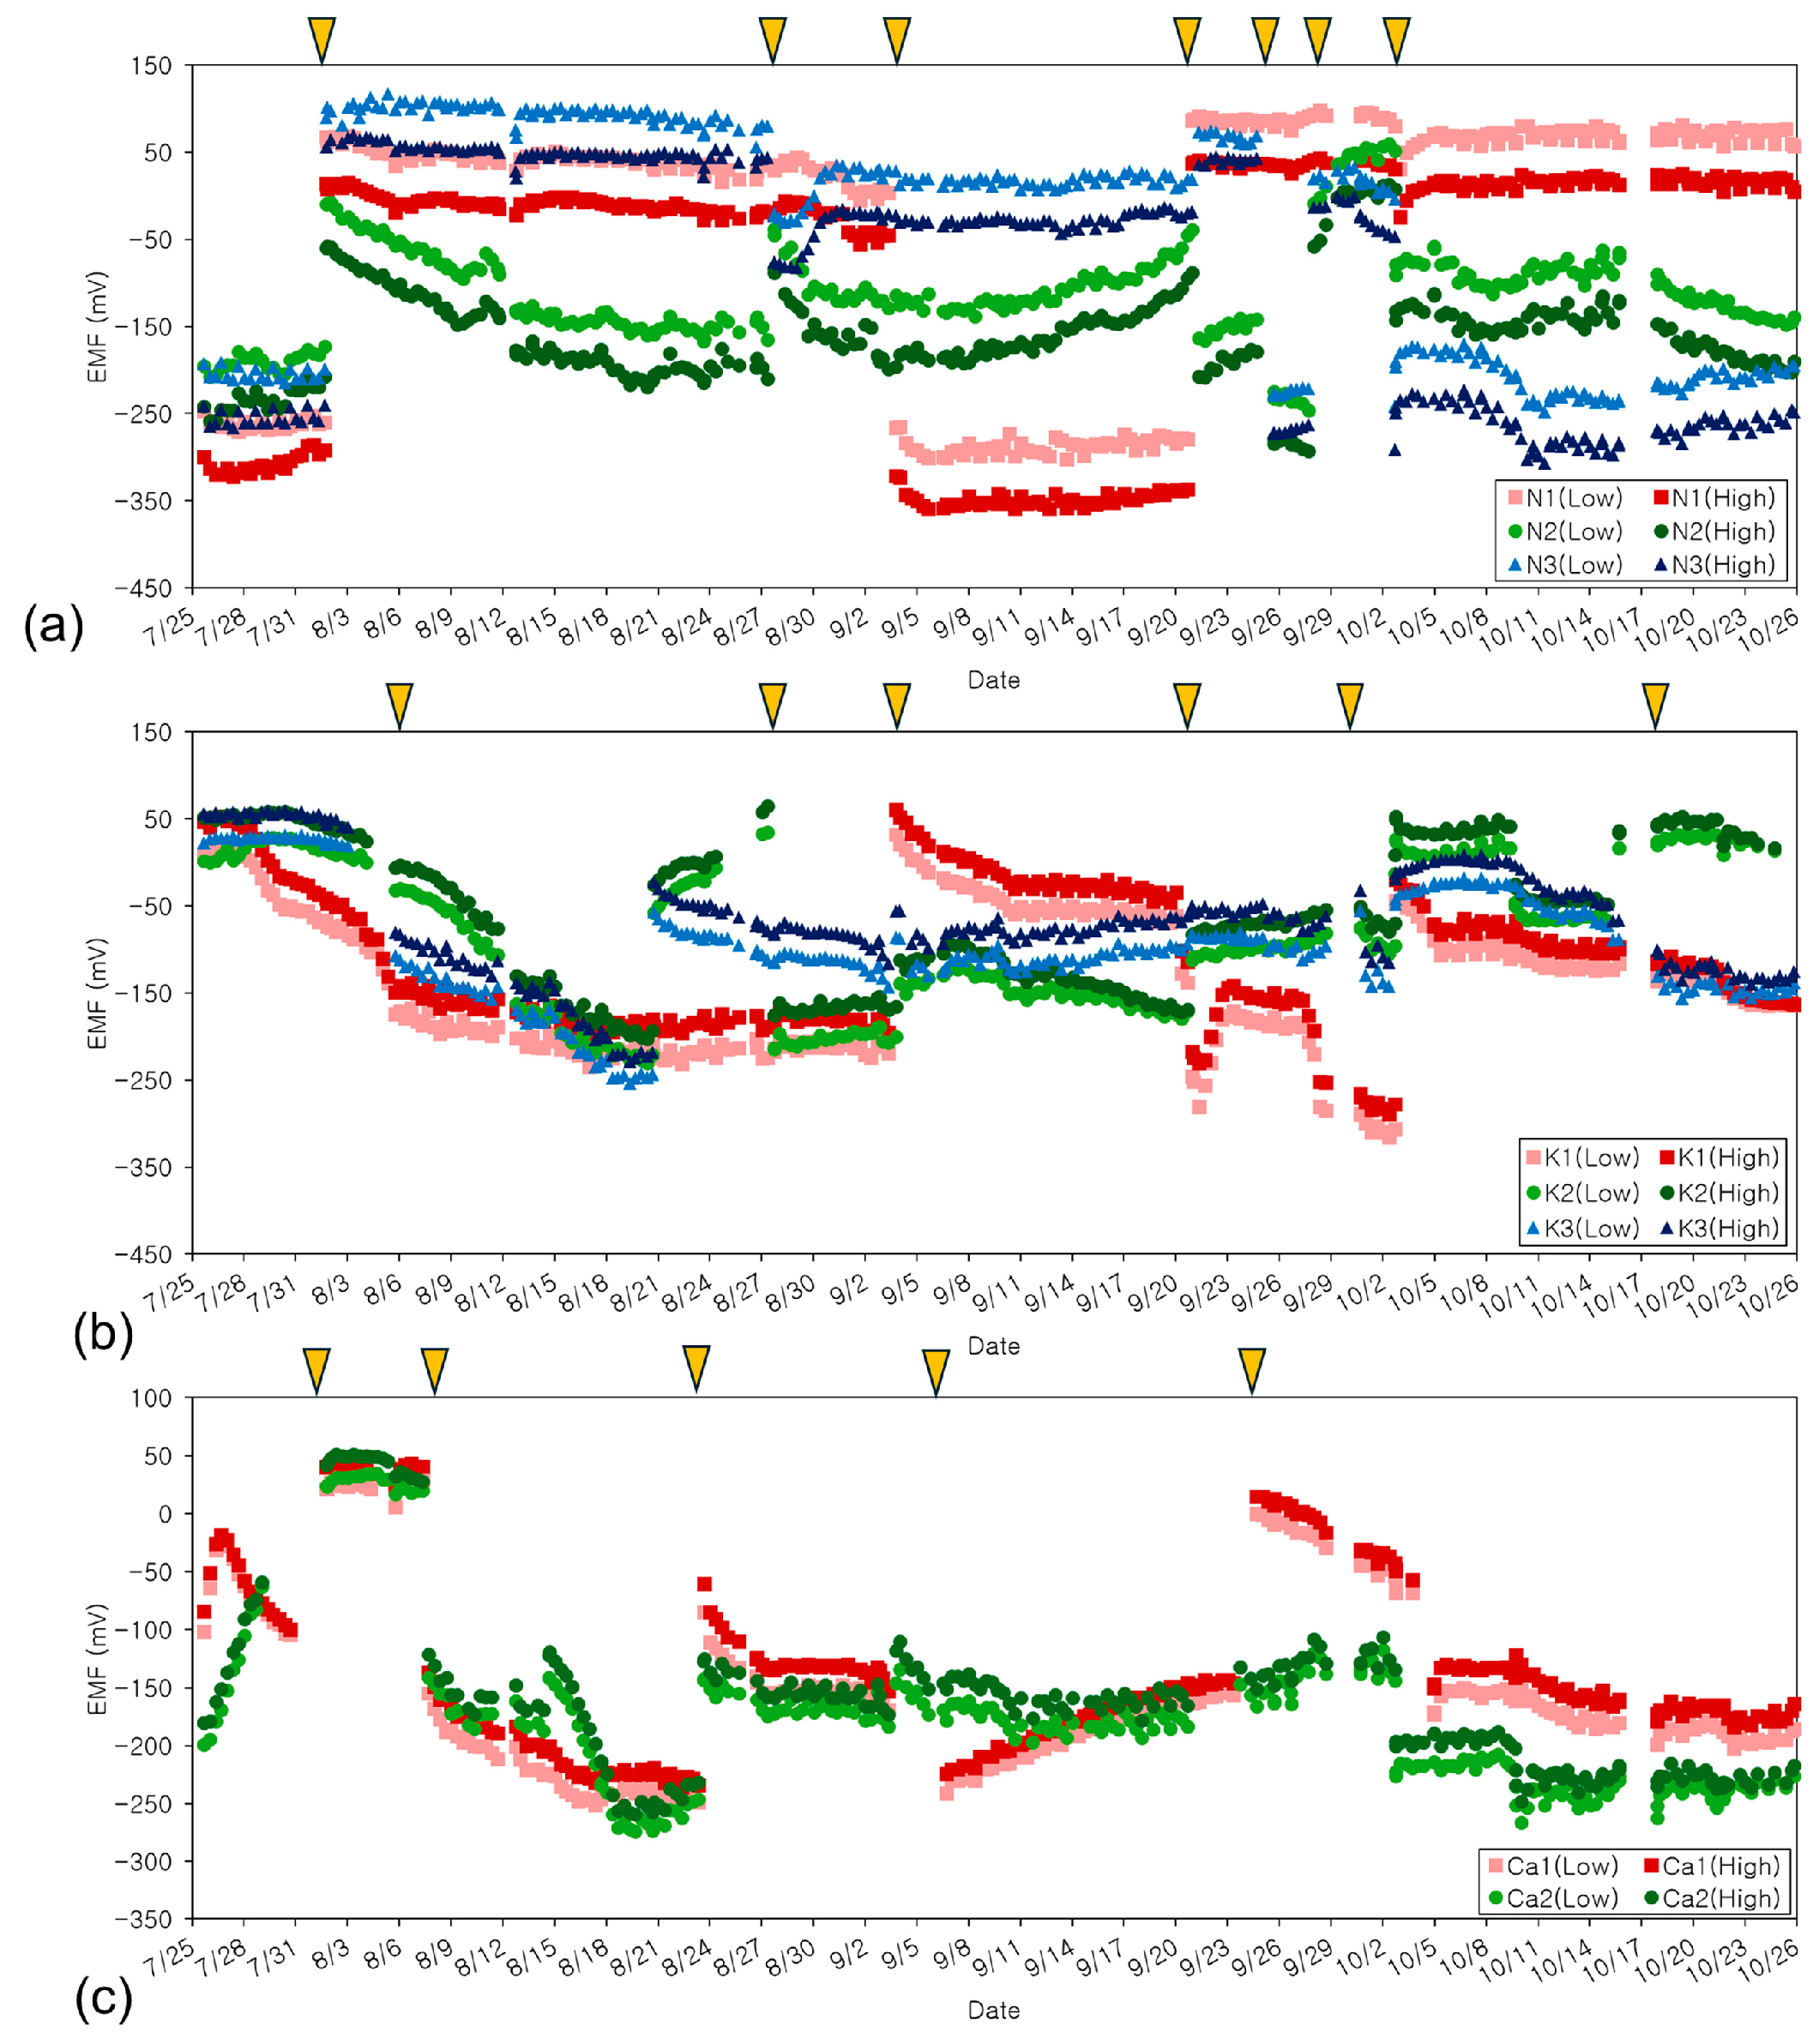
During the experiment, the stability of the ISEs was monitored through daily signal potentials of the two-point normalization solutions (Appendix A, Figure A1). While signal drifts were observed, the automated normalization protocol effectively maintained measurement accuracy by compensating for the drifts. Electrodes were replaced only when sensitivity significantly deviated or noise increased, ensuring a functional lifespan of 4–6 weeks. Changes in ion concentrations under the specific management system are presented in Figure 7a, while the ion concentration changes under the EC-based system are shown in Figure 7b.
To compare ISE measurements with standard analysis during the cultivation period, nutrient solution samples were taken from the mixing tank every 3–5 days and sent to NICEM for analysis. Over three cultivation cycles, the monitored results showed RMSEs of 51.66 mg·L−1 for NO3 and 19.30 mg·L−1 for Ca. Notably, the K ion concentration under ion-specific management was maintained with an RMSE of 38.8 mg·L−1, while EC-based management failed to sustain K levels, leading to depletion as seen in Figure 7b. Specifically, the K ion concentration under EC-based management experienced significant depletion. Starting at 176 mg·L−1 in early August, the concentration dropped below 8 mg·L−1 by August 26. Similarly, during September, K concentration decreased from 144 mg·L−1 to 12 mg·L−1, and in October, it fell from 33 mg·L−1 to less than 8 mg·L−1. Despite EC and pH remaining within the target ranges, as shown in Figure 7c, K depletion was observed under EC-based management.
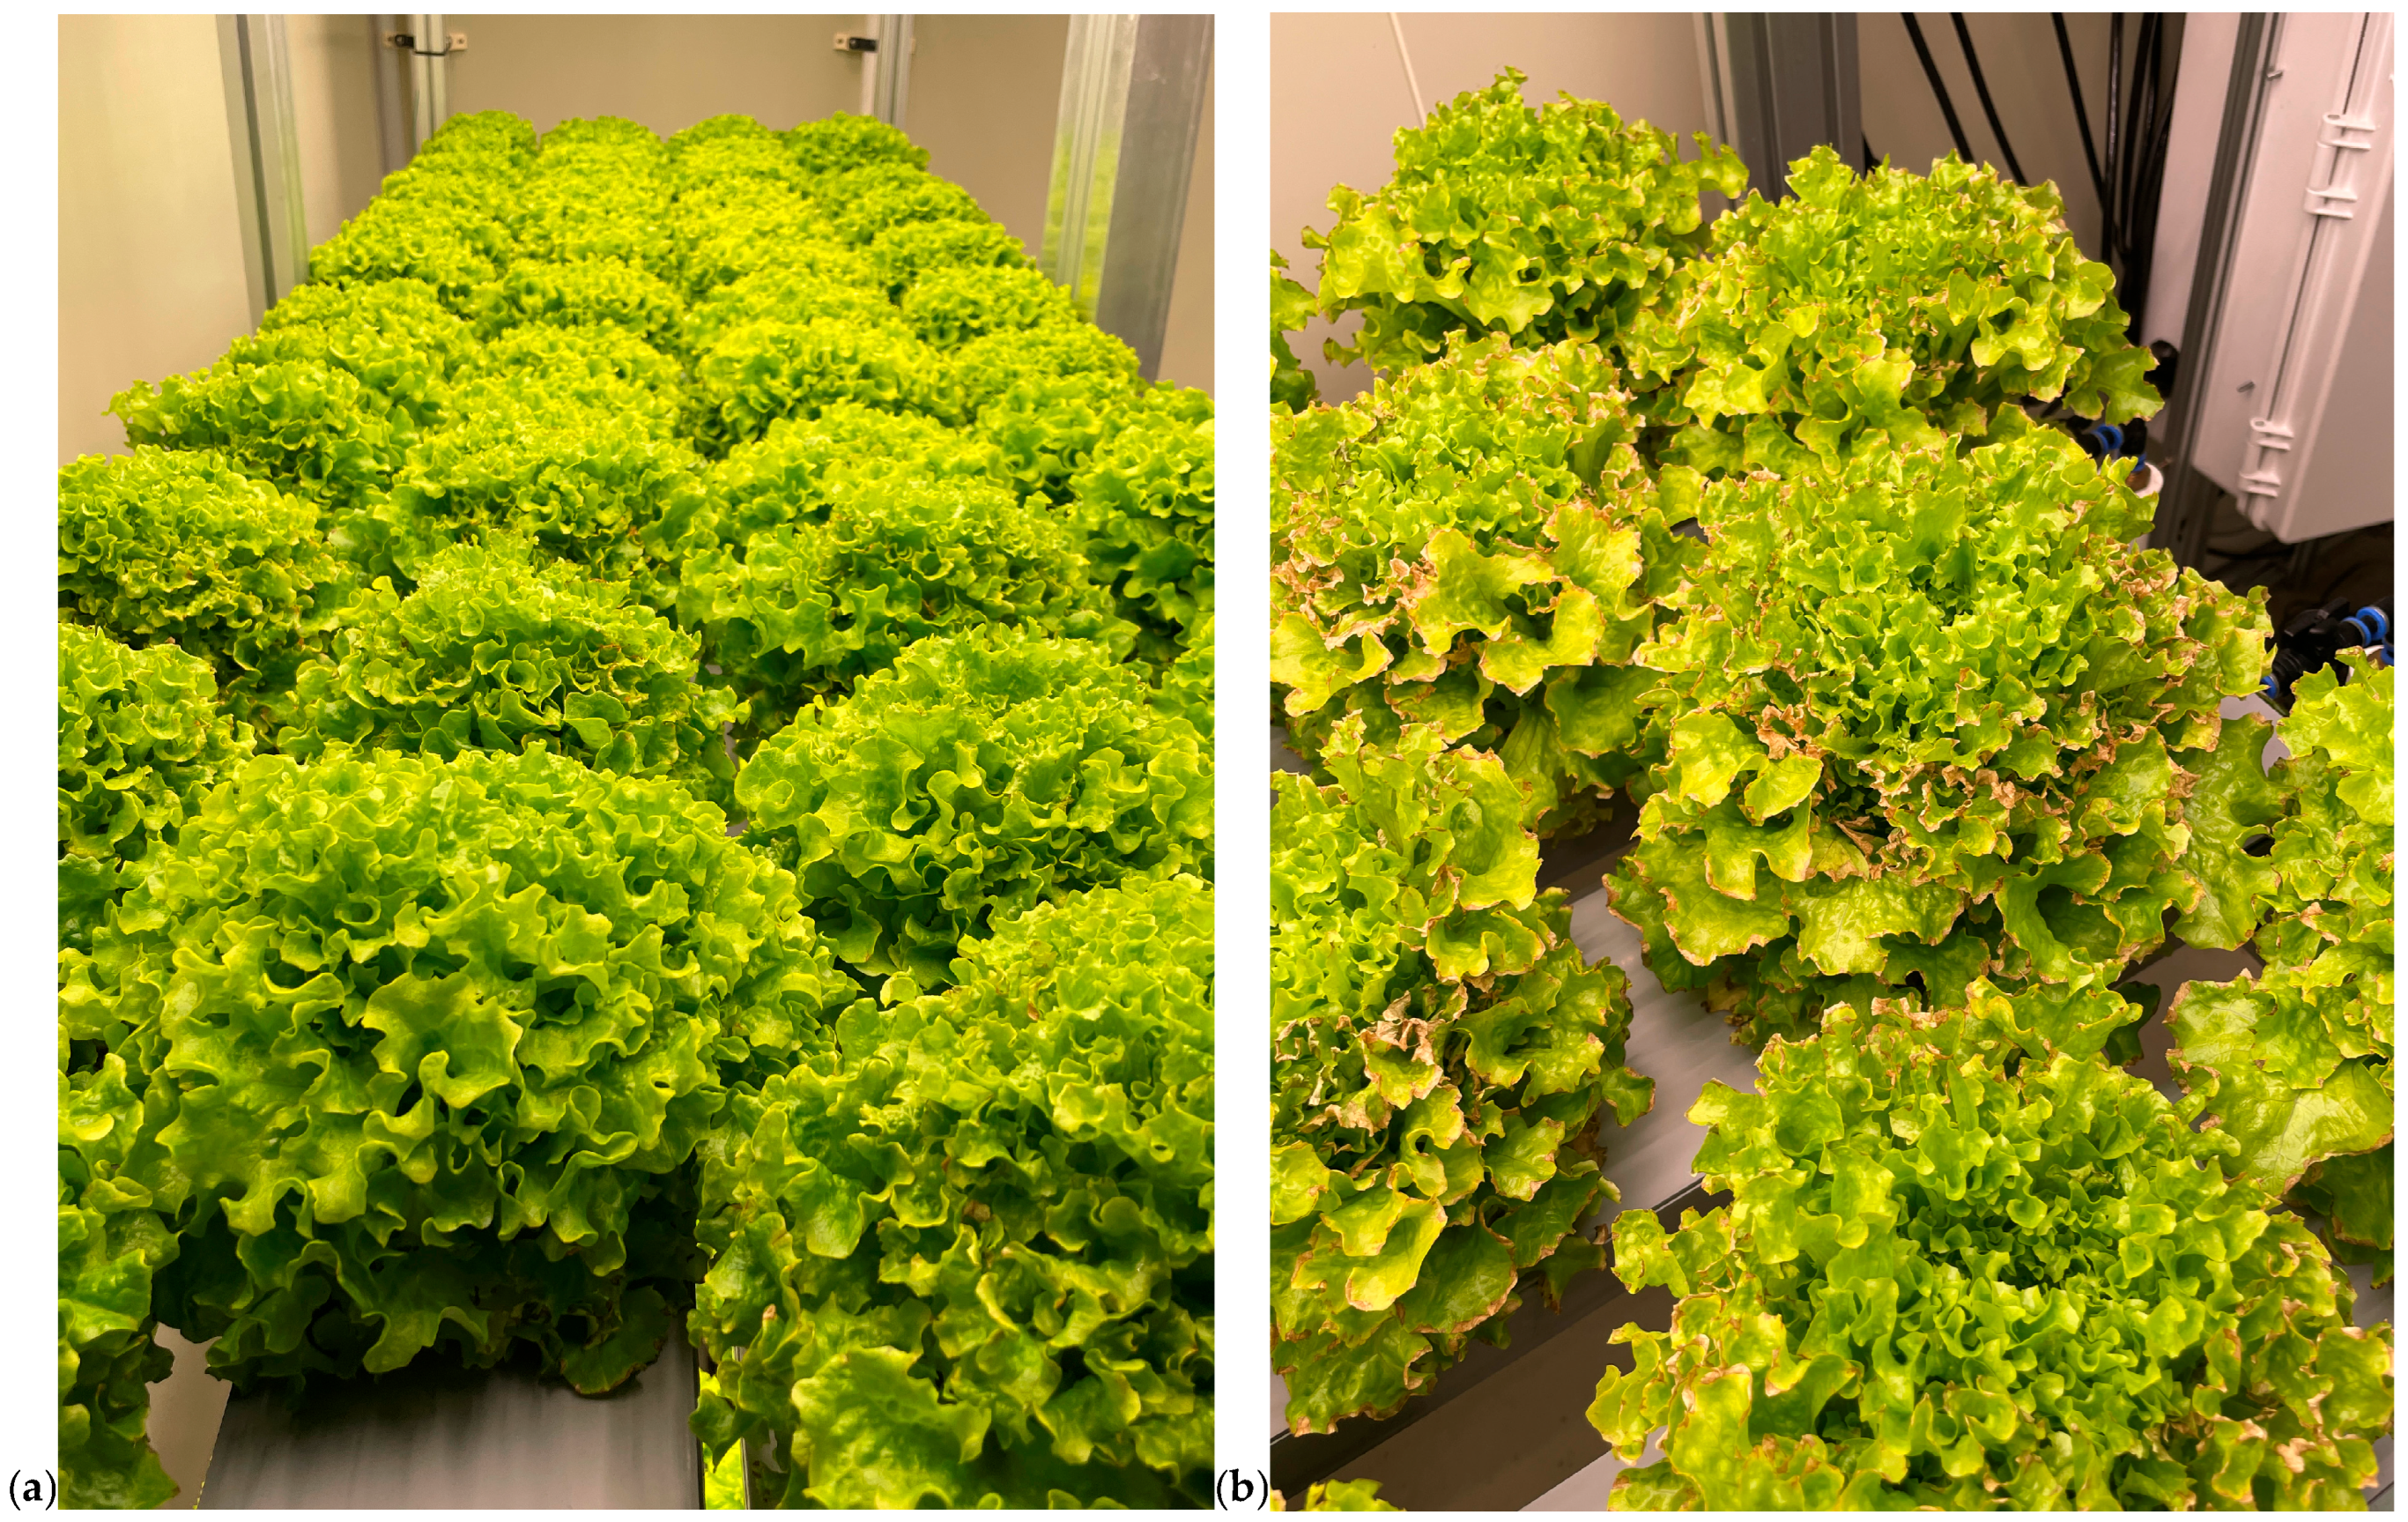
The impact of K ion depletion became more evident in the later period of the cultivation cycle. As shown in Figure 8a, crops managed with the ion-specific management system did not exhibit physiological disorders. In contrast, the EC-based system resulted in substantial physiological damage, as illustrated in Figure 8b.
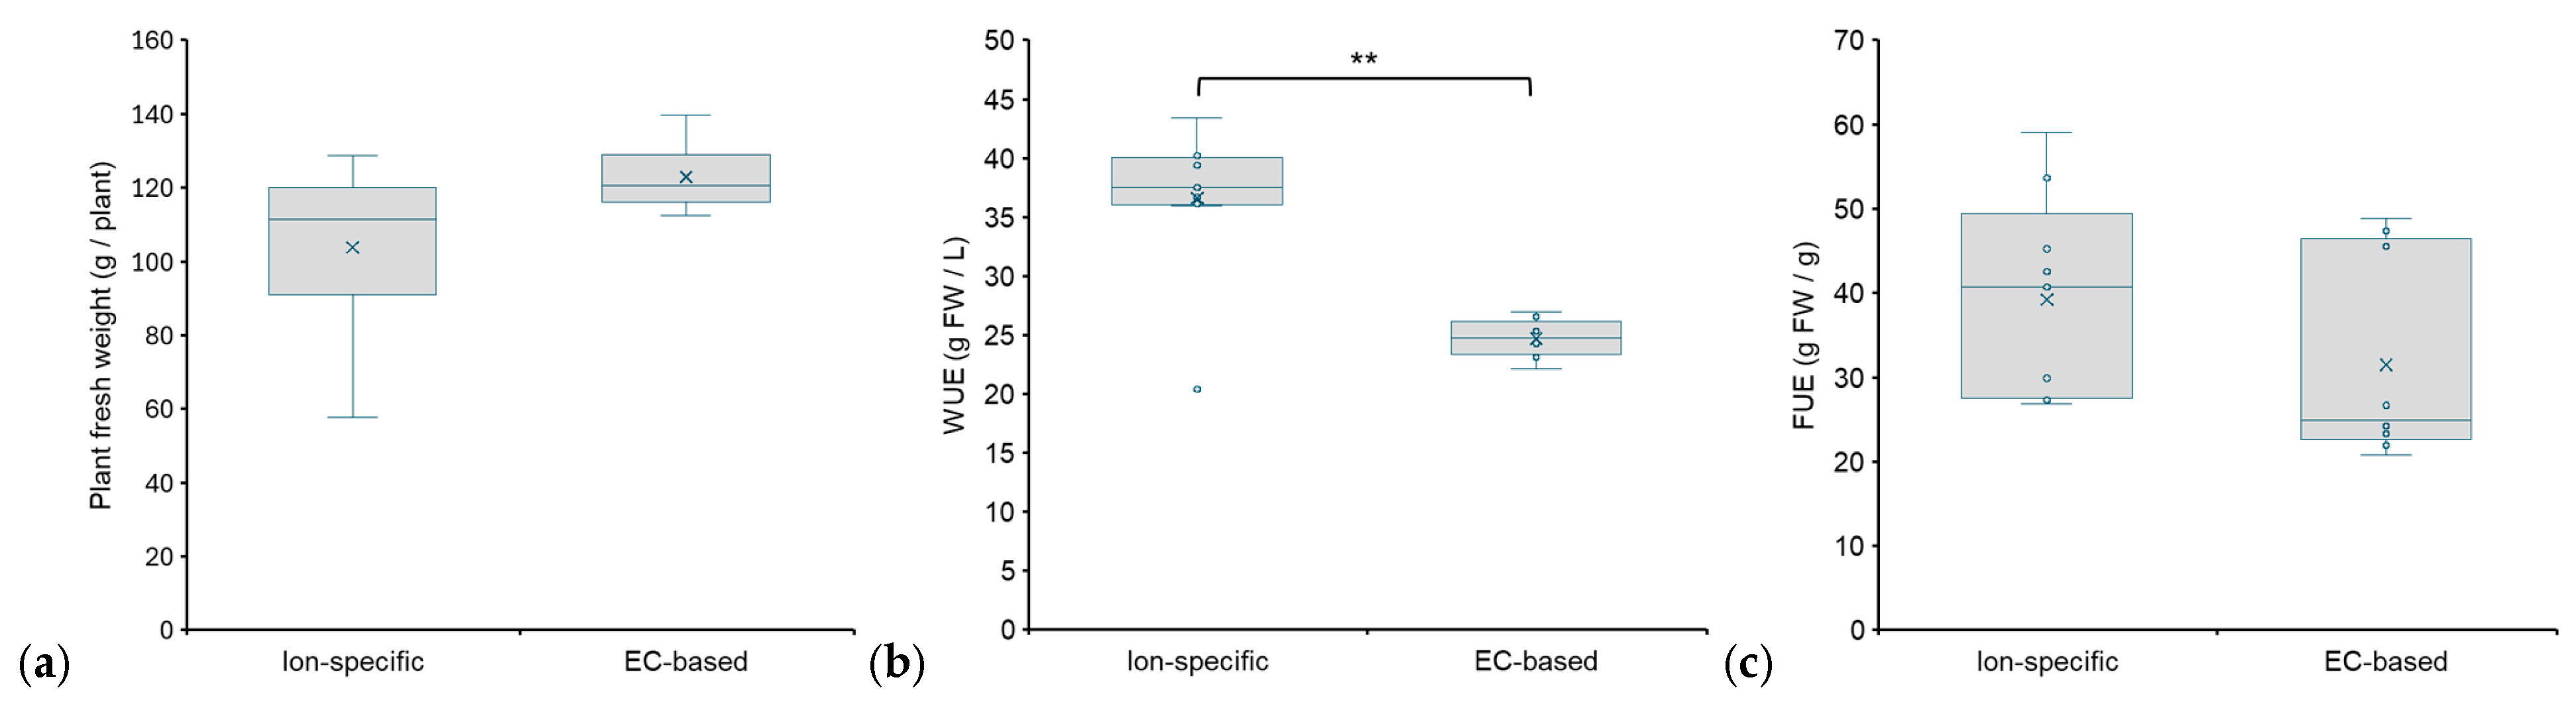
Over the course of three cultivation cycles, the ion-specific management system consumed 1.32 kg of fertilizer and 1225.8 L of water, resulting in a total fresh weight of 44.86 kg (17.37 kg, 14.0 kg, and 13.49 kg of lettuce per cycle). In contrast, the EC-based system used 1.9 kg of fertilizer and 2151 L of water, producing 18.5 kg, 16.8 kg, and 17.7 kg of lettuce, totaling 53.0 kg. The crop yield per cultivation bed, crop biomass, WUE, and FUE of the ion-specific management system and the EC-based management system are summarized in Table 3. Over three cultivation cycles, the average fresh weight per cultivation bed for the ion-specific management system was 4.98 kg, with an average crop biomass of 103.84 g, which was 15.6% lower than the EC-based system’s average fresh weight of 5.9 kg and crop biomass of 122.89 g (Figure 9a). However, despite the lower total fresh weight, the ion-specific management system demonstrated higher efficiency compared to the EC-based management system. Considering water usage for crop cultivation, the ion-specific management system achieved a WUE of 36.63 g FW L−1, which is 48.4% higher than the EC-based management system’s 24.68 g FW L−1 (Figure 9b). Similarly, the FUE of the ion-specific management system was 39.22 g FW g−1, showing a 24.5% improvement compared to the EC-based system’s 31.49 g FW g−1 (Figure 9c).
To analyze the impact of nutrient management systems on WUE, an independent t-test was conducted. The statistical results for WUE showed a p-value of 0.00048, which is significantly lower than the significance level of 0.01. Consequently, it was statistically demonstrated that the ion-specific management system significantly improves WUE compared to the EC-based system. For FUE, the statistical analysis revealed that the p-value was 0.054, which is marginally above the standard significance threshold (p < 0.05). However, considering the 24.5% improvement in efficiency observed in the ion-specific system, the results suggest a practical advantage in saving fertilizer. The findings indicate that, while the difference fell just short of statistical significance due to the limited sample size, there is a clear tendency toward improved resource efficiency.

3.3. Environmental Impacts of Ion-Specific and EC-Based Management

From 25 July to 25 October 2024, data on fertilizer input, water usage, and electricity consumption were collected during crop cultivation in the plant factory. Additionally, the materials used for constructing the plant factory—including their types, quantities, and weights—were estimated through observation and measurement. The materials were analyzed considering their lifespans and the experiment duration. The collected data were compiled into an LCI, detailed in Table 4.
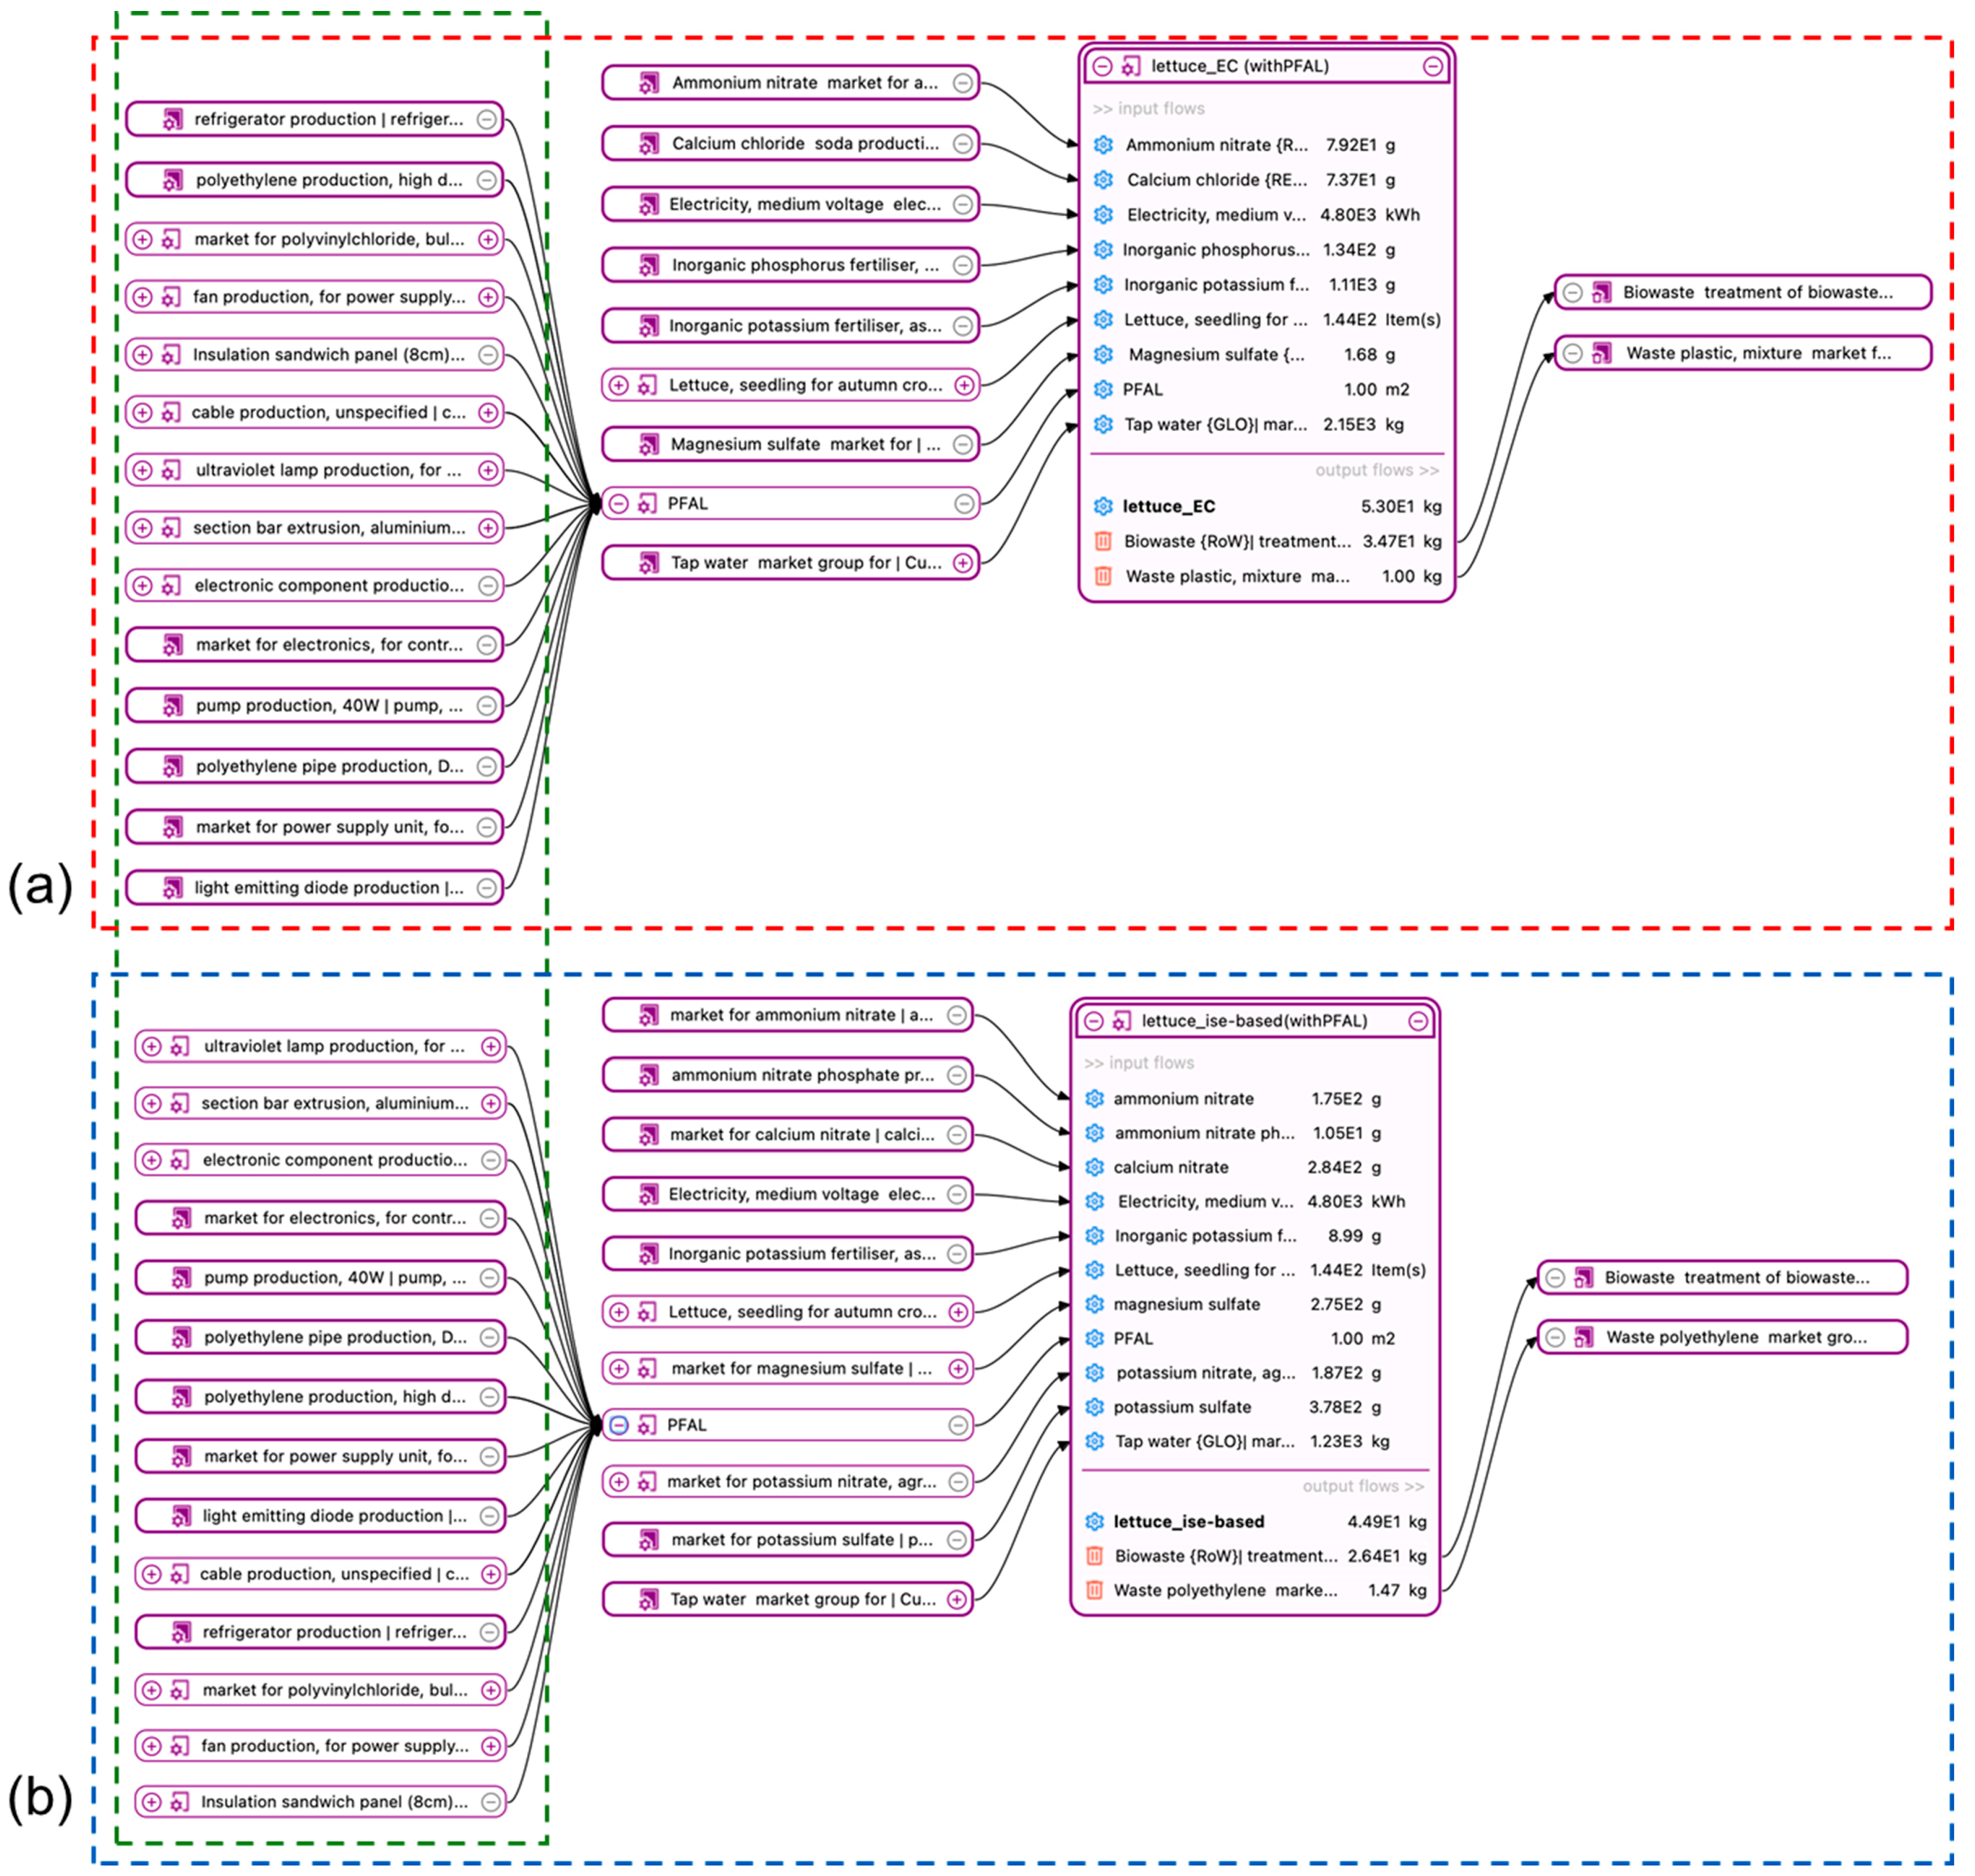
Based on the LCI, process networks were constructed using the LCA database. The process networks include lettuce cultivation under an EC-based management system (Figure 10a) and lettuce cultivation under ion-specific management (Figure 10b), both incorporating the plant factory.
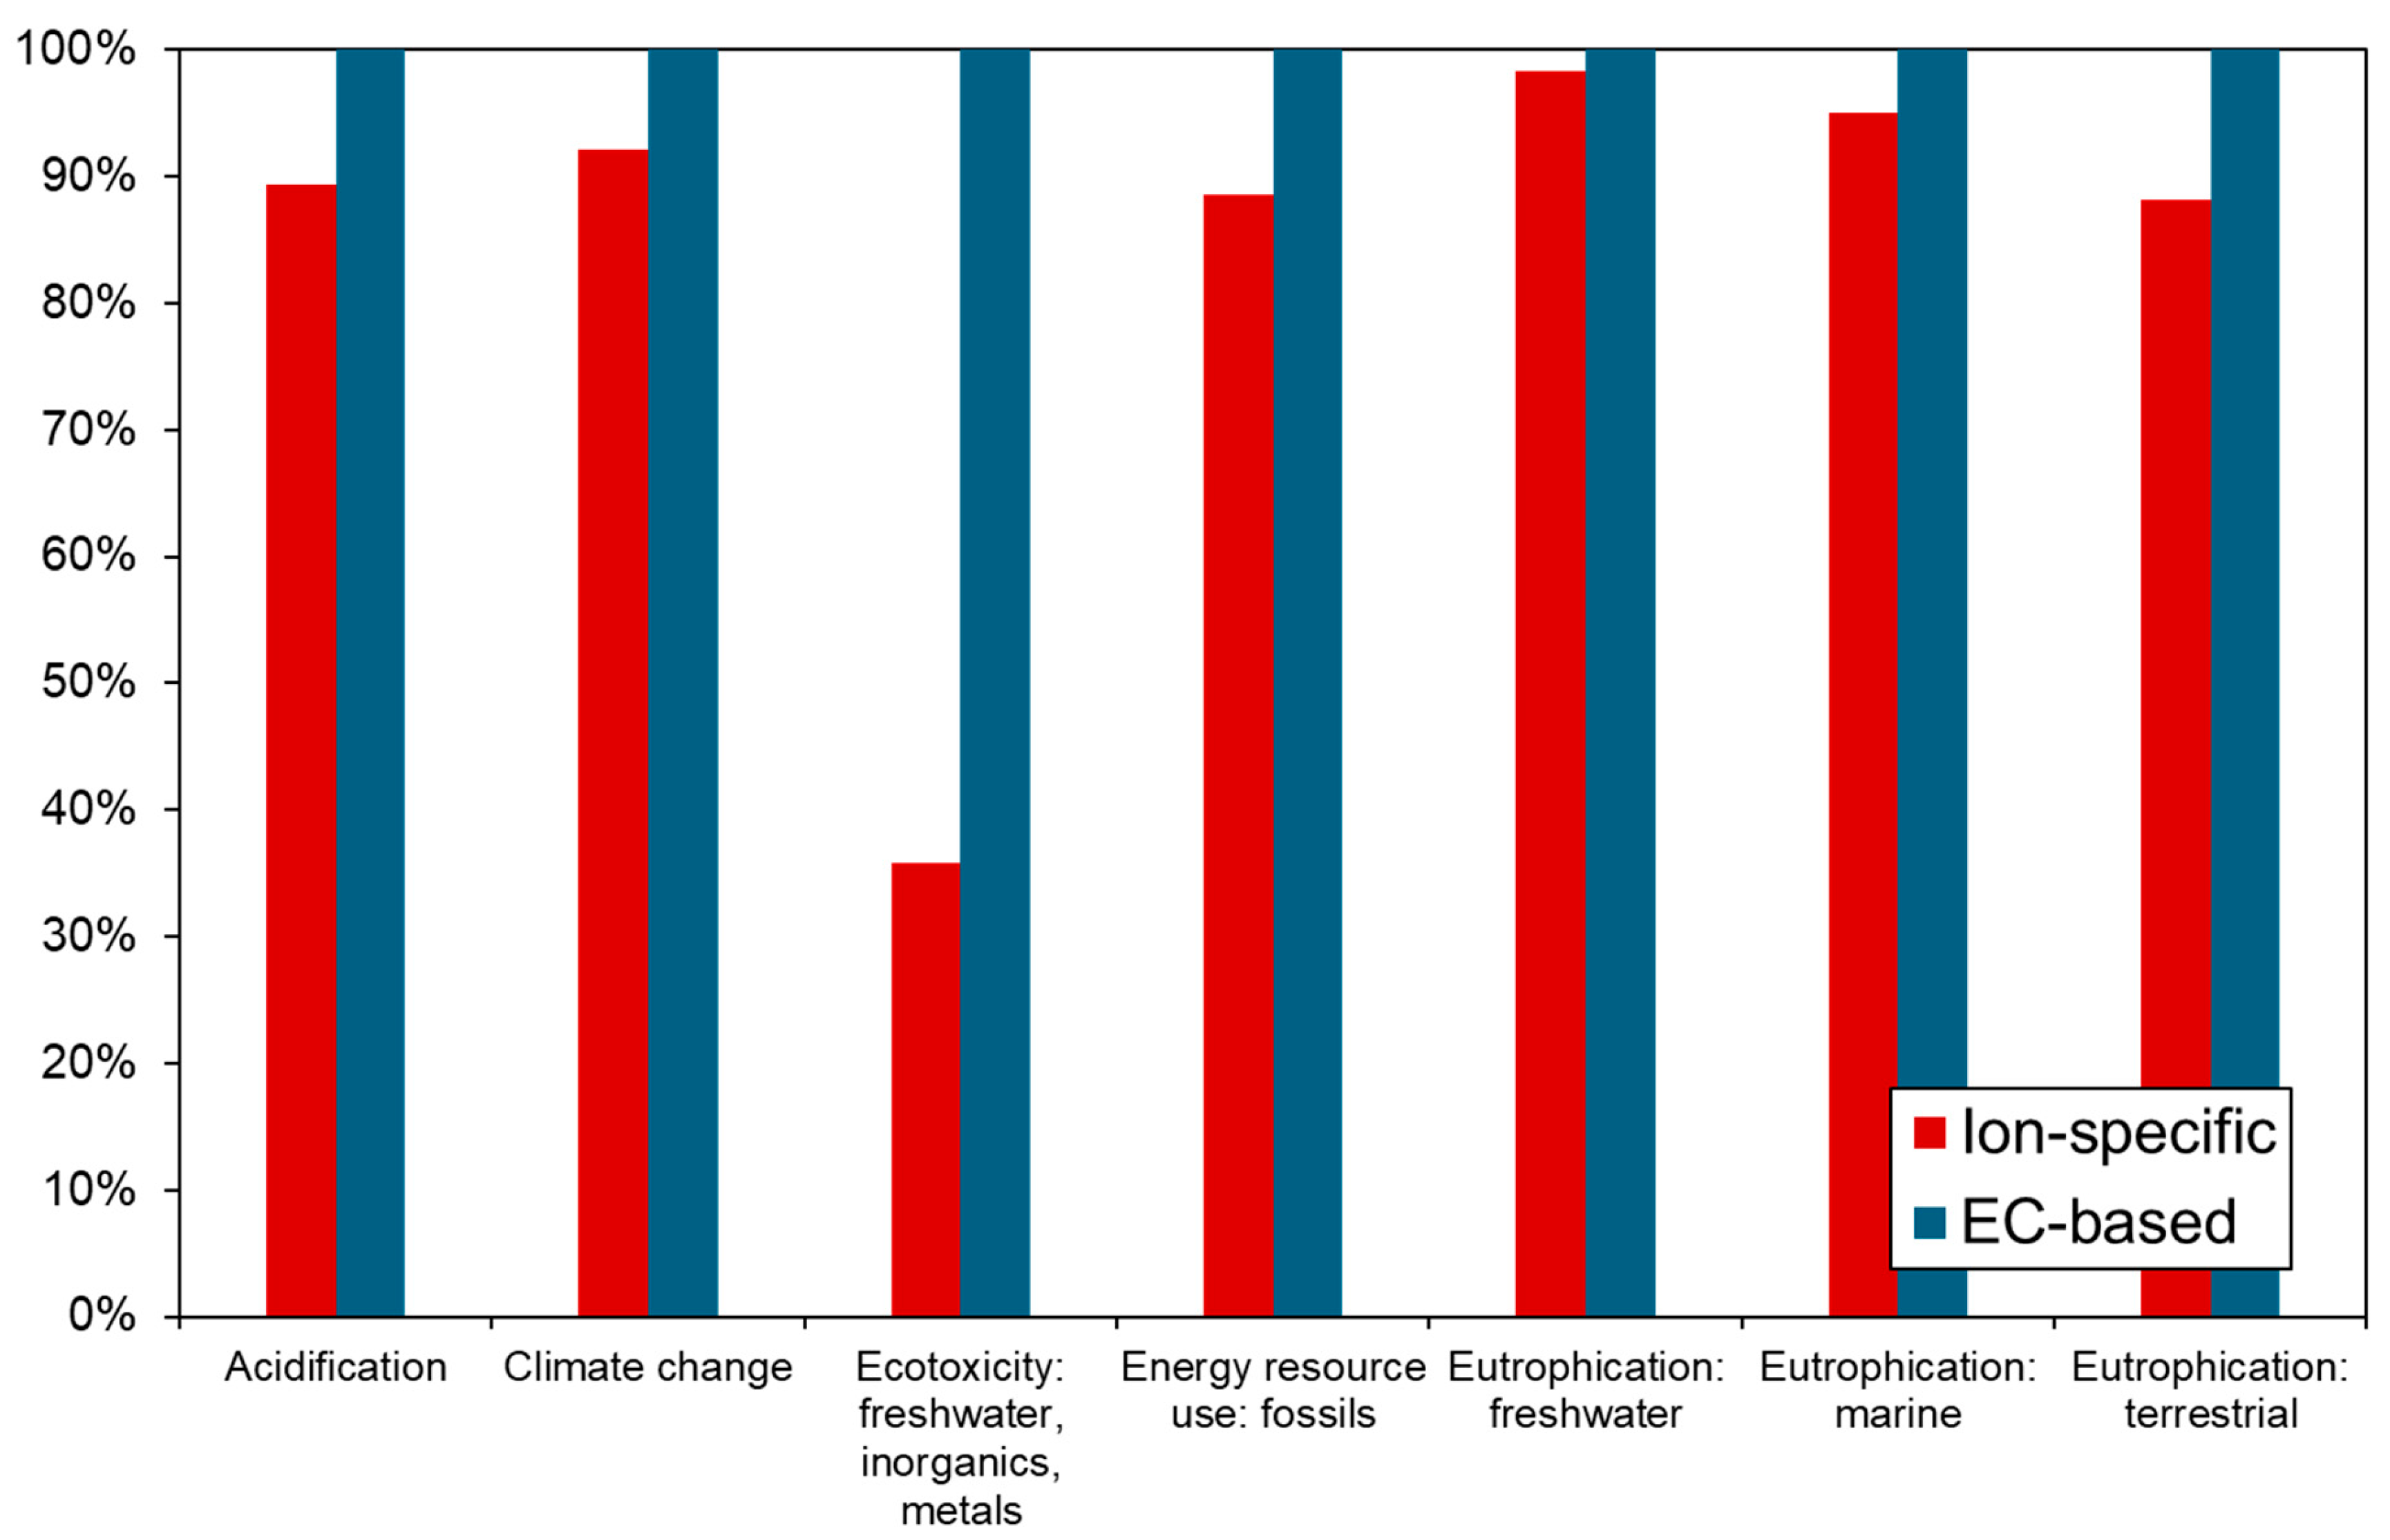
Based on the collected LCI and constructed process networks, an impact assessment was conducted. As shown in Figure 11 and Table 5, ion-specific management demonstrates environmental advantages over EC-based management in closed hydroponics. Specifically, EC-based management emits 0.18 kg CO2-eq per kg of lettuce, whereas ion-specific management reduces this to 0.17 kg CO2-eq, reflecting an 8% lower greenhouse gas emission. Additionally, in terms of freshwater, marine, and terrestrial eutrophication, ion-specific management demonstrated 2%, 5%, and 12% lower impacts, respectively, compared to EC-based management. Notably, in the freshwater ecotoxicity category, ion-specific management exhibited a 64% reduction in impact relative to EC-based management. This significant difference is attributed to the extended reuse of nutrient solutions in ion-specific management, which contrasts with conventional EC-based strategies that lack individual ion compensation or stage-specific adjustments. Consequently, the ion-specific system enabled nutrient solution reuse to last three times longer.

4. Discussion

In this study, a precision nutrient solution control system using ISEs was established, and it was proven that it can effectively prevent nutrient imbalance during lettuce cultivation. Figure 7 shows the relatively large deviations observed in some ion concentrations despite daily adjustments. It would be due to the rapid and non-linear nutrient uptake dynamics of the crops during photoperiods, which can cause temporary concentration drops between control intervals [27]. Furthermore, the time required for homogenization after the injection of fertilizers may contribute to temporary deviations during the sampling process. From the growing experiment, conventional EC-based control systems cannot account for individual ion concentrations, thereby leading to a rapid depletion of specific ions (e.g., K+) in the late growth stage (Figure 7b). The result is consistent with a recent finding regarding nutrient dynamics in closed hydroponics [28]. Such high K+ consumption likely inhibited Ca2+ uptake through ion antagonism [29], thereby inducing physiological disorders such as tip-burn (Figure 8).
In contrast, the ISE-based control system maintained NO3, K+, and Ca2+ concentrations within their target ranges (RMSE < 52 mg L−1), enabling healthy crop production without physiological damage. This result reconfirmed the reliability of automated two-point normalization for stable ion monitoring over the crop growing period [19]. The 12-week experiment also confirmed the feasibility of zero-discharge operation through ion-specific management, which was only validated via simulations [21]. By maintaining precise nutrient balance over the growing period, the system successfully supported a completely closed-loop process, minimizing environmental impact.
Although physiological disorders were observed in the EC-based control group (Figure 8), its total fresh weight was approximately 15.6% higher than that of the ISE-based group (Figure 9 and Table 3). This result may be because the measurement was conducted based on total fresh weight rather than marketable quality. Specifically, high NO3 levels during the early-to-mid growth stages can induce NO3 accumulation in cellular vacuoles (Figure 7b), thereby increasing osmotic potential and driving cell expansion through enhanced water uptake [30]. While this process promotes higher FW, it leads to succulent tissues with low structural integrity, which accounts for the higher susceptibility to tip-burn compared to the ISE-based group. Therefore, in terms of marketable yield, it is difficult to conclude that the EC group demonstrated superior productivity.
In terms of resource-use efficiency, the ISE system improved water-use efficiency (WUE) and fertilizer-use efficiency (FUE) by 48.4% and 24.5%, respectively, compared to the EC system (Figure 9 and Table 3). Notably, the statistical significance of WUE improvement was clearly demonstrated. This enhancement is attributable to the ISE system’s ability to precisely supply water and nutrients according to actual crop uptake requirements while minimizing unnecessary nutrient solution discharge. Although the improvement in FUE did not fully meet the significance threshold (p = 0.055), further studies with larger sample sizes are warranted to verify this trend. Nevertheless, the reduction in absolute fertilizer input (from 1.9 kg to 1.32 kg) represents a meaningful improvement in both operational cost savings and environmental impact reduction.
The LCA results showed that ISE-based control reduced the global warming potential by 8% compared to EC-based control and provided clear environmental benefits in fertilizer-related impact categories, such as eutrophication and freshwater ecotoxicity (Table 5 and Figure 11). In particular, the 64% reduction in freshwater ecotoxicity is noteworthy. The key mechanism behind these improvements lies in the extended nutrient solution replacement interval. Under EC control, frequent replacement was unavoidable due to the progressive ion imbalance, whereas ISE control extended nutrient solution lifespan by more than threefold through ion-specific correction, drastically reducing waste nutrient discharge. This finding highlights that precision nutrient management can enhance the sustainability of closed hydroponic systems.
While ion-specific management improves resource efficiency, practical challenges remain, such as the need for periodic sensor replacement and the limited range of ions that can be directly sensed. However, by providing empirical data on plant physiology and environmental impacts (LCA), this study demonstrates the system’s broader sustainability and realistic potential for precision agriculture. Furthermore, the ion-specific approach is readily applicable to any tank-based fertigation system, and scaling up is feasible provided nutrient uniformity is maintained. Nevertheless, for industrial adoption, future research should be conducted to evaluate the benefits of fertilizer savings and productivity in relation to maintenance costs, including automated normalization, fault diagnosis, and sensor replacement.

5. Conclusions

This study validated a closed hydroponic nutrient management system using ISE-based precision control through a three-month lettuce cultivation experiment. Over three months of lettuce cultivation with the system, NO3, K, and Ca ions were managed effectively with RMSE values of 51.66 mg·L−1, 38.8 mg·L−1, and 19.3 mg·L−1, respectively, confirming the system’s performance in nutrient management. In addition, compared to conventional EC-based management, the ion-specific system demonstrated significantly higher resource efficiency, achieving substantial improvements in both WUE and FUE.
Additionally, LCA confirmed that the specific nutrient management system exhibited superior environmental performance compared to the EC-based system. Specifically, it reduced greenhouse gas emissions per kilogram of lettuce by 8% and reduced impacts in key categories, including freshwater, marine, and terrestrial eutrophication (by 2%, 5%, and 12%, respectively). In the case of freshwater ecotoxicity, the specific management system demonstrated 64% lower impact compared to the EC-based system. These findings highlight the advantages of the ion-specific management in terms of cost savings and reduced environmental impacts compared to the conventional EC-based approach.
While the efficacy of ion-based precision nutrient management was demonstrated, further research is needed to extend its application to fruit-bearing crops with complex nutrient requirements. Additionally, to ensure commercial feasibility, future economic assessments should focus on marketable quality rather than simple biomass yield. Overall, this study provides a promising sustainable closed hydroponic management to enhance resource efficiency and minimize environmental impact.

Author Contributions

Conceptualization, S.L. and H.-J.K.; methodology, S.L. and M.-S.G.; software, S.L. and M.-S.G.; validation, S.L., R.B.S., S.K.P. and M.-S.G.; formal analysis, S.L. and W.-J.C.; investigation, S.L. and W.-J.C.; resources, S.K.P. and H.-J.K.; data curation, S.L. and W.-J.C.; writing—original draft preparation, S.L. and W.-J.C.; writing—review and editing, S.L., W.-J.C. and H.-J.K.; visualization, S.L., S.K.P. and M.-S.G.; supervision, H.-J.K.; project administration, H.-J.K. and R.B.S.; funding acquisition, H.-J.K. and R.B.S. All authors have read and agreed to the published version of the manuscript.

Funding

This work was supported by the Glocal University 30 Project Fund of Gyeongsang National University in 2025, and the Korea–Philippines Cooperation Base Establishment program funded by the Ministry of Science and ICT (RS-2022-NR119711).

Data Availability Statement

The data presented in this study are available on request from the corresponding author due to restrictions by the funding agency.

Acknowledgments

During the preparation of this manuscript, the authors used an AI-based language model for language translation purposes. The authors have reviewed and edited the output and take full responsibility for the content of this publication.

Conflicts of Interest

The authors declare no conflicts of interest. The funders had no role in the design of the study; in the collection, analyses, or interpretation of data; in the writing of the manuscript; or in the decision to publish the results.

Appendix A

Figure A1. Signal (mV) of ISEs for two-point normalization solutions during the cultivation: (a) NO3 electrode, (b) K+ electrode, and (c) Ca2+ electrode. Yellow arrows indicate the points of electrode replacement.
Agronomy 16 00232 g0a1

References

  1. Clune, S.; Crossin, E.; Verghese, K. Systematic review of greenhouse gas emissions for different fresh food categories. J. Clean. Prod. 2017, 140, 766–783. [Google Scholar] [CrossRef] [Scilit]
  2. Poore, J.; Nemecek, T. Reducing food’s environmental impacts through producers and consumers. Science 2018, 360, 987–992. [Google Scholar] [CrossRef] [Scilit]
  3. Mbow, C.; Rosenzweig, C.; Barioni, L.; Benton, T.; Herrero, M.; Krishnapillai, M.; Diouf, A. Food security (No. GSFC-E-DAA-TN78913). In Climate Change and Land: An IPCC Special Report on Climate Change, Desertification, Land Degradation, Sustainable Land Management, Food Security, and Greenhouse Gas Fluxes in Terrestrial Ecosystems; IPCC: Geneva, Switzerland, 2020. [Google Scholar]
  4. Benke, K.; Tomkins, B. Future food-production systems: Vertical farming and controlled-environment agriculture. Sustain. Sci. Pract. Policy 2017, 13, 13–26. [Google Scholar] [CrossRef] [Scilit]
  5. Edwards, F.; Dixon, J.; Friel, S.; Hall, G.; Larsen, K.; Lockie, S.; Wood, B.; Lawrence, M.; Hanigan, I.; Hogan, A. Climate change adaptation at the intersection of food and health. Asia Pac. J. Public Health 2011, 23, 91S–104S. [Google Scholar] [CrossRef] [Scilit]
  6. Velazquez-Gonzalez, R.S.; Garcia-Garcia, A.L.; Ventura-Zapata, E.; Barceinas-Sanchez, J.D.O.; Sosa-Savedra, J.C. A review on hydroponics and the technologies associated for medium-and small-scale operations. Agriculture 2022, 12, 646. [Google Scholar] [CrossRef] [Scilit]
  7. Van Delden, S.; SharathKumar, M.; Butturini, M.; Graamans, L.; Heuvelink, E.; Kacira, M.; Kaiser, E.; Klamer, R.; Klerkx, L.; Kootstra, G. Current status and future challenges in implementing and upscaling vertical farming systems. Nat. Food 2021, 2, 944–956. [Google Scholar] [CrossRef] [Scilit] [PubMed]
  8. Kozai, T.; Niu, G. Plant factory as a resource-efficient closed plant production system. In Plant Factory; Elsevier: Amsterdam, The Netherlands, 2016; pp. 69–90. [Google Scholar]
  9. Blom, T.; Jenkins, A.; Pulselli, R.; Van den Dobbelsteen, A. The embodied carbon emissions of lettuce production in vertical farming, greenhouse horticulture, and open-field farming in the Netherlands. J. Clean. Prod. 2022, 377, 134443. [Google Scholar] [CrossRef] [Scilit]
  10. Fathidarehnijeh, E.; Nadeem, M.; Cheema, M.; Thomas, R.; Krishnapillai, M.; Galagedara, L. Current perspective on nutrient solution management strategies to improve the nutrient and water use efficiency in hydroponic systems. Can. J. Plant Sci. 2024, 104, 88–102. [Google Scholar] [CrossRef] [Scilit]
  11. Martin, M.; Elnour, M.; Siñol, A.C. Environmental life cycle assessment of a large-scale commercial vertical farm. Sustain. Prod. Consum. 2023, 40, 182–193. [Google Scholar] [CrossRef] [Scilit]
  12. Hasler, K.; Bröring, S.; Omta, S.W.F.; Olfs, H.W. Life cycle assessment (LCA) of different fertilizer product types. Eur. J. Agron. 2015, 69, 41–51. [Google Scholar] [CrossRef] [Scilit]
  13. Graamans, L.; Baeza, E.; Van Den Dobbelsteen, A.; Tsafaras, I.; Stanghellini, C. Plant factories versus greenhouses: Comparison of resource use efficiency. Agric. Syst. 2018, 160, 31–43. [Google Scholar] [CrossRef] [Scilit]
  14. Carotti, L.; Pistillo, A.; Zauli, I.; Meneghello, D.; Martin, M.; Pennisi, G.; Gianquinto, G.; Orsini, F. Improving water use efficiency in vertical farming: Effects of growing systems, far-red radiation and planting density on lettuce cultivation. Agric. Water Manage. 2023, 285, 108365. [Google Scholar] [CrossRef] [Scilit]
  15. Avgoustaki, D.D.; Xydis, G. Energy cost reduction by shifting electricity demand in indoor vertical farms with artificial lighting. Biosyst. Eng. 2021, 211, 219–229. [Google Scholar] [CrossRef] [Scilit]
  16. Ahn, T.-I.; Shin, J.-W.; Son, J.-E. Analysis of changes in ion concentration with time and drainage ratio under EC-based nutrient control in closed-loop soilless culture for sweet pepper plants (Capsicum annum L.‘Boogie’). J. Bio-Environ. Control 2010, 19, 298–304. [Google Scholar]
  17. Bailey, B.; Haggett, B.; Hunter, A.; Albery, W.; Svanberg, L. Monitoring nutrient film solutions using ion-selective electrodes. J. Agric. Eng. Res. 1988, 40, 129–142. [Google Scholar] [CrossRef] [Scilit]
  18. Miller, A.; Adhikari, R.; Nemali, K. Recycling nutrient solution can reduce growth due to nutrient deficiencies in hydroponic production. Front. Plant Sci. 2020, 11, 607643. [Google Scholar] [CrossRef] [Scilit]
  19. Kim, J.; Kim, H.-J.; Gang, M.-S.; Kim, D.-W.; Cho, W.-J.; Jang, J.K. Closed hydroponic nutrient solution management using multiple water sources. J. Biosyst. Eng. 2023, 48, 215–224. [Google Scholar] [CrossRef] [Scilit]
  20. Kim, H.J.; Kim, D.W.; Kim, W.K.; Cho, W.J.; Kang, C.I. PVC membrane-based portable ion analyzer for hydroponic and water monitoring. Comput. Electron. Agric. 2017, 140, 374–385. [Google Scholar] [CrossRef] [Scilit]
  21. Cho, W.-J.; Gang, M.-S.; Kim, D.-W.; Kim, J.; Jung, D.-H.; Kim, H.-J. Decision-tree-based ion-specific dosing algorithm for enhancing closed hydroponic efficiency and reducing carbon emissions. Front. Plant Sci. 2023, 14, 1301490. [Google Scholar] [CrossRef] [Scilit]
  22. Munoz-Perea, C.G.; Allen, R.G.; Westermann, D.T.; Wright, J.L.; Singh, S.P. Water use efficiency among dry bean landraces and cultivars in drought-stressed and non-stressed environments. Euphytica 2007, 155, 393–402. [Google Scholar] [CrossRef] [Scilit]
  23. Briggs, L.J.; Shantz, H.L. The Water Requirement of Plants; US Government Printing Office: Washington, DC, USA, 1913. [Google Scholar]
  24. ISO 14040:2006; Environmental Management—Life Cycle Assessment—Principles and Framework. International Organization for Standardization: London, UK, 2006.
  25. ISO 14044:2006; Environmental Management—Life Cycle Assessment—Requirements and Guidelines. International Organization for Standardization: London, UK, 2006.
  26. Zhang, T.; Shi, Y.; Piao, F.; Sun, Z. Effects of different LED sources on the growth and nitrogen metabolism of lettuce. Plant Cell Tissue Organ Cult. 2018, 134, 231–240. [Google Scholar] [CrossRef] [Scilit]
  27. Vought, K.; Bayabil, H.K.; Pompeo, J.; Crawford, D.; Zhang, Y.; Correll, M.; Martin-Ryals, A. Dynamics of micro and macronutrients in a hydroponic nutrient film technique system under lettuce cultivation. Heliyon 2024, 10, e32316. [Google Scholar] [CrossRef] [Scilit]
  28. Liu, X.; Chen, C.; Zhang, Y.-H.; Tong, Y.-X. Effects of nutrient solution recycling on water and nutrient consumption patterns and lettuce growth. Sci. Hortic. 2025, 341, 113976. [Google Scholar] [CrossRef] [Scilit]
  29. Uno, Y.; Okubo, H.; Itoh, H.; Koyama, R. Reduction of leaf lettuce tipburn using an indicator cultivar. Sci. Hortic. 2016, 210, 14–18. [Google Scholar] [CrossRef] [Scilit]
  30. Chabite, I.T.; Zhang, L.; Yao, N.; Fu, Q.; Yu, H. Mode of Managing Nutrient Solution Based on N Use Efficiency for Lettuce (Lactuca sativa L.). J. Food Sci. Eng. 2017, 7, 29–37. [Google Scholar] [CrossRef] [Scilit]
Figure 1. Flow of operational sequence of ion monitoring and fertilizer dosing algorithm from Cho et al. [21].
Agronomy 16 00232 g001
Figure 2. View of the precision nutrient solution management system.
Agronomy 16 00232 g002
Figure 3. View of the plant factory with the nutrient solution management system: (a) view of the system installation; (b) layout of the growing systems.
Agronomy 16 00232 g003
Figure 4. System design and assessment of the LCA phases based on ISO 14040 [24].
Agronomy 16 00232 g004
Figure 5. System boundaries for the life cycle assessment of a plant factory, including the inputs and outputs of the system. Modified from Martin, Elnour and Siñol [11].
Agronomy 16 00232 g005
Figure 6. Relationships between ion concentrations determined by standard analyzers and ISEs: (a) NO3, (b) K, and (c) Ca.
Agronomy 16 00232 g006
Figure 7. Change in ion concentrations over the experimental period: (a) ion-specific management; (b) EC-based management; (c) EC and pH variation under EC-based management. Dashed lines indicate the target concentration values.
Agronomy 16 00232 g007
Figure 8. Crop condition at the end of cultivation: (a) ion-specific management; (b) EC-based management.
Agronomy 16 00232 g008
Figure 9. (a) Plant fresh weight (g plant−1); (b) water-use efficiency (g FW L−1); (c) fertilizer-use efficiency (g FW g−1) for plants grown in ion-specific and EC-based control. ** indicates the significance level of p < 0.01, the cross (×) indicates the mean value, and the small circles represent outliers.
Agronomy 16 00232 g009
Figure 10. OpenLCA process networks: (a) crop cultivation using EC-based control in a plant factory (the red dashed box); (b) crop cultivation using ion-specific management in a plant factory (the blue dashed box).
Agronomy 16 00232 g010
Figure 11. Comparison of the environmental impacts of each nutrient solution control system.
Agronomy 16 00232 g011
Table 1. Concentration of the fertilizers used for ion-specific management.
Stock SolutionType of IonConcentration (mgL−1)
Mg(SO4)2∙7H2OMg3143.43
SO412,424.06
NH4H2PO4NH4180.38
H2PO4969.87
KH2PO4K453.37
H2PO41124.62
Ca(NO3)2∙4H2OCa5176.36
NO316,016.8
KNO3K12,645.64
NO320,054.35
NH4NO3NH46760.77
NO323,239.23
K2SO4K10,769.69
SO413,230.31
MicronutrientFe-EDTA1144
B39
Mn48.51
Zn231.23
Cu0.87
Mo0.79
Table 2. Concentrations of stock solutions A, B, and acid used for EC-based management.
Stock SolutionType of IonConcentration (mgL−1)
ANO3-N55,000
K45,000
Ca20,000
B1.4
Fe-EDTA300
Zn1
Mo2
BNO3-N25,000
H3PO422,000
K53,000
Mn70
B500
Zn30
Cu7
AcidH3PO42850
Table 3. Total fresh weight (kg FW floor−1), plant fresh weight (g plant−1), water-use efficiency (g FW L−1), and fertilizer-use efficiency (g FW g−1) for plants grown in ion-specific and EC-based control.
Total Biomass
(kg FW Floor−1)
Plant Fresh Weight
(g Plant−1)
Water-Use Efficiency
(g FW L−1)
Fertilizer-Use Efficiency
(g FW g−1)
Ion-specific4.98 ± 1.05103.84 ± 21.936.63 ± 1.91 **39.22 ± 9.9
EC-based5.9 ± 0.41122.89 ± 8.6424.68 ± 1.03 **31.49 ± 13.7
** indicates the significance level of p < 0.01.
Table 4. Material and energy inputs and outputs for the production in the plant factory during the cultivation.
TypeCategorySpecific CategoryDetailAmountUnit
InputsMaterial inputsGrowing medium 1.05kg
FertilizersIon-specificKNO3187.37g
Ca(NO3)2283.65g
NH4NO3174.9g
NH4H2PO410.51g
K2SO4378.48g
MgSO4275.12g
KH2PO48.99g
EC-basedMg1.68g
NH479.2g
H2PO4133.9g
NO3871.2g
Ca73.7g
K241.08g
Seeding 288ea
WaterTap water3377.1m3
Other
Energy inputs Electricity9596kWh
OutputsProduction outputs Ion-specificPlants44.86kg
EC-basedPlants53kg
End-of-life Ion-specificBiowaste26.41kg
EC-basedBiowaste34.7kg
InfrastructureInfrastructure Aluminum profile107.2kg
Plastic74.88kg
Pipes (polyethylene)30m
Insulation sandwich panel23.51m2
TanksPlastic8kg
LED light fixtures60units
Pumps2units
Air circulator1units
Air conditioner1units
UV lamp2units
DC Fans12units
SMPS6units
Monitoring EquipmentComputers4units
Wire100m
Table 5. Comparison of the environmental impacts for each nutrient solution control system per kg edible lettuce in a plant factory.
Impact CategoryIon-SpecificEC-Based
Acidification (mol H+ eq)7.75 × 10−48.66 × 10−4
Climate change (kg CO2 eq)1.70 × 10−11.85 × 10−1
Ecotoxicity: freshwater, inorganics, metals (CTUe)9.94 × 1002.77 × 101
Energy resource use: Fossils (MJ)7.95 × 10−18.98 × 10−1
Eutrophication: freshwater1.30 × 10−41.33 × 10⁻⁴
Eutrophication: marine2.35 × 10−42.47 × 10⁻⁴
Eutrophication: terrestrial2.74 × 10−33.11 × 10⁻³
Disclaimer/Publisher’s Note: The statements, opinions and data contained in all publications are solely those of the individual author(s) and contributor(s) and not of MDPI and/or the editor(s). MDPI and/or the editor(s) disclaim responsibility for any injury to people or property resulting from any ideas, methods, instructions or products referred to in the content.