Article

Projected Distribution of Five Invasive Ipomoea Species in China Under Climate Change

College of Geography and Planning, Chengdu University of Technology, Chengdu 610059, China
*
Author to whom correspondence should be addressed.
Agronomy 2026, 16(18), 1763; https://doi.org/10.3390/agronomy16181763
Submission received: 13 August 2026 / Revised: 4 September 2026 / Accepted: 6 September 2026 / Published: 9 September 2026
(This article belongs to the Section Agroecology Innovation: Achieving System Resilience)

Abstract

In recent years, increasing attention has been paid to the influence of climate change on the distribution and spread of invasive species. However, projections of the future distributions of invasive Ipomoea species remain limited, despite their strong reproductive capacity, ecological adaptability, and competitive ability. In this study, 34 environmental variables were initially considered, and highly correlated variables were removed before fitting Maximum Entropy (MaxEnt) models, with model settings selected according to species-specific sample sizes, to predict the potential distributions of five invasive Ipomoea species (Ipomoea nil, Ipomoea purpurea, Ipomoea quamoclit, Ipomoea lacunosa, and Ipomoea alba) across China under current and future climate scenarios (SSP126, SSP370, and SSP585). Model performance and the contributions of environmental variables were evaluated, and changes in suitable areas and distribution centroids were compared among climate scenarios. All five models showed high predictive performance, with AUC values exceeding 0.9. Snow cover days (SCD) was the main predictor for I. nil and I. purpurea, while Bio9, elevation, and Bio11 were the dominant predictors for I. quamoclit, I. lacunosa, and I. alba, respectively. Compared with the baseline climate period (1981–2010), suitable areas for all five species were projected to expand under future climate scenarios, with varying shifts in distribution centroids. These results indicate that climate warming may increase the potential invasion risk and ecological impacts of invasive Ipomoea species in China, highlighting the need for strengthened monitoring and management to support biodiversity conservation.

1. Introduction

Invasive species are organisms that come from outside the local ecosystem, including plants, animals, and microorganisms [1,2]. With ongoing globalization and a changing climate, biological invasions have increased competition for resources and disturbed ecological balance, increasing competitive pressure on native species and contributing to global declines in biodiversity and ecosystem decline worldwide [3,4]. On the other hand, invasive species can reduce crop yields, increase agricultural management costs, and negatively affect socio-economic development [5,6]. In China, several invasive species, including Bemisia tabaci [7], Bursaphelenchus xylophilus [8], and Ageratina adenophora [9], have been reported to cause crop yield reductions, timber losses, and livestock poisoning [10]. Between 1965 and 2017, the aggregate economic burden of biological invasions in China was estimated at US$174.7 billion (in 2017 constant dollars), with an average annual loss of approximately US$3.30 billion [11,12,13]. Moreover, climate change may further complicate the management and control of invasive species by altering their dispersal processes and rates [14,15]. Therefore, accurately predicting the potential range and invasion mechanisms of invasive plants under future climate change can help guide early prevention and control measures.
Ipomoea represents the largest genus within the Convolvulaceae family, known for its high reproductive potential, strong adaptability, and rapid growth, and is widely found across tropical and subtropical regions worldwide [16,17]. In China, 13 invasive Ipomoea species have been recorded and are widely distributed in southern China and parts of eastern China, most of which are herbaceous vines [18,19]. Some Ipomoea species can establish stable populations in a variety of habitats, including croplands, forest margins, riverbanks, roadsides, and wastelands [20,21]. Their rapid growth and twining habit may form dense vegetation cover, suppress native plant growth, and alter plant community structure, with potential consequences for ecosystem stability and biodiversity [22]. In agricultural systems, invasive Ipomoea species may also compete with crops for light, water, and nutrients, increasing field management costs and potentially causing agricultural production losses [23,24]. Therefore, assessing the future range of Ipomoea species under climate change is important for informing effective invasion management.
Currently, models of species distribution (SDMs) have been widely applied to species distribution prediction, endangered species conservation, and invasion risk assessment of non-native species because they can effectively integrate species occurrence records with environmental factors such as climate, topography, and soil, quantify the relationships between species and environmental conditions, and predict potential suitable areas under current and future environmental conditions [25,26]. In addition, SDMs can overcome the spatial limitations of existing occurrence records and facilitate the assessment of changes in species distributions and their responses to climate change [27]. Many researchers use methods such as MaxEnt (Maximum Entropy Model), RF (Random Forest), GAM (Generalized Additive Model), GBM (Generalized Boosted Model), and GLM (Generalized Linear Model) to simulate the nonlinear relationship between species and environmental variables, all of which have good generalization ability and prediction accuracy [28,29,30]. However, relative to other approaches for modeling species distributions, MaxEnt has a key advantage in requiring only presence-only data, while still achieving high accuracy and stability with limited samples [31,32]. Furthermore, MaxEnt can quantify the relative contributions of environmental variables and generate spatially explicit habitat suitability predictions, making it an effective tool for identifying potential suitable habitats and their environmental drivers [33]. Early studies have used MaxEnt models to predict various invasive plants, such as Alternanthera philoxeroides [34], Eriochloa villosa [35], and Cenchrus spinifex [36]. In addition, researchers have also used this model to predict multiple plants of the same family or genus, such as the Avena genus [37], the Asteraceae family [38], and the Bidens genus [39]. However, previous research has largely focused on individual species or a few families and genera, and systematic assessments of the potential range and invasion risk of highly invasive Ipomoea species are still lacking.
In this study, we employed the MaxEnt model (version 3.4.4; Princeton University, Princeton, NJ, USA), together with occurrence data from five Ipomoea species in China and 34 environmental factors (such as climate, topography, soil, and UV-B radiation), to assess how climate change influences their distribution patterns (Figure S1). The specific objectives are: ① Identify the key environmental factors influencing the invasion of five Ipomoea species; ② Construct the current distribution patterns (1981–2010) of five invasive plants in the Ipomoea and further predict their future distribution trends under three climate scenarios; ③ Quantify the centroid migration and rate of five Ipomoea species under three future climate scenarios, and propose monitoring strategies for specific regions.

2. Materials and Methods

2.1. Data Source for the Distribution Sample

To identify Ipomoea species occurring in China, data were obtained from the Chinese Information System on Invasive Alien Species (https://www.iplant.cn/ias/, accessed on 18 October 2025). According to the relevant classification, I. purpurea is classified as Level I (malicious invasion), I. nil as Level II (serious invasion), and I. quamoclit, I. lacunosa, and I. alba as Level III (localized invasion) in China.
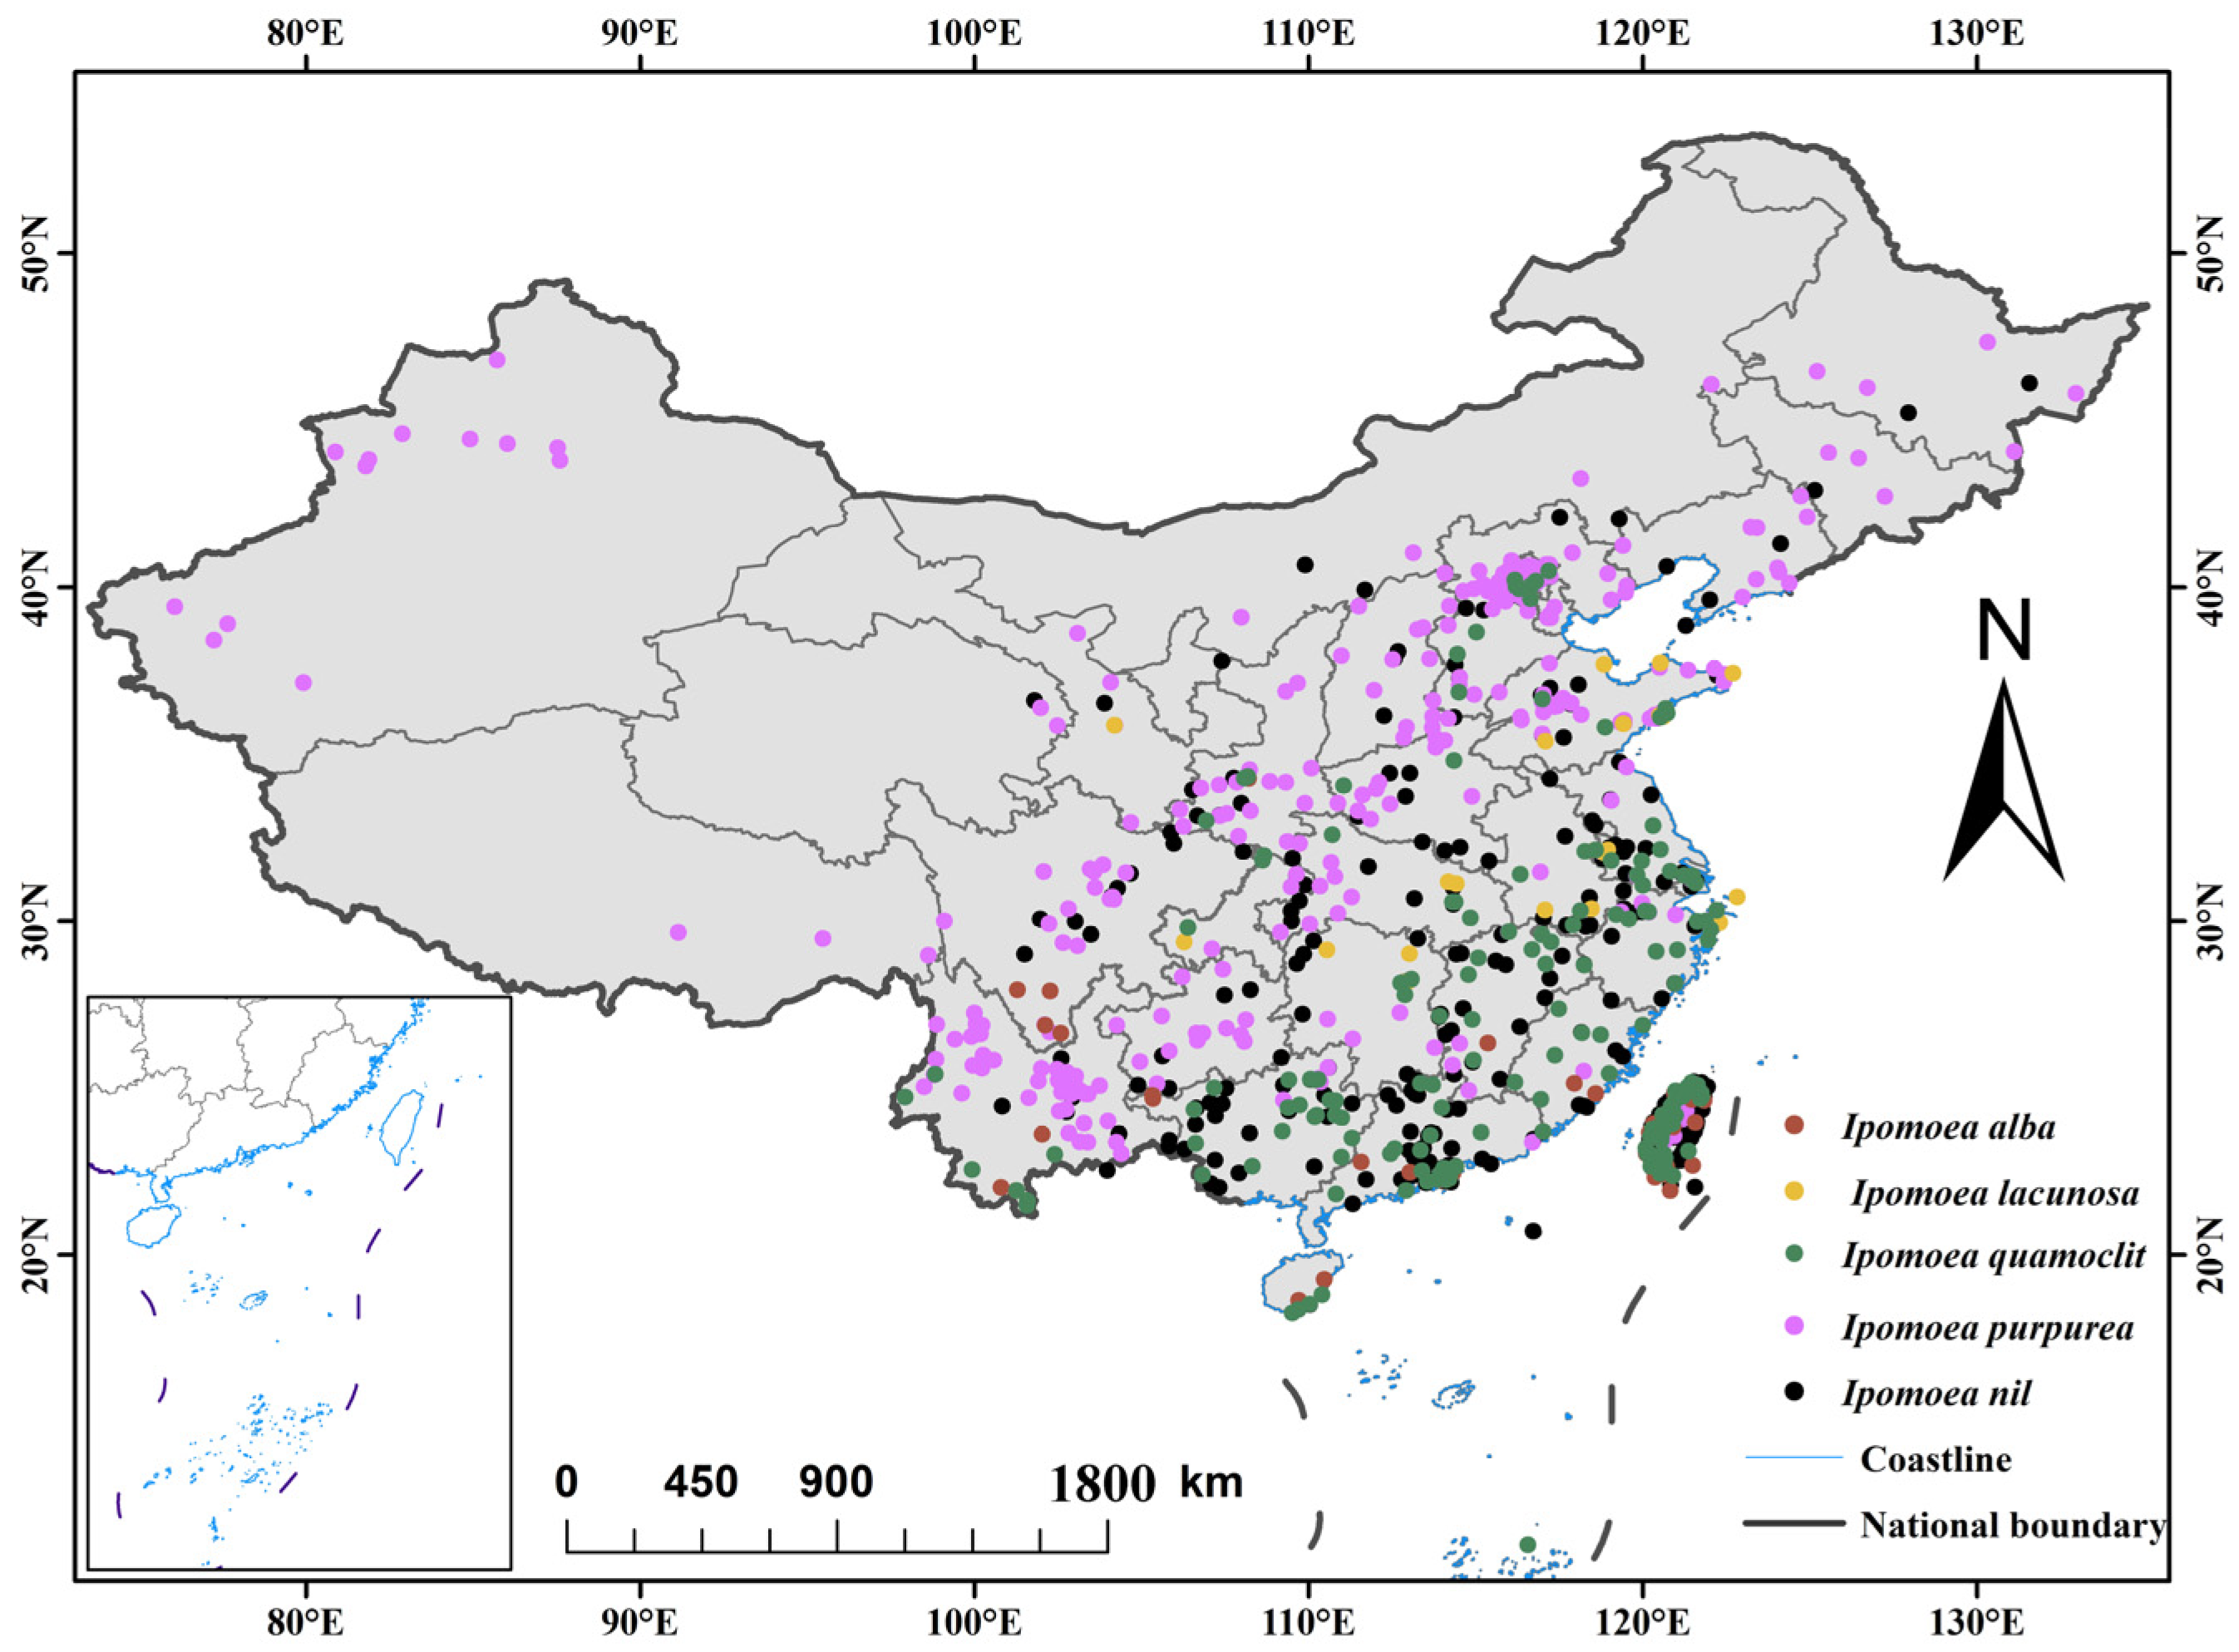
Occurrence records of the five invasive Ipomoea species were then obtained from the GBIF (Global Biodiversity Information Facility) (https://www.gbif.org/, accessed on 20 October 2025), Plant Intelligence (https://www.iplant.cn/ias/, accessed on 20 October 2025), and CVH (Chinese Virtual Herbarium) (https://www.cvh.ac.cn/, accessed on 22 October 2025). To maintain a constant sampling density and lessen sampling bias, the occurrence points were spatially thinned through the “SpThin” package in R (version 4.4.2; R Foundation for Statistical Computing, Vienna, Austria), making sure that each point was at least 7.5 km apart. Following this step, the dataset included 430 valid records for I. nil, 340 for I. purpurea, 173 for I. quamoclit, 28 for I. lacunosa, and 56 for I. alba (Figure 1 and Table 1).

2.2. Selection of Variables

A total of 34 predictor variables, including climate, soil, terrain, and UV-B radiation, as modeling factors (Table 2). Climatic data were derived from the CHELSA database (Climatologies at high resolution for the earth’s land-surface areas) (https://chelsa-climate.org, accessed on 27 October 2025) and include 19 bioclimatic variables (Bio1-Bio19) and SCD (snow cover days), representing key climatic characteristics of the study area. All variables were processed at a 30-arcsecond (approximately 1 km) spatial resolution. Meanwhile, we used the CMIP6 (Coupled Model Intercomparison Project Phase 6) Shared Socioeconomic Pathways (SSPs) as future climate projections. Three representative scenarios were selected in this study, including SSP126, SSP370, and SSP585, representing different levels of future climate change intensity. Specifically, SSP126 is generally considered a sustainable development pathway characterized by strong international cooperation, low-carbon development, and increased reliance on renewable energy, with global warming estimated at around 1.8 °C. SSP370 reflects a regional rivalry pathway, with relatively high emissions and an estimated global warming of approximately 3.6 °C. In contrast, SSP585 describes a high-emission pathway driven by continued fossil fuel dependence and limited climate mitigation efforts, with global temperatures projected to rise by approximately 4.4 °C by 2100. The data for these three scenarios are based on the ensemble mean of five CMIP6 Global Climate Models (GCMs) (GFDL-ESM4, UKESM1-0-LL, MPI-ESM1-2-HR, IPSL-CM6A-LR, and MRI-ESM2-0) to reduce the systematic bias of individual models and improve the reliability and representativeness of future climate projections. Elevation data were derived from the 30-m DEM available through the Geospatial Data Cloud (https://www.gscloud.cn/, accessed on 28 October 2025). On this basis, we used the ArcGIS 10.8.1 tool (Esri, Redlands, CA, USA) to extract slope, aspect, and TWI information to reflect the geomorphic features of the study area, as these variables are closely related to local topography, solar radiation, and moisture conditions, which may influence the distribution of invasive Ipomoea species. Previous studies have shown that UV-B radiation (Ultraviolet-B radiation) can affect seed germination, morphological development, and photosynthetic performance in Ipomoea species, whose growth and interspecific competition are also closely associated with light conditions [40]. Therefore, UV-B radiation was included as an environmental factor in this study. The relevant variables were obtained from the global UV-B radiation database (http://www.ufz.de/gluv/, accessed on 28 October 2025), including UV-B1 to UV-B6. The soil information, including soil organic carbon (OC), total nitrogen (TN), pH, and bulk density (BD) at depths of 0–5 cm and 5–15 cm, was obtained from the SoilGrids database (https://soilgrids.org/, accessed on 29 October 2025) and averaged across the two layers to better represent surface soil properties and to reflect the effects of soil fertility, nutrient availability, and physicochemical conditions on the distribution of the five invasive Ipomoea species.
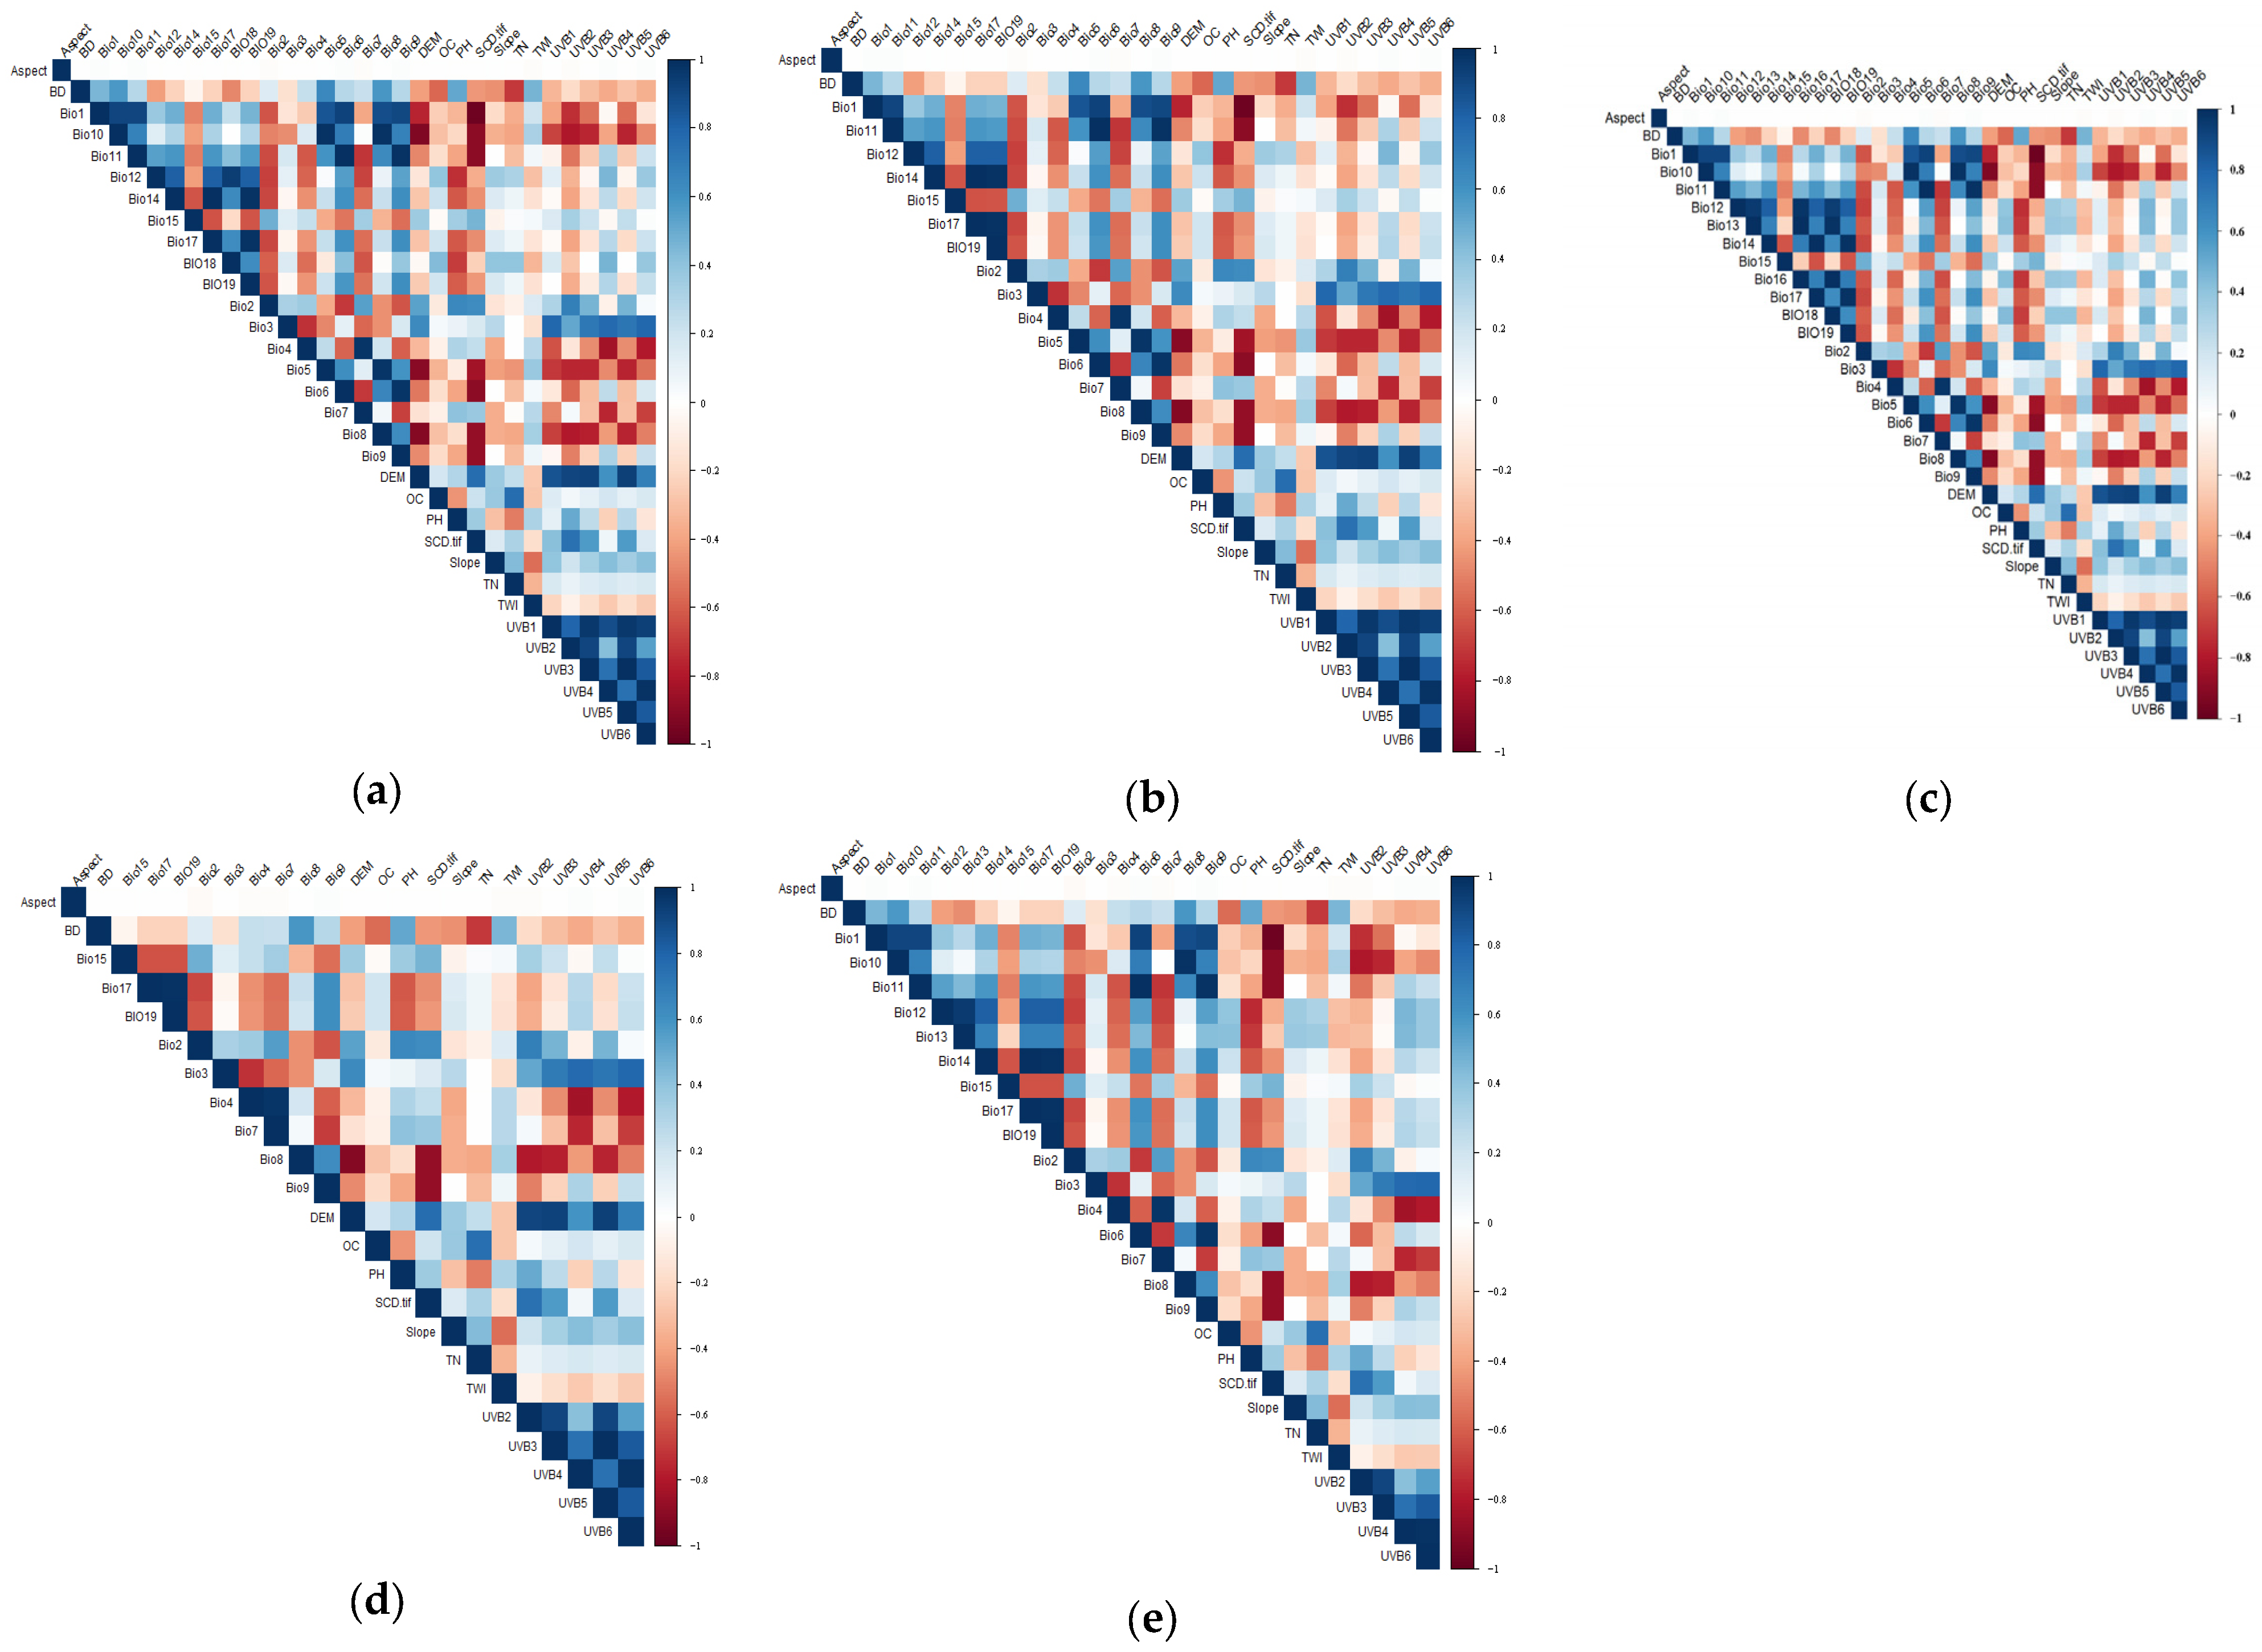
To reduce redundancy among predictors, we conducted a Pearson correlation analysis across the 34 environmental variables. Variable pairs with correlations above 0.8 were deemed highly collinear, and only those with clear ecological relevance and high contribution and permutation importance in preliminary modeling were kept (Figure 2 and Table S1). In addition, to ensure spatial consistency among all environmental rasters, the original 30-m DEM was resampled to a target resolution of 1 km × 1 km using bilinear interpolation in ArcGIS, and all environmental layers were projected to the WGS-1984 coordinate system.

2.3. Model Settings and Model Construction

To predict the potential ranges of five invasive Ipomoea species in China, species-specific MaxEnt model settings were selected using ENMeval in R [41,42,43]. Specifically, modeling for I. nil was conducted using feature classes (FC) = LQH (Linear + Quadratic + Hinge) and regularization multiplier (RM) = 1, while I. purpurea was modeled with FC = LQH (Linear + Quadratic + Hinge) and RM = 1. For I. quamoclit, modeling employed FC = LQHT (Linear + Quadratic + Hinge + Threshold) and RM = 2 (Figure S1). Given their limited occurrence records (fewer than 80 spatial points), default MaxEnt feature-class and regularization settings were directly adopted for I. lacunosa and I. alba [41,44,45].
In this study, MaxEnt was set to randomly select 25% of each species’ occurrence data as the model test dataset, with the remaining 75% used as the model training dataset [46]. Model replicates were implemented using bootstrap resampling with a total of 10 replicates. For each replicate, a maximum of 10,000 background points were randomly sampled across mainland China, which was defined as the unified accessible modeling area for all five Ipomoea species. To comprehensively evaluate model performance, we used area under the Curve (AUC), true skill statistic (TSS), omission rate, and the continuous Boyce index (CBI) to assess model discrimination, prediction error, and calibration (Table 3), with final results averaged across 10 replicates to reduce random variation [47,48]. AUC, TSS, and CBI values closer to 1 indicate better model performance, with stronger discrimination and greater consistency between predicted suitability and observed occurrences [49,50,51], whereas lower omission rates indicate fewer missed occurrences and better predictive performance [52]. The Jackknife test was used to figure out how important each variable was, and the logistic outputs showed the chances of each event happening, while the other settings stayed the same. Based on the continuous logistic suitability outputs, the potential distribution was further classified into three habitat suitability categories using unified thresholds across current and future climate scenarios: unsuitable (p < 0.4), moderately suitable (0.4 ≤ p < 0.6), and highly suitable (0.6 ≤ p ≤ 1.0) [53]. To reduce random error, the final results were averaged over 10 copies. Combined with ArcGIS, species presence was quantified on a scale of 0 to 1, where higher values reflect a better probability of existence. Meanwhile, a threshold of 50% probability of occurrence was adopted to distinguish predicted presence from absence [54,55,56].

3. Results

3.1. Performance and Validation of the Model

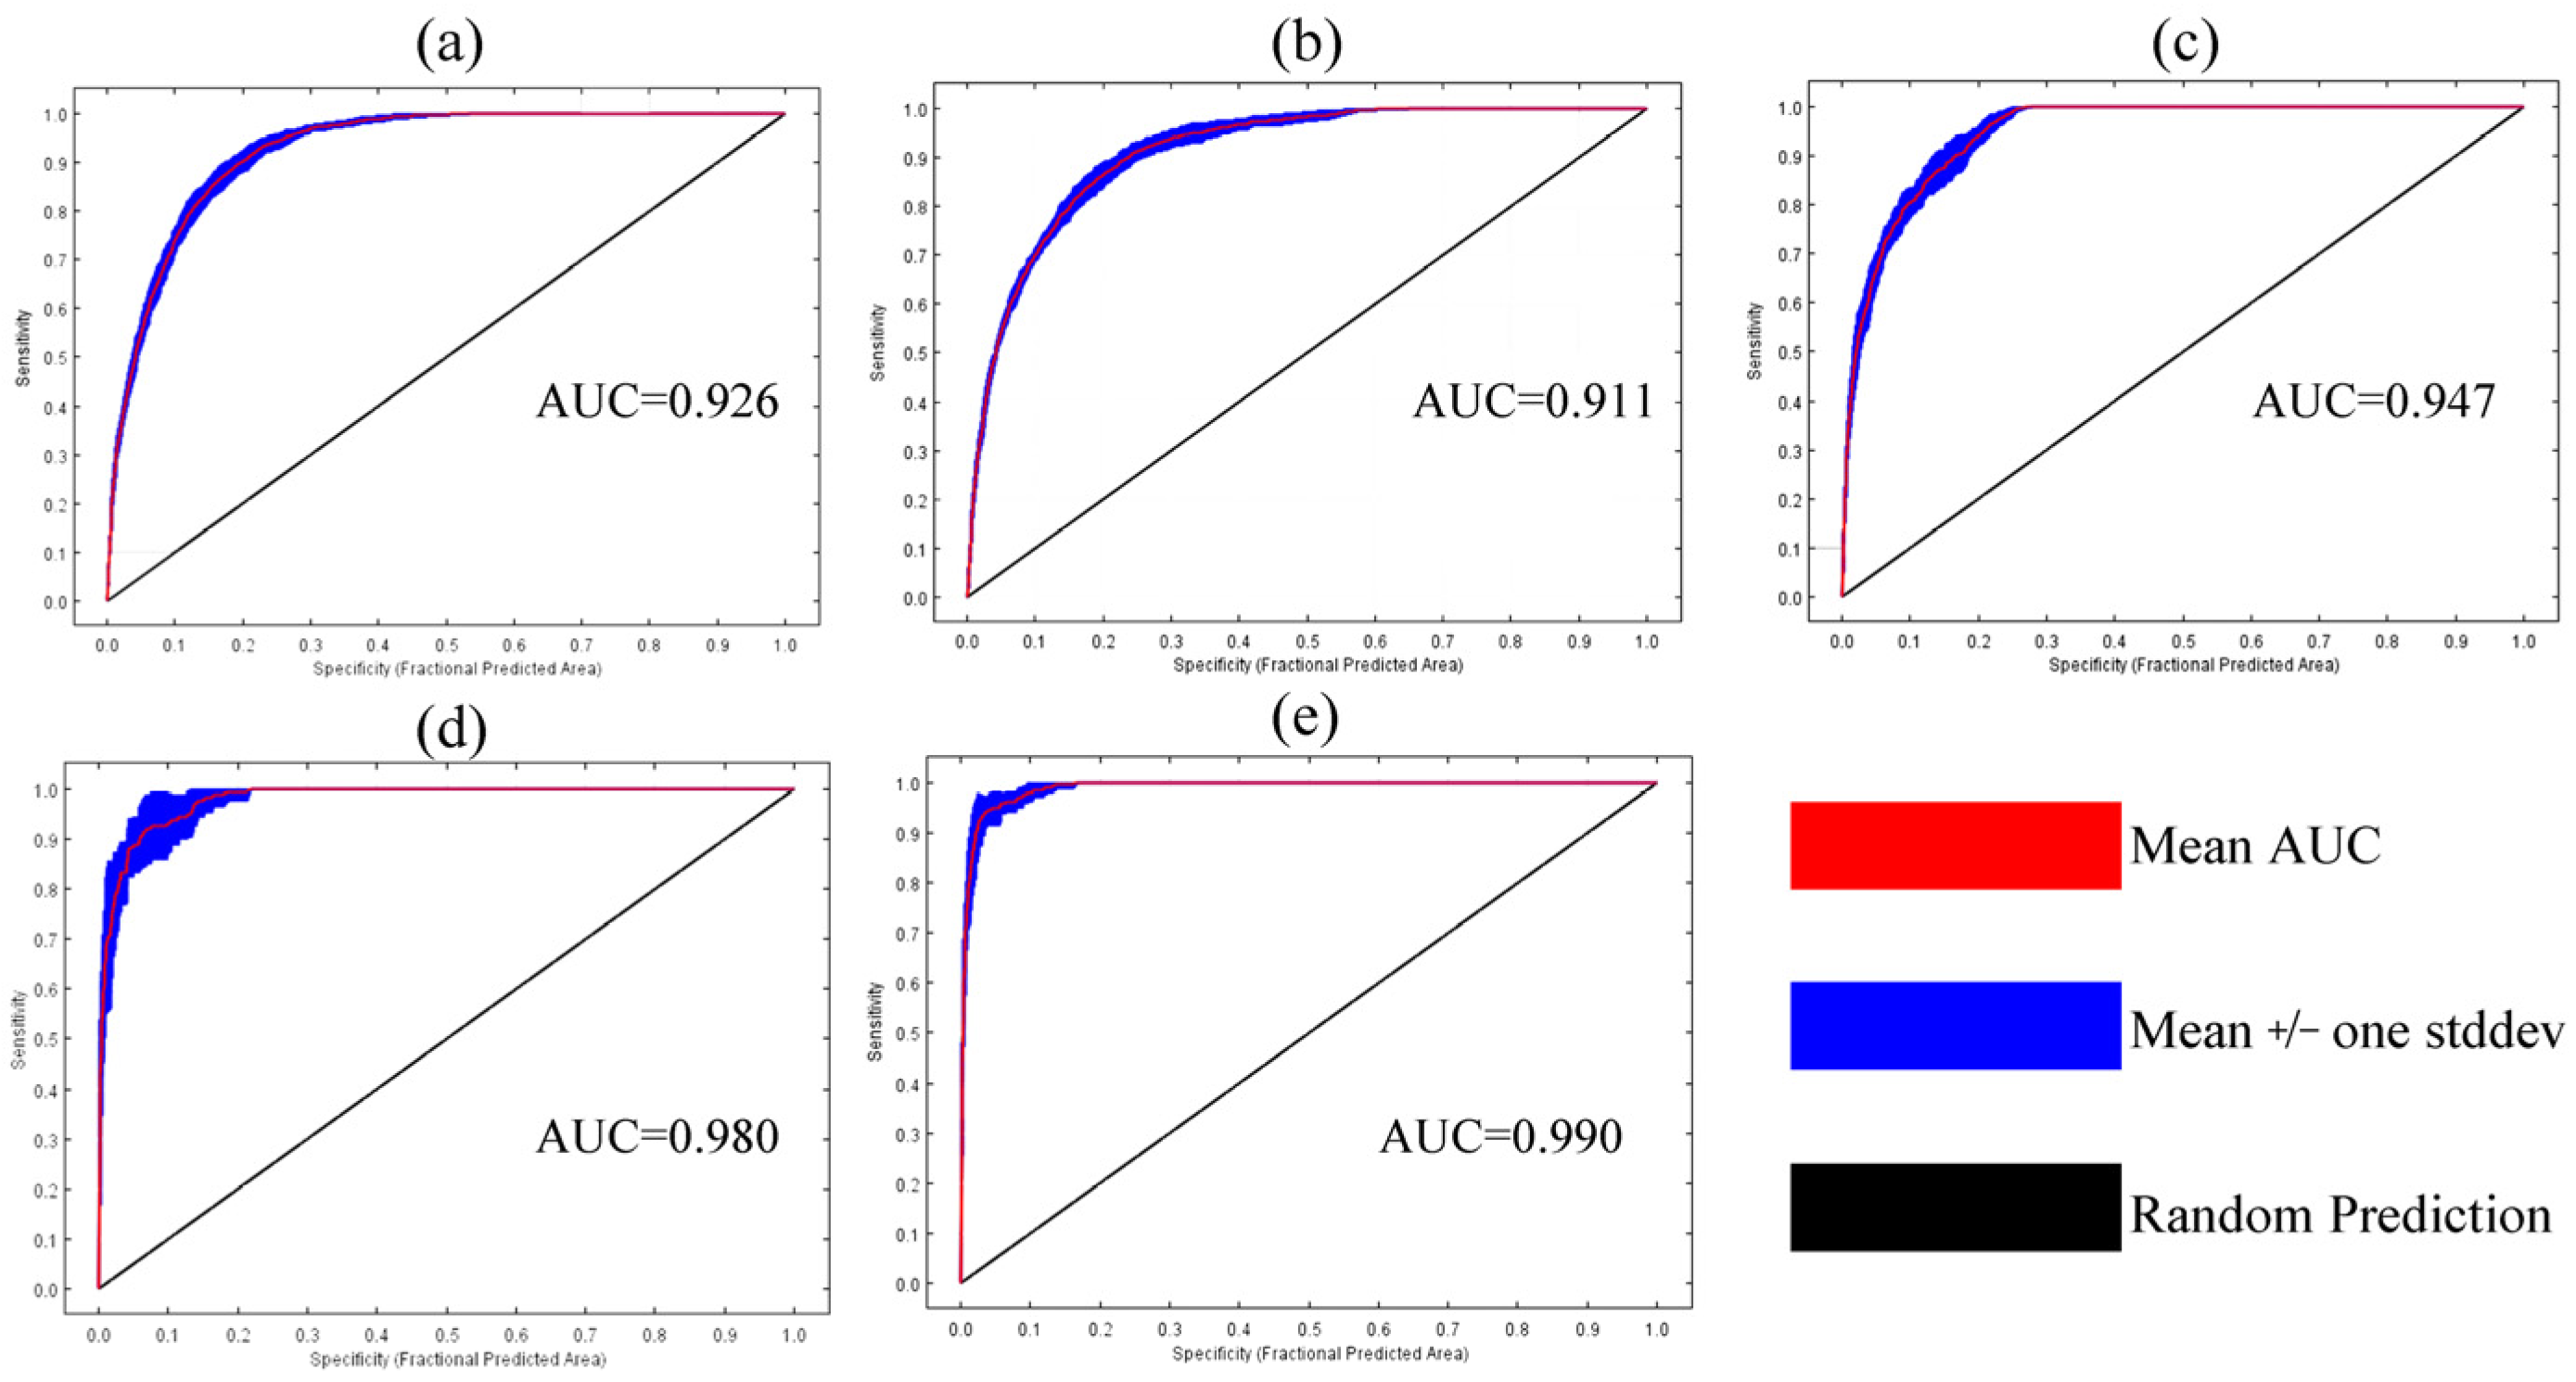
The average AUC from ten replicates demonstrates high predictive accuracy and strong model discrimination. The mean AUC values for I. nil, I. purpurea, and I. quamoclit were 0.926, 0.911, and 0.947, respectively. Although I. lacunosa and I. alba were modeled using the default settings, they still reached high AUC levels at 0.980 and 0.990, respectively (Figure 3 and Table 3).

3.2. Key Environmental Factors Influencing the Ipomoea Invasion

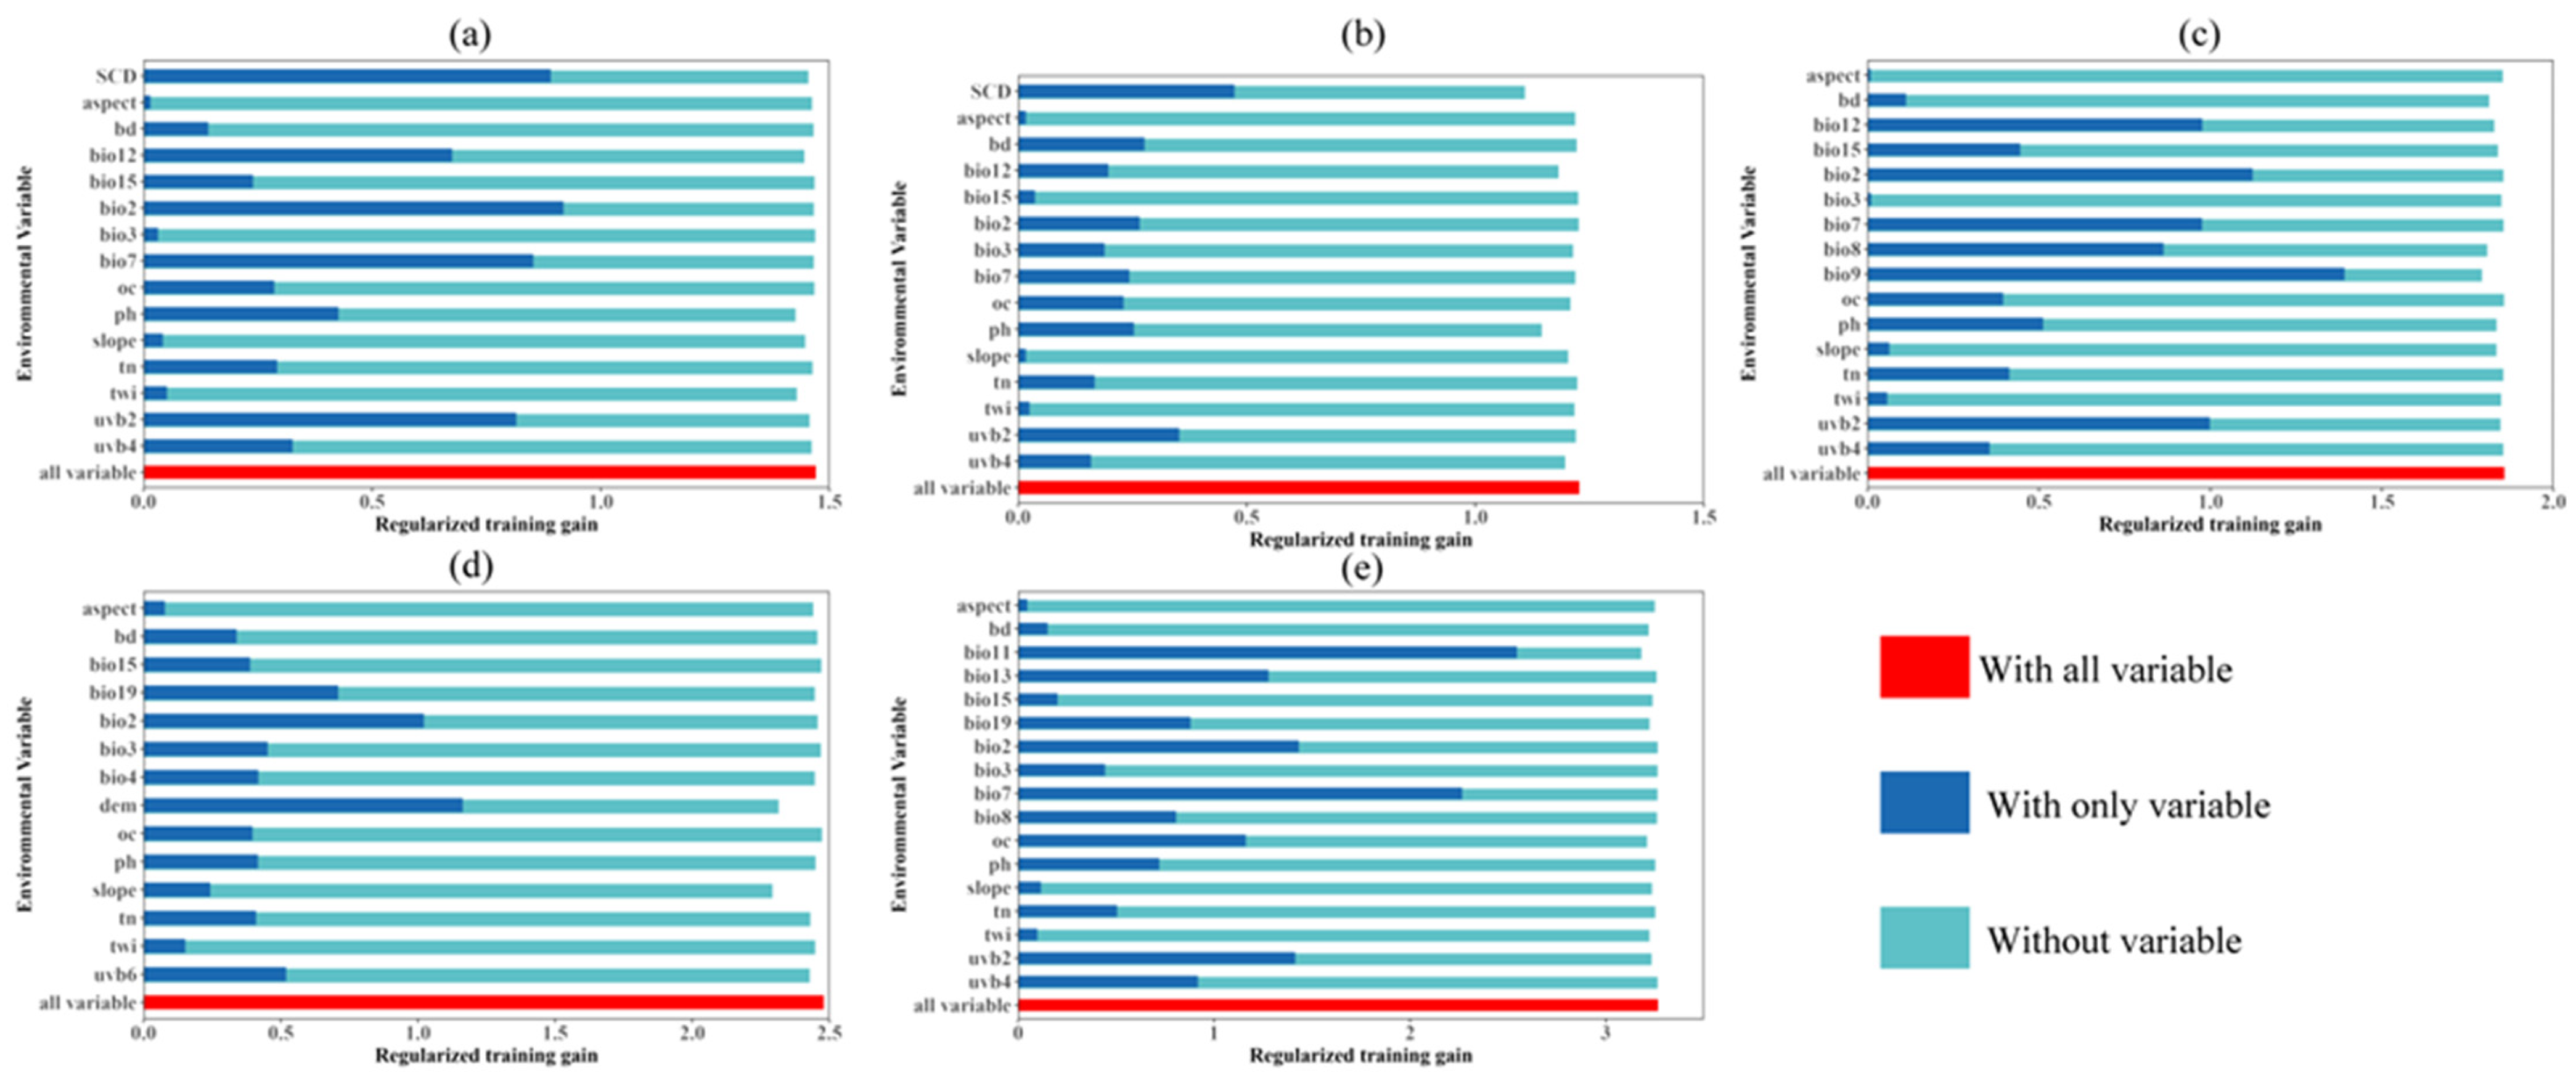
Table 4 shows the impact of various environmental variables on the potential habitats of five invasive plants in Ipomoea. Meanwhile, the jackknife test (Figure 4) shows the relative importance of individual environmental factors, residual variables after removing factors, and a complete model that includes all variables. Based on this, the study identified the most influential variables as the key factors determining the likely ranges of the five invasive Ipomoea species and analyzed the response curves for each species. In these response curves, the red and gray shaded areas represent the mean and standard deviation across ten model runs, respectively (Figure S2).
The distribution of I. nil was primarily associated with SCD, Bio7 (Temperature annual range), and pH. Its occurrence probability showed a continuous decline with increasing SCD and Bio7, suggesting a preference for areas with fewer snow-covered days and a relatively narrower annual temperature range. The optimal pH range was 5.6–7.8, with the highest occurrence probability (approximately 0.78) at around pH 7.0.
For I. purpurea, SCD, pH, and Bio12 (Annual precipitation) were the main environmental predictors. Occurrence probability declined with increasing SCD, whereas its response to pH was highest within the range of 6.4–8.2, reaching a maximum of approximately 0.85 at pH 7.5. The occurrence probability remained above 0.5 across a broad range of Bio12 (500–7000 mm), with the highest probability (approximately 0.77) occurring at around 800 mm.
The distribution of I. quamoclit was primarily associated with Bio9 (Mean temperature of the driest quarter), Bio12, and UV-B2 (UV-B Radiation Seasonality). Its occurrence probability increased with Bio9 and reached approximately 0.98 at around 29 °C. The response of I. quamoclit to Bio12 was relatively broad, with occurrence probabilities above 0.5 between 1200 and 6200 mm and a peak of approximately 0.95 at around 3500 mm. In contrast, occurrence probability showed a generally negative response to UV-B2 and declined markedly at relatively high UV-B2 levels, suggesting that strong UV-B radiation seasonality may constrain the habitat suitability of I. quamoclit.
For I. lacunosa, elevation, Bio19 (Precipitation of coldest quarter), and slope were the primary predictors. Its occurrence probability decreased with increasing elevation. The response to Bio19 was highest within 50–700 mm, reaching a peak probability of approximately 0.85 at 150 mm. The suitable slope range was 0–5°, with the highest occurrence probability (approximately 0.70) at 0°.
The distribution of I. alba was primarily associated with Bio11 (Mean Temperature of Coldest Quarter), OC (soil organic carbon), and Bio7. Its occurrence probability increased with Bio11 and OC, whereas a decreasing trend was observed with increasing Bio7.

3.3. Potential Distribution Under Current Climatic Circumstances

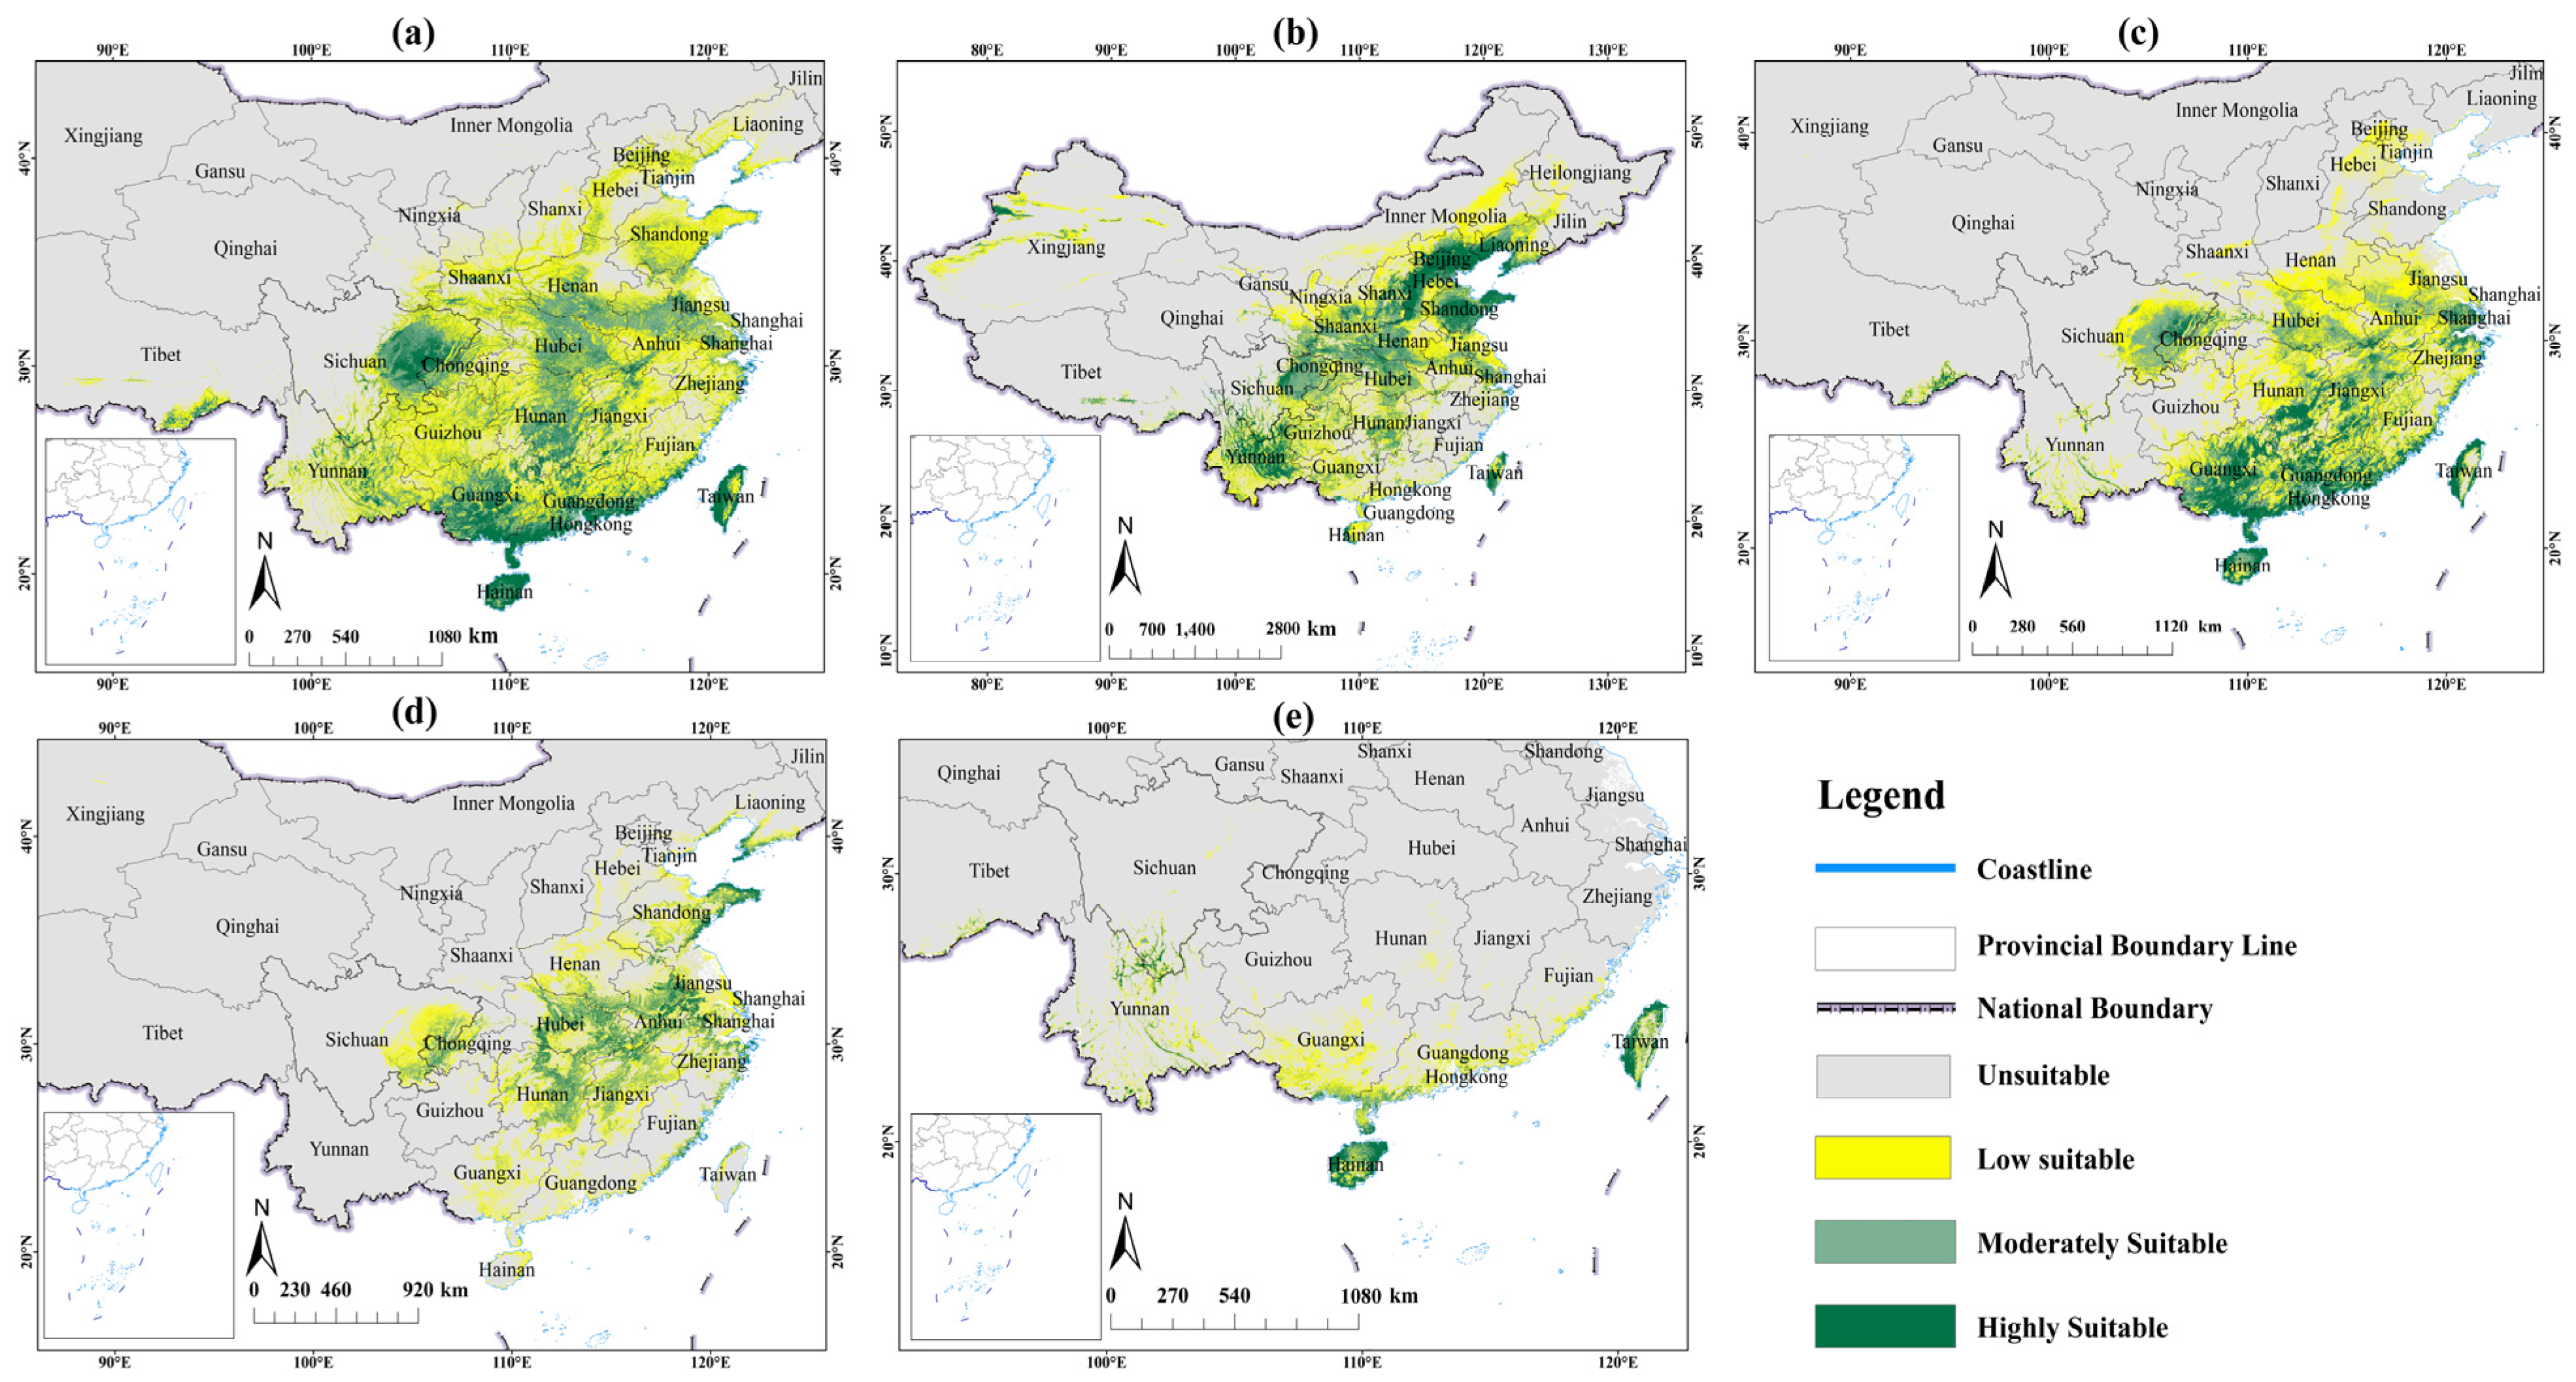
Using the results from MaxEnt predictions, potentially suitable habitat patterns for five invasive Ipomoea species in the current period were obtained (Figure 5).
I. nil was mainly distributed in southern and southwestern China, particularly across Chongqing, Guangxi, and Guangdong, with 37.19 × 10⁴ km2 of highly suitable habitat extending toward the southeastern coast. I. purpurea exhibited the broadest potential distribution, with highly suitable habitats (57.55 × 10⁴ km2) concentrated in Guangxi, Guangdong, Fujian, Taiwan, and southeastern Chongqing, while moderately suitable areas extended toward the middle and lower reaches of the Yangtze River and the Yunnan–Guizhou Plateau. I. quamoclit showed a similar southern distribution pattern, with 26.48 × 10⁴ km2 of highly suitable habitat mainly occurring in southern China and the southeastern coastal region, and moderately suitable areas extending into central-southern and eastern southwestern China. In contrast, I. lacunosa displayed a more localized distribution, with 10.56 × 10⁴ km2 of highly suitable habitat concentrated in the middle and lower reaches of the Yangtze River, particularly around eastern Chongqing, northeastern Guizhou, and northern Fujian. I. alba had the most restricted potential distribution, with 3.70 × 10⁴ km2 of highly suitable habitat primarily located in Hainan and Taiwan, while moderately suitable areas occurred mainly in central Yunnan and southeastern Tibet. Overall, the five species shared a predominantly southern distribution pattern but differed substantially in the extent and spatial configuration of their potential habitats.

3.3.1. Potential Habitat of I. nil Under Projected Climate Scenarios

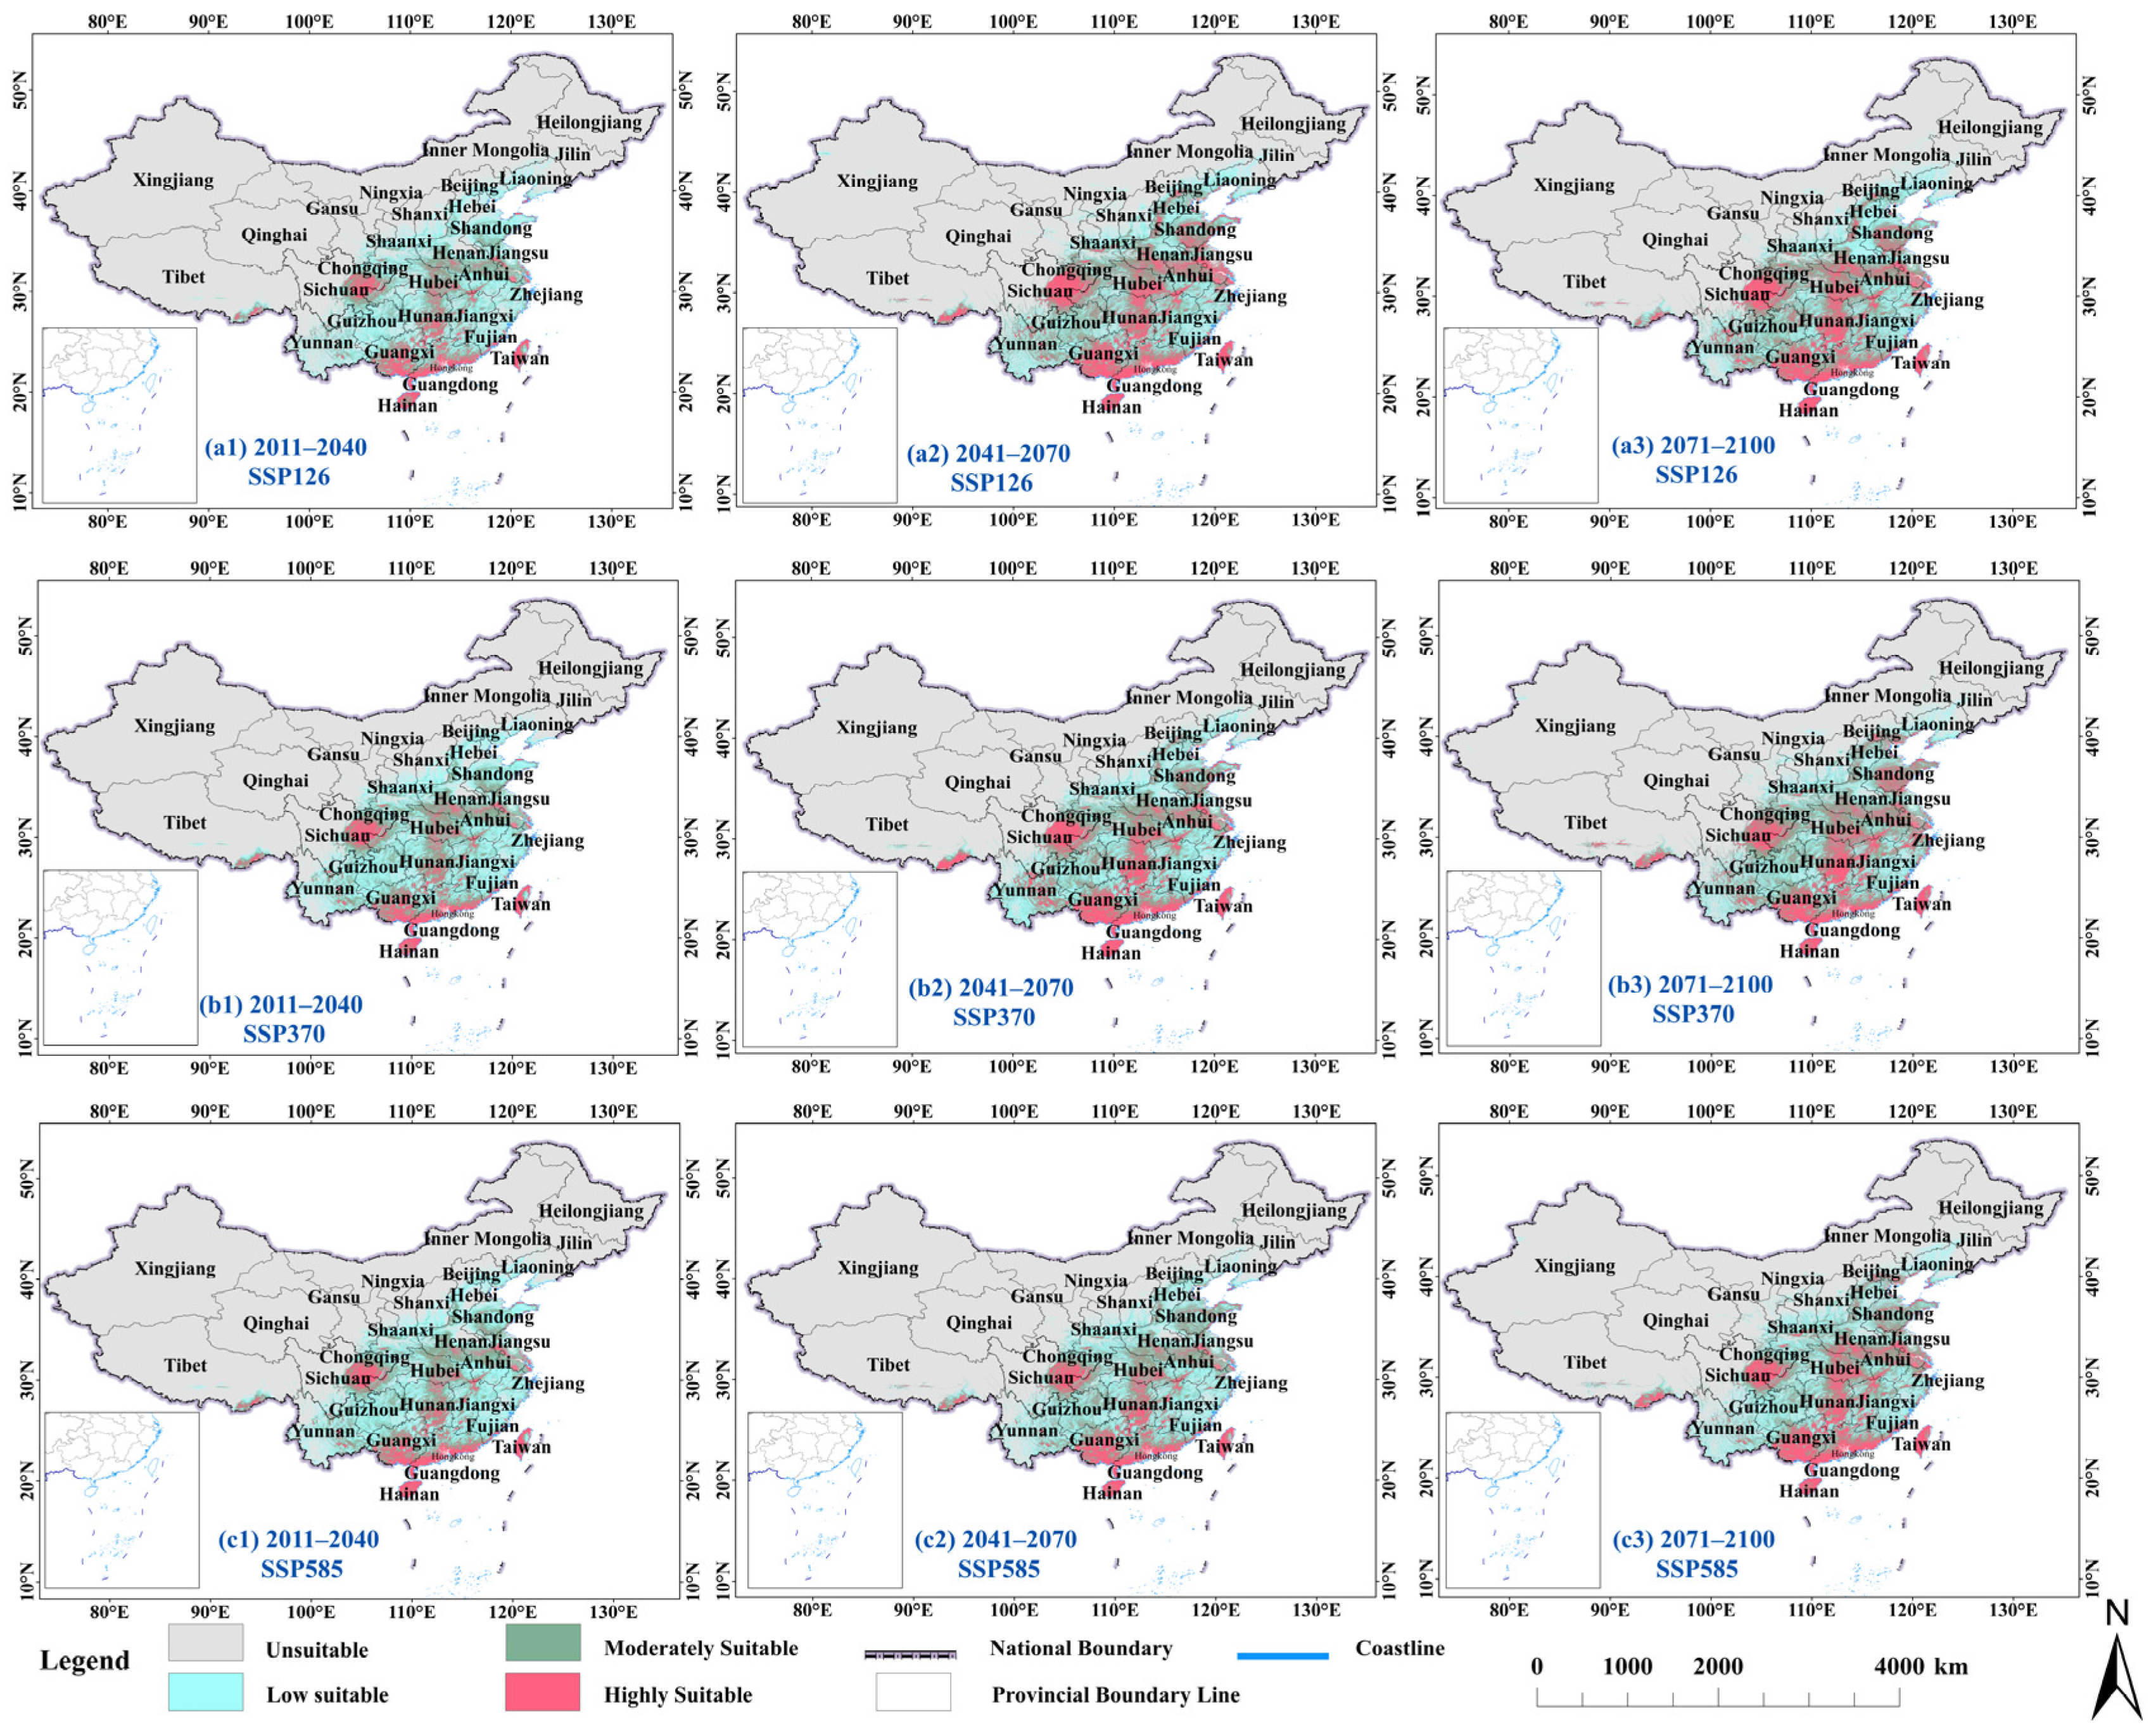
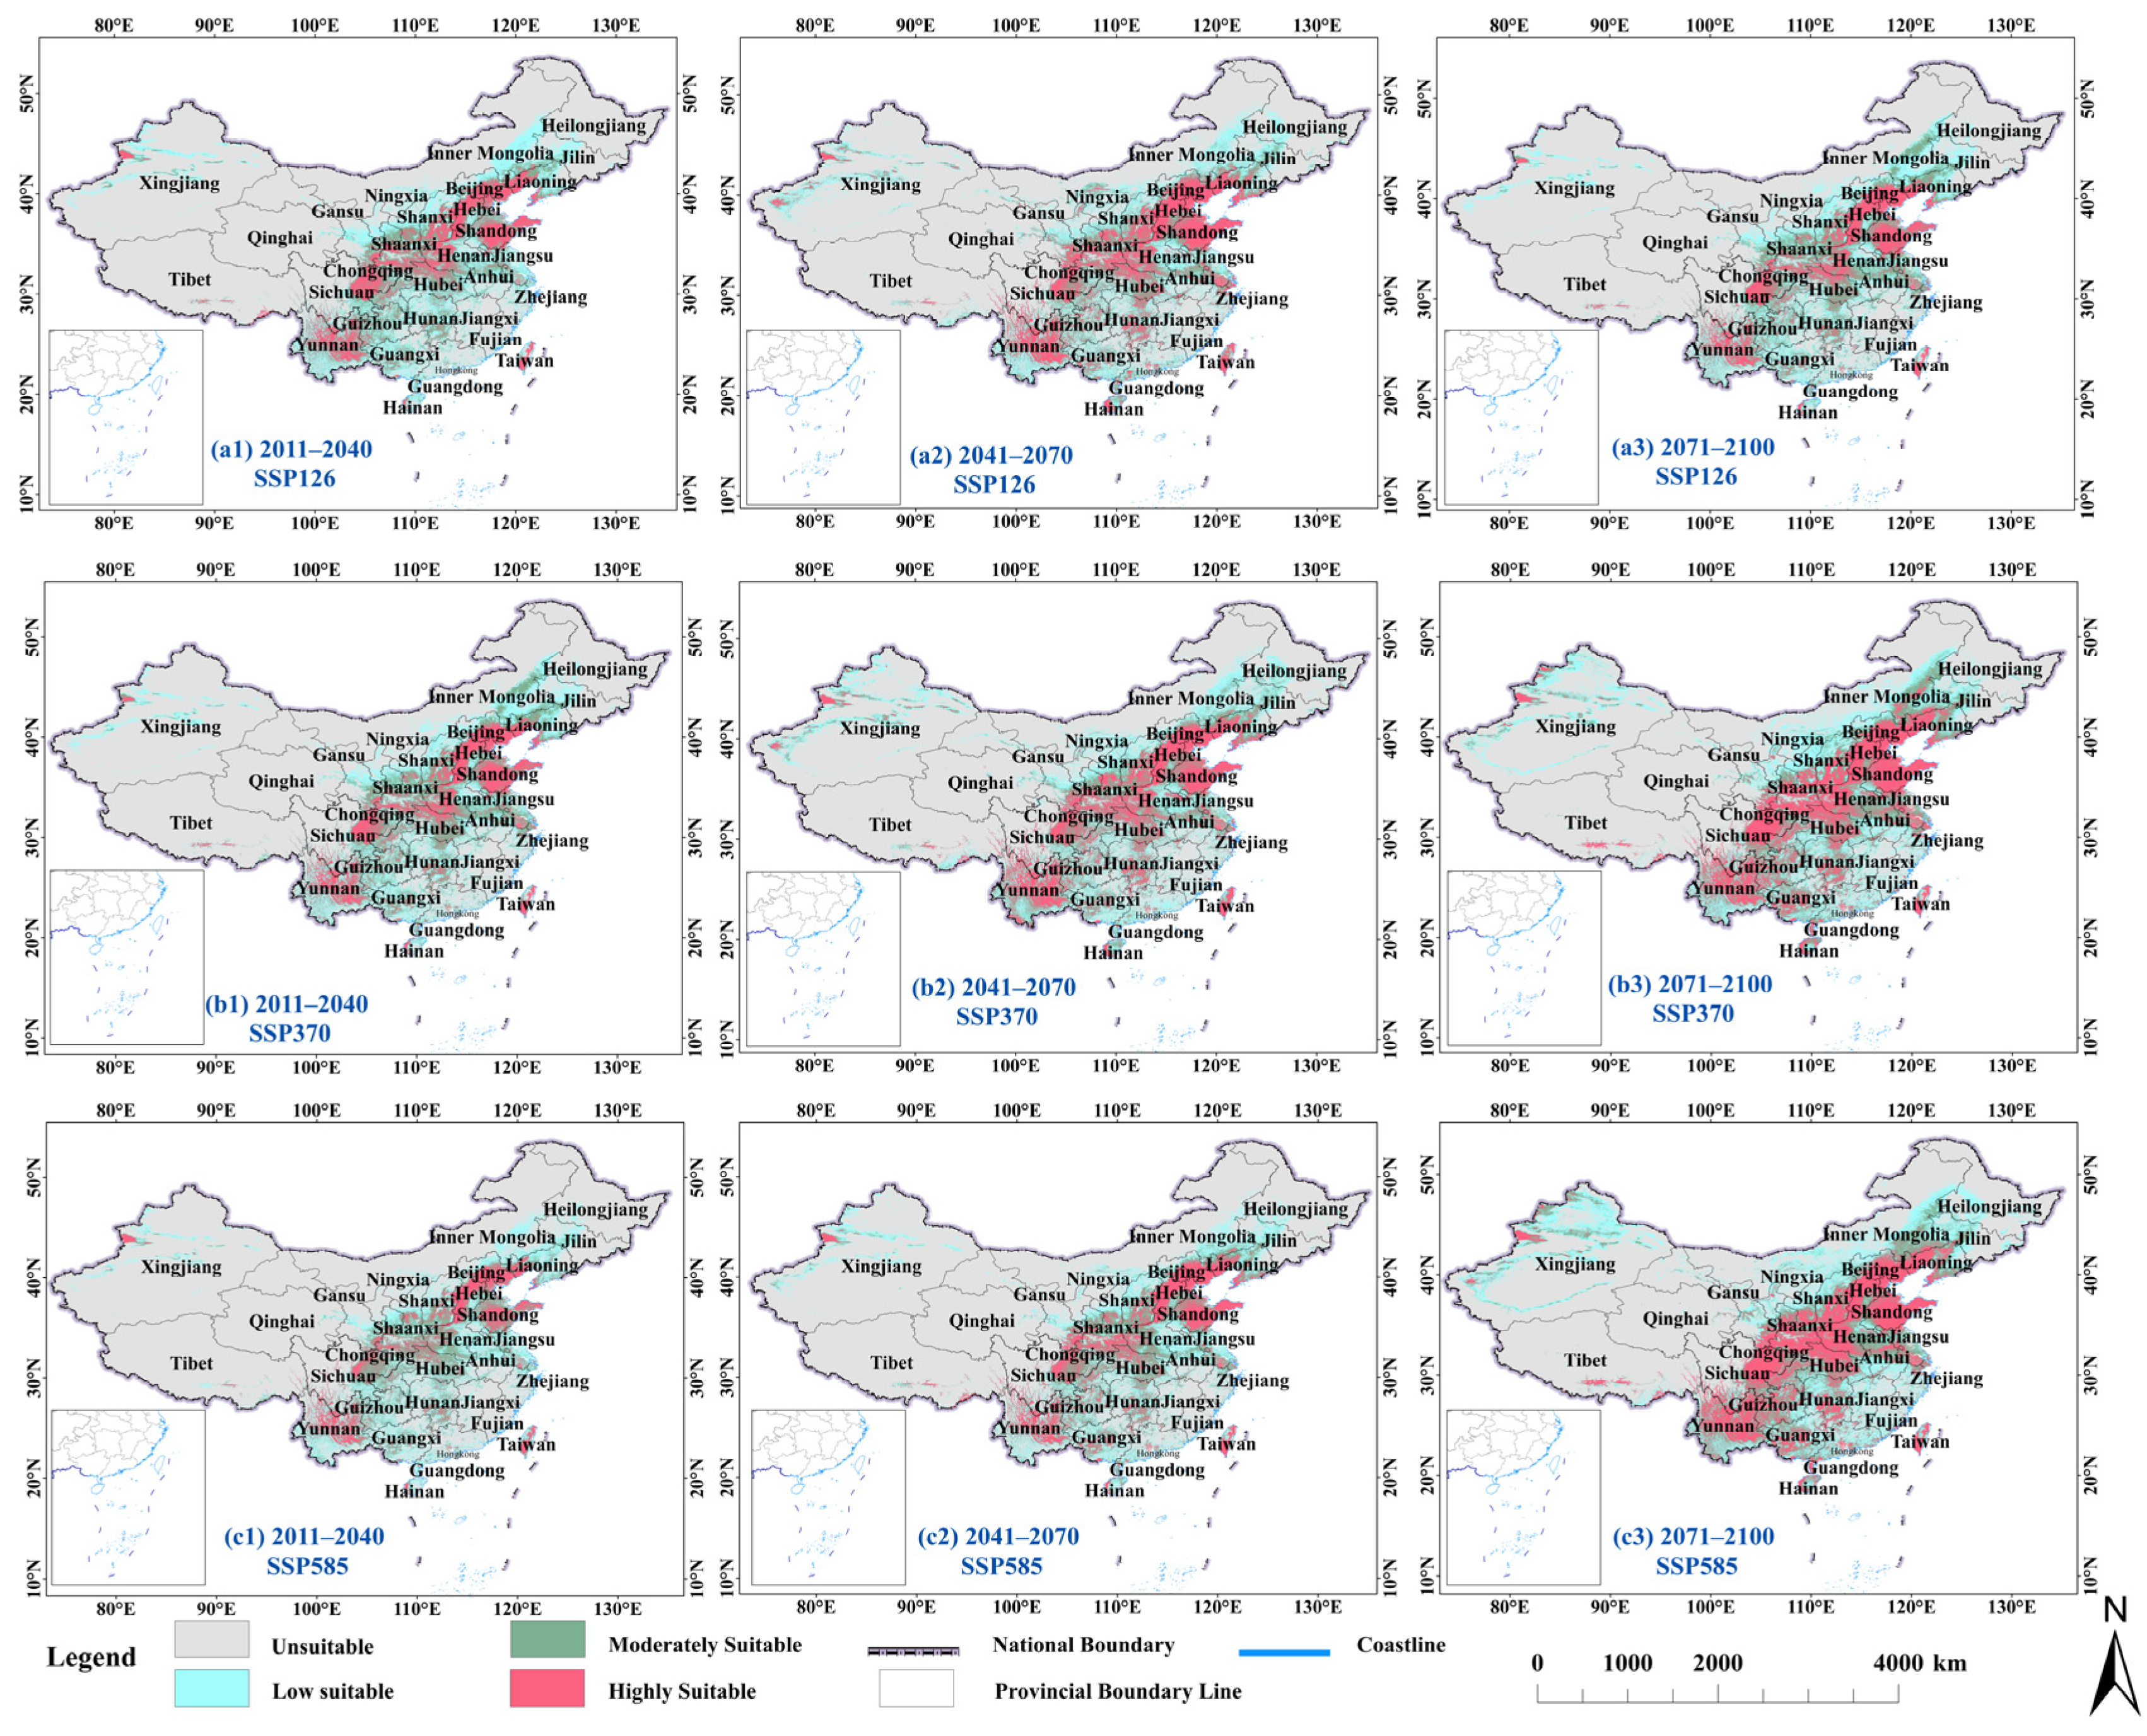
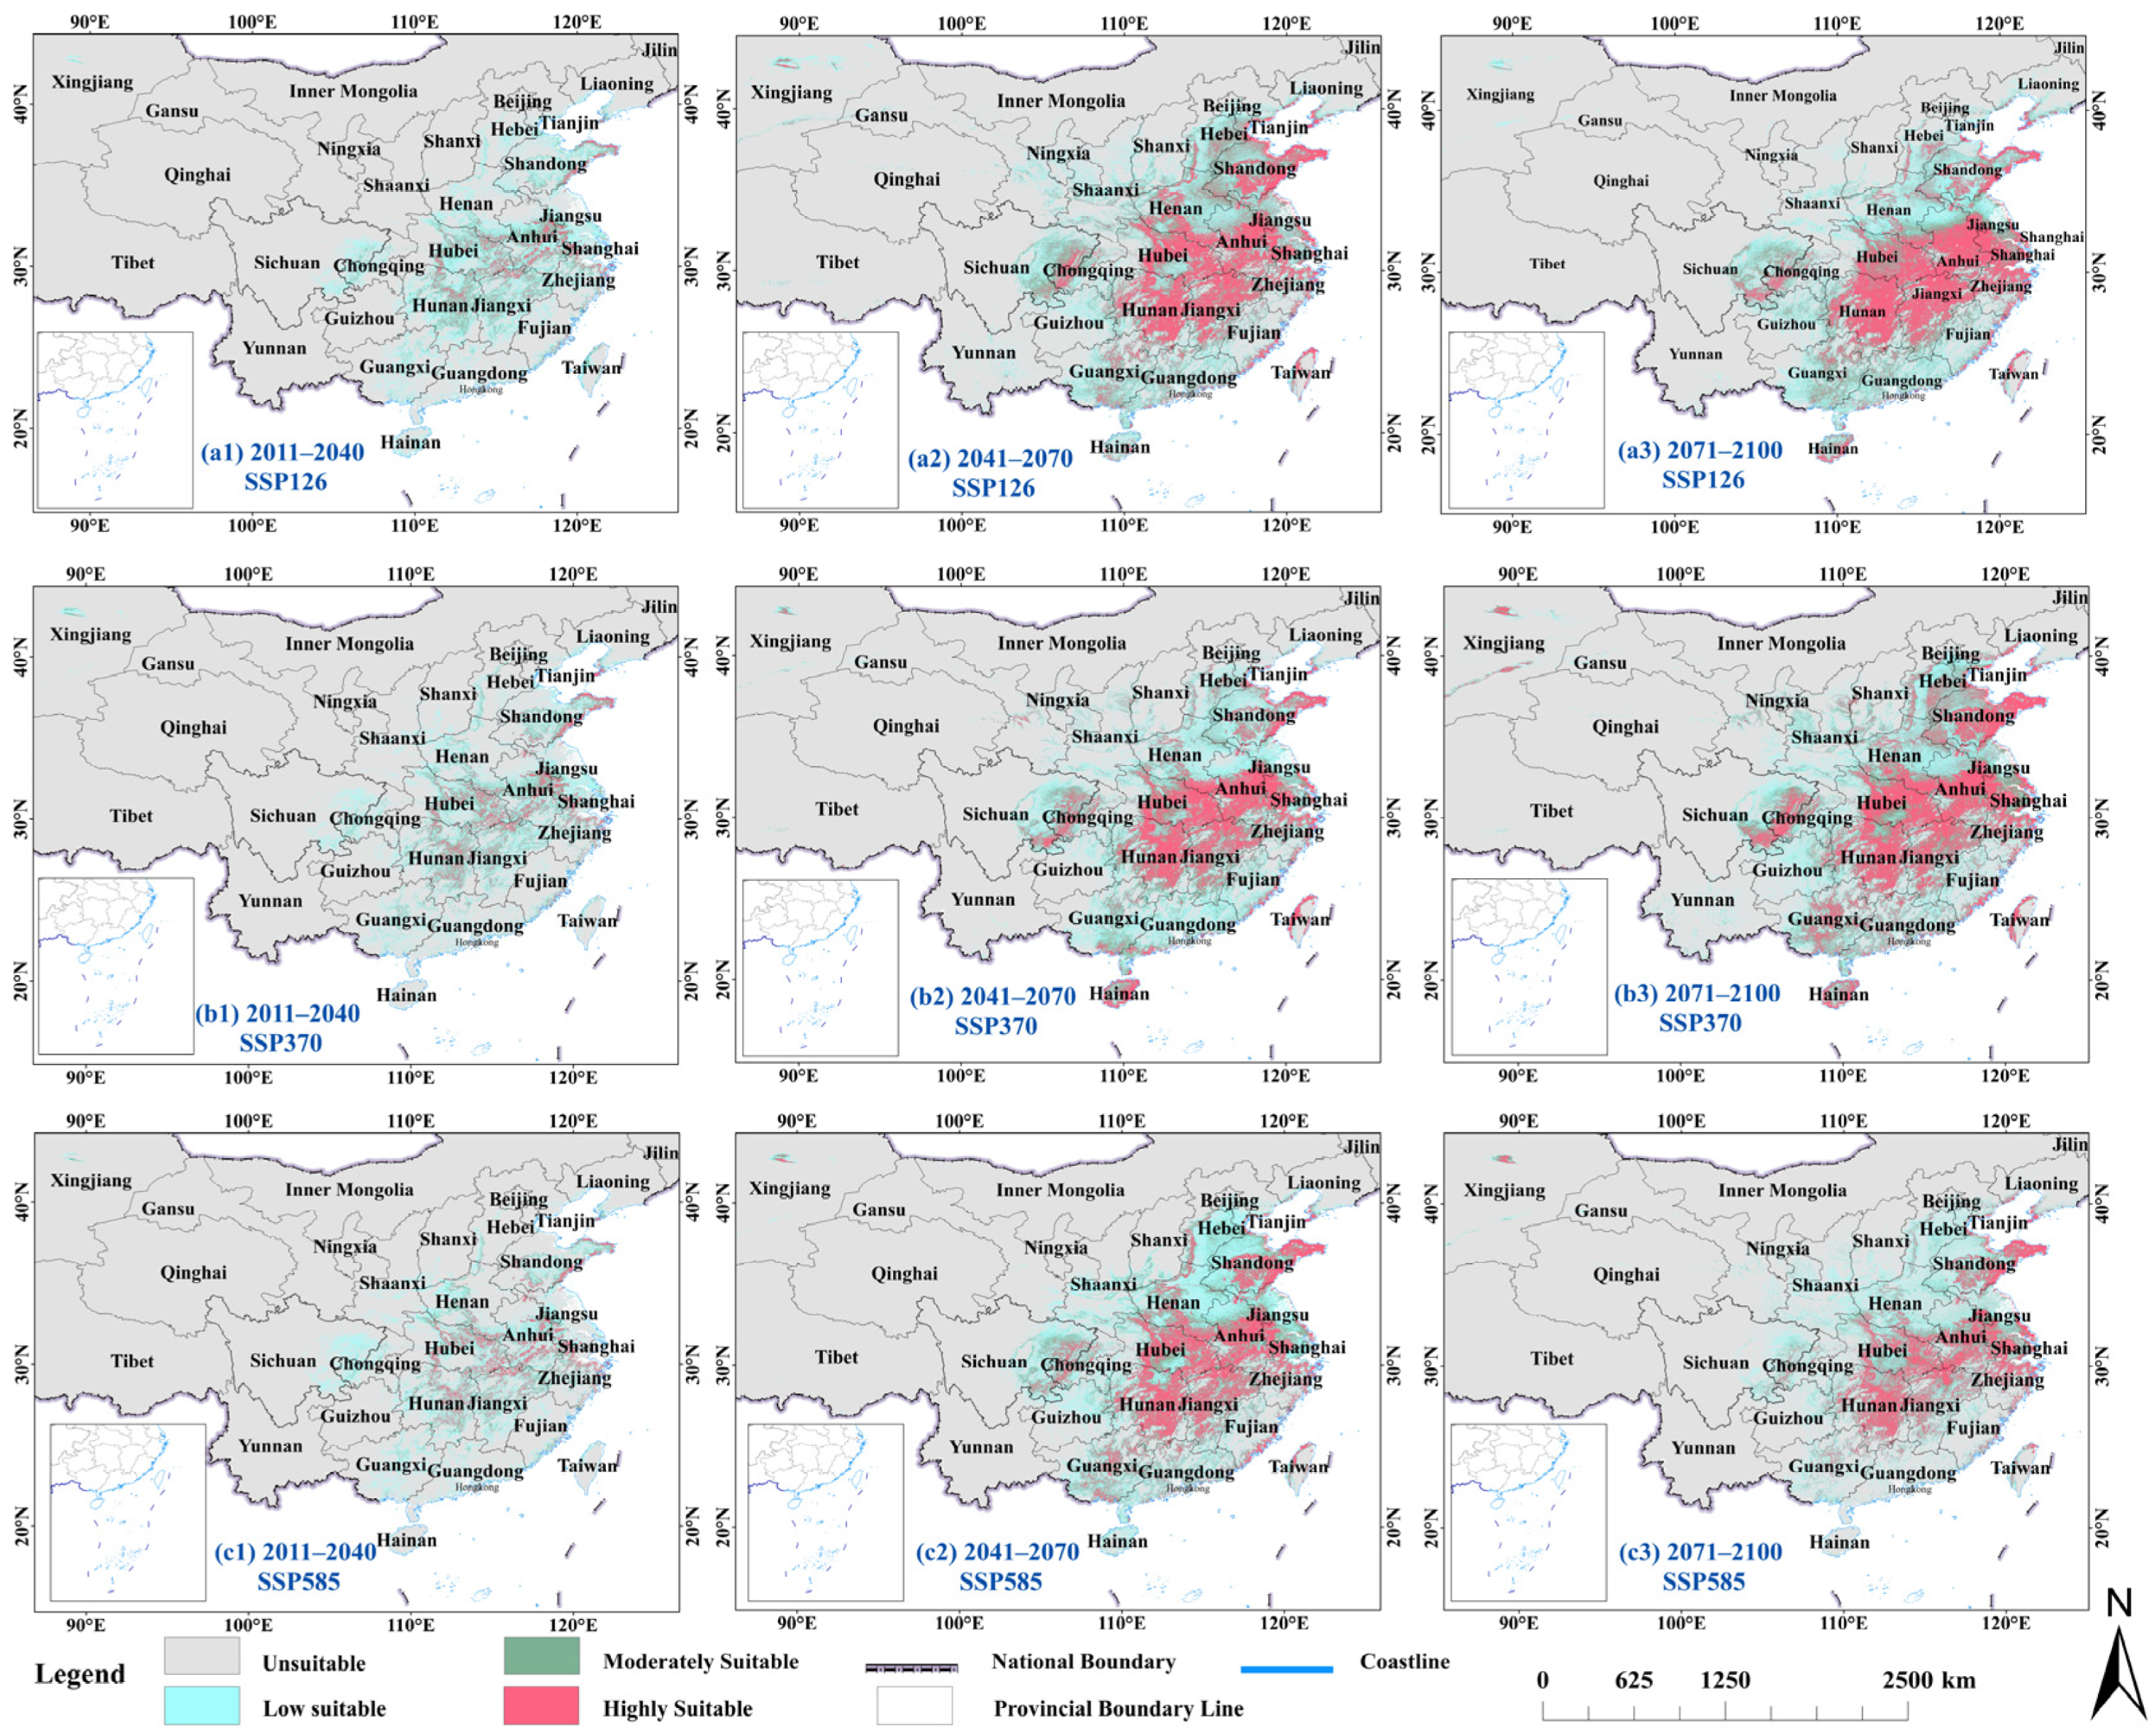
Figure 6 and Table 5 show that the potentially suitable area for I. nil exhibits different change responses under different climate scenarios in the future. Compared with the current total suitable area (suitability value ≥ 0.4; 105.27 × 10⁴ km2), the total suitable area of I. nil was projected to expand under all three future climate scenarios, with the magnitude of expansion increasing over time. Under SSP126, the highly suitable area showed the most pronounced expansion during 2041–2070, reaching 86.48 × 10⁴ km2, an increase of 132.45% relative to the current period. Under SSP370, the moderately and highly suitable areas continued to expand, resulting in a total suitable area of 181.57 × 10⁴ km2 by the end of the 21st century, representing a 72.48% increase relative to the current period. Under SSP585, areas with low suitability decreased progressively, with a corresponding shift toward moderate and high suitability levels. Spatially, highly suitable areas were projected to expand primarily toward northern China, the Huai River Basin, and southwestern China, while moderately suitable areas extended toward northeastern and northwestern China.

3.3.2. Potential Habitat of I. purpurea Under Projected Climate Scenarios

The MaxEnt projections indicated that the total suitable area of I. purpurea generally increased under the three future climate scenarios (Figure 7 and Table 6). The current total suitable area was 140.10 × 10⁴ km2. It increased progressively under SSP126 and SSP370, whereas SSP585 showed a slight decline during 2011–2040 followed by a marked expansion to 255.84 × 10⁴ km2 during 2071–2100, representing an 82.61% increase relative to the current period. The highly suitable area reached its greatest increase under SSP370, at 138.71 × 10⁴ km2 (141.02%), while the moderately suitable area generally expanded over time. The potential range of I. purpurea was projected to shift toward northern and western China. Moderately suitable habitats reached the margins of the Qinghai–Tibet Plateau and Inner Mongolia, whereas highly suitable habitats became more extensive across Northeast China, Northwest China, and inland North China, indicating an increasing potential invasion risk in these regions under future climate scenarios.

3.3.3. Potential Habitat of I. quamoclit Under Projected Climate Scenarios

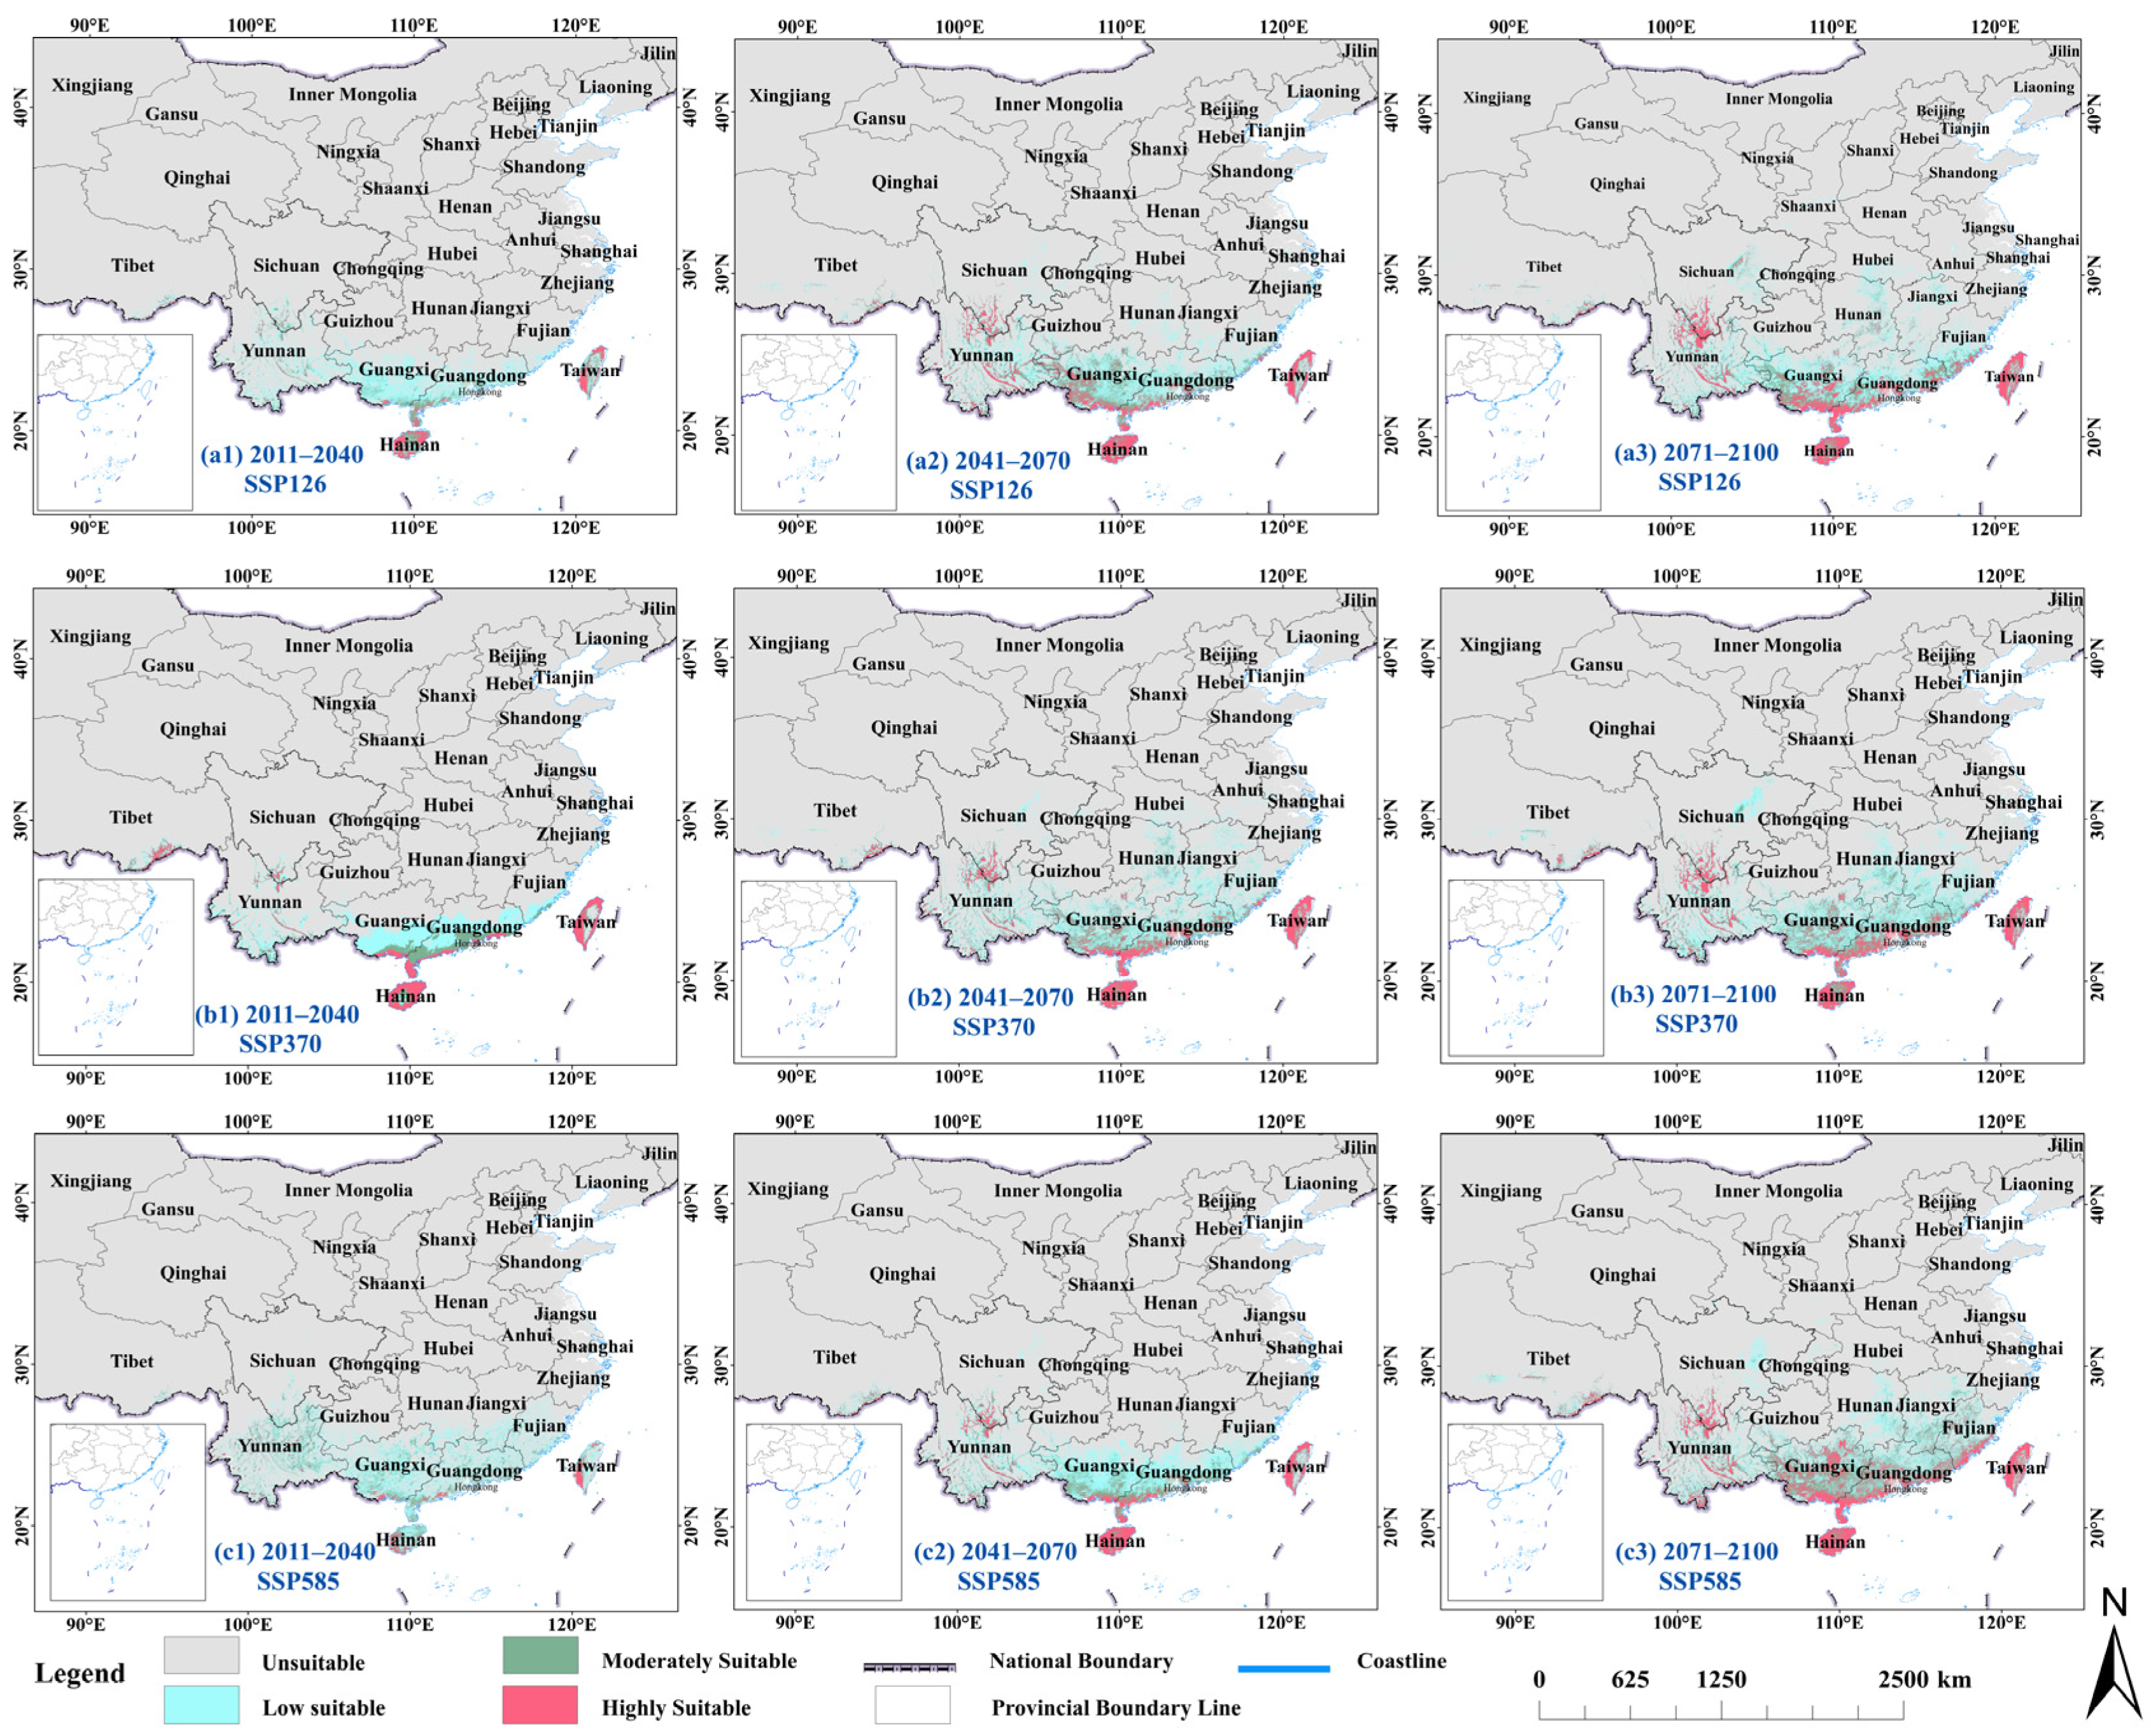
I. quamoclit suitable areas consistently expanded under all three future climate scenarios (Figure 8 and Table 7). The highly suitable area of I. quamoclit increased markedly under SSP126 and SSP370, particularly under SSP370, reaching 65.40 × 10⁴ km2 during 2041–2070, an increase of 146.97%, with moderately suitable areas simultaneously expanding over time. By contrast, SSP585 showed an initial decline in total suitable area, with the largest reduction occurring in the moderately suitable area during 2011–2040 (31.70 × 10⁴ km2; −25.05%), followed by a gradual recovery and increase in total suitable area over the subsequent periods. The potential distribution was projected to shift toward northern and western China, with highly suitable habitats extending into North China, the Huang Huai region, and southwestern China, and moderately suitable habitats reaching further northwest and northeast.

3.3.4. Potential Habitat of I. lacunosa Under Projected Climate Scenarios

Compared with the current total suitable area (31.16 × 10⁴ km2), I. lacunosa is projected to initially decline before expanding rapidly under future climate scenarios (Figure 9 and Table 8). During 2011–2040, all suitability classes declined across the three scenarios, with the largest reduction in moderately suitable area under SSP585 (12.03 × 10⁴ km2; −40.02%). The suitable areas subsequently recovered and expanded, with the most pronounced increase in highly suitable habitat under SSP370 during 2071–2100, reaching 69.41 × 10⁴ km2, an increase of 557.21%. Future warming is projected to improve habitat suitability for I. lacunosa, expanding its potential distribution and increasing its invasion potential. Geographically, highly suitable habitats were projected to shift mainly northward, while moderately suitable habitats extended toward northwestern and southwestern China and low-suitability areas reached farther into northern and northwestern regions.

3.3.5. Potential Habitat of I. alba Under Projected Climate Scenarios

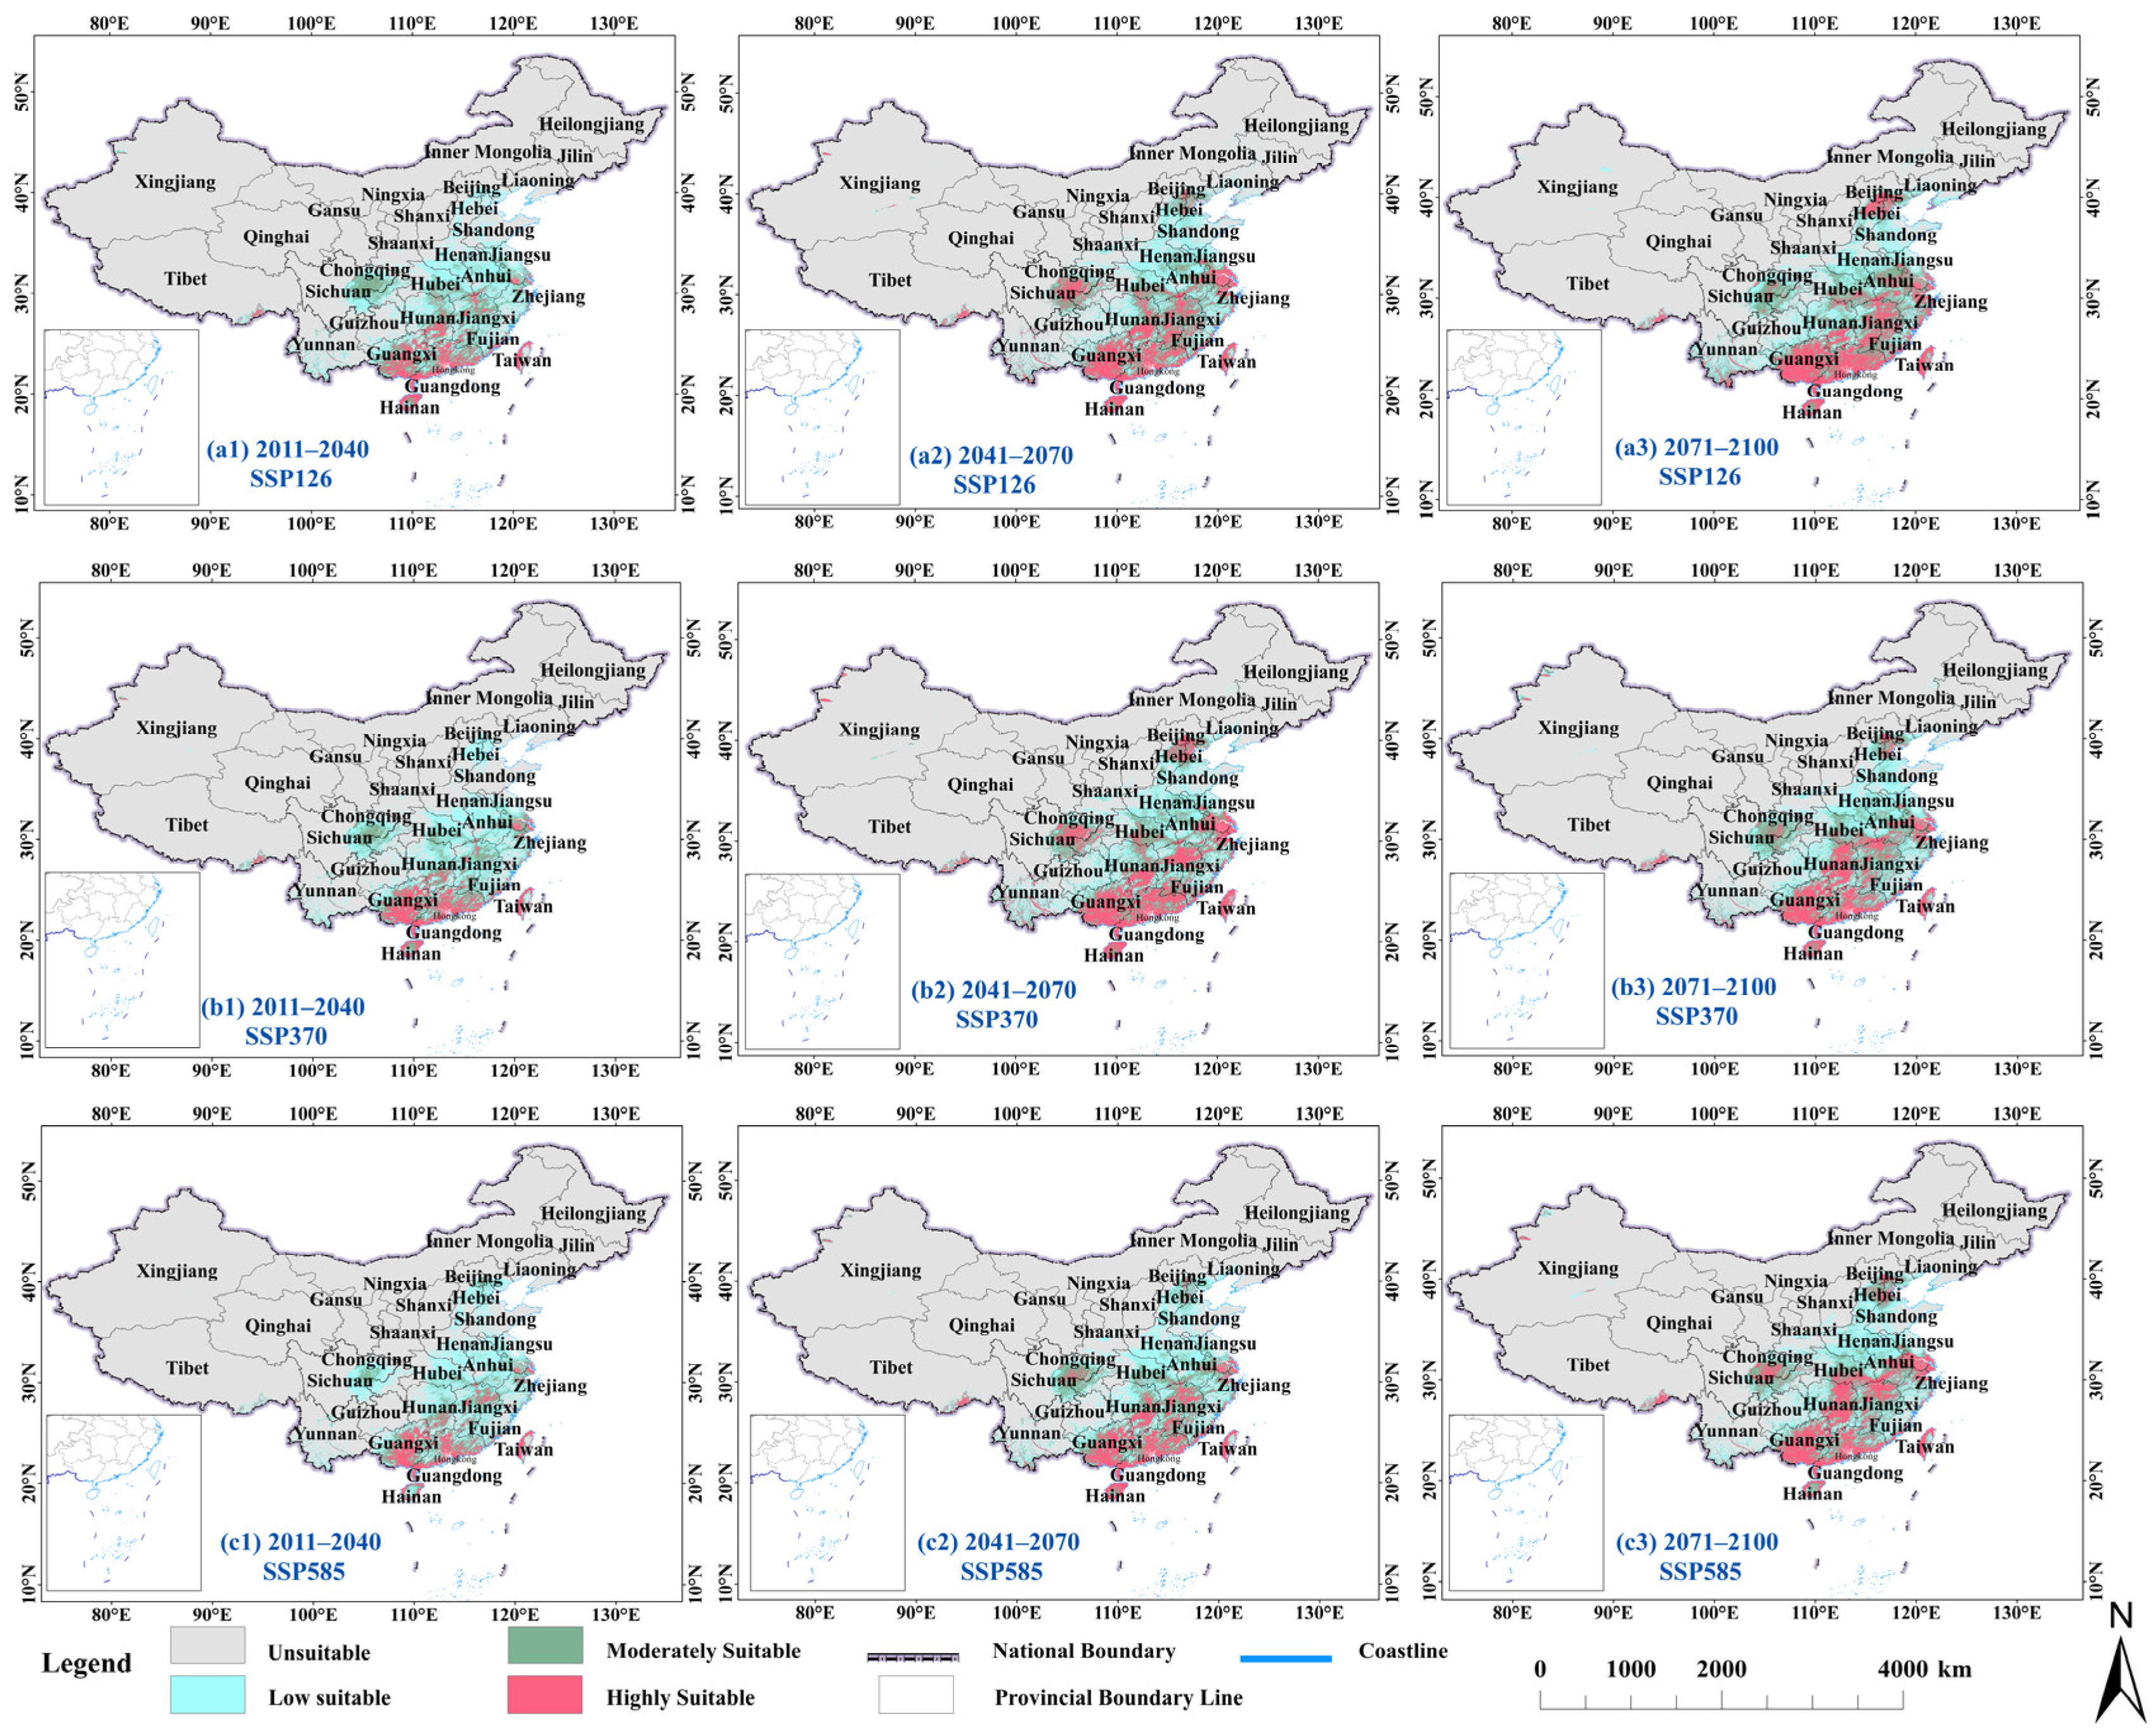
Compared with the current total suitable area (7.92 × 10⁴ km2), I. alba was projected to expand rapidly after an initial fluctuation under future climate scenarios (Figure 10 and Table 9). From 2011 to 2040, low suitability areas increased markedly, while moderately suitable areas expanded to varying degrees. In contrast, highly suitable areas declined slightly under SSP126 and SSP370 and more substantially under SSP585 (2.88 × 10⁴ km2; −22.39%). From 2041 onward, all suitability classes increased rapidly, with the most pronounced growth in highly suitable areas under SSP585, reaching 20.44 × 10⁴ km2 (451.79%). The total suitable area also increased substantially during the later periods, particularly under SSP585, reaching 38.75 × 10⁴ km2 (389.26%). Highly suitable areas expanded toward inland South China and southwestern China, while moderately and low suitability areas extended northward toward the Yangtze River Basin, indicating a progressive expansion of the suitable range under future climate scenarios.

3.4. Changes in Centroid Direction and Distance of 5 Plants in Ipomoea

As the climate changes, plant distribution centers adjust according to shifts in suitable habitat areas. Therefore, we plotted the migration patterns of the centroids of five potential distributions in Ipomoea (Figure 11, Figure 12, Figure 13, Figure 14 and Figure 15 and Table S2).
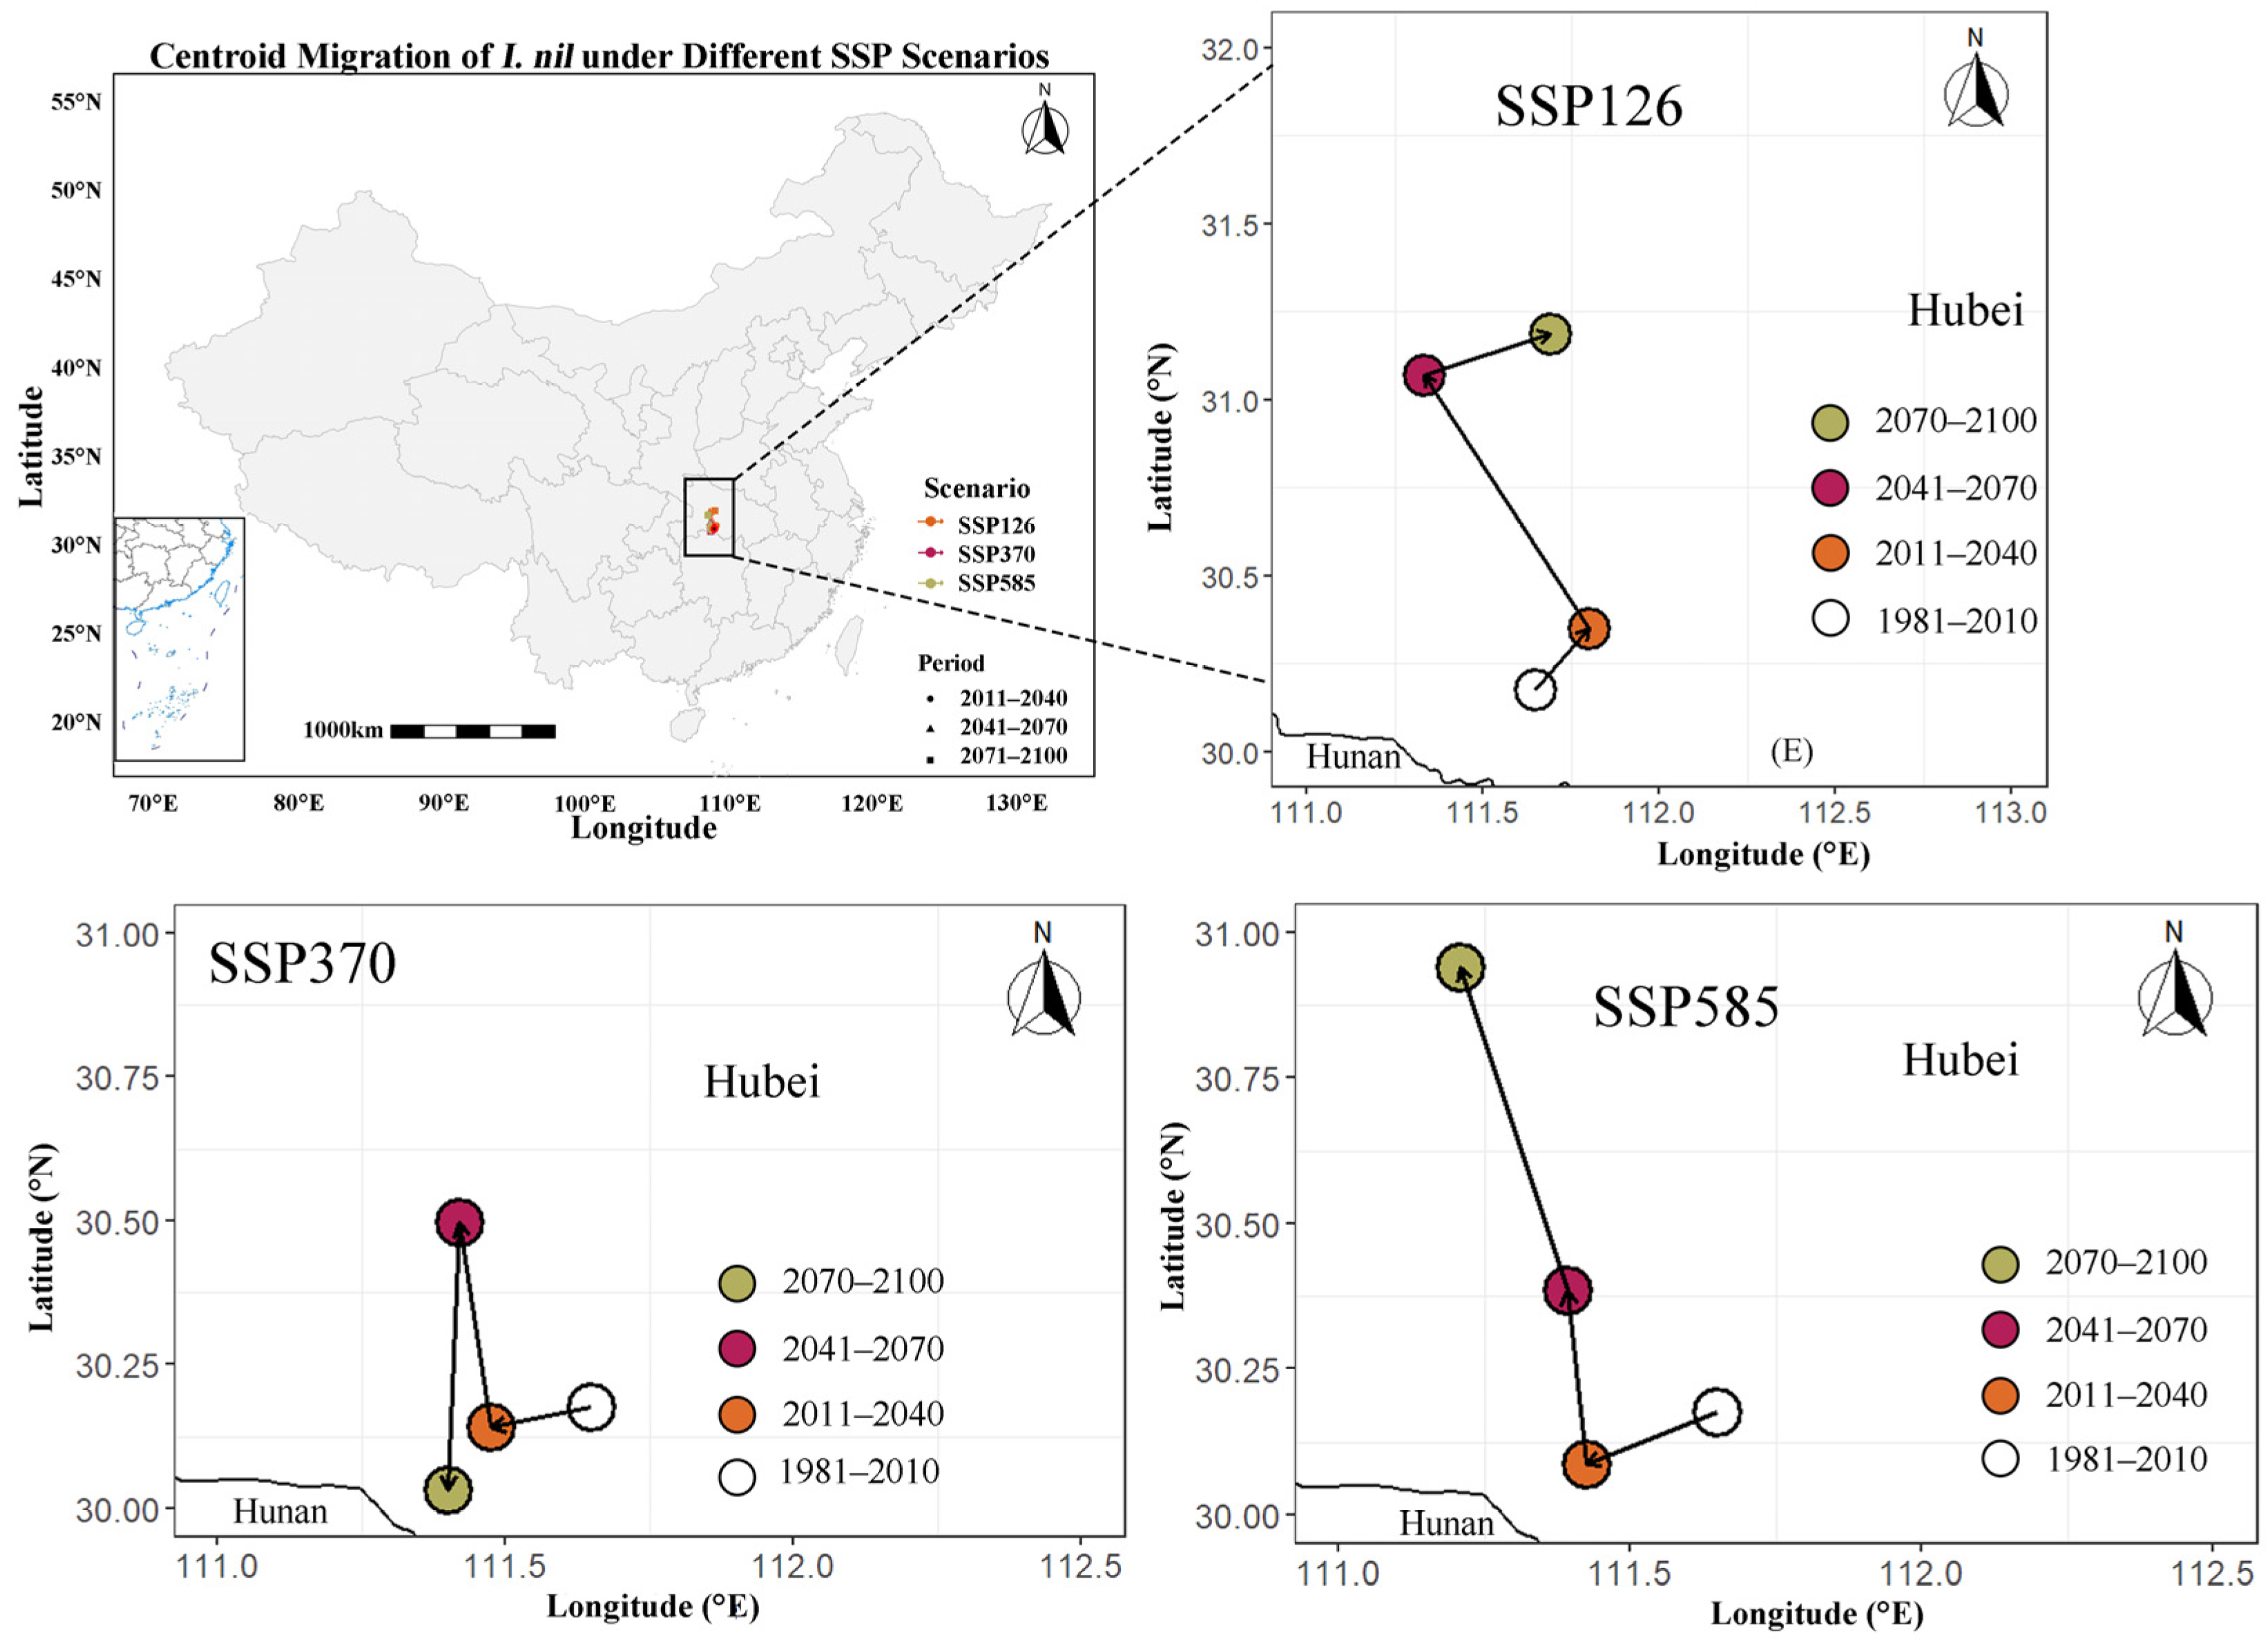
For I. nil (Figure 11), the current centroid was located in Yuan’an County, Hubei Province (111°38′56.4″ E, 30°10′33.6″ N). Under SSP126, it shifted northeastward by 24.25 km during 2011–2040, northwestward by 91.71 km during 2041–2070, and northeastward by 36.42 km thereafter, remaining within Yuan’an and Nanzhang counties (111°41′27.6″ E, 31°11′16.8″ N). Under SSP370, the centroid moved southwestward by 17.15 km, northwestward by 39.86 km, and southwestward by 51.55 km across the three periods, with the final position in Zhijiang City (111°24′3.6″ E, 30°1′55.2″ N). Under SSP585, it shifted southwestward by 23.79 km, northwestward by 33.16 km, and northwestward by 64.97 km, ultimately reaching Nanzhang County (111°12′32.4″ E, 30°56′24″ N). The largest displacement occurred under SSP585.
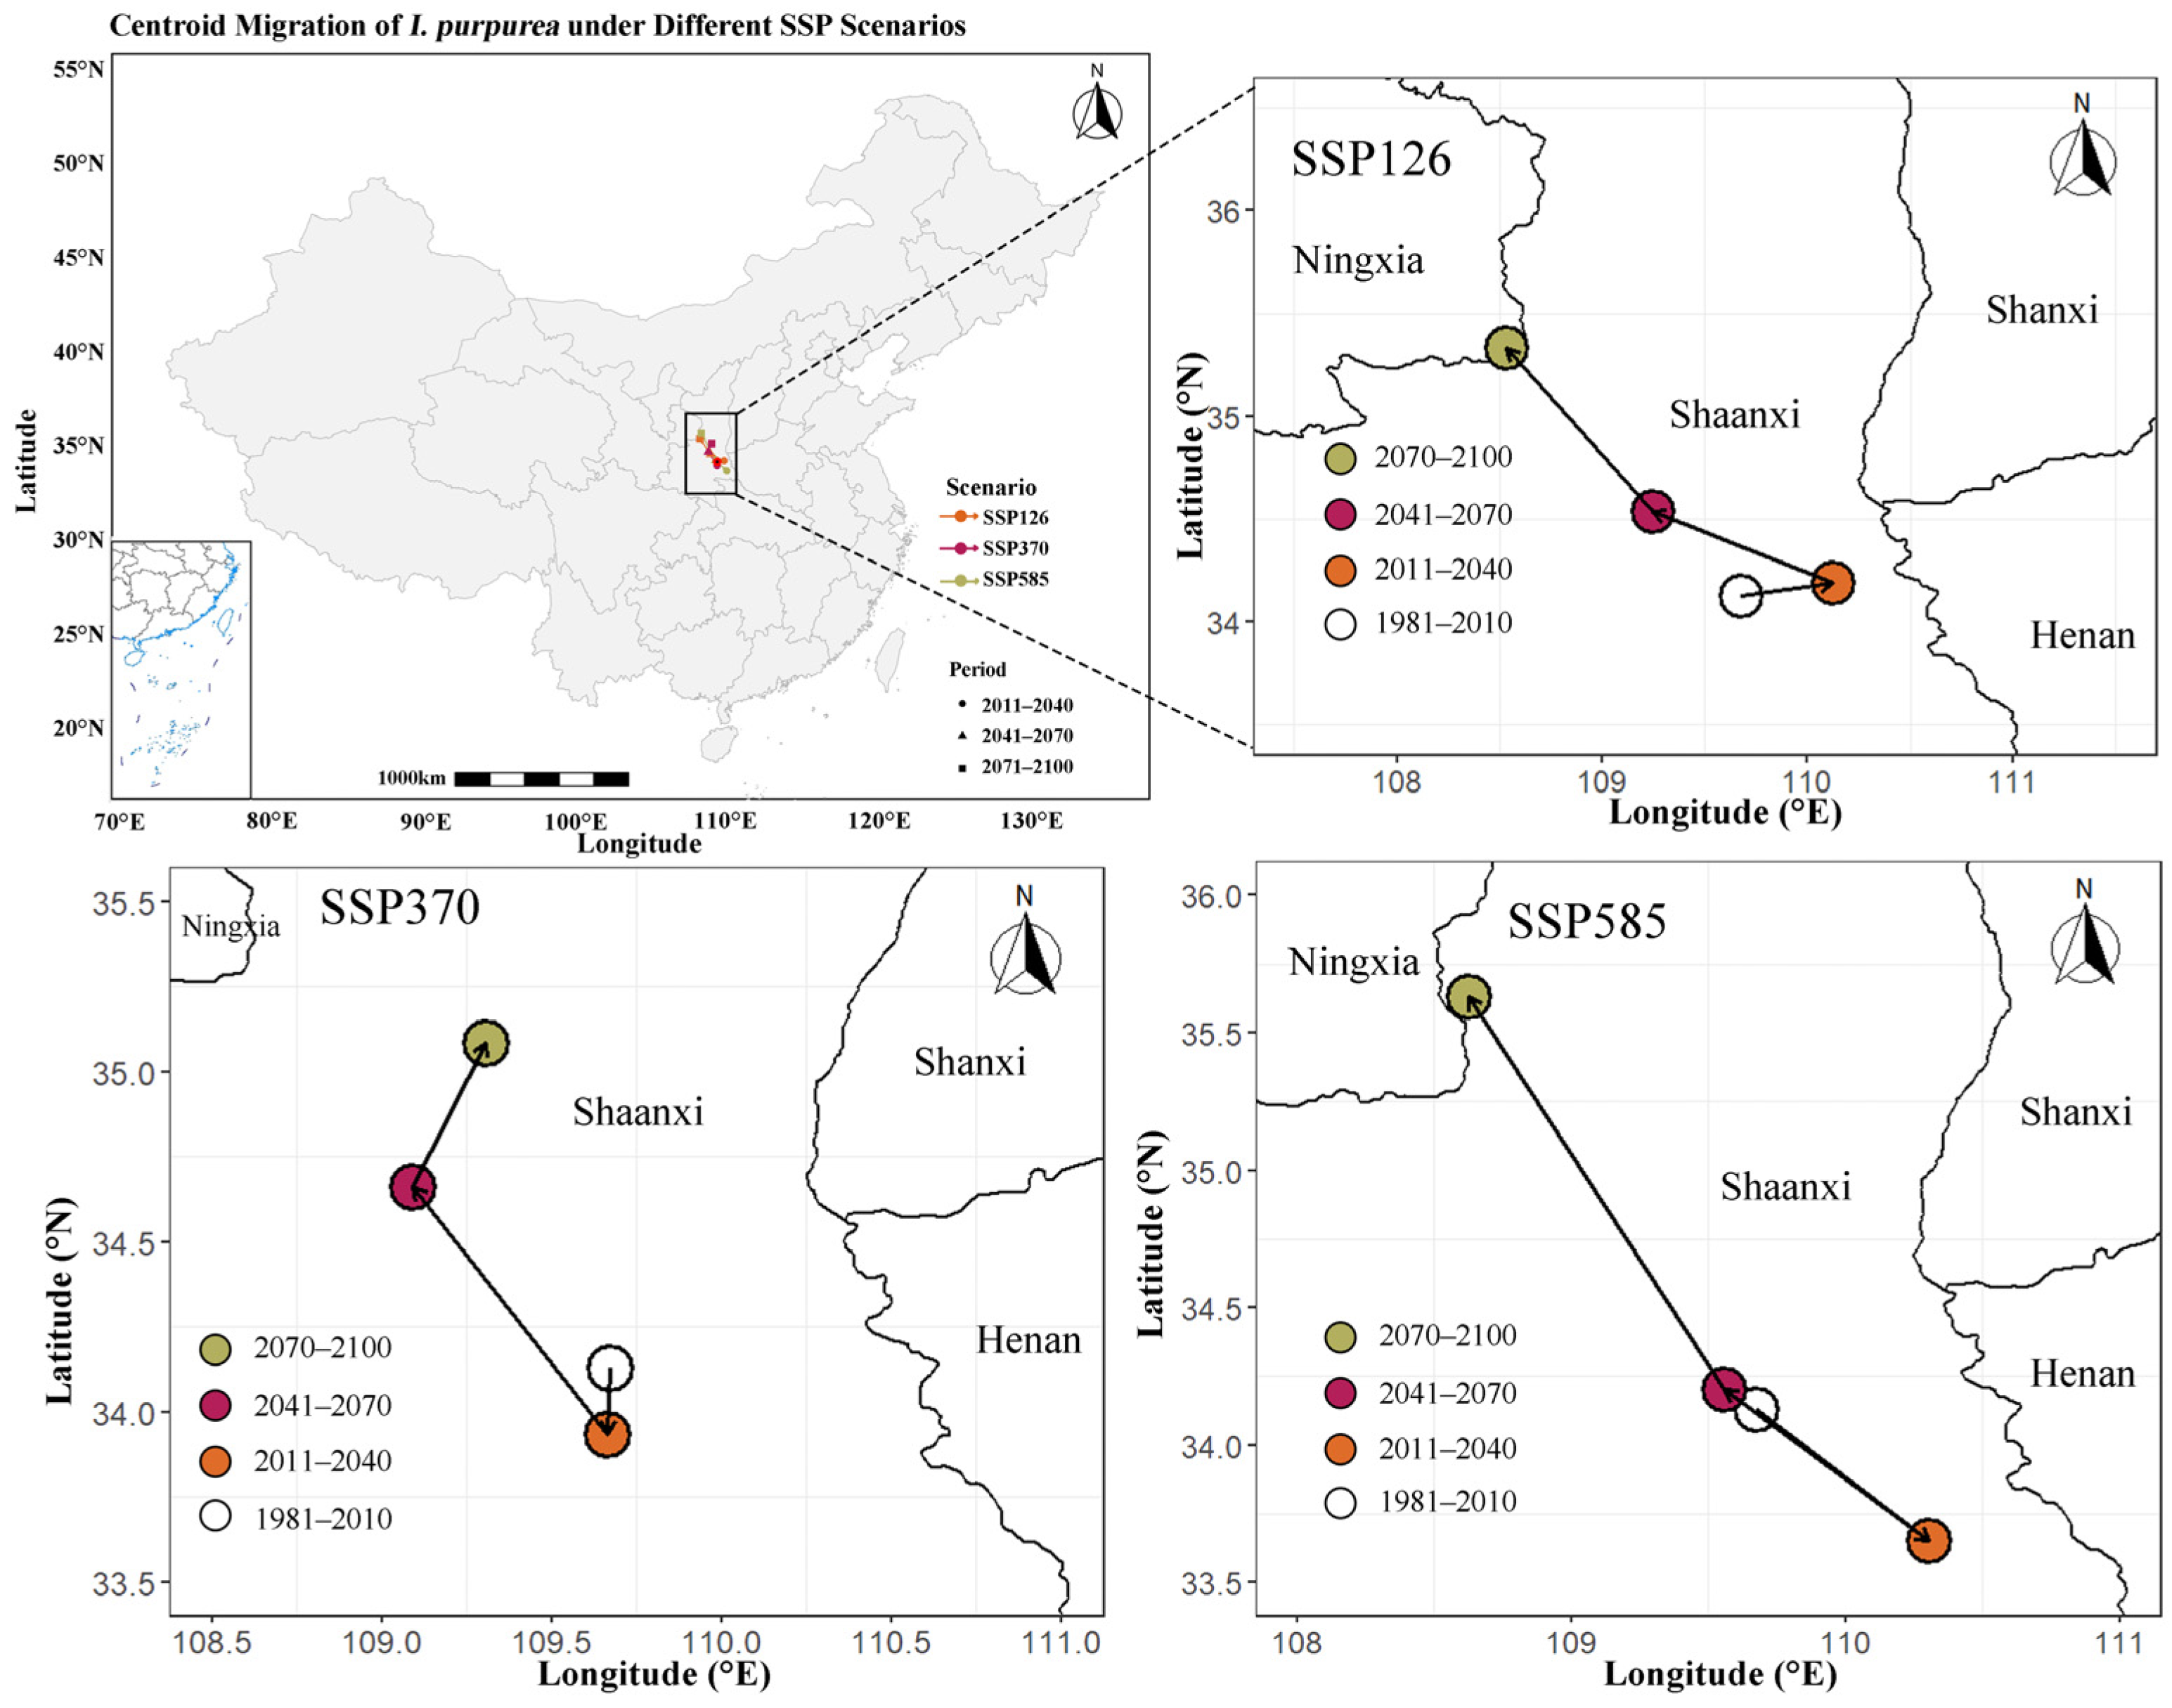
The centroid of I. purpurea (Figure 12) was initially located in northeastern Yijun County, Shaanxi Province (109°40′26.4″ E, 34°7′48″ N), but its subsequent trajectory differed substantially among scenarios. Under SSP126, it moved northeastward by 42.27 km before shifting northwestward by 89.83 and 110.53 km during the subsequent periods, ultimately reaching Haiyuan County, Ningxia Hui Autonomous Region (108°32′9.6″ E, 35°19′55.2″ N). The SSP370 trajectory consisted of a southward shift of 21.68 km, followed by northwestward and northeastward movements of 96.35 and 50.86 km, respectively, ending in Fuxian County, Shaanxi Province (109°39′54″ E, 33°56′2.4″ N). Under SSP585, the centroid first shifted southeastward by 78.95 km and then northwestward by 92.32 and 179.82 km, with its final position near the Ningxia–Shaanxi border (108°37′26.4″ E, 35°37′48″ N).
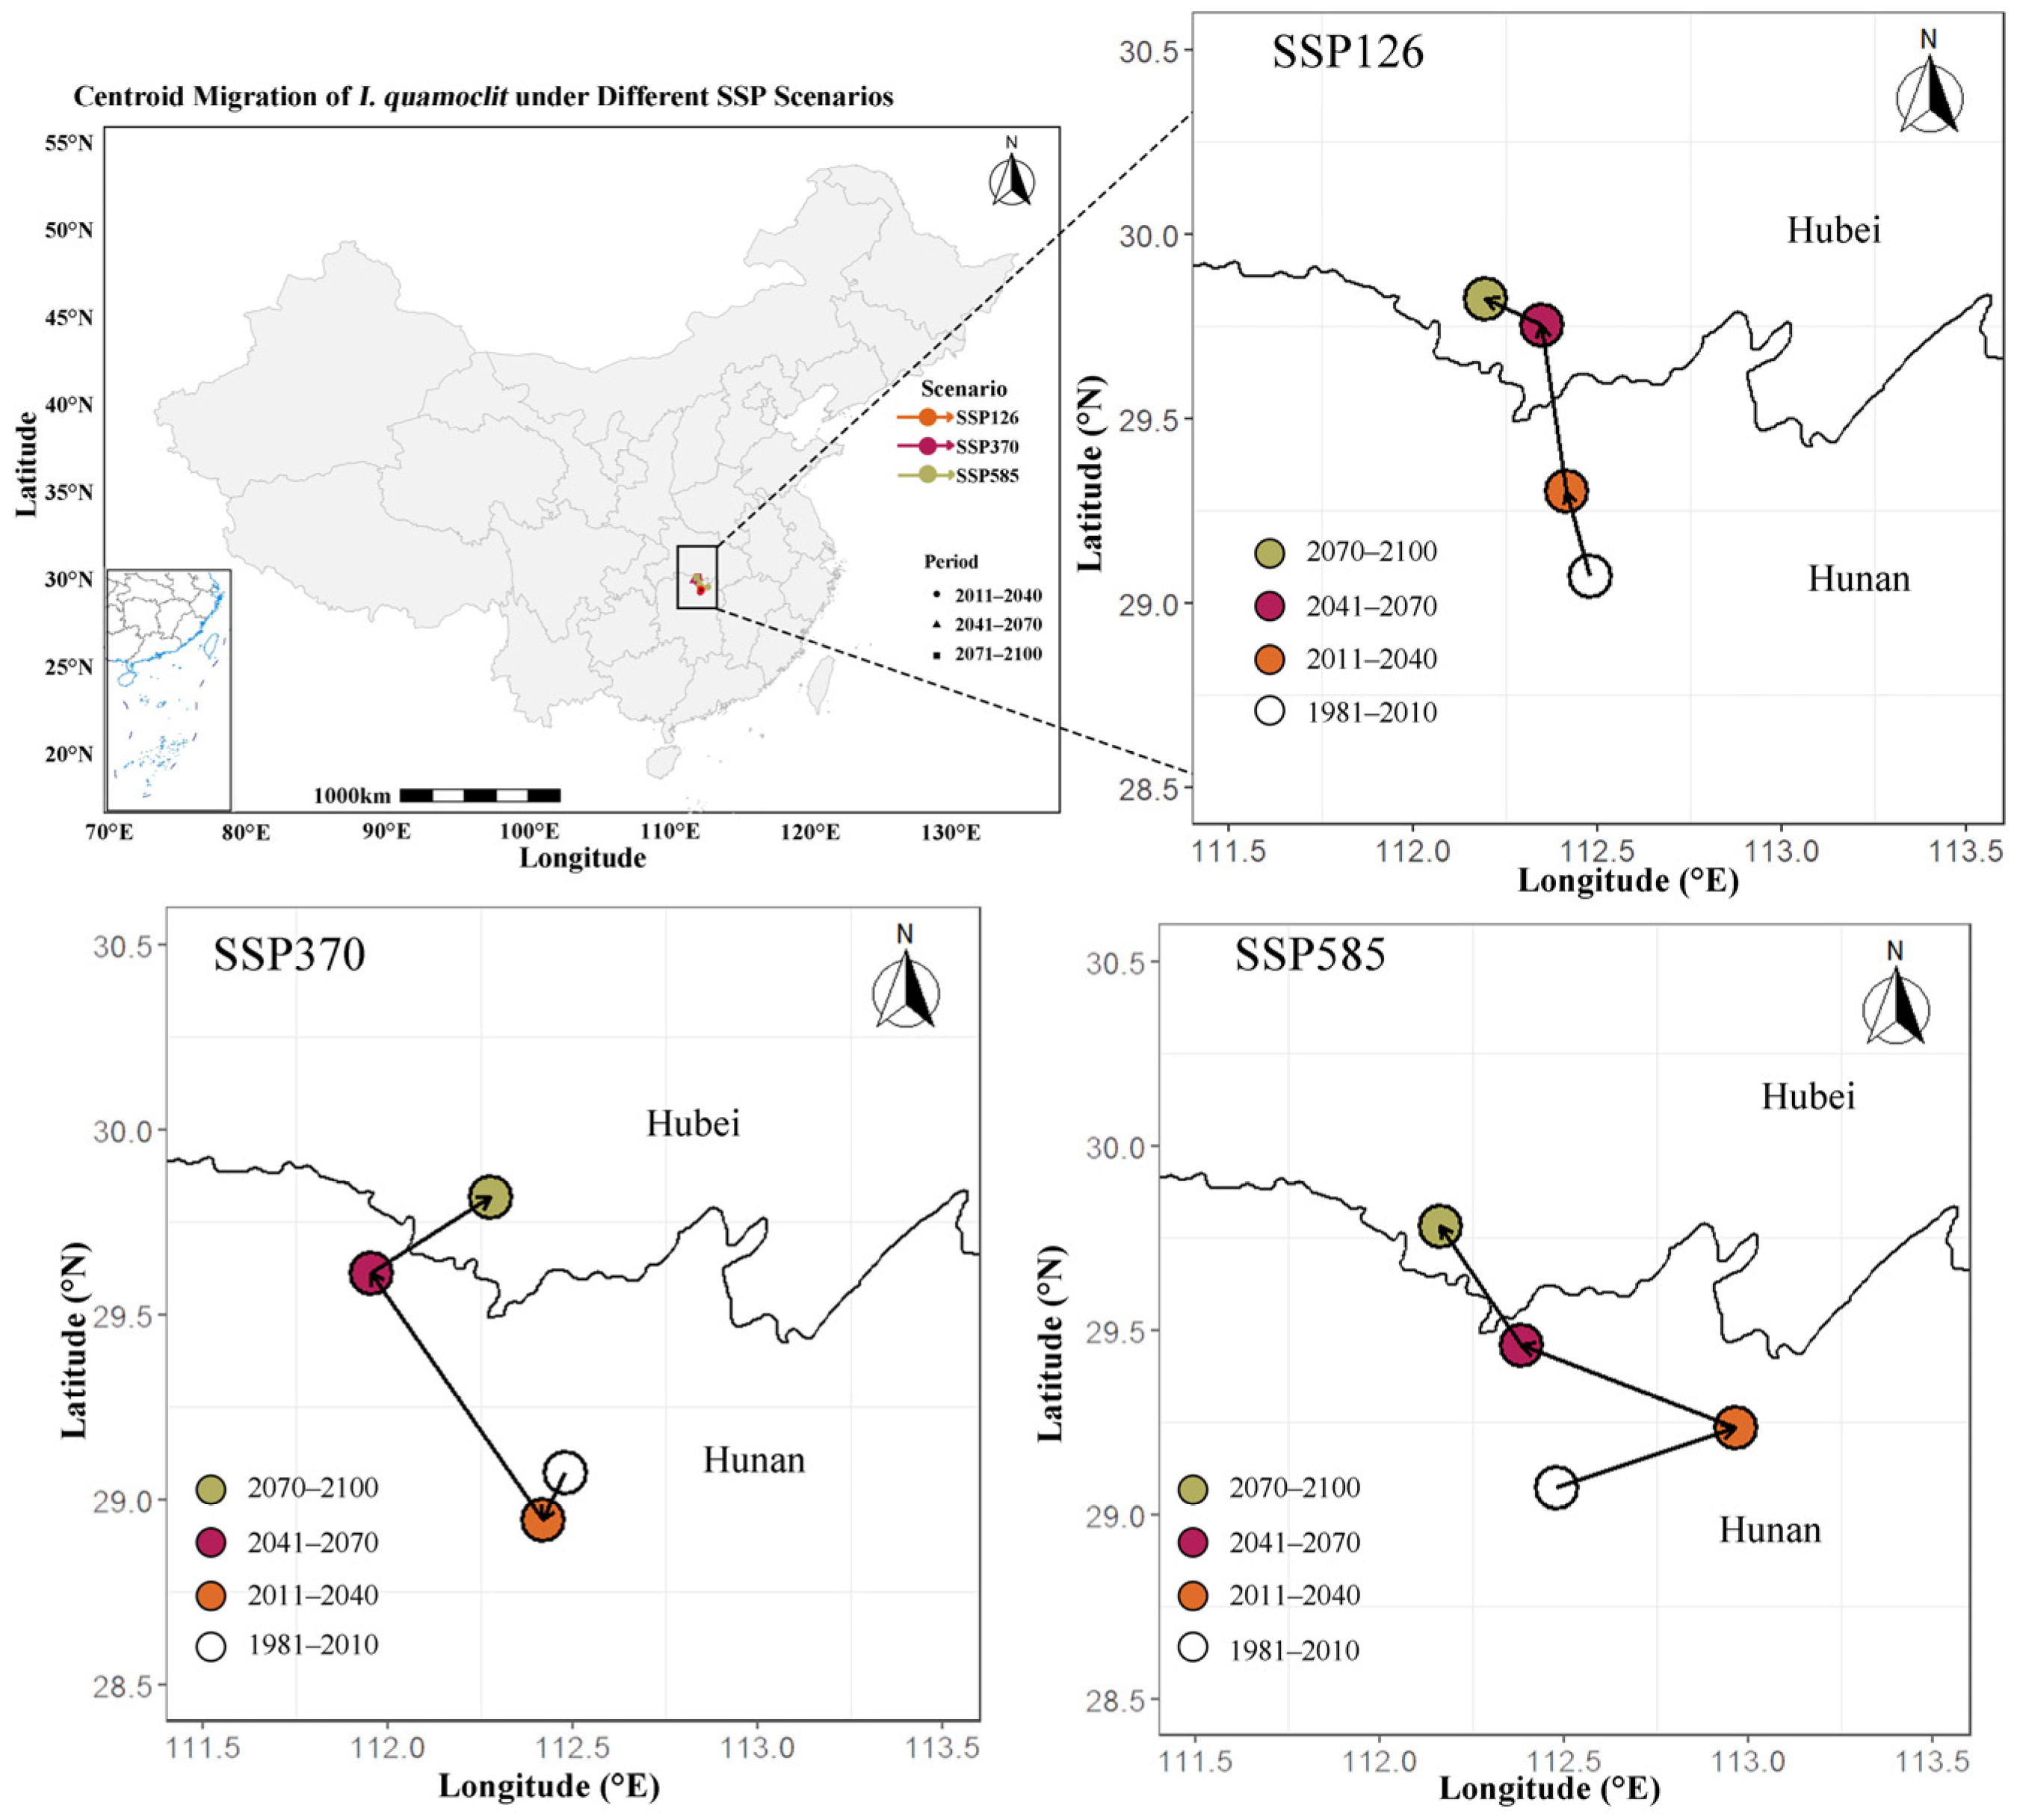
Figure 13 shows the centroid shifts of the potential distribution of I. quamoclit under different climate scenarios, with the present centroid located in Yiyang County, Hunan Province (112°28′44.4″ E, 29°4′26.4″ N). A predominantly northwestward trajectory was observed across all three scenarios. Under SSP126, the centroid moved northwestward by 26.16, 50.49, and 16.76 km over the three periods, respectively, ultimately reaching Songzi City, Hubei Province (112°11′42″ E, 29°49′37.2″ N). The SSP370 pathway began with a southwestward shift of 15.31 km, followed by northwestward movements of 86.64 and 38.75 km, ending in Gong’an County, Hubei Province (112°16′33.6″ E, 29°49′8.4″ N). In the SSP585 scenario, an initial northeastward displacement of 50.46 km was followed by northwestward shifts of 61.41 and 41.85 km, also resulting in a final position in Gong’an County (112°9′43.2″ E, 29°46′58.8″ N).
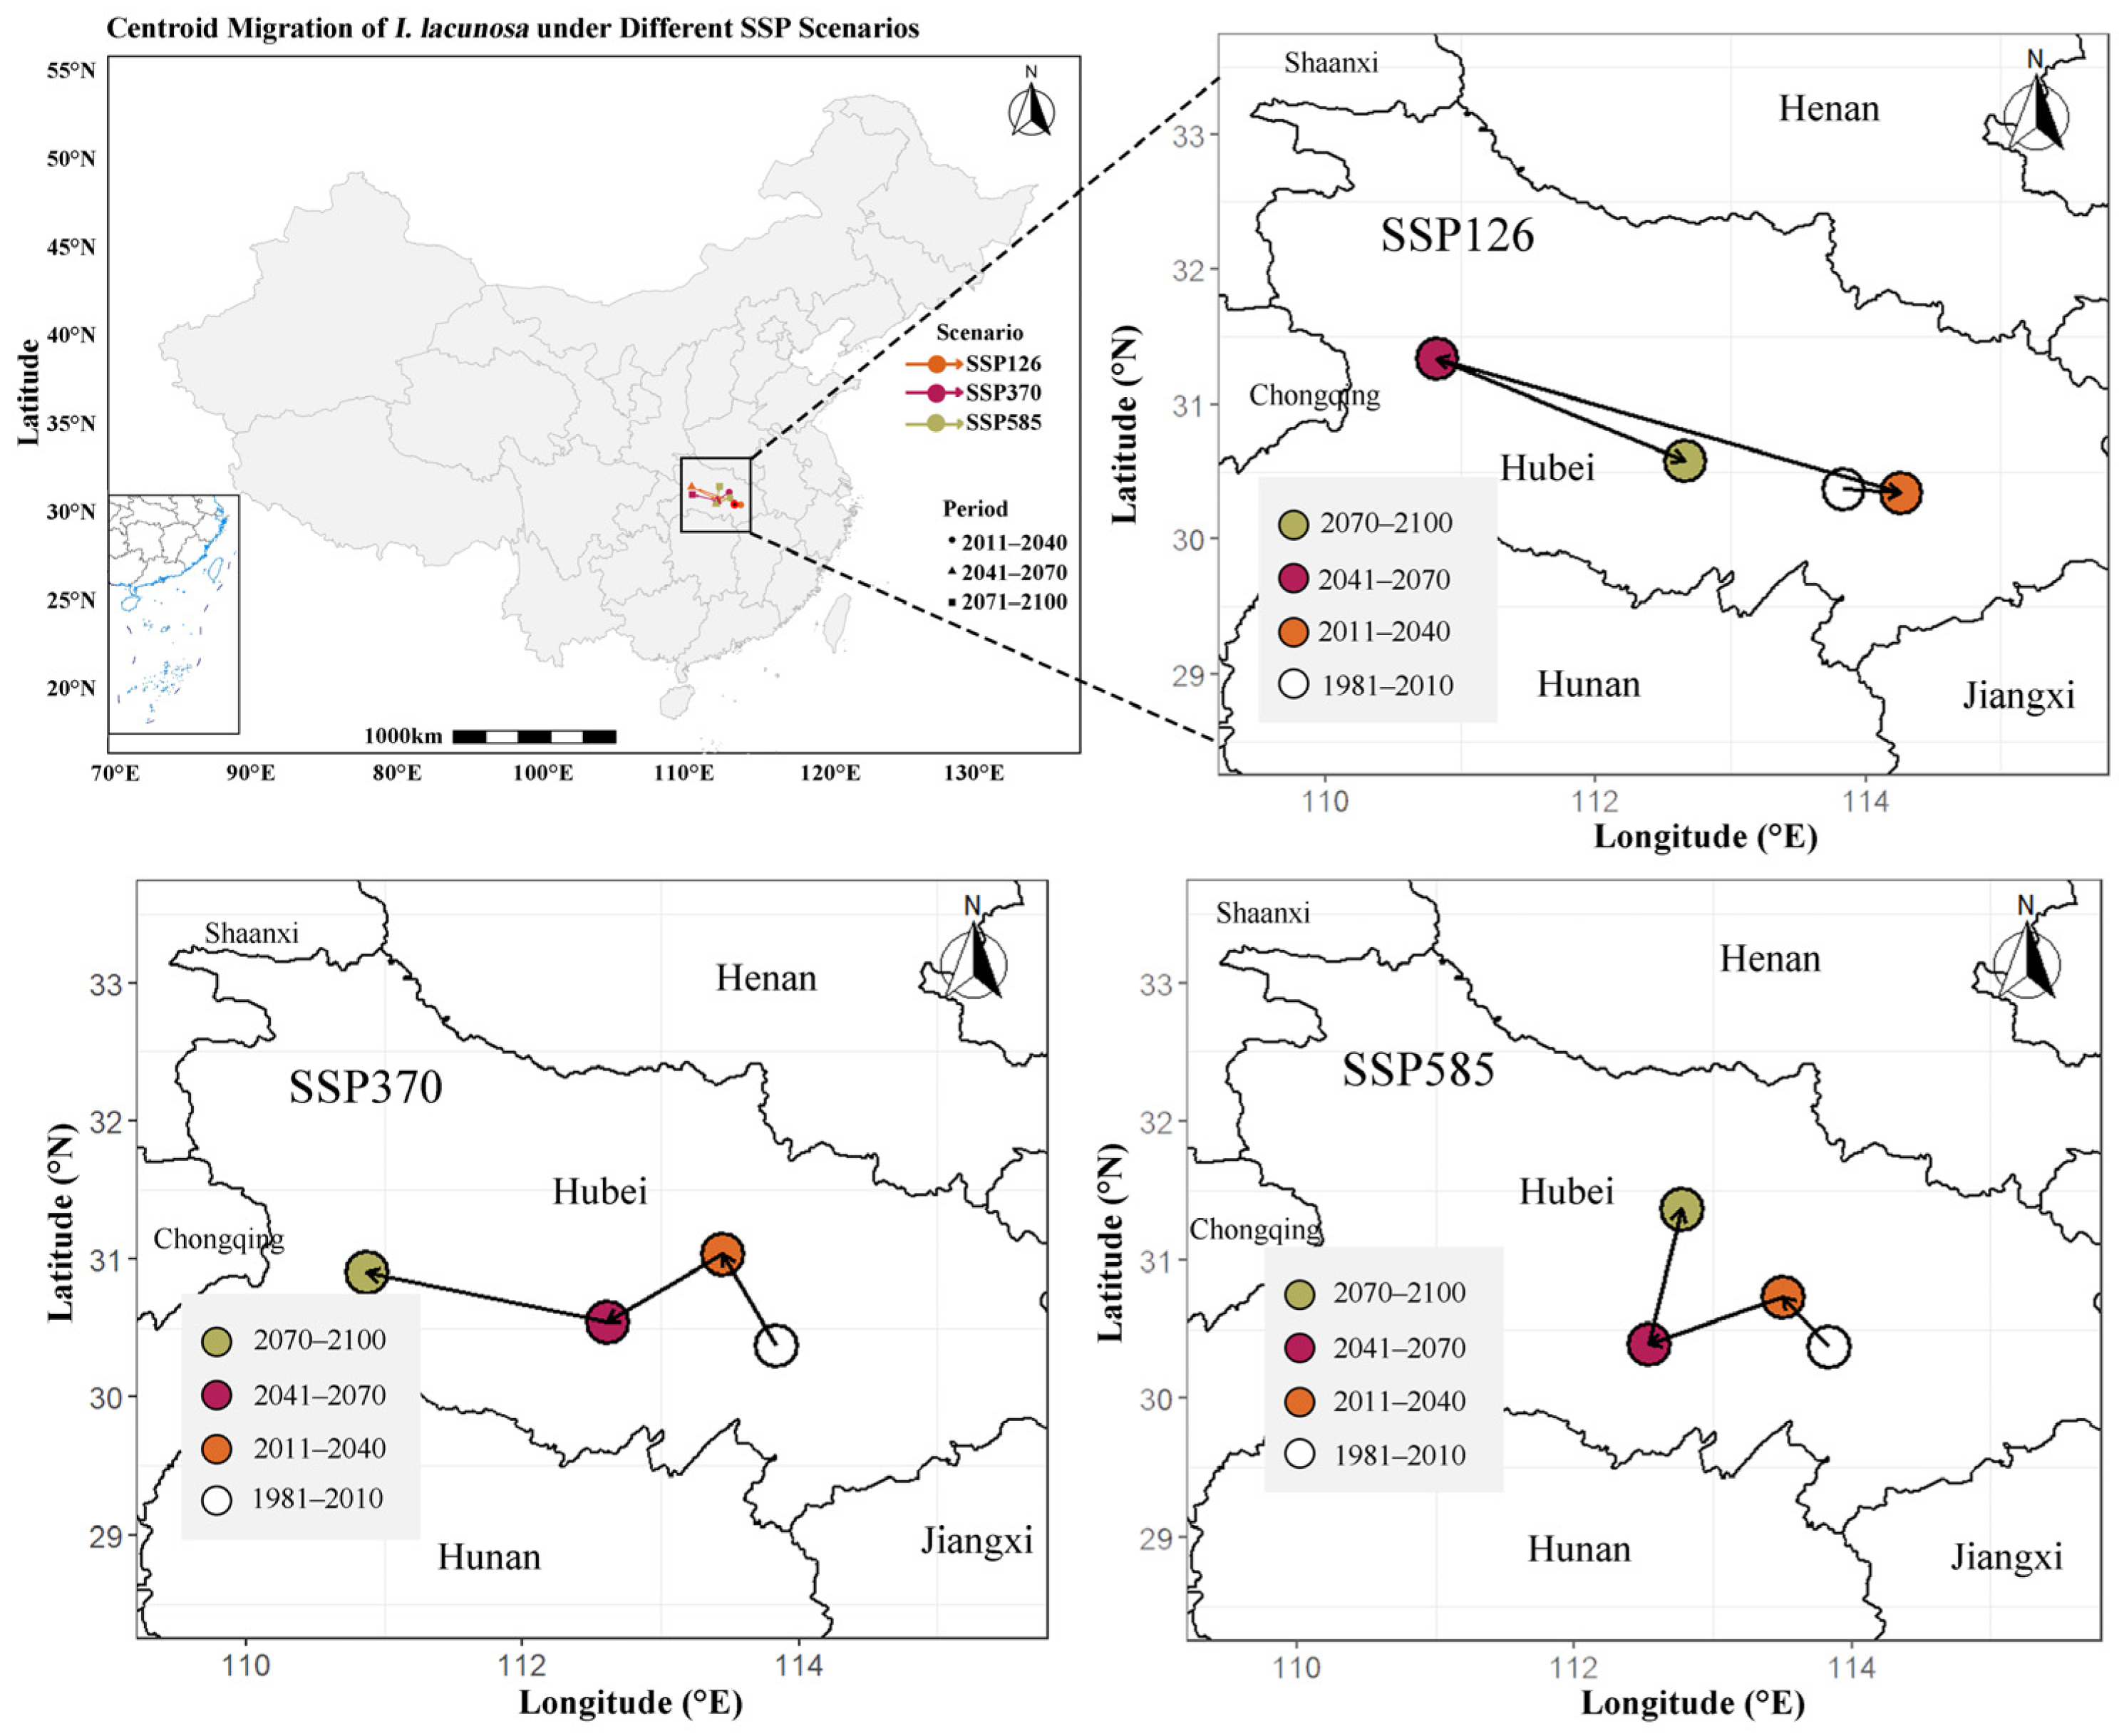
For I. lacunosa (Figure 14), the centroid during the baseline period was located in Huangpi District, Hubei Province (113°50′0″ E, 30°22′8.4″ N). Under SSP126, the centroid shifted eastward by 41.61 km, followed by a northwestward displacement of 347.11 km and a subsequent southeastward shift of 196.40 km, ultimately reaching Xiangzhou District (112°39′39.6″ E, 30°35′2.4″ N). Under SSP370, it moved northwestward by 82.59 km, southwestward by 97.24 km, and northwestward by 171.03 km, with the final position near Zigui County (110°52′16.6″ E, 30°54′7.2″ N). Under SSP585, the centroid first shifted northeastward by 51.54 km, then southwestward by 99.83 km, and finally northeastward by 110.97 km, ending in Suizhou City (112°46′30″ E, 31°22′4.8″ N).
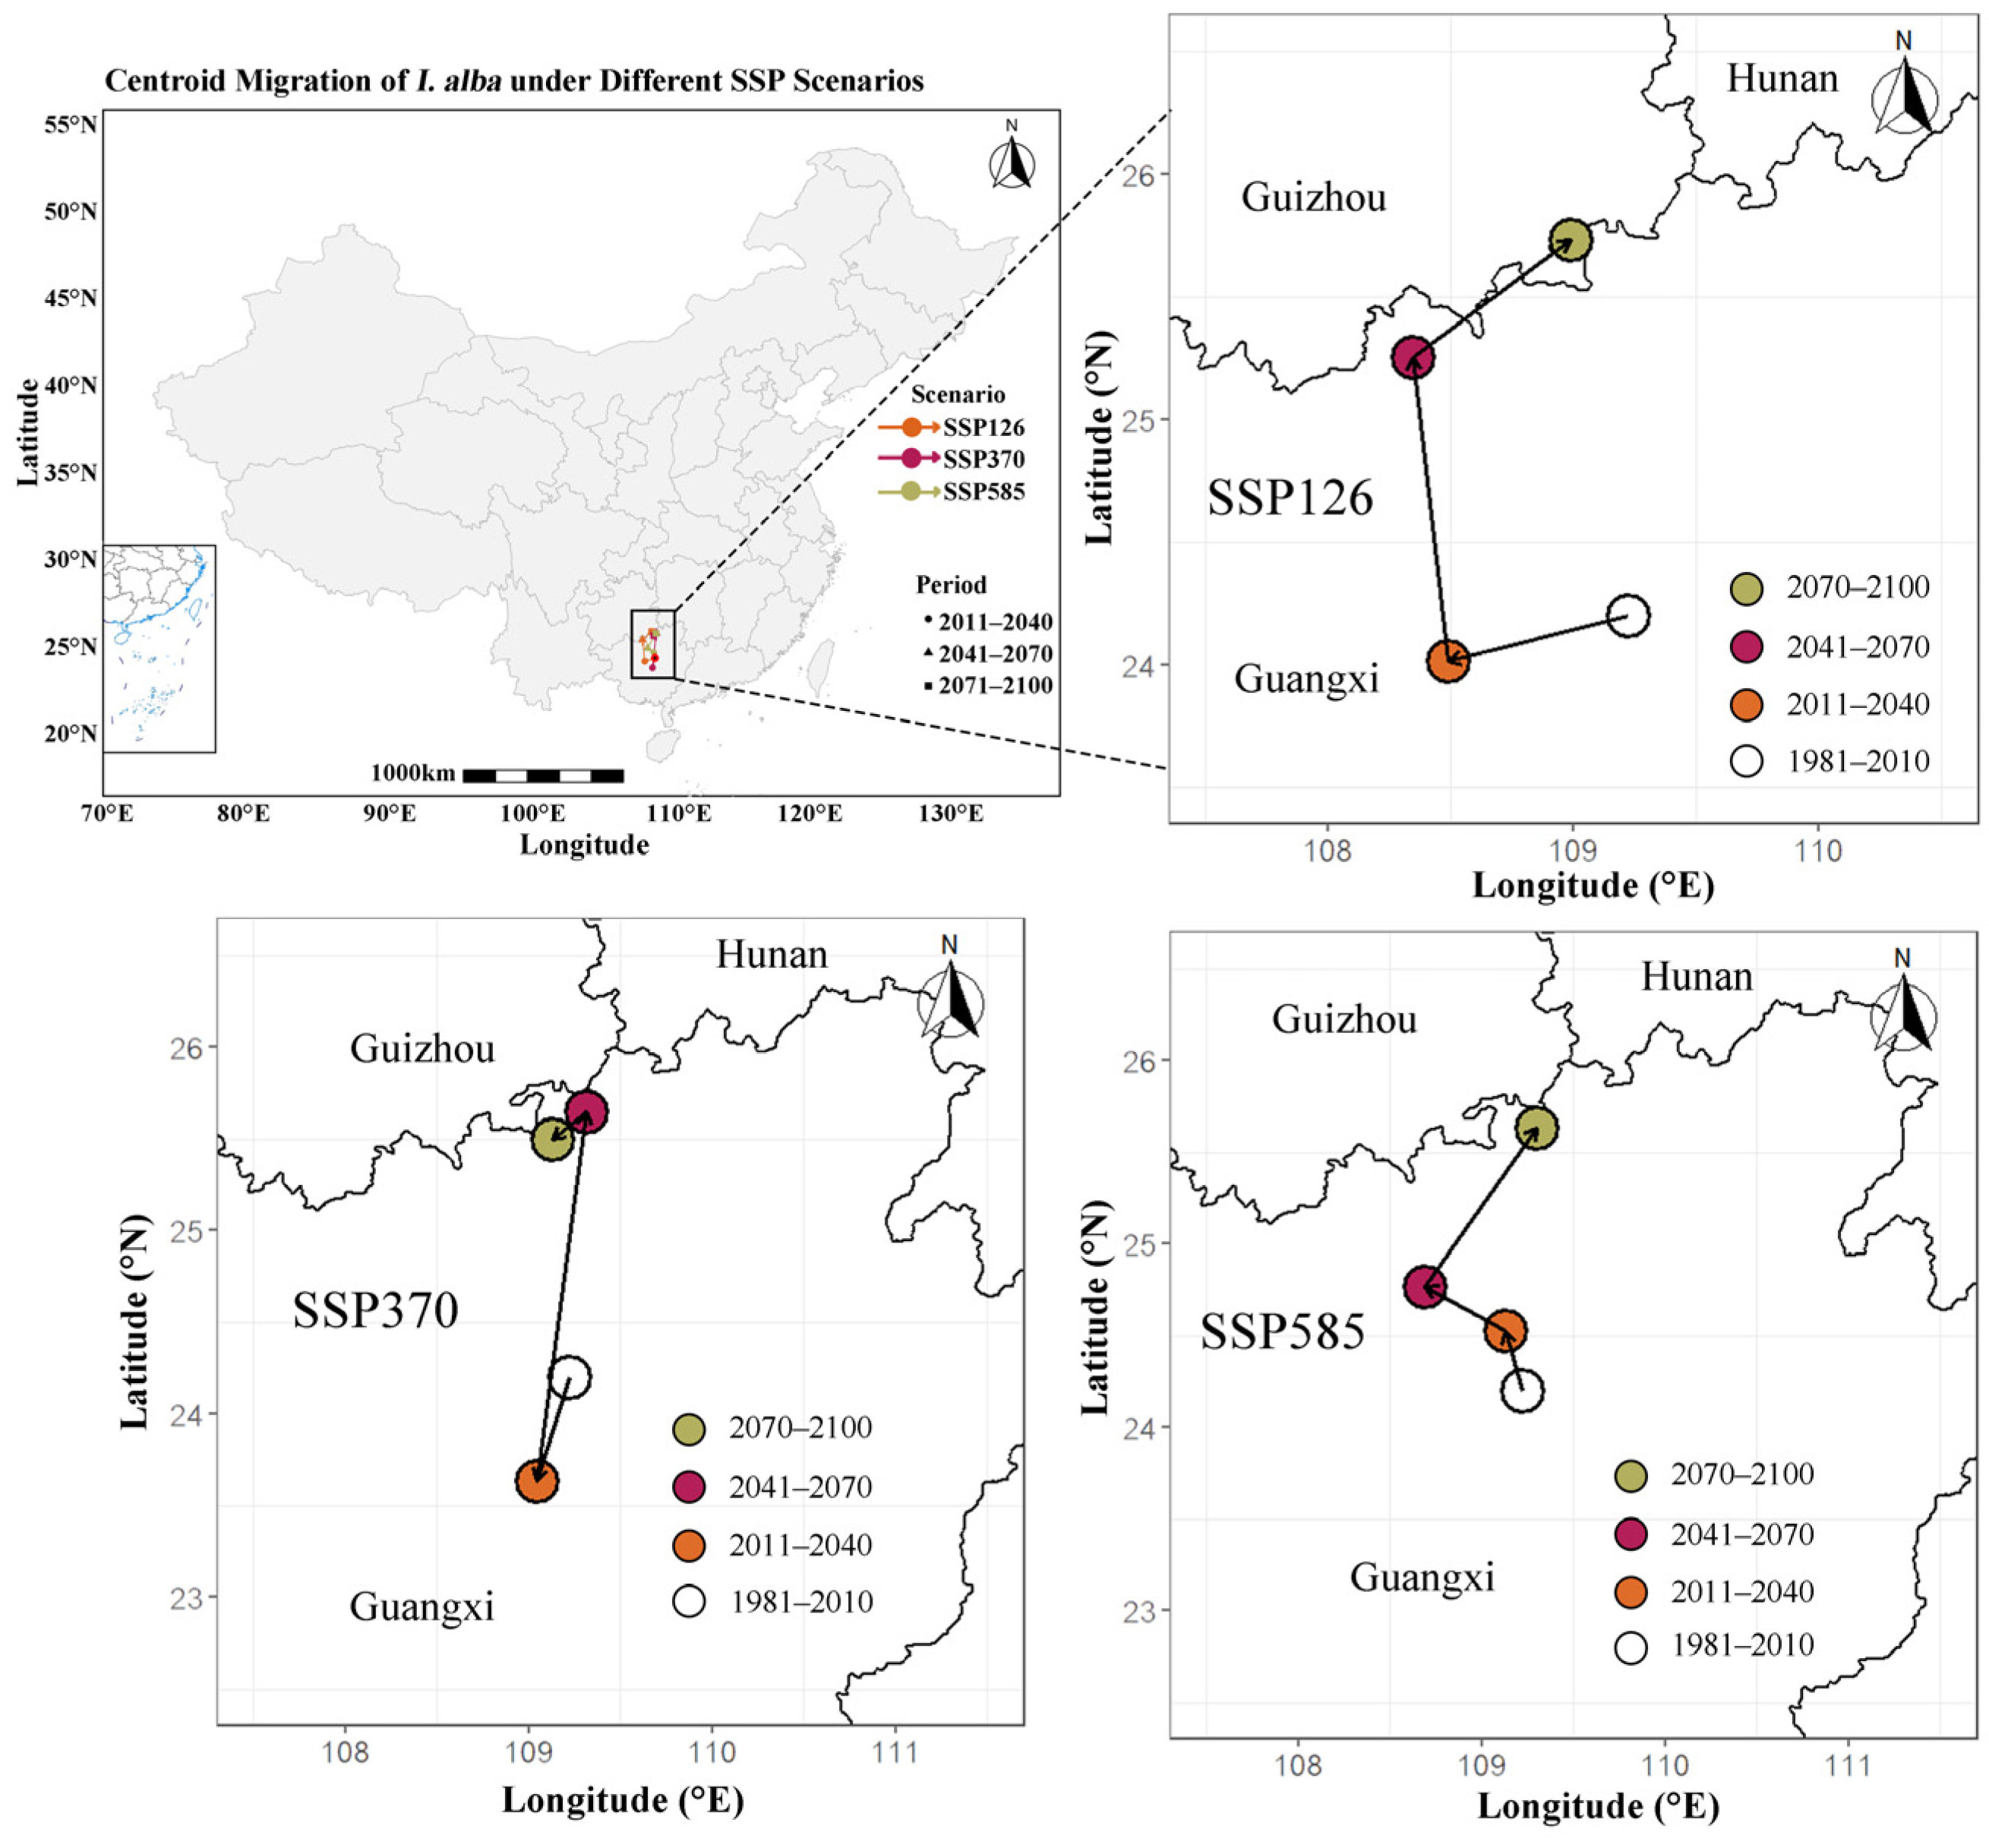
Figure 15 indicates that the centroid of the potential distribution of I. alba is currently located in Liujiang District, Guangxi (109°13′15.6″ E, 24°12′7.2″ N). Its migration pathway varied in both direction and magnitude among the future scenarios. The centroid under SSP126 moved southwestward by 77.98 km, northwestward by 137.95 km, and northeastward by 83.74 km, ultimately reaching Qianxinan Buyi and Miao Autonomous Prefecture, Guizhou (108°59′16.8″ E, 25°43′55.2″ N). Under SSP370, the trajectory comprised southwestward, northeastward, and southwestward movements of 65.25, 224.51, and 25.06 km, respectively, with the final position in Luzhai County, Guangxi (109°7′44.4″ E, 25°29′49.2″ N). Under SSP585, the centroid shifted northwestward by 37.06 and 51.67 km during the first two periods, followed by a northeastward displacement of 113.55 km and a final position in Rongshui Miao Autonomous County (109°17′56.4″ E, 25°38′6″ N).

4. Discussion

4.1. Key Factors Analysis

Overall, the potential distributions of the five invasive Ipomoea species were primarily associated with temperature and precipitation, with additional effects of snow cover, soil properties, and topographic conditions. Temperature-related variables, including Bio7, Bio9, and Bio11, were important predictors for several species. These variables can influence thermal tolerance, metabolic activity, and the length of the growing season, thereby affecting the establishment and persistence of Ipomoea species along temperature gradients [57,58]. The species-specific responses further suggest that thermal conditions may impose different constraints among species. For example, the positive response of I. quamoclit to Bio9 indicates that warmer conditions during the driest quarter may favor its occurrence, whereas the positive response of I. alba to Bio11 suggests that warmer conditions during the coldest quarter may alleviate low-temperature constraints on this species. Precipitation was another important factor shaping the potential distributions of Ipomoea species. Bio12 (annual precipitation) and Bio19 (precipitation of the coldest quarter) influence water availability and habitat suitability at broad spatial scales [59]. Notably, Bio12 made relatively high contributions to the distributions of I. purpurea and I. quamoclit, although both species showed broad response ranges to annual precipitation. This broad response may be related to their tropical origins, strong environmental adaptability, and ecological plasticity, which enable them to establish across diverse habitats and tolerate substantial variation in precipitation. Thus, annual precipitation may not impose a narrow ecological limit on these species. However, spatial variation in precipitation can still influence regional water availability and interact with temperature, soil moisture, and topographic conditions to shape habitat suitability [60]. Therefore, the broad precipitation response of I. purpurea and I. quamoclit does not preclude the contribution of Bio12 to their potential distributions. Snow cover can alter soil temperature, moisture, and the timing of seasonal warming, thereby affecting plant phenology, germination, growth, and overwinter survival [61,62]. For tropical and subtropical invasive Ipomoea species that are generally sensitive to low temperatures, prolonged snow cover may delay the growing season, restrict germination and early growth, and increase cold stress, thereby limiting their establishment and persistence in colder regions. Soil properties, particularly organic carbon and pH, may further influence habitat suitability by affecting microbial activity, nutrient availability, and soil conditions, thereby contributing to plant growth and establishment [63]. Topographic factors such as elevation and slope may also indirectly shape Ipomoea distributions by modifying local temperature, moisture, and other environmental conditions [64].

4.2. Range Expansion in Five Invasive Ipomoea Species

Compared with the baseline period (1981–2010), the projected expansion of suitable habitats under future climate scenarios suggests that climate change may progressively reduce the climatic constraints on the establishment of invasive Ipomoea species in regions that are currently less suitable. The overall increase in suitable areas, particularly under higher-emission scenarios and later periods, indicates that warming may provide broader opportunities for these species to establish beyond their current distribution ranges. The tendency for suitable habitats and distribution centroids to extend toward higher latitudes further suggests a potential northward shift in invasion risk. However, the magnitude and direction of these changes varied among species and climate scenarios, indicating that the effects of future climate change are unlikely to be uniform across the five Ipomoea species.
The future expansion of suitable habitats for Ipomoea species may result from the combined effects of climate warming and their ecological characteristics. As temperatures increase and precipitation patterns change, areas previously constrained by low temperatures or unfavorable climatic conditions may gradually become more suitable for the establishment and persistence of these species. This shift may be particularly pronounced for Ipomoea species originating from tropical and subtropical regions, where relatively warm climatic conditions prevail. Their preference for warm environments, together with their strong growth and reproductive capacities, may further facilitate population establishment and spread as climatic conditions become increasingly favorable, thereby promoting the expansion of their potential distribution ranges [65]. However, the continued expansion of suitable habitats for Ipomoea species may increase their opportunities to establish and spread in agricultural areas. Owing to their rapid growth and climbing characteristics, these species can quickly occupy the growing space of crops and compete with crops for light, water, and soil nutrients, thereby potentially impairing crop growth and reducing crop yields [66,67]. Meanwhile, the expansion of their populations may increase the difficulty of removal and routine management in agricultural fields, consequently increasing the labor and economic inputs required for invasive species control [68]. Beyond agricultural production, the establishment of Ipomoea species in new ecological areas may also alter the spatial structure of existing vegetation and patterns of resource use, thereby disrupting energy flow and nutrient cycling within ecosystems. According to Bajahmoum’s study, the growth may also change the microhabitat conditions and soil nutrient cycling, which would threaten the stability of the ecosystem [69]. As their suitable habitats continue to extend toward higher latitudes and elevations, ecologically fragile areas such as mountainous regions and ecological transition zones may face increasing invasion pressure, potentially making ecosystem maintenance and recovery more difficult [70,71]. Overall, climate change may not only expand the potential distribution ranges of Ipomoea species but also extend their potential impacts on agricultural production and ecosystems.
The differences in future range expansion among the five Ipomoea species may reflect interspecific differences in climatic niche breadth and environmental tolerance. Species with broader ecological niches can generally tolerate a wider range of climatic conditions and are less constrained by individual environmental factors, thereby having greater potential for spatial expansion as climatic conditions change [72]. In contrast, species that are more dependent on specific temperature, precipitation, or other environmental conditions may experience stronger environmental constraints on their suitable habitats and consequently show more limited responses to future climate change [73]. In this study, the relatively broad potential distributions of I. purpurea and I. nil may be associated with their wider environmental tolerance, allowing them to occupy a larger potential suitable area. In comparison, the relatively limited suitable ranges of I. lacunosa and I. alba suggest that their future distributional changes may be more strongly constrained by specific environmental conditions. These findings indicate that the effects of climate change on invasive Ipomoea species are not uniform, and that species-specific niche characteristics may be an important factor contributing to differences in their future range expansion.
Existing distribution records of Ipomoea species were mainly concentrated in parts of eastern, central-southern, and southwestern China [74,75]. These areas showed a high degree of spatial overlap with the potential suitable habitats predicted by the current model, indicating that the model could effectively identify areas with concentrated existing invasion records. Under future climate scenarios, the potential suitable habitats of the five Ipomoea species are expected to remain mainly concentrated in warm and humid regions, including the middle and lower reaches of the Yangtze River, southern China, southwestern China, and the southeastern coastal region, while gradually expanding toward northwestern and northern China, northeastern China, and inland areas. Therefore, future management should strengthen population removal and source control in core suitable areas such as the middle and lower reaches of the Yangtze River, southern China, and southwestern China, while enhancing monitoring and early warning in newly suitable areas in northern, central, and inland regions. In addition, species-specific management strategies should be implemented.

4.3. Research Limitations

This study used the MaxEnt model to predict the potential distributions of five invasive Ipomoea species under different climate scenarios. However, MaxEnt mainly considers environmental factors and cannot fully account for biotic interactions. For example, changes in pollinator populations and distributions may affect the reproduction and spread of I. purpurea, I. nil, and I. quamoclit. In addition, differences in sampling times, changes in temperature and species distributions, and the spatial resolution of environmental data may affect prediction accuracy. The relatively limited occurrence records for I. lacunosa and I. alba may also introduce some uncertainty. Future studies should incorporate more biotic factors, long-term distribution data, and higher-resolution environmental data to improve prediction reliability.

5. Conclusions

The results showed that bioclimatic variables (SCD, Bio9, and Bio11) were the main influencing factors for the expansion of the potential suitable areas of the five invasive Ipomoea species in China. Under future climate change scenarios, the potential suitable areas of the five invasive Ipomoea species are projected to expand to varying degrees, with the extent of expansion generally increasing under higher-emission scenarios and longer projection periods. The potential suitable areas are mainly concentrated in the middle and lower reaches of the Yangtze River, southern China, southwestern China, and the southeastern coastal regions, while gradually expanding toward eastern, northern, central, and northwestern China. Meanwhile, with climate warming, the potential distribution centroids of the five species are generally projected to shift northward or toward higher elevations. These findings can provide a spatial basis for monitoring and early control in key agricultural areas, quarantine and risk management of invasive species, and regional management, while helping to reduce potential impacts on native plant diversity and community structure and maintain ecosystem resilience.

Supplementary Materials

The following supporting information can be downloaded at: https://www.mdpi.com/article/10.3390/agronomy16181763/s1, Figure S1: Overview of the study workflow. Figure S2: Optimized Maxent model parameters: (a) I. nil, (b) I. purpurea, (c) I. quamoclit (Note: If the sample size of I. lacunosa and I. alba is less than 80, the default mode will be used). Figure S3: Response curves of major environmental factors for each species: (a) I. nil, (b) I. purpurea, (c) I. quamoclit, (d) I. lacunosa, (e) I. alba. Table S1: Correlation Matrix of 34 Environmental Variables (When the correlation between two factors is greater than 0.8, only the factor with higher importance is taken). Table S2: Distribution centroids and centroid migration distances of 5 Ipomoea plants under.

Author Contributions

Z.W. (Zhengxuan Wei): Method research; Learning software; Data visualization; Article writing. Y.W.: Supervision; Review and edit; Data collection. W.C.: Supervision; Data interpretation; J.R.: Data collection; Data management. Z.W. (Zhijia Wang): Data collection; R language learning; Data management. All authors have read and agreed to the published version of the manuscript.

Funding

This research received no external funding.

Data Availability Statement

The processed results presented in this study are included in the article and its Supplementary Materials. The occurrence records for the five invasive Ipomoea species were obtained from the Global Biodiversity Information Facility (GBIF; https://www.gbif.org/, accessed on 20 October 2025), the Chinese Information System on Invasive Alien Species (https://www.iplant.cn/ias/, accessed on 18 October 2025), and the Chinese Virtual Herbarium (CVH; https://www.cvh.ac.cn/, accessed on 22 October 2025). The environmental input data were obtained from the CHELSA database (https://chelsa-climate.org/, accessed on 5 September 2026), the SoilGrids database (https://soilgrids.org/, accessed on 29 October 2025), the Geospatial Data Cloud (https://www.gscloud.cn/, accessed on 28 October 2025), and the Global UV-B Radiation Database (http://www.ufz.de/gluv/, accessed on 28 October 2025). Further inquiries can be directed to the corresponding author.

Conflicts of Interest

The authors declare no conflicts of interest.

References

  1. Fachinello, M.C.; Romero, J.H.C.; de Castro, W.A.C. Defining invasive species and demonstrating impacts of Biological invasions: A scientometric analysis of studies on invasive alien plants in Brazil over the past 20 years. NeoBiota 2022, 76, 13–24. [Google Scholar] [CrossRef] [Scilit]
  2. Haubrock, P.J.; Soto, I.; Ahmed, D.A.; Ansari, A.R.; Tarkan, A.S.; Kurtul, I.; Macêdo, R.L.; Lázaro-Lobo, A.; Toutain, M.; Parker, B.; et al. Biological invasions are a population-level rather than a species-level Phenomenon. Glob. Change Biol. 2024, 30, e17312. [Google Scholar] [CrossRef] [Scilit] [PubMed]
  3. Manzoor, S.A.; Griffiths, G.; Lukac, M. Land use and climate change interaction triggers contrasting trajectories of biological invasion. Ecol. Indic. 2021, 120, 106936. [Google Scholar] [CrossRef] [Scilit]
  4. Turbelin, A.J.; Cuthbert, R.N.; Essl, F.; Haubrock, P.J.; Ricciardi, A.; Courchamp, F. Biological invasions are as costly as natural hazards. Perspect. Ecol. Conserv. 2023, 21, 143–150. [Google Scholar] [CrossRef] [Scilit]
  5. Hudgins, E.J.; Cuthbert, R.N.; Haubrock, P.J.; Taylor, N.G.; Kourantidou, M.; Nguyen, D.; Bang, A.; Turbelin, A.J.; Moodley, D.; Briski, E.; et al. Unevenly distributed biological invasion costs among origin and recipient regions. Nat. Sustain. 2023, 6, 1113–1124. [Google Scholar] [CrossRef] [Scilit]
  6. Mungi, N.A.; Jhala, Y.V.; Svenning, J.C.; Qureshi, Q. Socioecological risks amplified by rising plant invasions in India. Nat. Sustain. 2026, 9, 130–141. [Google Scholar] [CrossRef] [Scilit]
  7. Jiao, X.; Xie, W.; Wang, S.; Wu, Q.; Zhou, L.; Pan, H.; Liu, B.; Zhang, Y. Host preference and nymph performance of B and Q putative species of Bemisia tabaci on three host plants. J. Pest Sci. 2012, 85, 423–430. [Google Scholar] [CrossRef] [Scilit]
  8. Li, Z.; Tao, J.; Zong, S. Cold tolerance in pinewood nematode Bursaphelenchus xylophilus promoted multiple invasion events in mid-temperate zone of China. Forests 2022, 13, 1100. [Google Scholar] [CrossRef] [Scilit]
  9. Xie, X.; Ma, T.; Chen, Y.; Zhuo, J.; Chen, S.; Kang, T.; Hao, M.; Ding, F.; Jiang, D. Modeling the potential invasion risk of Ageratina adenophora in China from an ecological suitability perspective. Ecol. Evol. 2025, 15, e72392. [Google Scholar] [CrossRef] [Scilit] [PubMed]
  10. Xu, H.; Ding, H.; Li, M.; Qiang, S.; Guo, J.; Han, Z.; Huang, Z.; Sun, H.; He, S.; Wu, H.; et al. The distribution and economic losses of alien species invasion to China. Biol. Invasions 2006, 8, 1495–1500. [Google Scholar] [CrossRef] [Scilit]
  11. Diagne, C.; Leroy, B.; Vaissière, A.C.; Gozlan, R.E.; Roiz, D.; Jarić, I.; Salles, J.-M.; Bradshaw, C.J.A.; Courchamp, F. High and rising economic costs of biological invasions worldwide. Nature 2021, 592, 571–576. [Google Scholar] [CrossRef] [Scilit] [PubMed]
  12. Fantle-Lepczyk, J.E.; Haubrock, P.J.; Kramer, A.M.; Cuthbert, R.N.; Turbelin, A.J.; Crystal-Ornelas, R.; Diagne, C.; Courchamp, F. Economic costs of biological invasions in the United States. Sci. Total Environ. 2022, 806, 151318. [Google Scholar] [CrossRef] [Scilit] [PubMed]
  13. Li, Y.; Zhang, J.; Zhang, J.; Du, J.; Yang, R.; Niu, M.; Li, Y. The high economic cost of biological invasions in China. J. Environ. Manag. 2025, 389, 126224. [Google Scholar] [CrossRef] [Scilit] [PubMed]
  14. Dai, Z.C.; Zhu, B.; Wan, J.S.; Rutherford, S. Global changes and plant invasions. Front. Ecol. Evol. 2022, 10, 845816. [Google Scholar] [CrossRef] [Scilit]
  15. Hartl, T.; Srivastava, V.; Prager, S.; Wist, T. Evaluating climate change scenarios on global pea aphid habitat suitability using species distribution models. Clim. Change Ecol. 2024, 7, 100084. [Google Scholar] [CrossRef] [Scilit]
  16. Hoshino, A.; Jayakumar, V.; Nitasaka, E.; Toyoda, A.; Noguchi, H.; Itoh, T.; Shin-I, T.; Minakuchi, Y.; Koda, Y.; Nagano, A.J.; et al. Genome sequence and analysis of the Japanese morning glory Ipomoea nil. Nat. Commun. 2016, 7, 13295. [Google Scholar] [CrossRef] [Scilit] [PubMed]
  17. Sudmoon, R.; Kaewdaungdee, S.; Ho, H.X.; Lee, S.Y.; Tanee, T.; Chaveerach, A. The chloroplast genome sequences of Ipomoea alba and I. obscura (Convolvulaceae): Genome comparison and phylogenetic analysis. Sci. Rep. 2024, 14, 14078. [Google Scholar] [CrossRef] [Scilit] [PubMed]
  18. Hao, Q.; Ma, J.S. Invasive alien plants in China: An update. Plant Divers. 2023, 45, 117–121. [Google Scholar] [CrossRef] [Scilit] [PubMed]
  19. Chen, M.; Cai, M.; Xiang, P.; Qin, Z.; Peng, C.; Li, S. Thermal adaptation of photosynthetic physiology of the invasive vine Ipomoea cairica (L.) enhances its advantage over native Paederia scandens (Lour.) Merr. in South China. Tree Physiol. 2023, 43, 575–586. [Google Scholar] [CrossRef] [Scilit] [PubMed]
  20. Ihara, N.; Kobayashi, H. Populations of Ipomoea hederacea var. integriuscula in field margins are maintained by seed production of individuals from a specific cohort. Agronomy 2022, 12, 2392. [Google Scholar] [CrossRef] [Scilit]
  21. Webster, T.M. Weed survey-southern states: Broadleaf crops subsection. Proc. South. Weed Sci. Soc. 2001, 54, 244–259. [Google Scholar]
  22. Sohrabi, S.; Yazlık, A.; Bazos, I.; Gherekhloo, J.; Kati, V.; Kitiş, Y.E.; Arianoutsou, M.; Kortz, A.; Pyšek, P. Alien species of Ipomoea in Greece, Türkiye and Iran: Distribution, impacts and management. NeoBiota 2025, 97, 135–160. [Google Scholar] [CrossRef] [Scilit]
  23. Mircea, D.M.; Li, R.; Blasco Giménez, L.; Vicente, O.; Sestras, A.F.; Sestras, R.E.; Boscaiu, M.; Mir, R. Salt and water stress tolerance in Ipomoea purpurea and Ipomoea tricolor, two ornamentals with invasive potential. Agronomy 2023, 13, 2198. [Google Scholar] [CrossRef] [Scilit]
  24. Oduor, A.M.O.; Long, H.; Fandohan, A.B.; Liu, J.; Yu, X. An invasive plant provides refuge to native plant species in an intensely grazed ecosystem. Biol. Invasions 2018, 20, 2745–2751. [Google Scholar] [CrossRef] [Scilit]
  25. El-Barougy, R.F.; Dakhil, M.A.; Halmy, M.W.; Gray, S.M.; Abdelaal, M.; Khedr, A.H.A.; Bersier, L.F. Invasion risk assessment using trait-environment and species distribution modelling techniques in an arid protected area: Towards conservation prioritization. Ecol. Indic. 2021, 129, 107951. [Google Scholar] [CrossRef] [Scilit]
  26. Mousikos, A.; Manolaki, P.; Knez, N.; Vogiatzakis, I.N. Can distribution modeling inform rare and endangered species monitoring in Mediterranean islands? Ecol. Inform. 2021, 66, 101434. [Google Scholar] [CrossRef] [Scilit]
  27. Baker, D.J.; Maclean, I.M.; Goodall, M.; Gaston, K.J. Species distribution modelling is needed to support ecological impact assessments. J. Appl. Ecol. 2021, 58, 21–26. [Google Scholar] [CrossRef] [Scilit]
  28. Cushman, S.A.; Kilshaw, K.; Campbell, R.D.; Kaszta, Z.; Gaywood, M.; Macdonald, D.W. Comparing the performance of global, geographically weighted and ecologically weighted species distribution models for Scottish wildcats using GLM and Random Forest predictive modeling. Ecol. Model. 2024, 492, 110691. [Google Scholar] [CrossRef] [Scilit]
  29. Safdar, S.; Younes, I.; Ahmad, A.; Sastry, S. A comprehensive review of spatial distribution modeling of plant species in mountainous environments: Implications for biodiversity conservation and climate change assessment. Kuwait J. Sci. 2025, 52, 100337. [Google Scholar] [CrossRef] [Scilit]
  30. Wani, Z.A.; Dar, J.A.; Lone, A.N.; Pant, S.; Siddiqui, S. Habitat suitability modelling and range change dynamics of Bergenia stracheyi under projected climate. Front. Ecol. Evol. 2025, 13, 1561640. [Google Scholar] [CrossRef] [Scilit]
  31. Sun, X.; Long, Z.; Jia, J. A multi-scale Maxent approach to model habitat suitability for the giant pandas in the Qionglai mountain, China. Glob. Ecol. Conserv. 2021, 30, e01766. [Google Scholar] [CrossRef] [Scilit]
  32. Li, Z.; Liu, Y.; Zeng, H. Application of the MaxEnt model in improving the accuracy of ecological red line identification: A case study of Zhanjiang, China. Ecol. Indic. 2022, 137, 108767. [Google Scholar] [CrossRef] [Scilit]
  33. Zhao, Z.; Xiao, N.; Shen, M.; Li, J. Comparison between optimized MaxEnt and random forest modeling in predicting potential distribution: A case study with Quasipaa boulengeri in China. Sci. Total Environ. 2022, 842, 156867. [Google Scholar] [CrossRef] [Scilit] [PubMed]
  34. Yan, H.; Feng, L.; Zhao, Y.; Feng, L.; Wu, D.; Zhu, C. Prediction of the spatial distribution of Alternanthera philoxeroides in China based on ArcGIS and MaxEnt. Glob. Ecol. Conserv. 2020, 21, e00856. [Google Scholar] [CrossRef] [Scilit]
  35. Yudaputra, A.N.G.G.A. Modelling potential current distribution and future dispersal of an invasive species Calliandra calothyrsus in Bali Island, Indonesia. Biodiversitas 2020, 21, 674–682. [Google Scholar] [CrossRef] [Scilit]
  36. Cao, J.; Xu, J.; Pan, X.; Monaco, T.A.; Zhao, K.; Wang, D.; Rong, Y. Potential impact of climate change on the global geographical distribution of the invasive species, Cenchrus spinifex (Field sandbur, Gramineae). Ecol. Indic. 2021, 131, 108204. [Google Scholar] [CrossRef] [Scilit]
  37. Wu, K.; Wang, Y.; Liu, Z.; Huo, W.; Cao, J.; Zhao, G.; Zhang, F.G. Prediction of potential invasion of two weeds of the genus Avena in Asia under climate change based on Maxent. Sci. Total Environ. 2024, 950, 175192. [Google Scholar] [CrossRef] [Scilit] [PubMed]
  38. Yang, W.; Sun, S.; Wang, N.; Fan, P.; You, C.; Wang, R.; Zheng, P.; Wang, H. Dynamics of the distribution of invasive alien plants (Asteraceae) in China under climate change. Sci. Total Environ. 2023, 903, 166260. [Google Scholar] [CrossRef] [Scilit] [PubMed]
  39. Xiao, H.; Liao, D.; Zhang, S.; Zhang, Y.; Rehab, O.E.; Zeng, J.; Yan, X.; Su, Q.; Zhou, B. Differences in responses of invasive and native plants to climate change: A case study of Bidens (Asteracea) from China. Front. Plant Sci. 2025, 16, 1583552. [Google Scholar] [CrossRef] [Scilit] [PubMed]
  40. Mousavi, S.S.; Karami, A.; Haghighi, T.M.; Maggi, F. Two Iranian Scrophularia striata Boiss. Ecotypes under UV-B radiation: Germination and initial growth perspective. South Afr. J. Bot. 2022, 148, 460–468. [Google Scholar] [CrossRef] [Scilit]
  41. Muscarella, R.; Galante, P.J.; Soley-Guardia, M.; Boria, R.A.; Kass, J.M.; Uriarte, M.; Anderson, R.P. ENMeval: An R package for conducting spatially independent evaluations and estimating optimal model complexity for Maxent ecological niche models. Methods Ecol. Evol. 2014, 5, 1198–1205. [Google Scholar] [CrossRef] [Scilit]
  42. Zhao, G.; Cui, X.; Sun, J.; Li, T.; Wang, Q.I.; Ye, X.; Fan, B. Analysis of the distribution pattern of Chinese Ziziphus jujuba under climate change based on optimized biomod2 and MaxEnt models. Ecol. Indic. 2021, 132, 108256. [Google Scholar] [CrossRef] [Scilit]
  43. Giulian, J.; Jones, T.C.; Moore, D. Assessing the potential invasive range of Trichonephila clavata using species distribution models. J. Asia-Pac. Biodivers. 2024, 17, 490–496. [Google Scholar] [CrossRef] [Scilit]
  44. Phillips, S.J.; Dudík, M. Modeling of species distributions with Maxent: New extensions and a comprehensive evaluation. Ecography 2008, 31, 161–175. [Google Scholar] [CrossRef] [Scilit]
  45. Valavi, R.; Elith, J.; Lahoz-Monfort, J.J.; Guillera-Arroita, G. Flexible species distribution modelling methods perform well on spatially separated testing data. Glob. Ecol. Biogeogr. 2023, 32, 369–383. [Google Scholar] [CrossRef] [Scilit]
  46. Elbahi, A.; Dugon, M.; Oubrou, W.; El Bekkay, M.; Hermas, J.; Lawton, C. Modelling the ecological niches of reptiles in highly biodiverse protected areas. Geol. Ecol. Landsc. 2025, 9, 1441–1462. [Google Scholar] [CrossRef] [Scilit]
  47. Lobo, J.M.; Jiménez-Valverde, A.; Real, R. AUC: A misleading measure of the performance of predictive distribution models. Glob. Ecol. Biogeogr. 2008, 17, 145–151. [Google Scholar] [CrossRef] [Scilit]
  48. Hao, T.; Elith, J.; Guillera-Arroita, G.; Lahoz-Monfort, J.J. A review of evidence about use and performance of species distribution modelling ensembles like BIOMOD. Divers. Distrib. 2019, 25, 839–852. [Google Scholar] [CrossRef] [Scilit]
  49. Ahmed, N.; Atzberger, C.; Zewdie, W. Species Distribution Modelling performance and its implication for Sentinel-2-based prediction of invasive Prosopis juliflora in lower Awash River basin, Ethiopia. Ecol. Process. 2021, 10, 18. [Google Scholar] [CrossRef] [Scilit]
  50. Allouche, O.; Tsoar, A.; Kadmon, R. Assessing the accuracy of species distribution models: Prevalence, kappa and the true skill statistic (TSS). J. Appl. Ecol. 2006, 43, 1223–1232. [Google Scholar] [CrossRef] [Scilit]
  51. Hirzel, A.H.; Le Lay, G.; Helfer, V.; Randin, C.; Guisan, A. Evaluating the ability of habitat suitability models to predict species presences. Ecol. Model. 2006, 199, 142–152. [Google Scholar] [CrossRef] [Scilit]
  52. Merow, C.; Smith, M.J.; Silander, J.A., Jr. A practical guide to MaxEnt for modeling species’ distributions: What it does, and why inputs and settings matter. Ecography 2013, 36, 1058–1069. [Google Scholar] [CrossRef] [Scilit]
  53. Li, F.; Lv, L.; Bao, S.; Cai, Z.; Fu, S.; Shi, J. Evaluation and Application of the MaxEnt Model to Quantify L. nanum Habitat Distribution Under Current and Future Climate Conditions. Agronomy 2025, 15, 1869. [Google Scholar] [CrossRef] [Scilit]
  54. Taucare-Ríos, A.; Bizama, G.; Bustamante, R.O. Using global and regional species distribution models (SDM) to infer the invasive stage of Latrodectus geometricus (Araneae: Theridiidae) in the Americas. Environ. Entomol. 2016, 45, 1379–1385. [Google Scholar] [CrossRef] [Scilit] [PubMed]
  55. Chi, Y.; Wang, G.G.; Zhu, M.; Jin, P.; Hu, Y.; Shu, P.; Wang, Z.; Fan, A.; Qian, P.; Han, Y.; et al. Potentially suitable habitat prediction of Pinus massoniana Lamb. in China under climate change using Maxent model. Front. For. Glob. Change 2023, 6, 1144401. [Google Scholar] [CrossRef] [Scilit]
  56. Huang, Y.; Zhang, G.; Fu, W.; Zhang, Y.; Zhao, Z.; Li, Z.; Qin, Y. Impacts of climate change on climatically suitable regions of two invasive Erigeron weeds in China. Front. Plant Sci. 2023, 14, 1238656. [Google Scholar] [CrossRef] [Scilit] [PubMed]
  57. Shan, Y.; Shen, H.; Huang, L.; Hamezah, H.S.; Han, R.; Ren, X.; Zhang, C.; Tong, X. Optimized MaxEnt analysis revealing the change of potential distribution area of Lygodium japonicum in China driven by global warming. Front. Plant Sci. 2025, 16, 1601956. [Google Scholar] [CrossRef] [Scilit] [PubMed]
  58. Ren, W.; Peng, J.; Shrestha, N.; Bian, Z.; Yang, Y.; Liu, J.; Liu, X.; Huang, P.; Wu, J. Potential distribution and future shifts of invasive alien plants in China under climate change. Glob. Ecol. Conserv. 2025, 60, e03601. [Google Scholar] [CrossRef] [Scilit]
  59. Wan, J.Z.; Wang, C.J.; Tan, J.F.; Yu, F.H. Climatic niche divergence and habitat suitability of eight alien invasive weeds in China under climate change. Ecol. Evol. 2017, 7, 1541–1552. [Google Scholar] [CrossRef] [Scilit] [PubMed]
  60. Tu, W.; Xiong, Q.; Qiu, X.; Zhang, Y. Dynamics of invasive alien plant species in China under climate change scenarios. Ecol. Indic. 2021, 129, 107919. [Google Scholar] [CrossRef] [Scilit]
  61. Qi, Y.; Wang, H.; Ma, X.; Zhang, J.; Yang, R. Relationship between vegetation phenology and snow cover changes during 2001–2018 in the Qilian Mountains. Ecol. Indic. 2021, 133, 108351. [Google Scholar] [CrossRef] [Scilit]
  62. Li, W.; Lu, H.; Chen, J.M.; Piao, S.; Keenan, T.F.; Miao, G.; Liu, Q.; Zang, Z.; Xu, N.; Liu, J.; et al. Enhanced effect of warming on the leaf-onset date of boreal deciduous broadleaf forest. Nat. Clim. Change 2026, 16, 200–206. [Google Scholar] [CrossRef] [Scilit]
  63. Spohn, M.; Bagchi, S.; Biederman, L.A.; Borer, E.T.; Bråthen, K.A.; Bugalho, M.N.; Caldeira, M.C.; Catford, J.A.; Collins, S.L.; Eisenhauer, N.; et al. The positive effect of plant diversity on soil carbon depends on climate. Nat. Commun. 2023, 14, 6624. [Google Scholar] [CrossRef] [Scilit] [PubMed]
  64. Lu, Y.; Chen, W.; Chen, X.; Li, Z. Effects of microclimate on soil moisture distribution in complex topography at the small watershed scale in the Anning River Region, Southwest China. J. Hydrol. Reg. Stud. 2025, 59, 102381. [Google Scholar] [CrossRef] [Scilit]
  65. Wang, J.; Zhao, M.; Zhang, J.; Zhao, B.; Lu, X.; Wei, H. Characterization and utilization of biochars derived from five invasive plant species Bidens pilosa L., Praxelis clematidea, Ipomoea cairica, Mikania micrantha and Lantana camara L. for Cd2+ and Cu2+ removal. J. Environ. Manag. 2021, 280, 111746. [Google Scholar] [CrossRef] [Scilit] [PubMed]
  66. Arana, J.; Meyers, S.L.; Guan, W.; Johnson, W.G. Interference of morningglories (Ipomoea spp.) with ‘Fascination’triploid watermelon. Weed Sci. 2022, 70, 488–494. [Google Scholar] [CrossRef] [Scilit]
  67. Westbrook, A.S.; Han, R.; Zhu, J.; Cordeau, S.; DiTommaso, A. Drought and Competition With Ivyleaf Morningglory (Ipomoea hederacea) Inhibit Corn and Soybean Growth. Front. Agron. 2021, 3, 720287. [Google Scholar] [CrossRef] [Scilit]
  68. Xiao, C.; Ye, J.; Zhang, H.; Qin, Y.; Yan, R.; Xu, G.; Zhou, H. Assessment of Habitat Suitability for the Invasive Vine Sicyos angulatus Under Current and Future Climate Change Scenarios. Plants 2025, 14, 2745. [Google Scholar] [CrossRef] [Scilit] [PubMed]
  69. Bajahmoum, E.A.; Almaghamsi, A. Physicochemical degradation of Avicennia marina mangrove soils in the Red Sea: Implications for coastal ecosystem services. Front. Soil Sci. 2025, 5, 1621591. [Google Scholar] [CrossRef] [Scilit]
  70. Zhang, Z.; Yang, Q.; Fristoe, T.S.; Dawson, W.; Essl, F.; Kreft, H.; Lenzner, B.; Pergl, J.; Pyšek, P.; Weigelt, P.; et al. The poleward naturalization of intracontinental alien plants. Sci. Adv. 2023, 9, eadi1897. [Google Scholar] [CrossRef] [Scilit] [PubMed]
  71. Fuentes-Lillo, E.; Lembrechts, J.J.; Barros, A.; Aschero, V.; Bustamante, R.O.; Cavieres, L.A.; Clavel, J.; Herrera, I.; Jiménez, A.; Tecco, P.; et al. Going up the Andes: Patterns and drivers of non-native plant invasions across latitudinal and elevational gradients. Biodivers. Conserv. 2023, 32, 4199–4219. [Google Scholar] [CrossRef] [Scilit]
  72. Slatyer, R.A.; Hirst, M.; Sexton, J.P. Niche breadth predicts geographical range size: A general ecological pattern. Ecol. Lett. 2013, 16, 1104–1114. [Google Scholar] [CrossRef] [Scilit] [PubMed]
  73. Sheth, S.N.; Morueta-Holme, N.; Angert, A.L. Determinants of geographic range size in plants. New Phytol. 2020, 226, 650–665. [Google Scholar] [CrossRef] [Scilit] [PubMed]
  74. Muñoz-Rodríguez, P.; Carruthers, T.; Wood, J.R.; Williams, B.R.; Weitemier, K.; Kronmiller, B.; Goodwin, Z.; Sumadijaya, A.; Anglin, N.L.; Filer, D.; et al. A taxonomic monograph of Ipomoea integrated across phylogenetic scales. Nat. Plants 2019, 5, 1136–1144. [Google Scholar] [CrossRef] [Scilit] [PubMed]
  75. Weber, E.; Sun, S.G.; Li, B. Invasive alien plants in China: Diversity and ecological insights. Biol. Invasions 2008, 10, 1411–1429. [Google Scholar] [CrossRef] [Scilit]
Figure 1. Five species of Ipomoea are distributed across China.
Agronomy 16 01763 g001
Figure 2. Correlation matrices of 5 Ipomoea species: (a) I. nil, (b) I. purpurea, (c) I. quamoclit, (d) I. lacunosa, (e) I. alba.
Agronomy 16 01763 g002
Figure 3. ROC (Receiver Operating Characteristic) curve and AUC results of five Ipomoea species under current climate conditions (1981–2010) based on ten runs: (a) I. nil, (b) I. purpurea, (c) I. quamoclit, (d) I. lacunosa, (e) I. alba.
Agronomy 16 01763 g003
Figure 4. Jackknife test results: (a) I. nil, (b) I. purpurea, (c) I. quamoclit, (d) I. lacunosa, (e) I. alba.
Agronomy 16 01763 g004
Figure 5. Distribution status of Ipomoea species in China: (a) I. nil, (b) I. purpurea, (c) I. quamoclit, (d) I. lacunosa, (e) I. alba.
Agronomy 16 01763 g005
Figure 6. Potentially suitable habitats for I. nil across China under projected climate scenarios.
Agronomy 16 01763 g006
Figure 7. Potentially suitable habitats for I. purpurea across China under projected climate scenarios.
Agronomy 16 01763 g007
Figure 8. Potentially suitable habitats for I. quamoclit across China under projected climate scenarios.
Agronomy 16 01763 g008
Figure 9. Potentially suitable habitats for I. lacunosa across China under projected climate scenarios.
Agronomy 16 01763 g009
Figure 10. Potentially suitable habitats for I. alba across China under projected climate scenarios.
Agronomy 16 01763 g010
Figure 11. Changes in the distribution of I. nil’s total appropriate habitat centroids under various warming scenarios.
Agronomy 16 01763 g011
Figure 12. Changes in the distribution of I. purpurea’s total appropriate habitat centroids under various warming scenarios.
Agronomy 16 01763 g012
Figure 13. Changes in the distribution of I. quamoclit’s total appropriate habitat centroids under various warming scenarios.
Agronomy 16 01763 g013
Figure 14. Changes in the distribution of I. lacunosa’s total appropriate habitat centroids under various warming scenarios.
Agronomy 16 01763 g014
Figure 15. Changes in the distribution of I. alba’s total appropriate habitat centroids under various warming scenarios.
Agronomy 16 01763 g015
Table 1. Lifeforms and origin of five invasive plants in the Ipomoea.
PlantsLife FormOriginIntrusion LevelNumber of
Distribution Records
I. nilAnnual herbTropical AmericaSerious invasion430
I. purpureaAnnual twining herbTropical AmericaMalicious intrusion340
I. quamoclitAnnual, slender twining herbTropical AmericaLocalized invasion173
I. lacunosaAnnual twining herbEastern and central AmericaLocalized invasion28
I. albaAnnual or perennial large twining herbTropical AmericaLocalized invasion56
Table 2. 34 types of environmental variables.
TypeVariableVariable DescriptionUnit
ClimateBio1Average Annual Temperature°C
Bio2Mean Diurnal Range
Bio3Isothermality°C
Bio4Temperature Seasonality°C
Bio5Highest Temperature of Hottest Month°C
Bio6Min Temperature of Coldest Month°C
Bio7Temperature Annual Range°C
Bio8Mean Temperature of Wettest Quarter°C
Bio9Mean Temperature over the Driest Quarter°C
Bio10Mean Temperature of Warmest Quarter°C
Bio11Mean Temperature of the Coldest Quarter°C
Bio12Annual Precipitationmm
Bio13Precipitation of the Wettest Monthmm
Bio14Precipitation of the Driest Monthmm
Bio15Precipitation Seasonalitymm
Bio16Precipitation of the Wettest Quartermm
Bio17Precipitation of the Driest Quartermm
Bio18Precipitation of the Warmest Quartermm
Bio19Precipitation of the Coldest Quartermm
SCDSnow Cover Daysd
AltitudeAspectAspect°
ElevationElevationm
SlopeSlope°
TWITopographic Wetness Index
Soil VariablesBDBulk Densityg/cm3
OCSoil Organic Carbong/cm3
pHSoil pH
TNTotal Nitrogeng/cm3
UV-BUVB1Annual Mean UV-B RadiationkJ m−2 day−1
UVB2UV-B Radiation SeasonalitykJ·m−2·day−1
UVB3Mean UV-B of Highest MonthkJ m−2 day−1
UVB4Mean UV-B radiation of the wettest quarterkJ·m−2·day−1
UVB5Sum of Monthly Mean UV-B
during Highest Quarter
kJ m−2 day−1
UVB6UV-B Radiation of the Driest QuarterkJ·m−2·day−1
Note: “−” represents unselected variables in the model.
Table 3. Model evaluation metrics of five Ipomoea species from ten runs under the current climate.
PlantsMetric Type12345678910Avg.
I. nilTraining AUC0.92180.93770.93300.92030.92690.91900.92310.93210.91960.92250.9256
Test AUC0.90650.92450.91310.91750.91270.89230.90230.90770.92500.91100.9113
TSS0.81430.83090.84250.84930.84930.85430.85870.86440.86690.86610.8492
Training Omission0.12890.03830.09410.06270.1010.08010.12540.14980.06620.08710.0934
Test Omission0.15790.07370.17890.11580.12630.10530.21050.26320.05260.12630.1411
CBI0.9950.990.9640.9920.9840.9850.9990.9920.9950.9950.9891
I. purpureaTraining AUC0.90070.90960.90500.91190.91200.91730.90510.90560.92230.91710.9107
Test AUC0.90390.91540.88790.88150.88850.89460.88710.89580.87620.89220.8923
TSS0.81110.82430.83910.8510.86020.87230.87850.88450.89140.89420.8606
Training Omission0.07240.06180.08370.09460.07530.08710.06850.09120.07760.08890.08011
Test Omission0.07360.05890.08170.09430.08750.07680.06420.09160.06950.08240.0781
CBI0.9910.9860.9890.9890.9940.9920.9750.9930.9920.9930.9894
I. quamoclitTraining AUC0.94810.95300.94910.94220.93880.94280.94440.94520.95240.95720.9473
Test AUC0.91780.93670.92390.91610.92890.91530.92990.93850.96060.93980.9308
TSS0.83270.83290.84210.85390.86710.87590.88670.88890.89490.88210.8655
Training Omission0.00880.06190.088500.04420.02650.02650.12390.07080.03540.0487
Test Omission0.05410.0270.162200.05410.10810.13510.16220.05410.13510.0892
CBI0.890.9210.9730.980.9520.970.9290.960.980.9780.9533
l. lacunosaTraining AUC0.98030.97960.96980.97940.99000.98010.97300.98490.98940.97070.9797
Test AUC0.98070.97960.95650.95540.92610.98740.92730.95990.98170.98170.9636
TSS0.75810.78510.78890.79830.80710.81620.82530.83030.84090.85290.8103
Training Omission0.06250.062500.0625000.1250.0625000.0375
Test Omission00.200.20.600.60.2000.18
CBI0.8890.8720.8860.8410.7560.940.8290.7420.8080.7160.8279
I. albaTraining AUC0.98620.99260.99450.98980.99310.98890.98920.98560.98950.98720.9897
Test AUC0.98180.98750.99010.98970.98680.96610.96080.98520.99470.98150.9824
TSS0.8470.86060.84530.82140.83550.85250.81980.81310.86610.80390.8365
Training Omission0.03030.030300.06060.03030.03030.06060.12120.03030.06060.0454
Test Omission00.100.20.20.20.30.100.10.13
CBI0.8660.9250.8080.9180.8690.8740.9580.780.8340.840.8672
Table 4. Percentage contribution of environmental variables.
TypeVariableVariable DescriptionUnitPercent Contribution (%)
I. nilI. purpureaI. quamoclitI. lacunosaI. alba
ClimateBio2Mean Diurnal Range°C3.90.13.93.60.4
Bio3IsothermalityUnitless0.64.20.65.30.2
Bio4Temperature SeasonalityUnitless5.3
Bio7Temperature Annual Range°C12.92.60.72.8
Bio8Mean Temperature of Wettest Quarter°C6.20.8
Bio9Mean Temperature over the Driest Quarter°C57.0
Bio11Mean Temperature of Coldest Month°C65.6
Bio12Annual Precipitationmm3.713.911.6
Bio13Precipitation of the Wettest Monthmm0.8
Bio15Precipitation SeasonalityUnitless1.21.11.70.62.2
Bio19Precipitation of the Coldest Quartermm15.52.0
SCDSnow Cover Daysd53.341.1
SoilBDBulk Densityg/cm33.70.72.51.5
TNSoil Nitrogeng/cm31.60.50.12.90.6
pHSoil pHDimensionless6.114.41.22.31.1
OCSoil Organic Carbong/cm30.34.21.72.213.9
AltitudeAspectAspect(°)0.71.00.22.50.4
ElevationElevationm41.5-
SlopeSlope(°)1.82.02.411.01.6
TWITopographic Wetness Indexunitless3.21.00.91.32.5
UV-BUVB2UV-B Radiation SeasonalitykJ·m−2·day−15.65.89.01.2
UVB4Mean UV-B radiation of the wettest quarterkJ·m−2·day−11.47.50.22.3
UVB6UV-B Radiation of the Driest QuarterkJ·m−2·day−14.5
Note: “−” represents unselected variables in the model.
Table 5. Appropriate area of I. nil in different periods (×104 km2).
Scenario and YearLow SuitabilityChange (%)Middle SuitabilityChange (%)High SuitabilityChange (%)Total SuitChange (%)
Reference period114.61-68.08-37.19-105.27-
SSP1262011–2040113.77−0.7368.530.6641.6612.01110.194.67
2041–2070100.48−12.391.7834.8186.45132.45 ↑178.2369.30
2071–2100101.64−11.3191.6834.6785.50129.90177.1868.31
SSP3702011–2040118.523.4181.9620.3944.5419.76126.5020.16
2041–2070107.21−6.4688.1529.4877.01107.07165.1656.89
2071–210097.18−15.21 ↓97.6643.4583.92125.65181.5772.48
SSP5852011–2040118.073.0279.8417.2744.3019.12124.1417.92
2041–2070107.76−5.9882.9421.8359.1559.05142.0934.97
2071–2100106.11−7.4286.5927.1978.17110.19164.7656.51
Note: “Change (%)” shows the percentage change in the appropriate region relative to the current time. ‘↑’ indicates the greatest growth, whereas ‘↓’ indicates the maximum reduction.
Table 6. Appropriate area of I. purpurea in different periods (×104 km2).
PeriodLow SuitabilityChange (%)Middle SuitabilityChange (%)High SuitabilityChange (%)Total SuitabilityChange (%)
Reference period126.73-82.55-57.55-140.10-
SSP1262011–2040132.854.8283.320.9376.9933.78160.3112.60
2041–2070132.194.3182.53−0.03113.2396.75195.7639.72
2071–2100121.93−3.7992.2311.7277.6434.90169.8721.24
SSP3702011–2040125.44−1.0283.150.7277.2934.31160.4414.51
2041–2070139.279.8989.488.39111.7294.13201.2043.61
2071–2100144.4113.9598.3719.16138.71141.02237.0769.21
SSP5852011–2040115.27−9.0474.57−9.67 ↓57.820.47132.39−5.50
2041–2070118.16−6.7680.05−3.0383.8045.61163.8516.95
2071–2100158.8325.33104.4826.55151.36163.01 ↑255.8482.61
Note: “Change (%)” shows the percentage change in the appropriate region relative to the current time. ‘↑’ indicates the greatest growth, whereas ‘↓’ indicates the maximum reduction.
Table 7. Appropriate area of I. quamoclit in different periods (×104 km2).
PeriodLow SuitabilityChange (%)Middle SuitabilityChange (%)High SuitabilityChange (%)Total SuitabilityChange (%)
Reference period71.44-42.29-26.48-68.77-
SSP1262011–204080.8513.1743.412.6425.78−2.6769.190.61
2041–207076.607.2255.1830.4758.28120.09113.4664.98
2071–210076.076.4760.7943.7463.11138.32123.9080.16
SSP3702011–204074.814.7237.66−10.9626.29−0.7163.95−7.00
2041–207075.105.1256.6934.0465.40146.97 ↑122.0977.53
2071–210080.1412.1754.6029.152.7399.1107.3256.05
SSP5852011–204077.528.531.70−25.05 ↓21.77−17.7953.47−22.24
2041–207075.415.5652.2523.5540.7453.8593.0024.23
2071–210077.117.9452.5724.3158.67121.53111.2461.75
Note: “Change (%)” shows the percentage change in the appropriate region relative to the current time. ‘↑’ indicates the greatest growth, whereas ‘↓’ indicates the maximum reduction.
Table 8. Appropriate area of I. lacunosa in different periods (×104 km2).
PeriodLow SuitabilityChange (%)Middle SuitabilityChange (%)High SuitabilityChange (%)Total SuitabilityChange (%)
Reference period47.46-20.06-10.56-30.62-
SSP1262011–204044.72−5.7915.88−20.846.55−37.9922.43−28.01
2041–207069.1145.6242.31110.9160.39471.79102.70229.58
2071–210059.3124.9537.8588.6859.77465.9997.62213.28
SSP3702011–204041.50−12.5616.51−17.699.20−12.8725.71−17.49
2041–207064.0734.9935.7278.0650.58378.9886.30176.95
2071–210068.4244.1647.11134.8369.41557.21 ↑116.52273.94
SSP5852011–204036.65−22.7812.03−40.02 ↓8.83−16.3720.87−33.02
2041–207066.1839.4438.2090.4147.57350.4285.77175.25
2071–210053.7413.2227.5337.2337.51255.1465.03108.69
Note: “Change (%)” shows the percentage change in the appropriate region relative to the current time. ‘↑’ indicates the greatest growth, whereas ‘↓’ indicates the maximum reduction.
Table 9. Appropriate area of I. alba in different periods (×104 km2).
PeriodLow SuitabilityChange (%)Middle SuitabilityChange (%)High SuitabilityChange (%)Total SuitabilityChange (%)
Reference period12.80-4.22-3.70-7.92-
SSP1262011–204019.5252.525.9340.433.43−7.329.0614.39
2041–207026.78109.2212.52196.4112.02224.4624.54209.84
2071–210033.02158.0013.96230.4115.86328.0329.82276.51
SSP3702011–204019.3050.827.2872.268.03116.6315.3193.30
2041–207031.64147.2412.15187.5313.30259.0725.45221.33
2071–210035.17174.7814.90252.6014.99304.7129.89277.39
SSP5852011–204027.98118.649.47124.132.88−22.39 ↓12.3555.93
2041–207026.01103.2210.17140.678.45128.1918.62135.10
2071–210030.90141.4618.31333.2920.44451.79 ↑38.75389.26
Note: “Change (%)” shows the percentage change in the appropriate region relative to the current time. ‘↑’ indicates the greatest growth, whereas ‘↓’ indicates the maximum reduction.
Disclaimer/Publisher’s Note: The statements, opinions and data contained in all publications are solely those of the individual author(s) and contributor(s) and not of MDPI and/or the editor(s). MDPI and/or the editor(s) disclaim responsibility for any injury to people or property resulting from any ideas, methods, instructions or products referred to in the content.