Article

Optimal Drip Irrigation Frequency and Volume Mitigates Photosynthetic Impairment and Balances Yield–Resource Trade–Offs for Spring Maize in Arid Sandy Loam Soils
1
Institute of Farmland Water Conservancy and Soil-fertilizer, Xinjiang Academy of Agricultural and Reclamation Science, Shihezi 832000, China
2
Key Laboratory of Agricultural Soil and Water Engineering in Arid and Semiarid Areas of the Ministry of Education, Northwest A&F University, Yangling 712100, China
*
Author to whom correspondence should be addressed.
Agronomy 2026, 16(18), 1751; https://doi.org/10.3390/agronomy16181751
Submission received: 6 July 2026 / Revised: 27 August 2026 / Accepted: 3 September 2026 / Published: 8 September 2026
(This article belongs to the Section Water Use and Irrigation)

Abstract

Optimizing irrigation amount and frequency is critical for maize production in arid sandy loam soils, which are characterized by severe water scarcity and high leaching risks. This study aimed to determine the physiological and multi-objective synergistic responses of spring maize to different drip irrigation regimes in the sandy soil region of Southern Xinjiang and to identify the optimal water management strategy. A two-year field experiment evaluated four irrigation amounts (W1: 350 mm, W2: 500 mm, W3: 650 mm, W4: 800 mm) combined with three irrigation frequencies (F4: 4-day, F7: 7-day, F10: 10-day intervals). The results indicated that increasing irrigation amount and frequency generally improved canopy physiological performance (leaf area index, SPAD values, net photosynthetic rates, and photosystem II photochemical efficiency), though the response magnitudes varied among specific physiological parameters and irrigation levels. Grain yield increased with irrigation amount and was highest at 800 mm under F4 or F7 frequency; however, excessive water inputs led to reduced water productivity. Conversely, nutrient use efficiencies for nitrogen, phosphorus, and potassium exhibited a parabolic response, reaching their maxima under W3 (650 mm) and F7 (7-day interval). To reconcile the trade-offs between maximum productivity and resource conservation, the entropy weight method coupled with TOPSIS (EWM-TOPSIS) was applied. The results showed that grain yield and water productivity were the dominant indicators determining overall system efficacy, with the W3F7 treatment consistently achieving the highest relative closeness (over 76%) to the ideal solution in both years. While this optimal recommendation relies on the multi-criteria weighting framework of the EWM-TOPSIS model, integrating a 650 mm irrigation quota with a 7-day interval offers a practical agronomic strategy to balance yield, water productivity, and nutrient efficiency in arid agroecosystems.

1. Introduction

Maize (Zea mays L.) is a globally vital cereal crop, playing an irreplaceable role in ensuring food security and meeting escalating global demand [1,2]. In arid and semi-arid regions, such as the temperate continental climate of Xinjiang, China, agricultural productivity is severely constrained by extreme water scarcity and erratic precipitation [3,4]. Furthermore, the widespread sandy loam soils in these regions are characterized by poor water-holding capacity, making them susceptible to rapid water percolation and nutrient movement below the shallow root layer [5]. Consequently, optimizing agricultural inputs is not only a primary agronomic challenge but also a fundamental necessity for sustainable crop production and environmental protection in arid agroecosystems [6,7].
Drip irrigation under plastic film has been widely adopted to mitigate water scarcity and enhance crop water productivity (WP) [3,8]. The dynamic balance of soil water availability—termed the soil moisture regime—is fundamentally dictated by soil physical properties (particularly soil texture) interacting with management practices [9]. In drip irrigation systems, this regime is governed by three interrelated but distinct parameters: total seasonal irrigation amount, irrigation frequency (interval between applications), and single-irrigation event size (quota). Canopy photosynthetic performance serves as the primary engine for photoassimilate accumulation, yet it is exceptionally sensitive to fluctuations in the soil moisture regime [10,11]. Inappropriate irrigation frequencies or inadequate total volumes trigger severe intermittent drought stress, inducing stomatal closure (Gsw) to limit transpiration loss, which subsequently restricts intercellular CO2 diffusion and leads to stomatal limitation of photosynthesis [12,13,14]. Under extreme soil drying coupled with high atmospheric evaporative demand, non-stomatal factors—specifically the impairment of photosystem II (PSII) reaction centers and thylakoid membrane structures—further reduce light-harvesting and electron transport efficiencies [15,16,17]. Conversely, while increasing total irrigation amount or frequency can alleviate moisture stress, excessive single-irrigation quotas do not endlessly boost growth; instead, they trigger luxury water consumption and restrict soil aeration, diminishing photosynthetic gains [18,19,20,21]. Therefore, fine-tuning the combination of total irrigation amount, application frequency, and single-event quota is essential to maintain an optimal soil moisture regime that enhances canopy physiological function without causing hypoxic or luxury-consumption penalties.
Fertigation further complicates root-zone dynamics due to the contrasting mobility profiles of macronutrients in soil profiles [22,23]. Nitrogen, predominantly present as highly mobile nitrate (NO3-N), is easily carried by excessive irrigation or low-frequency high-volume wetting fronts through the 60 cm sandy loam layer, resulting in severe deep leaching and groundwater contamination risks [5,24,25]. In contrast, available phosphorus (AP) and available potassium (AK) exhibit strong spatial conservatism and low mobility, tending to accumulate in the shallow surface soil near emitters [26,27]. This spatial mismatch—where nitrogen escapes below the active root zone while phosphorus and potassium remain trapped in topsoil—severely limits the synergistic uptake of N, P, and K by crops [28,29]. Short-interval, moderate-volume drip regimes can maintain an optimal wetting front, suppressing non-beneficial topsoil evaporation while simultaneously intercepting mobile nitrogen within the primary root zone (0–40 cm) and driving P and K diffusion toward the root surface [30,31,32]. Regulating irrigation timing and quota is thus pivotal for synchronizing root-zone water-nutrient dynamics with crop uptake demand [33,34,35,36,37].
Traditional agricultural evaluations often rely on single-factor optimization—typically pursuing maximum grain yield—which frequently leads to resource wastage, reduced resource use efficiencies, and elevated environmental footprints [38,39,40]. Modern sustainable agriculture demands a multi-objective decision-making approach that simultaneously optimizes grain yield, WP, and multi-element nutrient use efficiencies [41,42]. The entropy weight method combined with the Technique for Order Preference by Similarity to Ideal Solution (EWM-TOPSIS) provides an objective, robust mathematical framework to eliminate subjective weighting bias and resolve complex trade-offs among conflicting agronomic performance metrics [43,44]. Although real-time soil moisture monitoring and evapotranspiration models are widely studied, their practical adoption under film-mulched drip irrigation in hyper-arid regions (e.g., Southern Xinjiang) remains limited by sensor placement sensitivity within localized wetting bulbs and low operational accessibility for local growers. To bridge research with field practice, establishing structured, easily adoptable combinations of irrigation amounts and fixed calendar intervals—grounded in regional farming benchmarks—is vastly more practical.
However, comprehensive studies systematically evaluating how combinations of total irrigation amount and frequency (and their corresponding single-event quotas) regulate aboveground physiological mechanisms (e.g., canopy expansion, leaf gas exchange, and PSII photochemical efficiency) and their coupling with multi-objective optimization (yield, WP, and N/P/K use efficiencies) for spring maize in arid sandy loam soils remain limited. Therefore, a two-year field experiment was conducted to (1) evaluate the physiological response mechanisms, specifically focusing on how irrigation amount and frequency modulate leaf area index, SPAD values, photosynthetic capacity, and PSII photochemical efficiency; (2) elucidate the synergistic effects of irrigation amount and frequency on dry matter accumulation, grain yield, WP, and multi-element (N, P, K) nutrient use efficiencies; and (3) establish a robust multi-objective evaluation framework using the EWM-TOPSIS model to identify the optimal drip irrigation strategy that balances high productivity with enhanced resource use efficiency in arid agroecosystems.

2. Materials and Methods

2.1. Experimental Area

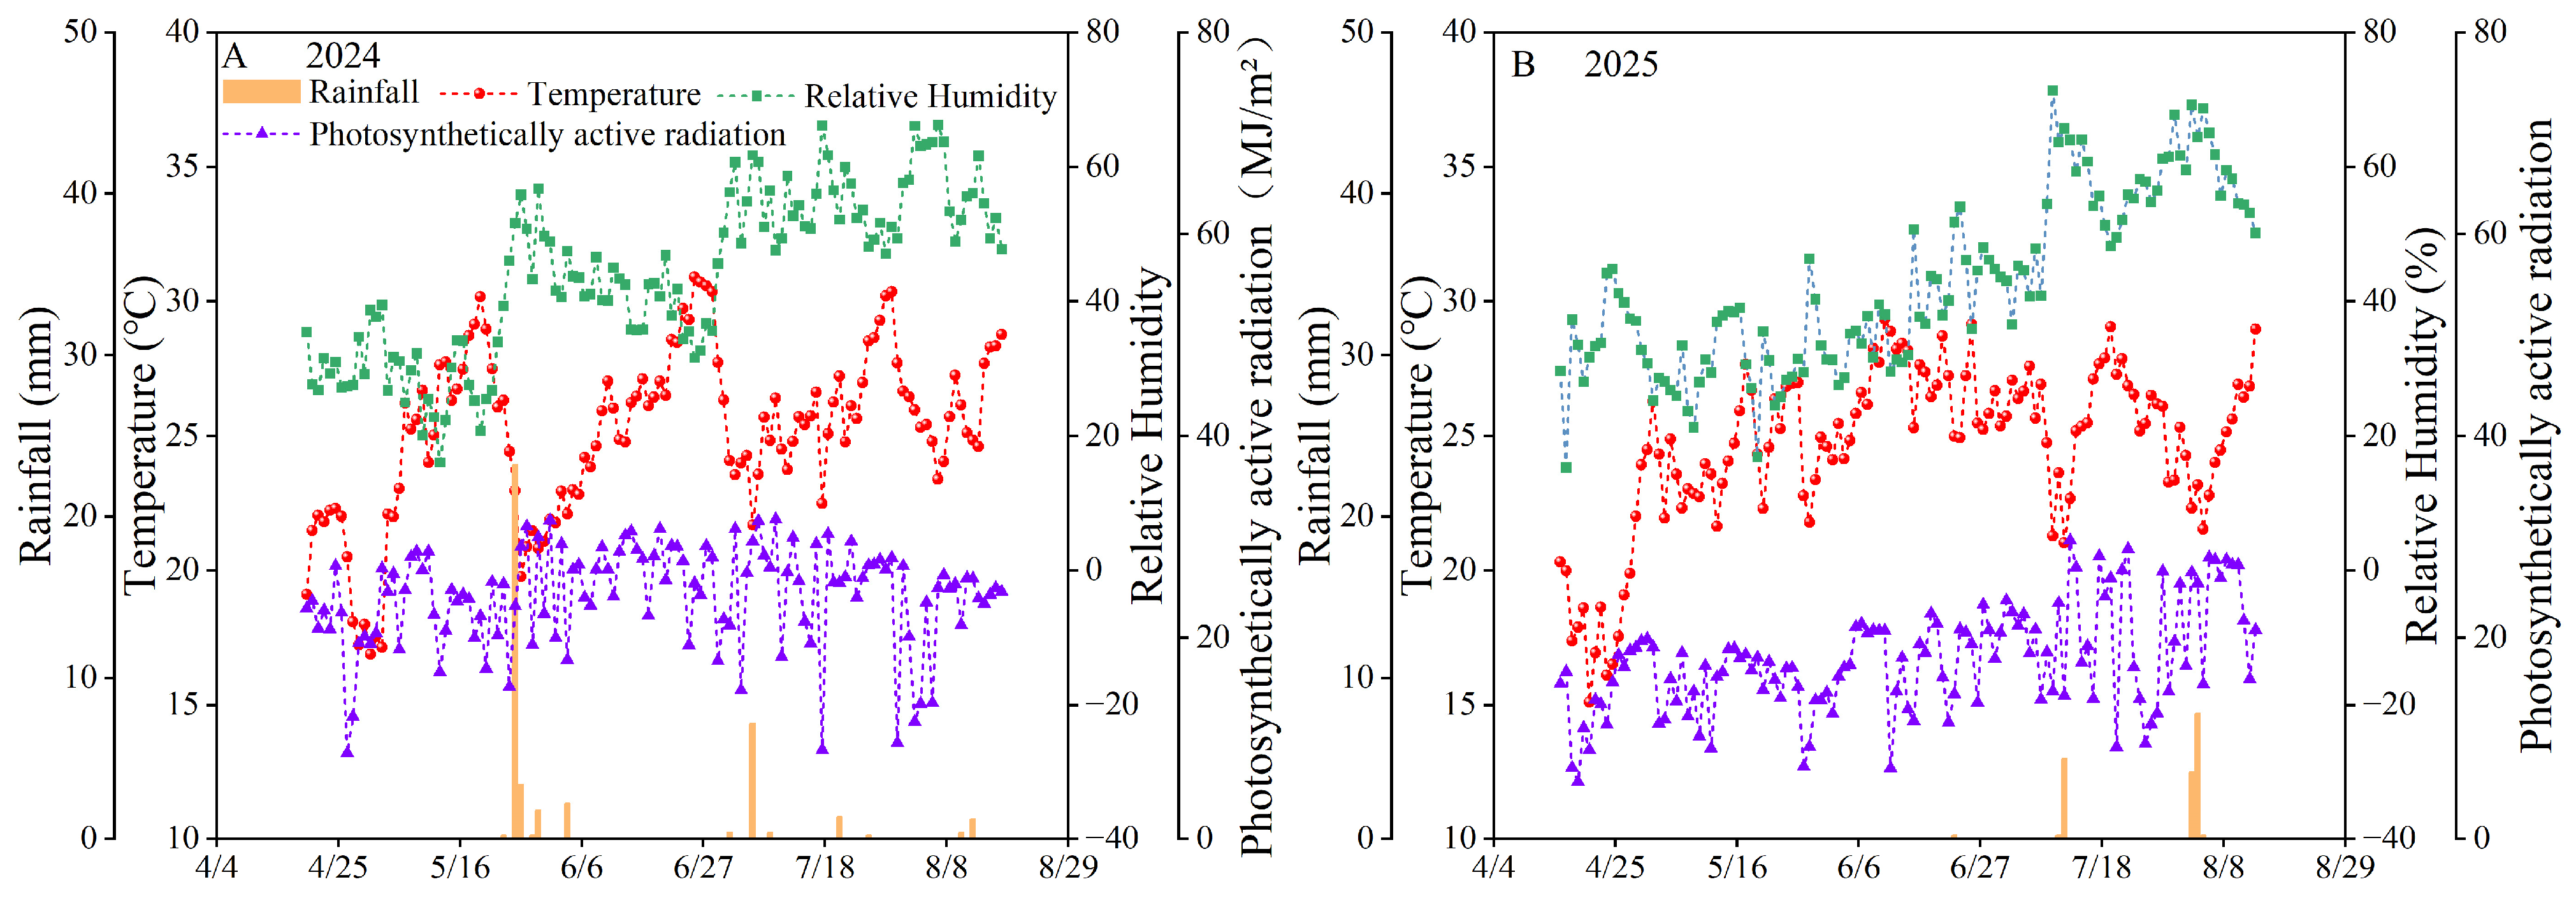
The field experiments were conducted at the Academician Expert Workstation of Modern Agriculture in Aral, Xinjiang, China (40°37′ N, 81°12′ E, 1009 m a.s.l.). The experimental site features a typical temperate continental climate, with a long-term mean annual temperature of 10.7 °C and an average annual precipitation of approximately 50 mm. The soil texture within the 0–60 cm profile is classified as sandy loam, characterized by a bulk density of 1.50 g cm−3 and a field capacity of 0.23 cm3 cm−3. The soil layer below 60 cm is loamy sand. For the entire 0–100 cm soil profile, the average bulk density and field capacity are 1.53 g cm−3 and 0.21 cm3 cm−3, respectively. The groundwater table is at a depth greater than 5 m. Prior to the experiment, the initial chemical properties of the topsoil (0–20 cm) were determined as follows: average nitrate-nitrogen (NO3-N) content of 27.27 mg kg−1, available phosphorus (AP) of 5.46 mg kg−1, and available potassium (AK) of 54.58 mg kg−1. The total precipitation during the experimental periods (maize growing seasons) in 2024 and 2025 was 42.33 mm and 17.60 mm, respectively. The dynamic changes in daily temperature, precipitation, and relative humidity throughout the growing seasons are illustrated in Figure 1.

2.2. Experimental Design and Management Practices

A two-factor randomized complete block design (RCBD) was employed, combining four drip irrigation amounts (W1: 350 mm, W2: 500 mm, W3: 650 mm, W4: 800 mm) and three drip irrigation frequencies (F4: 4-day, F7: 7-day, F10: 10-day intervals), yielding 12 treatment combinations. The experimental field was organized into three spatial blocks (replicates) aligned perpendicular to the field gradient. Each block contained a complete set of all 12 treatments, which were randomly assigned to individual plots within the block using a computer-generated random sequence (Figure S1).
Each experimental plot covered an area of 100 m2 (10 m × 10 m). To eliminate lateral soil water and nutrient movement between adjacent treatments, a 1 m wide unirrigated isolation strip was established between neighboring plots, and a 3 m wide buffer zone surrounded the perimeter of the entire experimental site. The field experiment was conducted on the exact same physical plots in both 2024 and 2025 without plot relocation to preserve treatment continuity.
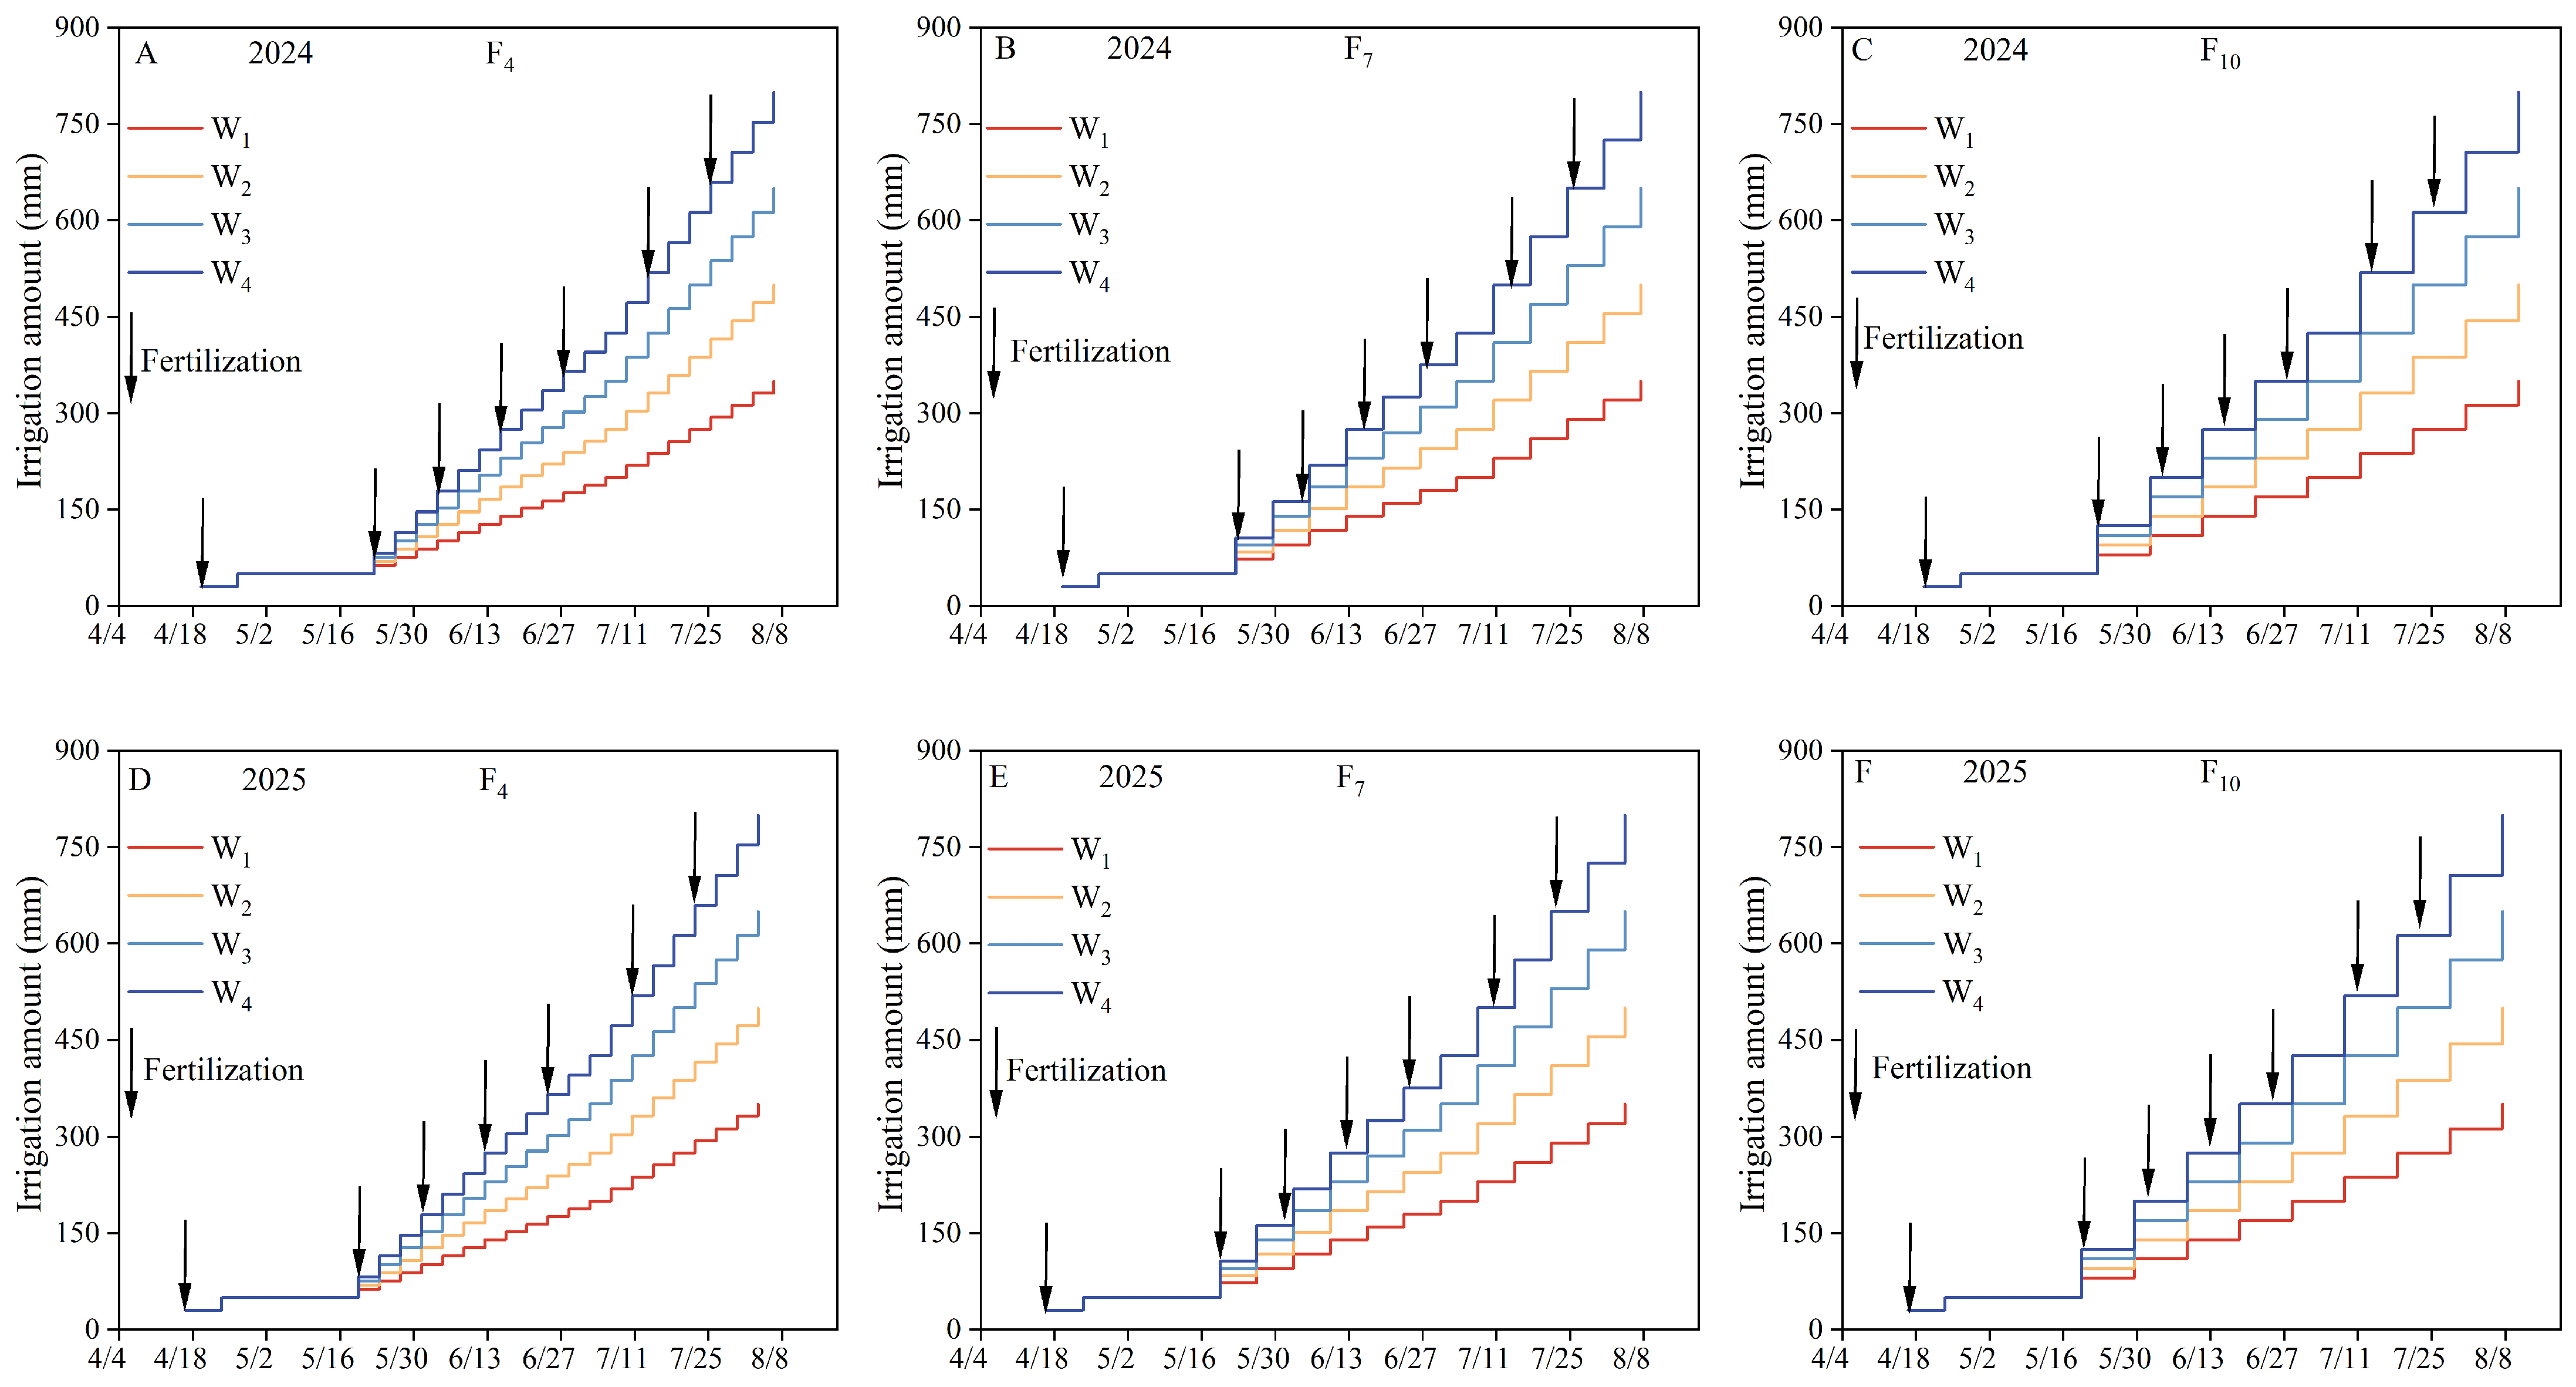
Maize cultivar ‘Xinyu 108’ was planted using a wide–narrow row planting pattern (30 + 80 cm), with a narrow row spacing of 30 cm, a wide row spacing of 80 cm, and a plant spacing of 14.5 cm, resulting in a planting density of 130,000 plants ha−1. A Venturi injector was used for fertigation. The applied fertilizers included urea (N ≥ 45%), monoammonium phosphate (N–P2O5 ≥ 12–60%), and agricultural potassium sulfate (K2O ≥ 50%). The total application rates of nitrogen, phosphorus, and potassium (N–P2O5–K2O) were 400, 200, and 200 kg ha−1, respectively. These seasonal nutrient application rates were established based on local farming surveys and official agronomic recommendations from the Xinjiang Production and Construction Corps (XPCC) for high-yielding drip-irrigated spring maize in Southern Xinjiang, taking into account the high planting density. Fertilizers were applied seven times over the entire growing season. Specifically, 5% of the total fertilizers were applied with irrigation water after seedling emergence. During the jointing, tasseling, and grain-filling stages, fertigation was performed twice per stage, accounting for 30%, 35%, and 30% of the total fertilizer amount, respectively. The experiment utilized inline flat emitter drip tapes with an emitter spacing of 30 cm and a flow rate of 2.6 L h−1. The specific irrigation layout is illustrated in Figure 2.

2.3. Sampling and Data Calculation

2.3.1. Weather Data

An automatic weather station (HOBO U30, United States) recorded wind speed, air temperature, relative humidity, precipitation, and photosynthetically active radiation (PAR, 400–700 nm) at 10 min intervals.

2.3.2. Reference Evapotranspiration (ET0) and Theoretical Crop Water Requirement (ETc)

Daily reference crop evapotranspiration (ET0, mm day−1) was calculated using the standard FAO-56 Penman–Monteith model based on meteorological variables (daily mean air temperature, relative humidity, wind speed at 2 m height, and solar radiation) recorded by the automatic weather station (Section 2.3.1):
E T 0 = 0.408 Δ R n G + γ 900 T + 273 u 2 e s e a Δ + γ 1 + 0.34 u 2
where R n is net radiation (MJ m−2 day−1), G is soil heat flux density (MJ m−2 day−1), T is mean daily air temperature (°C), u 2 is wind speed at 2 m height (m s−1), e s e a is saturation vapor pressure deficit (kPa), Δ is the slope of the saturation vapor pressure curve (kPa °C−1), and γ is the psychrometric constant (kPa °C−1). Standard crop evapotranspiration ( E T c , mm) was calculated as E T c = K c × E T 0 , where K c values were set to 0.60 (initial stage), 1.20 (mid-season), and 0.80 (late season) in accordance with FAO-56 guidelines calibrated for drip-irrigated spring maize in Northwest China. Total seasonal theoretical E T c was estimated at 628.58 mm in 2024 and 582.45 mm in 2025, which served as an independent benchmark to compare with the soil water balance results.

2.3.3. Leaf Area Index and Aboveground Dry Matter

Starting from 27 days after emergence of spring maize, plant samples were collected every 10–20 days. Three representative plants were randomly selected from each treatment to determine leaf area and aboveground dry matter. Leaf area was measured by determining the length and maximum width of each fully expanded leaf per plant using a tape measure (0.1 cm precision), and the leaf area index (LAI) was subsequently calculated.
L A I = 0.75 ρ i = 1 m j = 1 n L i j W i j m
where 0.75 is the correction coefficient for maize leaf area; ρ is the plant density; Lᵢⱼ and Wᵢⱼ are the length and maximum width (cm) of the j-th leaf of the i-th maize plant, respectively; and m is the number of measured plants.
At each sampling event, three plants were randomly selected from each plot and separated from the base of the stem and the underground parts. The various organs (stem, leaf, bract, and ear) were separated, placed in an oven at 105 °C for 1 h for deactivation, and then dried at 75 °C to constant weight. After drying and cooling, the mass was weighed using an electronic balance (0.01 g precision). The average dry matter weight per three plants in each plot was calculated and then multiplied by the planting density to determine the population aboveground dry matter (kg·ha−1).

2.3.4. Leaf SPAD Value

At the jointing, grain-filling, and maturity stages, the SPAD value of the spring maize ear leaf (the top first fully expanded leaf at the jointing stage) was measured at the upper, middle, and lower positions using a SPAD-502Plus portable chlorophyll meter. The average of the three readings was taken as one data point, and each treatment was replicated three times.

2.3.5. Gas Exchange Parameters and Chlorophyll Fluorescence Parameters

On clear, sunny days during the jointing, grain-filling, and maturity stages of spring maize, leaf gas exchange parameters—including net photosynthetic rate (Pn), transpiration rate (Tr), and stomatal conductance (Gsw)—were measured between 11:00 a.m. and 12:00 p.m. using a LI-6400 portable photosynthesis system (LI-COR Inc., Lincoln, NE, USA). Measurements were conducted on the ear leaf (or the uppermost fully expanded leaf at the jointing stage) with three replicates per treatment. To minimize environmental fluctuations and ensure comparability among treatments, chamber microclimatic conditions were standardly controlled across all measurements: photosynthetically active radiation (PAR) was set to a saturating light intensity of 1400 μmol m−2 s−1 using the internal LED light source, and sample cell CO2 concentration was maintained at 400 μmol mol−1 via a CO2 injector. During the 1 h measurement window, ambient air temperature ranged from 28 to 32 °C, and chamber vapor pressure deficit (VPD) was maintained within 1.8–2.5 kPa. Plot measurement sequences were fully randomized to prevent systematic temporal bias.
On the same days as the gas exchange measurements during the jointing, grain-filling, and maturity stages, chlorophyll fluorescence parameters of the ear leaf were measured using a Li-600 fluorescence stomatal meter (LI-COR, USA). The parameters included the maximum photochemical efficiency of PSII (Fv/Fm), the actual photochemical efficiency of PSII (ΦPSII), and the photochemical quenching coefficient (qP).
F v / F m = F m F o F m
ϕ P S I I = F m F s F m
q P = F m F s F m F o

2.3.6. Grain Yield, Water Consumption and Water Productivity

Grain yield was determined at physiological maturity. To eliminate border effects, all sampling was conducted strictly within the central zone of each plot, leaving outer guard rows on both sides and a 1.0 m buffer zone at both ends of each plot unharvested. In each plot, an identical sampling area—a 3 m long section spanning three plastic mulch strips (totaling 12 rows)—was harvested. The actual number of maize plants within each sampling area was precisely recorded. All ears within the designated areas were harvested, air-dried naturally, and manually threshed, with total grain weight measured using an electronic balance. The final grain yield per unit area (kg ha−1) was calculated by converting the harvested grain weight based on the exact sampling area ratio.
Before sowing, after harvest, and both before and 24 h after each irrigation event, systematic soil sampling was conducted across the 0–150 cm soil profile (divided into 0–20, 20–40, 40–60, 60–80, 80–100, 100–120, and 120–150 cm layers). In each plot, three soil cores were collected from locations exhibiting uniform crop growth at varying horizontal distances from the drip line—specifically directly under the drip tape, beside the plant, and in the middle of the wide row. Soil gravimetric water content was subsequently determined using the standard oven-drying method.
Seasonal crop water consumption was evaluated using the soil water balance equation applied to the 0–150 cm soil profile:
E T app = P + I + U R ± Δ W
where E T app represents the apparent seasonal crop evapotranspiration (mm), P is precipitation (mm), I is irrigation amount (mm), U is groundwater upward contribution (mm), R is surface runoff (mm), and Δ W is the change in soil water storage in the 0–150 cm profile between sowing and physiological maturity (mm). Surface runoff ( R ) was zero due to the leveled field and low drip discharge rates (2.6 L h−1). Upward groundwater recharge ( U ) was negligible owing to the deep water table (>5.0 m).
Intensive soil moisture monitoring before and 24 h after irrigation during the grain-filling stage (Figures S2 and S3) indicated that under deficit and moderate irrigation regimes ( W 1 to W 3 ), moisture replenishment was primarily retained within the 0–80 cm root layer, and soil water content remained below field capacity (gravimetric FC = 15.33% in 0–60 cm), resulting in negligible deep percolation ( D 0 ). However, under high-volume single events (particularly F 10 W 4 and W 4 ), post-irrigation topsoil moisture temporarily exceeded field capacity, indicating potential gravitational drainage during post-irrigation redistribution (estimated at ~10–12.5% of the single application quota). Because profile sampling was conducted at critical phenological stages rather than continuously after all individual irrigation events to avoid soil disturbance, E T app for W 4 represents an upper-bound estimate encompassing actual crop ET and secondary deep percolation losses. Water productivity ( W P , kg ha−1 mm−1) was calculated as W P = G Y / E T app .
Water productivity (WP: kg ha−1 mm−1) was defined as the ratio of grain yield to crop water consumption, calculated as:
W P = G Y E T
where GY is the grain yield (kg ha−1), and ET is the crop water consumption (mm).

2.3.7. Nutrient Use Efficiency

Based on the total nitrogen, total phosphorus, and total potassium contents in various organs (stem, leaf, bract, and grain) of spring maize plants at maturity, the N, P, and K uptake per plant was calculated and then converted to kg·ha−1. Subsequently, the nutrient use efficiency was calculated as follows:
N U E = G Y N U
P U E = G Y P U
K U E = G Y K U
where NUE, PUE, and KUE represent nitrogen use efficiency, phosphorus use efficiency, and potassium use efficiency (kg·kg−1), respectively; NU, PU, and KU represent the uptake amounts of nitrogen, phosphorus, and potassium (kg·ha−1), respectively; and GY is the grain yield (kg·ha−1).

2.3.8. Comprehensive Analysis Based on the EWM-TOPSIS Model

To comprehensively evaluate the overall benefits of maize production under different treatments (Grain yield, WP, NUE, PUE, and KUE), this study employed the entropy weight method (EWM) combined with the Technique for Order Preference by Similarity to Ideal Solution (TOPSIS) to construct a comprehensive evaluation model. The specific calculation procedures are as follows:
Data standardization: Assuming the experiment consists of m treatments (m = 12 in this study) and each treatment is evaluated by n indicators, the original data matrix is constructed as X = (xij)m×n, where xij represents the value of the j-th indicator for the i-th treatment. To eliminate discrepancies in dimensions and magnitudes among different indicators, the original data were first normalized using the range standardization method.
z i j = x i j min ( x j ) max ( x j ) min ( x j )
where zij is the dimensionless value after standardization; max (xj) and min (xj) denote the maximum and minimum values of the j-th indicator across all treatments, respectively. To avoid logarithms of zero in subsequent steps, the standardized data were transformed as follows: z′ij = zij + 10−5.
Weight determination using EWM: The proportion of the i-th treatment for the j-th indicator (pij) was calculated as:
p i j = z i j i = 1 m z i j , i = 1 , , m
The information entropy of the j-th indicator (ej) was calculated as:
e j = k i = 1 m p i j ln ( p i j ) , k = 1 ln ( m ) > 0
The objective weight of the j-th indicator (wj) was determined as:
w j = 1 e j j = 1 n ( 1 e j )
Comprehensive evaluation using TOPSIS: The weighted normalized decision matrix A = (aij)m×n was constructed using the calculated weights wj and the standardized matrix:
a i j = w i j × z i j
The positive ideal solution (A+) and the negative ideal solution (A) were identified as follows:
A + = ( a 1 + , a 2 + , , a n + ) = ( max ( a 1 ) , max ( a 2 ) , , max ( a n ) )
A = ( a 1 , a 2 , , a n ) = ( min ( a 1 ) , min ( a 2 ) , , min ( a n ) )
The Euclidean distances of each treatment from the positive and negative ideal solutions (Di+ and Di) were calculated as:
D i + = j = 1 n a i j a j + 2
D i = j = 1 m a i j a j 2
The relative closeness, denoting the comprehensive evaluation index (Si), was calculated for each evaluation object:
S i = D i D i + + D i
where Si∈ [0, 1]. A larger Si value indicates that the comprehensive water and fertilizer benefit of the given drip irrigation treatment is closer to the optimal level, whereas a smaller value indicates poorer performance. Based on the Si values, the 12 treatments were ranked to identify the optimal irrigation strategy.
Additionally, a sensitivity analysis was conducted by perturbing individual indicator weights by 10–20% and sequentially omitting single indicators. The high consistency of treatment rankings across these scenarios confirmed that the EWM-TOPSIS evaluation model was robust and insensitive to weight fluctuations or indicator selections.

2.4. Data Analysis

All experimental data are expressed as mean ± standard deviation (n = 3). Two-way analysis of variance (ANOVA) was conducted using SPSS 26.0 (SPSS Inc., Chicago, IL, USA) to evaluate the main effects of irrigation amount (W), irrigation frequency (F), and their interaction effects (W × F), with block specified as a random effect. Because inter-annual weather variation significantly influenced crop evapotranspiration demand, statistical analyses were performed separately for the 2024 and 2025 growing seasons. For plant physiological and biomass parameters measured repeatedly across the growing season (e.g., LAI, dry matter accumulation, SPAD, leaf gas exchange, and chlorophyll fluorescence), separate two-way ANOVAs were conducted independently at each specific sampling date/growth stage (jointing, tasseling, grain-filling, and maturity). This stage-specific analytical approach was chosen because plant physiological traits undergo rapid ontogenetic shifts over time, making within-stage mean comparisons (p < 0.05, evaluated via Duncan’s multiple range test or LSD test) the most physiologically meaningful method to identify critical water-stress thresholds across developmental phases. Multi-objective evaluation was executed using the EWM–TOPSIS framework in SPSSAU, and figures were rendered using Origin 2024 (OriginLab Corp., Northampton, MA, USA).

3. Results

3.1. Leaf Area Index and Leaf SPAD Value

3.1.1. Leaf Area Index

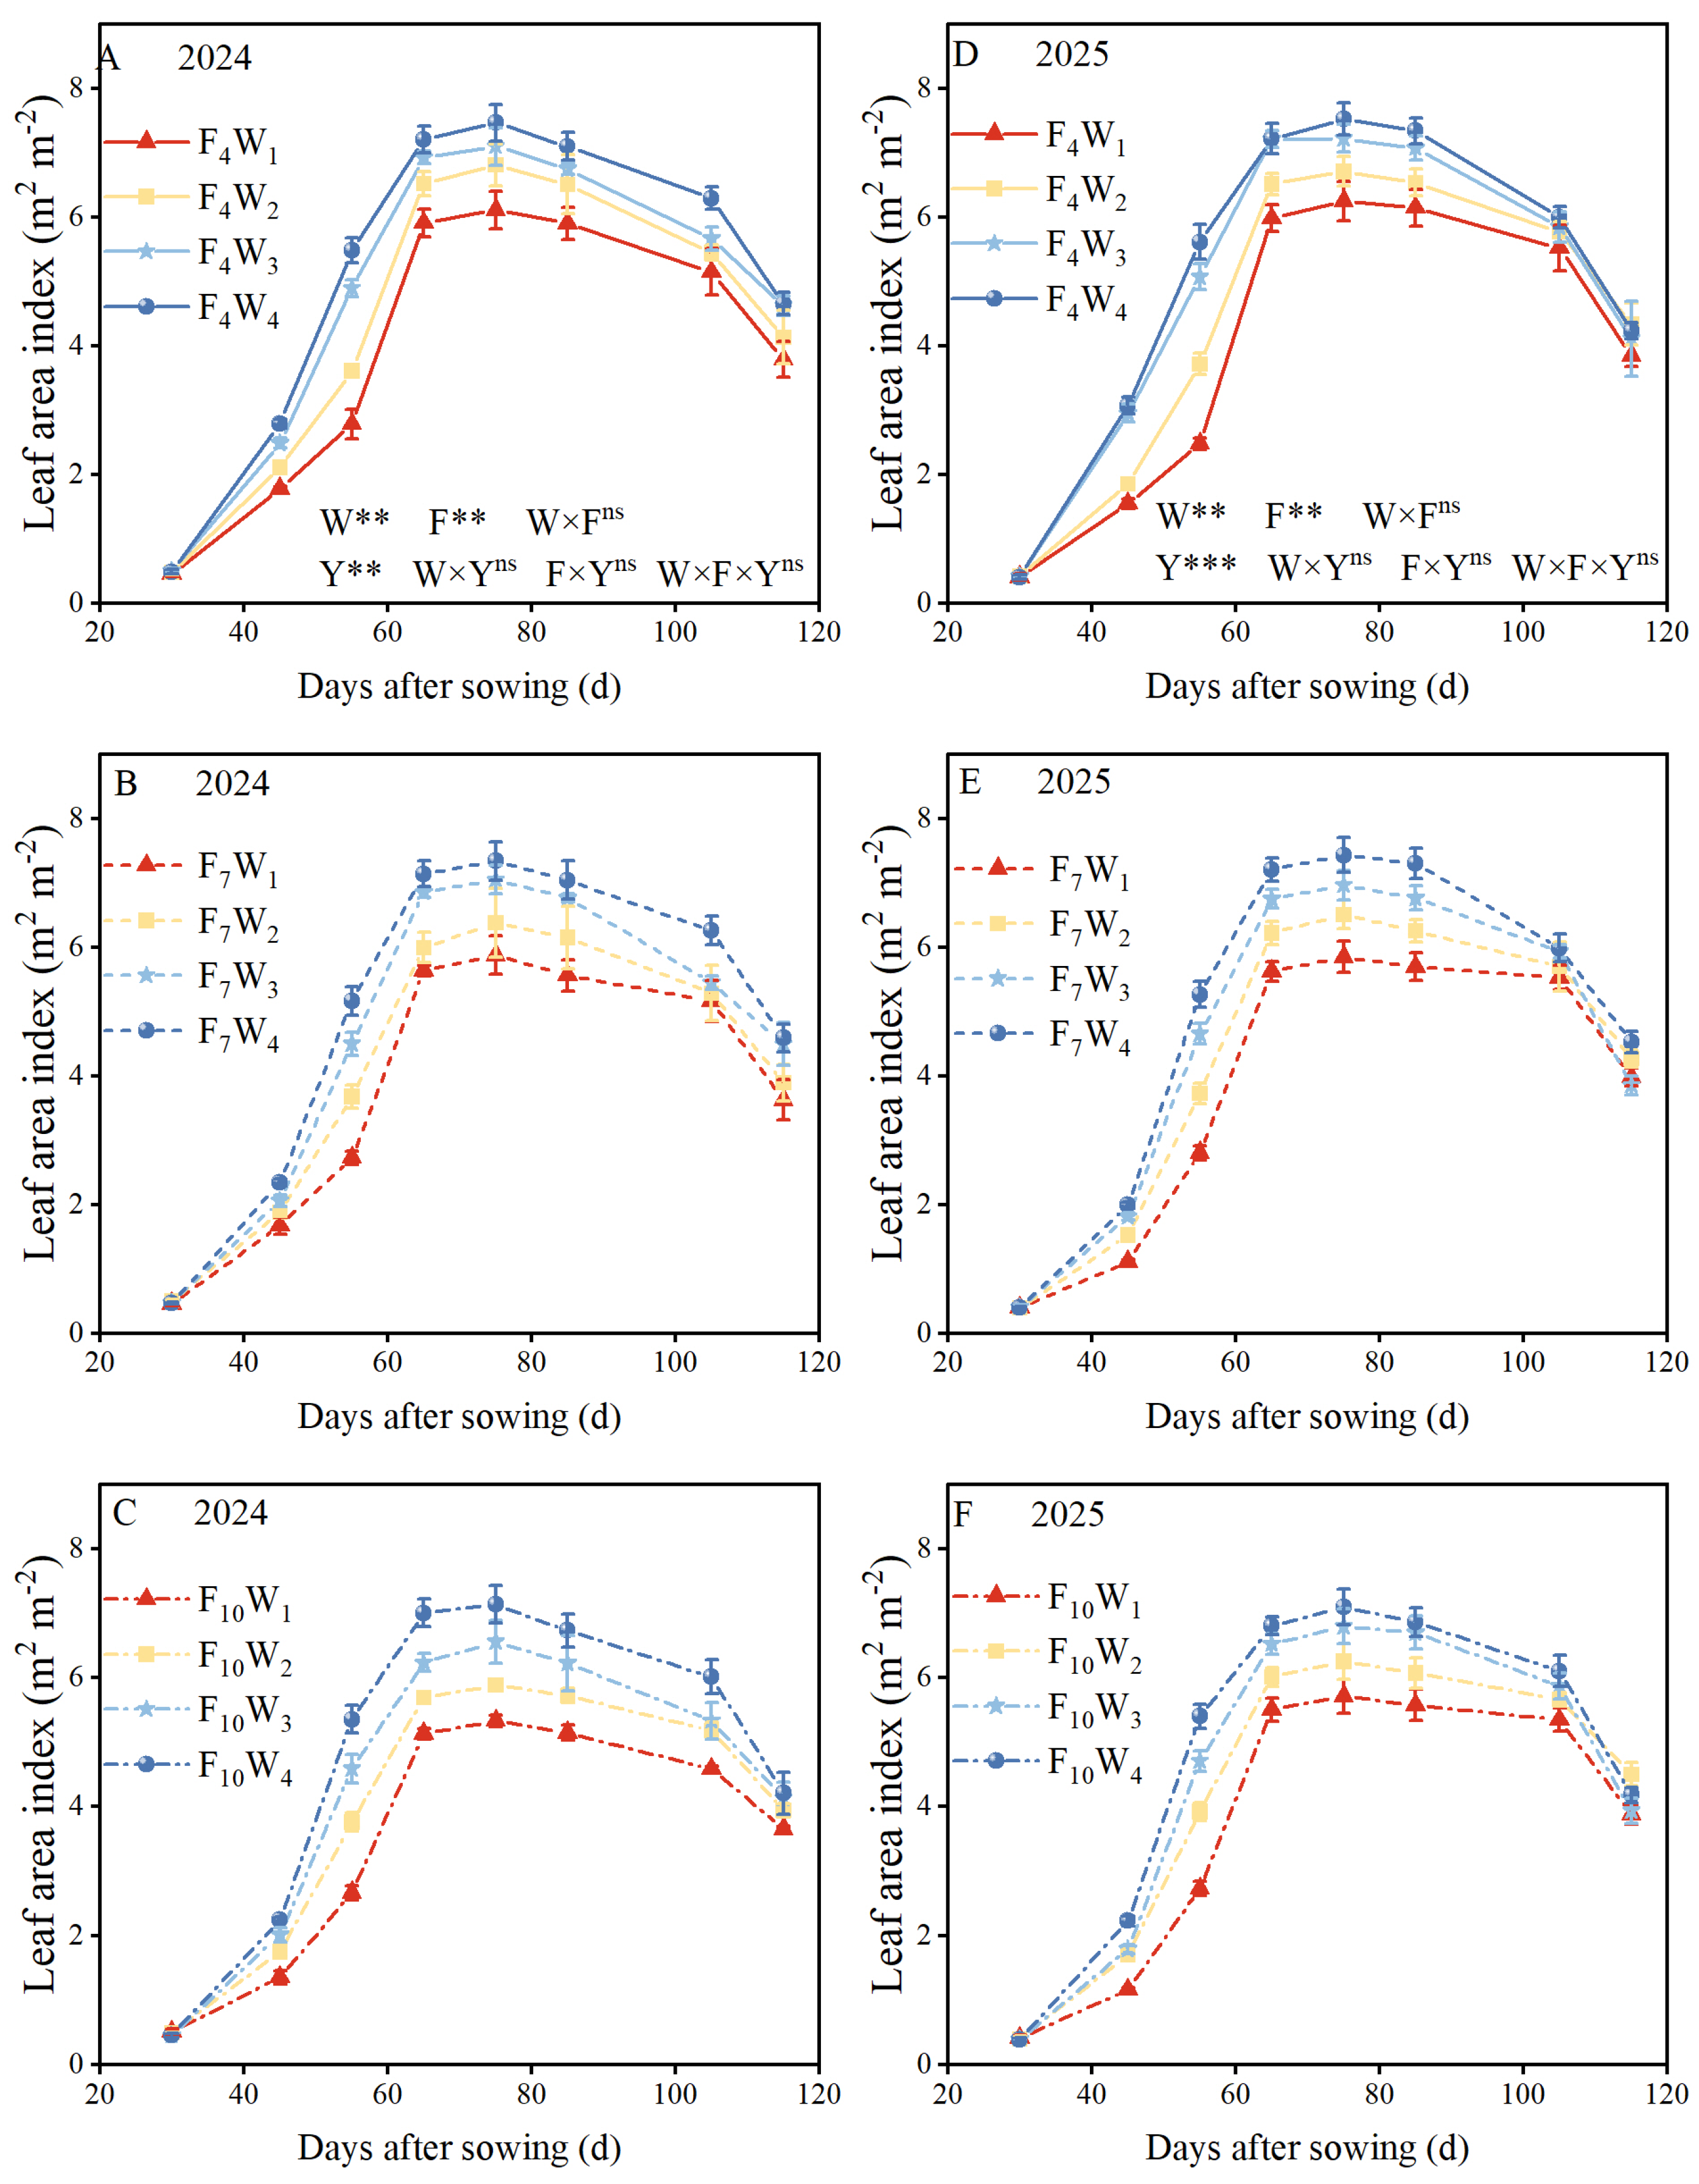
Across both growing seasons, the leaf area index (LAI) of spring maize followed a unimodal curve, peaking at the tasseling stage (~70 days post-emergence) before declining (Figure 3). Two-way ANOVA indicated that both irrigation amount (W) and frequency (F) significantly influenced LAI (p < 0.05; Figure 3). Under the same frequency, increasing water input (W2, W3, and W4 vs. W1) expanded tasseling-stage LAI by 9.5–10.2%, 19.6–19.7%, and 24.1–26.8% across both years, respectively. However, the promotional response of LAI to irrigation frequency was strongly modulated by total water input: shifting from F10 to F7 and F4 increased LAI by 3.8–7.2% and 8.5–10.8%, respectively, with these gains being most pronounced under water-deficit conditions and progressively diminishing under higher irrigation regimes (W3 and W4).

3.1.2. Leaf SPAD Value

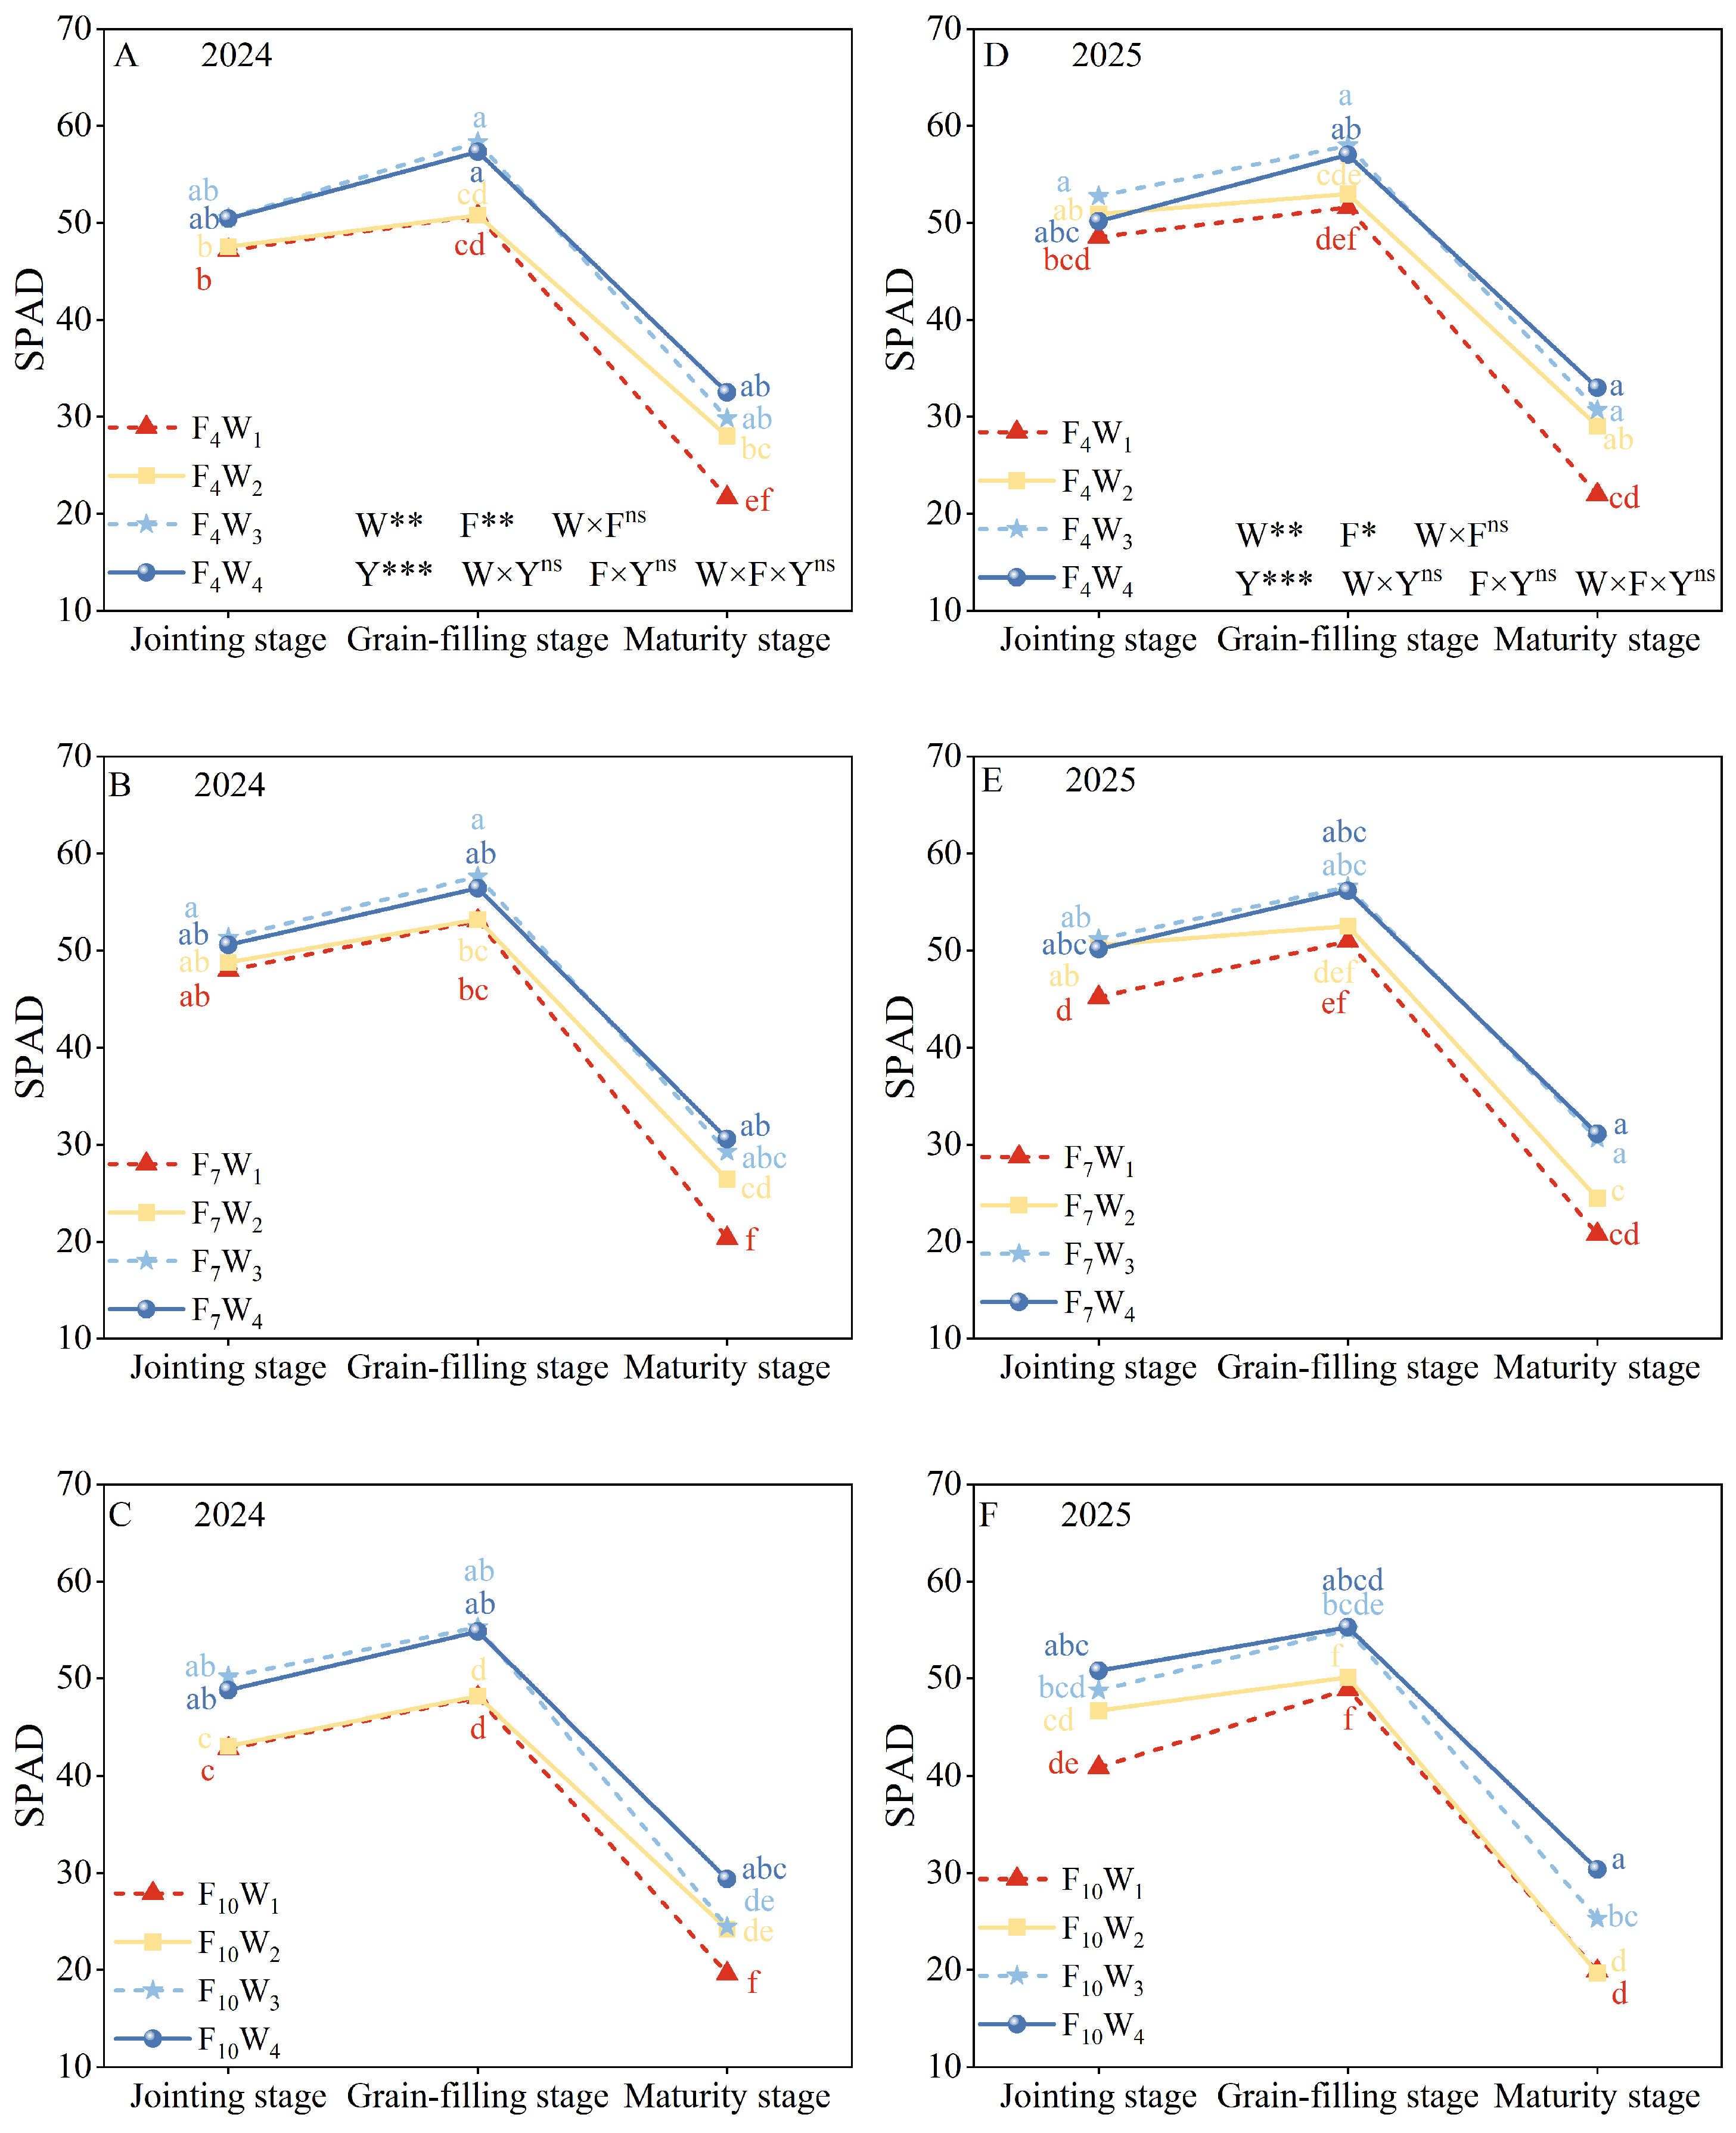
Both drip irrigation amount (W) and frequency (F) significantly affected the leaf SPAD value of spring maize across all growth stages (p < 0.05; Figure 4). Across all treatments, SPAD values exhibited a unimodal dynamic, peaking at the grain-filling stage before declining toward maturity. Based on two-year averages under a given frequency, increasing water input gradually enhanced SPAD values, with the largest relative gains observed at maturity: compared with W1, SPAD values under W2, W3, and W4 increased by 5.6–11.8% during earlier stages (jointing and grain-filling) and by 22.2%, 36.9%, and 50.4% at maturity, respectively. Similarly, under the same irrigation amount, higher irrigation frequencies (F4 and F7) enhanced SPAD values relative to F10 across the jointing (6.4–7.0%), grain-filling (5.1%), and maturity stages (10.8–17.6%). Notably, the W × F interaction was particularly pronounced during late senescence (maturity stage), where high frequency combined with adequate water supply (e.g., F4W3/F4W4) substantially delayed leaf chlorophyll degradation.

3.2. Gas Exchange Parameters

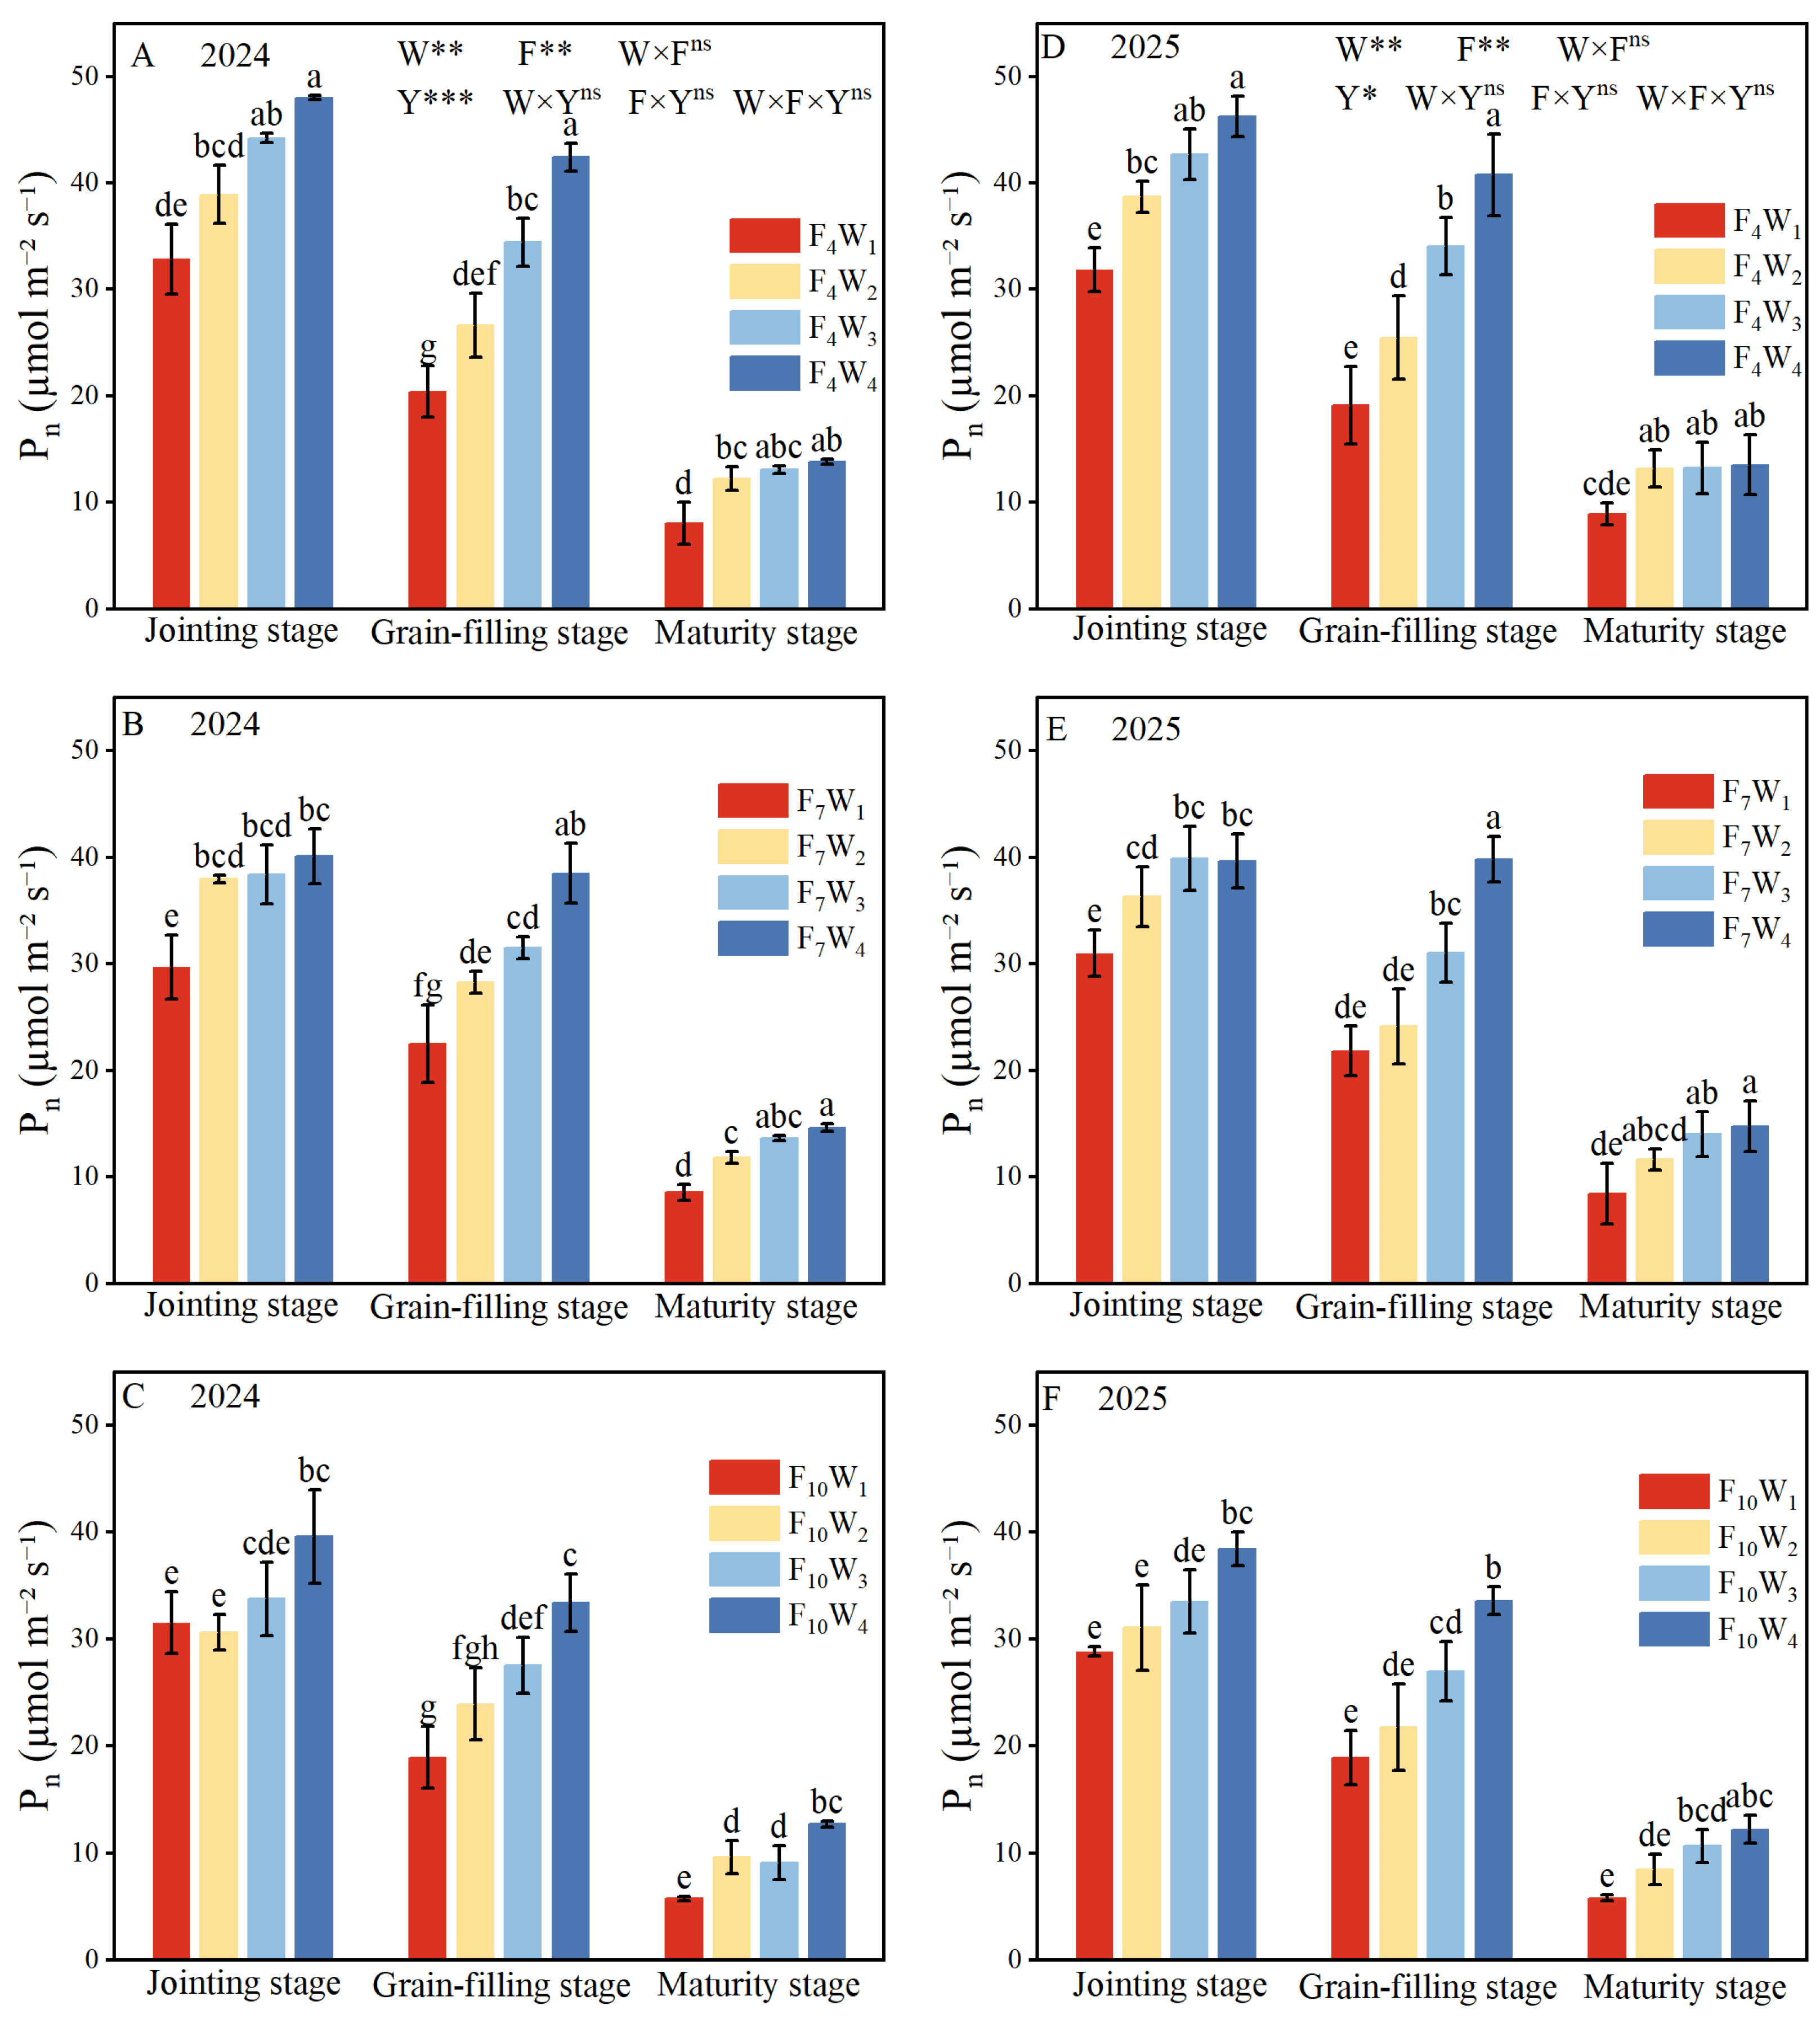
Both drip irrigation amount (W) and frequency (F) significantly affected leaf gas exchange parameters (Pn, Tr and Gsw) across all growth stages (p < 0.05; Figure 5 and Figures S4 and S5). Pn, Tr and Gsw exhibited a progressive decline from jointing to maturity. Across both years, under a given irrigation frequency, increasing water input markedly enhanced gas exchange, particularly during the critical grain-filling stage: compared with W1, drip irrigation amounts W2, W3, and W4 increased Pn by 19.3–27.4%, 51.1–53.9%, and 84.7–90.8%; Tr by 4.8–40.8%, 53.0–67.0%, and 68.4–82.8%; and Gsw by 25.4–27.3%, 51.3–54.9%, and 67.5–67.9%, respectively. Under the same irrigation amount, higher irrigation frequencies (F4 and F7) also promoted leaf gas exchange relative to F10 during grain filling, increasing Pn by 17.9–19.3% (F4) and 15.4–16.4% (F7), Tr by 36.5–36.8% (F4) and 22.4–27.8% (F7), and Gsw by 21.6–28.5% (F4) and 19.3–24.9% (F7). Notably, high irrigation frequency effectively mitigated stomatal limitations (Gsw) and sustained carbon assimilation (Pn) under deficit irrigation regimes, whereas its beneficial physiological impact diminished under full irrigation.

3.3. Chlorophyll Fluorescence Parameters

Both drip irrigation amount and irrigation frequency significantly affected the Fv/Fm, ΦPSII and qP of maize (p < 0.05; Table 1). Chlorophyll fluorescence parameters exhibited a trend of first increasing and then decreasing from the jointing stage to the grain-filling stage and then to the maturity stage. Under the same irrigation frequency, the Fv/Fm, ΦPSII and qP at the jointing, grain-filling, and maturity stages all initially increased with increasing drip irrigation amount and then stabilized, with no significant difference between W3 and W4. Compared with W1, in 2024, at the grain-filling stage, Fv/Fm increased on average by 4.6%, 8.9%, and 11.3%; ΦPSII increased by 16.3%, 51.7%, and 54.4%; and qP increased by 27.3%, 59.8%, and 62.5%, respectively. In 2025, Fv/Fm increased by 3.3%, 7.34%, and 9.5%; ΦPSII increased by 21.1%, 46.1%, and 47.2%; and qP increased by 10.4%, 43.43%, and 46.5%, respectively. Under the same drip irrigation amount, the Fv/Fm, ΦPSII, and qP at the jointing, grain-filling, and maturity stages all increased with increasing irrigation frequency. Compared with F10, in 2024, at the grain-filling stage, Fv/Fm increased on average by 3.8% and 2.7%; ΦPSII increased by 7.4% and 5.4%; and qP increased by 4.2% and 2.6%, respectively. In 2025, Fv/Fm increased by 2.7% and 2.1%; ΦPSII increased by 10.6% and 7.6%; and qP increased by 7.7% and 5.4%, respectively.

3.4. Aboveground Dry Matter Accumulation

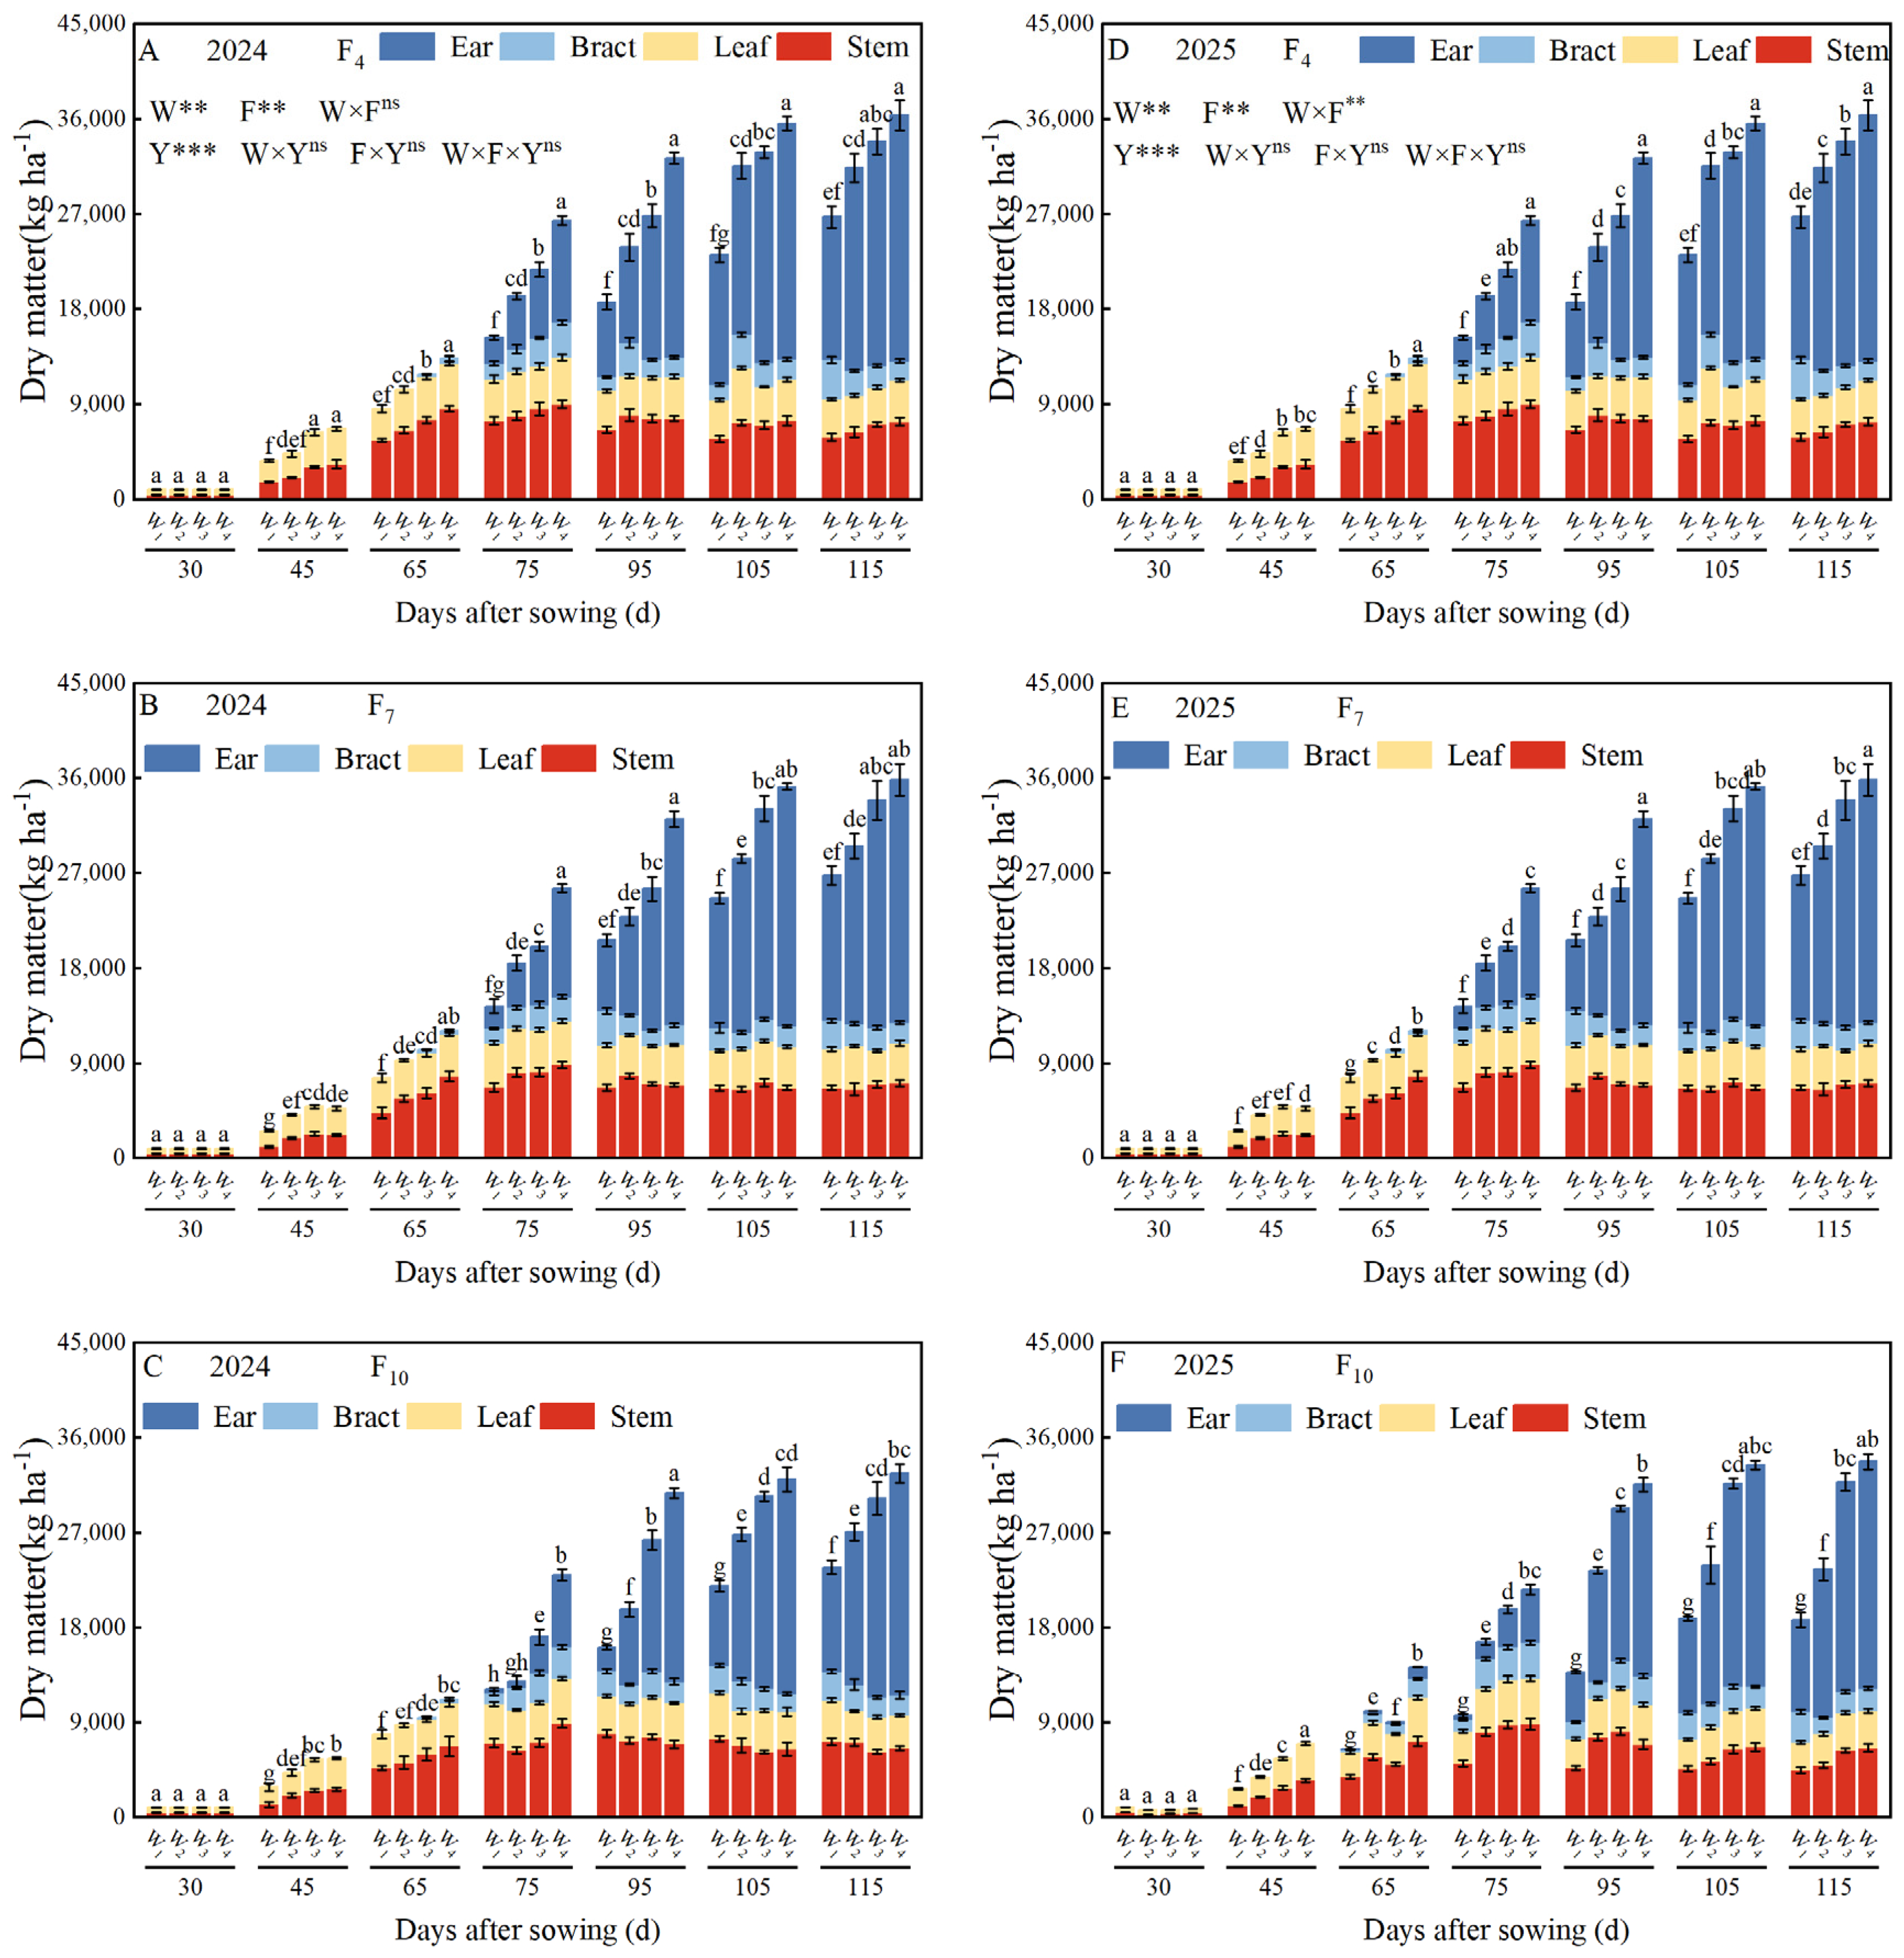
Both drip irrigation amount and irrigation frequency significantly affected the aboveground dry matter accumulation of maize (p < 0.05; Figure 6). Overall, the total aboveground dry matter of maize in 2024 and 2025 showed consistent trends under different drip irrigation amounts and frequencies, with the maximum value achieved under the F4W4 treatment in both years. Under the same irrigation frequency, total aboveground dry matter increased with increasing drip irrigation amount. Compared with W1, drip irrigation amounts W2, W3, and W4 increased by 14.0%, 26.9%, and 35.8% in 2024, and by 16.7%, 40.1%, and 52.4% in 2025, respectively. Under the same drip irrigation amount, the total aboveground dry matter of spring maize at maturity increased with increasing irrigation frequency; however, raising the irrigation amount reduced the differences caused by irrigation frequency. Compared with F10, in 2024, under the W1 treatment, F4 and F7 increased by 12.7% and 12.8%, respectively; under W2, they increased by 15.8% and 9.1%; under W3, by 11.9% and 12.1%; and under W4, by 11.4% and 9.91%, respectively. In 2025, under W1, F4 and F7 increased by 38.2% and 29.9%; under W2, by 27.5% and 15.3%; under W3, by 3.7% and 0.5%; and under W4, by 6.7% and 5.6%, respectively.

3.5. Grain Yield, Water Consumption and Water Productivity

3.5.1. Grain Yield

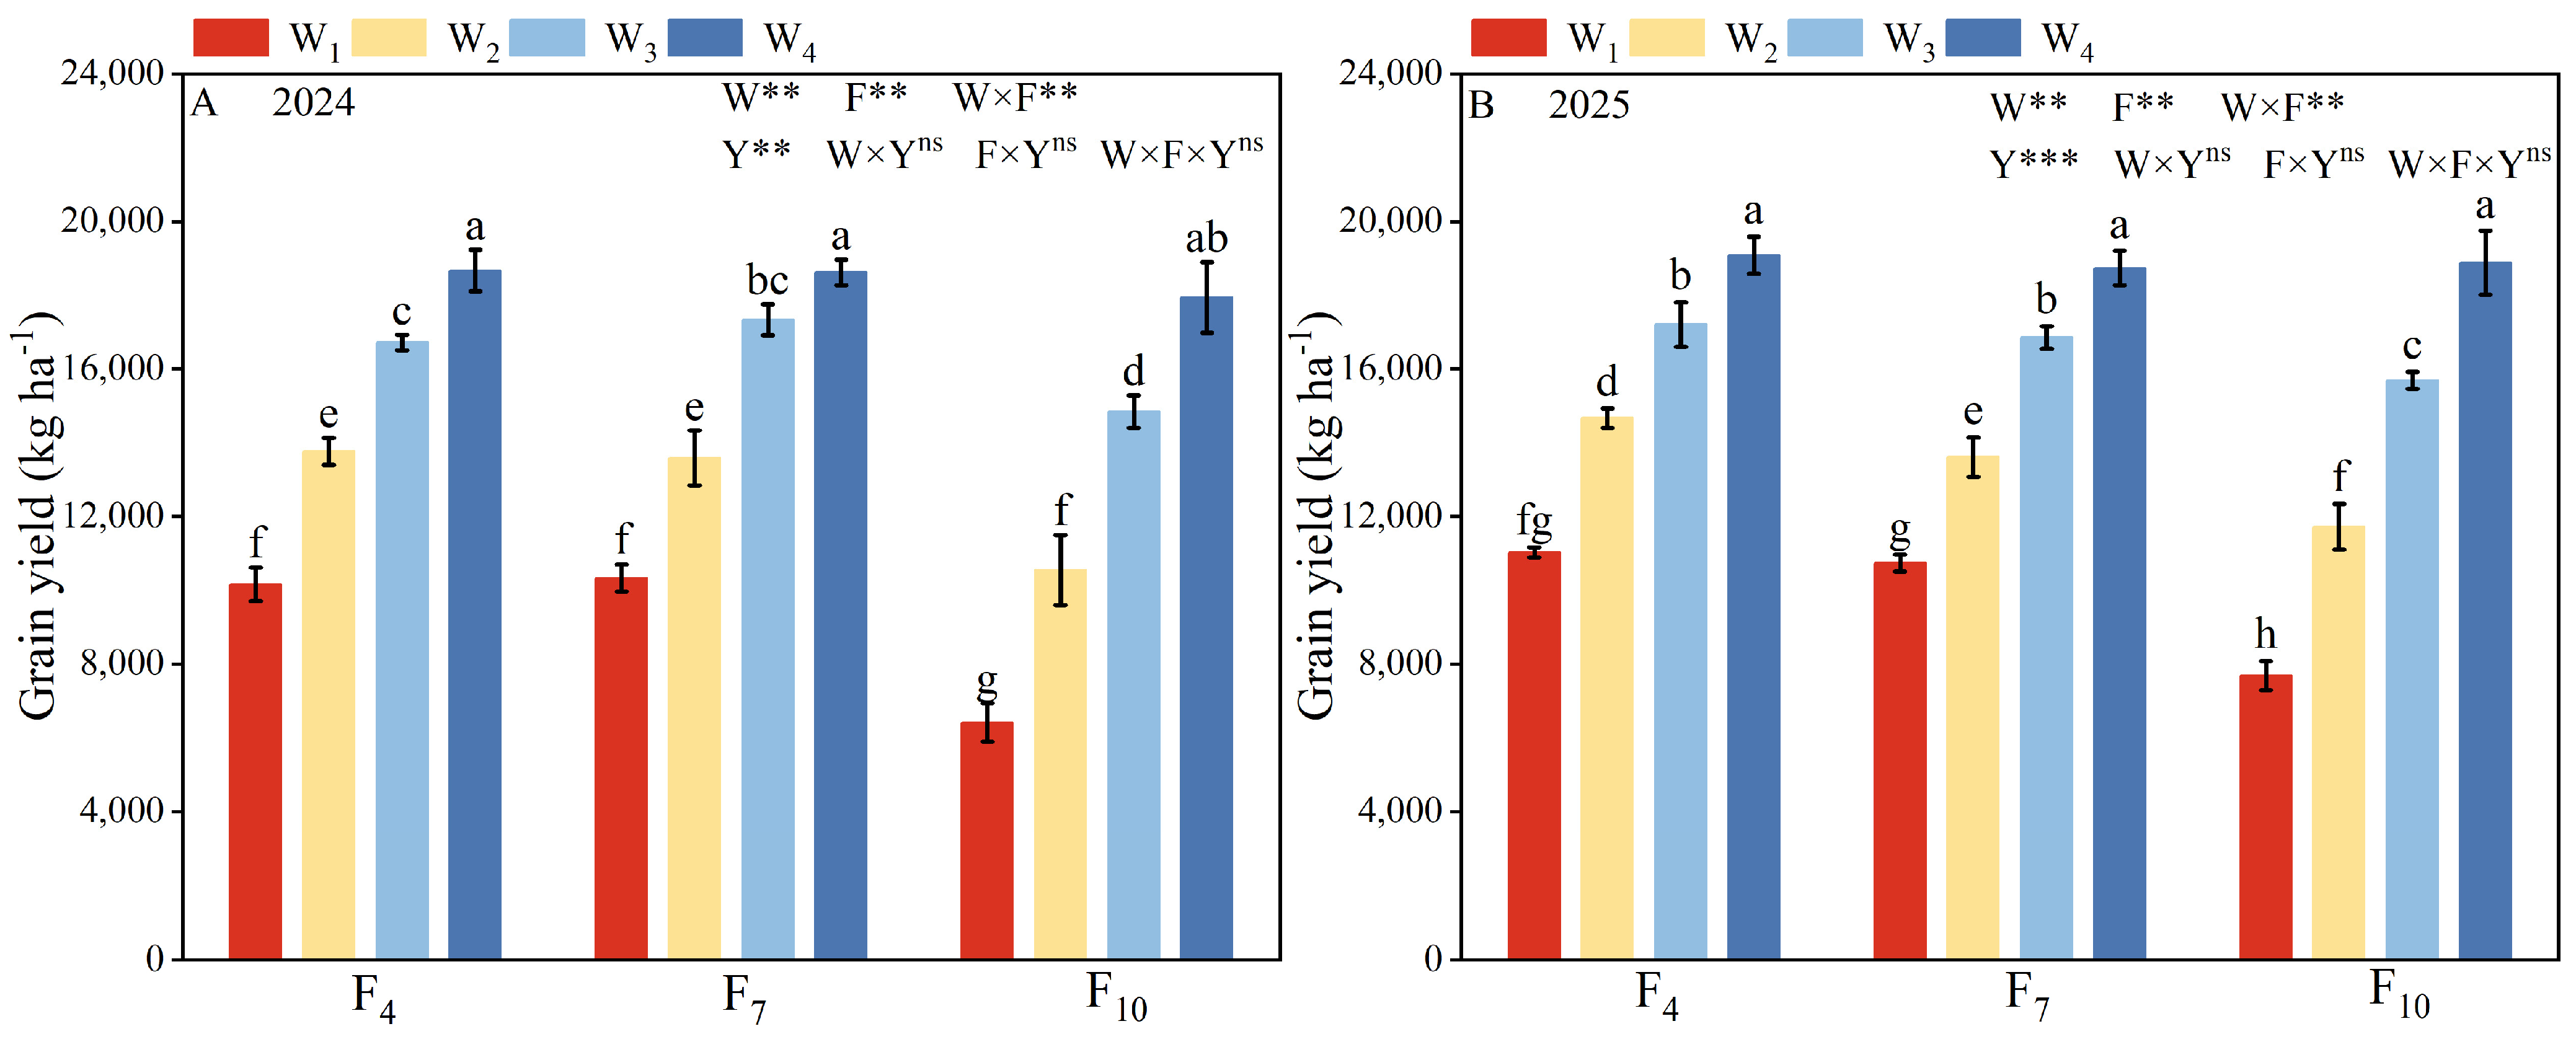
Both drip irrigation amount and irrigation frequency significantly affected the grain yield of maize (p < 0.05; Figure 7). Under the same irrigation frequency, grain yield increased with increasing irrigation amount. Compared with W1, grain yield under W2, W3, and W4 increased by 40.9%, 81.8%, and 105.3% in 2024, and by 35.8%, 68.9%, and 92.6% in 2025, respectively. Under deficit to moderate irrigation levels (W1–W3), there was no significant difference in grain yield between the F4 and F7 treatments, but both produced significantly higher yields than F10. Across W1–W3, grain yield under F4 and F7 increased by an average of 19.2% and 20.4% in 2024, and 14.9% and 11.1% in 2025 compared to F10, respectively. However, under full irrigation (W4), no significant differences in grain yield were observed among F4, F7, and F10. In 2024, the maximum grain yield was achieved under the F7W4 treatment, followed by F4W4 and F10W4. In 2025, the highest average grain yield was obtained under the F4W4 treatment, followed by F7W4 and F10W4.

3.5.2. Water Consumption and Water Productivity

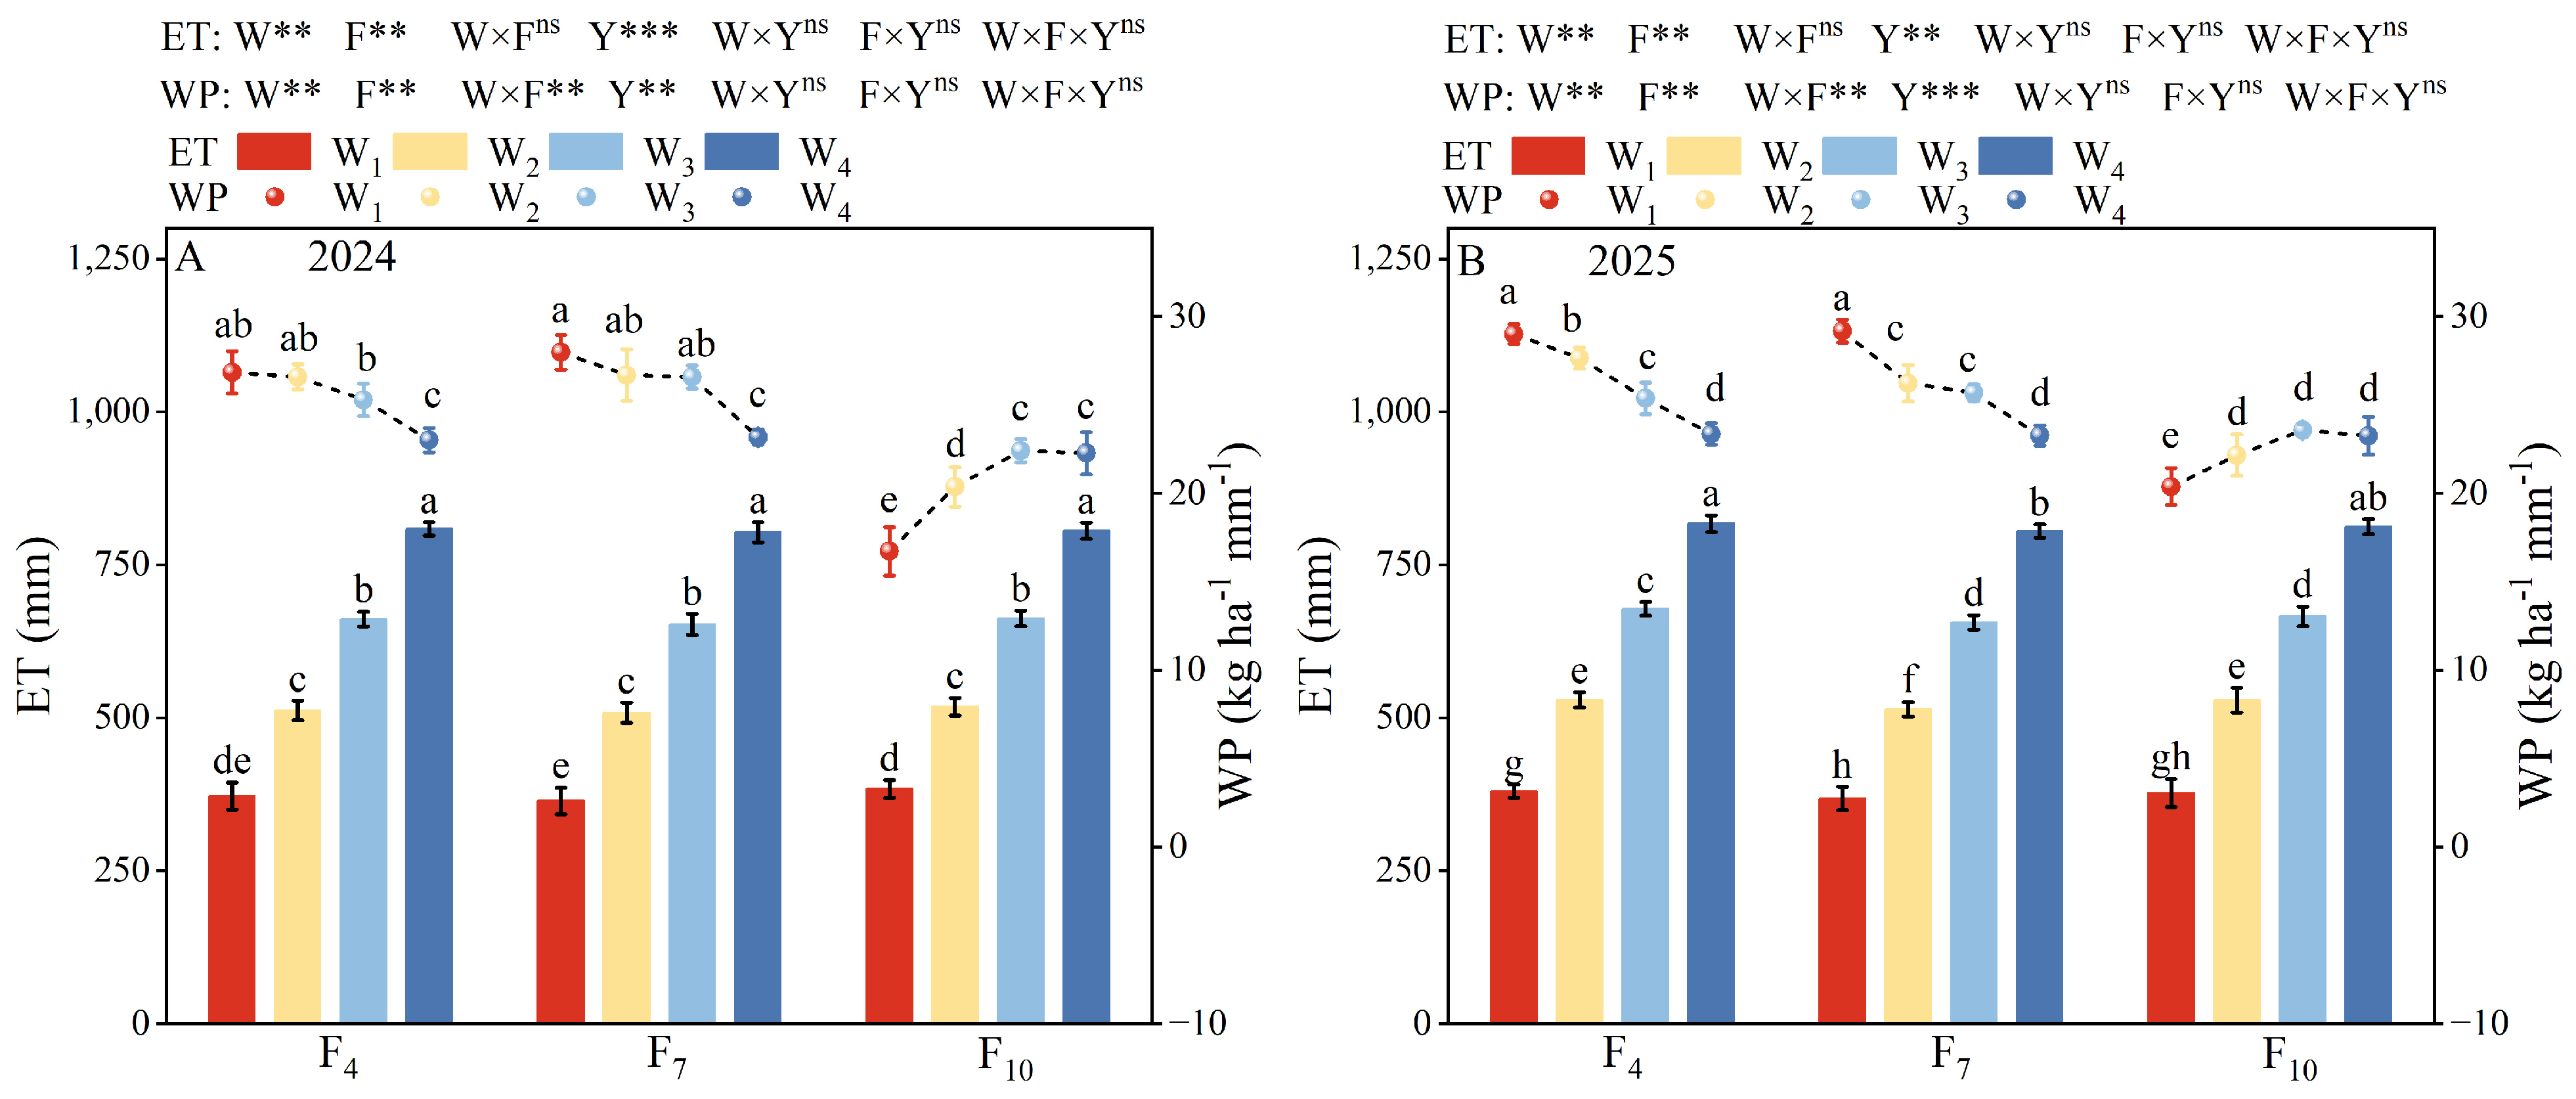
Pre- and post-irrigation soil water profile monitoring confirmed that moisture dynamics were predominantly confined to the 0–80 cm root layer, with the deep 100–120 cm soil water content remaining unchanged before and after irrigation (Figures S2 and S3). Both drip irrigation amount and irrigation frequency significantly affected the water consumption (ET) and water productivity (WP) of maize (p < 0.05; Figure 8). Under the same drip irrigation amount, the ET under W1 and W2 first decreased and then increased with increasing irrigation frequency, while under W3 and W4 it increased with increasing irrigation frequency. Under the same irrigation frequency treatment, ET increased with increasing irrigation amount. On average, compared with the W1 treatment, the ET under the W2, W3, and W4 treatments increased by 37.3%, 76.5%, and 115.9% in 2024, and by 39.7%, 77.7%, and 116.3% in 2025, respectively.
Under the same drip irrigation amount, WP generally followed the order “F4 ≈ F7 > F10”. Compared with F10, the WP under F4 and F7 increased by 24.4% and 24.7% in 2024, and by 17.9% and 16.8% in 2025, respectively. Under the same irrigation frequency, the WP under F4 and F7 decreased with increasing drip irrigation amount, while the WP under F10 first increased and then decreased with increasing drip irrigation amount. For F4, compared with W1, the WP under W2, W3, and W4 decreased by 0.9%, 5.8%, and 14.3% in 2024, and by 4.7%, 12.5%, and 19.5% in 2025, respectively. For F10, compared with W1, the WP under W2, W3, and W4 increased by 13.6%, 21.2%, and 20.7% in 2024, and by 6.1%, 11.0%, and 9.9% in 2025, respectively.
Comparing the measured E T app with the theoretical crop water requirement ( E T c 628.58   mm in 2024 and 582.45   mm in 2025; Section 2.3.2), the seasonal water consumption under W 3 showed the highest congruence with crop atmospheric demand. In contrast, W 1 and W 2 suffered from severe deficit stress, while W 4 ( E T app > 800   mm ) resulted in luxury water consumption and secondary percolation losses, which explains the pronounced reduction in W P under excessive irrigation.

3.6. Nutrient Use Efficiency

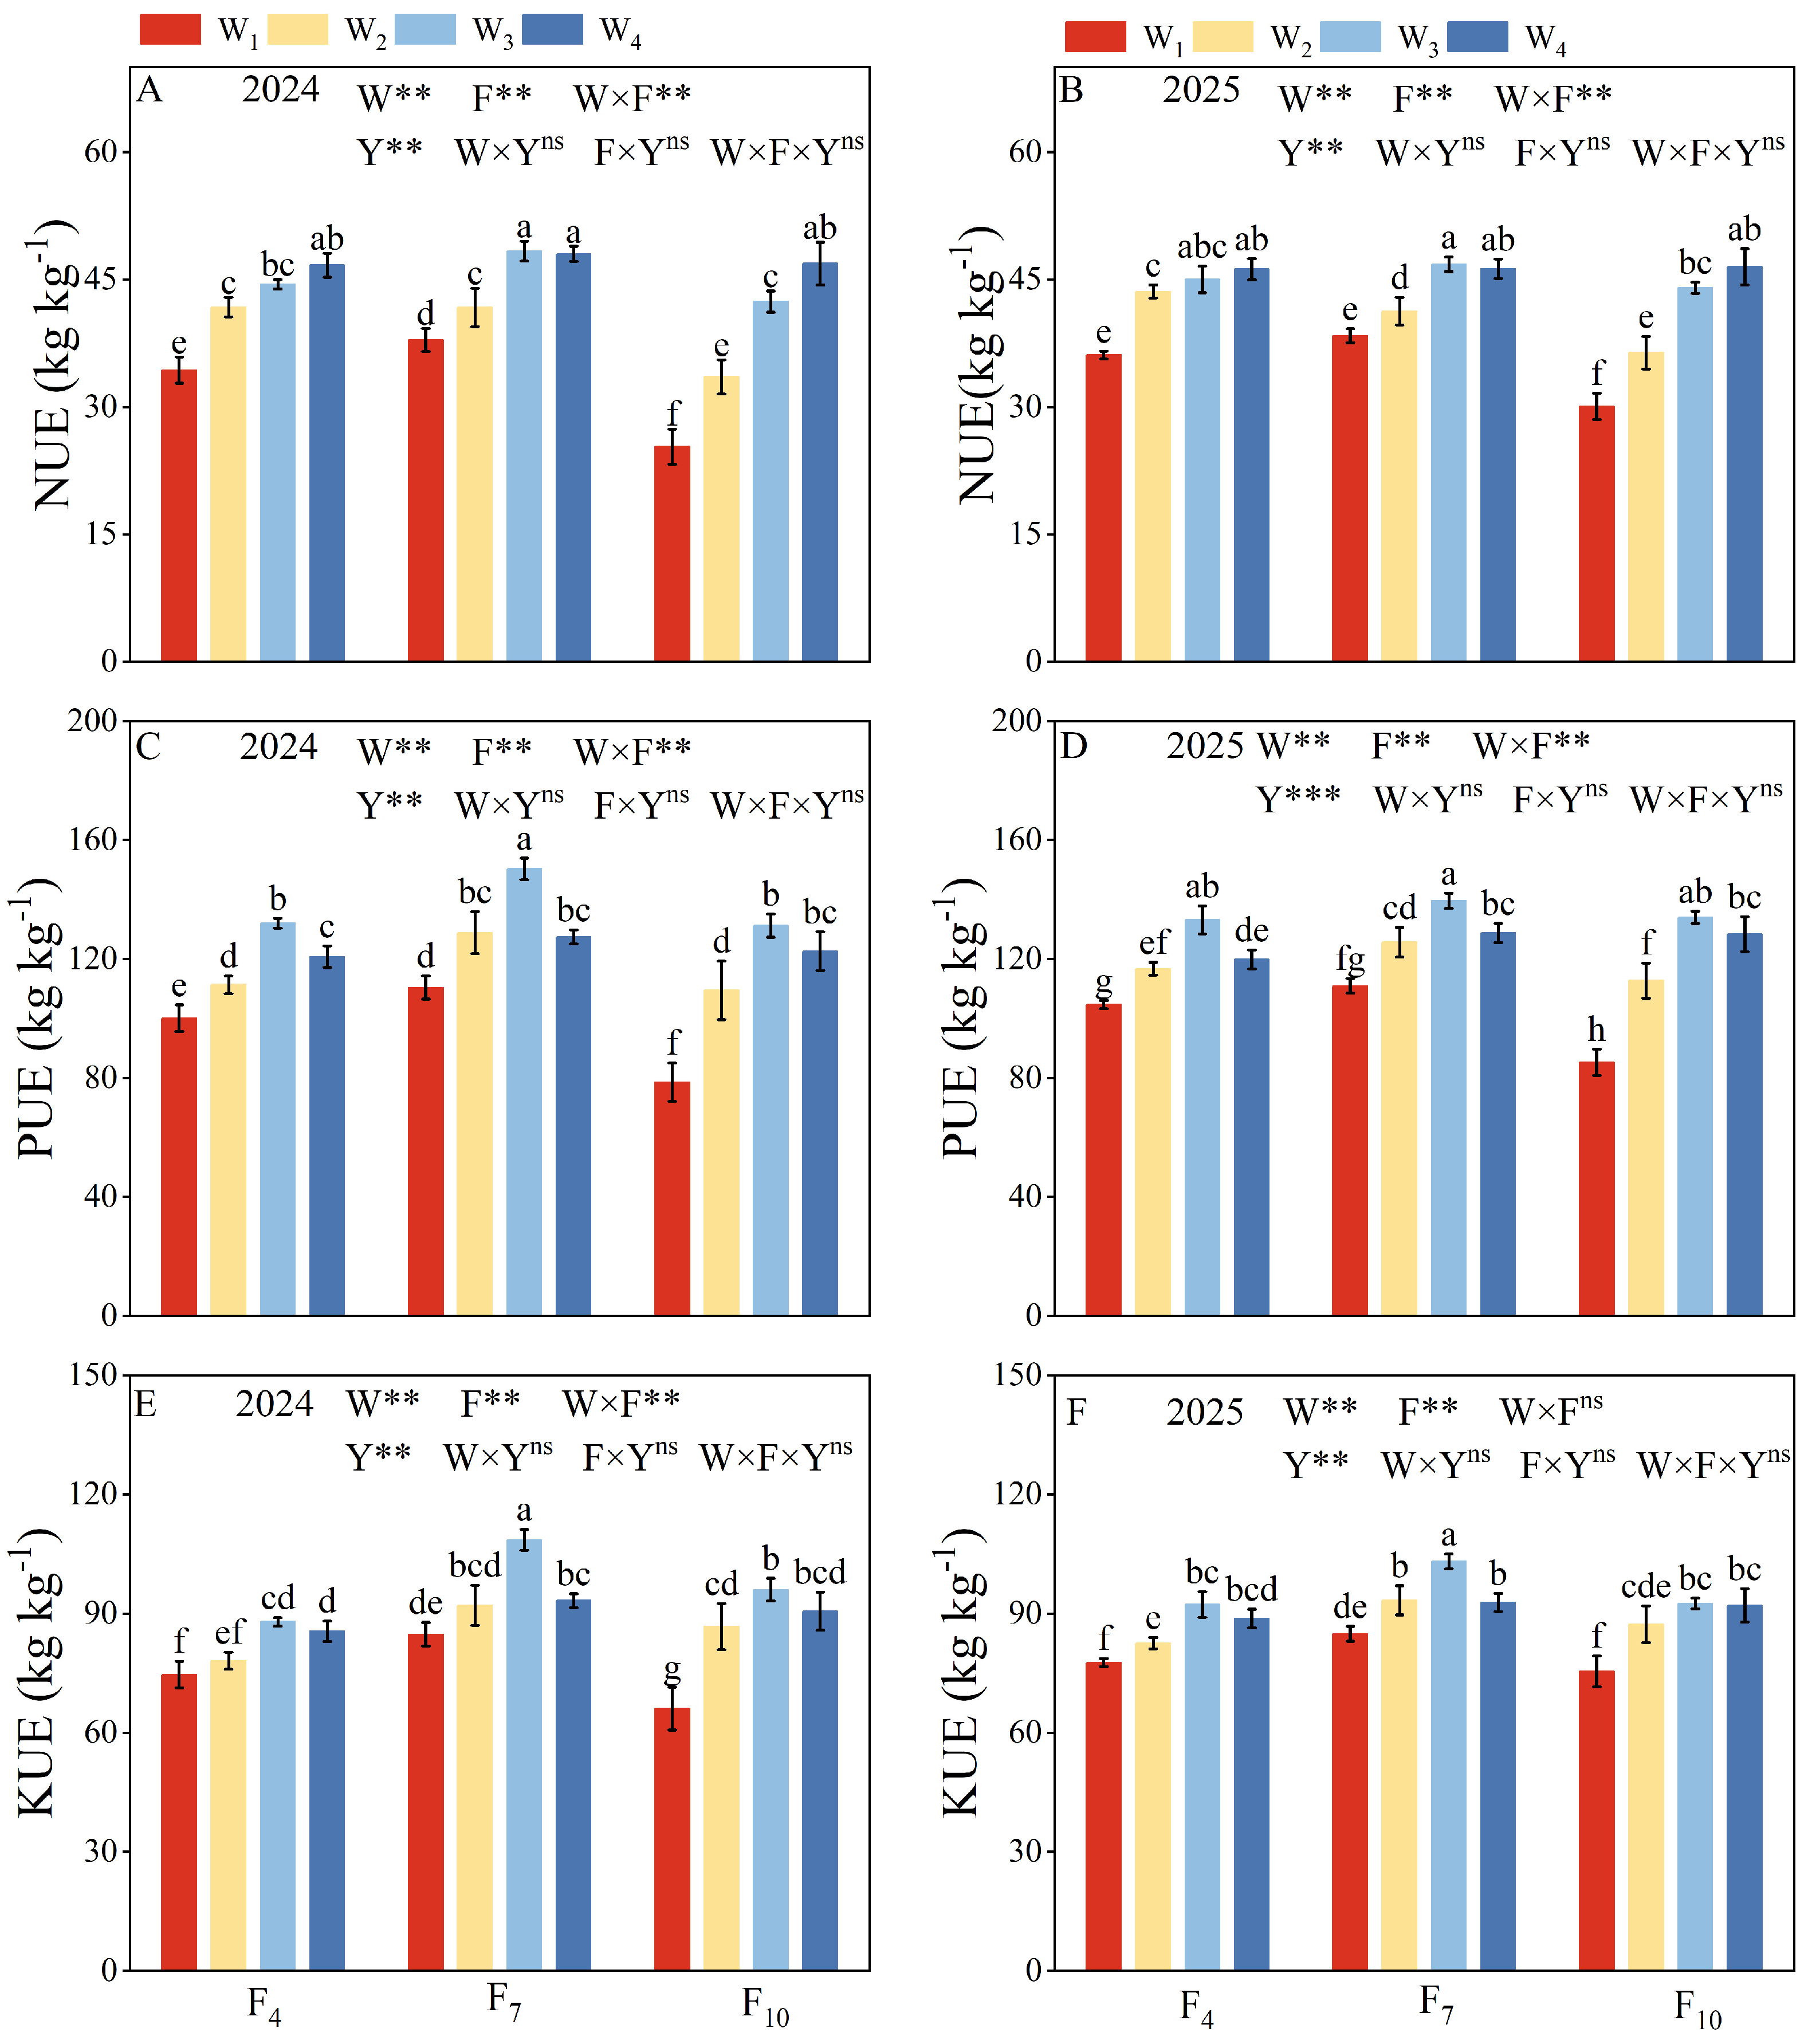
Both drip irrigation amount (W) and frequency (F) significantly influenced nitrogen, phosphorus, and potassium use efficiencies (NUE, PUE, and KUE) of spring maize, exhibiting a significant interactive effect between the two factors (W × F, p < 0.05; Figure 9). Overall, across all frequency levels, NUE, PUE, and KUE followed a parabolic (unimodal) response to increasing water input, peaking under moderate irrigation (W3) before declining under the highest water supply (W4). Across both years, under a given irrigation frequency, increasing irrigation volume from W1 to W2, W3, and W4 increased NUE by 25.6–32.2%, 40.8–43.1%, and 42.2–45.3%; PUE by 21.9–24.0%, 32.6–38.9%, and 25.8–36.3%; and KUE by 15.4–23.6%, 24.2–51.5%, and 27.1–55.2%, respectively. Similarly, under a given irrigation amount, nutrient use efficiencies initially increased and then decreased with higher irrigation frequencies, with the 7-day interval (F7) consistently outperforming both low-frequency (F10) and high-frequency (F4) regimes. Compared with F10, F4 and F7 increased NUE by 8.3–17.6% and 15.1–26.2%; PUE by 8.5–10.8% and 18.9–27.2%; and KUE by 6.7–16.9% and 16.6–27.9%, respectively. Notably, the W × F interaction demonstrated that moderate irrigation combined with an intermediate frequency (F7W3) achieved the highest synergistic resource use efficiencies, whereas excessive irrigation (W4) attenuated these gains due to diminishing marginal returns.

3.7. Comprehensive Analysis Based on the EWM-TOPSIS Model

Based on the weights assigned by the entropy weight method (EWM), a weighted normalized matrix was constructed (Tables S1 and S2). The TOPSIS model was then employed to calculate the relative closeness of each treatment to the ideal solution, and the comprehensive benefit ranking was subsequently derived (Table 2). The F7W3 treatment (irrigation frequency of 7 days, irrigation amount of 650 mm) exhibited the highest relative closeness in both 2024 and 2025 (92.7% and 79.5%, respectively), consistently ranking first. This indicates that this treatment minimizes redundant consumption of water and nutrients while ensuring crop yield, achieving a perfect balance of multiple objectives. Overall, adopting an irrigation frequency of 7 days combined with a seasonal drip irrigation amount of 650 mm (F7W3) enables the optimal spatiotemporal match between water and fertilizer supply and crop demand for spring maize in arid regions, and is therefore recommended as the optimal irrigation regime under the conditions of this experiment.

4. Discussion

4.1. Driving Mechanism of Drip Irrigation Amount and Frequency Regulation on Photosynthetic Physiology and Dry Matter Accumulation of Spring Maize in Arid Regions

Canopy photosynthetic performance serves as the core driver of biomass accumulation, and its extreme sensitivity to root-zone water availability ultimately determines overall crop vigor and yield potential [10,11]. Our results demonstrated that severe water deficit (W1) or prolonged irrigation intervals (F10) significantly inhibited leaf gas exchange parameters (Pn, Tr, and Gsw) and PSII photochemical efficiency (Fv/Fm, ΦPSII and qP). This physiological impairment was primarily driven by intermittent drought stress. Under water-limited conditions, crops rapidly close their stomata to maintain turgor pressure and minimize transpiration loss; however, this adaptive mechanism subsequently impedes CO2 diffusion into the intercellular spaces, leading to severe stomatal limitation of photosynthesis [12,13,14]. Specifically, the extreme deficit regime (F10W1) combined prolonged soil drying with high atmospheric evaporative demand (Tmean = 20–30 °C, RH = 40–70%), inducing visible mid-day leaf rolling and premature canopy senescence. This severe coupled drought triggered not only acute stomatal closure but also non-stomatal impairment of PSII reaction centers, explaining the drastic drop in photoassimilate accumulation.
Chlorophyll fluorescence parameters serve as intrinsic indicators of PSII sensitivity to environmental stress. The findings revealed that Fv/Fm, ΦPSII and qP remained at low levels under W1 and F10 treatments. These deficits damage the thylakoid membrane structure of mesophyll cells, thereby reducing light-harvesting and electron transport efficiency [15,16,17]. Conversely, increasing irrigation volume and frequency (e.g., F4W4) alleviated stress and effectively promoted leaf cell expansion. Specifically, the F4 and F7 treatments significantly enhanced photosynthesis and PSII photochemical efficiency, maintaining a high leaf area index (LAI), SPAD values, and robust PSII activity. This provided a sufficient carbon source for photoassimilate synthesis, ultimately leading to a significant increase in aboveground dry matter accumulation at maturity [45,46,47]. However, the promotional effect of increased irrigation frequency on dry matter accumulation diminished when the irrigation volume reached W4. This indicates that under ample or excessive water supply, moisture is no longer the primary limiting factor for growth; instead, a plausible explanation is that excessive water might temporarily impair root respiration and metabolic activity due to reduced soil aeration, although soil oxygen status and root respiration were not directly measured in this study [18,19,20].

4.2. Synergistic Regulation Mechanism of Drip Irrigation Volume and Frequency on Yield and Water-Fertilizer Use Efficiency

A core challenge in modern arid agriculture is maximizing the synergistic efficiency of water and fertilizer while ensuring grain yield [27,48]. Our results quantitatively demonstrate an inevitable trade-off: although the maximum irrigation volume (W4) produced the highest yield, its water productivity (WP) declined significantly under F4 and F7 frequencies. This decline stems from an exponential increase in crop water consumption that outpaced the marginal growth in yield, leading to luxury water consumption [21,49,50]. Similarly, nutrient use efficiencies (NUE, PUE, and KUE) followed a parabolic trend, ultimately exhibiting a sharp decline under excessive water input. This corroborates the view that pursuing absolute maximum yield often comes at the expense of resource efficiency and increased environmental costs [39,51]. The intrinsic mechanism of this yield–efficiency trade-off is highly dependent on the spatiotemporal synchronization between root-zone water dynamics and nutrient transport characteristics [23,29]. In fertigation systems, water movement is the primary driver governing nutrient spatial distribution. In light sandy loam soils with low water-holding capacity (gravimetric field capacity of 15.33% in the 0–60 cm layer; Section 2.1), the single-event irrigation quota fundamentally dictates downward hydrological and solute fluxes. Under moderate irrigation regimes (such as F7W3), single applications maintained soil moisture within the 0–80 cm root zone without exceeding field capacity, effectively preventing deep percolation (D ≈ 0) and closely matching theoretical crop water demand (ETc ≈ 582–628 mm). In contrast, under the highest irrigation quota (W4) and low-frequency large-volume events (F10W4, ~90 mm/event), post-irrigation soil moisture in the 0–40 cm layer reached 20–25%, significantly surpassing field capacity (Figures S2 and S3). Under gravity, this excess perched water inevitably redistributes downward beyond the active 0–100 cm root zone during the days following irrigation, creating an estimated single-event percolation deficit of ~10.2 mm (~12.5% of the applied quota). This deep percolation loss not only increases apparent water consumption and reduces WP, but also provides direct hydraulic evidence for the downward displacement of highly mobile nitrate (NO3-N) below the primary root layer (60 cm). This uncouples nitrate availability from root uptake and directly accounts for the pronounced decline in nitrogen, phosphorus, and potassium use efficiencies (NUE, PUE, KUE) observed under excessive irrigation inputs [6,25]. Conversely, available phosphorus (AP) and potassium (AK) exhibit lower mobility in soil. Insufficient single-irrigation volumes can lead to the localized accumulation of these nutrients in the topsoil directly beneath the dripper, causing a spatiotemporal mismatch between water and fertilizer availability [27].
Irrigation frequency and appropriate water volume play a pivotal role in mediating this contradiction. Compared to low-frequency irrigation, short-interval drip irrigation treatments (F4 and F7) distribute limited water more uniformly throughout the growth period by maintaining a smaller single-irrigation quota. Specifically, as a proposed mechanism, a moderate irrigation combination (e.g., F7W3) is hypothesized to create a favorable wetting front in sandy loam. We speculate that this moisture regime facilitates the local diffusion of P and K toward the root surface by maintaining adequate soil moisture, while optimizing the wetting extent to retain water and mobile nitrate within the primary root zone (0–40 cm). This theoretical spatial alignment provides a plausible mechanism for the observed high congruence between N, P, and K supply and crop uptake patterns [30,31,32]. Physiologically, the superior resource efficiency under F7 relative to F4 stems from a finer balance among soil evaporation, root architecture, and soil aeration. Continuous topsoil wetness under F4 (4-day interval) exacerbates non-beneficial soil evaporation from unmulched wetting zones and could theoretically restrict soil oxygen availability, potentially favoring a shallower root distribution (0–30 cm). Conversely, the 7-day interval (F7) allows the thin topsoil surface to form a dry soil mulch that suppresses direct evaporation while preserving moisture in the 20–60 cm layer for crop transpiration. Moreover, moderate wetting-drying cycles under F7 are hypothesized to enhance soil aeration and potentially stimulate compensatory deeper root proliferation (30–80 cm), which may explain the enhanced water and nutrient capture during the grain-filling stage without exceeding field capacity. Agronomically, while ultra-high-frequency drip irrigation (e.g., 1–2 day intervals or daily micro-irrigation) is theoretically advantageous for coarse soils, it presents notable practical drawbacks under field-scale production in Southern Xinjiang. First, regional water delivery is governed by centralized canal and pump rotational scheduling, where rotational turns across field blocks generally operate on 5- to 10-day cycles, making 1- to 2-day applications logistically difficult and cost-prohibitive. Second, film mulching effectively acts as a vapor barrier, substantially retarding root-zone drying in sandy loam and buffering the crop between 4- and 7-day intervals. Third, persistent ultra-high-frequency watering keeps the surface layer constantly saturated, which can induce superficial root crowding and heighten maize lodging risks during windy summer months. Furthermore, the differences in yield and multi-resource use efficiency between F4 and F7 were not significant. Considering practical field operations, a 7-day frequency not only maintained high grain yield and WP while maximizing multi-element synergistic uptake, but also reduced total seasonal irrigation operations by over 40% compared to F4. From a management perspective, this lower operational frequency offers potential practical advantages in reducing labor inputs and system operating wear without sacrificing crop productivity [37,52].

4.3. Multi-Objective Comprehensive Evaluation and Management Implications Based on the EWM-TOPSIS Model

Traditional irrigation regimes often rely on single-factor optimization (e.g., pursuing maximum yield regardless of cost), which inevitably leads to severe resource wastage, diminished economic returns, and environmental burdens such as groundwater pollution in fragile arid ecosystems [24,40]. In this study, the EWM-TOPSIS model was employed to reduce subjective weighting bias and comprehensively evaluate the conflicting objectives among yield, water productivity (WP), and nutrient use efficiency (NUE). The model identified F7W3 (7-day interval, 650 mm irrigation volume) as the optimal strategy among the tested treatments under the specific conditions of this experiment. From an agronomic perspective, F7W3 maintains a moderate single-irrigation load, ensuring optimal PSII activity and leaf gas exchange. From the standpoint of environmental sustainability, it effectively curbs the diminishing marginal returns associated with luxury water consumption (W4). By sacrificing a statistically non-significant fraction of absolute yield, the F7W3 regime substantially enhanced WP, NUE, PUE, and KUE, achieving the highest relative closeness coefficient [3,42,44].
Despite these compelling results, the site-specific nature of this study presents certain limitations. The spatiotemporal dynamics of water and fertilizer were evaluated specifically based on a sandy loam profile, where soil texture fundamentally dictates hydraulic conductivity [53]. Consequently, site-specific calibrations may be required when extrapolating the optimal F7W3 regime to heavy clay or severely saline–alkali soils. Furthermore, while we established robust links between macronutrient uptake and canopy physiology, the underlying micro-mechanisms, such as root architectural traits and the response of the rhizosphere microbiome to varying wetting–drying frequencies, were not explored in depth [54,55]. Future research should integrate root–soil–microbe interaction models to further refine precision water and nutrient management in arid agroecosystems. Several experimental boundaries should be acknowledged: (1) deep percolation fluxes, dynamic nitrate leaching rates, and in situ 3D root architectural traits (e.g., root length density across depth) were not directly measured using automated drainage lysimeters, suction lysimeters, or minirhizotron imaging; rather, these mechanisms were inferred from profile soil moisture dynamics (0–150 cm) and total crop nutrient uptake patterns; (2) ultra-high-frequency irrigation regimes (1–2 day intervals) were not evaluated due to regional rotational canal infrastructure. Future research should integrate continuous drainage monitoring systems, in situ root-rhizosphere sensors, and automated micro-pulsed irrigation to validate these hydrological and physiological trade-offs at higher temporal resolutions.

5. Conclusions

A two-year field study systematically elucidated the synergistic mechanisms of drip irrigation amount and frequency on spring maize in arid sandy loam soils. Severe water deficit or low-frequency irrigation induced pronounced stomatal limitations and photosystem II (PSII) photochemical damage, significantly inhibiting leaf Pn, Tr, Gsw, Fv/Fm, ΦPSII, qP, and aboveground dry matter accumulation. Conversely, short-interval drip irrigation (F4 and F7) not only maintained robust leaf gas exchange and PSII activity but also reduced water consumption under the same total irrigation volume, thereby increasing WP by 17–24% compared to low-frequency irrigation (F10). Furthermore, although the highest irrigation volume (800 mm) achieved the maximum grain yield, it concurrently caused a substantial increase in water consumption. This led to significant decreases in WP and nutrient use efficiencies, thereby revealing an inevitable trade-off between yield and resource efficiency. By employing the EWM-TOPSIS (entropy weight method combined with the Technique for Order Preference by Similarity to Ideal Solution) model to reduce subjective weighting bias, the F7W3 treatment (650 mm volume, 7-day interval) was identified as the optimal strategy among all evaluated treatments under the tested conditions. By coordinating yield, WP, and multi-nutrient efficiencies, this treatment achieved the highest relative closeness coefficients in 2024 and 2025 (92.1% and 76.3%, respectively). Ultimately, it effectively balanced robust canopy physiological performance, high grain yield, and the optimization of WP and fertilizer use efficiencies. However, these conclusions and the identified optimal irrigation regime (F7W3) are based on a two-year field evaluation under the typical hyper-arid climate and sandy loam soil conditions of Southern Xinjiang. Consequently, the boundary of applicability for this specific regime should be considered within similar ecological zones. To extend these findings to regions with differing soil textures, rainfall patterns, or inter-annual climate fluctuations, future studies should incorporate multi-location long-term field trials alongside process-based crop growth models (e.g., AquaCrop or DSSAT) for regional calibration and dynamic management.

Supplementary Materials

The following supporting information can be downloaded at: https://www.mdpi.com/article/10.3390/agronomy16181751/s1. Figure S1: Schematic diagram of the experimental field layout; Figure S2: Soil water content changes before and after irrigation during the jointing stage in 2024; Figure S3: Soil water content changes before and after irrigation during the jointing stage in 2025; Figure S4: Transpiration rate (Tr) of leaves at key growth stages (jointing, grain-filling, and maturity stages) under different treatments during the 2024 and 2025 growing seasons; Figure S5: Stomatal conductance (Gsw) of leaves at key growth stages (jointing, grain-filling, and maturity stages) under different treatments during the 2024 and 2025 growing seasons; Table S1: Weight distribution of each evaluation indicator based on the entropy weight method in 2024 and 2025; Table S2: TOPSIS weighted decision matrix for different treatments in 2024 and 2025.

Author Contributions

Conceptualization, investigation, methods, original Draft, Y.L.; investigation, methods, H.K. (Hongtai Kou); investigation, methods, H.K. (Hao Kong); investigation, methods, M.F.; investigation, methods, G.L.; investigation, methods, C.Y.; supervision, funding acquisition, conceptualization, review and editing, J.F. All authors have read and agreed to the published version of the manuscript.

Funding

We extend our sincere gratitude to the Science and Technology Plan Project of Xinjiang Production and Construction Corps, China (2025DA020) and the NYHXGG Project of Xinjiang Production and Construction Corps, China (NYHXGG, 2023AA309) for funding this study.

Data Availability Statement

All data will be made available on request to the corresponding author’s email with appropriate justification.

Conflicts of Interest

The authors declare no conflicts of interest.

References

  1. Erenstein, O.; Jaleta, M.; Sonder, K.; Mottaleb, K.; Prasanna, B. Global maize production, consumption and trade: Trends and R&D implications. Food Secur. 2022, 14, 1295–1319. [Google Scholar] [CrossRef] [Scilit]
  2. Shiferaw, B.; Prasanna, B.M.; Hellin, J.; Banziger, M. Crops that feed the world 6. Past successes and future challenges to the role played by maize in global food security. Food Secur. 2011, 3, 307–327. [Google Scholar] [CrossRef] [Scilit]
  3. Bian, Q.; Dong, Z.; Fu, Y.; Zhao, Y.; Feng, Y.; Wang, Z.; Zhu, J. Optimizing irrigation strategies to improve yield and water use efficiency of drip-irrigated maize in southern Xinjiang. Plants 2024, 13, 3492. [Google Scholar] [CrossRef] [Scilit] [PubMed]
  4. Xing, Y.; Zhang, X.; Wang, X. Enhancing soil health and crop yields through water-fertilizer coupling technology. Front. Sustain. Food Syst. 2024, 8, 1494819. [Google Scholar] [CrossRef] [Scilit]
  5. Singh, A.; Rudnick, D.; Snow, D.; Misar, C.; Birru, G.; Proctor, C.; Puntel, L.; Iqbal, J. Intra- and inter-annual variability of nitrogen and irrigation management effects on nitrate leaching and maize yield in the bazile groundwater management area, nebraska. Agric. Ecosyst. Environ. 2025, 381, 109463. [Google Scholar] [CrossRef] [Scilit]
  6. Ning, D.; Chen, H.; Qin, A.; Gao, Y.; Zhang, J.; Duan, A.; Wang, X.; Liu, Z. Optimizing irrigation and N fertigation regimes achieved high yield and water productivity and low N leaching in a maize field in the north China plain. Agric. Water Manag. 2024, 301, 108945. [Google Scholar] [CrossRef] [Scilit]
  7. Xing, Y.; Wang, X. Precision agriculture and water conservation strategies for sustainable crop production in arid regions. Plants 2024, 13, 3184. [Google Scholar] [CrossRef] [Scilit] [PubMed]
  8. Wang, C.; Li, S.; Huang, S.; Feng, X. A Review of the Application and Impact of Drip Irrigation under Plastic Mulch in Agricultural Ecosystems. Agronomy 2024, 14, 1752. [Google Scholar] [CrossRef] [Scilit]
  9. Liu, X.; Yan, Z.; Shen, Y.J.; Min, L.; Wang, S.; Shen, Y.; Guo, Y. Quantifying the effects of irrigation schedule on groundwater level variability using a linked APSIM-MODFLOW model framework. Agric. Water Manag. 2025, 316, 109610. [Google Scholar] [CrossRef] [Scilit]
  10. Fu, Z.; Ciais, P.; Prentice, I.C.; Gentine, P.; Makowski, D.; Bastos, A.; Luo, X.; Green, J.K.; Stoy, P.C.; Yang, H.; et al. Atmospheric dryness reduces photosynthesis along a large range of soil water deficits. Nat. Commun. 2022, 13, 989. [Google Scholar] [CrossRef] [Scilit] [PubMed]
  11. Li, J.; Schachtman, D.P.; Creech, C.F.; Wang, L.; Ge, Y.; Shi, Y. Evaluation of UAV-derived multimodal remote sensing data for biomass prediction and drought tolerance assessment in bioenergy sorghum. Crop J. 2022, 10, 1363–1373. [Google Scholar] [CrossRef] [Scilit]
  12. Joshi, J.; Stocker, B.D.; Hofhansl, F.; Zhou, S.; Dieckmann, U.; Prentice, I.C. Towards a unified theory of plant photosynthesis and hydraulics. Nat. Plants 2022, 8, 1304–1316. [Google Scholar] [CrossRef] [Scilit] [PubMed]
  13. Zhao, F.; Liu, J.; Zhang, Q.; Wang, R.; Wang, H.; Zhang, K.; Zhao, H.; Qi, Y.; Chen, F. Difference of response thresholds between leaf gas exchange and yield to drought for spring wheat. Chin. J. Eco-Agric. 2023, 31, 1733–1744. [Google Scholar]
  14. Beauclaire, Q.; Vanden Brande, F.; Longdoz, B. Key role played by mesophyll conductance in limiting carbon assimilation and transpiration of potato under soil water stress. Front. Plant Sci. 2024, 15, 1500624. [Google Scholar] [CrossRef] [Scilit] [PubMed]
  15. Shi, C.; Fu, Y.; Guo, Y.; Ma, Y.; Li, S.; Lin, J.; Wang, J. Comparative effects of water potential stress induced by salt, alkali and drought on photosynthetic electron transport and apparatus in Hordeum jubatum seedlings. Crop Pasture Sci. 2022, 74, 324–333. [Google Scholar] [CrossRef] [Scilit]
  16. Moustakas, M.; Panteris, E.; Moustaka, J.; Aydın, T.; Bayçu, G.; Sperdouli, I. Modulation of photosystem II function in celery via foliar-applied salicylic acid during gradual water deficit stress. Int. J. Mol. Sci. 2024, 25, 6721. [Google Scholar] [CrossRef] [Scilit] [PubMed]
  17. Naseer, M.A.; Hussain, S.; Mukhtar, A.; Rui, Q.; Ru, G.; Ahmad, H.; Zhang, Z.Q.; Shi, L.B.; Asad, M.S.; Chen, X.; et al. Chlorophyll fluorescence, physiology, and yield of winter wheat under different irrigation and shade durations during the grain-filling stage. Front. Plant Sci. 2024, 15, 1396929. [Google Scholar] [CrossRef] [Scilit] [PubMed]
  18. Yu, Z.; Wang, H.; Yu, D.; Yin, N.-X.; Zhang, J. The effect of aeration and irrigation on the improvement of soil environment and yield in dryland maize. Front. Plant Sci. 2024, 15, 1464624. [Google Scholar] [CrossRef] [Scilit] [PubMed]
  19. Yang, T.; Zhao, J.; Hong, M.; Ma, M.; Ma, S.; Yuan, Y. Optimizing water and nitrogen supply can regulate the dynamics of dry matter accumulation in maize, thereby promoting dry matter accumulation and increasing yield. Field Crops Res. 2025, 326, 109837. [Google Scholar] [CrossRef] [Scilit]
  20. Feng, Y.; Tang, Y.; Abdoulaye, A.H.; Zhang, Y.; Wen, W.; Wang, H.; Du, Z.; Chen, Y. Progress in plant rhizosphere microbiome research for improved growth, nutrient uptake, and disease resistance. Plant Stress 2026, 20, 101323. [Google Scholar] [CrossRef] [Scilit]
  21. Li, Y.; Chen, Z.; Xu, X.; Xiong, Y.; Huang, Q.; Huang, G. Assessing resource utilization, food production and ecosystem service value from spring wheat farmland under reduced irrigation and N fertilization management using a process simulation-based framework. J. Hydrol. 2023, 626, 130362. [Google Scholar] [CrossRef] [Scilit]
  22. Mankotia, S.; Sharma, J.C. Response of NPK fertilization and irrigation in nutrient and soil moisture distribution under high-density apple plantation in the NW himalayan region. Commun. Soil Sci. Plant Anal. 2024, 55, 101–117. [Google Scholar] [CrossRef] [Scilit]
  23. Yao, X.; Zhang, Z.; Li, K.; Yuan, F.; Xu, X.; Long, X.; Song, C. Optimizing water and nitrogen management to balance greenhouse gas emissions and yield in Chinese rice paddies. Field Crops Res. 2024, 319, 109621. [Google Scholar] [CrossRef] [Scilit]
  24. Chen, Y.; Li, H.; Xu, Y.; Fu, Q.; Wang, Y.; He, B.; Li, M. Sustainable management in irrigation water distribution system under climate change: Process-driven optimization modelling considering water-food-energy-environment synergies. Agric. Water Manag. 2024, 302, 108990. [Google Scholar] [CrossRef] [Scilit]
  25. Holz, M.; Zarebanadkouki, M.; Benard, P.; Hoffmann, M.; Dubbert, M. Root and rhizosphere traits for enhanced water and nutrients uptake efficiency in dynamic environments. Front. Plant Sci. 2024, 15, 1383373. [Google Scholar] [CrossRef] [Scilit] [PubMed]
  26. Sidhu, S.K.; Zotarelli, L.; Sharma, L.K. A review of potassium significance and management approaches in potato production under sandy soils. J. Sustain. Agric. Environ. 2024, 3, e12106. [Google Scholar] [CrossRef] [Scilit]
  27. Yang, X.; Zhang, L.; Liu, X. Optimizing water-fertilizer integration with drip irrigation management to improve crop yield, water, and nitrogen use efficiency: A meta-analysis study. Sci. Hortic. 2024, 338, 113653. [Google Scholar] [CrossRef] [Scilit]
  28. Zhi, X.; Bian, X.; Huang, F.; Li, Y.; Cao, Y.; Gun, S.; Ma, N. Differential effects of non-structural carbohydrate allocation and C:N:P:K stoichiometry of rapeseed roots in diverse soil environments. Ind. Crops Prod. 2025, 225, 120542. [Google Scholar] [CrossRef] [Scilit]
  29. Maurel, C.; Nacry, P. Root architecture and hydraulics converge for acclimation to changing water availability. Nat. Plants 2020, 6, 744–749. [Google Scholar] [CrossRef] [Scilit] [PubMed]
  30. Gao, J.; Liu, Z.; Wang, P.; Huang, S. Drip irrigation coupled with appropriate N input increased maize (Zea mays L.) yield and lodging resistance via optimizing root and stem trait. Eur. J. Agron. 2024, 160, 127298. [Google Scholar] [CrossRef] [Scilit]
  31. Rubio-Asensio, J.S.; Intrigliolo, D.S. Fertigation frequency is a useful tool for nitrate management in intensive open-field agriculture. Irrig. Sci. 2024, 42, 353–365. [Google Scholar] [CrossRef] [Scilit]
  32. Sun, W.; Shi, H.; Li, X.; Miao, Q.; Yan, J.; Feng, Z.; Qi, Y.; Feng, W. Effect of water conservation and nitrogen reduction on root growth and yield in spring maize in typical sand interlayered soil. Agriculture 2024, 14, 338. [Google Scholar] [CrossRef] [Scilit]
  33. Chen, S.; Liu, W.; Morel, J.; Parsons, D.; Du, T. Improving yield, quality, and environmental co-benefits through optimized irrigation and nitrogen management of hybrid maize in northwest China. Agric. Water Manag. 2023, 290, 108577. [Google Scholar] [CrossRef] [Scilit]
  34. Chen, H.; Tang, Q.; Li, Y.; Zhang, H.; Li, K.; Li, J.; Xie, Y.; Su, N.; Duan, Y.; Lv, Z.; et al. Interactive Effects of Irrigation Amount and Interval on Cotton Water Use and Productivity: Evidence from Controlled Experiments and AquaCrop Simulations. Agronomy 2026, 16, 730. [Google Scholar] [CrossRef] [Scilit]
  35. Liu, X.; Liu, J.; Huang, C.; Liu, H.; Meng, Y.; Chen, H.; Ma, S.; Liu, Z. The impacts of irrigation methods and regimes on the water and nitrogen utilization efficiency in subsoiling wheat fields. Agric. Water Manag. 2024, 295, 108765. [Google Scholar] [CrossRef] [Scilit]
  36. Duan, T.; Zhang, L.; Wang, G.; Liang, F. Effects of water application frequency and water use efficiency under deficit irrigation on maize yield in Xinjiang. Agronomy 2025, 15, 1110. [Google Scholar] [CrossRef] [Scilit]
  37. Yin, J.; Yang, Y.; Eeswaran, R.; Yang, Z.; Ma, Z.; Sun, F. Irrigation scheduling for potatoes (Solanum tuberosum L.) under drip irrigation in an arid region using AquaCrop model. Front. Plant Sci. 2023, 14, 1242074. [Google Scholar] [CrossRef] [Scilit] [PubMed]
  38. Kakraliya, M.; Jat, H.S.; Kumar, S.; Kakraliya, S.K.; Gora, M.K.; Poonia, T.; Kumar, S.; Choudhary, M.; Gathala, M.K.; Sharma, P.C.; et al. Bundling subsurface drip irrigation with no-till provides a window to integrate mung bean with intensive cereal systems for improving resource use efficiency. Front. Sustain. Food Syst. 2024, 8, 1292284. [Google Scholar] [CrossRef] [Scilit]
  39. Huang, X.; Xu, X.; Zhu, Q.; Zhang, Y. Optimizing water and nitrogen inputs for sustainable wheat yields and minimal environmental impacts. Agric. Syst. 2024, 220, 104061. [Google Scholar] [CrossRef] [Scilit]
  40. Shi, R.; Guo, W. Research progress on the optimal allocation of agricultural irrigation water resources. Trans. Chin. Soc. Agric. Eng. 2024, 40, 1–13. [Google Scholar]
  41. Hou, X.; Fan, J.; Zhang, F.; Hu, W.; Xiang, Y. Optimization of water and nitrogen management to improve seed cotton yield, water productivity and economic benefit of mulched drip-irrigated cotton in southern Xinjiang, China. Field Crops Res. 2024, 308, 109301. [Google Scholar] [CrossRef] [Scilit]
  42. Liu, Y.; Gu, J.; Ma, N.; Li, X.; Yin, G.; Sun, S. Optimizing spring maize growth and yield through balanced irrigation and nitrogen application: A TOPSIS method approach. Agronomy 2024, 14, 1825. [Google Scholar] [CrossRef] [Scilit]
  43. Song, Y.; Xu, J.; Zhang, S.; Xing, J.; Wang, L.; Wang, X.; Hu, C.; Li, W.; Tan, Z.; Cheng, Y. Optimizing water–fertilizer coupling across different growth stages of tomato in yellow sand substrate: Toward enhanced yield, quality, and resource use efficiency. Plants 2025, 14, 936. [Google Scholar] [CrossRef] [Scilit] [PubMed]
  44. Naounoulis, I.; Faliagka, S.; Levizou, E.; Katsoulas, N. Cascade hydroponics enhanced water and nutrients use efficiency in a greenhouse cucumber-melon crop combination. Sci. Hortic. 2024, 338, 113822. [Google Scholar] [CrossRef] [Scilit]
  45. Wang, C.; Liu, W.; Li, Q.; Ma, D.; Lu, H.; Feng, W.; Xie, Y.; Zhu, Y.; Guo, T. Effects of different irrigation and nitrogen regimes on root growth and its correlation with above-ground plant parts in high-yielding wheat under field conditions. Field Crops Res. 2014, 165, 138–149. [Google Scholar] [CrossRef] [Scilit]
  46. Ding, Y.; Ma, J.; Zhang, J.; Bai, Y.; Cui, B.; Hao, X.; Fu, G.; Zheng, M.; Ding, B. Response of photosynthesis, population physiological indexes, and yield of cotton in dry areas to the new technology of “dry sowing and wet emergence. Front. Plant Sci. 2024, 15, 1487832. [Google Scholar] [CrossRef] [Scilit] [PubMed]
  47. Zhang, H.; Zhang, R.; Sun, L.; Li, H.; Xue, Y.; Zhao, X.; Liu, J.; Yuan, C. Optimized irrigation and fertilization for spring maize under warming and wetting climate in a semi-arid region of China. Front. Plant Sci. 2025, 16, 1600561. [Google Scholar] [CrossRef] [Scilit] [PubMed]
  48. Li, Z.; Ma, W.; Zhang, X.; Chen, G.; Zhang, X.; Yang, G.; Wei, C. Effects of Co-Application of Superabsorbent Polymer and Phosphorus Fertilizer on Water and Phosphorus Use Efficiency in Drip-Irrigated Maize. Agronomy 2026, 16, 488. [Google Scholar] [CrossRef] [Scilit]
  49. Zhang, S.; Chen, S.; Hu, T.; Geng, C.; Liu, J. Optimization of irrigation and nitrogen levels for a trade-off: Yield, quality, water use efficiency and environment effect in a drip-fertigated apple orchard based on TOPSIS method. Sci. Hortic. 2023, 309, 111700. [Google Scholar] [CrossRef] [Scilit]
  50. Zhang, T.; Zuo, Q.; Ma, N.; Shi, J.; Fan, Y.; Wu, X.; Wang, L.; Xue, X.; Ben-Gal, A. Optimizing relative root-zone water depletion thresholds to maximize yield and water productivity of winter wheat using AquaCrop. Agric. Water Manag. 2023, 286, 108391. [Google Scholar] [CrossRef] [Scilit]
  51. Qu, X.; Yao, W.; Ji, H.; Xu, Y.; Jia, R.; Chen, X.; Li, H.; Sánchez-Rodríguez, A.R.; Shen, Y.; Yang, Y.; et al. Optimizing nitrogen fertilization and irrigation strategies to balance agroecosystem services in the wheat-maize double cropping system: A 21-year field study. Field Crops Res. 2025, 322, 109706. [Google Scholar] [CrossRef] [Scilit]
  52. Kong, W.; Gao, C.; Zhao, F.; Ju, F.; Li, Z.; Zhao, H.; Liu, K.; Liu, P. Optimizing water and nitrogen management in a wheat–maize rotation system: Synergistic increases in grain yield, resource use efficiency, and economic and environmental benefits. Front. Plant Sci. 2026, 17, 1769742. [Google Scholar] [CrossRef] [Scilit] [PubMed]
  53. Sun, K.; Yang, R.; Che, Z.; Zhao, W.; Song, S.; Ren, H. Soil texture modulates microbial responses to irrigation: Implications for nutrient cycling in arid agroecosystem. Soil Tillage Res. 2026, 256, 106838. [Google Scholar] [CrossRef] [Scilit]
  54. Gao, J.; Zhang, Y.; Xu, C.; Wang, P.; Huang, S.; Lv, Y. Enhancing spatial and temporal coordination of soil water and root growth to improve maize (Zea mays L.) yield. Agric. Water Manag. 2024, 294, 108728. [Google Scholar] [CrossRef] [Scilit]
  55. Li, Y.; Bai, L.; Wei, S.; Wu, H.; Li, R.; Wang, Y.; Wang, Z. Integrating heterosis for root architecture and nitrogen use efficiency of maize: A comparison between hybrids from different decades. Agronomy 2024, 14, 2018. [Google Scholar] [CrossRef] [Scilit]
Figure 1. Dynamic changes in main meteorological factors during the experimental periods in 2024 (A) and 2025 (B). The figure illustrates daily rainfall, mean daily temperature, relative humidity, and photosynthetically active radiation. The maize growing season extended from 20 April to 18 August in 2024, and from 16 April to 14 August in 2025. During these periods, the mean air temperatures were 25.11 °C and 24.62 °C, respectively. Total rainfall was recorded at 42.3 mm (2024) and 17.6 mm (2025).
Agronomy 16 01751 g001
Figure 2. Dynamic changes in cumulative irrigation amount under different treatments in 2024 (AC) and 2025 (DF). The differently colored step lines represent four different irrigation levels/gradients (W1, W2, W3, and W4). Each vertical step on the cumulative lines indicates a specific irrigation event, where the horizontal position marks the irrigation date and the vertical step height corresponds to the single-event irrigation quota. The downward black arrows (↓) indicate the specific timing of fertilization events. When scheduled fertilization dates did not coincide with irrigation events (particularly under lower-frequency F7 and F10 treatments), fertigation was performed separately with carrier water, which was directly deducted from the nearest scheduled irrigation quota to maintain the exact target seasonal water depth.
Agronomy 16 01751 g002
Figure 3. Dynamic changes in leaf area index (LAI) under different treatments during the 2024 (AC) and 2025 (DF) growing seasons. The error bars represent the standard deviation of the mean (n = 3). ANOVA indicates analysis of variance; *** indicates significance at the 0.1% probability level, ** indicates significance at the 1% probability level; ns indicates not significant; the value of each treatment is the average effect value; W: drip irrigation amounts, F: drip irrigation frequencies, Y: year. W1, W2, W3, and W4 represent drip irrigation amounts of 350, 500, 650, and 800 mm, respectively. F4, F7, and F10 represent drip irrigation frequencies of 4-day, 7-day, and 10-day, respectively.
Agronomy 16 01751 g003
Figure 4. Dynamic changes in leaf SPAD values across key growth stages (jointing, grain-filling, and maturity stages) under different treatments during the 2024 (AC) and 2025 (DF) growing seasons. The error bars represent the standard deviation of the mean (n = 3). Different lowercase letters denote significant differences (p < 0.05) among all 12 treatment combinations (F × W) at the same growth stage within the same year. Different lowercase letters indicate significant differences among treatments at the p < 0.05 level. ANOVA indicates analysis of variance; *** indicates significance at the 0.1% probability level, ** indicates significance at the 1% probability level; * indicates significance at the 5% probability level; ns indicates not significant; the value of each treatment is the average effect value; W: drip irrigation amounts, F: drip irrigation frequencies, Y: year. W1, W2, W3, and W4 represent drip irrigation amounts of 350, 500, 650, and 800 mm, respectively. F4, F7, and F10 represent drip irrigation frequencies of 4-day, 7-day, and 10-day, respectively.
Agronomy 16 01751 g004
Figure 5. Net photosynthetic rate (Pn) of leaves at key growth stages (jointing, grain-filling, and maturity stages) under different treatments during the 2024 (AC) and 2025 (DF) growing seasons. The error bars represent the standard deviation of the mean (n = 3). Different lowercase letters indicate significant differences among treatments at the p < 0.05 level. ANOVA indicates analysis of variance; *** indicates significance at the 0.1% probability level, ** indicates significance at the 1% probability level; * indicates significance at the 5% probability level; ns indicates not significant; the value of each treatment is the average effect value; W: drip irrigation amounts, F: drip irrigation frequencies, Y: year. W1, W2, W3, and W4 represent drip irrigation amounts of 350, 500, 650, and 800 mm, respectively. F4, F7, and F10 represent drip irrigation frequencies of 4-day, 7-day, and 10-day, respectively.
Agronomy 16 01751 g005
Figure 6. Dynamic effects of different treatments on dry matter accumulation and partitioning among organs during the 2024 (AC) and 2025 (DF) growing seasons. The error bars represent the standard deviation of the mean (n = 3). Different lowercase letters indicate significant differences among treatments at the p < 0.05 level. ANOVA indicates analysis of variance; *** indicates significance at the 0.1% probability level, ** indicates significance at the 1% probability level; ns indicates not significant; the value of each treatment is the average effect value; W: drip irrigation amounts, F: drip irrigation frequencies, Y: year. W1, W2, W3, and W4 represent drip irrigation amounts of 350, 500, 650, and 800 mm, respectively. F4, F7, and F10 represent drip irrigation frequencies of 4-day, 7-day, and 10-day, respectively.
Agronomy 16 01751 g006
Figure 7. Effects of different treatments on grain yield during the 2024 (A) and 2025 (B) growing seasons. The error bars represent the standard deviation of the mean (n = 3). Different lowercase letters indicate significant differences among treatments at the p < 0.05 level. ANOVA indicates analysis of variance; *** indicates significance at the 0.1% probability level, ** indicates significance at the 1% probability level; ns indicates not significant; the value of each treatment is the average effect value; W: drip irrigation amounts, F: drip irrigation frequencies, Y: year. W1, W2, W3, and W4 represent drip irrigation amounts of 350, 500, 650, and 800 mm, respectively. F4, F7, and F10 represent drip irrigation frequencies of 4-day, 7-day, and 10-day, respectively.
Agronomy 16 01751 g007
Figure 8. Effects of different treatments on evapotranspiration (ET) (Bars) and water productivity (WP) (dashed lines with circles) in 2024 (A) and 2025 (B). The error bars represent the standard deviation of the mean (n = 3). Different lowercase letters indicate significant differences among treatments at the p < 0.05 level. ANOVA indicates analysis of variance; *** indicates significance at the 0.1% probability level, ** indicates significance at the 1% probability level; ns indicates not significant; the value of each treatment is the average effect value; W: drip irrigation amounts, F: drip irrigation frequencies, Y: year. W1, W2, W3, and W4 represent drip irrigation amounts of 350, 500, 650, and 800 mm, respectively. F4, F7, and F10 represent drip irrigation frequencies of 4-day, 7-day, and 10-day, respectively.
Agronomy 16 01751 g008
Figure 9. Effects of different treatments on nitrogen (NUE), phosphorus (PUE), and potassium (KUE) use efficiencies in 2024 (A,C,E) and 2025 (B,D,F). The error bars represent the standard deviation of the mean (n = 3). Different lowercase letters indicate significant differences among treatments at the p < 0.05 level. ANOVA indicates analysis of variance; *** indicates significance at the 0.1% probability level, ** indicates significance at the 1% probability level; ns indicates not significant; the value of each treatment is the average effect value; W: drip irrigation amounts, F: drip irrigation frequencies, Y: year. W1, W2, W3, and W4 represent drip irrigation amounts of 350, 500, 650, and 800 mm, respectively. F4, F7, and F10 represent drip irrigation frequencies of 4-day, 7-day, and 10-day, respectively.
Agronomy 16 01751 g009
Table 1. Effects of different treatments on leaf chlorophyll fluorescence parameters at key growth stages in 2024 and 2025.
YearTreatmentJointing StageGrain-Filling StageMaturity Stage
Fv/FmΦPS//qPFv/FmΦPS//qPFv/FmΦPS//qP
2024F4W10.790 ± 0.021 cd0.503 ± 0.026 e0.637 ± 0.031 c0.727 ± 0.021 d0.346 ± 0.019 d0.476 ± 0.012 c0.719 ± 0.007 c0.292 ± 0.021 d0.406 ± 0.034 c
F4W20.795 ± 0.009 bcd0.572 ± 0.017 d0.719 ± 0.027 b0.761 ± 0.011 bc0.461 ± 0.006 c0.605 ± 0.013 b0.765 ± 0.006 a0.455 ± 0.024 c0.595 ± 0.034 b
F4W30.824 ± 0.012 ab0.748 ± 0.023 a0.908 ± 0.041 a0.789 ± 0.021 ab0.600 ± 0.029 ab0.762 ± 0.049 a0.765 ± 0.015 a0.549 ± 0.015 a0.717 ± 0.021 a
F4W40.833 ± 0.016 a0.756 ± 0.021 a0.907 ± 0.008 a0.805 ± 0.010 a0.628 ± 0.034 a0.780 ± 0.044 a0.766 ± 0.007 a0.559 ± 0.024 a0.729 ± 0.026 a
F7W10.773 ± 0.026 d0.494 ± 0.035 e0.639 ± 0.025 c0.720 ± 0.012 de0.342 ± 0.018 d0.475 ± 0.023 c0.719 ± 0.009 c0.295 ± 0.028 d0.410 ± 0.043 c
F7W20.786 ± 0.018 cd0.570 ± 0.025 d0.725 ± 0.047 b0.749 ± 0.016 cd0.458 ± 0.004 c0.612 ± 0.009 b0.762 ± 0.011 a0.440 ± 0.017 c0.578 ± 0.021 b
F7W30.813 ± 0.015 abc0.730 ± 0.028 ab0.898 ± 0.050 a0.784 ± 0.019 ab0.592 ± 0.042 ab0.757 ± 0.071 a0.765 ± 0.003 a0.542 ± 0.021 ab0.709 ± 0.027 a
F7W40.827 ± 0.021 a0.749 ± 0.026 a0.905 ± 0.016 a0.797 ± 0.009 a0.606 ± 0.051 ab0.760 ± 0.059 a0.764 ± 0.009 a0.544 ± 0.004 ab0.713 ± 0.008 a
F10W10.706 ± 0.012 e0.422 ± 0.045 f0.597 ± 0.063 c0.695 ± 0.016 e0.320 ± 0.027 d0.461 ± 0.050 c0.709 ± 0.008 c0.287 ± 0.036 d0.406 ± 0.054 c
F10W20.769 ± 0.019 d0.509 ± 0.034 e0.663 ± 0.059 bc0.730 ± 0.015 cd0.423 ± 0.026 c0.580 ± 0.045 b0.724 ± 0.014 c0.416 ± 0.034 c0.576 ± 0.059 b
F10W30.790 ± 0.016 cd0.675 ± 0.028 c0.855 ± 0.044 a0.761 ± 0.023 bc0.561 ± 0.041 b0.737 ± 0.045 a0.741 ± 0.016 b0.502 ± 0.031 b0.677 ± 0.028 a
F10W40.813 ± 0.014 abc0.686 ± 0.024 bc0.844 ± 0.018 a0.783 ± 0.029 ab0.591 ± 0.033 ab0.755 ± 0.017 a0.757 ± 0.011 ab0.522 ± 0.023 ab0.690 ± 0.027 a
ANOVA
W******************
F*********ns*****
Y******************
W × F*nsnsnsnsnsnsns**
Y × Wnsnsnsnsnsnsnsnsns
Y × Fnsnsnsnsnsnsnsnsns
Y × W × Fnsnsnsnsnsnsnsnsns
2025F4W10.800 ± 0.010 def0.525 ± 0.014 d0.656 ± 0.018 c0.737 ± 0.013 d0.401 ± 0.011 cd0.544 ± 0.017 bc0.730 ± 0.008 de0.308 ± 0.014 e0.421 ± 0.018 e
F4W20.808 ± 0.009 cde0.620 ± 0.035 b0.767 ± 0.036 b0.764 ± 0.008 c0.464 ± 0.031 c0.607 ± 0.034 b0.764 ± 0.011 abc0.465 ± 0.011 c0.609 ± 0.008 c
F4W30.826 ± 0.014 abc0.742 ± 0.013 a0.898 ± 0.013 a0.797 ± 0.023 a0.626 ± 0.065 ab0.788 ± 0.100 a0.779 ± 0.004 a0.545 ± 0.011 a0.699 ± 0.014 ab
F4W40.836 ± 0.012 a0.747 ± 0.017 a0.894 ± 0.033 a0.807 ± 0.009 a0.645 ± 0.042 a0.799 ± 0.060 a0.777 ± 0.009 a0.563 ± 0.016 a0.724 ± 0.027 a
F7W10.790 ± 0.015 ef0.517 ± 0.026 d0.655 ± 0.021 c0.733 ± 0.010 d0.390 ± 0.019 d0.532 ± 0.027 bc0.723 ± 0.010 ef0.300 ± 0.015 e0.416 ± 0.026 e
F7W20.804 ± 0.020 cde0.623 ± 0.033 b0.775 ± 0.049 b0.761 ± 0.008 c0.460 ± 0.025 c0.604 ± 0.034 bc0.760 ± 0.013 abc0.450 ± 0.003 c0.592 ± 0.011 c
F7W30.819 ± 0.006 abcd0.733 ± 0.018 a0.894 ± 0.016 a0.789 ± 0.013 ab0.601 ± 0.054 ab0.763 ± 0.068 a0.775 ± 0.013 ab0.543 ± 0.017 a0.702 ± 0.032 ab
F7W40.834 ± 0.010 ab0.742 ± 0.030 a0.889 ± 0.029 a0.804 ± 0.012 a0.628 ± 0.038 a0.781 ± 0.040 a0.771 ± 0.013 ab0.557 ± 0.013 a0.722 ± 0.006 a
F10W10.724 ± 0.004 g0.450 ± 0.011 e0.621 ± 0.018 c0.723 ± 0.011 d0.372 ± 0.028 d0.515 ± 0.047 c0.710 ± 0.007 f0.286 ± 0.013 e0.403 ± 0.020 e
F10W20.781 ± 0.012 f0.576 ± 0.033 c0.738 ± 0.033 b0.741 ± 0.008 d0.404 ± 0.021 cd0.546 ± 0.034 bc0.735 ± 0.010 de0.350 ± 0.016 d0.477 ± 0.027 d
F10W30.802 ± 0.016 def0.704 ± 0.020 a0.878 ± 0.020 a0.770 ± 0.007 bc0.563 ± 0.010 b0.731 ± 0.007 a0.746 ± 0.001 cd0.501 ± 0.011 b0.672 ± 0.014 b
F10W40.812 ± 0.015 bcde0.707 ± 0.011 a0.871 ± 0.026 a0.790 ± 0.009 ab0.592 ± 0.028 ab0.750 ± 0.036 a0.757 ± 0.015 bc0.550 ± 0.014 a0.726 ± 0.004 a
ANOVA
W******************
F****************
Y***************
W × F*nsnsnsnsnsns****
Y × Wnsnsnsnsnsnsnsnsns
Y × Fnsnsnsnsnsnsnsnsns
Y × W × Fnsnsnsnsnsnsnsnsns
Note: Data are presented as mean ± standard deviation (SD) (n = 3). Different lowercase letters indicate significant differences among treatments at the p < 0.05 level. ANOVA indicates analysis of variance; *** indicates significance at the 0.1% probability level, ** indicates significance at the 1% probability level; * indicates significance at the 5% probability level; ns indicates not significant; the value of each treatment is the average effect value; W: drip irrigation amounts, F: drip irrigation frequencies, Y: year. W1, W2, W3, and W4 represent drip irrigation amounts of 350, 500, 650, and 800 mm, respectively. F4, F7, and F10 represent drip irrigation frequencies of 4-day, 7-day, and 10-day, respectively.
Table 2. Comprehensive evaluation and ranking of different treatments based on the EWM-TOPSIS model in 2024 and 2025.
Treatment20242025
D+DCiRankingD+DCiRanking
F4W10.2920.2060.414100.3010.2540.45810
F4W20.2150.2700.55780.2110.2890.5788
F4W30.1330.3340.71530.1450.3300.6952
F4W40.1630.3370.67460.2070.3120.6017
F7W10.2380.2560.51990.2470.2790.5319
F7W20.1500.3110.67550.1670.2920.6374
F7W30.0340.4280.92710.1020.3950.7951
F7W40.1260.3620.74220.1850.3300.6413
F10W10.4490.0000.000120.4540.0000.00012
F10W20.2760.1780.392110.2970.1670.36011
F10W30.1490.3070.67370.1900.2960.6106
F10W40.1510.3360.69040.1890.3300.6365
Note: D+ and D represent the Euclidean distances to the positive-ideal and negative-ideal solutions, respectively. Ci represents the relative closeness coefficient, where a higher Ci value (closer to 1) indicates better comprehensive performance. Ci = 0.000 for the F10W1 treatment occurs because this severe water-deficit treatment defined the negative-ideal solution (D = 0) across all evaluated indicators. W and F denote drip irrigation amounts and frequencies, respectively. W1, W2, W3, and W4 represent drip irrigation amounts of 350, 500, 650, and 800 mm, respectively; F4, F7, and F10 represent drip irrigation frequencies of 4-day, 7-day, and 10-day intervals, respectively.
Disclaimer/Publisher’s Note: The statements, opinions and data contained in all publications are solely those of the individual author(s) and contributor(s) and not of MDPI and/or the editor(s). MDPI and/or the editor(s) disclaim responsibility for any injury to people or property resulting from any ideas, methods, instructions or products referred to in the content.