1. Introduction
Driven by the global crises of population growth and shifting climate patterns, agricultural yields are increasingly jeopardized by abiotic stresses such as fluctuating temperatures, arid conditions, salinization, and heavy metal pollution [
1,
2,
3]. Such stresses can negatively affect crop growth and development, ultimately resulting in dual losses of yield and quality. Oilseed rape (
Brassica napus L.) is a globally significant oilseed crop, valued for its edible oil, biofuel, and protein-rich meal. Nevertheless, the escalating frequency and severity of non-biological stressors—chiefly drought, soil salinity, and thermal extremes—increasingly limit its yield potential and cultivation range, a situation further intensified by global climate shifts [
4,
5,
6]. These stresses disrupt physiological and metabolic homeostasis, leading to substantial yield and quality losses. Consequently, there is an urgent need to decipher the complex molecular mechanisms underlying stress tolerance in
B. napus to facilitate the development of resilient cultivars [
7].
In this context, investigating gene families that mediate both developmental pathways and environmental stress responses constitutes a pivotal approach [
8]. Improving plant stress tolerance and identifying stress-tolerant germplasm resources have become key objectives in modern breeding programs.
As a vital group of polyhydroxylated steroidal plant hormones, brassinosteroids (BRs) are essential for coordinating a diverse array of physiological activities, including cell proliferation, tissue elongation, photomorphogenesis, and the patterning of vascular bundles [
9]. In addition to their well-documented roles in growth regulation, accumulating research increasingly demonstrates that BRs act as pivotal mediators in modulating how plants adapt to various environmental stressors. Current research positions BRs as essential modulators capable of improving plant resilience. They achieve this by fortifying antioxidant defenses, preserving the structural integrity of membranes, and optimizing osmotic regulation under adverse conditions [
10,
11]. To illustrate, a study by Hussain et al. established that treating plants with exogenous BRs effectively dampens the adverse effects of salinity and heavy metal exposure by readjusting cellular ion balance and tuning the ascorbate–glutathione pathway [
12]. Similarly, Minchae et al. revealed a complex crosstalk between BR signaling, abscisic acid (ABA) pathways, and mitogen-activated protein kinase (MAPK) cascades under water-deficit conditions [
13]. The pivotal role of brassinosteroids in orchestrating vegetative growth and development explains why their synthesis pathways and signal transduction mechanisms have consistently served as a highly active research hotspot within the plant molecular biology community recently. Therefore, dissecting the genetic architecture of BR biosynthesis is crucial for harnessing its potential in stress-resilient crop breeding.
The cytochrome P450 (CYP) superfamily is one of the largest and most catalytically diverse groups of enzymes in the plant kingdom [
14,
15]. As a central node in plant metabolic networks, it is broadly involved in secondary metabolite biosynthesis, xenobiotic detoxification, and the production of various phytohormones. Within this vast catalytic machinery, the
CYP90 family has evolved into a highly specialized and dedicated core assembly line, orchestrating the biosynthetic pathway of brassinosteroids (BRs), a crucial class of steroidal hormones in plants. BRs play an indispensable and pivotal role in regulating cell elongation and vascular differentiation, as well as in mediating responses to abiotic stresses such as salinity, alkalinity, and drought [
16]. Members of the
CYP90 family, including CYP90A, CYP90B, CYP90C, and CYP90D, constitute the primary routes in the BR biosynthetic pathway. By catalyzing the C-3 oxidation and the C-22/C-23-specific hydroxylation of the steroidal precursor skeleton, they drive the metabolic flux of BR precursors; notably, the C-22 hydroxylation mediated by
CYP90B represents the initial rate-limiting step of the entire biosynthetic network [
17].
Notably, a tightly regulated dynamic homeostatic loop is established within this system. The forward catalysis by
CYP90 family enzymes continuously drives the accumulation of active BRs. However, once the level of free BRs in the plant reaches a physiological threshold, a robust negative feedback signal is triggered to specifically repress the transcription of core
CYP90 biosynthetic genes while simultaneously activating the expression of specific BR-degrading CYP members [
6,
16]. This bidirectional regulatory mechanism, governed by the functional specificity of
CYP90s and the negative feedback of BR signaling, ensures that plants can precisely maintain hormonal homeostasis in complex and fluctuating environments. Therefore, systematically elucidating the evolutionary characteristics, polymorphisms, and expression divergence of the
BnCYP90 gene family under stress responses in
B.
napus, a species that has undergone complex allopolyploidization events, holds significant theoretical and practical value for revealing the evolutionary patterns of BR metabolic networks and facilitating the genetic improvement of stress tolerance in polyploid crops.
Due to a lineage-specific whole-genome triplication (WGT) event, the genus Brassica—including
B. napus—possesses a highly expanded and structurally intricate genome. This genomic architecture offers an ideal framework for exploring the evolutionary dynamics, retention rates, and functional diversification of gene families [
18]. Recent genome-wide characterizations in
B. napus have successfully mapped various stress-responsive gene groups—such as the brassinosteroid-biosynthetic
CYP90 family and the cellulose synthase (
CesA) family—illuminating their distinct contributions to metabolic pathways, cell wall structural integrity, and environmental stress adaptation [
19,
20,
21]. These prior investigations have established a clear precedent, demonstrating that pairing broad genomic identification with detailed expression profiling offers a robust methodology for isolating crucial functional candidates [
22]. Although individual
CYP90 genes have been well-characterized in model plants, a comprehensive, genome-wide investigation into the
CYP90 gene family within the economically vital crop
B. napus remains absent from the current literature [
23]. The evolutionary mechanisms, gene structure, and, critically, the stress-responsive expression patterns of the whole
BnCYP90 gene family remain unknown. Further research is essential to elucidate the evolutionary history and expression patterns of these
CYP90 candidates, as well as to clarify how they might influence important agronomic performance traits in this species [
24].
Propelled by advancements in high-throughput sequencing technologies, the generation of chromosome-level rapeseed genomic resources provides a robust framework for the comprehensive analysis of target gene families [
25]. However, the
CYP90 gene family in rapeseed has not yet been comprehensively identified and characterized. In this study, we conducted a systematic genome-wide analysis of the
CYP90 gene family in
B. napus. The genome of the rapeseed cultivar “ZS11” was used as a reference, and validation was carried out using bioinformatics tools and RT-qPCR. Our objectives were to (1) identify all
CYP90 gene family members in the ZS11 genome; (2) perform comprehensive bioinformatics analyses, including phylogenetic classification, gene structure characterization, cis-regulatory element prediction, and synteny analysis; and (3) profile the expression patterns of
CYP90 genes across different tissues and under various abiotic stress treatments using transcriptomic data and RT-qPCR. Furthermore, by employing single nucleotide polymorphism (SNP) variant profiling, we successfully linked specific haplotypes of critical
CYP90 loci to phenotypic variations observed under salinity stress. These insights offer promising target candidates and establish a strong theoretical framework for marker-assisted breeding initiatives designed to fortify stress tolerance in rapeseed and related Brassica species.
3. Results
3.1. Physicochemical Properties and Subcellular Localization Prediction of BnCYP90 Proteins
Predictive analysis of the 25 BnCYP90 family proteins (
Table S1) revealed that their amino acid lengths range from 294 to 542 aa, with molecular weights varying between 33.29 and 61.73 kDa. The theoretical isoelectric points (6.90–9.37) indicate that the vast majority of the members (24) are basic proteins. Physicochemical characterizations showed that all members are hydrophilic, possessing uniformly negative grand average of hydropathicity (GRAVY) values (−0.296 to −0.051). Regarding protein stability, their aliphatic indices (80.84–98.39) provide an indirect estimate of potential thermal stability; however, the instability index indicates that only 5 proteins are predicted to be stable in vitro (<40), while the remaining 20 members are classified as unstable (≥40). Furthermore, subcellular localization predictions demonstrated that these proteins are strictly distributed between the plasma membrane (20 proteins) and the cytoplasm (5 proteins). This highly concentrated localization pattern aligns well with the typical membrane-associated characteristics of cytochrome P450 enzymes, suggesting their primary functional sites are positioned within membrane systems and cytosolic metabolic networks.
3.2. Identification and Chromosomal Localization of CYP90 Gene Family
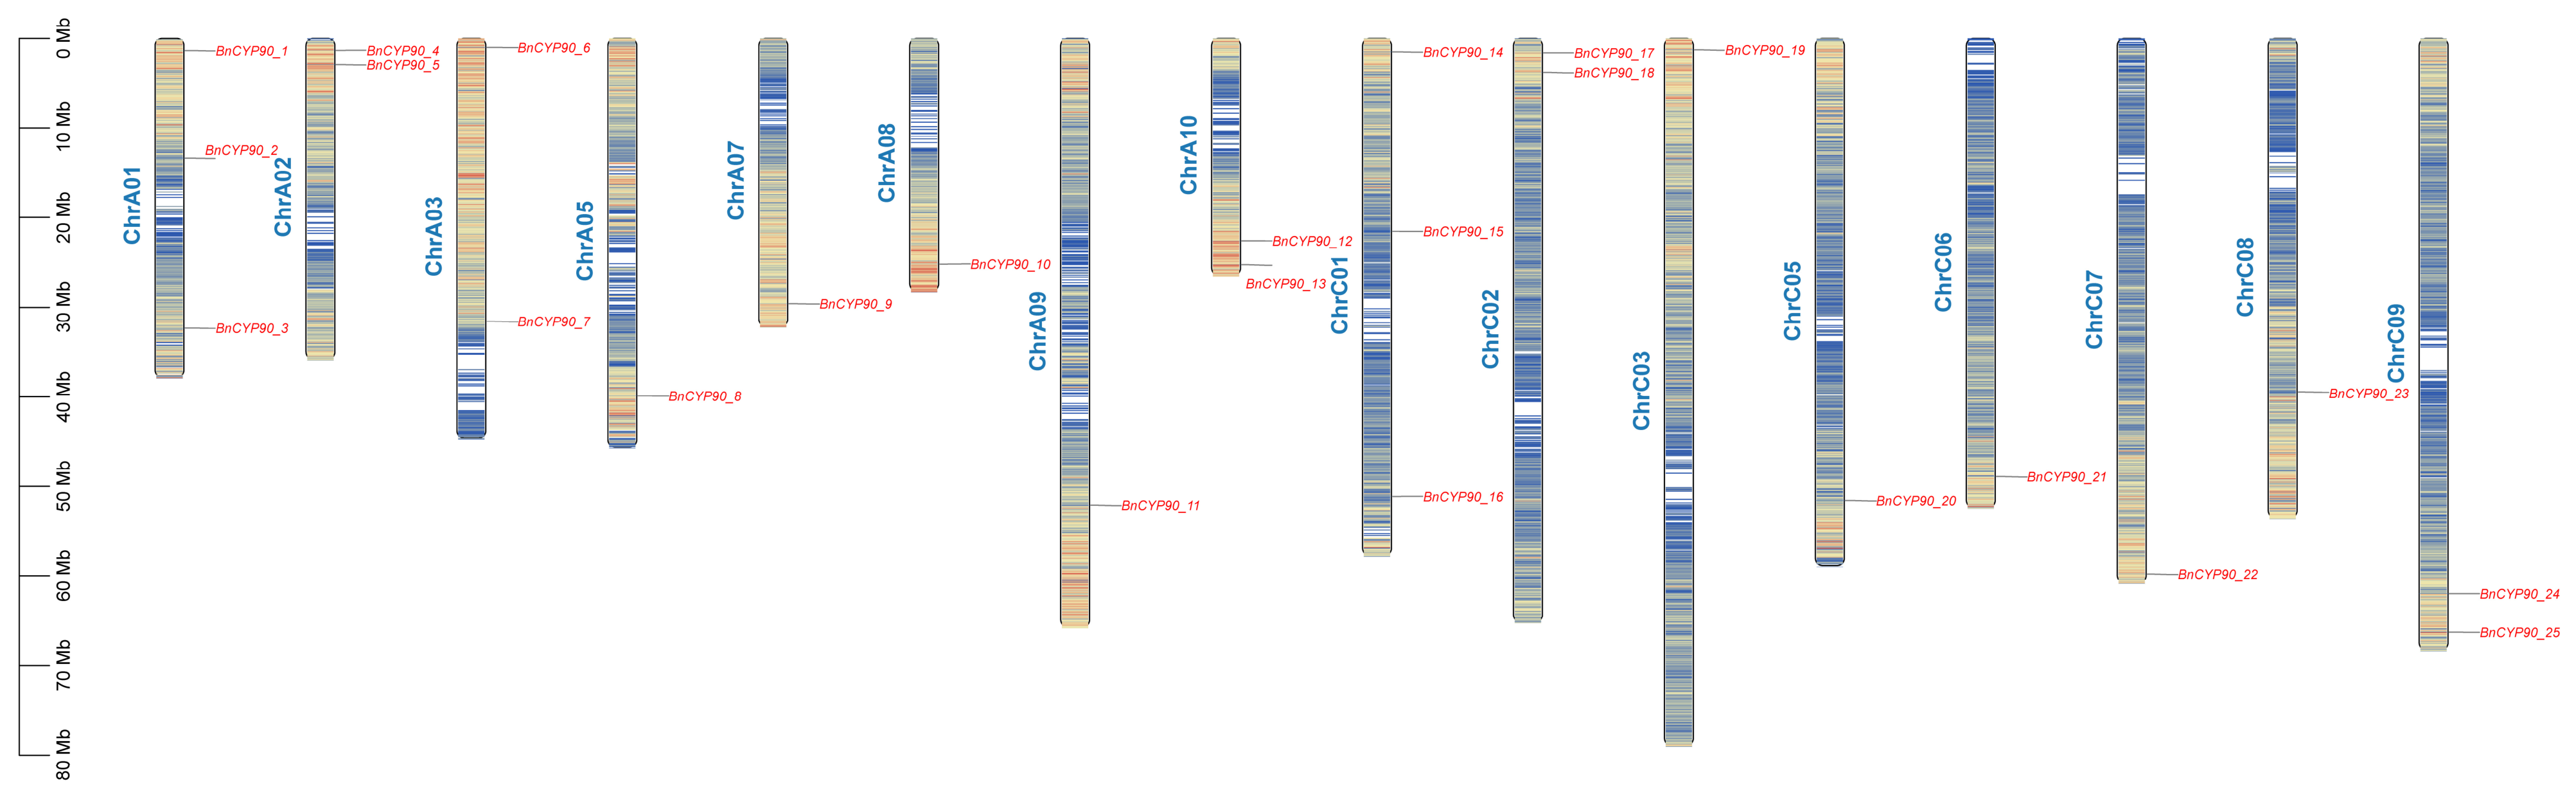
Chromosomal localization analysis showed that the 25
BnCYP90 genes were unevenly distributed across 16 chromosomes of
B. napus. Among them, 13 genes were located in the A subgenome and 12 in the C subgenome, indicating a generally balanced number of
BnCYP90 family members between the two subgenomes (
Figure 1). ChrA01 and ChrC01 contained the largest numbers of
BnCYP90 genes, with three members on each chromosome. ChrA02, ChrA03, ChrA10, ChrC02, and ChrC09 each harbored two genes, whereas ChrA05, ChrA07, ChrA08, ChrA09, ChrC03, ChrC05, ChrC06, ChrC07, and ChrC08 each contained one gene. No
BnCYP90 genes were detected on ChrA04, ChrA06, or ChrC04. Specifically,
BnCYP90_1–
BnCYP90_13 were distributed in the A subgenome, whereas
BnCYP90_14–
BnCYP90_25 were located in the C subgenome. Several family members were physically close to one another on ChrA02, ChrA10, ChrC02, and ChrC09, suggesting that local gene duplication may have contributed to the expansion of the
BnCYP90 gene family. In addition, corresponding distribution patterns were observed on several homologous chromosome pairs, including ChrA01/ChrC01, ChrA02/ChrC02, ChrA03/ChrC03, ChrA05/ChrC05, ChrA07/ChrC07, ChrA08/ChrC08, and ChrA09/ChrC09, indicating a relatively high degree of conservation between the A and C subgenomes. Nevertheless, the numbers of
BnCYP90 genes were not completely consistent between some homologous chromosome pairs. For example, ChrA09 and ChrC09 contained one and two genes, respectively, while a
BnCYP90 gene was identified on ChrC06, but no corresponding member was detected on ChrA06. These differences suggest that the
BnCYP90 gene family may have undergone asymmetric gene retention or loss during the formation and evolution of
B. napus.
3.3. Phylogenetic Analysis of BnCYP90 Proteins
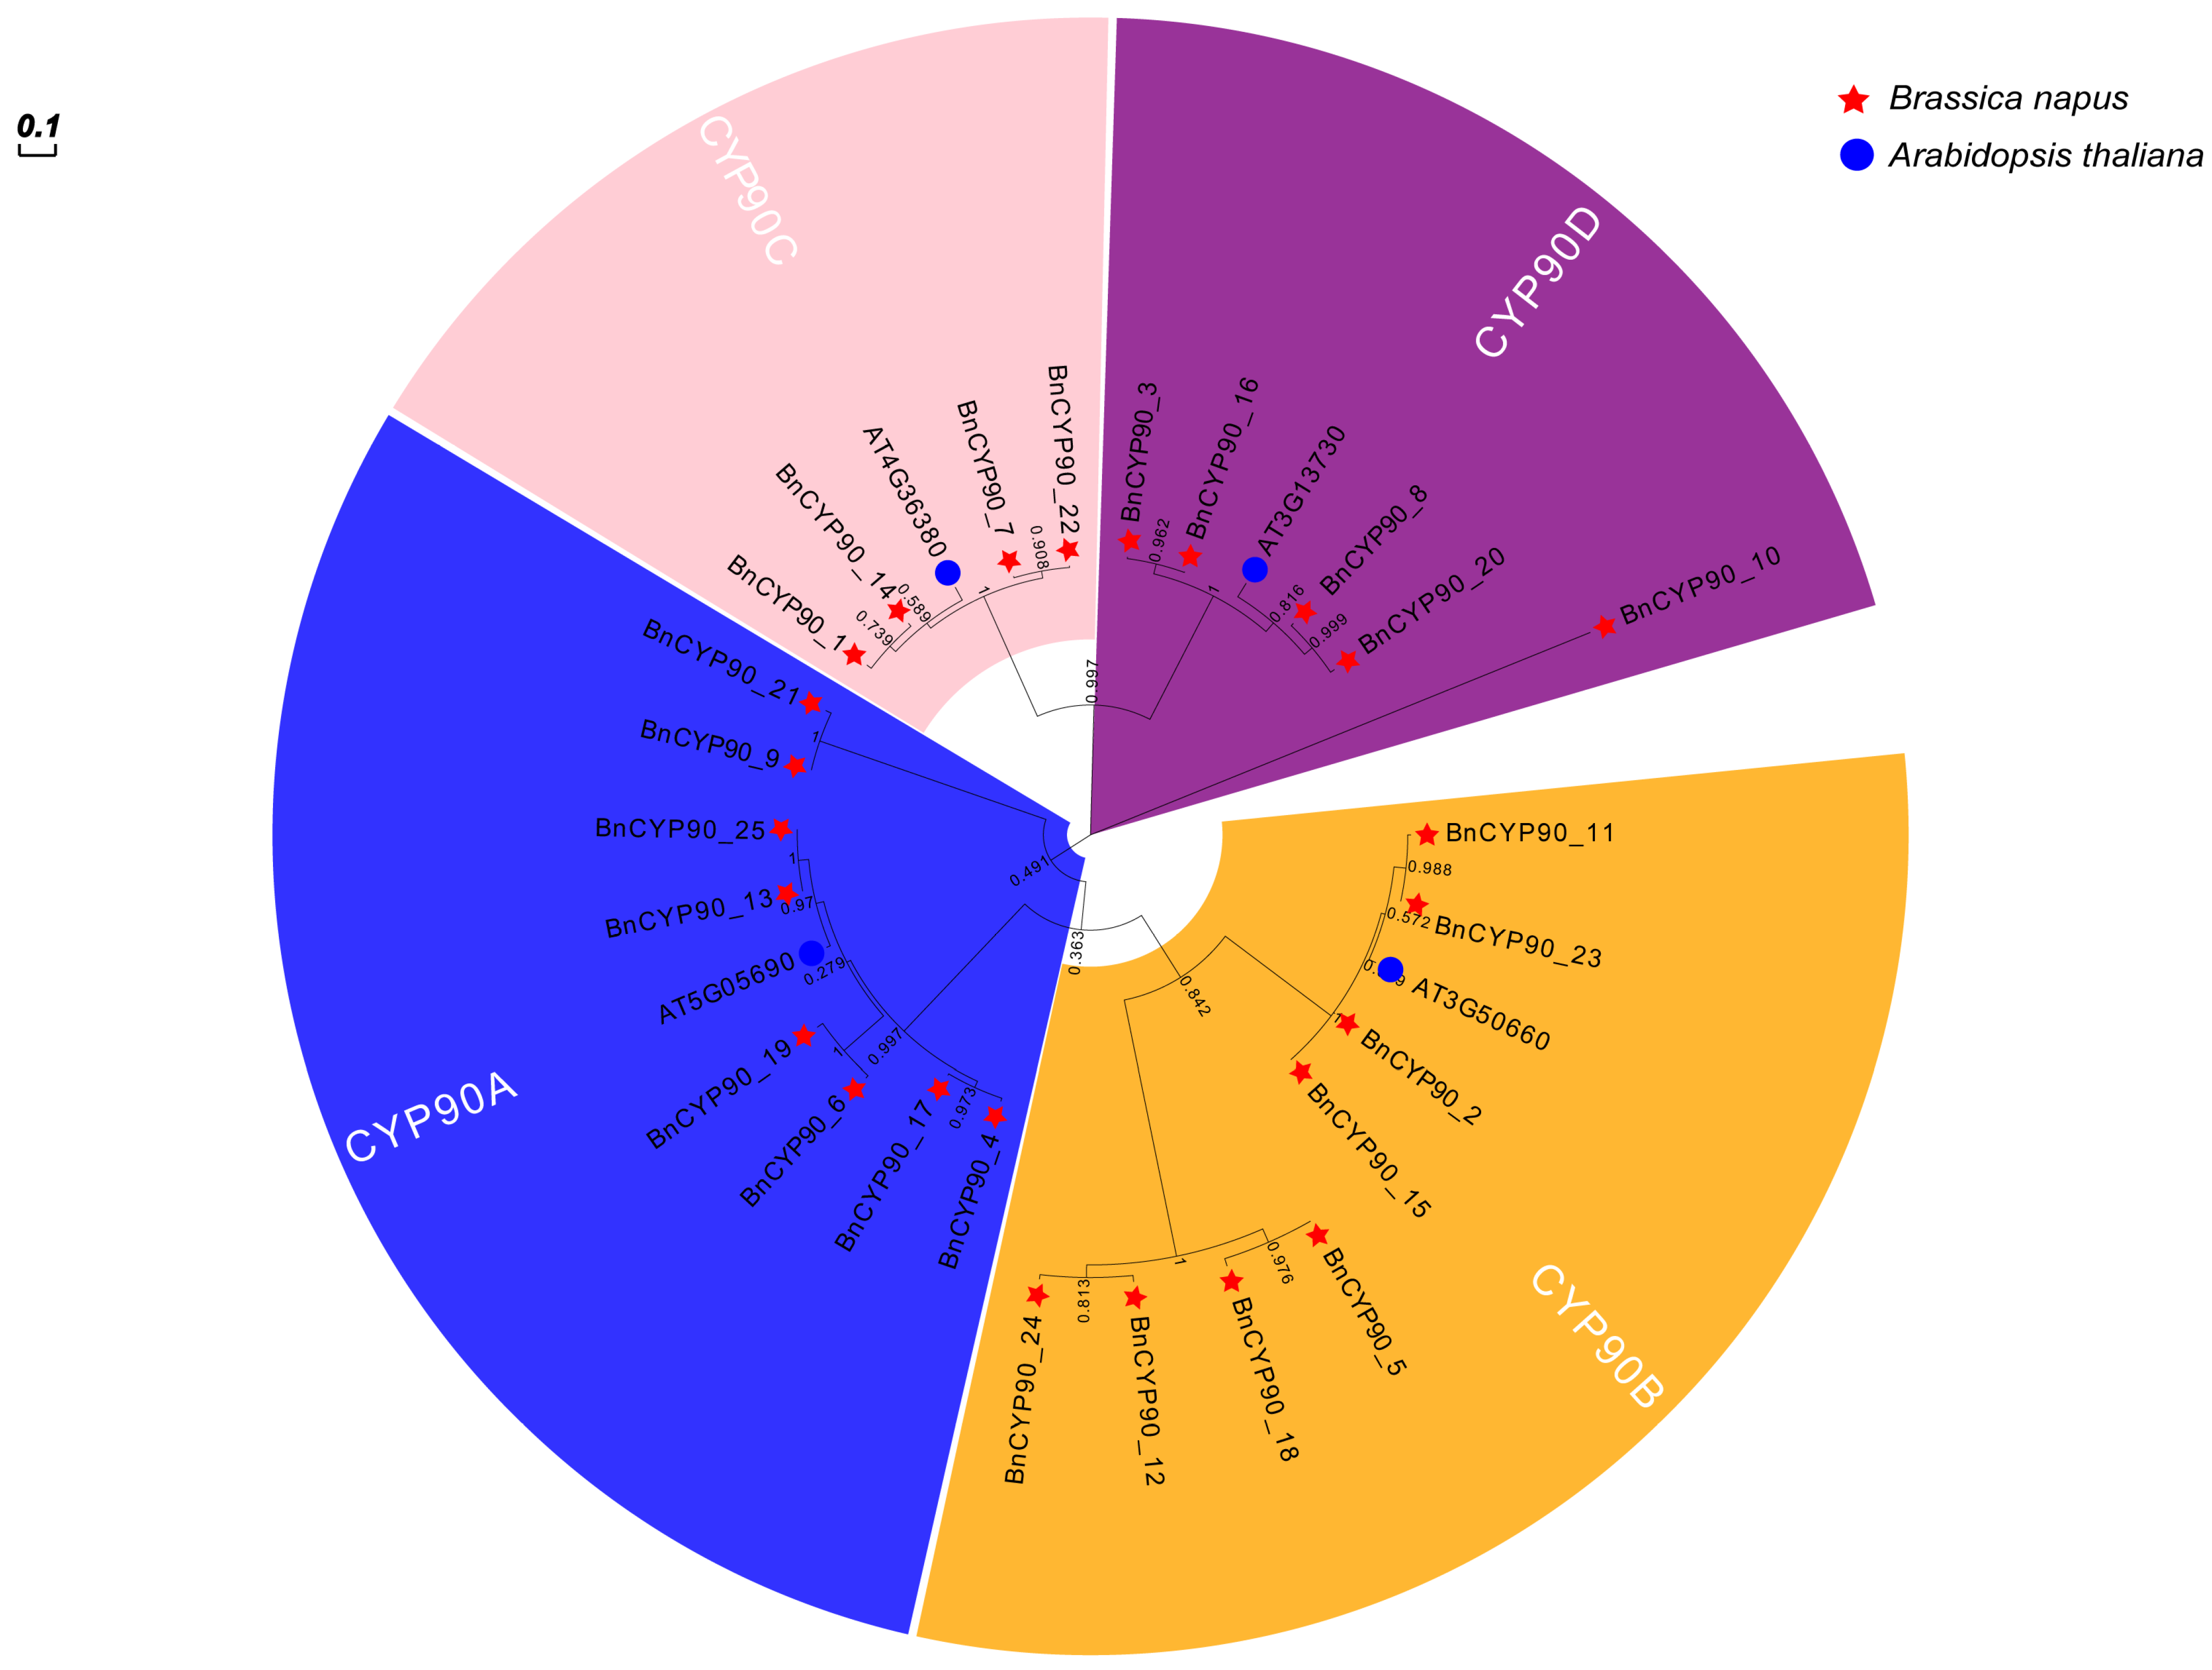
To clarify the evolutionary relationships among members of the BnCYP90 gene family in
B. napus, a phylogenetic tree was constructed using 25 BnCYP90 proteins and four representative CYP90 proteins from
A. thaliana. Clustering relationships with the corresponding Arabidopsis homologs allowed all BnCYP90 members to be classified into four distinct phylogenetic groups: CYP90A, CYP90B, CYP90C, and CYP90D (
Figure 2). Among these, the CYP90A and CYP90B groups represented the largest clades, each containing eight BnCYP90 members and individually accounting for 32% of the family. The CYP90D group included five members (20%), whereas the CYP90C group was the smallest, containing four members (16%).
Within the CYP90A group, the gene pairs BnCYP90_4/BnCYP90_17, BnCYP90_6/BnCYP90_19, BnCYP90_13/BnCYP90_25, and BnCYP90_7/BnCYP90_22 formed closely related sister branches and clustered strongly with the Arabidopsis protein AT5G05690 (CYP90A1). In the CYP90B group, BnCYP90_2/BnCYP90_15, BnCYP90_11/BnCYP90_23, BnCYP90_5/BnCYP90_18, and BnCYP90_12/BnCYP90_24 formed corresponding gene pairs that clustered with AT3G50660 (CYP90B1). The CYP90C group comprised BnCYP90_1, BnCYP90_9, BnCYP90_14, and BnCYP90_21; among these, BnCYP90_1/BnCYP90_14 and BnCYP90_9/BnCYP90_21 exhibited close phylogenetic relationships and clustered with AT4G36380 (CYP90C1). Finally, the CYP90D group consisted of BnCYP90_3, BnCYP90_8, BnCYP90_10, BnCYP90_16, and BnCYP90_20. Within this clade, BnCYP90_3/BnCYP90_16 and BnCYP90_8/BnCYP90_20 formed sister branches clustering with AT3G13730 (CYP90D1), while BnCYP90_10 was positioned on a relatively independent branch at the base of this group.
3.4. Collinearity Analysis of CYP90 Gene Family
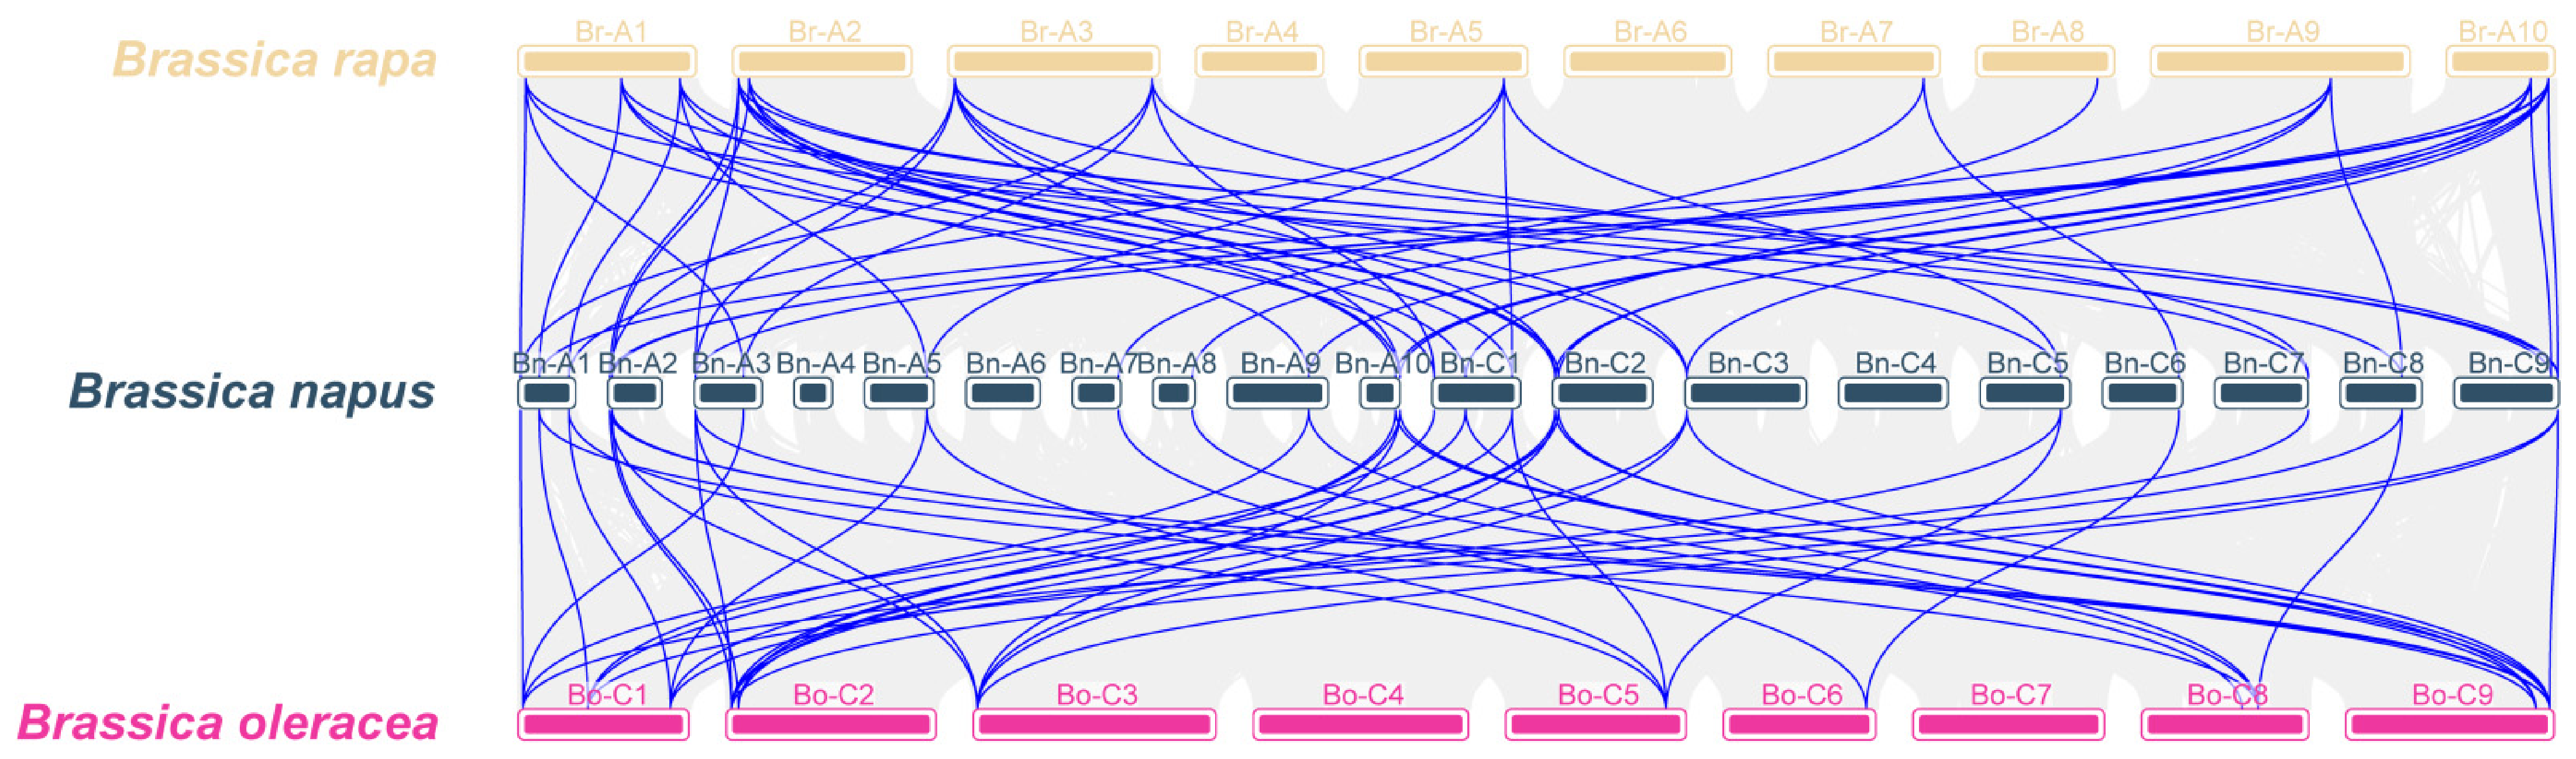
To investigate the evolutionary origin of the
BnCYP90 gene family in
B. napus, interspecific synteny analysis was conducted among
B. napus and its two diploid progenitors,
B. rapa and
B. oleracea. A total of 100 syntenic relationships were identified between the 25
BnCYP90 genes and their
CYP90 homologs in
B. rapa and
B. oleracea (
Figure 3;
Table S2). Specifically, the 25
BnCYP90 genes formed 53 syntenic gene pairs with 13 genes in
B. rapa and 47 syntenic gene pairs with 12 genes in
B. oleracea, indicating extensive syntenic conservation of the
BnCYP90 family between
B. napus and its progenitor species. All 25
BnCYP90 genes had at least one syntenic counterpart in the
B. rapa genome, with each
BnCYP90 gene corresponding to one to three
B. rapa homologs. Except for
BnCYP90_24, the remaining 24
BnCYP90 genes each had at least one syntenic counterpart in the
B. oleracea genome, with one to three homologs identified for each gene. Most
BnCYP90 members exhibited one-to-many syntenic relationships. For example,
BnCYP90_4,
BnCYP90_6,
BnCYP90_13,
BnCYP90_17,
BnCYP90_19, and
BnCYP90_25 were all syntenically related to Bra009126, Bra028751, and Bra005863 in
B. rapa, as well as to BolC2t06210H, BolC3t12828H, and BolC9t59877H in
B. oleracea. In addition,
BnCYP90_1,
BnCYP90_7,
BnCYP90_14, and
BnCYP90_22 shared the same syntenic homologs in the progenitor species, whereas
BnCYP90_2,
BnCYP90_11,
BnCYP90_15, and
BnCYP90_23 also exhibited consistent syntenic correspondence patterns.
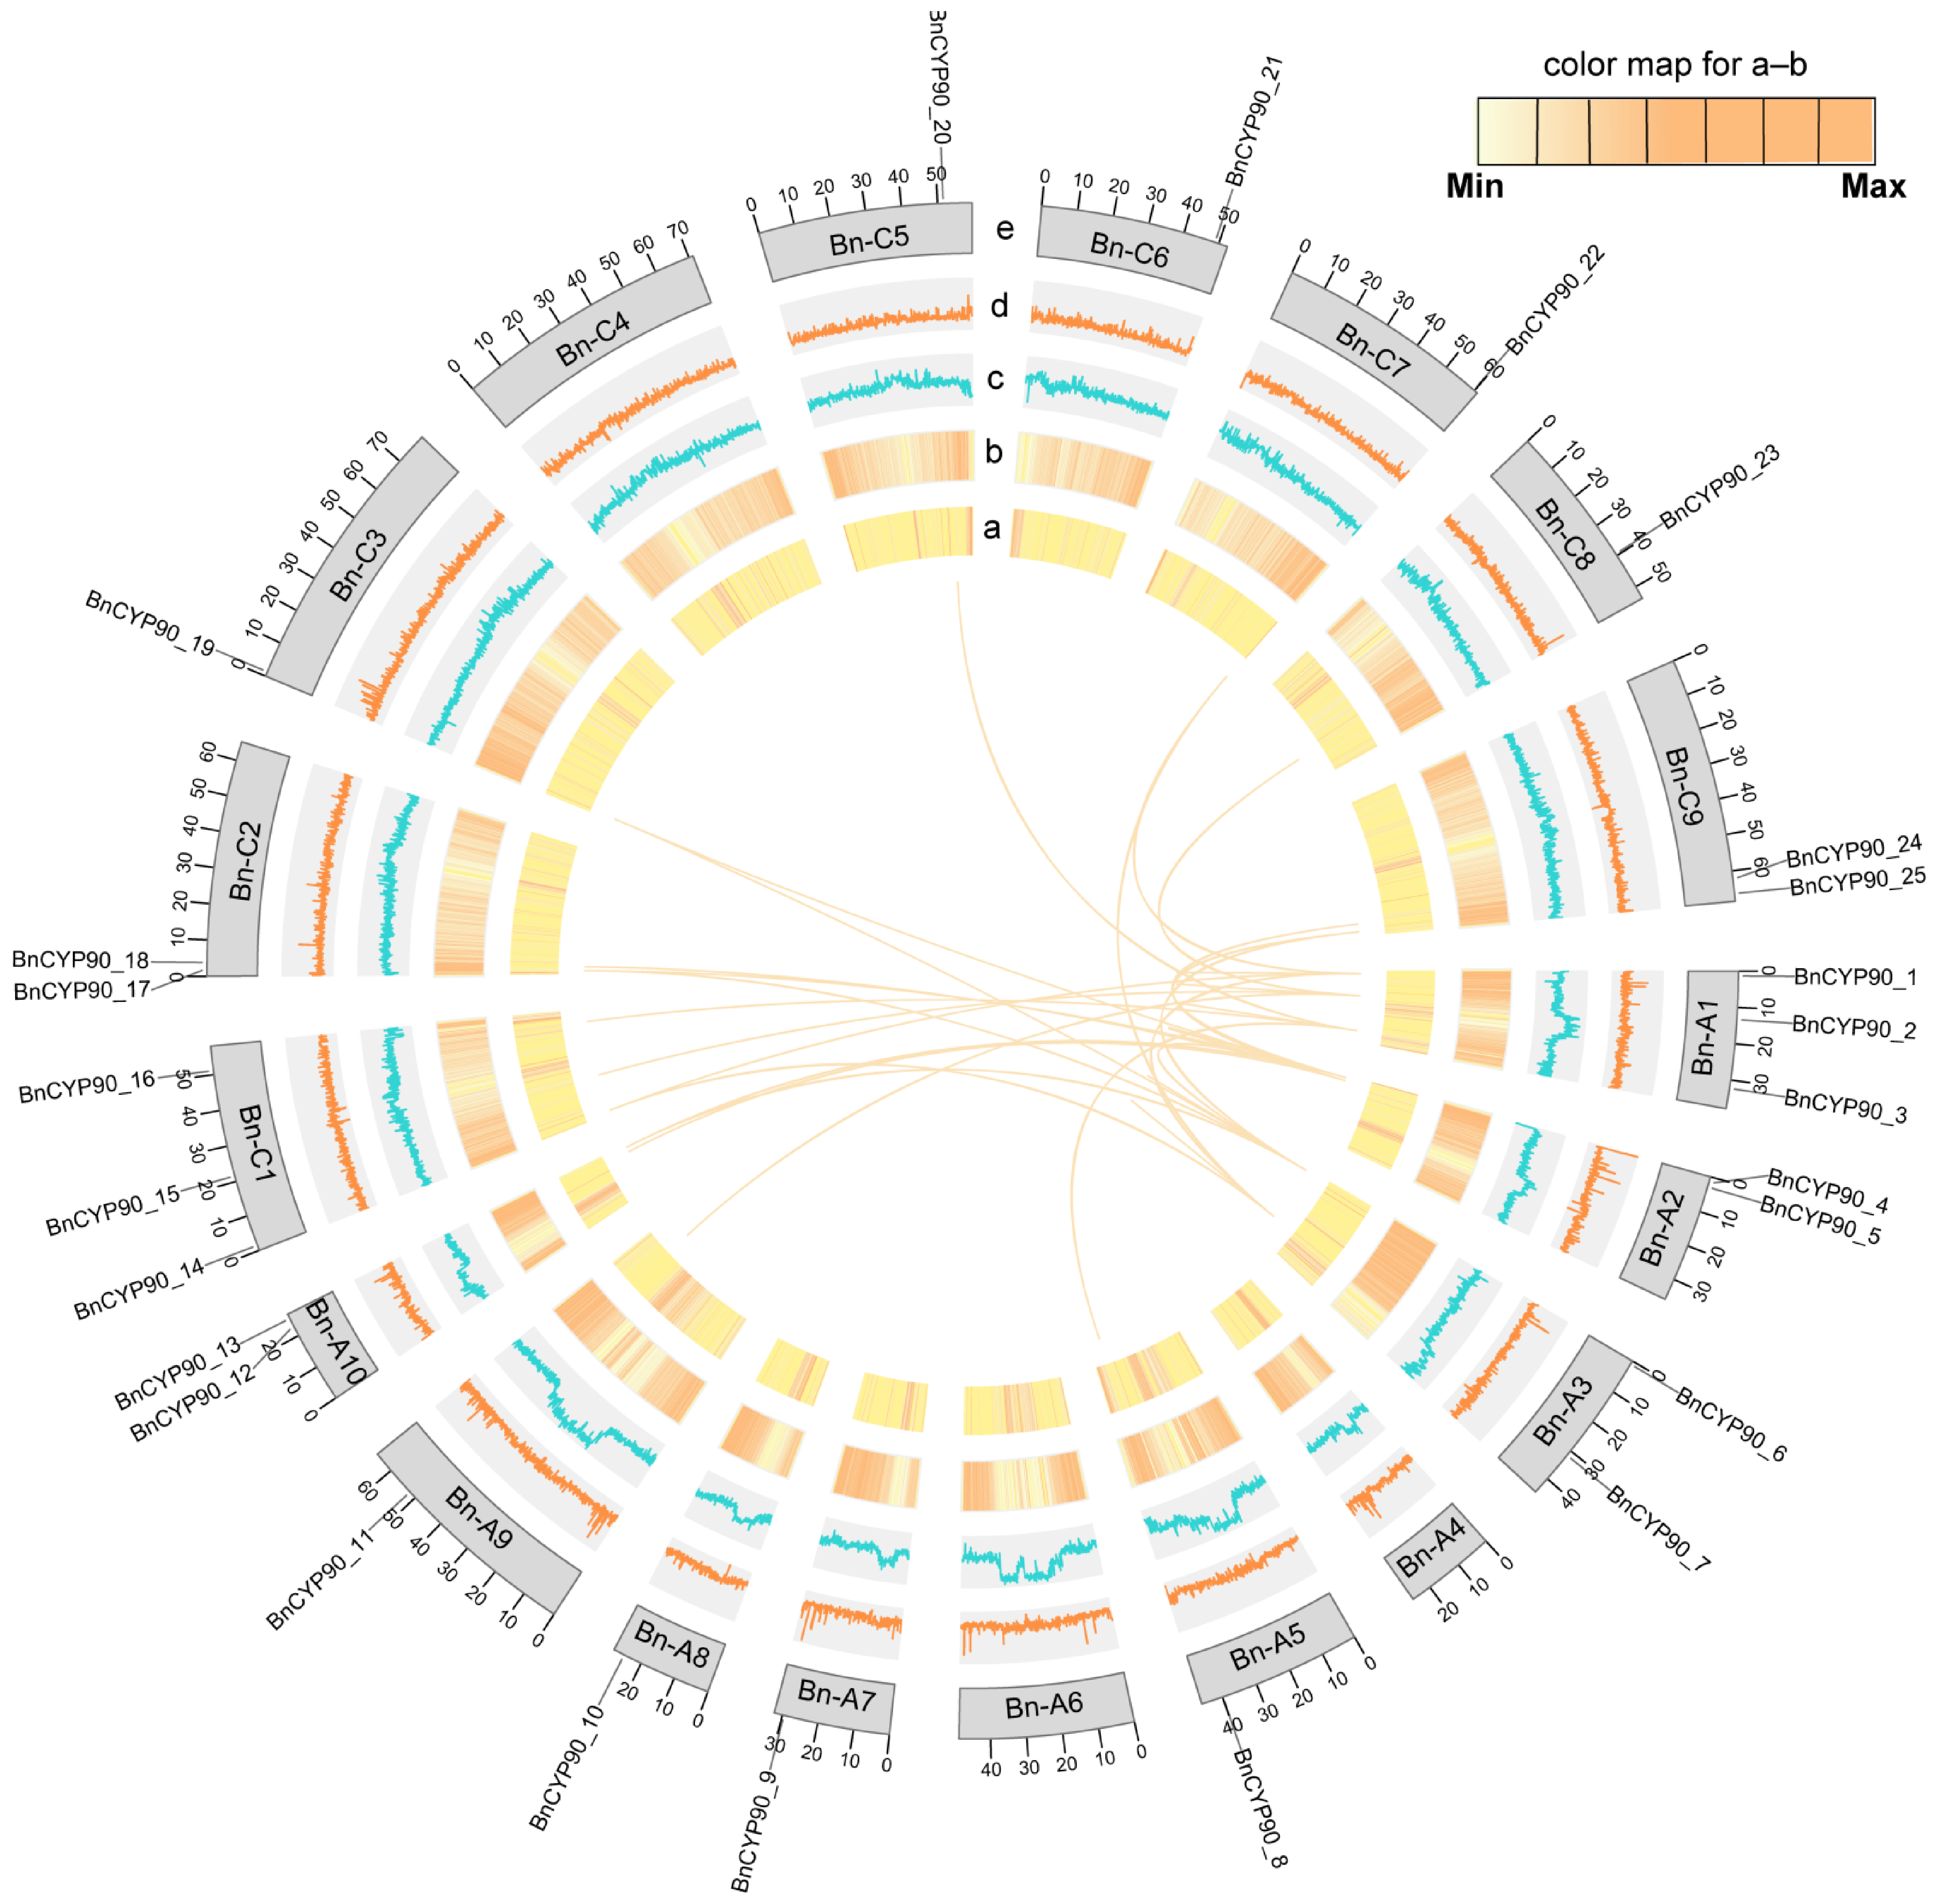
To characterize the duplication and expansion patterns of the
BnCYP90 gene family, intraspecific synteny analysis was performed for the 25
BnCYP90 genes. After removing self-matches and reciprocal duplicate records, 23 nonredundant syntenic gene pairs involving 22
BnCYP90 members were identified (
Figure 4;
Table S3). Among them, 16 syntenic pairs connected the A and C subgenomes, whereas the remaining seven pairs were located within the A subgenome, indicating that the retention of homologous genes between the A and C subgenomes constitutes the major component of syntenic relationships within the
BnCYP90 family. Based on their syntenic relationships, the
BnCYP90 members could be broadly divided into five syntenic groups. The first group comprised
BnCYP90_1,
BnCYP90_7,
BnCYP90_14, and
BnCYP90_22; the second included
BnCYP90_2,
BnCYP90_11,
BnCYP90_15, and
BnCYP90_23; the third consisted of
BnCYP90_3,
BnCYP90_8,
BnCYP90_16, and
BnCYP90_20; the fourth contained
BnCYP90_4,
BnCYP90_6,
BnCYP90_13,
BnCYP90_17,
BnCYP90_19, and
BnCYP90_25; and the fifth included
BnCYP90_5,
BnCYP90_12,
BnCYP90_18, and
BnCYP90_24. Notably,
BnCYP90_4 and
BnCYP90_6 each exhibited syntenic relationships with five other family members, making them the most highly connected genes in the syntenic network and suggesting extensive duplication and retention within their corresponding evolutionary lineages. To evaluate the selective pressure acting on the
BnCYP90 gene family, Ka/Ks analysis was performed on the duplicated gene pairs. Valid Ka/Ks values were obtained for 22 nonredundant gene pairs, ranging from 0.1229 to 0.5775, with all values below 1 (
Table S4). These results indicate that the
BnCYP90 gene family has predominantly undergone purifying selection during evolution. Overall, strong purifying selection may have contributed to maintaining the structural and functional stability of
BnCYP90 family members.
3.5. Analysis of Gene Structure, Conserved Motifs, Domains, and Cis-Regulatory Elements in the BnCYP90 Family
To further characterize the structural features of the
BnCYP90 gene family, the conserved motifs, conserved domains, promoter cis-regulatory elements, and gene structures of the 25
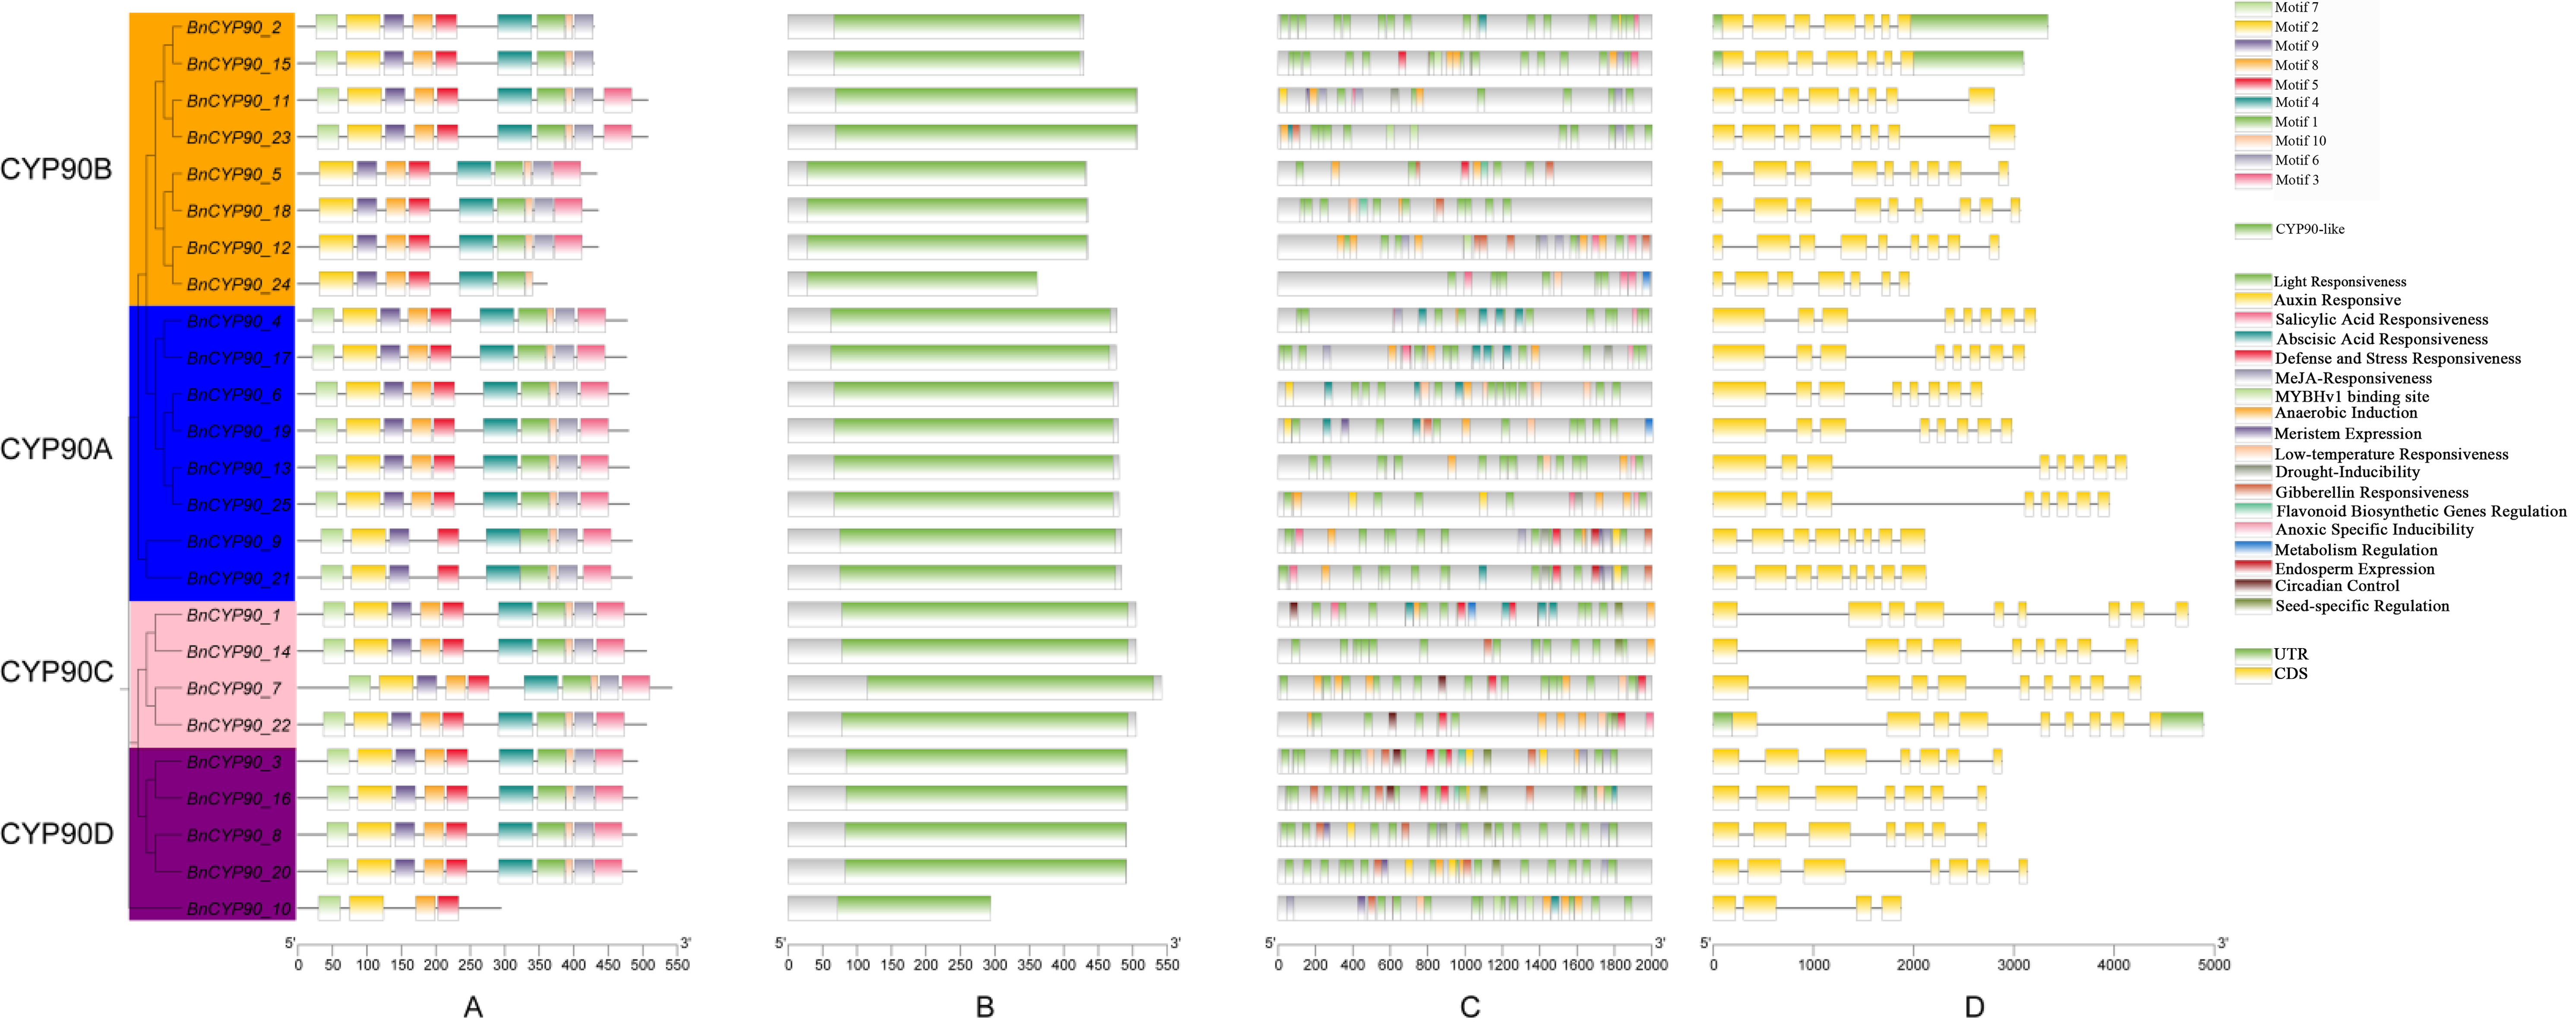
BnCYP90 members were comprehensively analyzed (
Figure 5). A total of 10 conserved motifs were identified. Most BnCYP90 proteins exhibited similar motif compositions and arrangements, and members within the same phylogenetic group generally showed more consistent motif patterns (
Figure 5A). A small number of proteins differed in motif number or organization. Notably,
BnCYP90_10 displayed a relatively simple motif composition, suggesting that some structural divergence may have occurred among
BnCYP90 family members despite their overall conservation. Conserved domain analysis showed that all BnCYP90 proteins contained the characteristic
CYP90-like domain, further supporting their classification as members of the cytochrome P450 family (
Figure 5B).
Analysis of the 2000 bp regions upstream of the start codons revealed abundant cis-regulatory elements in the promoters of the
BnCYP90 genes (
Figure 5C;
Table S5). Light-responsive elements, including the G-box, Box 4, GT1-motif, TCT-motif, GATA-motif, and AE-box, were widely distributed across most
BnCYP90 promoters, suggesting that the transcription of these genes may be influenced by light conditions. Multiple hormone-responsive elements were also identified. ABREs are associated with abscisic acid signaling; CGTCA- and TGACG-motifs are related to methyl jasmonate responsiveness; TCA-elements are associated with salicylic acid responsiveness; TGA elements and AuxRR-core motifs are related to auxin responsiveness; and P-box, GARE-motif, and TATC-box elements are associated with gibberellin responsiveness. These elements suggest that
BnCYP90 genes may be integrated into multiple phytohormone signaling pathways.
Several stress-responsive elements were also detected, including MBS elements associated with drought inducibility, LTR elements related to low-temperature responsiveness, ARE and GC motifs associated with anaerobic or anoxic induction, and TC-rich repeats related to defense and general stress responses. In addition, CAT-box, circadian, RY-element, and GCN4_motif elements were identified in several promoters, indicating potential involvement in meristem expression, circadian regulation, seed-specific expression, and endosperm-specific expression, respectively. The types, numbers, and distributions of these elements varied among
BnCYP90 genes, indicating that individual family members may respond differently to environmental, hormonal, and developmental signals. Detailed information on the names, conserved sequences, positions, reference species, and functional annotations of all predicted cis-regulatory elements is provided in
Table S5. Nevertheless, these predicted elements represent potential regulatory sites, and their functions require further experimental validation.
Gene structure analysis revealed variations among
BnCYP90 family members in gene length, exon number, and intron distribution, although members within the same phylogenetic group generally displayed similar exon–intron structures (
Figure 5D). The 25
BnCYP90 genes contained 4–9 exons and 3–8 introns. Several members of the
CYP90C group contained relatively long genomic sequences and more exons, whereas some
CYP90A and
CYP90B members exhibited more compact gene structures. To further assess whether these structural differences involved changes at splice junctions, the 5′ splice donor and 3′ splice acceptor sites of all
BnCYP90 introns were examined using the ZS11 reference genome sequence and its corresponding annotation. A total of 171 introns were analyzed, and all contained the canonical GT–AG splice-junction dinucleotides. No GC–AG, AT–AC, or other noncanonical splice-site types were detected (
Tables S5 and S8). These findings indicate that although
BnCYP90 genes differ in exon number, intron number, and intron length, their core splice-site signals are highly conserved. Therefore, the observed gene structural differences primarily represent diversification in exon–intron organization rather than changes in the canonical splice-site type.
3.6. Protein–Protein Interaction Network Analysis
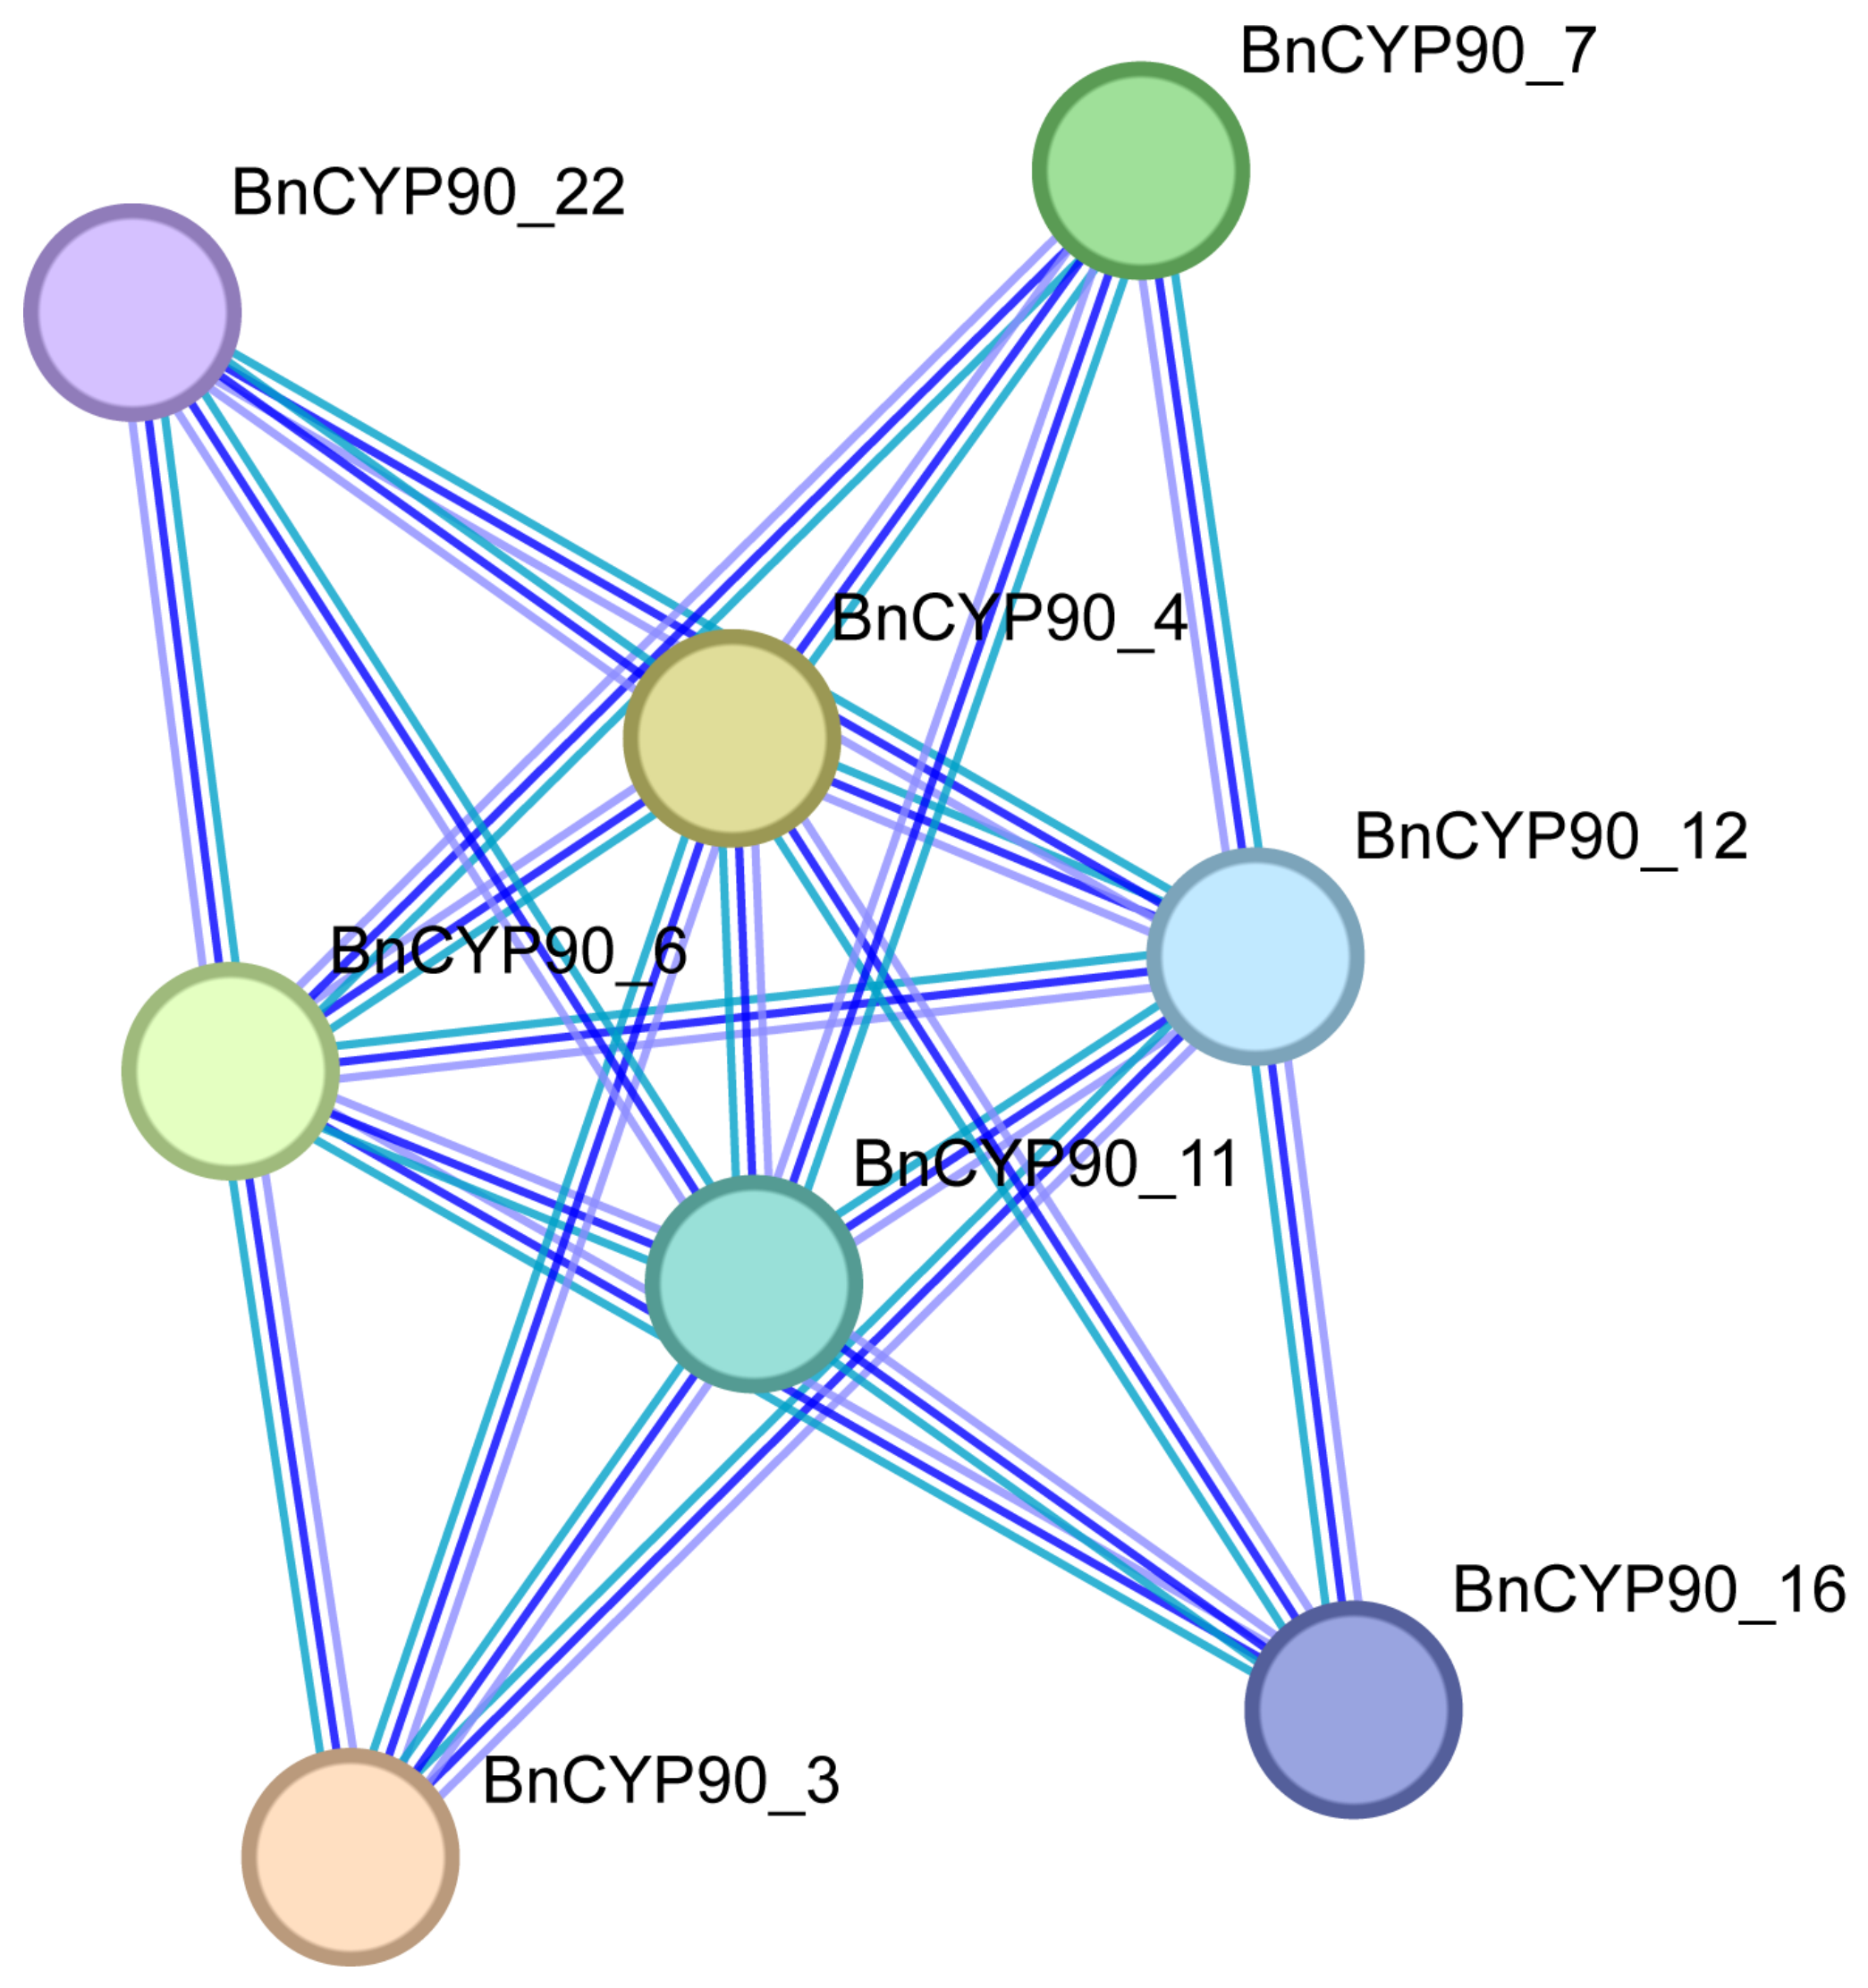
To investigate potential functional associations among
BnCYP90 family members, a protein–protein interaction network was predicted. The results showed that
BnCYP90_3,
BnCYP90_4,
BnCYP90_6,
BnCYP90_7,
BnCYP90_11,
BnCYP90_12,
BnCYP90_16, and
BnCYP90_22 formed a highly interconnected network (
Figure 6). Among them,
BnCYP90_4, BnCYP90_6, and
BnCYP90_11 occupied relatively central positions and showed predicted interactions with multiple family members, suggesting that they may play important roles in the functional network of the
BnCYP90 family. In contrast,
BnCYP90_3,
BnCYP90_7,
BnCYP90_16, and
BnCYP90_22 were mainly located at the periphery of the network but remained connected to the central proteins through multiple predicted interactions.
3.7. Analysis of the microRNA-Mediated Post-Transcriptional Regulatory Network of BnCYP90 Genes
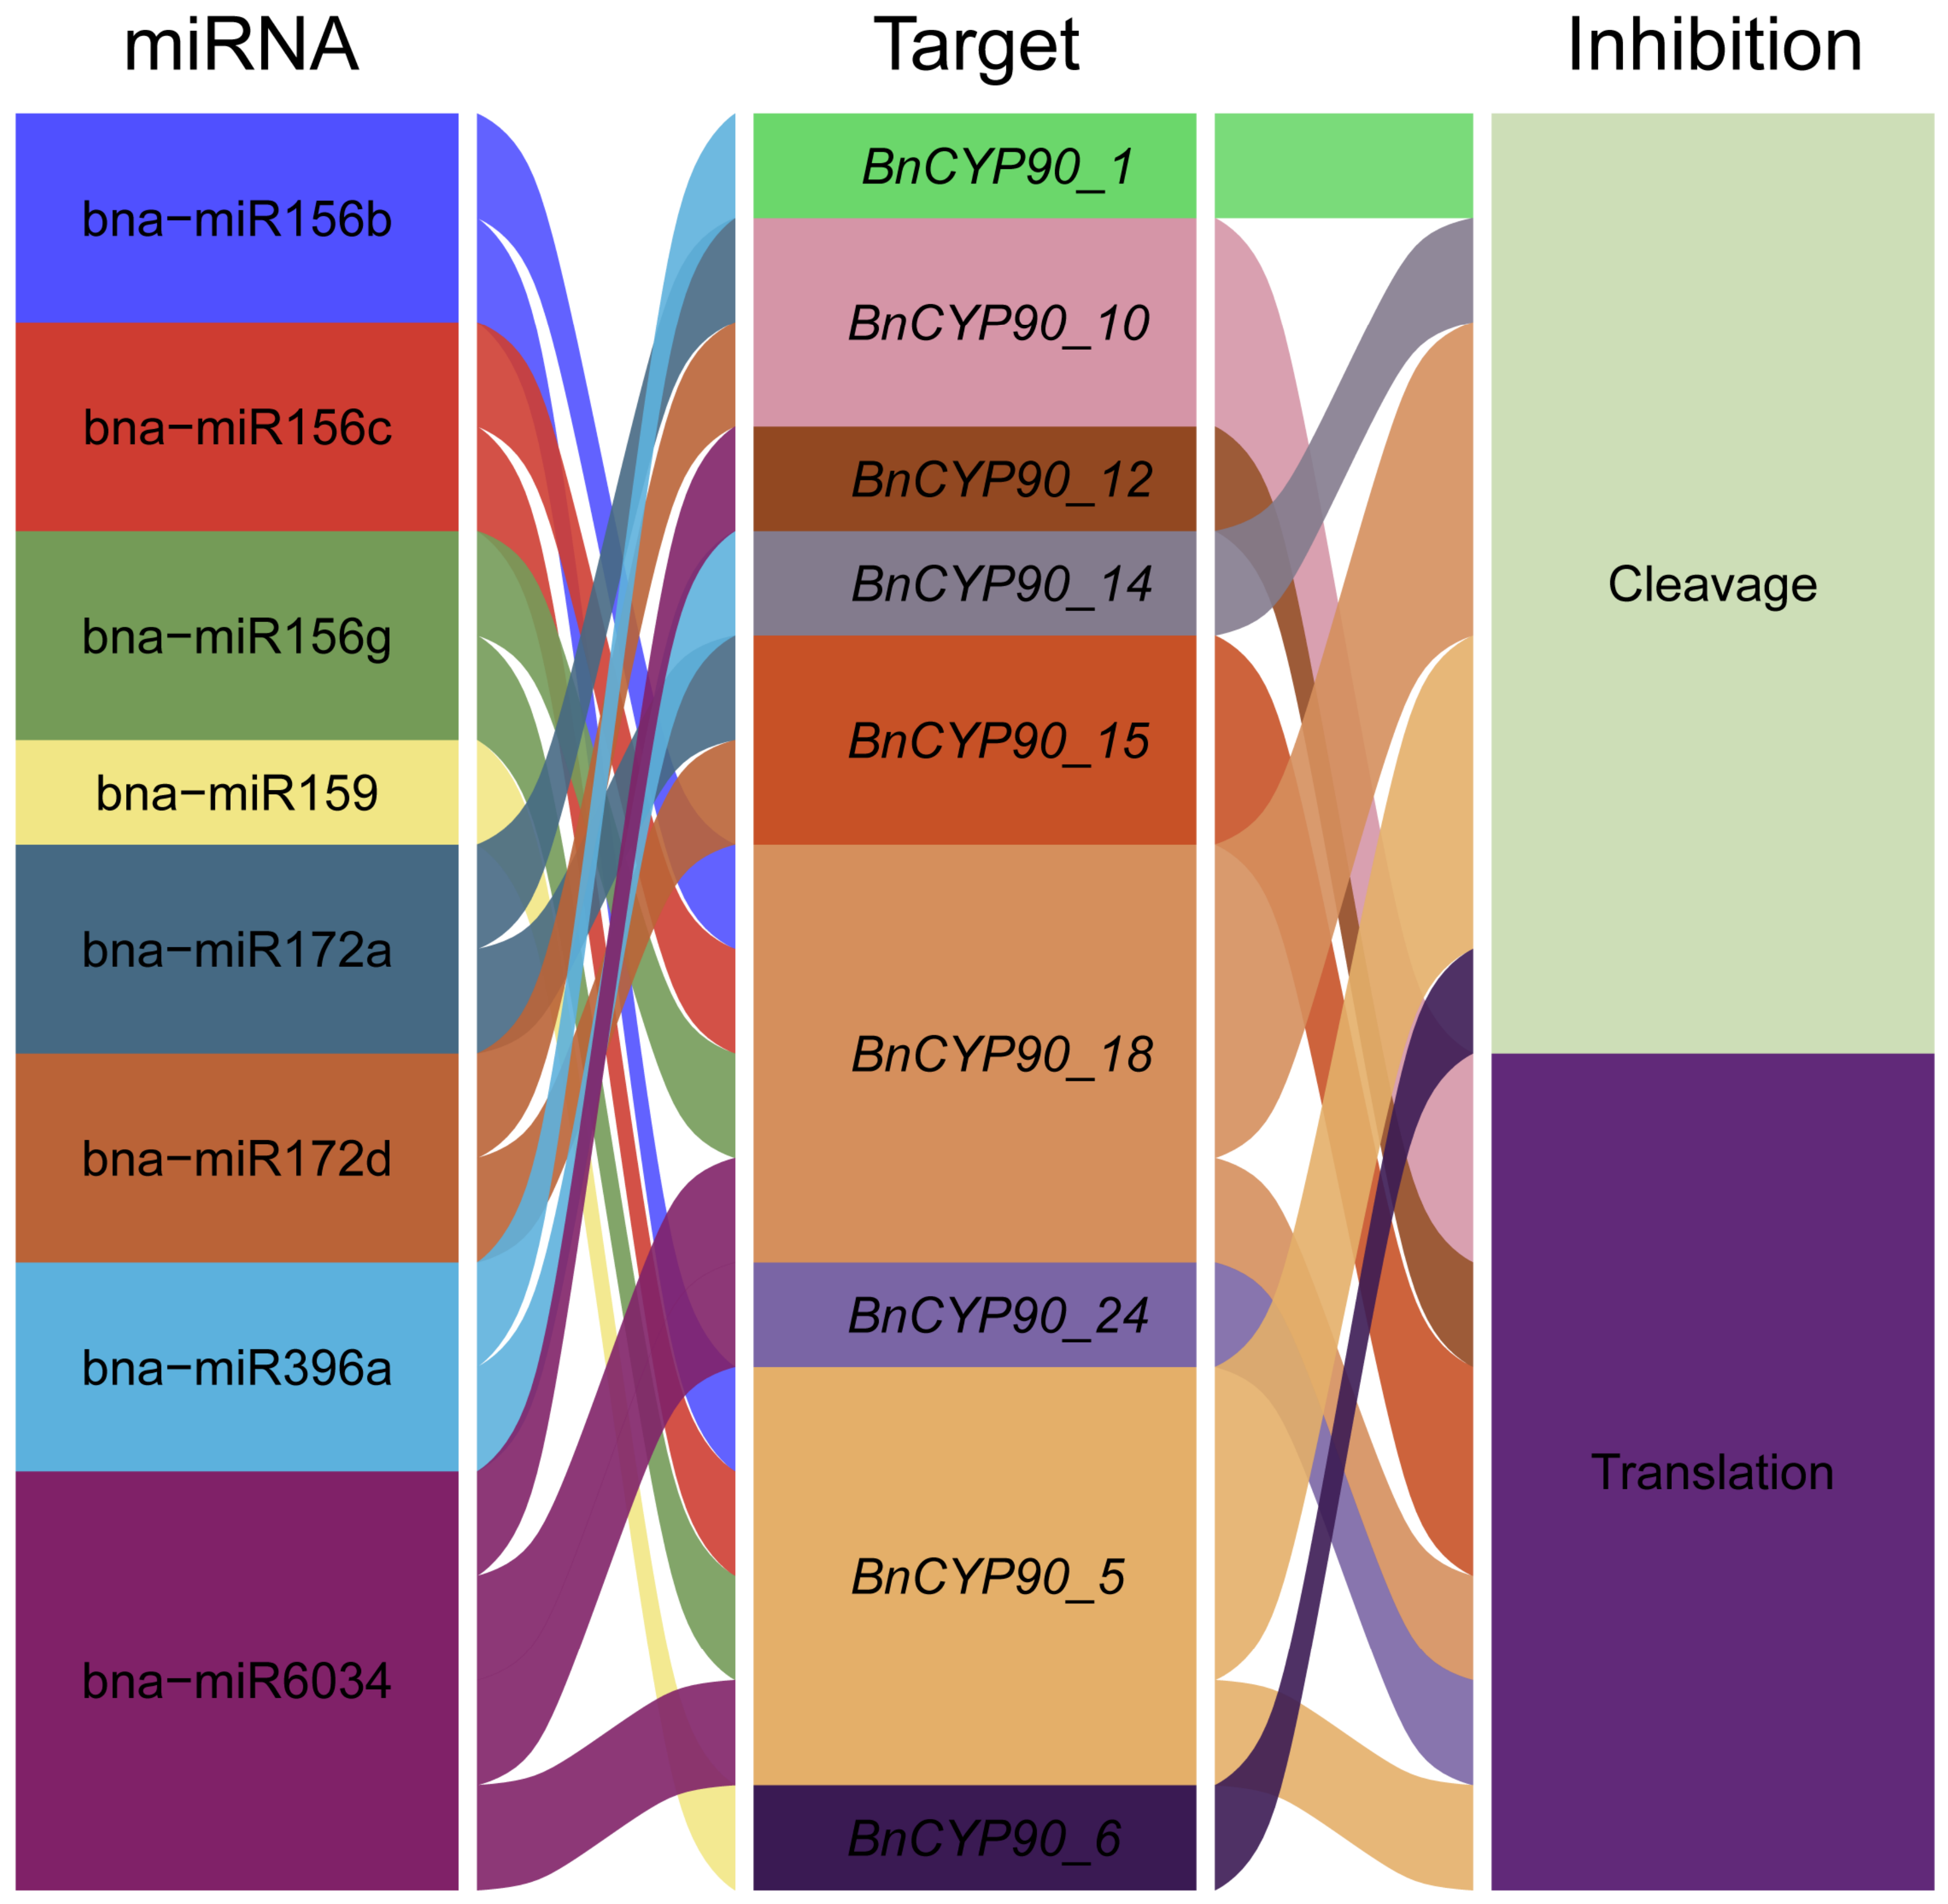
To investigate the potential post-transcriptional regulatory mechanisms of the
BnCYP90 gene family, miRNA–target relationships were predicted. Eight miRNAs, including bna-miR156b, bna-miR156c, bna-miR156g, bna-miR159, bna-miR172a, bna-miR172d, bna-miR396a, and bna-miR6034, were predicted to form 17 regulatory relationships with nine
BnCYP90 genes (
Figure 7,
Table S9). Among these genes,
BnCYP90_5 and
BnCYP90_18 had the largest numbers of predicted miRNA regulators, each being targeted by four miRNAs.
BnCYP90_10 and
BnCYP90_15 were each targeted by two miRNAs, whereas the remaining genes were each targeted by one miRNA. bna-miR6034 targeted the greatest number of
BnCYP90 genes, suggesting that it may play a relatively broad role in the post-transcriptional regulation of this gene family. Regarding the predicted modes of inhibition, nine miRNA–target relationships were mediated through mRNA cleavage, whereas eight involved translational inhibition, indicating that
BnCYP90 genes may be regulated through both mechanisms.
3.8. Analysis of Single Nucleotide Polymorphism (SNP) Variations in the BnCYP90 Gene Family
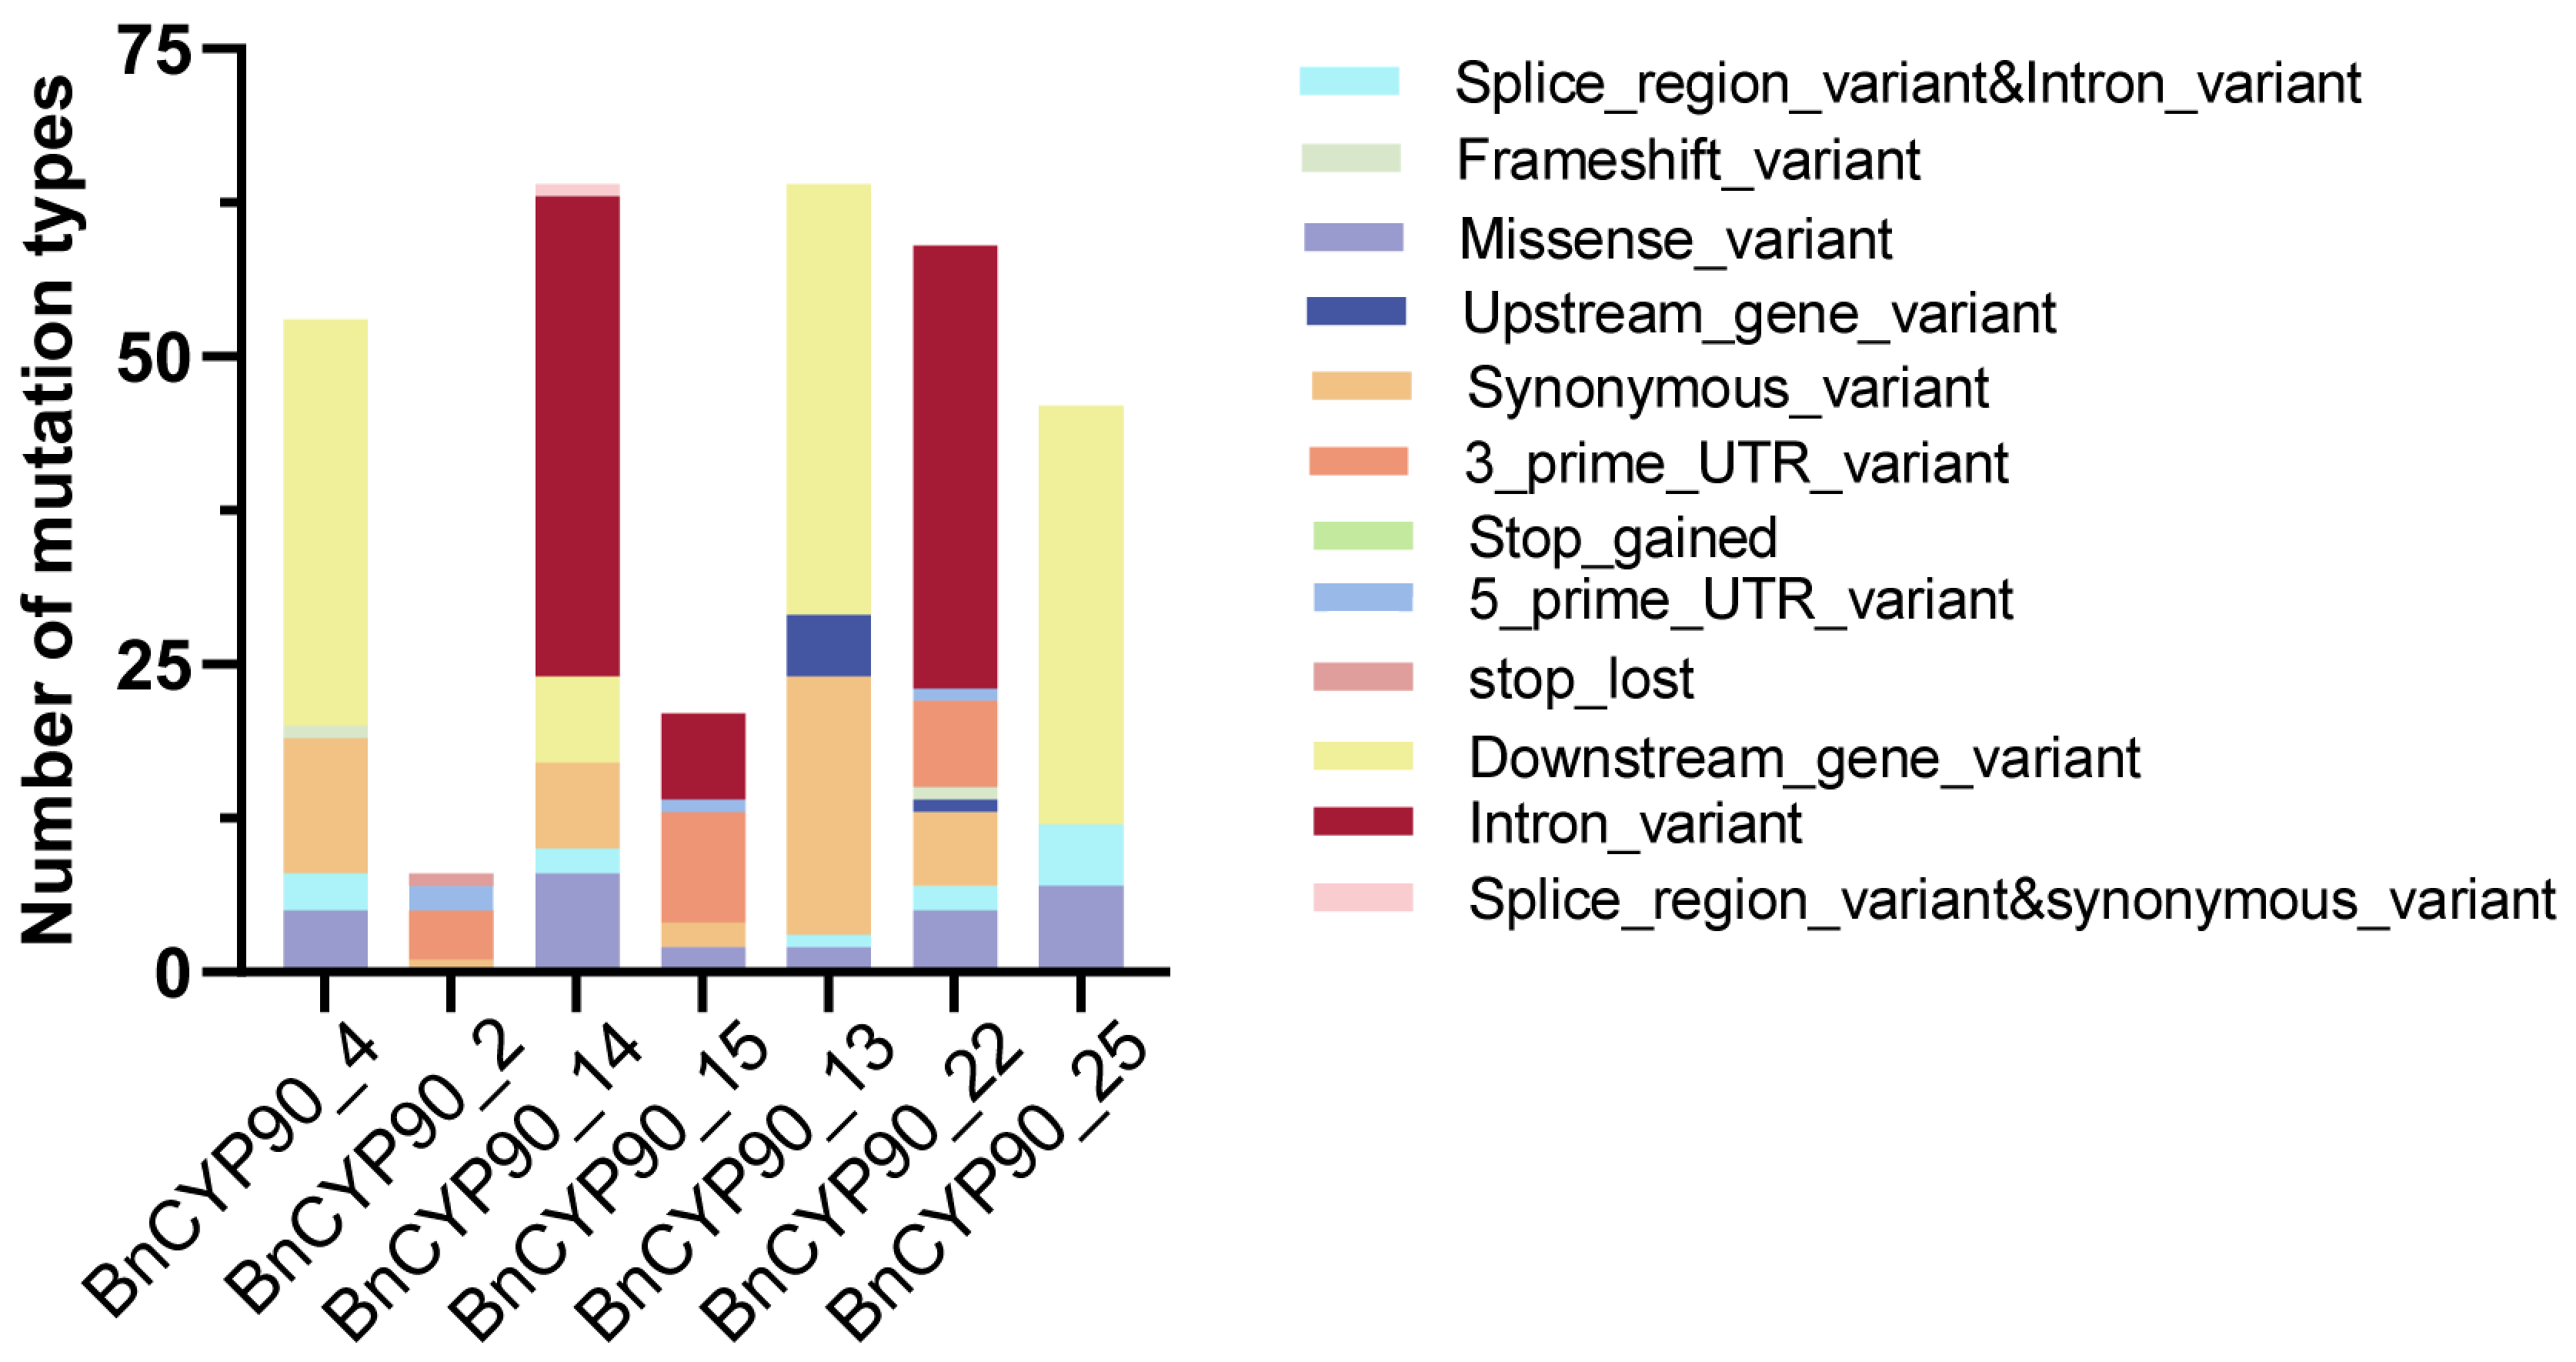
To characterize the genetic variation in the
BnCYP90 gene family, sequence variants within the
BnCYP90 genes were analyzed across a natural population of
B.
napus. Multiple types of variants were identified, including intronic, downstream, synonymous, missense, upstream, untranslated region (UTR), and splice-region variants (
Figure 8). Clear differences were observed among genes in both the number and composition of variants.
BnCYP90_13 and
BnCYP90_14 contained relatively large numbers of variants, followed by
BnCYP90_22,
BnCYP90_4, and
BnCYP90_25, whereas
BnCYP90_2 contained the fewest. Overall, intronic and downstream variants accounted for relatively large proportions. Missense, frameshift, and stop codon-related variants were also detected in several genes, indicating substantial differences in the level of genetic diversity among
BnCYP90 family members.
Further analysis focused on an SNP located at position 66,297,283 on chromosome C09 within
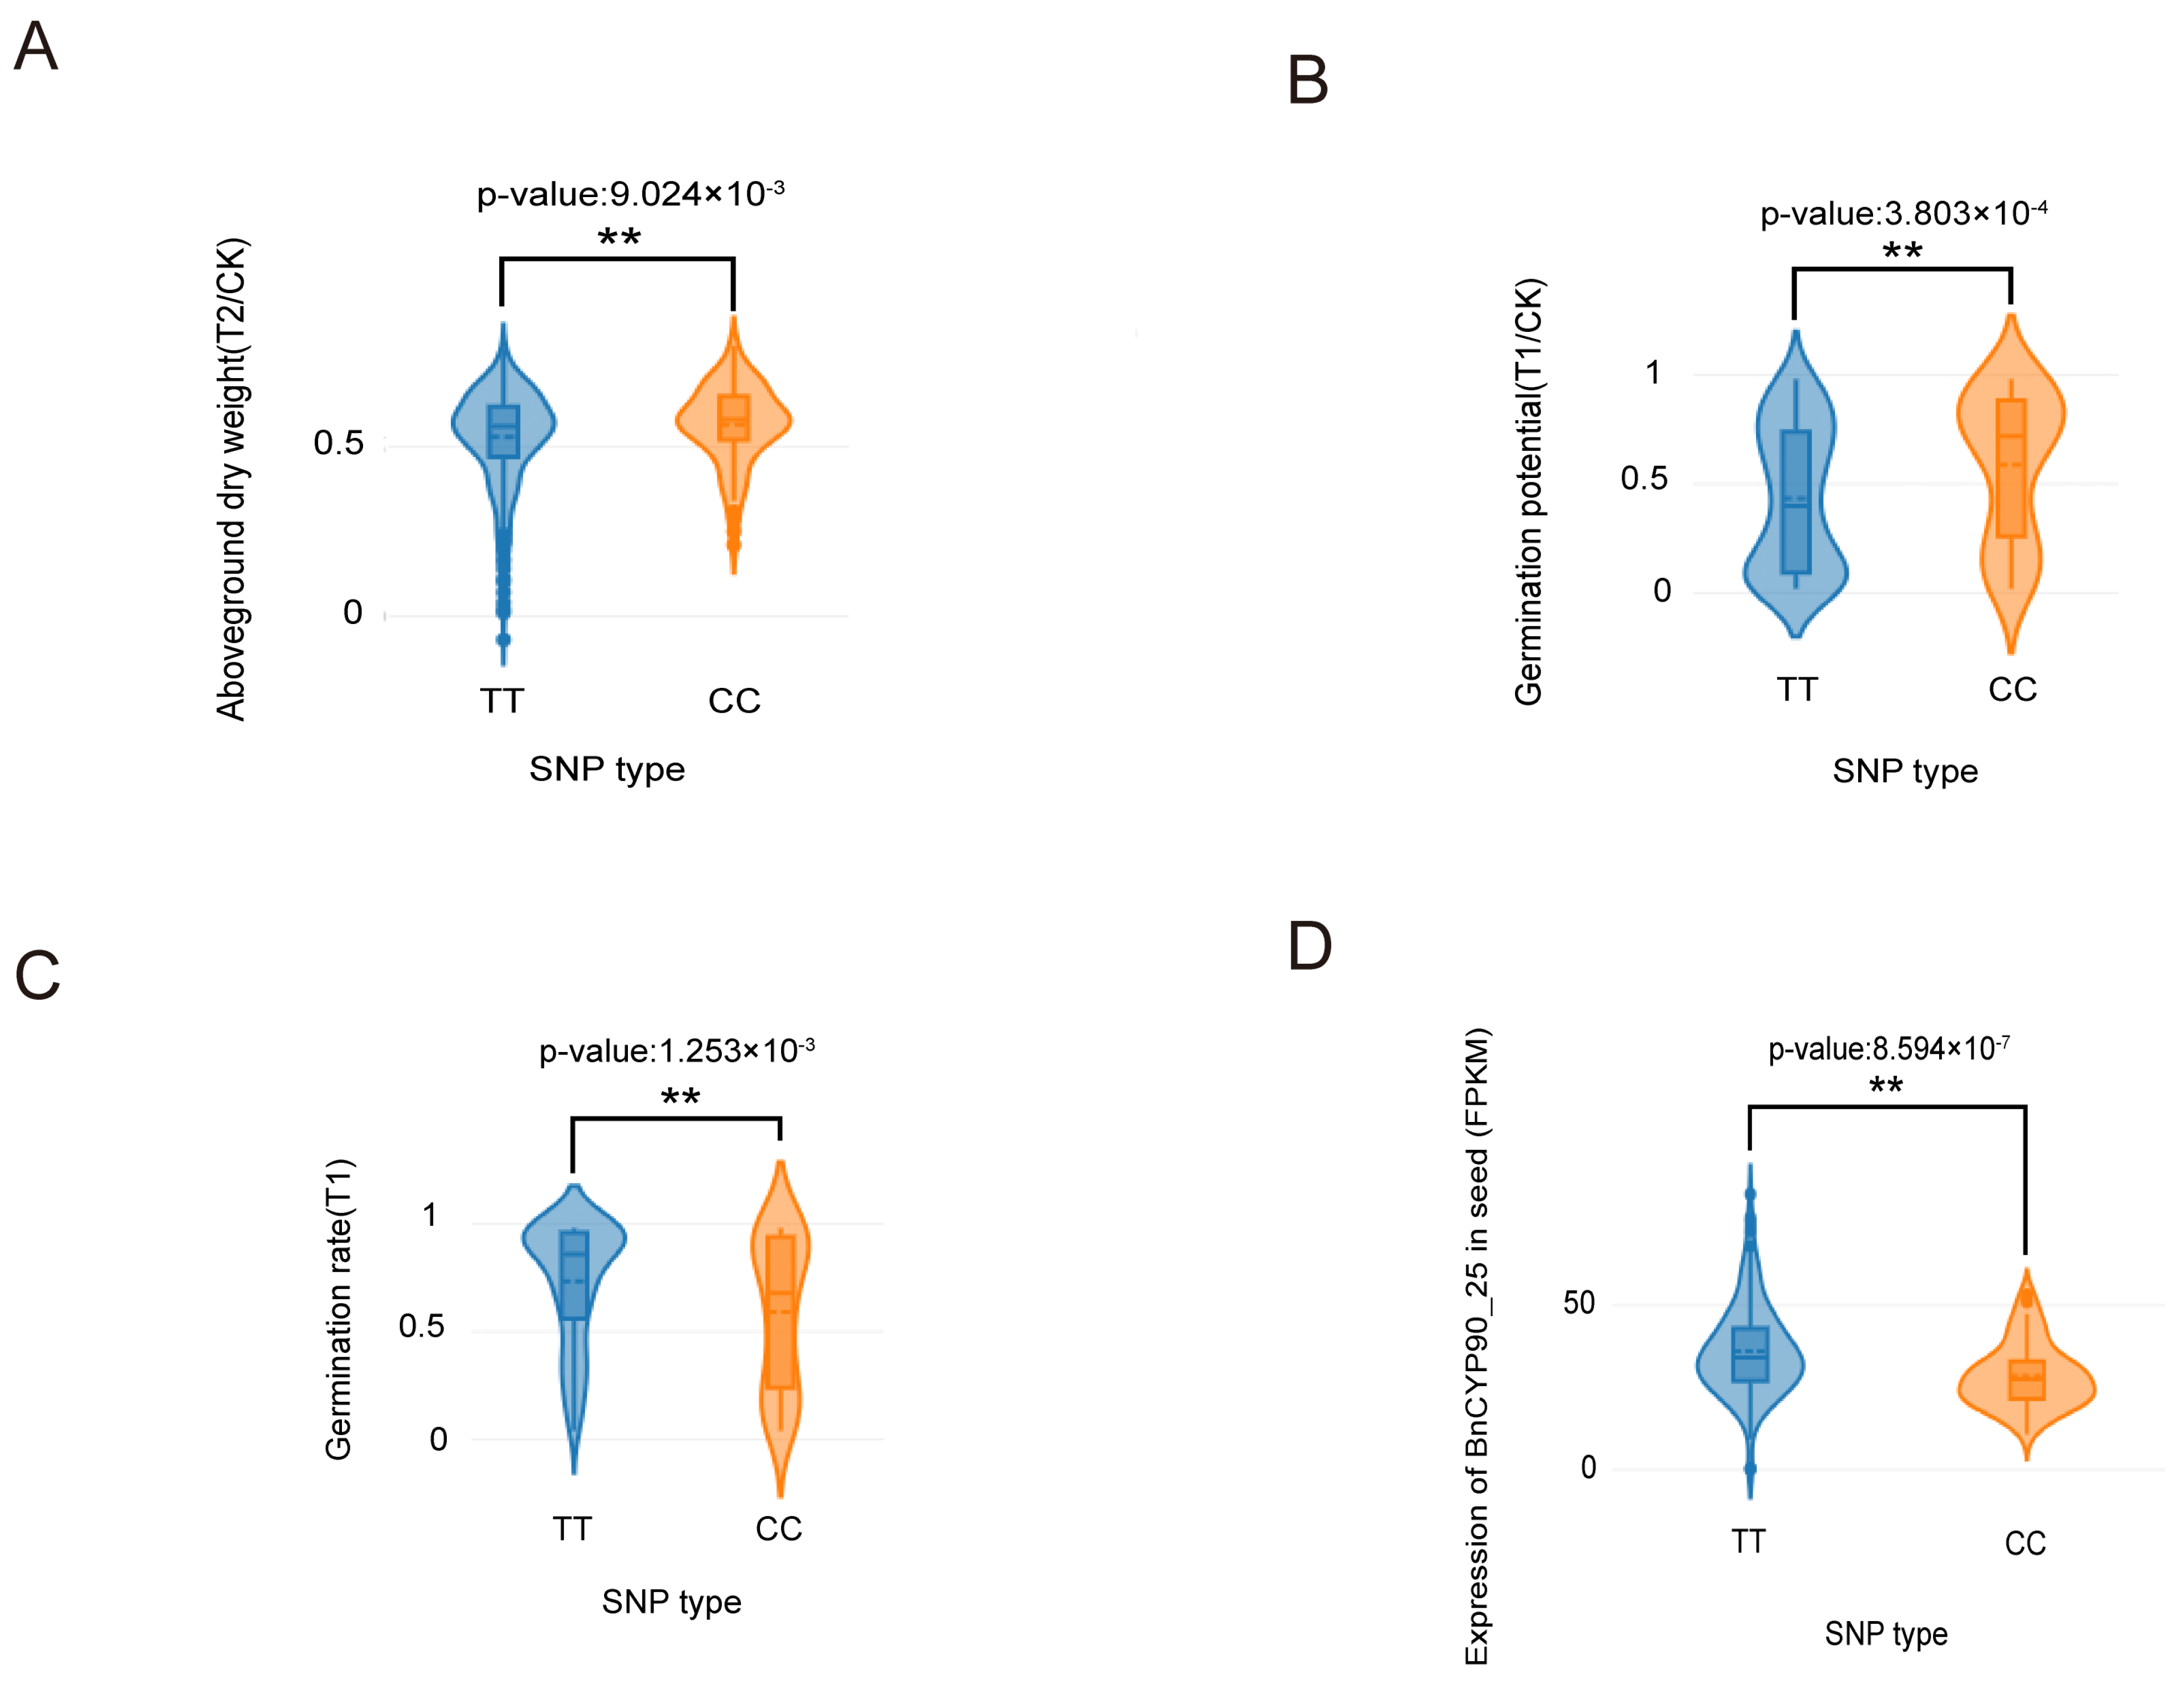
BnCYP90_25. This C/T polymorphism was annotated as a missense variant with a moderate predicted functional impact. Association analysis revealed significant differences between the TT and CC genotypes in salt stress-responsive traits and
BnCYP90_25 expression (
Figure 9). Here, T/CK represents the ratio of the trait value under salt treatment (T) to that under the control condition (CK). Accessions carrying the CC genotype exhibited a significantly higher T/CK ratio for aboveground dry weight than those carrying the TT genotype (
p = 9.024 × 10
−3), indicating greater maintenance of aboveground biomass relative to the control under salt stress. The CC genotype also showed a significantly higher T/CK ratio for germination potential (
p = 3.803 × 10
−4). In contrast, under salt stress, the germination rate of accessions carrying the TT genotype was significantly higher than that of accessions carrying the CC genotype (
p = 1.253 × 10
−3). In addition,
BnCYP90_25 expression in seeds was significantly higher in the TT genotype than in the CC genotype (
p = 8.594 × 10
−7). These results indicate that the missense SNP at C09:66,297,283 is significantly associated with variation in
BnCYP90_25 expression and with genotype-dependent salt stress responses during seed germination and seedling growth.
3.9. Transcriptome Expression Profiling of BnCYP90 Genes Under Abiotic Stresses
To investigate the tissue-specific expression characteristics of the
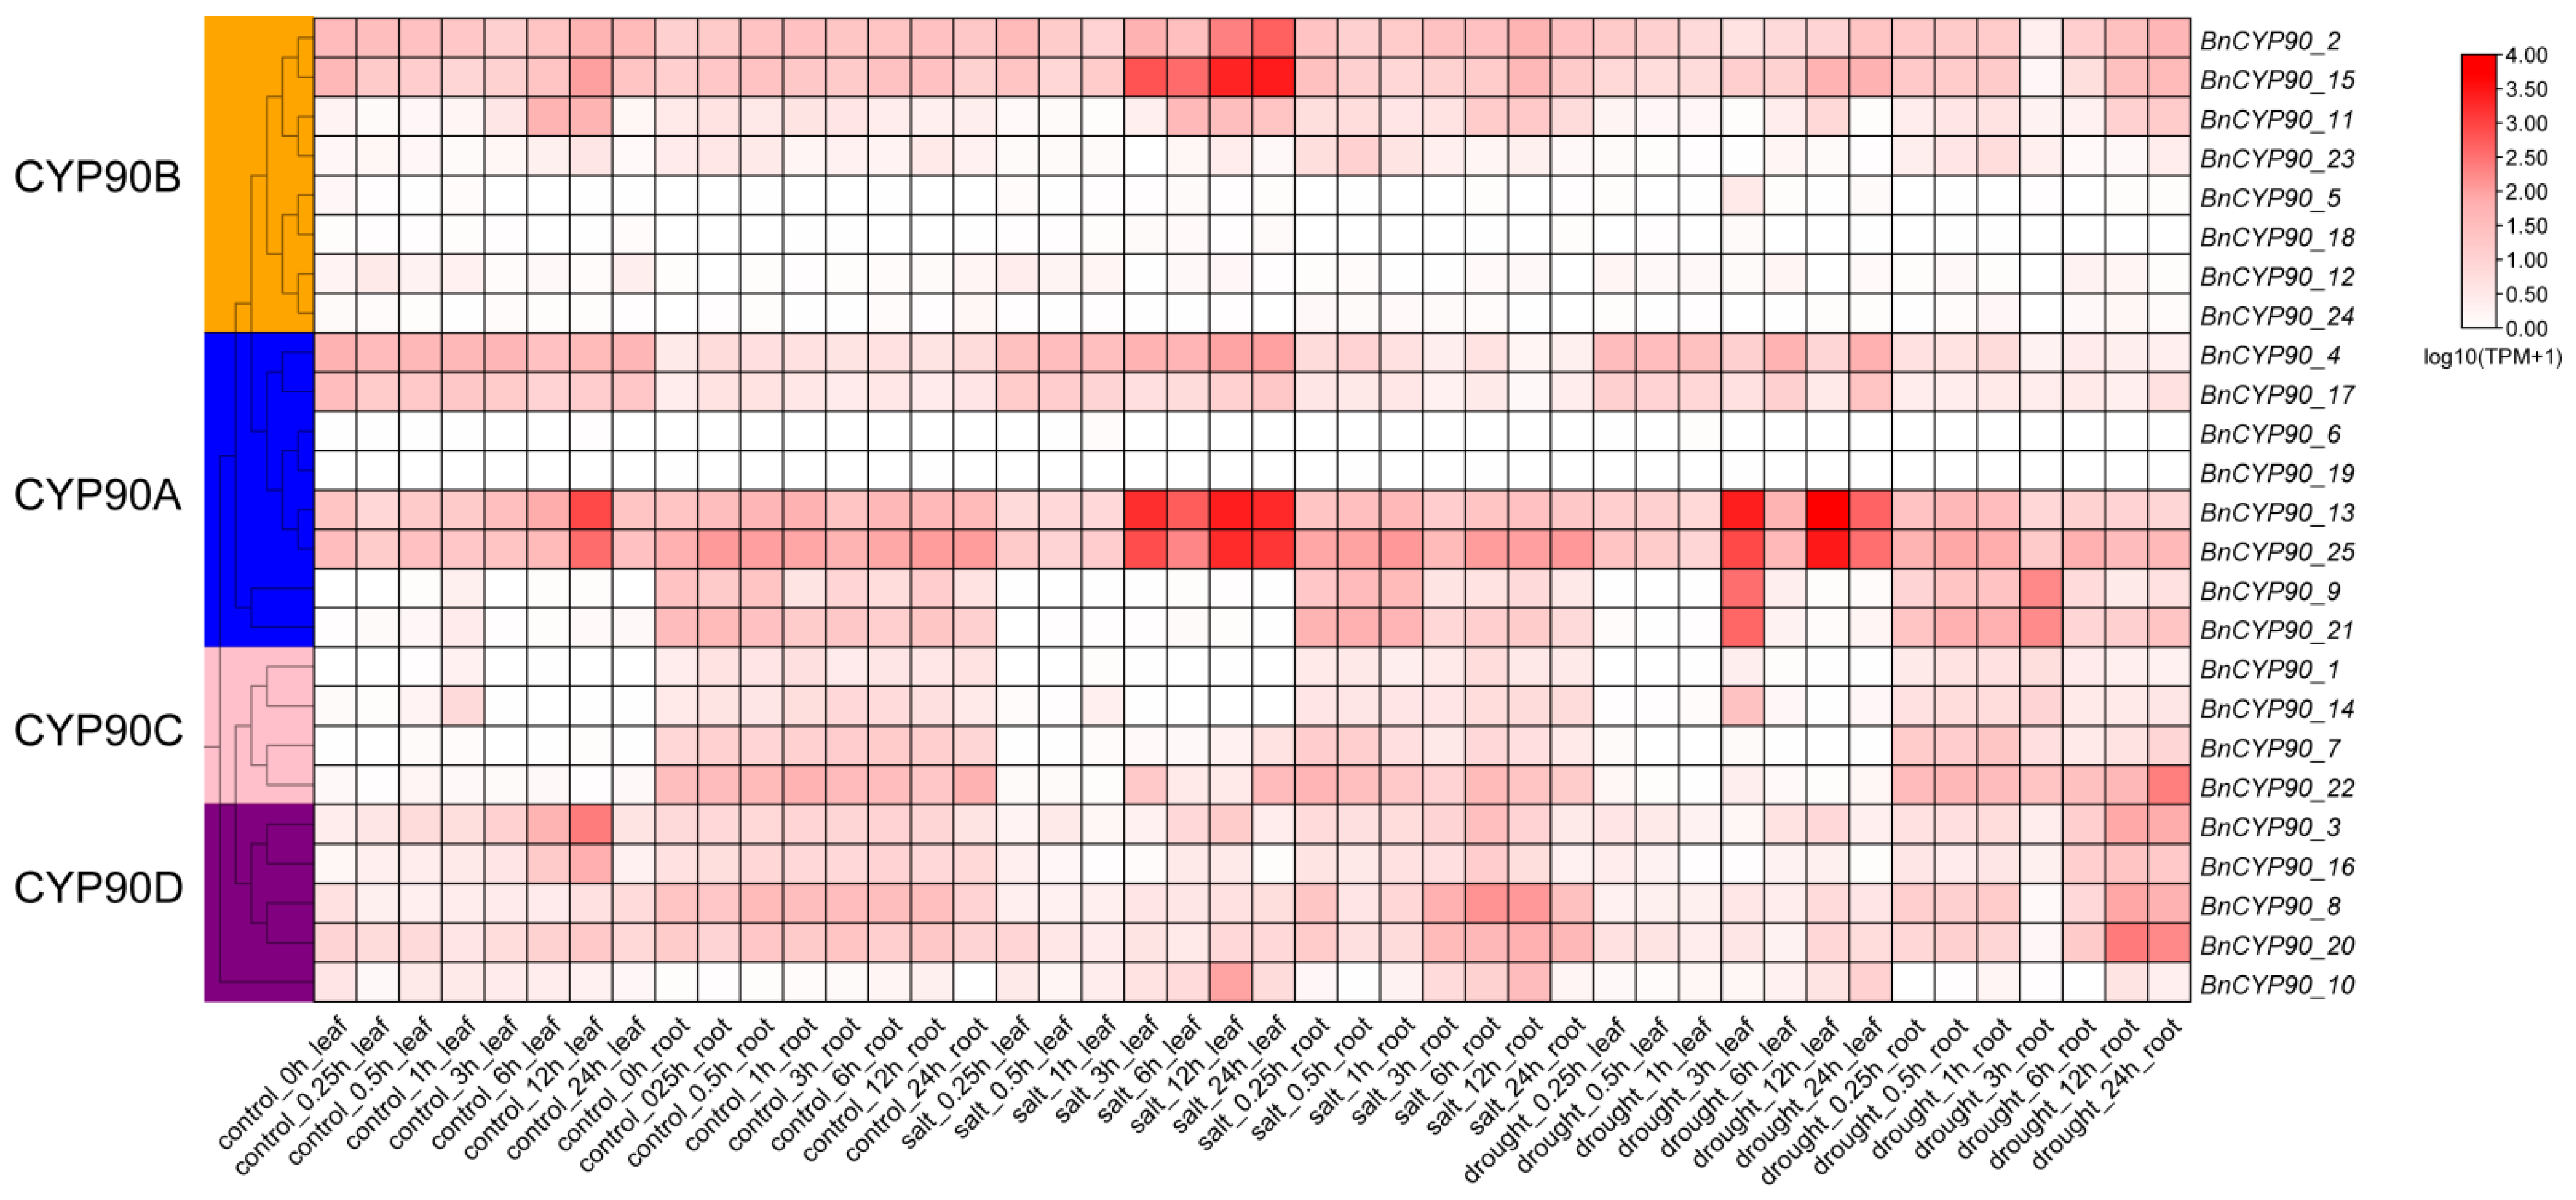
BnCYP90 gene family and its responses to abiotic stress, the transcript levels of 25 BnCYP90 genes were compared in leaves and roots at different treatment time points (
Figure 10). Overall, BnCYP90 family members exhibited distinct tissue-specific and stress-responsive expression patterns, while several genes within the same phylogenetic group showed similar expression profiles.
Within the CYP90B group, BnCYP90_2 and BnCYP90_15 maintained relatively high expression levels in control leaves and were further upregulated under salt stress, with BnCYP90_15 showing the strongest induction in salt-treated leaves. The remaining members of this group exhibited generally lower expression levels across the treatments. In the CYP90A group, BnCYP90_13 and BnCYP90_25 showed relatively high baseline expression in leaves, with clear time-dependent induction under both salt and drought stress. Conversely, BnCYP90_9 and BnCYP90_21 were predominantly expressed in roots under normal conditions but also exhibited induction in leaves under drought stress. Other members, including BnCYP90_4, BnCYP90_17, BnCYP90_6, and BnCYP90_19, were expressed at relatively low levels in most samples. Members of the CYP90C group (BnCYP90_1, BnCYP90_14, BnCYP90_7, and BnCYP90_22) generally exhibited low expression levels in leaves but maintained relatively higher baseline expression in roots. In particular, BnCYP90_22 was noticeably upregulated in roots during the later stages of drought stress. In the CYP90D group, BnCYP90_3, BnCYP90_16, and BnCYP90_8 showed moderate expression in control leaves, whereas BnCYP90_20 and BnCYP90_10 were mainly expressed in roots. Notably, BnCYP90_20 was markedly upregulated in roots during the later stages of both salt and drought stress.
3.10. Co-Expression Network Analysis and Identification of Hub Genes Associated with BnCYP90 Genes
To identify co-expression modules associated with
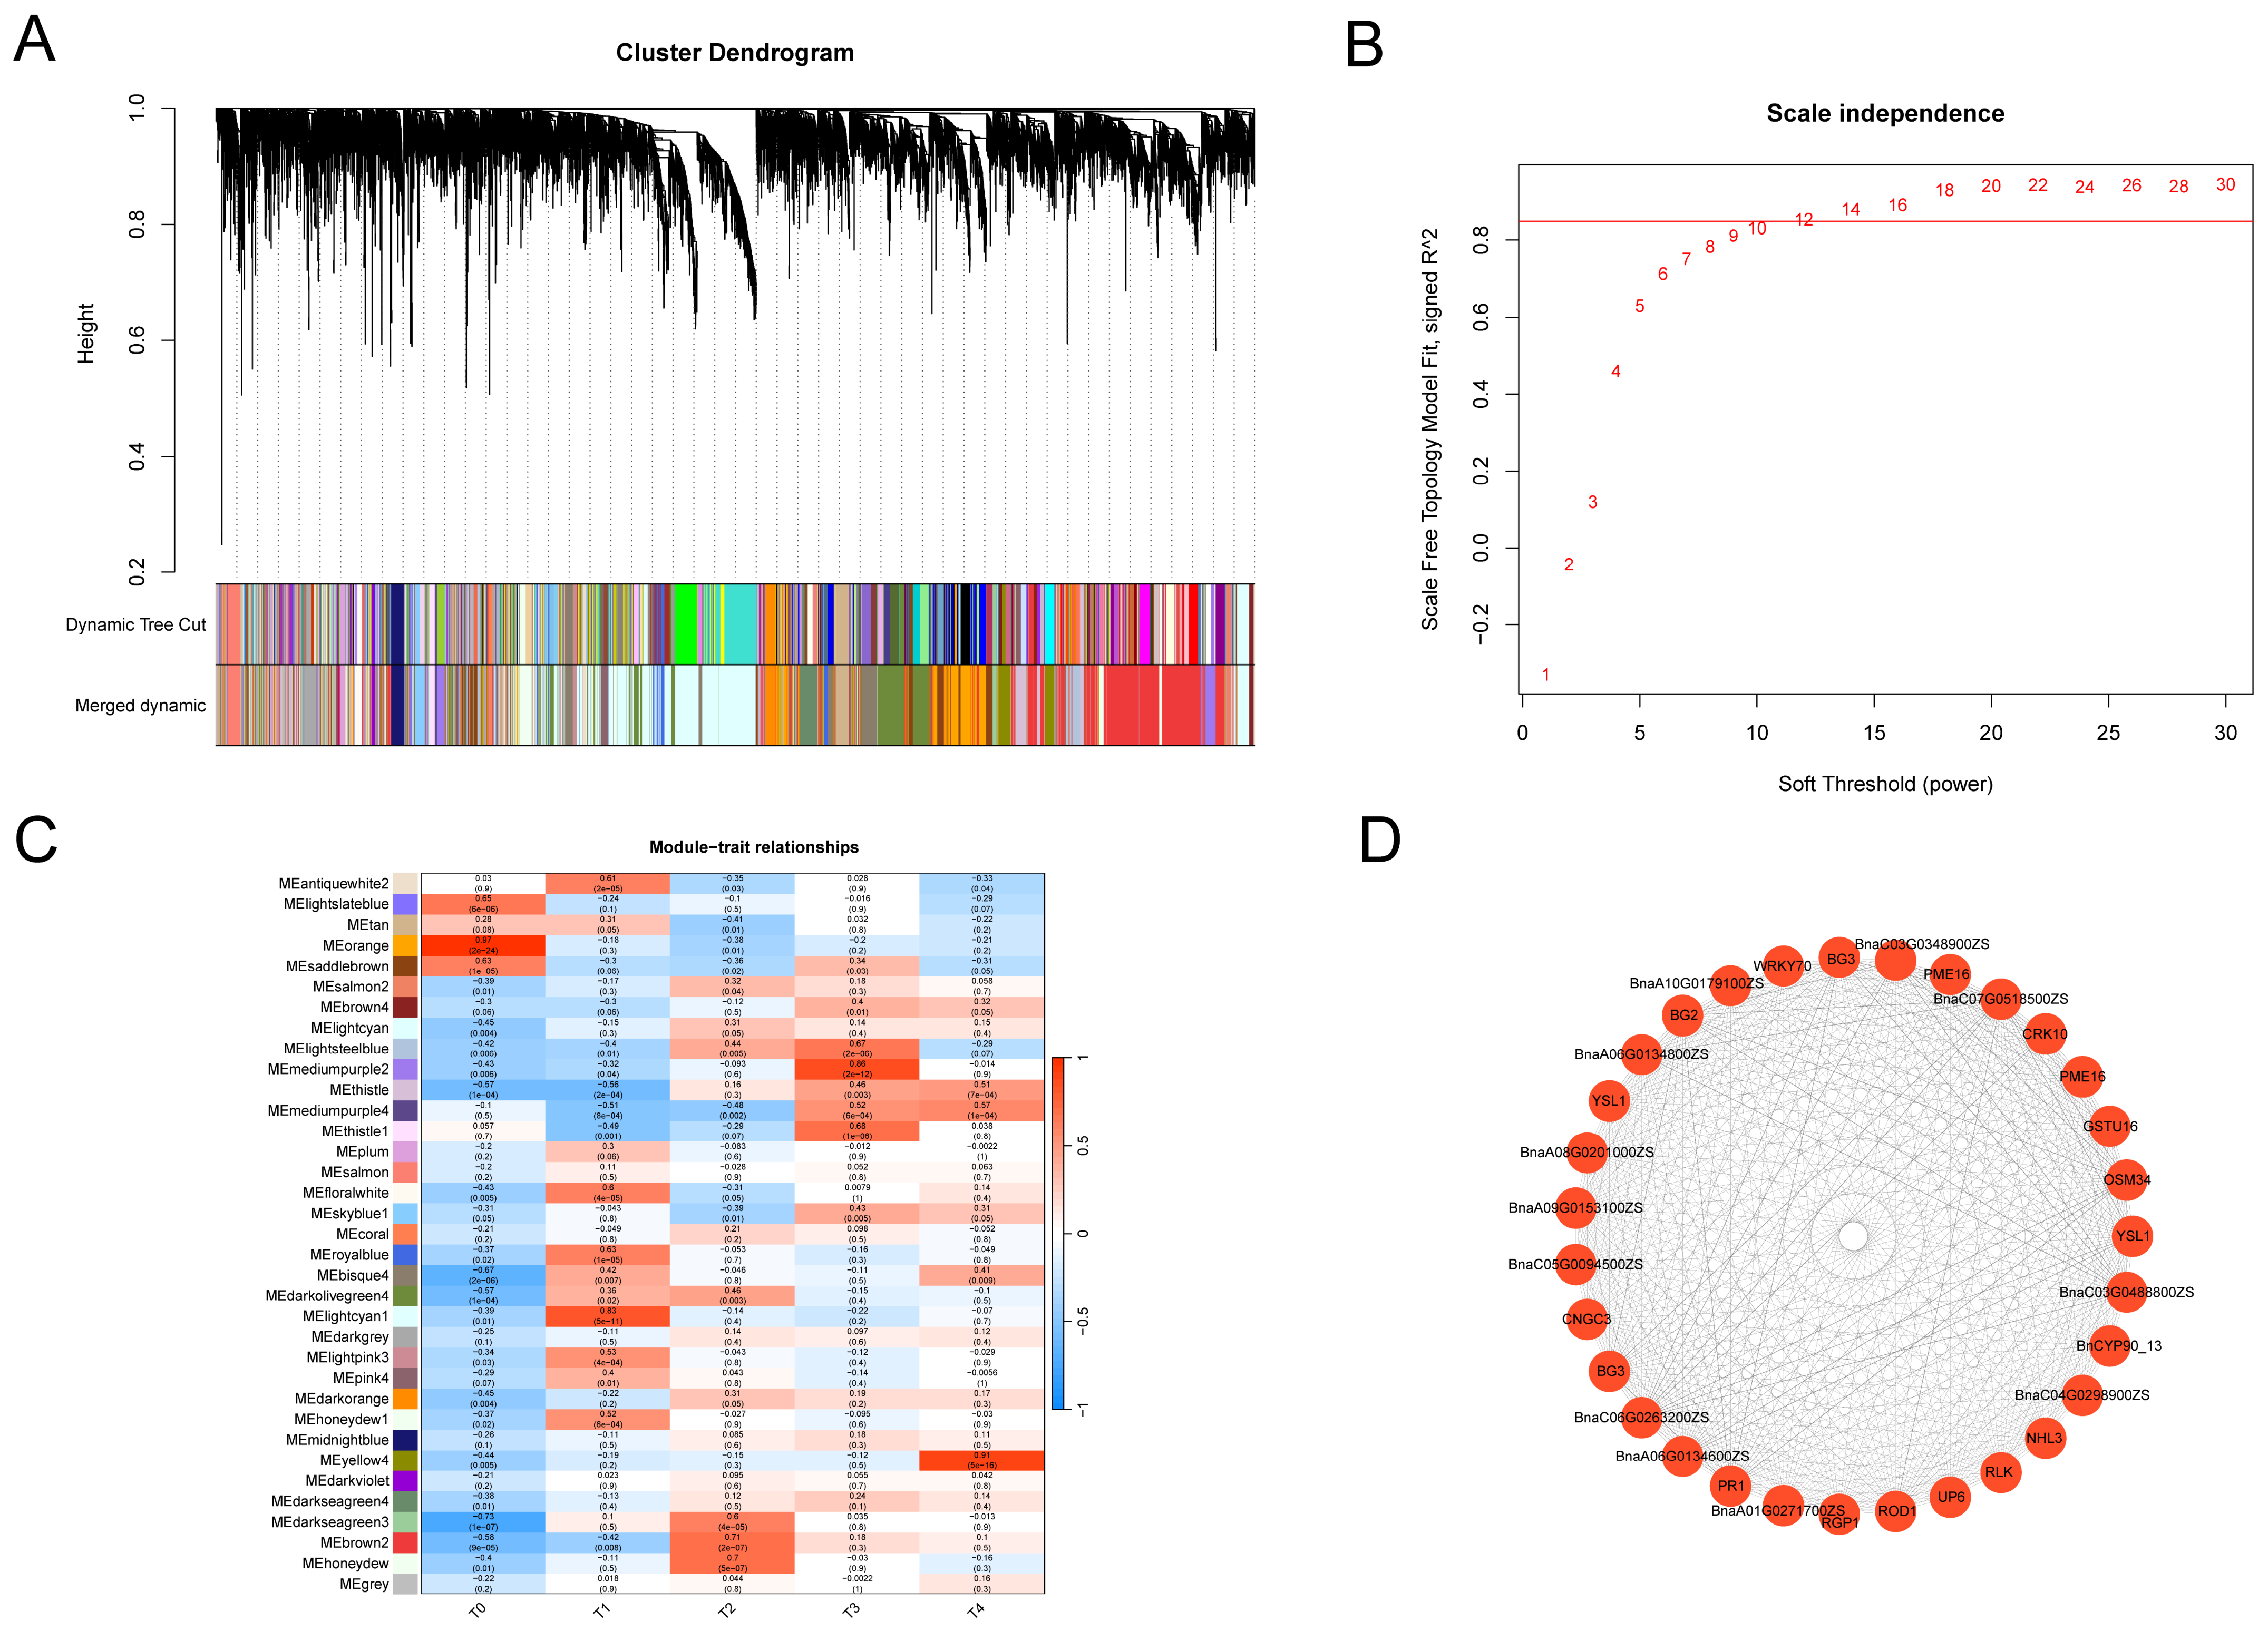
BnCYP90_13 expression, weighted gene co-expression network analysis (WGCNA) was performed using transcriptomic data from the T0–T4 stages. Hierarchical clustering combined with dynamic tree cutting grouped genes with similar expression patterns into multiple co-expression modules, after which highly similar modules were merged (
Figure 11A). When the soft-thresholding power was set to 12, the scale-free topology fit index reached the predefined criterion; therefore, this value was used to construct the subsequent co-expression network (
Figure 11B).
Module–stage correlation analysis revealed distinct association patterns between the co-expression modules and the T0–T4 stages (
Figure 11C). Several modules showed strong positive correlations with a specific stage but weak or negative correlations with the remaining stages, indicating marked differences in transcriptional regulation among developmental stages. Notably, the royalblue module showed the strongest positive correlation with the T1 stage, a clear negative correlation with T0, and relatively weak correlations with T2–T4. This contrasting pattern suggests that genes within the royalblue module may be coordinately upregulated during the transition from T0 to T1 and subsequently decline at later stages, exhibiting a pronounced T1-specific expression pattern. Because
BnCYP90_13 was assigned to the royalblue module, and this module was highly correlated with T1, the royalblue module was selected as the key
BnCYP90_13-associated module for subsequent hub gene screening.
Based on intramodular connectivity, the top hub genes were further selected from the royalblue module, and a co-expression network involving these genes and
BnCYP90_13 was constructed (
Figure 11D). The results showed that
BnCYP90_13 was closely co-expressed with several highly connected genes, including WRKY70, PME18,
GSTU16, YSL1, NHL3, RLK, and RGL1. These proteins are well documented to play crucial roles in diverse plant biological processes: RGL1 acts as a key repressor in gibberellin signaling for hormone crosstalk; PME18 is involved in cell wall remodeling and cellular expansion; WRKY70, GSTU16, and NHL3 mediate stress defense and redox homeostasis; and YSL1 functions in metal ion transport and nutrient allocation. This network suggests that
BnCYP90_13 may act together with core genes in the royalblue module to participate in transcriptional regulation associated with the T1 stage. It should be noted that co-expression relationships reflect similarities in gene expression patterns rather than direct regulatory interactions or protein–protein interactions.
3.11. Detection of BnCYP90s Expression Under Various Abiotic Stresses by RT-qPCR Technique
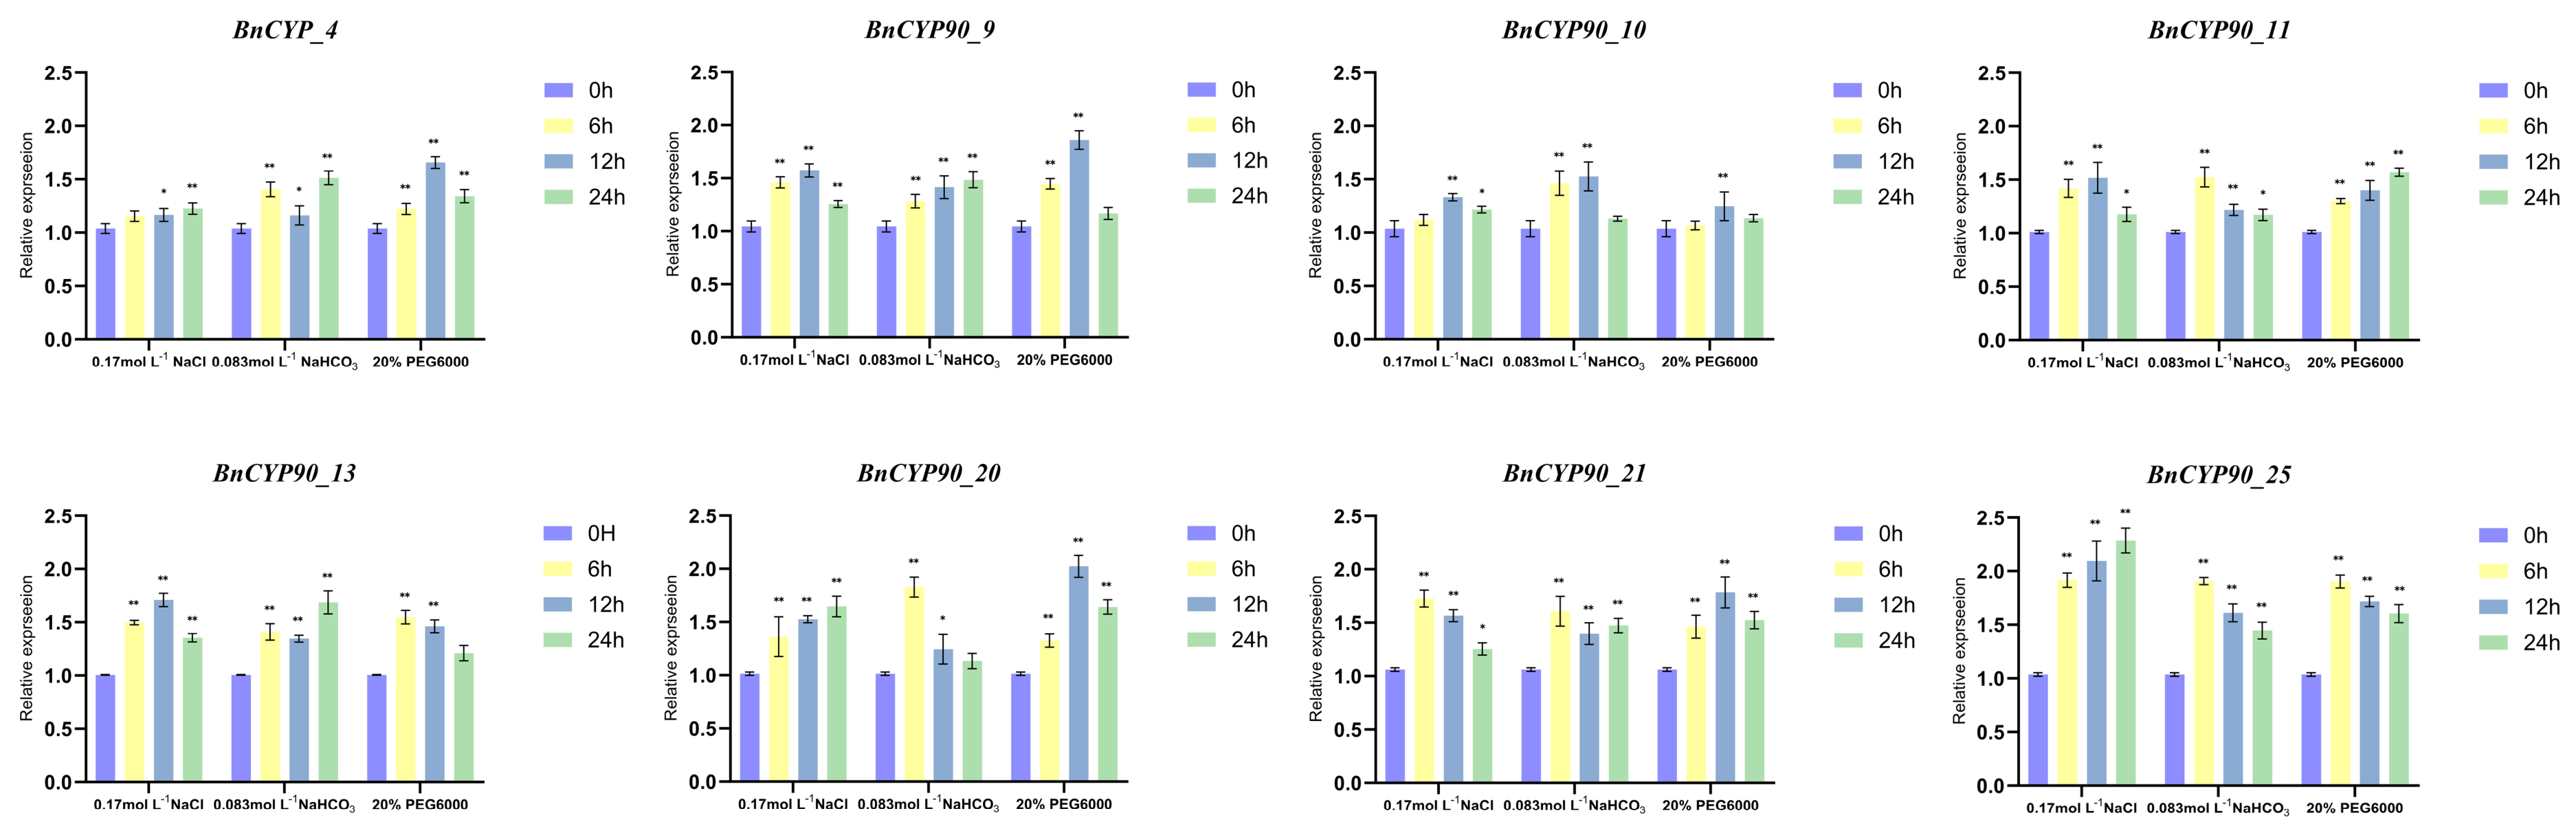
To understand their stress-responsive characteristics, we monitored the transcriptional patterns of eight
BnCYP90 genes under three distinct abiotic treatments: salt (NaCl), alkaline (NaHCO
3), and osmotic (PEG) stresses. The quantitative results demonstrated that this gene family is highly sensitive to environmental adversity. Nevertheless, these members display a striking divergence in expression along with highly coordinated cooperation regarding induction timing and transcriptional amplitude. Collectively, these elements weave together an intricate, stress-responsive regulatory landscape (
Figure 12,
Table S10).
Regarding specific transcriptional characteristics, BnCYP90_25 displayed a sustained activation pattern under salt stress conditions. Specifically, during the 0.17 mol L−1 NaCl treatment, the relative expression level of this gene exhibited a clear, stepwise upward trend over time, reaching its maximum peak after twenty-four hours of treatment. The robust, statistically significant induction observed throughout the late phases of this stress treatment strongly suggests that it was strongly transcriptionally responsive under prolonged salt stress, representing a candidate for future functional validation regarding long-term cellular adaptation.
Concurrently, other members of the family manifested distinct early-to-mid-response traits and stress-specific fluctuations. BnCYP90_9 and BnCYP90_20 represent typical mid-stage response genes under osmotic stress; notably, both genes surged to their peak expression levels exactly 12 h following the onset of the 20% PEG treatment before subsiding. In contrast, BnCYP90_21 and BnCYP90_25 exhibited acute early sensitivity, sharply peaking just six hours after the initiation of the 0.083 mol L−1 NaHCO3 treatment. Such rapid and robust upregulation suggests that they may be associated with early stress signaling and initial response phases of immediate defense mechanisms. Furthermore, the broad absence of initial repression across the analyzed members highlights a rapid, positive transcriptional response pattern within this gene family in response to external environmental stimuli.
4. Discussion
This study identified 25 members of the
BnCYP90 gene family in
B.
napus, which are widely distributed across 16 chromosomes, with the majority exhibiting an uneven distribution pattern. This distribution may be closely related to the polyploidization events of
B. napus (an allotetraploid, AACC), which originated from the hybridization and chromosome doubling of
B. rapa (AA) and
B. oleracea (CC). Collinearity analysis revealed 53 and 47 pairs of syntenic
CYP90 genes between
B. napus and its ancestral species
B. rapa and
B. oleracea, respectively, suggesting substantial gene retention during its evolutionary history. However, the distribution of certain genes on homologous chromosome pairs was not entirely consistent, implying that they may have undergone asymmetric gene retention or loss after species divergence, setting them on independent evolutionary trajectories. Furthermore, intragenomic collinearity and the non-synonymous to synonymous substitution rate ratios (Ka/Ks < 1) indicate that the
BnCYP90 family has primarily been subjected to purifying selection, suggesting the preservation of essential structural features. This mirrors the highly conserved nature of the P450 core domain observed in cotton brassinosteroid synthesis enzymes during polyploidization [
20,
21,
50].
Phylogenetic analysis classified BnCYP90 proteins into four distinct groups (
CYP90A,
CYP90B,
CYP90C, and
CYP90D). All
BnCYP90 members clustered closely with conserved homologous genes from Arabidopsis, suggesting their key roles in fundamental physiological processes such as basic BR biosynthesis. Structural analysis demonstrated that all BnCYP90 proteins contained the characteristic
CYP90-like domain, suggesting the potential conservation of their predicted protein functions. However, a few members (e.g.,
BnCYP90_10) exhibited a relatively simple motif composition. Gene structure analysis further demonstrated that although most members retained canonical GT-AG splice-junction signals, different members still varied in gene length, exon number, and intron distribution. These structural variations might be associated with evolutionary adaptation during stress responses and developmental regulation through genomic streamlining or organizational diversification. This paradigm of structural diversification is frequently observed in complex plant gene families, much like how the BES1 transcription factor family in cotton utilizes structural modifications associated with distinct downstream regulatory functions [
51].
Cis-regulatory element analysis revealed the potential involvement of
BnCYP90 genes in stress responses. The enrichment of light-responsive, anaerobic induction (ARE), drought-inducibility (MBS), antioxidant, and hormone-responsive elements (such as ABRE and CGTCA-motif) in
BnCYP90 promoters suggests their possible roles in abscisic acid (ABA) and methyl jasmonate (MeJA) signaling, as well as redox homeostasis under stress conditions. This is highly consistent with the characteristics of BR-related gene promoters in species such as wheat and cotton, which are similarly enriched with multiple environmental and hormone-responsive elements [
52,
53]. In the computationally predicted protein–protein interaction (PPI) network,
BnCYP90_4,
BnCYP90_6, and
BnCYP90_11 were identified as predicted, highly connected candidate nodes, interacting closely with other members. Simultaneously, these genes are targeted by various miRNAs, which are predicted to be regulated predominantly via transcript cleavage and partially through translational inhibition. This miRNA-mediated post-transcriptional regulation mirrors the mechanisms observed within the BnCesA regulatory network, reflecting complex multidimensional control over gene expression [
20].
The expression profiling of
BnCYP90 genes revealed distinct temporal and spatial response patterns when confronting abiotic challenges. Transcriptome and qRT-PCR analyses demonstrated that BnCYP90_25 displayed a sustained activation pattern under salt stress, suggesting its potential involvement in long-term cellular responses to salinity. In contrast,
BnCYP90_9 and
BnCYP90_20 exhibited mid-stage expression peaks under osmotic stress (PEG), whereas
BnCYP90_21 and
BnCYP90_25 showed strong early transcriptional sensitivity under alkaline stress. These spatiotemporal expression differences highlight the distinct expression profiles among family members under various environmental conditions. This distinct spatiotemporal partitioning is a characteristic feature of BR synthesis genes, much like
GhROT3-1 and
GhDET2-1 in cotton, which exhibit specific temporal expression phases during different fiber developmental stages. However, because these findings are based primarily on transcriptional profiling, further physiological and biochemical investigations are necessary to confirm whether these expression dynamics directly translate to the initiation of defense mechanisms or coordinated stress tolerance [
50]. Furthermore, weighted gene co-expression network analysis (WGCNA) pinpointed
BnCYP90_13 as a highly co-expressed core hub within the royalblue module at the T1 developmental stage, highly co-expressed with genes such as
WRKY70,
PME18, and
GSTU16. The utility of WGCNA in isolating key developmental and stress-responsive hubs has been similarly validated in identifying salt-tolerance regulatory hubs in Gramineae [
54].
Seed germination rate and biomass accumulation directly influence crop early establishment and yield. Natural variations, such as single-nucleotide polymorphisms (SNPs) in populations, constitute the genetic basis for these physiological trade-offs. In this study, SNP variation analysis revealed that a missense variant in
BnCYP90_25 was significantly associated with a physiological trade-off under salt stress: the TT genotype was linked to a statistically significant germination rate and higher
BnCYP90_25 expression in seeds, whereas the CC genotype exhibited greater relative maintenance of aboveground dry matter and germination potential. This suggests that variation at specific SNP loci within BnCYP90_25 may be associated with physiological trade-offs between seed germination performance and seedling biomass retention under salinity stress. The identification of candidate SNPs associated with phenotypic outcomes has been reported across multiple gene families in
B. napus; for instance, a specific SNP found in BnCesA1 was reported to correlate with root elongation performance under salt stress, and GSK3 family variants controlling plant height were also successfully mapped via genome-wide association studies (GWAS). This reflects the pleiotropic role of BRs in balancing dynamic growth and stress resilience [
20].




 ,
,