Article

Physiological Responses to Chronic Salt Stress at the Young Panicle Stage and Agronomic Performance of Rice Genotypes with Contrasting Salt Tolerance

1
School of Tropical Agriculture and Forestry, Hainan University, Haikou 570228, China
2
South China Center of National Center for Technology Innovation of Saline-Alkali Tolerant Rice, College of Coastal Agricultural Sciences, Guangdong Ocean University, Zhanjiang 524088, China
3
National Center of Technology Innovation for Saline-Alkali Tolerant Rice, Sanya 572000, China
4
National Key Laboratory of Hybrid Rice, Hunan Hybrid Rice Research Center, Changsha 410125, China
*
Authors to whom correspondence should be addressed.
Agronomy 2026, 16(17), 1628; https://doi.org/10.3390/agronomy16171628 (registering DOI)
Submission received: 21 July 2026 / Revised: 14 August 2026 / Accepted: 23 August 2026 / Published: 25 August 2026
(This article belongs to the Section Plant-Crop Biology and Biochemistry)

Abstract

The selection and breeding of salt-tolerant rice and the use of saline–alkali land for rice cultivation are crucial for food security. However, most studies have focused only on the seedling salt tolerance stage, with little research on the salt tolerance mechanisms during the reproductive growth period. This study selected the salt-tolerant rice line SR17, the salt-tolerant variety SR86, and the salt-sensitive variety IR29 as research subjects. Two salt stress gradients of 0% and 0.5% (7.8 dS m−1) were established. Salt stress was applied continuously from rice transplanting to the maturity stage, and the differences in response mechanisms during the young panicle stage under long-term salt stress were analyzed. The results showed that, under salt stress, SR17 exhibited the least lipid peroxidation and membrane damage, followed by SR86, while IR29 suffered the most severe damage. SR17 and SR86 could reduce oxidative damage and maintain membrane system integrity by activating the antioxidant enzyme system and accumulating soluble proteins. In contrast, the antioxidant system in IR29 was insufficiently activated; this indicates that the adaptability of this variety to salt-induced oxidative stress is relatively poor. The chlorophyll content and most photosynthetic parameters in SR17 showed no significant changes, and leaf gas exchange performance and chlorophyll status were the least affected, whereas IR29 suffered severe damage. Agronomic trait investigation revealed that, compared with the control, SR17 exhibited the smallest reductions in plant height, spikelets per panicle, 1000-grain weight, grain yield per plant, and main spikelet number under salt stress, and the decreases in key yield-related indicators—effective panicle number, grain yield per plant, and seed setting rate—were not significant. This study confirms that SR17 possesses superior salt tolerance and holds potential for further breeding and multi-environment trials, while also providing an important basis for elucidating the physiological mechanisms of salt tolerance during the reproductive stage of rice.

1. Introduction

Soil salinization is one of the most severe abiotic stresses facing global agricultural production, seriously affecting the growth, development, and yield of crops [1]. According to statistics, more than 1.381 billion hectares of land worldwide are affected by salt stress, of which approximately 20% of irrigated farmland has suffered varying degrees of salt damage [2,3,4]. Rice (Oryza sativa L.) is a staple food crop for more than half of the world’s population and plays an irreplaceable role in global food security [5,6]. However, rice is one of the most salt-sensitive cereal crops, with a salt tolerance threshold of only 3 dS m−1; beyond this value, yield decreases by 12% for every 1 dS m−1 increase [7,8]. Salt stress damage to rice occurs throughout the entire growth cycle, but the seedling stage and reproductive stage (especially the panicle initiation stage) are the most sensitive, directly leading to reductions in effective panicle number, decreased seed setting rate, and lower 1000-grain weight, ultimately resulting in severe yield losses [9,10,11].
The mechanisms of salt stress damage to plants are complex and multifaceted, primarily involving osmotic stress, ionic toxicity, and oxidative stress at three levels [3,12]. In the early stage of salt stress, the high concentration of salt around the root zone lowers the soil water potential, causing osmotic stress. This leads to a decrease in cell turgor pressure, stomatal closure, and restricted CO2 uptake, thereby inhibiting photosynthesis and cell elongation [9]. As the duration of stress increases, Na+ and Cl enter the roots in large quantities via the apoplastic and symplastic pathways and are transported upward to the leaves [13,14]. The accumulation of excess Na+ in the cytoplasm not only competitively inhibits K+ uptake, disrupting ion homeostasis, but also displaces K+ from binding sites on enzymes, leading to the inactivation of numerous metabolic enzymes [7,15]. Concurrently, the increased activity of NADPH oxidase and the over-reduction in the photosynthetic electron transport chain under salt stress trigger a massive burst of ROS, including superoxide anions (O2•−), hydrogen peroxide (H2O2), and hydroxyl radicals (·OH) [16,17,18,19]. These ROS attack cell membrane lipids, proteins, and nucleic acids, initiating membrane lipid peroxidation marked by malondialdehyde (MDA) content, which results in the loss of cell membrane integrity and electrolyte leakage [3,20].
To cope with oxidative damage caused by salt stress, rice has evolved an efficient antioxidant defense system [21,22,23]. Superoxide dismutase (SOD), as the first line of defense in ROS scavenging, catalyzes the dismutation of O2•− into H2O2 and O2; subsequently, peroxidase (POD) and catalase (CAT) further decompose H2O2 into H2O and O2, thereby alleviating oxidative damage [20,22,24]. Studies have demonstrated that salt-tolerant rice cultivars can maintain or enhance the activities of these antioxidant enzymes under salt stress, enabling more-efficient ROS scavenging and reduced membrane lipid peroxidation. In contrast, salt-sensitive cultivars exhibit a significant decline in SOD activity, accompanied by a marked increase in MDA content [25,26]. Furthermoresoluble proteins function as osmotically active solutes, and changes in their content reflect the plant’s metabolic adaptive capacity, while chlorophyll content directly determines photosynthetic performance [22,27].
The inhibition of photosynthesis by salt stress is an important physiological reason for the decline in rice yield [28,29]. The reduction in net photosynthetic rate (Pn) is typically associated with stomatal and non-stomatal limitations. On one hand, the osmotic stress induced by salt stress triggers stomatal closure, thereby reducing CO2 diffusion into mesophyll cells. On the other hand, the accumulation of Na+ in mesophyll cells damages chloroplast structure, reduces mesophyll conductance, and impairs the carboxylation efficiency of Rubisco [30]. Studies have shown that the decline in photosynthetic rate in rice leaves under salt stress is primarily attributable to a reduction in CO2 concentration within chloroplasts, and diffusion limitations (including both stomatal and mesophyll limitations) are the major limiting factors [30,31]. Numerous studies have found that NaCl stress significantly reduces Pn, transpiration rate (Tr), and stomatal conductance (Gs) in rice and also leads to a decrease in chlorophyll content [32,33,34].
The selection and breeding of salt-tolerant rice varieties represent the most economical and sustainable approach for the efficient utilization of saline–alkali land [1,6,22,35]. Over the years, researchers worldwide have developed a number of rice varieties (lines) with improved salt tolerance through germplasm screening, mutagenesis breeding, and genetic engineering [9]. Most studies have focused on the seedling stage of rice, while research on salt tolerance during the reproductive stage remains scarce. In particular, evaluations of the physiological mechanisms underlying prolonged salt stress at the panicle initiation stage are even more limited [32,36,37]. However, salt tolerance during the panicle initiation stage under prolonged salt stress is especially critical for grain yield. Moreover, the physiological mechanisms underlying salt tolerance differ substantially among varieties, necessitating a comprehensive multi-dimensional evaluation encompassing antioxidant metabolism, photosynthetic performance, and yield formation. SR86 is a salt–alkali-tolerant rice variety developed by Chen et al. [38]; however, its excessive plant height and strong photosensitivity severely restrict its broader agricultural application [39]. During a survey of salt-tolerant plants in coastal tidal flats, a salt-tolerant rice line (SR17) morphologically resembling SR86 was identified. Compared with SR86, SR17 exhibited reduced plant height, weak photosensitivity, enhanced lodging resistance, and adaptability to a wider range of cultivation regions (Figure S1). In this study, SR17 was evaluated alongside the salt-tolerant variety SR86 (positive control) and the salt-sensitive variety IR29 (negative control) under salt pond cultivation conditions throughout the entire growth period. Physiological and biochemical indices as well as photosynthetic parameters were measured at the young panicle initiation stage, and agronomic traits were systematically assessed at maturity. This study aimed to comprehensively evaluate the salt tolerance and underlying physiological and biochemical mechanisms of SR17, thereby providing a theoretical basis for its promotion and application in saline–alkali regions.

2. Materials and Methods

2.1. Experimental Materials

SR86, utilized in this study, is a rice germplasm resource known for its strong salt tolerance [38]. SR17 is a salt-tolerant rice line discovered in the coastal tidal flats and is preserved by our laboratory. IR29 was also maintained in our laboratory.

2.2. Experimental Conditions and Crop Management

The salt pond rice experiment in 2025 was conducted at the core research base of the National Center for Saline–Alkali-Tolerant Rice Technology Innovation Headquarters in Sanya, China (18.36 °N, 109.17 °E). The experimental base was established along the coastal zone, equipped with an automated seawater collection network for seawater intake. Salt stress was induced using a mixed solution of seawater and freshwater prepared in a mixing tank. During the experiment, soil salinity was monitored daily using a portable conductivity meter (2266FS, Spectrum, Boston, MA, USA) to maintain the salinity of the salt-treated plots at 0.5% (7.8 dS m−1). Additionally, the base is equipped with a fully automatic rain shelter, which is triggered by rainfall sensors to open automatically, thereby minimizing the impact of rainfall on stable salinity control. This system design ensures strict control of salinity parameters during the experiment. Prior to rice planting, the top 20 cm of soil had a pH of 7.5, total nitrogen content of 0.65 g kg−1, available phosphorus content of 155.28 mg kg−1, available potassium content of 232.38 mg kg−1, organic matter content of 7.68 g kg−1, and an electrical conductivity of 0.26 dS m−1.
The experiment employed a split-plot design, with each plot covering an area of 20 m2 (4 m × 5 m). Irrigation with different salt concentrations served as the main plot treatment: 0% (control group) and 0.5% (seawater dilution, 7.8 dS m−1). Within each main plot, subplots were assigned to three rice cultivars, with three biological replicates, resulting in a total of six main plots. Seeds of the three rice cultivars were placed at 40 °C for 24 h to break seed dormancy. Germinated seeds were placed in seedling trays on 25 July 2025, and rice seedlings were transplanted into the salt ponds on 10 August 2025, at a spacing of 20 cm × 20 cm, with one seedling per hill. After transplantation, each plot was continuously irrigated with the corresponding salt concentration until maturity. Nitrogen fertilizer was applied in the form of urea (46% N), phosphorus fertilizer as calcium superphosphate (16% P2O5), and potassium fertilizer as potassium chloride (60% K2O). Nitrogen fertilizer was applied as basal, tillering, and panicle fertilizers at a ratio of 100:75:50 kg ha−1; phosphorus fertilizer was applied once as basal fertilizer (60 kg ha−1); and potassium fertilizer was applied as basal and panicle fertilizers at a 50:50 kg ha−1 ratio. Pest, disease, and weed control were carried out in accordance with standard rice cultivation practices.
Rice was harvested from the salt pond on 8 November 2025. The average temperature throughout the entire growth period was 27.3 °C. In each salt pond area, 6 plants were randomly selected from each subplot for each of the three rice varieties, and agronomic traits including plant height, effective panicle number, spikelets per panicle, total spikelets per plant, seed setting rate, 1000-grain weight grain yield per plant, main spikelet number, panicle length and panicle weight were evaluated.

2.3. Chlorophyll Content Assay

Three plants per genotype were selected from each subplot, and the second fully expanded leaf from the top was sampled for measurement. Chlorophyll content was measured with minor modifications following the method established by Liu et al. [40]. Briefly, 0.05 g of leaf tissue was excised, fragmented, and placed into 7 mL centrifuge tubes, each containing 5 mL of 95% ethanol. The mixtures were homogenized thoroughly and left to stand overnight at room temperature in the dark. The supernatant was then carefully transferred to a microplate, and absorbance values were measured at wavelengths of 665 nm and 649 nm using a microplate reader (Epoch, BioTek, Beijing, China). Chlorophyll concentration was calculated using the formula: CT = (13.95 × OD665 − 6.88 × OD649) + (24.96 × OD649 − 7.32 × OD665) and expressed as mg per gram of fresh weight (mg g−1 FW).

2.4. Determination of Photosynthesis Parameters

For gas exchange parameters and photosynthetic performance evaluation, the second fully expanded leaf from the top of the rice plant was selected and analyzed using a portable photosynthesis system (LI-6800, LI-COR) between 9:00 and 11:30. During this period, measurements were randomized across treatments to avoid time-of-day confounding. Measurements were conducted at a flow rate of 500 μmol s−1 and a photosynthetically active radiation (PAR) intensity of 1000 μmol m−2 s−1, with the leaf chamber (3 cm × 3 cm) positioned on the middle part of the leaf. The chamber and leaf temperatures were maintained under ambient conditions, with RH ranging from 55% to 65%, and the reference CO2 concentration was set to 400 ppm. Data were recorded after stabilization. For each genotype, five plants were selected from corresponding subplot for measurement, with three biological replicates per treatment.

2.5. Electrolyte Leakage Assay

Plant electrolyte leakage was determined following the method of Chen et al. [41] with slight modifications. Briefly, 0.1 g of the second fully expanded leaf from the top of rice plants was collected, cut into small pieces, and placed into a 15 mL centrifuge tube containing 10 mL of distilled water. The samples were incubated at room temperature for 12 h, after which the conductivity of the extract (R1) was measured using a portable conductivity meter (LE703, METTLER TOLEDO, Shanghai, China). The samples were then boiled in a water bath for an additional 15 min, cooled to room temperature, and shaken thoroughly. The conductivity was measured again and recorded as R2. Relative electrolyte leakage was calculated using the formula: Relative conductivity (%) = R1/R2 × 100%.

2.6. Determination of Physiological Indices

Three plants per genotype were selected from each subplot, and the second fully expanded leaf from the top was sampled for physiological measurements. Enzyme extraction was performed as follows: 1 g of fresh plant tissue was homogenized in 10 mL of 0.05 mol L−1 phosphate buffer (pH 7.8) under cold conditions. The homogenate was centrifuged at 12,000 rpm for 10 min at 4 °C, and the supernatant was collected as crude enzyme extract.
MDA content was determined following the method described by Cai et al. [42] with some modifications, which involved extraction with trichloroacetic acid (TCA) and reaction with thiobarbituric acid (TBA). Briefly, 1 mL of the enzyme extract was mixed with 2 mL of MDA reaction solution containing 10% TCA and 0.6% (w/v) TBA. A mixture of distilled water and MDA reaction solution was used as a blank. The mixture was incubated in a boiling water bath for 15 min. After the reaction, the samples were centrifuged at 12,000 rpm for 10 min at room temperature. The supernatant was collected, and the absorbance at 532 nm, 600 nm, and 450 nm was measured using a microplate reader (Epoch, BioTek). MDA concentration was calculated using the formula: CMDA = 6.425 × (OD532 − OD600) − 0.559 × OD450.
The activity of SOD was assessed according to the methods outlined by Li et al. [43] with some modifications. SOD activity was determined using the nitroblue tetrazolium (NBT) method. Briefly, 100 μL of the enzyme extract was mixed with 3 mL of SOD reaction solution containing 0.05 mol L−1 phosphate buffer, 130 mmol L−1 methionine (Met), 750 μmol L−1 NBT, 100 μmol L−1 EDTA-Na2, and 20 μmol L−1 riboflavin (FD). The mixture was exposed to 4000 lux light for 15 min (AE). Meanwhile, four additional tubes were prepared without enzyme extract (using phosphate buffer instead), with two tubes exposed to 4000 lux light for 15 min as control (ACK) and two tubes kept in the dark as blank. After the reaction, absorbance at 560 nm was measured using a microplate reader (Epoch, BioTek), with the blank used for zero adjustment. SOD activity was calculated using the formula: ASOD = ((ACK − AE) × VT)/(1/2ACK × W × VS). One unit of SOD activity (U) was defined as the amount of enzyme required to inhibit 50% of the photochemical reduction of NBT, and activity was expressed as kU g−1.
The activity of POD was assessed according to the methods outlined by Li et al. [43] with some modifications. POD activity was determined using the guaiacol method. The enzyme extract was diluted 10-fold. Briefly, 100 μL of the diluted enzyme extract was mixed with 3 mL of POD reaction solution. A mixture of 100 μL of 0.1 mol L−1 phosphate buffer (pH 6.0) and 3 mL of reaction solution was used as blank. Absorbance at 470 nm was measured using a microplate reader at 30 s intervals for a total of five readings. POD activity was calculated using the formula: APOD = (ΔOD470 × VT × 10)/(W × VS), where ΔOD470 represents the mean absorbance change per minute averaged over four intervals between the five readings. Enzyme activity was expressed as the change in absorbance per minute (U g−1).
The activity of CAT was assessed according to the methods outlined by Li et al. [43] with some modifications. Briefly, 100 μL of the enzyme extract was mixed with 3 mL of CAT reaction solution. A mixture of 100 μL of 0.1 mol L−1 phosphate buffer (pH 7.0) and 3 mL of reaction solution was used as blank. Absorbance at 240 nm was measured using a microplate reader at 30 s intervals for a total of five readings. CAT activity was calculated using the formula: ACAT = ΔOD240 × VT/(W × Vs), where ΔOD240 represents the mean absorbance change per minute averaged over four intervals between the five readings. Enzyme activity was expressed as the change in absorbance per minute (U g−1).
Soluble protein content was quantified using the Bradford [44] method, with bovine serum albumin (BSA) as the protein standard. Briefly, 1 mL of the enzyme extract was mixed with 5 mL of Coomassie Brilliant Blue solution and incubated at room temperature for 5 min. Absorbance at 595 nm was measured to calculate protein concentration. Soluble protein content was calculated using the formula: SP Content (mg g) = (C × VT)/(W × VS × 1000), where C is the protein content (μg) obtained from the standard curve.
In the above formula, VT represents the total volume of the extract, VS is the volume of the extract used during the measurement, and W is the fresh weight of the sample.

2.7. Data Analyses

Data were organized using Microsoft Excel 2016. Two-way analysis of variance (ANOVA) was performed using SPSS 26. After checking for homogeneity of variance (p > 0.05), multiple comparisons among different varieties under the same salinity level were conducted using Duncan’s multiple range test. Differences between two salinity levels for a single variety were analyzed using an independent samples t-test. Comparisons were made at probability levels of 0.05, 0.01, and 0.001. All figures were generated using GraphPad Prism 8.

3. Results

3.1. Leaf Electrolyte Leakage and MDA Content

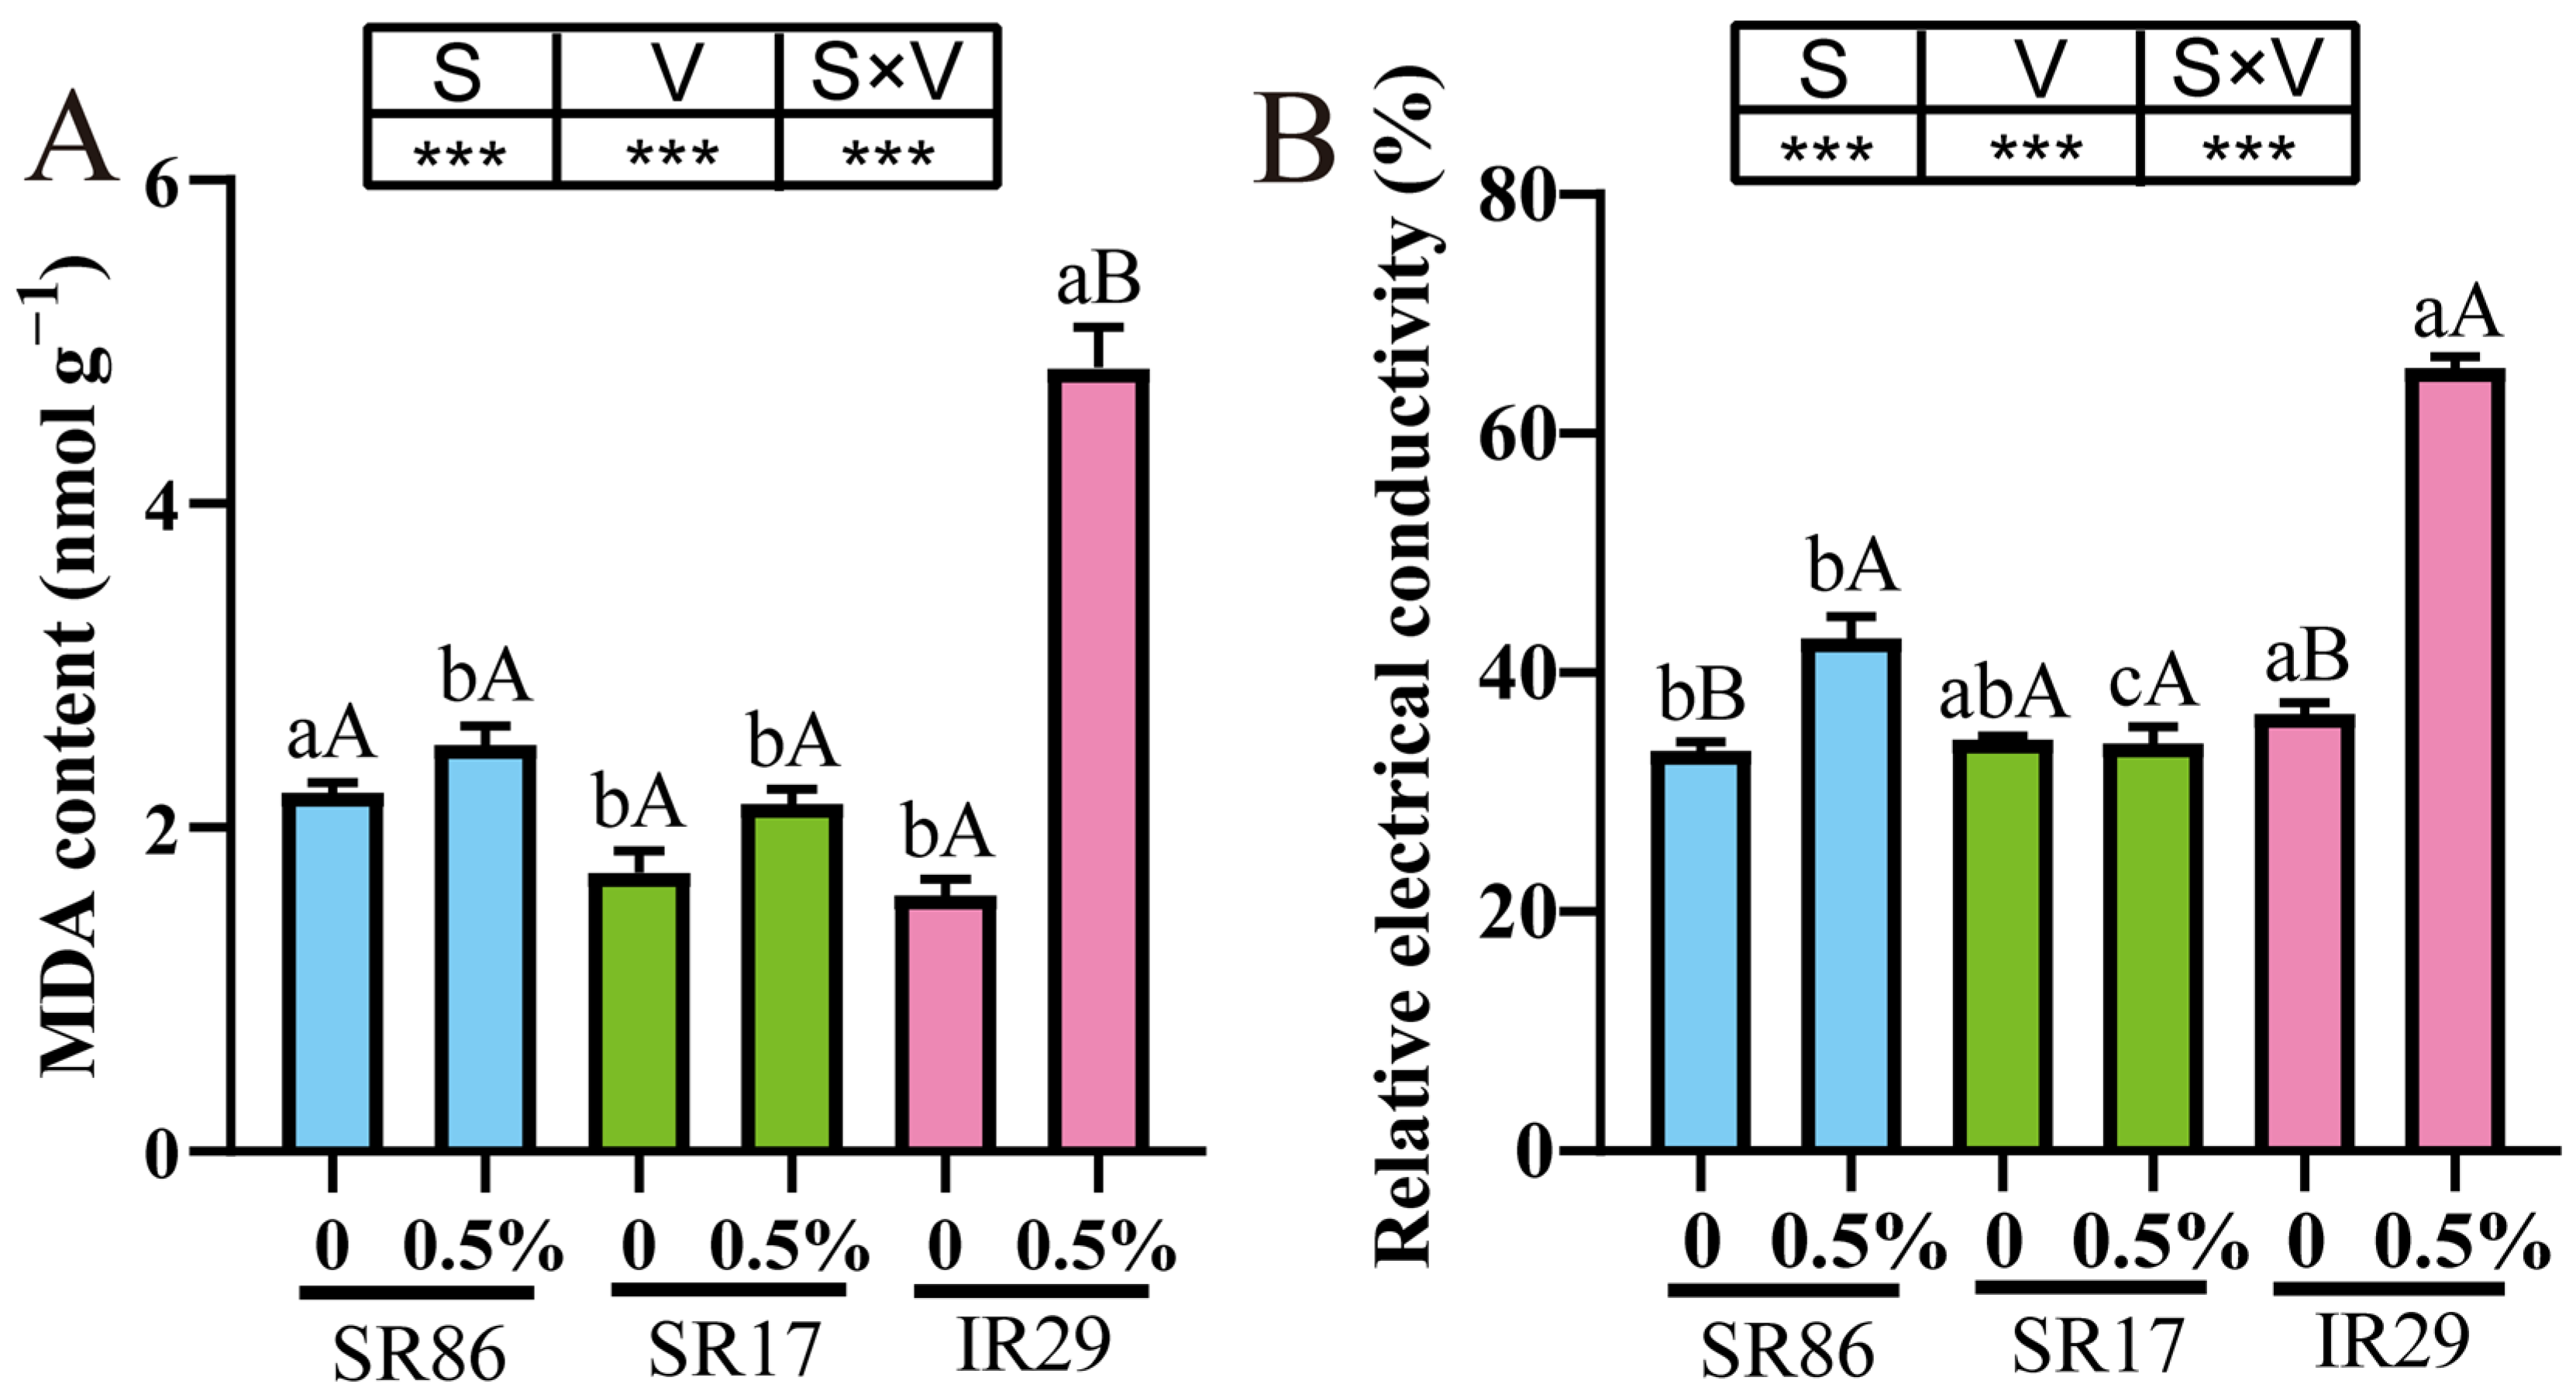
After transplantation, the MDA content and electrolyte leakage were determined at the young panicle stage in SR17, SR86, and the salt-sensitive cultivar IR29, which were subjected to long-term exposure to a 0.5% salt pond (Figure 1). The results showed that MDA content and electrolyte leakage were significantly affected by variety, salinity, and their interaction (Figure 1). Compared with the control (0% salt concentration), the MDA content of SR17 and SR86 did not change significantly under salt stress, whereas that of IR29 significantly increased by 205.64% (Figure 1A). Furthermore, the relative electrical conductivity of SR17 showed no significant change under salt stress compared with the control, while SR86 exhibited a significant increase of 28.18%, and IR29 showed a marked increase of 78.97% (Figure 1B). This result indicates that, under salt stress, SR17 exhibited the lowest level of lipid peroxidation and the least oxidative damage to the cell membrane, followed by SR86, whereas IR29 showed the most prominent lipid peroxidation-induced membrane damage.

3.2. Activities of SOD, POD, CAT and Content of SP

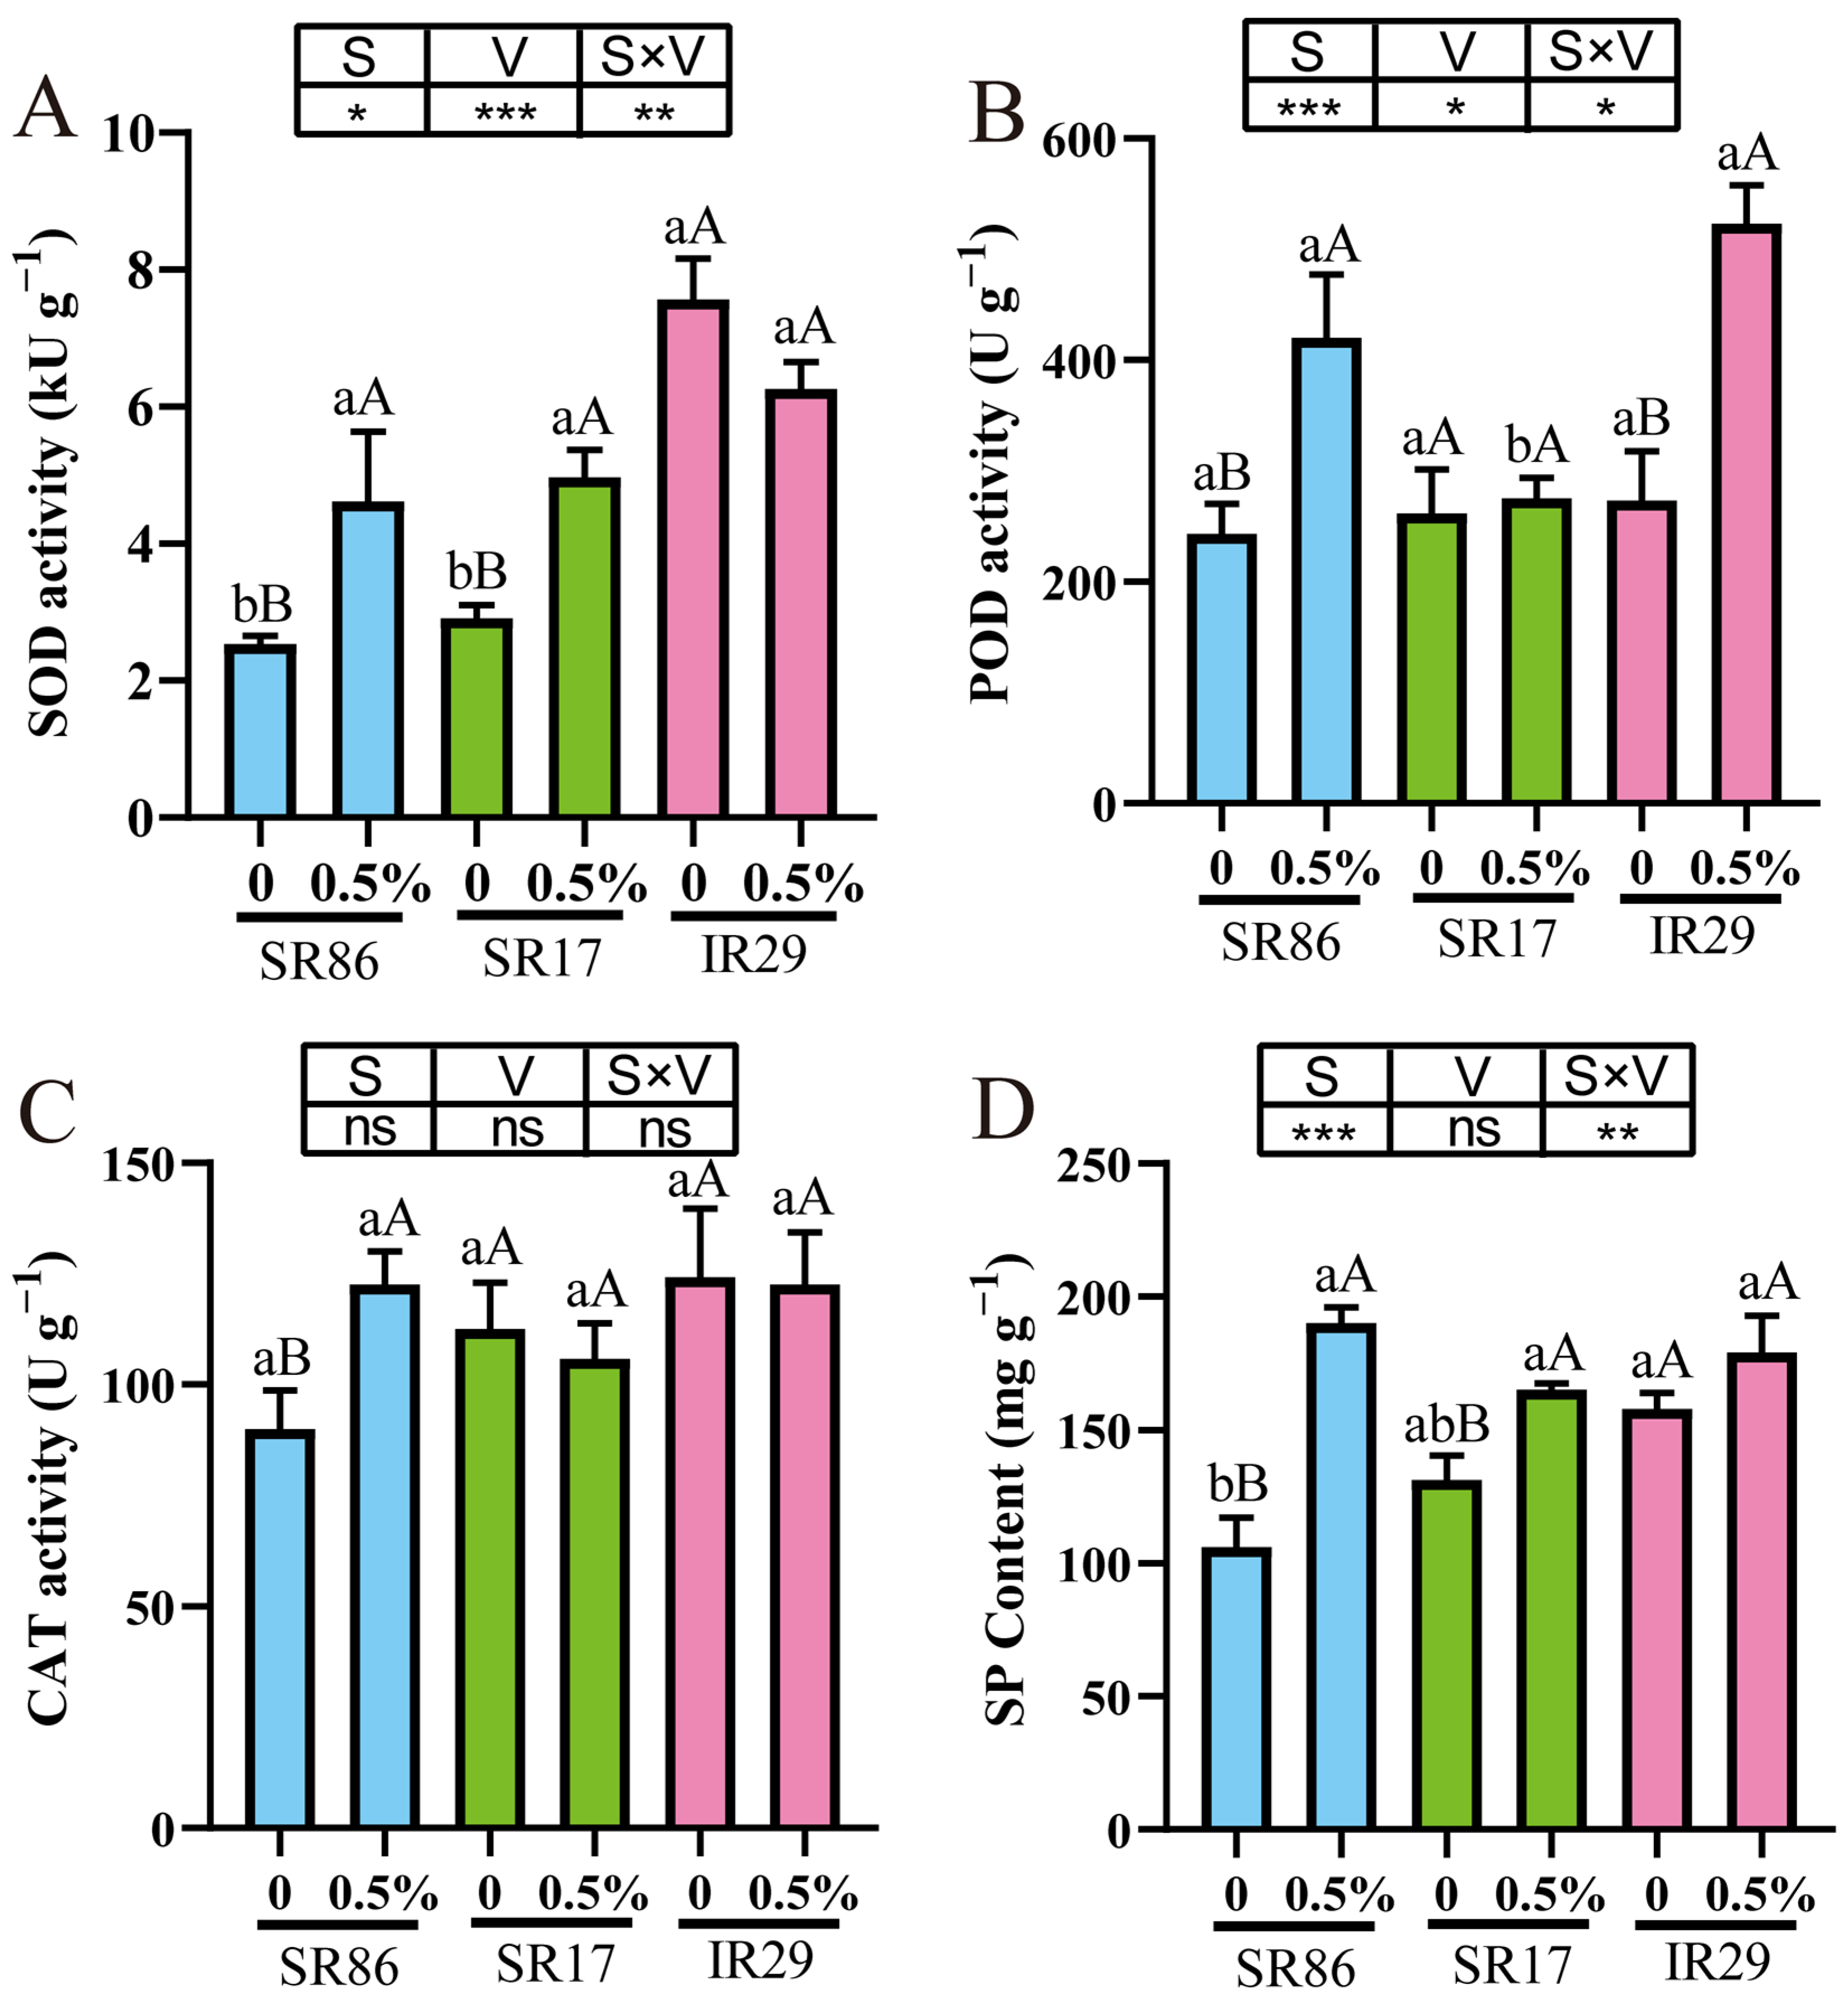
Activities of SOD and POD in plants were significantly influenced by variety, salinity, and their interaction (Figure 2A,B). However, CAT activity was not significantly affected by salinity, variety, or their interaction (Figure 2C). Soluble protein was significantly affected by salinity and its interaction with variety, but not by variety alone (Figure 2D). Compared with the control, the SOD activity of SR17 was significantly increased by 70.70% after salt treatment (Figure 2A), while the activities of POD and CAT showed no significant changes (Figure 2B,C). Similarly, the SOD activity of SR86 was significantly increased by 81.85%, analogous to that of SR17 (Figure 2A). However, unlike SR17, both POD and CAT activities in SR86 were significantly elevated, increasing by 72.60% and 36.11%, respectively, compared with the control (Figure 2B,C). In contrast, IR29 differed from both SR17 and SR86; its SOD and CAT activities exhibited no significant changes, except for a significant increase of 91.46% in POD activity (Figure 2B). Under salt treatment, the soluble protein contents of SR17 and SR86 significantly increased by 25.70% and 79.08%, respectively, compared with the control, whereas no significant change was observed in IR29 (Figure 2D).

3.3. Chlorophyll Content and Photosynthetic Parameters

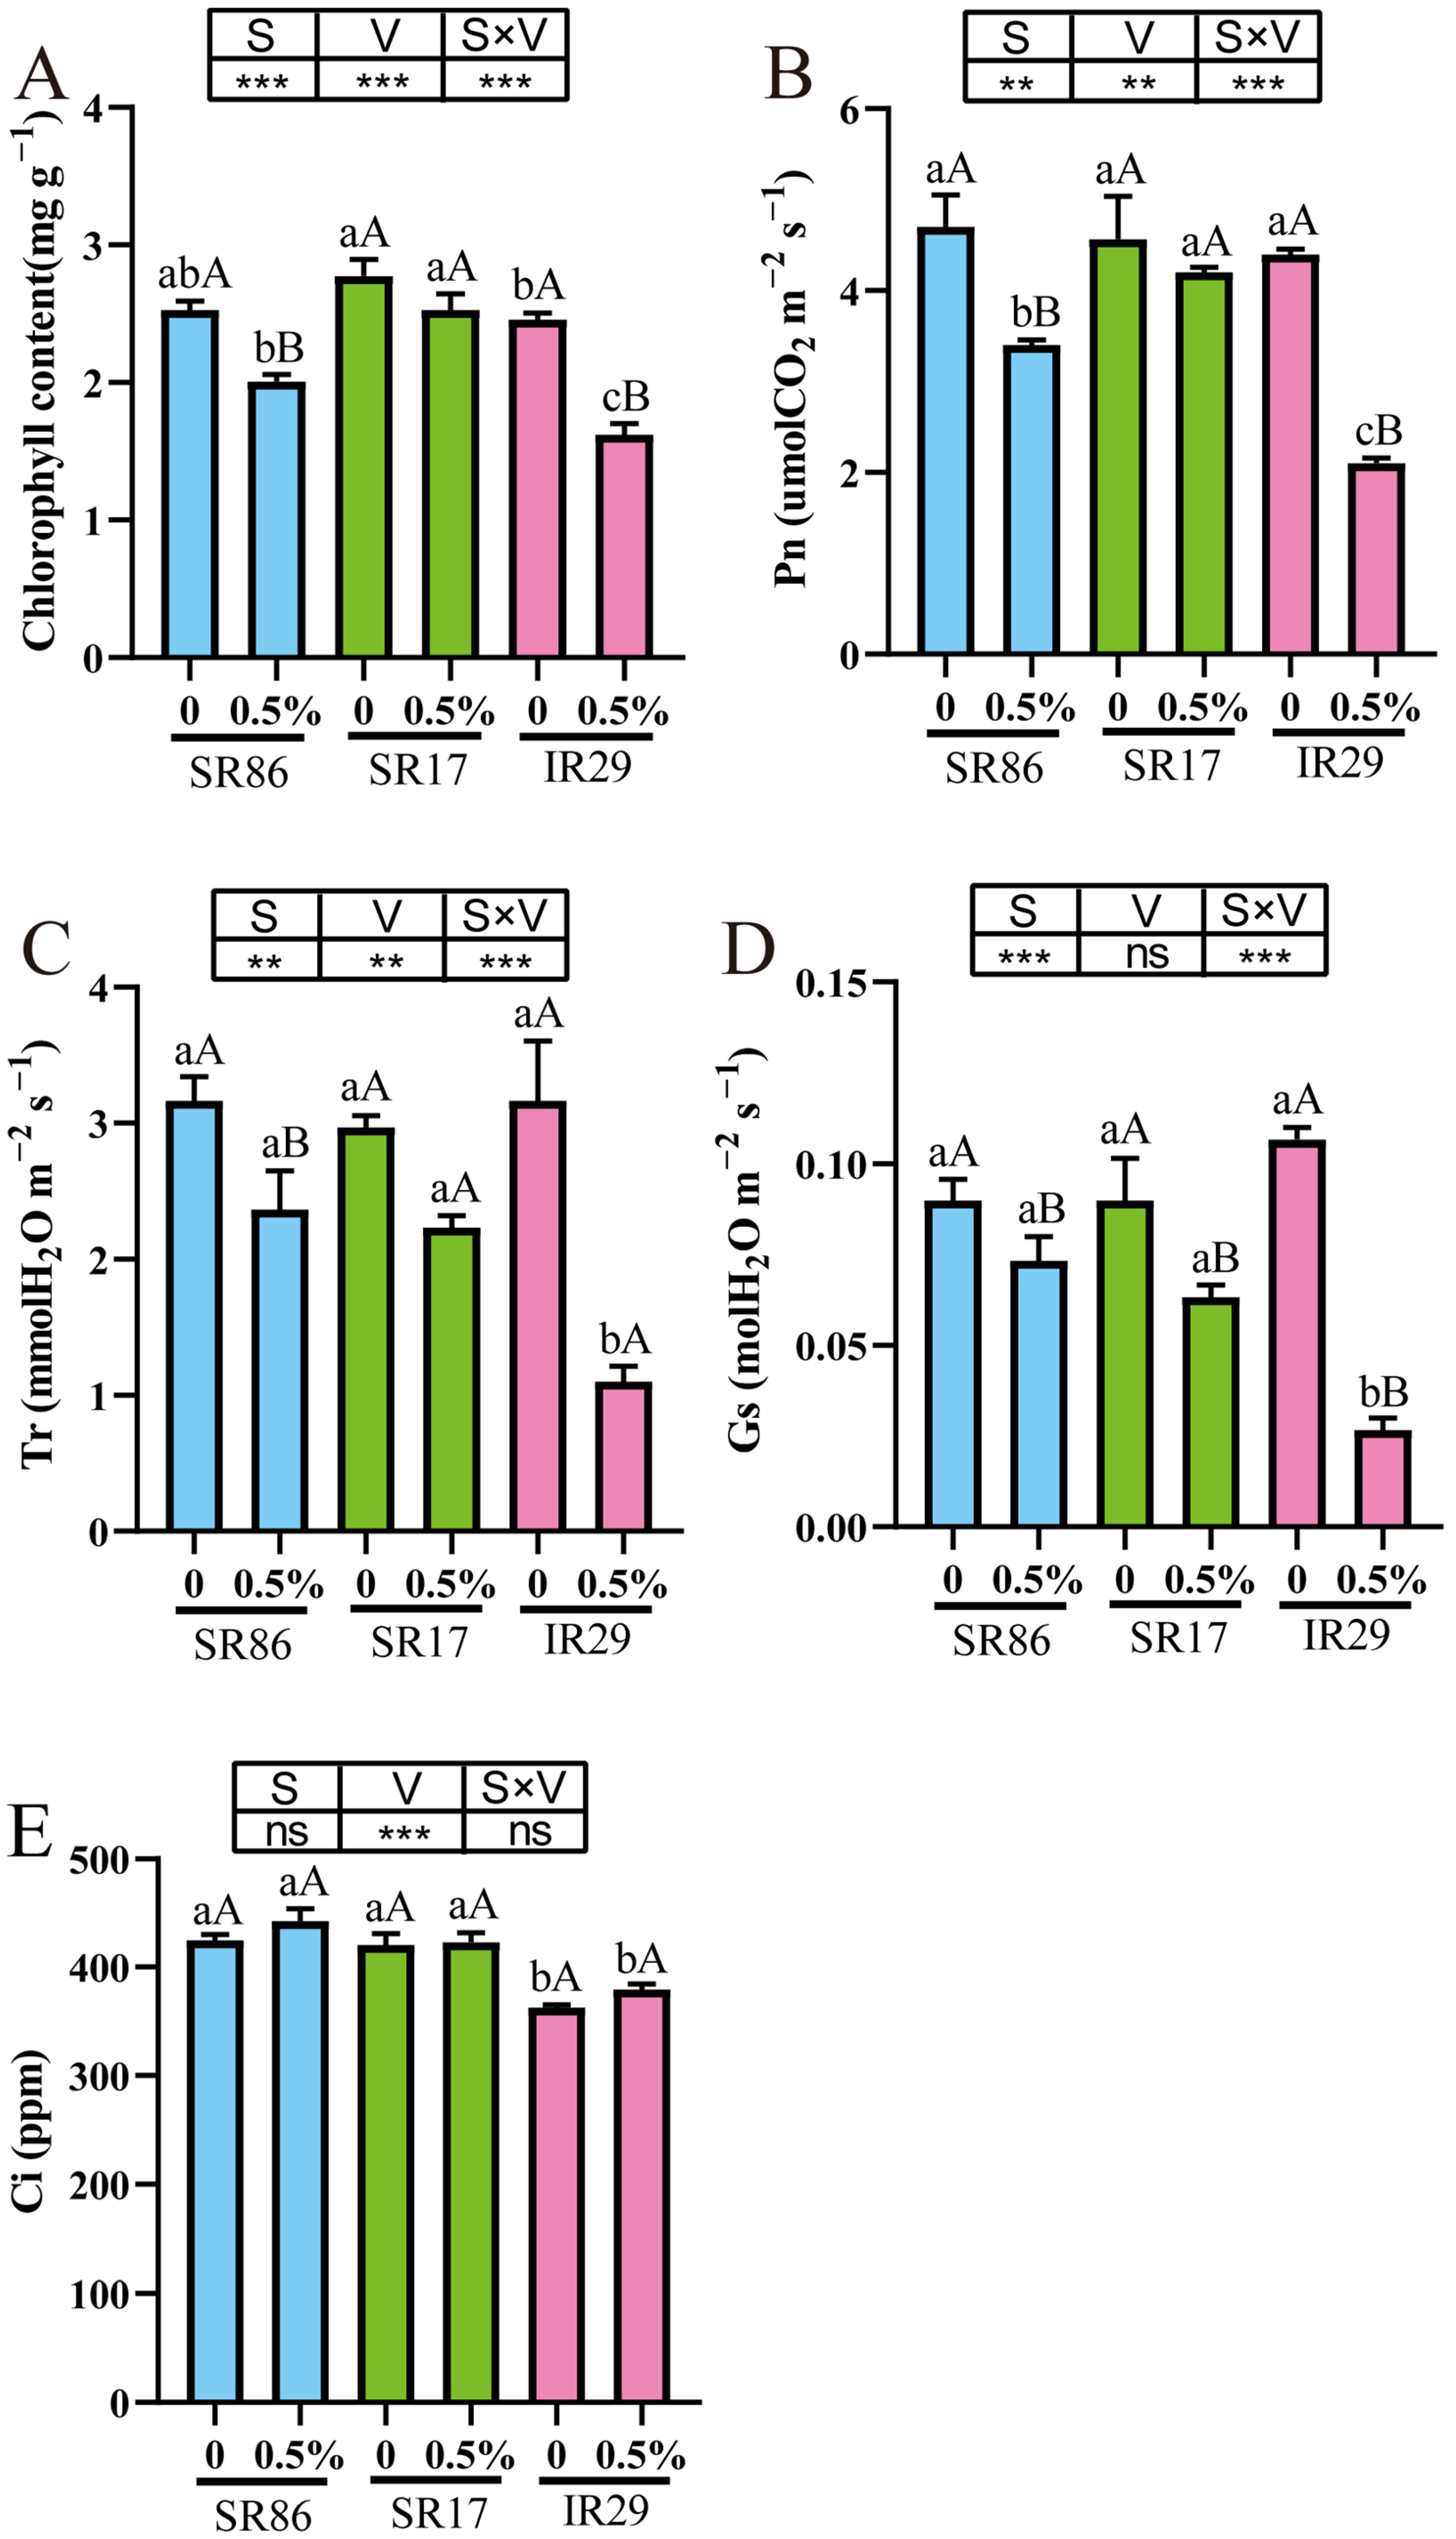
Chlorophyll content, Pn, and Tr were significantly affected by variety, salinity, and their interaction (Figure 3A–C). Salinity and its interaction with variety had significant effects on Gs, while variety alone did not significantly affect Gs (Figure 3D). In contrast, intercellular CO2 concentration (Ci) was significantly affected by variety, but not by salinity or their interaction (Figure 3E). Under salt stress, the chlorophyll content of SR17 showed no significant change compared with the control, whereas that of SR86 and IR29 decreased to varying degrees by 20.54% and 34.01%, respectively (Figure 3A). The results for photosynthetic parameters were similar to those described above. In SR17, except for a significant decrease of 29.63% in Gs, no significant changes were observed in Pn, Tr, or Ci under salt stress. In SR86, all photosynthetic parameters except Ci, including Pn, Gr, and Gs were significantly decreased by 27.66%, 25.26%, and 18.52%, respectively, compared with the control. In IR29, except for Ci, which remained unchanged, Pn, Tr, and Gs were markedly reduced under salt stress relative to the control, by 52.27%, 65.26%, and 75.00%, respectively (Figure 3B–E). The results showed that the photosynthetic performance of IR29 leaves declined markedly under salt stress, followed by SR86, whereas SR17 exhibited the smallest decline.

3.4. Agronomic Traits

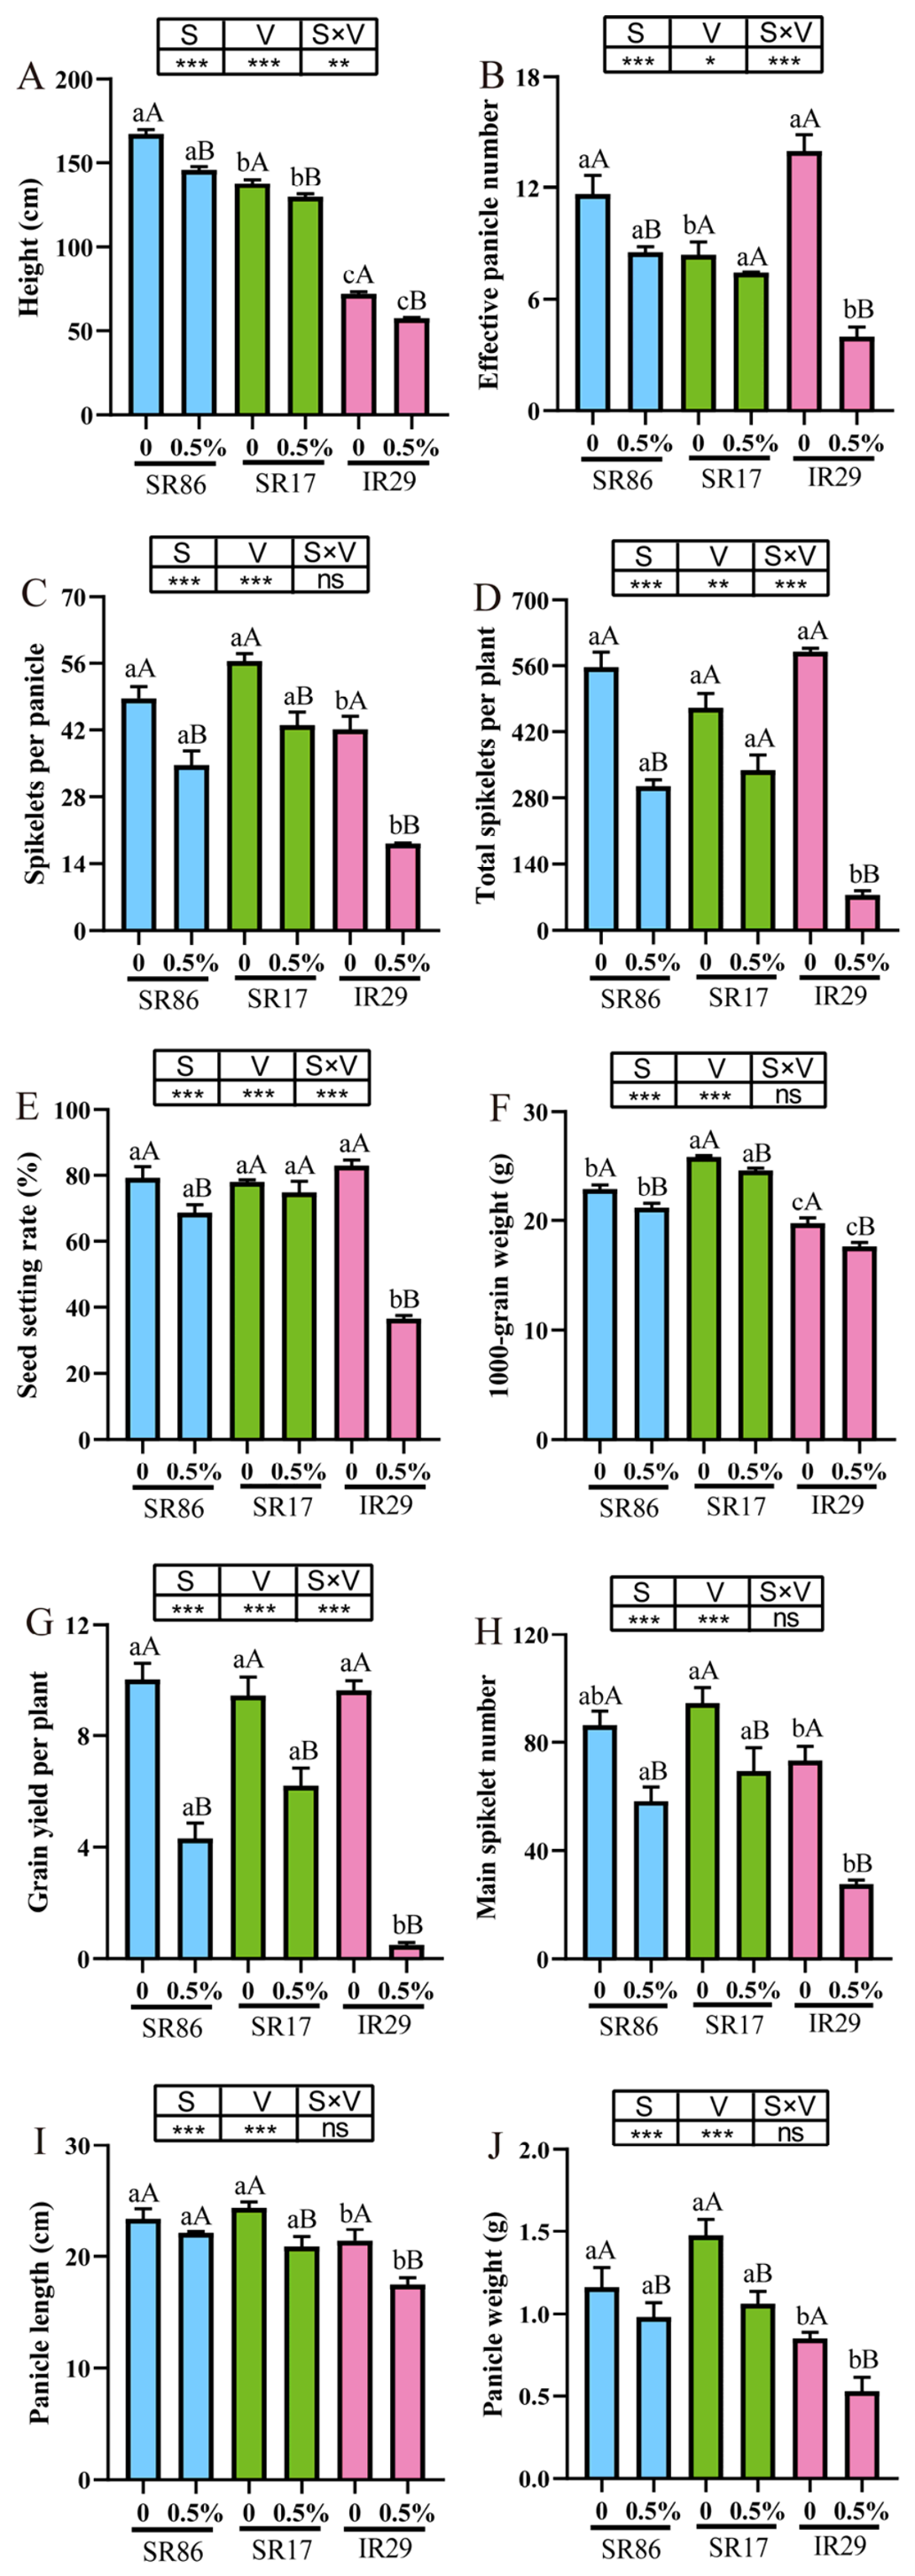
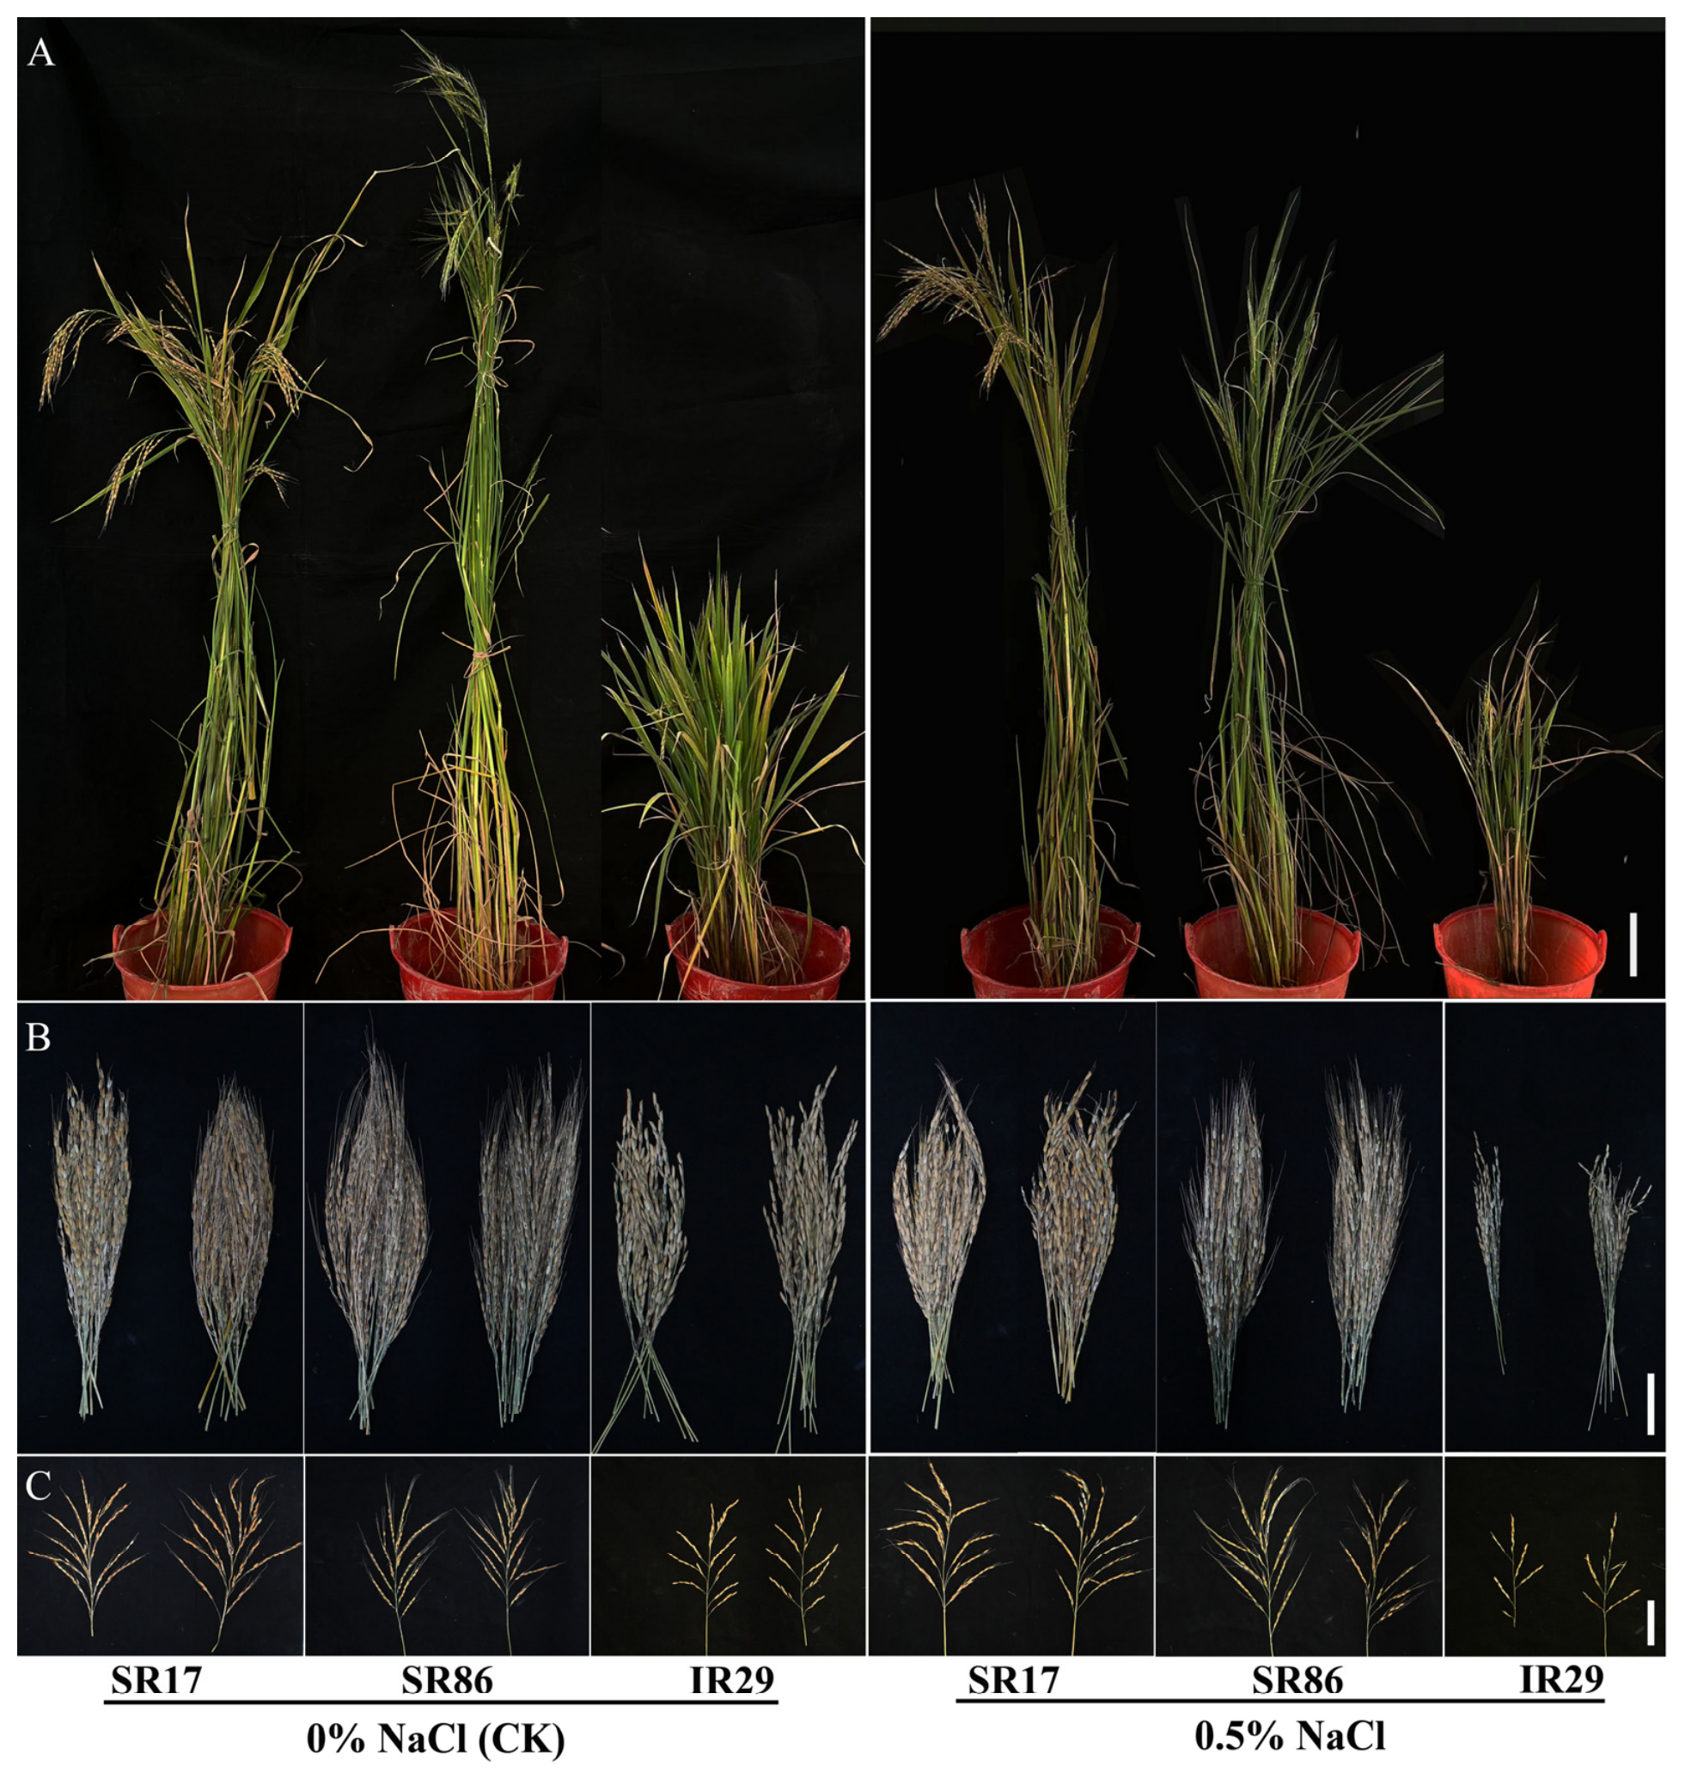
Agronomic performance at maturity was then evaluated. A comparative analysis of agronomic traits was performed on SR17, SR86, and IR29 grown to maturity in salt ponds of varying concentrations (Figure 4 and Figure 5). The results showed that agronomic traits of rice plants, including plant height, effective panicle number, grains per panicle, total grains per plant, seed setting rate, thousand-grain weight, yield per plant, grains per main panicle, panicle length, and panicle weight, were significantly affected by salinity and variety.
Among these traits, plant height, effective panicle number, total grains per plant, seed setting rate, and yield per plant were significantly affected by the interaction between salinity and variety, whereas the other agronomic traits were not significantly influenced by this interaction (Figure 5). Compared with the control, SR17, SR86, and IR29 were all inhibited to varying degrees under salt stress. Specifically, plant height, spikelets per panicle, 1000-grain weight, grain yield per plant, panicle weight, and main spikelet number were significantly reduced in all three varieties under salt stress relative to the control. However, the extent of reduction differed among the three varieties. Plant height decreased by 20.23% in IR29, 12.81% in SR86, and only 5.76% in SR17 (Figure 5A). SR17 and SR86 exhibited similar reductions in spikelets per panicle, with decreases of 22.85% and 23.87%, respectively, whereas IR29 showed a reduction of 56.78% (Figure 5C). Regarding 1000-grain weight, SR17 had a higher value than SR86 and IR29 under control conditions. Under salt stress, 1000-grain weight decreased by 10.71% in IR29, 6.50% in SR86, and only 4.65% in SR17, which was significantly lower than that of IR29 and SR86 (Figure 5F). Grain yield per plant was consistent with the above results, with SR17 showing a much smaller reduction (37.08%) than SR86 (53.65%) and IR29 (95.13%) (Figure 5G). Main spikelet number in SR17, SR86, and IR29 decreased by 29.67%, 33.35%, and 62.27%, respectively, relative to the control (Figure 5H). In contrast to the above results, panicle weight under salt stress showed the smallest reduction in SR86 (16.50%), followed by SR17 (24.51%), while IR29 again exhibited a substantial decrease of 50.48% (Figure 5J). Interestingly, under salt stress, several key agronomic traits of SR17, including effective panicle number, total spikelet number per plant, and seed setting rate, did not decrease significantly compared with the control. In contrast, these traits decreased significantly in SR86 by 26.09%, 43.73%, and 11.91%, respectively, and were drastically reduced in IR29 by 71.43%, 87.37%, and 55.86%, respectively (Figure 5B,D,E). For SR86, panicle length did not decrease significantly under salt stress compared with the control, whereas SR17 and IR29 showed significant reductions of 12.90% and 18.22%, respectively (Figure 5I). Collectively, these results indicate that, under salt stress, SR17 showed the best performance in grain yield and the major yield components, followed by SR86, with IR29 performing the worst.

4. Discussion

Rice exhibits differential responses to salt stress across various growth stages, with the seedling and reproductive stages being the most sensitive; however, the correlation between these two stages is very low [36]. The physiological basis of salt tolerance at the seedling stage is relatively well established, and most studies on salt tolerance in rice are confined to the seedling stage. In contrast, research on salt tolerance during the reproductive stage, as well as studies investigating the correlation between salt tolerance at the seedling and reproductive stages, remains scarce [36,37]. In terms of overall grain yield, the most sensitive period begins at the young panicle stage [37]. Therefore, in the present study, we examined the physiological responses of SR17 during the young panicle initiation stage under long-term salt stress. IR29 is sensitive to salt stress during the reproductive stage and is commonly used as a sensitive check in breeding nurseries [36]; accordingly, IR29 was selected as the negative control in this experiment.
Salt stress induces substantial accumulation of ROS, leading to increased membrane lipid peroxidation and membrane permeability. MDA content and electrolyte leakage are commonly used as key indicators of oxidative damage [41]. In the present study, SR17 and SR86 showed no significant changes in MDA content, suggesting a lower degree of membrane lipid peroxidation and better maintenance of membrane system integrity. In contrast, the salt-sensitive cultivar IR29 exhibited a marked increase in both MDA content and relative electrolyte leakage, indicating severe oxidative injury (Figure 1A). Demiral and Türkan [45] similarly observed that, under salt stress, the salt-tolerant rice cultivar Pokkali showed no significant change in MDA content, whereas the salt-sensitive cultivar IR-28 exhibited a pronounced increase, consistent with our findings.
SOD is a key antioxidant enzyme [46]. The significantly elevated SOD activity in SR17 and SR86 indicates an enhanced SOD-mediated antioxidant capacity, whereas SOD activity in IR29 showed no significant change, thereby weakening its antioxidant capacity (Figure 2A). Dionisio-Sese and Tobita [10] also reported that SOD activity in the salt-tolerant cultivar Pokkali remained stable or slightly increased under salt stress, whereas it decreased significantly in the salt-sensitive cultivar.
CAT and POD are responsible for scavenging H2O2, the product of SOD activity. In this study, both CAT and POD activities significantly increased in SR86. Although no significant changes were observed in SR17, its soluble protein content was significantly elevated (Figure 2B–D). This change is a typical adaptive physiological response of rice in resisting osmotic stress. In IR29, only POD activity increased while CAT and SOD were not activated (Figure 2A–C); this indicates that this variety has relatively poor adaptability in resisting salt-induced oxidative stress. Vighi et al. [47] noted that, in salt-tolerant rice, SOD activity increased under salt stress, while CAT and APX activities showed minimal change, suggesting that H2O2 may participate in other signaling processes rather than directly causing lipid peroxidation. Kumar et al. [48] also found that CAT and POD activities were significantly higher in the salt-tolerant rice cultivar Panvel-3 than in the salt-sensitive cultivar.
As important osmoregulatory substances and protective molecules, soluble proteins can effectively maintain cellular osmotic potential and protect enzyme activities through the regulation of their content [49]. Soluble protein content was significantly elevated in SR17 and SR86 but showed no significant change in IR29, further indicating that SR17 and SR86 possess stronger osmotic regulation and protein protection capabilities. In summary, by synergistically activating the antioxidant enzyme system (SOD, CAT, POD) and accumulating soluble proteins, SR86 effectively inhibited membrane lipid peroxidation and maintained membrane integrity. It is speculated that, under salt stress, SR17 enhances its antioxidant capacity solely through SOD, while the accumulation of soluble proteins provides osmotic defense. Compared with SR86, SR17 incurred lower material and energy consumption and suffered less growth damage under salt stress. The antioxidant enzyme system of IR29 failed to be fully activated, and the antioxidant capacity it mediated was significantly reduced.
Under salt stress, the photosynthetic performance of three rice varieties diverged markedly, explained by differences in chlorophyll content and photosynthetic limitation type. Chlorophyll is a key biochemical indicator of salt tolerance: salt-tolerant varieties maintain or enhance it, while salt-sensitive ones show pronounced declines [50]. SR17 maintained stable chlorophyll content, whereas SR86 and IR29 decreased by 20.54% and 34.01%, respectively, providing a pigment basis for SR17′s higher Pn (Figure 3A). Photosynthetic decline can result from stomatal limitation or non-stomatal limitation, and the intercellular Ci serves as a key criterion for distinguishing between these two mechanisms: if a decline in Pn is accompanied by a decrease in Ci, stomatal limitation predominates; if Pn declines while Ci remains unchanged or increases, both the carboxylation capacity of mesophyll cells and stomatal conductance are impaired, indicating the predominance of non-stomatal limitation [51]. In SR86 and IR29, Pn declined without corresponding Ci reduction (Figure 3B,E), indicating non-stomatal limitation from salt-induced damage to chloroplasts, Rubisco activity, and PSII electron transport [52,53]. IR29 showed the greatest chlorophyll loss and a 75% reduction in Gs, reflecting the most severe impairment (Figure 3D). Although SR17′s Gs decreased by 29.63%, its Pn and Ci remained unchanged (Figure 3B,D,E), suggesting moderate stomatal closure as an active water-conserving strategy without seriously compromising the photosynthetic apparatus [50].
Previous studies have shown that salt stress affects the yield components of rice, including effective panicle number, spikelets per panicle, 1000-grain weight, seed setting rate, panicle length, and panicle weight [54,55,56,57,58]. The results of this study indicate that the yields of SR17, SR86, and IR29 all decreased to varying degrees under salt stress. The yield reduction rate of IR29 was substantially higher than those of SR17 and SR86, and its values for all measured indices were significantly lower than those of the control as well as those of SR17 and SR86 under salt stress (Figure 5). Furthermore, compared with the control, SR17 showed no significant reductions in effective panicle number, total spikelets per plant, or seed setting rate under salt stress; this indicates that SR17 can maintain a stable yield structure under long-term salt stress, reflecting its salt tolerance at the yield level.

5. Conclusions

Given that the current research on rice salt tolerance has predominantly focused on the seedling stage, with insufficient attention to the effects of long-term salt stress on the young panicle stage, this study used the salt-tolerant cultivar SR86 and the salt-sensitive cultivar IR29 as controls to characterize the physiological responses and agronomic performance of the rice line SR17 at the young panicle stage under salt stress imposed throughout the entire growth period. SR17 exhibited superior salt tolerance under long-term salt stress, and the results support an association between the salt tolerance of SR17 and lower oxidative damage indicators, maintenance of gas exchange and chlorophyll, and greater yield retention capacity. SR17 can therefore be regarded as a promising material for further breeding and multi-environment trials, and this work provides an important foundation for dissecting the physiological mechanisms underlying salt tolerance during the reproductive stage of rice under long-term salt stress.

Supplementary Materials

The following supporting information can be downloaded at https://www.mdpi.com/article/10.3390/agronomy16171628/s1: Figure S1: Light sensitivity and lodging resistance of SR17 and SR86. (A) Under long-day conditions, SR17 heads and matures normally, while SR86 fails to head. (B) SR17 matures and does not fall over under short-day conditions. (C) SR86 matures under short-day conditions but exhibits lodging.

Author Contributions

Conceptualization, J.C., X.J. and Z.W.; methodology, J.C.; software, J.C.; validation, J.C. and Y.W.; formal analysis, J.C.; investigation, J.C. and Y.W.; resources, J.C., Y.W. and X.J.; data curation, J.C. and X.J.; writing—original draft preparation, J.C.; writing—review and editing, J.C. and Y.W.; visualization, J.C.; supervision, X.J. and Z.W.; project administration, X.J.; funding acquisition, X.J. All authors have read and agreed to the published version of the manuscript.

Funding

This study is supported by the Natural Science Foundation of Guangdong Province (2023A1515012295) and the Program for Guangdong Provincial Innovative team for Development and Utilization of Germplasm Resource of Saline–Alkali-Tolerant Plants, National Key R&D Program of China (2018YFE0207203-2), Foundation of National Center for Technology Innovation of Saline–Alkali-Tolerant Rice, Scientific Research Start-up Funds of Guangdong Ocean University.

Data Availability Statement

The original contributions presented in this study are included in the article/Supplementary Material. Further inquiries can be directed to the corresponding authors.

Conflicts of Interest

The authors declare no conflicts of interest.

References

  1. Ponce, K.S.; Meng, L.; Guo, L.; Leng, Y.; Ye, G. Advances in sensing, response and regulation mechanism of salt tolerance in rice. Int. J. Mol. Sci. 2021, 22, 2254. [Google Scholar] [CrossRef] [Scilit] [PubMed]
  2. Food and Agriculture Organization of the United Nations. World Soil Salinity and Food Security; FAO: Rome, Italy, 2024.
  3. Yang, Y.; Guo, Y. Elucidating the molecular mechanisms mediating plant salt-stress responses. New Phytol. 2018, 217, 523–539. [Google Scholar] [CrossRef] [Scilit] [PubMed]
  4. Zhu, W.; Gu, S.; Jiang, R.; Zhang, X.; Hatano, R. Saline–Alkali soil reclamation contributes to soil health improvement in China. Agriculture 2024, 14, 1210. [Google Scholar] [CrossRef] [Scilit]
  5. An, J.; Qian, Y.; Xie, Z.; Wang, W.; Chen, K.; Zhang, G.; Jiang, J.; Xu, J.; Zheng, T.; Zhang, F.; et al. Lhca4 maintaining photochemical efficiency and ROS homeostasis contributes to rice salt tolerance. Rice 2026. [Google Scholar] [CrossRef] [Scilit] [PubMed]
  6. Reddy, I.N.B.L.; Kim, B.K.; Yoon, I.S.; Kim, K.H.; Kwon, T.R. Salt tolerance in rice: Focus on mechanisms and approaches. Rice Sci. 2017, 24, 123–144. [Google Scholar] [CrossRef] [Scilit]
  7. Liu, C.; Mao, B.; Yuan, D.; Chu, C.; Duan, M. Salt tolerance in rice: Physiological responses and molecular mechanisms. Crop J. 2022, 10, 13–25. [Google Scholar] [CrossRef] [Scilit]
  8. Negrão, S.; Courtois, B.; Ahmadi, N.; Abreu, I.; Saibo, N.; Oliveira, M.M. Recent updates on salinity stress in rice: From physiological to molecular responses. Crit. Rev. Plant Sci. 2011, 30, 329–377. [Google Scholar] [CrossRef] [Scilit]
  9. Krishnamurthy, S.L.; Gautam, R.K.; Sharma, P.C.; Sharma, D.K. Effect of different salt stresses on agro-morphological traits and utilisation of salt stress indices for reproductive stage salt tolerance in rice. Field Crops Res. 2016, 190, 26–33. [Google Scholar] [CrossRef] [Scilit]
  10. Dionisio-Sese, M.L.; Tobita, S. Antioxidant responses of rice seedlings to salinity stress. Plant Sci. 1998, 135, 1–9. [Google Scholar] [CrossRef] [Scilit]
  11. Sackey, O.K.; Feng, N.; Mohammed, Y.Z.; Dzou, C.F.; Zheng, D.; Zhao, L.; Shen, X. A comprehensive review on rice responses and tolerance to salt stress. Front. Plant Sci. 2025, 16, 1561280. [Google Scholar] [CrossRef] [Scilit] [PubMed]
  12. Dong, M.; Xie, Z.; Lian, L.; Shi, L.; Zhang, J.; Liu, Q.; Jiang, Z.; Wu, C. The plasma membrane H+-ATPase OSA2 negatively regulates salt tolerance in rice seedlings. Biochem. Biophys. Res. Commun. 2026, 829, 154235. [Google Scholar] [CrossRef] [Scilit] [PubMed]
  13. Mohanty, A.; Chakraborty, K.; Mondal, S.; Jena, P.; Panda, R.K.; Samal, K.C.; Chattopadhyay, K. Relative contribution of ion exclusion and tissue tolerance traits govern the differential response of rice towards salt stress at seedling and reproductive stages. Environ. Exp. Bot. 2023, 206, 105131. [Google Scholar] [CrossRef] [Scilit]
  14. Mitsuya, S.; Yano, K.; Kawasaki, M.; Taniguchi, M.; Miyake, H. Relationship between the distribution of na and the damages caused by salinity in the leaves of rice seedlings grown under a saline condition. Plant Prod. Sci. 2002, 5, 269–274. [Google Scholar] [CrossRef] [Scilit]
  15. Mao, L.; Lu, J.G.; Jiang, H.Y. Mechanisms of plant responses to salt-alkali stress. Mol. Plant Breed. 2020, 18, 3441–3448. [Google Scholar]
  16. Sierla, M.; Waszczak, C.; Vahisalu, T.; Kangasjärvi, J. Reactive oxygen species in the regulation of stomatal movements. Plant Physiol. 2016, 171, 1569–1580. [Google Scholar] [CrossRef] [Scilit] [PubMed]
  17. Mittler, R.; Zandalinas, S.I.; Fichman, Y.; Breusegem, F.V. Reactive oxygen species signalling in plant stress responses. Nat. Rev. Mol. Cell Biol. 2022, 23, 663–679. [Google Scholar] [CrossRef] [Scilit] [PubMed]
  18. Dietz, K.J.; Vogelsang, L. A general concept of quantitative abiotic stress sensing. Trends Plant Sci. 2024, 29, 319–328. [Google Scholar] [CrossRef] [Scilit] [PubMed]
  19. Liu, X.; Ji, P.; Liao, J.; Duan, X.; Luo, Z.; Yu, X.; Jiang, C.J.; Xu, C.; Yang, H.; Peng, B.; et al. CRISPR/Cas knockout of the NADPH oxidase gene OsRbohB reduces ROS overaccumulation and enhances heat stress tolerance in rice. Plant Biotechnol. J. 2024, 23, 336–351. [Google Scholar] [CrossRef] [Scilit] [PubMed]
  20. Xu, J.; Duan, X.; Yang, J.; Beeching, J.; Zhang, P. Enhanced reactive oxygen species scavenging by overproduction of superoxide dismutase and catalase delays postharvest physiological deterioration of cassava storage roots. Plant Physiol. 2013, 161, 1517–1528. [Google Scholar] [CrossRef] [Scilit] [PubMed]
  21. Zhu, J.K. Salt and drought stress signal transduction in plants. Annu. Rev. Plant Biol. 2002, 53, 247–273. [Google Scholar] [CrossRef] [Scilit] [PubMed]
  22. Lakra, N.; Kaur, C.; Anwar, K.; Singla-Pareek, S.L.; Pareek, A. Proteomics of contrasting rice genotypes: Identification of potential targets for raising crops for saline environment. Plant Cell Environ. 2017, 41, 947–969. [Google Scholar] [CrossRef] [Scilit] [PubMed]
  23. Yang, Y.; Guo, Y. Unraveling salt stress signaling in plants. J. Integr. Plant Biol. 2018, 60, 796–804. [Google Scholar] [CrossRef] [Scilit] [PubMed]
  24. Waszczak, C.; Carmody, M.; Kangasjarvi, J. Reactive oxygen species in plant signaling. Annu. Rev. Plant Biol. 2018, 69, 209–236. [Google Scholar] [CrossRef] [Scilit] [PubMed]
  25. Rahman, A.; Hossain, M.S.; Mahmud, J.A.; Nahar, K.; Hasanuzzaman, M.; Fujita, M. Manganese-induced salt stress tolerance in rice seedlings: Regulation of ion homeostasis, antioxidant defense and glyoxalase systems. Physiol. Mol. Biol. Plants 2016, 22, 291–306. [Google Scholar] [CrossRef] [Scilit] [PubMed]
  26. Arvas, Y.E.; Kocacaliskan, İ.; Erisen, S.; Ordu, E. Antioxidant and molecular response of mutant and native rice (Oryza sativa L.) varieties grown under salt stress. Biologia 2023, 78, 1199–1210. [Google Scholar] [CrossRef] [Scilit]
  27. Afifi, M.; Saker, M.; Ahmed, M.; Khatab, S. Morphological and physiological studies on the effect of salinity and growth promoters on rice plants. Acta Agron. Hung. 2010, 58, 11–20. [Google Scholar] [CrossRef] [Scilit]
  28. Chaves, M.M.; Flexas, J.; Pinheiro, C. Photosynthesis under drought and salt stress: Regulation mechanisms from whole plant to cell. Ann. Bot. 2009, 103, 551–560. [Google Scholar] [CrossRef] [Scilit] [PubMed]
  29. Bose, J.; Munns, R.; Shabala, S.; Gilliham, M.; Pogson, B.; Tyerman, S.D. Chloroplast function and ion regulation in plants growing on saline soils: Lessons from halophytes. J. Exp. Bot. 2017, 68, 3129–3143. [Google Scholar] [CrossRef] [Scilit] [PubMed]
  30. Suo, J.; Zhao, Q.; David, L.; Chen, S.; Dai, S. Salinity response in chloroplasts: Insights from gene characterization. Int. J. Mol. Sci. 2017, 18, 1011. [Google Scholar] [CrossRef] [Scilit] [PubMed]
  31. Zhao, C.; Zhang, H.; Song, C.; Zhu, J.K.; Shabala, S. Mechanisms of plant responses and adaptation to soil salinity. Innovation 2020, 1, 100017. [Google Scholar] [CrossRef] [Scilit] [PubMed]
  32. Li, Y.; Xue, Y.; Guan, Z.; Wang, Z.; Hou, D.; Zhao, T.; Lu, X.; Qi, Y.; Hao, Y.; Liu, J.; et al. Salt stress responses of different rice varieties at panicle initiation: Agronomic traits, photosynthesis, and antioxidants. Plants 2025, 14, 2278. [Google Scholar] [CrossRef] [Scilit] [PubMed]
  33. Duan, S.; Zhao, L.; Jiang, R.; Deng, R.; Zhou, H.; Mohammed, Y.Z.; Yue, N.; Yang, X.; Zhang, M.; Wang, B.; et al. Drill seeding and 5-ALA improve photosynthetic efficiency and ion balance of rice seedlings under salt stress. BMC Plant Biol. 2026, 26, 961. [Google Scholar] [CrossRef] [Scilit] [PubMed]
  34. Prusty, S.; Mishra, S.; Poosapati, S.; Swain, D.M.; Sahoo, R.K. Overexpression of phosphoenolpyruvate carboxykinase increases photosynthetic efficiency and salt tolerance in rice. Plants 2026, 15, 1402. [Google Scholar] [CrossRef] [Scilit] [PubMed]
  35. Liu, Y.; Wang, B.; Li, J.; Song, Z.; Lu, B.; Chi, M.; Yang, B.; Qin, D.; Lam, Y.W.; Li, J.; et al. Salt response analysis in two rice cultivars at seedling stage. Acta Physiol. Plant. 2017, 39, 215. [Google Scholar] [CrossRef] [Scilit] [PubMed]
  36. Moradi, F.; Ismail, A.M. Responses of photosynthesis, chlorophyll fluorescence and ROS-scavenging systems to salt stress during seedling and reproductive stages in rice. Ann. Bot. 2007, 99, 1161–1173. [Google Scholar] [CrossRef] [Scilit] [PubMed]
  37. Singh, R.K.; Kota, S.; Flowers, T.J. Salt tolerance in rice: Seedling and reproductive stage QTL mapping come of age. Theor. Appl. Genet. 2021, 134, 3495–3533. [Google Scholar] [CrossRef] [Scilit] [PubMed]
  38. Chen, R.; Cheng, Y.; Han, S.; Van Handel, B.; Dong, L.; Li, X.; Xie, X. Whole genome sequencing and comparative transcriptome analysis of a novel seawater adapted, salt-resistant rice cultivar-sea rice 86. BMC Genom. 2017, 18, 655. [Google Scholar] [CrossRef] [Scilit] [PubMed]
  39. Hao, Y.; Xu, B.; Zong, W.; Li, S.; Du, D.; Chen, M.; Xiao, D.; Song, Y.; Guo, X.; Li, W.; et al. Directional improvement of agronomic traits in salt-tolerant rice by multiplex-genome-editing. J. Integr. Plant Biol. 2025, 67, 2480–2490. [Google Scholar] [CrossRef] [Scilit] [PubMed]
  40. Liu, C.; Lin, J.Z.; Wang, Y.; Tian, Y.; Zheng, H.P.; Zhou, Z.K.; Zhou, Y.B.; Tang, X.D.; Zhao, X.H.; Wu, T.; et al. The protein phosphatase PC1 dephosphorylates and deactivates CatC to negatively regulate H2O2 homeostasis and salt tolerance in rice. Plant Cell 2023, 35, 3604–3625. [Google Scholar] [CrossRef] [Scilit] [PubMed]
  41. Chen, S.; Li, M.; Zhang, G.; Shi, L.; Liu, Q.; Cheng, H.; Wang, L.; Xia, K.; Gao, W. miR5810–OsMRLP6 module regulates rice salt tolerance by affecting ROS accumulation and K+/Na+ homeostasis. Plant Sci. 2026, 371, 113265. [Google Scholar] [CrossRef] [Scilit] [PubMed]
  42. Cai, W.; Liu, W.; Wang, W.S.; Fu, Z.W.; Han, T.T.; Lu, Y.T. Overexpression of rat neurons nitric oxide synthase in rice enhances drought and salt tolerance. PLoS ONE 2015, 10, e0131599. [Google Scholar] [CrossRef] [Scilit] [PubMed]
  43. Li, Q.; Yang, A.; Zhang, W.H. Comparative studies on tolerance of rice genotypes differing in their tolerance to moderate salt stress. BMC Plant Biol. 2017, 17, 141. [Google Scholar] [CrossRef] [Scilit] [PubMed]
  44. Bradford, M. A rapid and sensitive method for the quantitation of microgram quantities of protein utilizing the principle of protein-dye binding. Anal. Biochem. 1976, 72, 248–254. [Google Scholar] [CrossRef] [PubMed]
  45. Demiral, T.; Turkan, I. Comparative lipid peroxidation, antioxidant defense systems and proline content in roots of two rice cultivars differing in salt tolerance. Environ. Exp. Bot. 2005, 53, 247–257. [Google Scholar] [CrossRef] [Scilit]
  46. Fadzilla, N.M.; Finch, R.P.; Burdon, R.H. Salinity, oxidative stress and antioxidant responses in shoot cultures of rice. J. Exp. Bot. 1997, 48, 325–331. [Google Scholar] [CrossRef] [Scilit]
  47. Vighi, I.L.; Benitez, L.C.; Amaral, M.N.; Moraes, G.P.; Auler, P.A.; Rodrigues, G.S.; Deuner, S.; Maia, L.C.; Braga, E.J.B. Functional characterization of the antioxidant enzymes in rice plants exposed to salinity stress. Biol. Plant. 2017, 61, 540–550. [Google Scholar] [CrossRef] [Scilit]
  48. Kumar, V.; Shriram, V.; Nikam, T.D.; Jawali, N.; Shitole, M.G. Antioxidant enzyme activities and protein profiling under salt stress in indica rice genotypes differing in salt tolerance. Arch. Agron. Soil Sci. 2009, 55, 379–394. [Google Scholar] [CrossRef] [Scilit]
  49. Chunthaburee, S.; Dongsansuk, A.; Sanitchon, J.; Pattanagul, W.; Theerakulpisut, P. Physiological and biochemical parameters for evaluation and clustering of rice cultivars differing in salt tolerance at seedling stage. Saudi J. Biol. Sci. 2016, 23, 467–477. [Google Scholar] [CrossRef] [Scilit] [PubMed]
  50. Acosta-Motos, J.; Ortuño, M.; Bernal-Vicente, A.; Diaz-Vivancos, P.; Sanchez-Blanco, M.; Hernandez, J. Plant responses to salt stress: Adaptive mechanisms. Agronomy 2017, 7, 18. [Google Scholar] [CrossRef] [Scilit]
  51. Kao, W.Y.; Tsai, T.T.; Tsai, H.C.; Shih, C.N. Response of three Glycine species to salt stress. Environ. Exp. Bot. 2006, 56, 120–125. [Google Scholar] [CrossRef] [Scilit]
  52. Wang, X.S.; Wang, J.; Yin, J.C.; Li, J.H. Comparison of the physiological factors in ion accumulation and photosynthetic electron transport between legumes Medicago truncatula and Medicago sativa under salt stress. Plant Soil 2022, 484, 473–486. [Google Scholar] [CrossRef] [Scilit]
  53. Kumar, V.; Srivastava, A.K.; Sharma, D.; Pandey, S.P.; Pandey, M.; Dudwadkar, A.; Parab, H.J.; Suprasanna, P.; Das, B.K. Antioxidant defense and ionic homeostasis govern stage-specific response of salinity stress in contrasting rice varieties. Plants 2024, 13, 778. [Google Scholar] [CrossRef] [Scilit] [PubMed]
  54. Asch, F.; Wopereis, M.C.S. Responses of field-grown irrigated rice cultivars to varying levels of floodwater salinity in a semi-arid environment. Field Crops Res. 2001, 70, 127–137. [Google Scholar] [CrossRef] [Scilit]
  55. Abdullah, Z.; Khan, M.A.; Flowers, T.J. Causes of sterility in seed set of rice under salinity stress. J. Agron. Crop Sci. 2001, 187, 25–32. [Google Scholar] [CrossRef] [Scilit]
  56. Motamed, M.K.; Asadi, R.; Rezaei, M.; Amiri, E. Response of high yielding rice varieties to NaCl salinity in greenhouse circumstances. Afr. J. Biotechnol. 2008, 7, 3866–3873. [Google Scholar]
  57. Clermont-Dauphin, C.; Suwannang, N.; Grunberger, O.; Claude, H.; Maeght, J.I. Yield of rice under water and soil salinity risks in farmers’ fields in northeast Thailand. Field Crops Res. 2010, 118, 289–296. [Google Scholar] [CrossRef] [Scilit]
  58. Mojakkir, A.M.; Tareq, M.Z.; Mottalib, M.A.; Hoque, A.B.M.Z.; Hossain, M.A. Effect of salinity at reproductive stage in rice. Int. J. Bus. Soc. Sci. Res. 2015, 3, 7–12. [Google Scholar]
Figure 1. Leaf electrolyte leakage and MDA content. (A) MDA content. (B) Relative electrical conductivity. Data are presented as the mean ± standard deviation (SD). In the analysis of variance (ANOVA) tables, S, V, and S × V denote salt stress, variety, and their interaction, respectively. Asterisks indicate significant differences at *** p ≤ 0.001. Different lowercase letters indicate significant differences among varieties under the same salt stress condition, while different uppercase letters indicate significant differences between salt stress treatments within the same variety.
Agronomy 16 01628 g001
Figure 2. Antioxidant enzyme activity and soluble protein content. (A) SOD activity. (B) POD activity. (C) CAT activity. (D) Soluble protein content, SP. Data are presented as the mean ± standard deviation (SD). In the analysis of variance (ANOVA) tables, S, V, and S × V denote salt stress, variety, and their interaction, respectively. Asterisks indicate significant differences at * p ≤ 0.05, ** p ≤ 0.01, and *** p ≤ 0.001, respectively; ns indicates no significant difference. Different lowercase letters indicate significant differences among varieties under the same salt stress condition, while different uppercase letters indicate significant differences between salt stress treatments within the same variety.
Agronomy 16 01628 g002
Figure 3. Chlorophyll content and photosynthetic parameters. (A) Chlorophyll content. (B) Net photosynthetic rate, Pn. (C) Transpiration rate, Tr. (D) Stomatal conductance, Gs. (E) Intercellular CO2 concentration, Ci. Data are presented as the mean ± standard deviation (SD). In the analysis of variance (ANOVA) tables, S, V, and S × V denote salt stress, variety, and their interaction, respectively. Asterisks indicate significant differences at ** p ≤ 0.01, and *** p ≤ 0.001, respectively; ns indicates no significant difference. Different lowercase letters indicate significant differences among varieties under the same salt stress condition, while different uppercase letters indicate significant differences between salt stress treatments within the same variety.
Agronomy 16 01628 g003
Figure 4. The phenotypic characteristics of SR17, SR86 and IR29 in the salt ponds. Photos of the SR17, SR86 and IR29 plants harvested from the salt pond (A), the harvested panicles (B) and spikelets (C). Scale bars: 10 cm in (A) and 2 cm in (B,C).
Agronomy 16 01628 g004
Figure 5. Agronomic trait statistics. (A) Height; (B) effective panicle number; (C) spikelet number per panicle; (D) total spikelet number per plant; (E) seed setting rate; (F) 1000-grain weight; (G) grain yield per plant; (H) main spikelet number; (I) panicle length; (J) panicle weight. Data are presented as the mean ± standard deviation (SD). In the analysis of variance (ANOVA) tables, S, V, and S × V denote salt stress, variety, and their interaction, respectively. Asterisks indicate significant differences at * p ≤ 0.05, ** p ≤ 0.01, and *** p ≤ 0.001, respectively; ns indicates no significant difference. Different lowercase letters indicate significant differences among varieties under the same salt stress condition, while different uppercase letters indicate significant differences between salt stress treatments within the same variety.
Agronomy 16 01628 g005
Disclaimer/Publisher’s Note: The statements, opinions and data contained in all publications are solely those of the individual author(s) and contributor(s) and not of MDPI and/or the editor(s). MDPI and/or the editor(s) disclaim responsibility for any injury to people or property resulting from any ideas, methods, instructions or products referred to in the content.