Article

Biochar Exacerbates Nitrogen Loss in Drought-Affected Soil with Green Manure Application

1
Yunnan Provincial Key Laboratory of Soil Carbon Sequestration and Pollution Control, Faculty of Environmental Science & Engineering, Kunming University of Science & Technology, Kunming 650500, China
2
Yunnan International Joint Laboratory for Emission Reduction and Carbon Sequestration in Agricultural Soils, Kunming 650500, China
3
Shandong Provincial Key Laboratory of Water and Soil Conservation and Environmental Protection, College of Resources and Environment, Linyi University, Linyi 276005, China
4
Department of Environmental Chemistry, University of Maria Skłodowska-Curie, Pl. M. Curie-Sklodowskiej 3, 20-031 Lublin, Poland
*
Author to whom correspondence should be addressed.
Agronomy 2026, 16(15), 1496; https://doi.org/10.3390/agronomy16151496
Submission received: 29 June 2026 / Revised: 23 July 2026 / Accepted: 31 July 2026 / Published: 4 August 2026
(This article belongs to the Section Soil and Plant Nutrition)

Abstract

The impact of biochar on N conversion in drought-affected soil with green manure application has not been systematically investigated. Therefore, this study examined the effects of biochar produced at 350 °C, 550 °C, and 750 °C (BC350, BC550, and BC750) on green manure (Medicago sativa L.) decomposition and N turnover in soil (Hapli-Udic Ferralosol) during a 60-day laboratory incubation experiment under different moisture conditions (45% or 65% soil water-holding capacity (WHC)). Due to low-temperature biochar (BC350) possessing hydrophilicity (thereby enhancing water retention) due to its surface oxygen-containing functional groups, while high-temperature biochar (BC750) relies on the aromatic conjugated π-electron system for electron transfer, both BC350 and BC750 promoted green manure decomposition and mineralization. Compared with green manure alone, co-application of BC350 and BC750 with green manure increased soil NH4+–N content by 5.58% and 38.37%, respectively. However, a significant total N loss (>11%) occurred under drought conditions. Partial least squares path modeling was used to elucidate the key driving pathways related to C and N sequestration in drought-affected soil with green manure and biochar co-application. The results indicate that the enhanced soil N loss could be attributed to both the biochar-induced rise in soil pH (>8%) and the drought-driven suppression of stable organic matter (e.g., >20% reduction in humus acid) and macroaggregate formation. This study demonstrates that although biochar addition can promote the decomposition of green manure to release available N, it may also exacerbate total soil N loss. Only under normal moisture conditions can the N released from green manure be converted into humus-associated N.

1. Introduction

Green manure is rich in essential nutrients for plants, such as nitrogen (N), phosphorus (P), and potassium (K), and is an important sustainable organic fertilizer in traditional horticulture. Applying green manure can reduce chemical fertilizers’ reliance and increase soil organic matter (SOM) content [1], soil cation exchange capacity (CEC), and soil productivity [2]. However, most green manure exhibits a relatively slow biodegradation rate in field conditions [3]; therefore, released nutrients have a temporal synchrony difference between crop-N demand and soil-N availability [4]. Particularly in arid areas, the decomposition of green manure may take more than one year [5], which has seriously affected its wide application. In addition, returning green manure to the field can stimulate microbial activity, leading to N2O release, which ultimately results in N loss [6]. Therefore, achieving rapid nutrient release from green manure while ensuring long-term nutrient retention in the soil represents a challenge that must be addressed for effective green manure application.
The moisture content of soil significantly influences the turnover of N and microbial activity. The percentage of soil moisture content in relation to soil water-holding capacity (WHC) serves as an indicator of drought degree. The following classification is used: no drought (>60%), mild drought (50–60%), moderate drought (40–50%), severe drought (30–40%), and exceptional drought (<30%) [7]. The decomposition of green manure and its N conversion vary significantly, owing to different soil moisture levels. Suboptimal moisture levels could impede the activity of soil microorganisms, alter their community structure, inhibit enzymatic activity, and slow down the rate of green manure decomposition [8]. Zhou et al. verified that green manure significantly increased N2O emissions under 50% WHC. Conversely, under 70% WHC, the decomposition of green manure depleted oxygen, which reduced N2O emissions by accelerating the further reduction of N2O to N2 through denitrification [9]. Changes in soil environment also significantly affect the microbial community during green manure decomposition. Li et al. reported that environmental variables, including litter addition and soil depth, exerted strong selective pressure on the bacterial community, resulting in a pronounced enrichment of Actinobacteria and a concurrent suppression of Firmicutes; by comparison, the fungal community, composed primarily of Ascomycota and Basidiomycota, showed higher resilience, and such divergence in microbial community assembly ultimately contributed to differences in litter decomposition rates among treatments [10]. Wang et al. also found that the abundances of Acidobacteria and Bacteroidetes rose significantly during decomposition, while those of Actinobacteria and Chloroflexi decreased after decomposition [11].
Numerous studies have indicated that under the influence of biochar, mineral N may undergo nitrification and denitrification processes, converting into N2 and N2O that escape from the soil [12]. Alternatively, under specific conditions, it may also be transformed into stable organic N by microorganisms and stored in the soil. In addition, the functional groups and pore structure of biochar can adsorb and fix inorganic N, thereby reducing the accessibility of reaction substrate for nitrification and denitrification in agroecosystems [13]. Furthermore, the high CEC and adsorption capacity of biochar enabled it to absorb NH4+–N, effectively mitigating the volatilization of NH3 [14]. However, Hu, et al. reported that the co-application of biochar with organic fertilizers increased the abundance of N-mineralizing microorganisms, promoted organic N mineralization, and elevated the NO3–N content, which might increase the risk of N leaching loss [15]. The effects of biochar on N transformation vary with its properties, which are closely related to pyrolysis temperature. While many studies have examined the role of biochar properties in regulating soil N transformation, the majority of these studies have concentrated only on the dynamics of available N, which constitutes a minor portion of soil N. In contrast, the loss of total N and its comprehensive discussion under organic N (e.g., green manure) addition have received far less attention.
Low-temperature biochar (e.g., pyrolyzed at 350 °C) exhibits strong hydrophilicity due to its surface richness in polar oxygen-containing groups, which engage in firm hydrogen bonding with water molecules [16]. The large specific surface area and the abundance of the functional groups of biochar can enhance the WHC of soil [17], and the greater hydrophilicity of lower-temperature biochar improves soil water retention [18], which in turn enhances microbial activity [19]. Li et al. demonstrated that biochar addition during the composting process retained moisture, consequently promoting the decomposition of organic matter and accelerating NH4+–N and NO3–N production [20], while also increasing WHC and facilitating humification [21]. Although existing research has shown that biochar promotes green manure decomposition and N turnover under favorable moisture conditions, whether such positive effects are sustained under drought and the associated mechanisms remain poorly understood, with systematic investigations still lacking. We speculated that the hydrophilicity of biochar may accelerate the decomposition of green manure and promote N release under drought conditions but may not promote its transformation into a more stable N form, potentially resulting in N loss from drought-affected soil.
As the pyrolysis temperature increases, the content of oxygen-containing functional groups and the hydrophilicity of biochar tend to decrease, while pH, specific surface area, C content, and electrical conductivity (EC) increase accordingly [22]. At elevated temperatures (e.g., 750 °C), biochar develops extensive graphite-like sheet structures composed of aromatic rings. The delocalized conjugated π-electrons residing on these rings can migrate freely throughout the C skeleton, thereby establishing an efficient pathway for electron transfer [23]. Consequently, biochar can function as an electron shuttle, reducing the electron-transfer distance and improving the efficiency of electron transfer across microbial interfaces [24], thereby promoting N conversion. However, Liu et al. found that the liming effect of biochar in the topsoil increased soil pH, thereby exacerbating NH3 volatilization losses in soils with neutral pH [25]. A clear understanding of the mechanisms underlying biochar-mediated soil N immobilization under drought conditions is currently lacking. Water limitation may adversely affect long-term immobilization by inhibiting microbial activity and mass diffusion. We propose that biochar with higher aromaticity may stimulate microbial activity through enhanced electron transfer, thereby accelerating green manure decomposition. Importantly, enhanced microbial activity promotes the production and accumulation of microbial necromass. These microbial residues can be physically protected by occlusion within soil aggregates or transformed via microbial processes into stable organic N pools, such as humus acid–N, thereby facilitating long-term N stabilization in soils. Meanwhile, biochar with elevated pH may further increase soil pH and stimulate NH3 volatilization, representing a competing loss pathway.
Thus, this study investigated the impact of biochar addition at different pyrolysis temperatures (350 °C, 550 °C, and 750 °C) on the decomposition and N conversion of green manure and its effect on soil N cycling at 45% and 65% soil WHC contents through biochar co-application with green manure. This research linked the physicochemical properties of biochar to soil N-cycling processes toward unveiling the mechanisms that govern nutrient release and retention in drought-affected soils. The following three hypotheses will be tested: (1) the aromatic structure and the hydrophilicity of biochar can promote green manure decomposition in drought-affected soil; (2) the integrative effect of biochar can promote the formation of macroaggregates and humification processes under normal moisture conditions, thereby retaining soil N; and (3) under drought conditions, biochar application further increases soil pH, which may enhance NH3 volatilization and promote denitrification, collectively exacerbating soil total N (TN) loss.

2. Materials and Methods

2.1. Biochar Preparation and Characterization

Bagasse was sourced from the Sugarcane Research Institute, Yunnan Academy of Agricultural Sciences, and was air-dried and crushed into 2–3 cm pieces. Bagasse biochars were produced in an oxygen-limited carbonization furnace at 350 °C, 550 °C, and 750 °C for 1 h and labeled as BC350, BC550 and BC750, respectively. The surface area of the biochar was determined by N2 adsorption–desorption isotherms obtained from a surface area analyzer at 77 K by a BET Surface Area Analyzer (ASAP 2020, Micromeritics, Norcross, GA, USA). The elemental composition (C, H, O, and N) of biochar (including biochar picked out with tweezers after soil cultivation) and green manure were determined using an Elemental Analyzer (Microcube, Elementar, Frankfurt, Germany). A Fourier-transform infrared spectrometer (Varian 640-IR, Thermo Fisher, Waltham, MA, USA) was used to determine the surface functional groups of biochar via the potassium bromide tablet method. The signal of persistent free radicals (PFRs) in biochar was measured by electron paramagnetic resonance spectroscopy (A300-6/1, Bruker, Ettlingen, Germany). The EC of biochar was measured at a powder compaction pressure of 6 MPa by a Powder Electrical Resistivity Meter (ST2722, Suzhou Lattice Electronics Co., Ltd., Suzhou, China).

2.2. Experimental Design

The green manure used was Medicago sativa L., which was harvested at the peak of flowering, air-dried and crushed into 2–3 cm pieces and is rich in protein, vitamins, and minerals. The moisture content of air-dried alfalfa was approximately 10%. Soil was collected from the campus of Kunming University of Science and Technology, air-dried, and sieved through a 2 mm sieve to remove gravel and plant debris. The soil is classified as Hapli-Udic Ferralosol (Chinese Soil Taxonomy, CST), which is characterized by its high acidity and low organic matter content. The soil had total C (TC) and TN contents of 7.49 g/kg and 0.76 g/kg, respectively, and a bulk density of approximately 1.22 g/cm3. Plastic pots measuring 42 × 17.5 cm and 14 cm in height were used for cultivation. Biochar and green manure were incorporated into soil at rates equivalent to 2% (w/w) and 1.6% (w/w) of the soil dry weight, respectively. The mixed materials (totaling 4 kg) were then filled into the pots. These treatments were labeled as follows: CK (soil alone), GM (soil + green manure), GB350 (soil + green manure + BC350), GB550 (soil + green manure + BC550), and GB750 (soil + green manure + BC750). This study focused on the rapid release and turnover dynamics of carbon (C) and N, processes that were predominantly concentrated within the first 60 days after green manure incorporation—a period commonly referred to as the rapid decomposition phase [26]. The cultivation period of this study was relatively short (60 days), and the N in the biochar might not be released at all. In addition, the N content of biochar did not decrease significantly after cultivation (Table 1). Moreover, this study mainly focused on the effects of the combined application of biochar on N turnover in soil amended with green manure. Therefore, a separate control group with biochar application was not established in this study.
Based on the drought classification criteria reported in the previous literature [7], we selected two moisture conditions: a normal moisture group, which maintained soil moisture at 65% of the soil WHC, and a drought group, which maintained soil moisture at 45% of the WHC. Three replicates are established for each treatment. The cultivation experiment started on 27 April 2023 and ended on 25 June 2023. The cultivation period was 60 days (simulating the fallow period, covering the early and mid-stages of green manure decomposition) in a greenhouse, maintaining a daytime temperature of approximately 25 °C, a nighttime temperature of approximately 10 °C, and relative air humidity around 60%. Soil samples were collected on the 5th, 10th, 15th, 20th, 30th, 45th, and 60th day. Soil samples were collected with care to prevent significant disturbance. Fresh soil samples were immediately stored in a refrigerator at −80 °C, while air-dried soil was spread out to dry naturally and then stored. Cumulative CO2 and N2O release were determined by cultivating soil with green manure and biochar in 250 mL silk bottles with an incubator for 60 days. The key methodological details are elaborated in Text S1.

2.3. Measurement of Soil-Quality Indicators

Soil pH was measured using a pH meter (Model PHSJ-5T, LeiCi, Shanghai, China). The soil-to-water mass ratio was 1:5 (g:mL). The soil solution was shaken for 0.5 h, left to stand, and measured within 1 h. Soil TN and TC were determined by an Elemental Analyzer (Microcube, Elementar, Frankfurt, Germany). Appropriate amounts of air-dried soil and soil (undecomposed green manure carefully removed by tweezers) were obtained and then analyzed using an elemental analyzer. NH4+–N and NO3–N in soil were leached using a 2 M KCl solution. The solid-to-liquid ratio of soil to solution was 1:2.5 (g:mL). After 2 h of shaking (180 r/min), the solution was centrifuged (3040× g) and filtered for measurement. NO3–N and NH4+–N were determined using a continuous flow chemical analyzer (SKALAR San++Classic, SKALAR ANALYTICAL B.V., Breda, The Netherlands). Soil nitrification potential (PN) was determined by the chloride inhibition method [21]. The suspension of soil samples was incubated in a shaker at 25 °C for 2 and 6 h. Subsequently, 2 mL was obtained and added to 2 mL of a 4 M KCl solution to leach NO2–N. NO2–N was color-developed with N-(1-naphthyl)-ethylenediamine and measured at 540 nm (UV-2600, Shimadzu, Kyoto, Japan). Total humus acid was extracted using 0.1 M of NaOH + Na4P2O7. Briefly, 5 g of soil was extracted several times until the extract was nearly colorless. A portion of the leachate was acidified with HCl to pH = 1 and allowed to stand for 24 h at 25 °C. The precipitate was humic acid. Humic acid was dissolved in 0.1 M of NaOH [27] and subsequently analyzed using a total organic C analyzer (vario TOC cube, Elementar, Frankfurt, Germany). The determination of total humus acid–N was conducted by taking soil samples separately. The soil was washed with 2 M of KCl before total humus acid–N extraction. Total humus acid–N extraction was determined by alkaline potassium persulfate oxidation.
Soil microbial biomass C (MBC) and microbial biomass N (MBN) were determined using the chloroform fumigation extraction method. Briefly, 2.5 g of the soil sample was collected in a beaker and placed in a vacuum desiccator filled with chloroform. The vacuum was maintained for 2 min, and the sample was then incubated at 25 °C for 24 h in the dark. After cultivation, the sample was extracted with 10 mL of 0.5 M of K2SO4. After shaking for 30 min, the samples were centrifuged and filtered. Nonfumigated soil was used as a control. TOC was determined using a total organic C analyzer (vario TOC cube, Elementar, Frankfurt, Germany), and TN was determined by alkaline potassium persulfate oxidation. Soil microorganism sequencing was then performed by the Personal Biotechnology Company (Shanghai, China) by using the Pacific Biosciences platform and the Illumina Novaseq platform [28]. The bacterial 16S_V3V4 region was amplified by using primers 338 F (ACTCCTACGGGAGGCAGCA) and 806R (GGACTACHVGGGTWTCTAAT). The fungal ITS1 region was amplified by using the primers ITS1F (CTTGGTCATTTAGAGGAAGTAA) and ITS2 (GCTGCGTTCTTCATCGATGC). In addition, the various forms of soil N were calculated as follows:
U n d e c o m p o s i t i o n N = T N 2 T N 3 T N 1 × 100 %
A p p a r e n t   L o s s N = T N 1 T N 2 T N 1 × 100 %
I n o r g a n i c N / M B N / T o t a l   h u m u s   a c i d N = I n o r g a n i c N / M B N / T o t a l   h u m u s   a c i d N T N 1 × 100 %
O t h e r N = 100 % t h e   s u m   o f   t h e   a b o v e   N   p r o p o r t i o n s
TN1 is the TN (TN, including organic N and inorganic N) content in the soil at the beginning of cultivation (5th days), TN2 is the TN content in the soil at the end of cultivation (60th days), and TN3 is the TN content in the soil after removing green manure at the end of cultivation (60th days). Inorganic-N is the sum of NH4+–N and NO3–N content; Apparent Loss-N includes the N that has escaped from the soil (apparent N loss); and Other-N includes other undetected N in the soil.

2.4. Data Analysis

A statistical analysis was performed using SPSS version 25.0 (IBM Corporation, Armonk, NY, USA). To account for repeated measurements taken over the 60-day incubation period, a repeated-measures analysis of variance (ANOVA) was conducted. When a significant main effect or interaction was detected, post hoc comparisons were carried out using Tukey’s honestly significant difference (HSD) test to control the family-wise error rate. For variables measured only at a single time point, one-way ANOVA was used, followed by Tukey’s HSD test for multiple comparisons. All data are presented as the mean ± standard error (SE), and statistical significance was set at p < 0.05. To quantify the direct and indirect effects of multiple drivers on soil humus, we applied partial least squares path modeling (PLS-PM) using the “plspm” package (version 0.6.0) in R (version 2025.09.2+418). The structural model was constructed based on hypothesized causal relationships among latent constructs. All manifest variables were modeled in reflective mode (mode A). Model performance was evaluated using R2 values and the goodness-of-fit (GOF) index.

3. Results

3.1. Basic Characterizations of Biochar and Green Manure

As the pyrolysis temperature increased, the C content of biochar gradually increased, while the H and O contents further decreased (Table 2). In addition, the H/C and (O+N)/C ratios of the biochar samples were markedly decreased. A lower H/C ratio indicated higher aromaticity, while a higher (O+N)/C ratio reflected greater polarity. BC350, which exhibits higher polarity, displayed enhanced hydrophilicity and superior water retention in soil. Conversely, the more aromatic BC750 has a higher electron-transfer capacity, with an EC reaching 1.56 × 10³ μS/cm. These graphitic structures contain delocalized π-electron systems that facilitated charge mobility, thereby enhancing the EC of biochar, which was confirmed via the highest EC compared to other biochars (Table 2). Furthermore, the specific surface area of biochar notably increased with increasing pyrolysis temperatures (Table 2). The low C/N ratio of green manure facilitates net N mineralization during its decomposition (Table 2), which consequently increased the soil inorganic N pool and may elevate the risk of N loss.
FTIR spectroscopy revealed that the functional groups of BC350 and BC550 exhibited minimal divergence (Figure 1a). Moreover, the vibrational signal of BC350 at 1715 cm−1 (C=O) displayed a slight enhancement relative to that of BC550. In contrast, BC750 showed vibrational signal peaks only at 1616 (C=C) and 3420 cm−1 (–OH). EPR spectroscopy revealed that BC550 exhibited the strongest PFR signal, whereas BC750 displayed the weakest (Figure 1b).

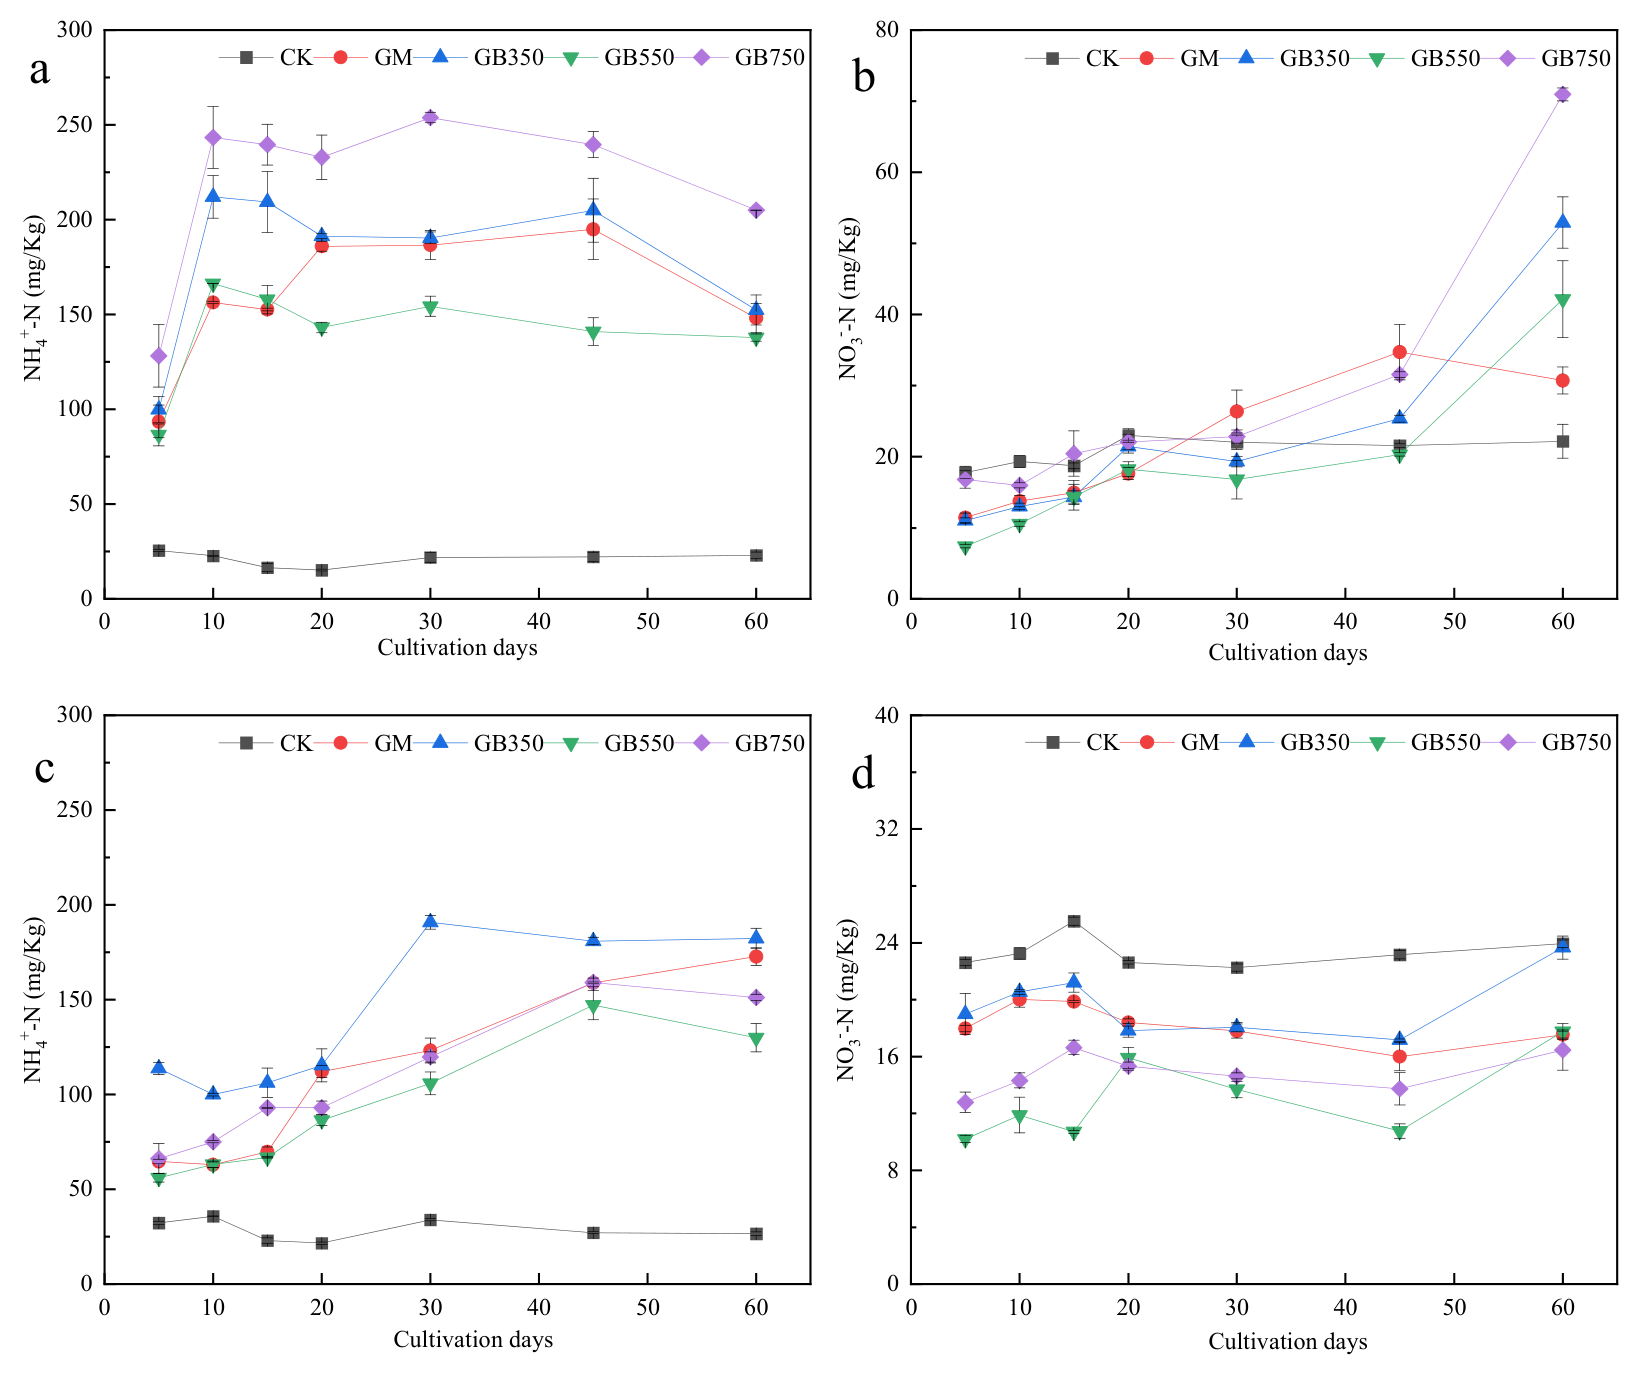
3.2. Changes in Soil NH4+–N and NO3–N Content

Under 65% soil WHC, the green manure alone and biochar with green manure groups demonstrated a notable increase in the NH4+–N content of the soil compared with that in CK (Figure 2a). The highest content was observed in GB750, with NH4+–N content ultimately reaching approximately 250 mg/kg at the end of cultivation. The NH4+–N content of GB350, GB550 and GM was all lower than that of GB750. The initial 10 days of cultivation were characterized by a rapid increase in NH4+–N content. The average cumulative rate of NH4+–N from the 5th to 10th day of the cultivation period was 12.57, 22.43, 15.98 and 23.02 mg/(kgsoil·d) for GM, GB350, GB550 and GB750, respectively, which demonstrated that the addition of BC350 and BC750 was the most effective in promoting green manure N mineralization during the first 10 days of cultivation. Soil NH4+–N content remained relatively stable from the 10th to 45th day of the cultivation period for all tested samples, with the highest concentration observed in GB750 (Figure 2a). At the end of cultivation, the soil NH4+–N content decreased by 14.45%. This might be because the PN was significantly enhanced (Figure S1a), thereby accelerating the transformation of NH4+–N into NO3–N under 65% soil WHC. However, the effect of biochar on NH4+–N content significantly decreased under 45% soil WHC (Figure 2c). Soil NH4+–N content increased significantly only after 30 days. The average cumulative rate of NH4+–N from the 5th to 30th day of the cultivation period was 2.34, 3.08, 1.99, and 2.15 mg/(kgsoil·d) for GM, GB350, GB550, and GB750, respectively. At 45 days of cultivation, the soil NH4+–N content was slightly lower than that of the soil under 65% WHC, reaching ~160 mg/kg.
Under 65% soil WHC, GM, GB350, and GB550 exhibited lower NO3–N content than CK during the initial 20 days of cultivation (Figure 2b). The NO3–N content gradually increased after 30 days and was higher than that of CK (20 mg/kg). The average nitrification rates of soil N in GM, GB350, GB550, and GB750 throughout the cultivation period were 0.35, 0.76, 0.63, and 0.98 mg/(kgsoil·d), respectively. These findings suggest that soil nitrification was facilitated by biochar addition, most effectively by BC750, as evidenced by the corresponding PN results (Figure S1). The NO3–N content of GB750 was consistently higher than that of CK throughout cultivation, reaching ~70 mg/kg at the end of cultivation. By contrast, the NO3–N content among all the treated groups was lower than that of CK under 45% soil WHC (Figure 2d).

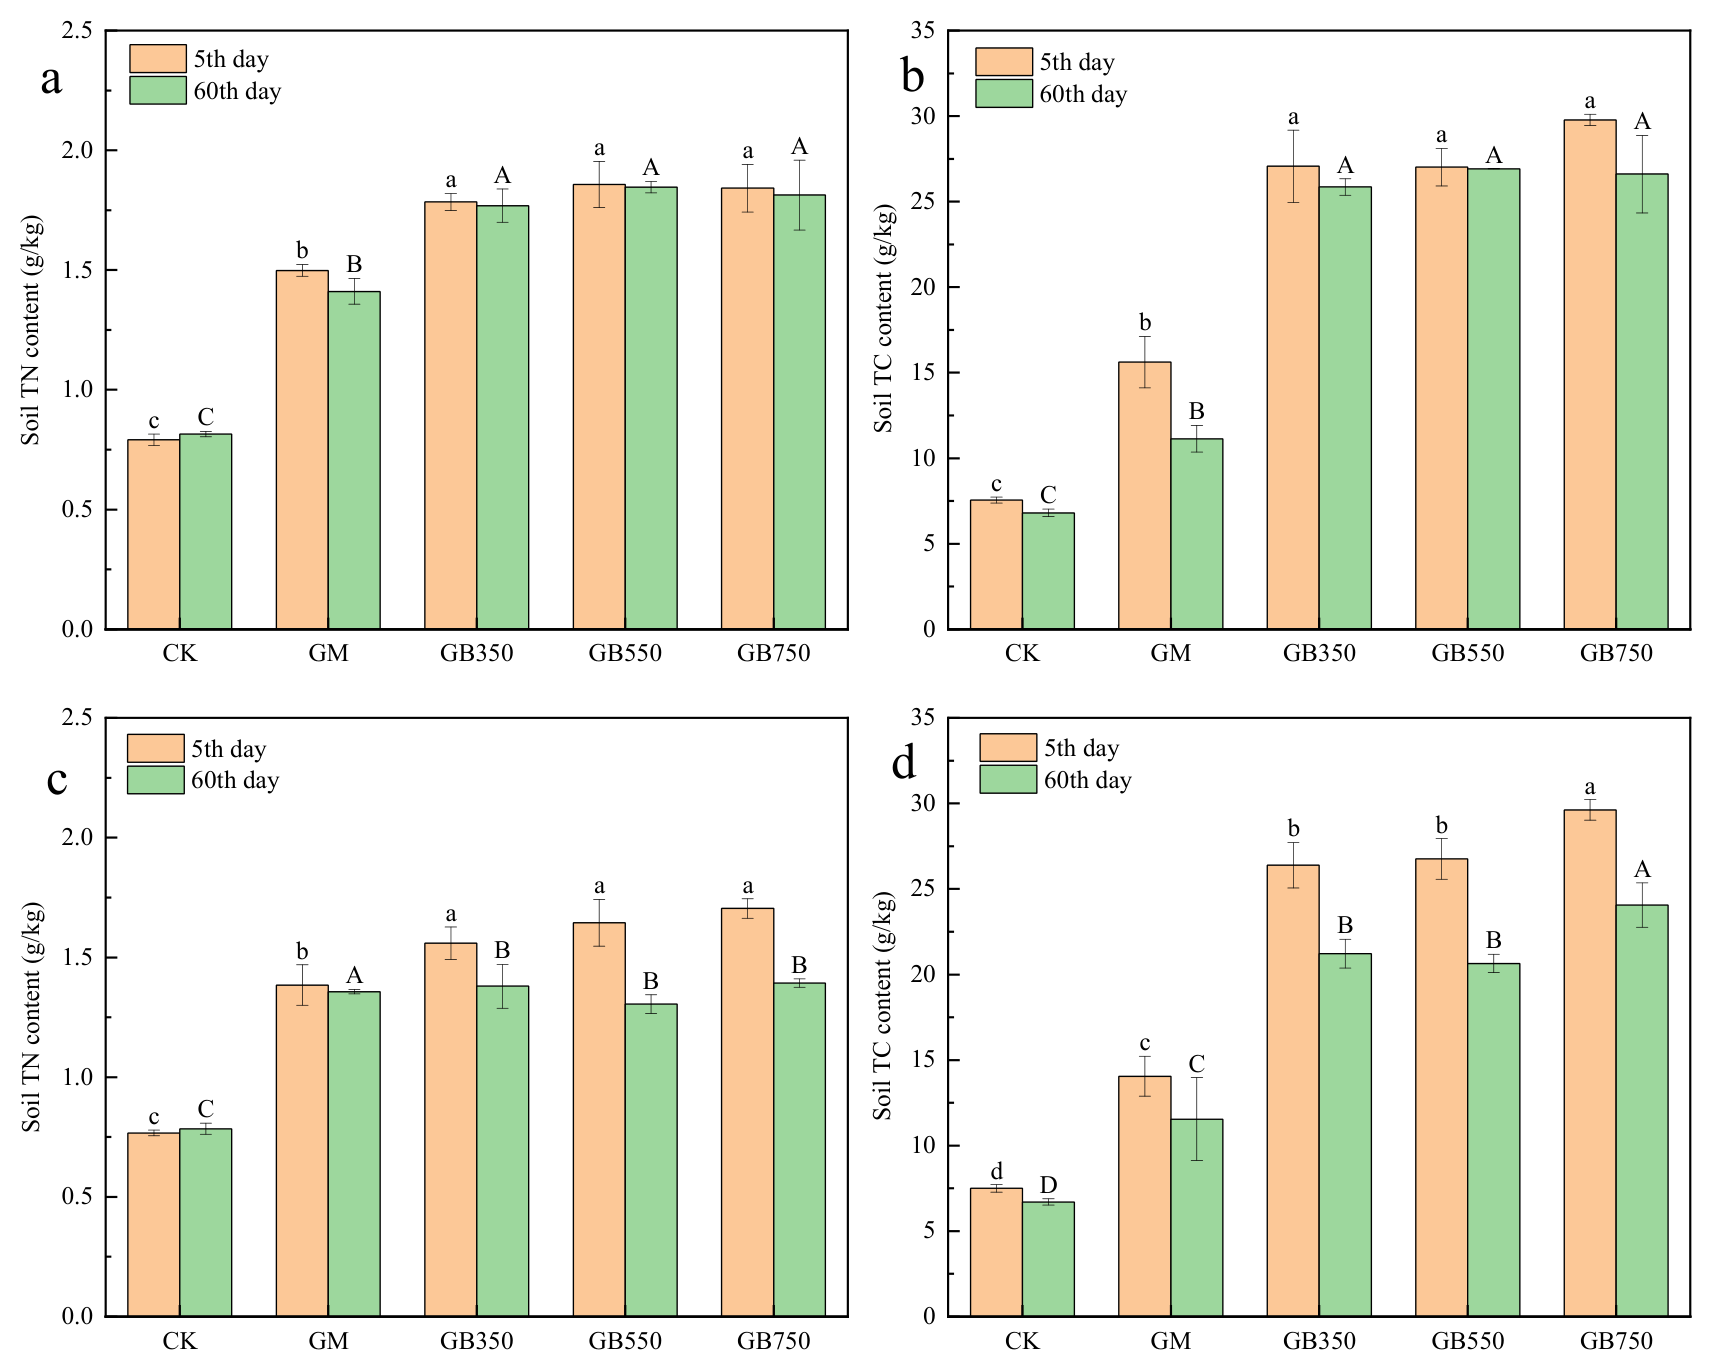
3.3. Changes in Soil TC and TN Contents

The TC and TN contents of the soil after 5th and 60th day of cultivation are shown in Figure 3. The TC and TN contents in the soil of green manure and biochar with green manure groups were higher than those of CK. After 60 days of cultivation, the TC and TN of GM decreased by 28.66% and 5.84%, but the TC and TN contents in the soil with biochar addition showed no significant reduction (Figure 3a,b) under 65% soil WHC. However, the TC and TN contents under all treatments with 45% soil WHC reduced significantly (Figure 3c,d). The TC and TN contents showed an overall decline compared to the 5th day, with decreases of 19.55%, 22.84%, 18.80%, 11.52%, 20.62%, and 18.28%. Furthermore, there are no significant differences in gross N changes among the different pyrolysis temperature biochar (BC350, BC550, and BC750) groups. In contrast, GB750 exhibited the highest TC content.

3.4. Changes in Soil Microbial Biomass and Humus Acid Contents

At the mid-stage of cultivation, the addition of green manure notably enhanced soil MBC at both moisture contents, but it was significantly lower under 45% soil WHC than under 65% soil WHC at levels of 0.12 and 0.22 mg/g, respectively (Table 3). Moreover, under 45% soil WHC, the MBC levels in GB350, GB550, and GB750 (0.15–0.17 mg/g) were all more than 37% higher than those in GM. Similarly, under 65% soil WHC, their MBC values (0.24–0.28 mg/g) also demonstrated increases of over 13% relative to GM. At the end of cultivation, there was no further increase in MBC content with the addition of biochar under 65% or 45% soil WHC. Under 65% soil WHC, the MBN of GB350, GB550, and GB750 decreased significantly, with a reduction exceeding 44% from the mid-stage to the end-stage of cultivation (Table 3). Nevertheless, MBN increased with increasing biochar pyrolysis temperatures at the mid-stage and end-stage of cultivation. Under 45% soil WHC the MBN of GB350 reached 0.024 mg/g at the mid-stage of cultivation, which was significantly enhanced by ~100.54% compared with that in GM (Table 3). However, the MBN exhibited a gradual decline as the biochar pyrolysis temperature increased, and the MBN increased significantly at the end of cultivation under 45% soil WHC.
There was no noticeable change in the MBC/MBN ratio of GM over the cultivation period, with all values remaining within the range of 5–6 under 65% soil WHC (Table 3). However, the MBC/MBN ratio of GB350, GB550, and GB750 exhibited a significant increase of >120% under 65% soil WHC. By contrast, the MBC/MBN ratio was higher under 45% soil WHC than under 65% soil WHC at the mid-stage of cultivation. In addition, the MBC/MBN ratio significantly declined at the end of cultivation under 45% soil WHC.
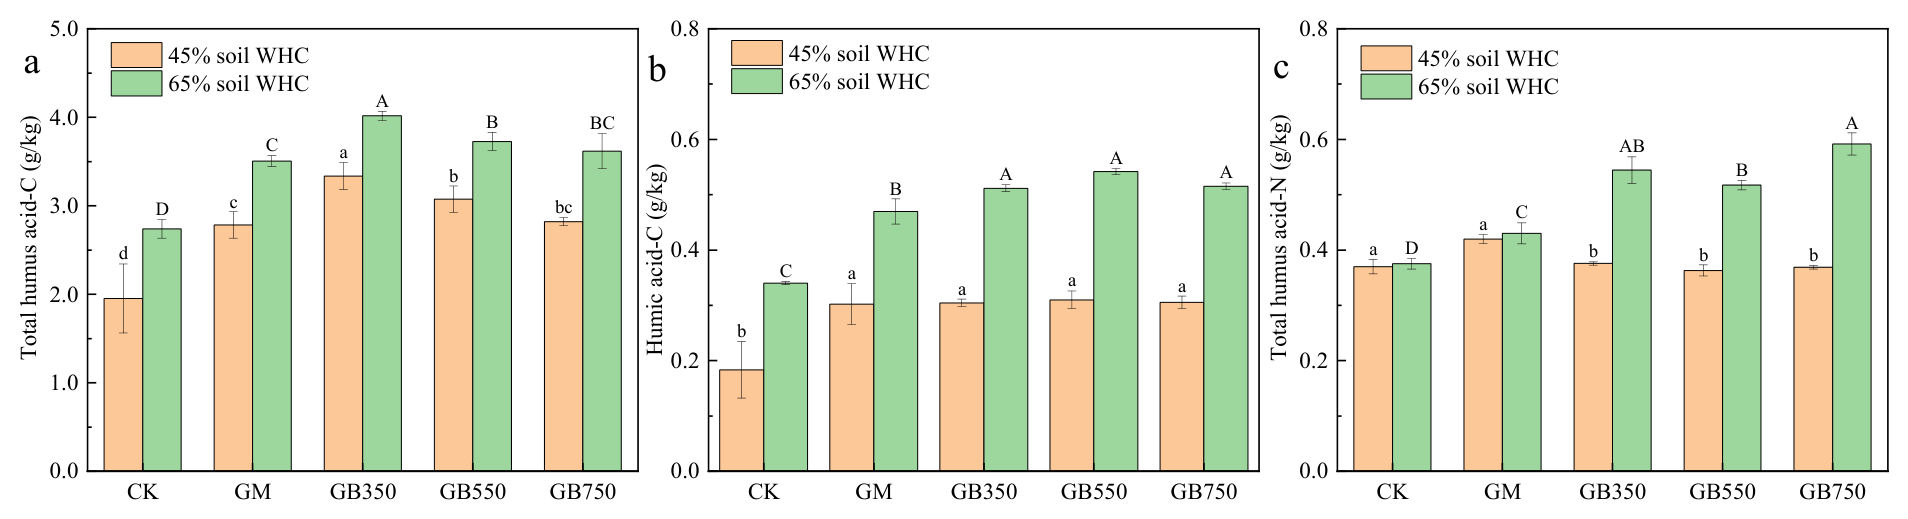
The total humus acid–C content was significantly higher by more than 20% under 65% soil WHC than under 45% soil WHC (Figure 4a). Furthermore, the co-application of biochar with green manure significantly increased the total humus acid–C content. The total humus acid–C content of GB350, GB550, and GB750 under 65% soil WHC increased by 20%, 21%, and 28%, respectively, compared to the corresponding group under 45% soil WHC. Moreover, the content of humic acid–C showed no notable discrepancies among GM, GB350, GB550, and GB750 under 45% soil WHC, with approximately 0.30 mg/g. By contrast, the humic acid–C content in GB350, GB550, and GB750 under 65% soil WHC was significantly higher than that in GM, with all of them increasing by more than 8% relative to GM (Figure 4b). The total humus acid–N content in the soil changed similarly to that of humic acid–C content. However, compared with under 45% soil WHC, the total humus acid–N content of GB350, GB550 and GB750 under 65% soil WHC increased by 45%, 43% and 60%, respectively (Figure 4c).

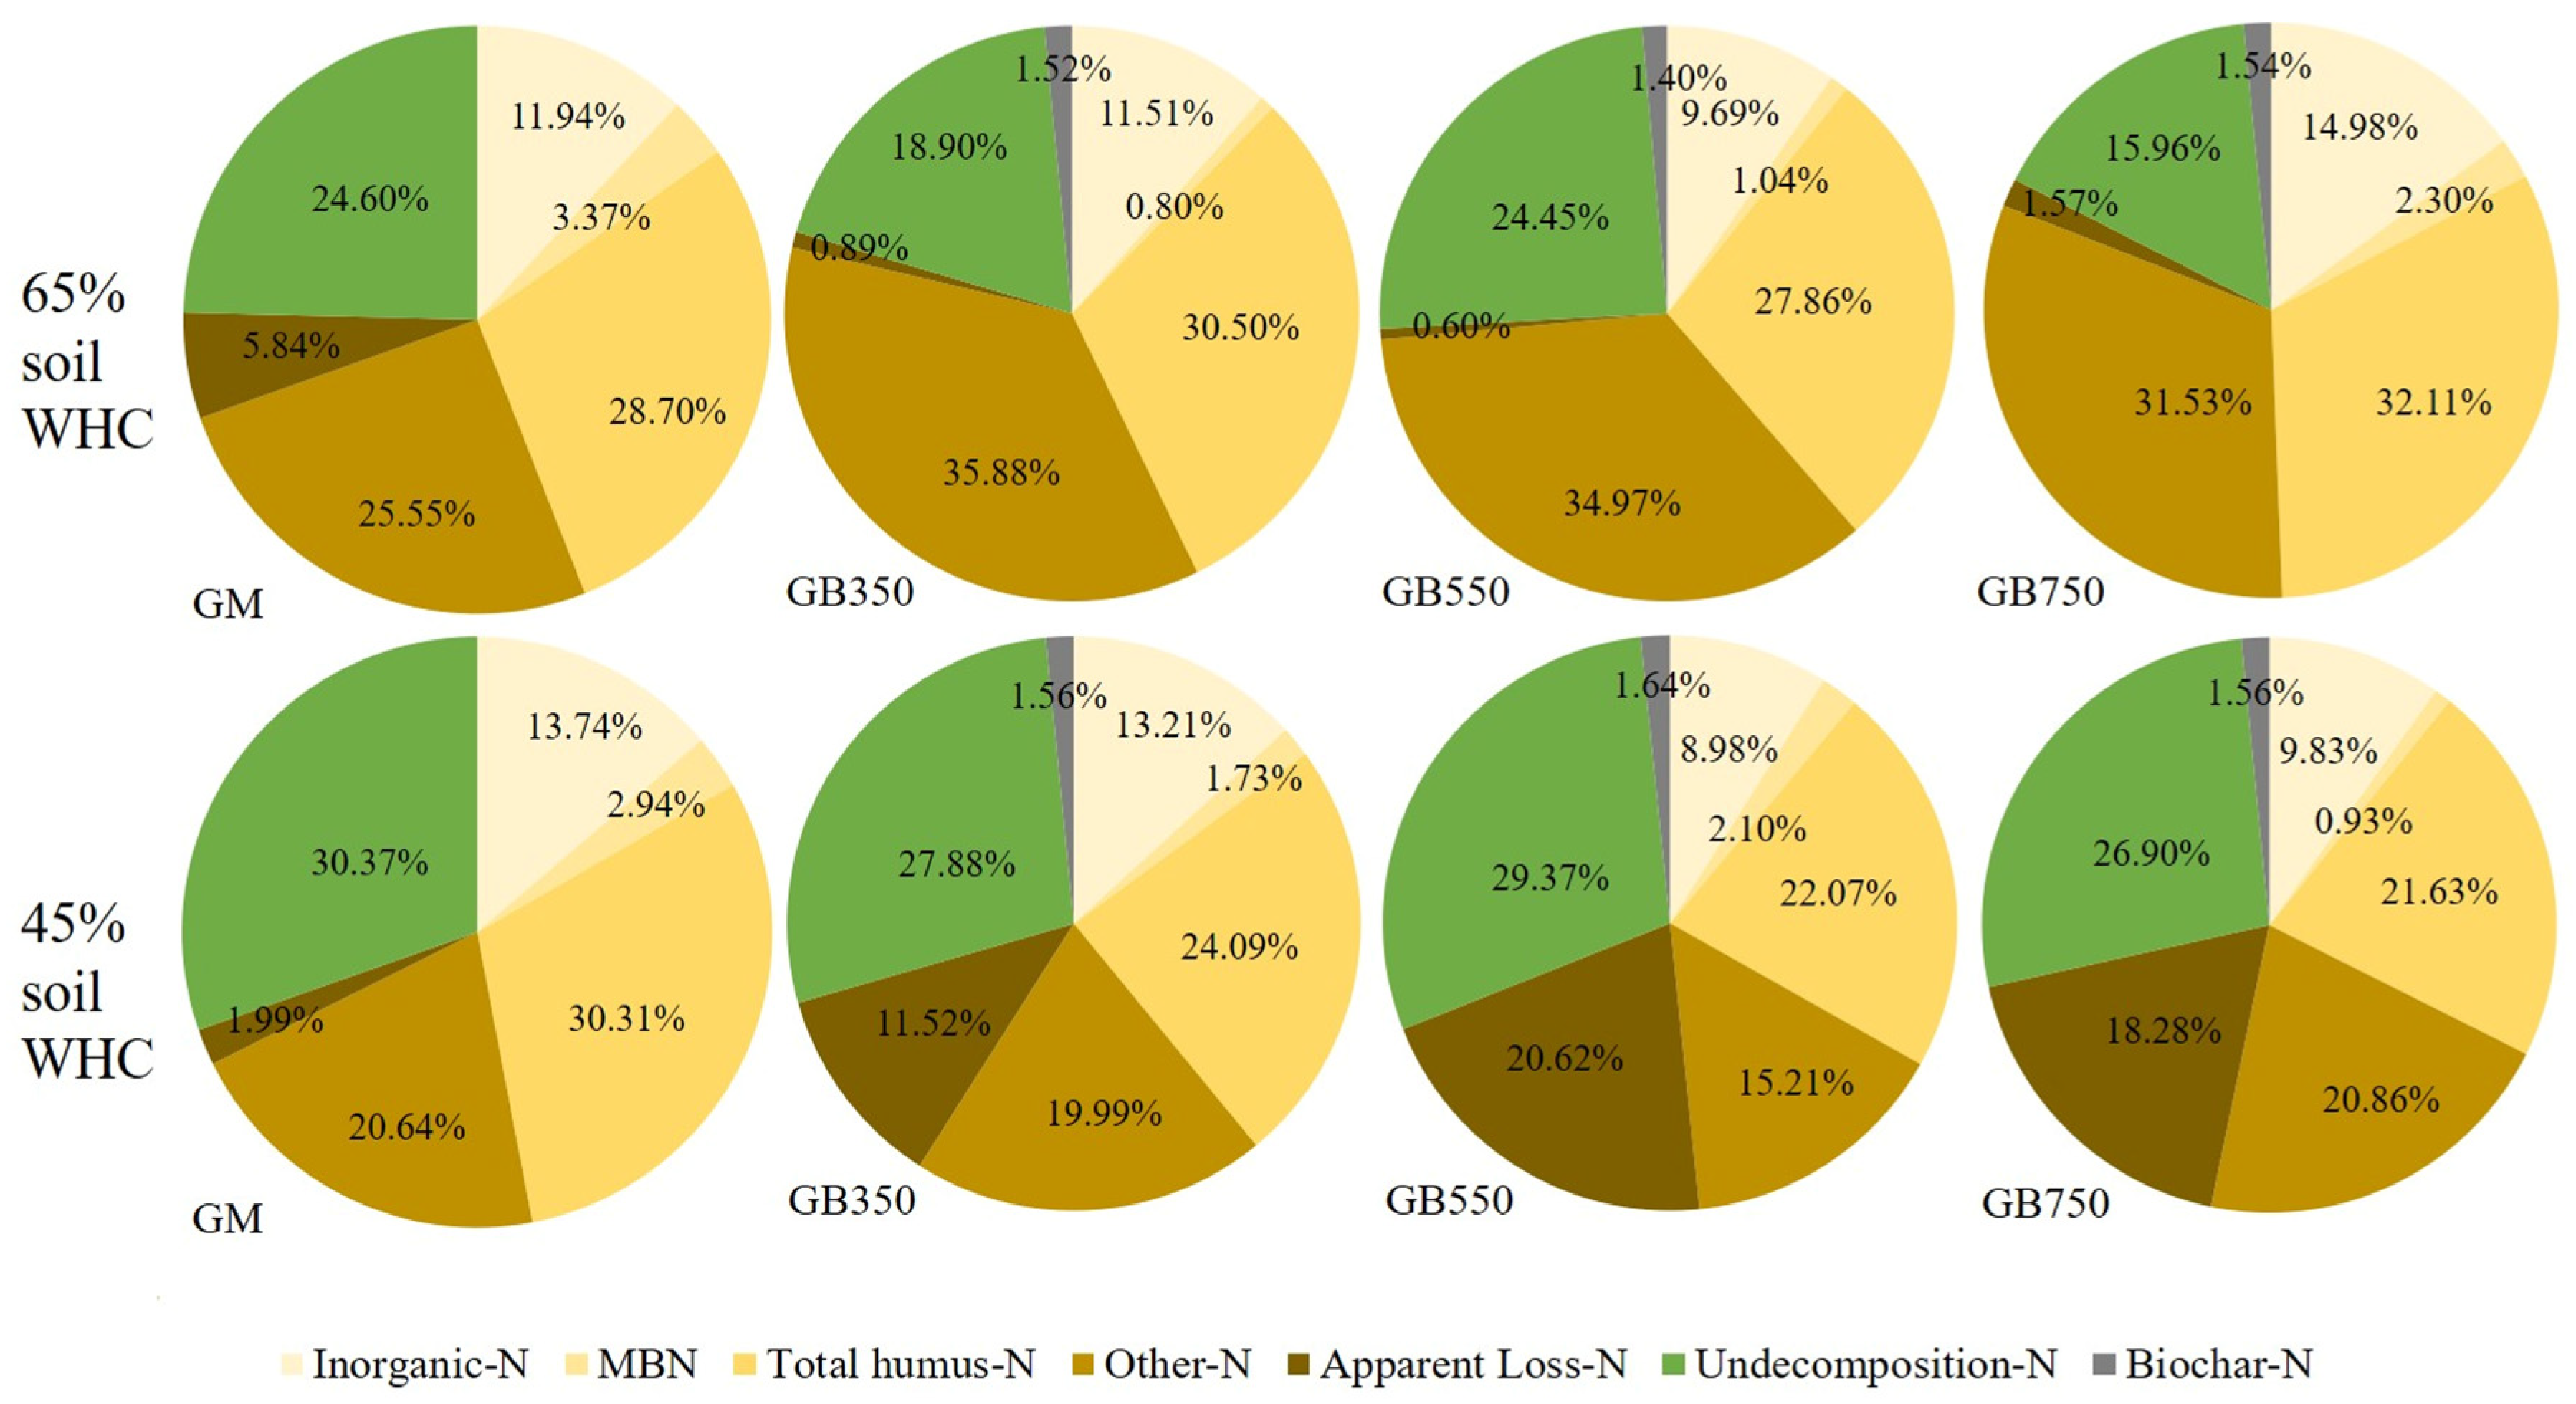
3.5. Changes in Soil N Fractions as a Percentage of TN

The proportion of soil N components to TN is shown in Figure 5. The application of BC350 and BC750 decreased the residual N proportion in green manure and enhanced the N release rate by 23.16% and 35.11% under 65% WHC and by 8.18% and 14.43% under 45% WHC, respectively. At 65% WHC, the addition of all three biochars (BC350, BC550, and BC750) significantly reduced N loss, with the losses being 0.89%, 0.60%, and 1.57% compared with the green manure alone treatment. Conversely, at 45% WHC, biochar addition led to significantly increased N losses, amounting to 11.52%, 20.62%, and 18.28%, respectively.

3.6. Changes in Soil Microorganisms

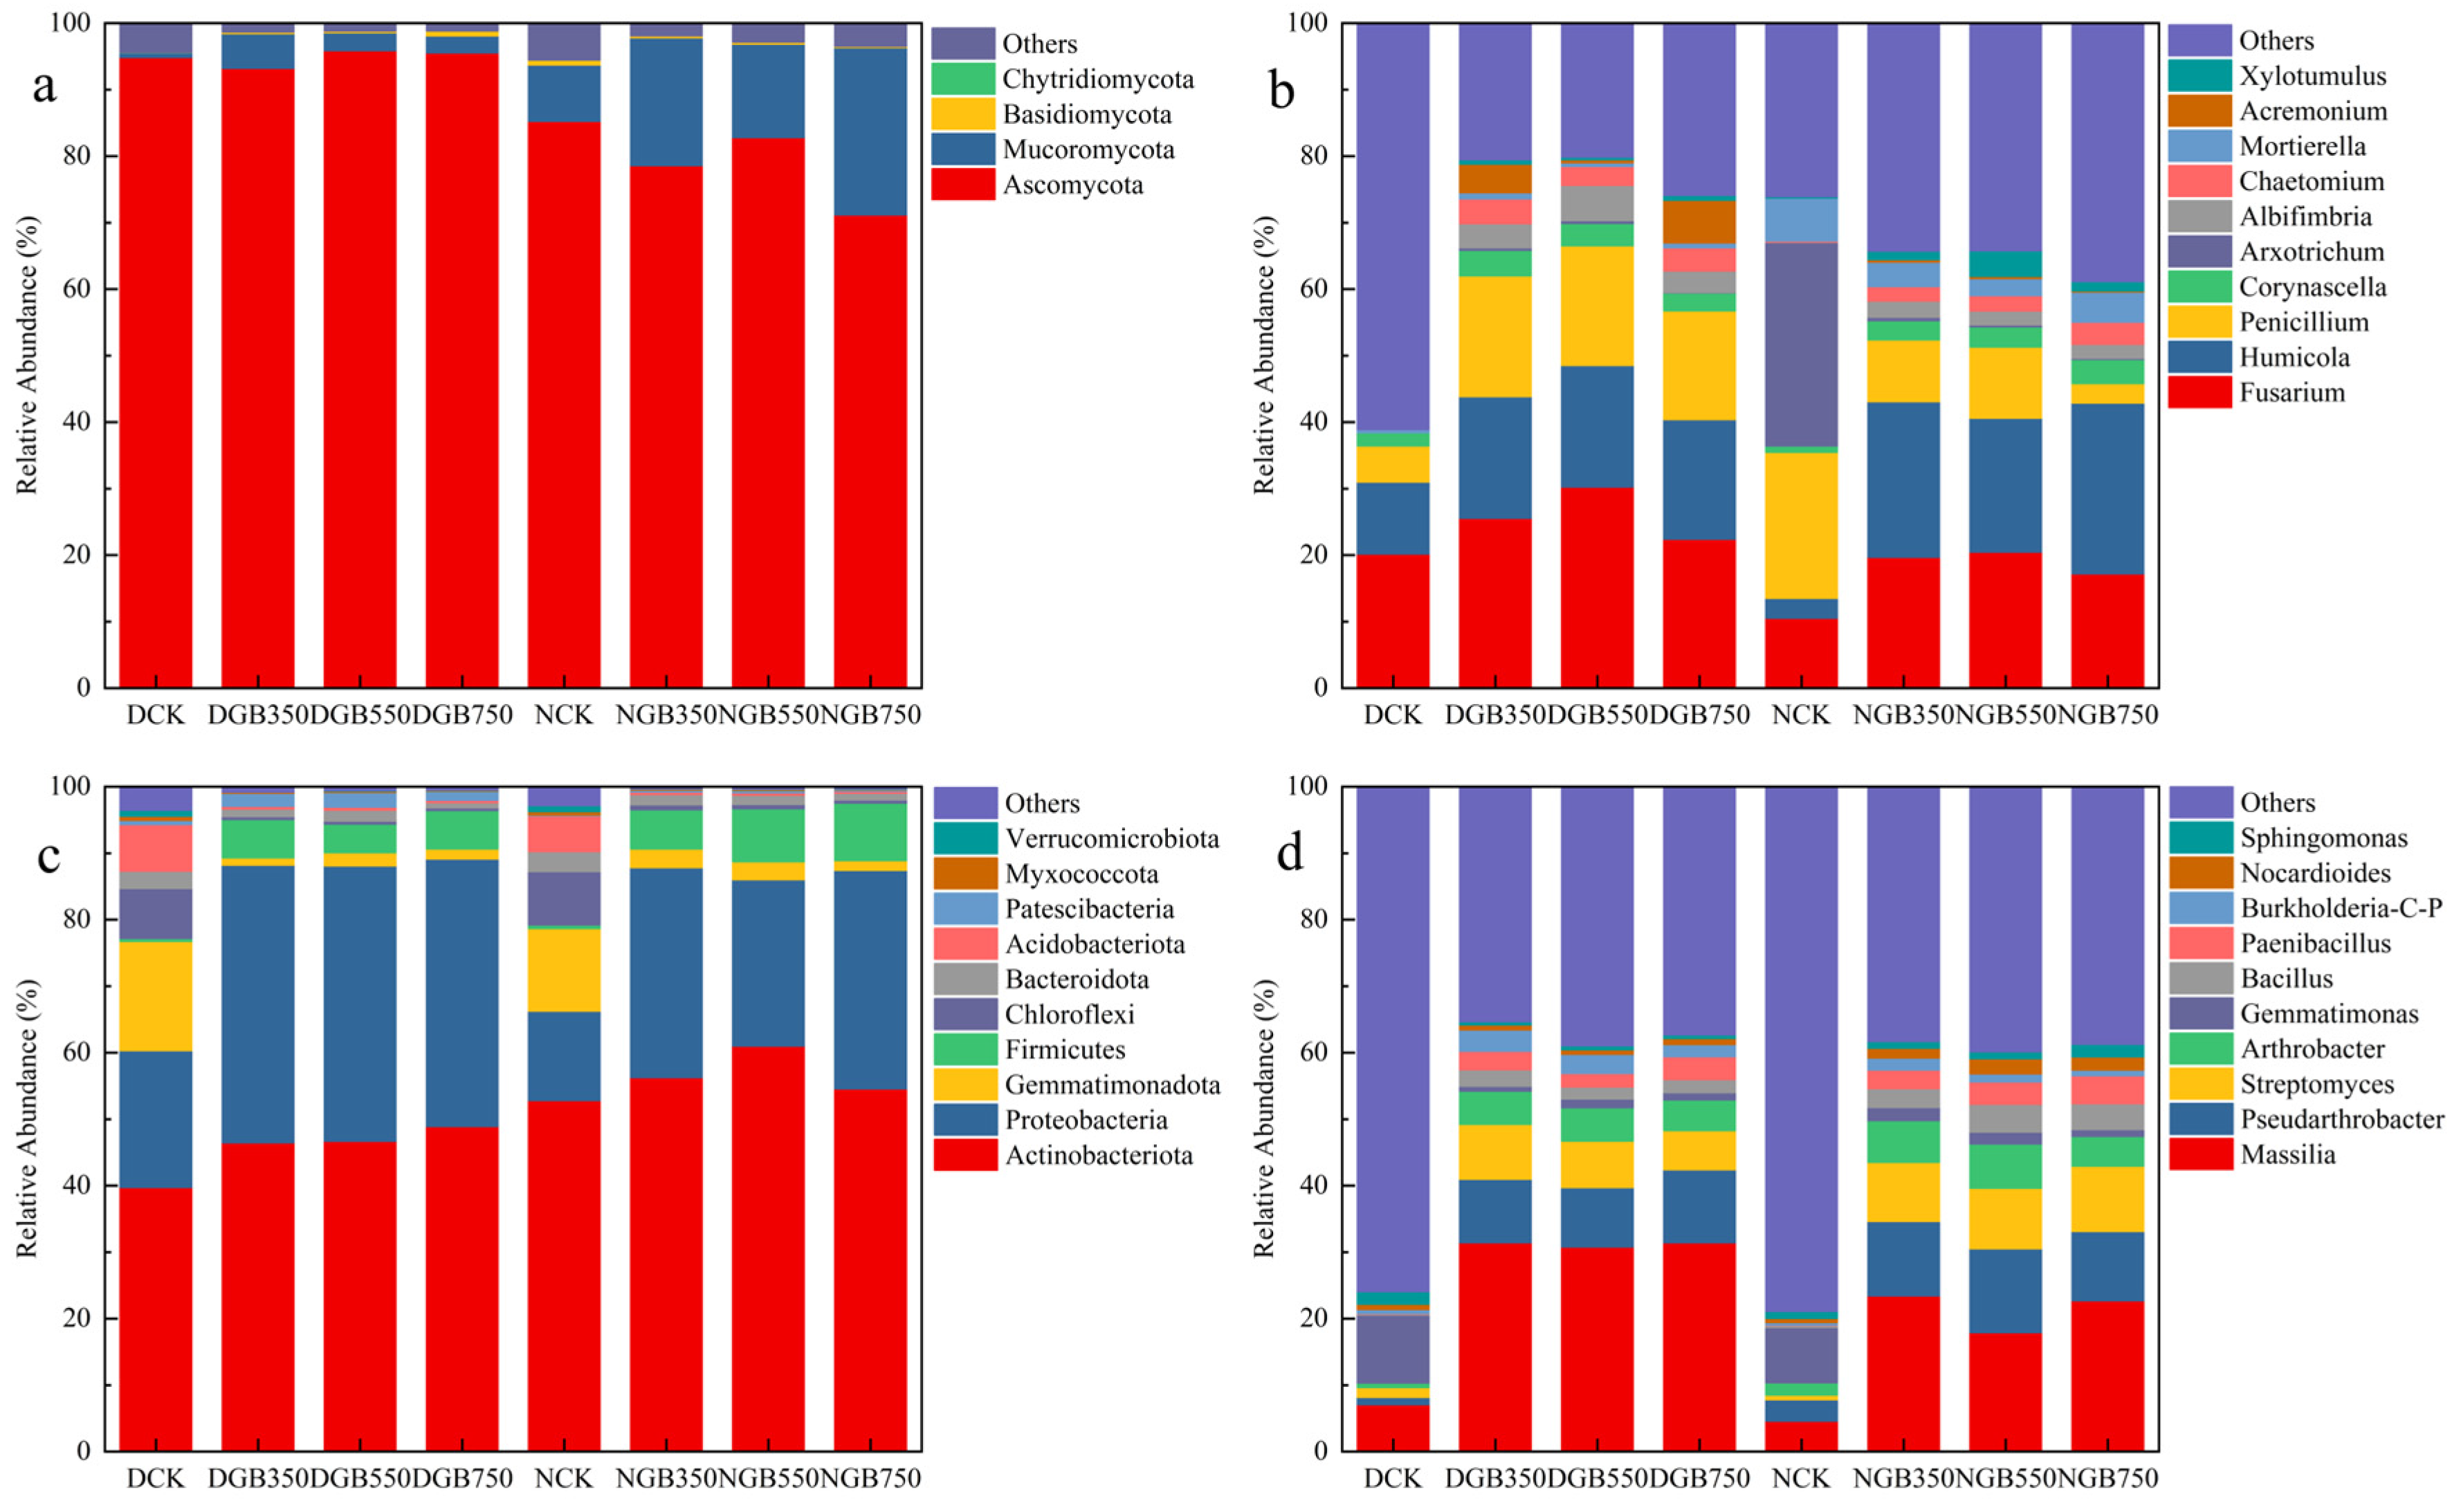
The species composition of microorganisms in the phylum Fungi, genus Fungi, phylum Bacteria, and genus Bacteria in the soil at the end of cultivation is shown in Figure 6. Ascomycota was the dominant species in the fungal phylum in all treatments. However, the abundance of Ascomycota was lower under 65% soil WHC, with a further reduction observed in GB350, GB550, and GB750. The abundance of Ascomycota was higher under 45% soil WHC than under 65% soil WHC. Under 65% soil WHC, the abundance of Mucoromycota gradually increased with an increasing biochar pyrolysis temperature. In both green manure and biochar combined with green manure, the fungal genus Humicola was dominant, playing a key role in promoting soil humus formation. For the bacterial communities, Proteobacteria dominated in green manure alone, while Actinobacteriota were most abundant in the biochar-amended variants at 45% soil WHC. Additionally, adding biochar significantly increased the population of denitrifying bacteria, such as Arthrobacter, Streptomyces, and Bacillus, under the 45% soil WHC condition.

4. Discussion

4.1. The Role of Biochar Properties on the Release of Green Manure N

The N content of biochar showed no significant change after 60 days of cultivation (Table 1), indicating that the changes in soil N could not be accounted for by the N contained within the biochar itself. BC750 exhibited a pronounced promoting effect on NH4+–N release from green manure under 65% soil WHC, whereas BC350 promoted NH4+–N release under 45% soil WHC (Figure 2 and Figure 5). The promotion effect of BC350 and BC750 could be attributed to the water-retaining capacity and EC of biochar, which facilitated the growth of microorganisms and the decomposition of green manure. BC750 exhibited the lowest H/C ratio of 0.24 and the highest EC (Table 2), suggesting it possessed high aromaticity and strong electron-transfer capacity. Liu et al. demonstrated that biochar acts as an electron shuttle, thereby enhancing the mineralization rate of SOM [29]. It is therefore possible that the high EC of BC750 may have contributed to the accelerated decomposition of green manure observed in our study. BC350 exhibited the highest (O+N)/C ratio of 0.20, suggesting that it has the highest polarity and the largest number of hydrophilic groups (Figure 1a). This facilitated soil water retention, which provided water for microbial activity and led to the decomposition and mineralization of green manure. Malinowski et al. also confirmed this result in their study [30]. Biochar co-application with green manure significantly increased CO2 emissions under a WHC of 45% (Figure S2a) and significantly increased MBC (Table 3), indicating that microbial activity was notably increased. Minamino et al. found that biochar addition accelerated the progress of litter decomposition by increasing microbial activity under drought conditions [31], which is consistent with our findings. Furthermore, under 45% WHC, the increase in the MBC/MBN ratio during the end-stage of incubation indicates a rise in the relative abundance of fungi compared with bacteria. This expansion of the fungal community may signal an acceleration of green manure decomposition [32]. As early decomposers, fungi are capable of breaking down recalcitrant organic compounds and providing substrates for subsequent microbial populations, thereby potentially enhancing overall microbial activity [33]. In addition, biochar addition significantly increased both mineralization and nitrification rates in soils under 65% soil WHC, especially BC350 and BC750, but it was able to increase mineralization rates without significantly affecting nitrification rates under 45% soil WHC (Figure 2). In this study, under drought conditions, the soil moisture increase provided by biochar may have been insufficient to sustain the rapid growth of nitrifying microorganisms, thereby contributing to a reduced PN rate (Figure S1b). Additionally, BC550 showed a relatively less pronounced effect. The high signal of PFRs (Figure 1b) might exert a toxic effect on soil microbial communities, and Yang et al. also confirmed this result in their study [34]. Although this study primarily focused on mineralization and nitrification, we acknowledge that other processes, such as the adsorption of NH4+ onto biochar surfaces and its subsequent desorption, could also influence the observed N dynamics. However, our measurements indicate that the NH4+–N adsorption capacity of biochar was relatively weak (Figure S3a), and its impact on soil NH4+–N concentration changes was limited. Therefore, this aspect is not thoroughly discussed in the present study.

4.2. Biochar Enhances N Sequestration in Soil Under 65% Soil WHC

Under 65% soil WHC, the contents of NH4+–N, NO3–N, and TN in GM decreased at the end-stage of cultivation. This indicates the potential risk of N loss when green manure was returned to the field separately. The soil TN content remained relatively stable and hardly decreased following biochar addition (Figure 3a), which may be associated with biochar-enhanced humus formation and immobilization of soil-free N [35]. Biochar co-application with green manure significantly promoted the soil humification process, thereby significantly increasing the total humus acid–C and total humus acid–N contents of the soil (Figure 4). Biochar may have facilitated the adsorption and immobilization of nutrients following green manure decomposition. Subsequently, microorganisms may have synthesized complex humus substances through polymerization [36]. FTIR spectra also revealed that the molecular structure of soil humic acid is aliphatic, young, and simple (Figure S3b) and also promoted the continuous renewal of humus [37]. Qian et al. demonstrated that biochar application in subtropical orchard soils not only enhances N retention, forming a temporary organic N reservoir and reducing inorganic N leaching potential, but also improves soil N-holding capacity through its porous structure and abundant functional groups [38]. Humicola is known to promote lignocellulose decomposition and soil humic acid formation. Wang et al. also found that biochar addition increased the abundance of Humicola, which in turn promoted organic matter decomposition, possibly because Humicola can produce thermostable cellulase, hemicellulase, ligninase, and amylase and thus contributes significantly to the decomposition process [39]. Under 65% WHC, the abundance of Humicola in GB350, GB550, and GB750 was higher than that in GM (Figure 6), which is consistent with the possibility that biochar addition may have facilitated green manure decomposition and soil humus formation. Moreover, Humicola abundance was positively correlated with soil TN contents (r = 0.68, p < 0.05), and soil total humus acid–N content was also positively correlated with soil TN contents (r = 0.89, p < 0.01) (Figure S5). Taken together, these correlative patterns suggest that under 65% soil WHC, biochar addition may have enhanced humification and promoted the integration of N-containing organic compounds into the complex molecular skeleton of humus acids, which could potentially contribute to mitigating soil N loss.
Under 65% soil WHC, the TC content remained stable, with no significant decrease observed across all pyrolysis temperatures of the biochar co-application with green manure (Figure 3b). Enhanced microbial activity promoted the transformation of organic matter into stable humus, thereby leading to increased soil C sequestration [40]. The low C/N green manure provided optimal N requirements for microbial populations and their activities [41]. Correspondingly, the abundance of Mucoromycota was higher under 65% soil WHC, which may further promote the fixation of SOM, and the addition of biochar further enhanced this condition. Mucoromycota has the capacity to produce extensive mycelium and contribute more stable organic C pools [42]. Their enrichment under 65% WHC, particularly with biochar addition, suggests that favorable moisture conditions may enhance their role in promoting soil structure and organic matter retention. This is consistent with the observed increase in stable organic C under 65% WHC in our study. In this study, the observed increase in stable organic C may have favored soil N sequestration. The MBC/MBN ratio serves as an indicator of soil microbial community [43]. At the end of cultivation, the addition of biochar resulted in a notable enhancement in the MBC/MBN ratio (Table 3), indicating a high level of activity within the fungal community. Fungal hyphae and abundant extracellular secretions can serve as cementing substances that promote the formation of agglomerates and form physical barriers (Figure S4a), which are more conducive to the fixation of soil organic C and N [44]. Microbial secretions released during green manure decomposition, together with biochar itself, can promote soil aggregate formation. By enhancing the “microbial C pump” effect [45] and enriching humification-related microbial taxa [46], biochar facilitates the conversion of C and N into stable microbial residues and humus. Furthermore, there was a significant positive correlation between the MBC/MBN ratio and the total humus acid and humic acid content in the soil (r = 0.64, p < 0.05, r = 0.65, p < 0.05) (Figure S5). These correlative patterns suggest that the succession of microbial communities toward a fungal-dominant state may be associated with the retention of soil C and N.

4.3. Biochar Exacerbates N Losses Under 45% Soil WHC

The TN of GB350, GB550, and GB750 under 45% soil WHC was significantly reduced by >11% (Figure 5). Under drought conditions, soil microbial activity was relatively weak (Figure S2a), as reflected by a lower soil PN (Figure S1b). This resulted in the accumulation of NH4+–N (Figure 2c), along with an increase in soil-free NH3 [47]. Furthermore, the formation of soil macroaggregates was impeded (Figure S4a), resulting in a relatively low content of NH4+–N fixed within aggregates. The elevated soil NH4+–N concentration, combined with the insufficient immobilization capacity of macroaggregates, may have jointly contributed to the exacerbation of soil NH3 volatilization. The addition of biochar elevated soil pH (Figure S6), and drought conditions further increased soil pH, which might have further enhanced NH3 volatilization [48]. Kim et al. observed that when soil is amended with approximately 100 mg-N/kg, its pH increases from 4.44 to 6.47, resulting in a more than tenfold increase in NH3 emissions [49], which aligns with the trend observed in this study. The volatilization of NH4+ into NH3 is based on Henry’s constant at the surface of liquid and gas and proceeds by diffusion, and volatilization is promoted as the pH increases. It is evident that the pH of BC550 and BC750 is higher (Table 2), which led to a higher soil pH (Figure S6).
Moreover, this study indicates that there was minimal N2O emission under 45% soil WHC (Figure S2b). Part of the TN reduction may have been converted to N2 through complete denitrification. Wu et al. also demonstrated a notable enhancement in N2 emissions from arid soils (Atacama Desert, <30% WHC) [50]. The higher content of microaggregates (Figure S4b) inhibited the diffusion of soil oxygen, thereby creating a suitable habitat for complete denitrification by denitrifying bacteria. The decomposition of green manure can substantially deplete oxygen within soil pores, leading to the development of localized hypoxic conditions, which in turn favor denitrification as the prevailing pathway [51]. Biochar co-application with green manure increased the abundance of Arthrobacter, Streptomyces, and Bacillus [52], which likely promoted denitrification and exacerbated soil N loss (Figure 6), thereby further confirming our speculation. This is consistent with our observation that N2O emissions were negligible under drought conditions (Figure S2b), suggesting that the N removed from the soil may have been predominantly converted to N2 via complete denitrification rather than emitted as N2O. In addition, Sun et al. also reported that under water-saving drip irrigation, the water-holding capacity of biochar sustains a soil moisture regime conducive to denitrification, potentially increasing N2O emissions [53]; concurrently, reduced irrigation diminishes the dilution of NH4+–N, and the elevation of soil pH caused by biochar may further enhance NH3 volatilization [54]. However, this study did not directly measure the total emissions of NH3 and N2 from the soil; therefore, the inference regarding the exact pathways of soil N loss still requires further careful verification.
The TC of GB350, GB550, and GB750 under 45% soil WHC were significantly reduced by 18%. The reduction in TC under 45% soil WHC could be attributed to microorganisms reducing investment in more stable C pools [55], resulting in enhanced C loss through volatile organic compound volatilization. The reduction in soil stable organic C could further increase the loss of soil N [56]. Under drought conditions, the soil contained relatively low contents of humus acid–C and humus acid–N (Figure 4), which led to a corresponding reduction in soil N fixation. Furthermore, under 45% soil WHC, the lower microbial activity led to low contents of soil MBC and MBN (Table 3), which adversely affected the retention of soil C and N. Wei et al. also indicated that significantly reduced microbial biomass in drought soils may substantially impair the soil’s C and N sequestration potential [57].

4.4. Elucidating C and N Retention Mechanisms Through PLS-PM Modeling

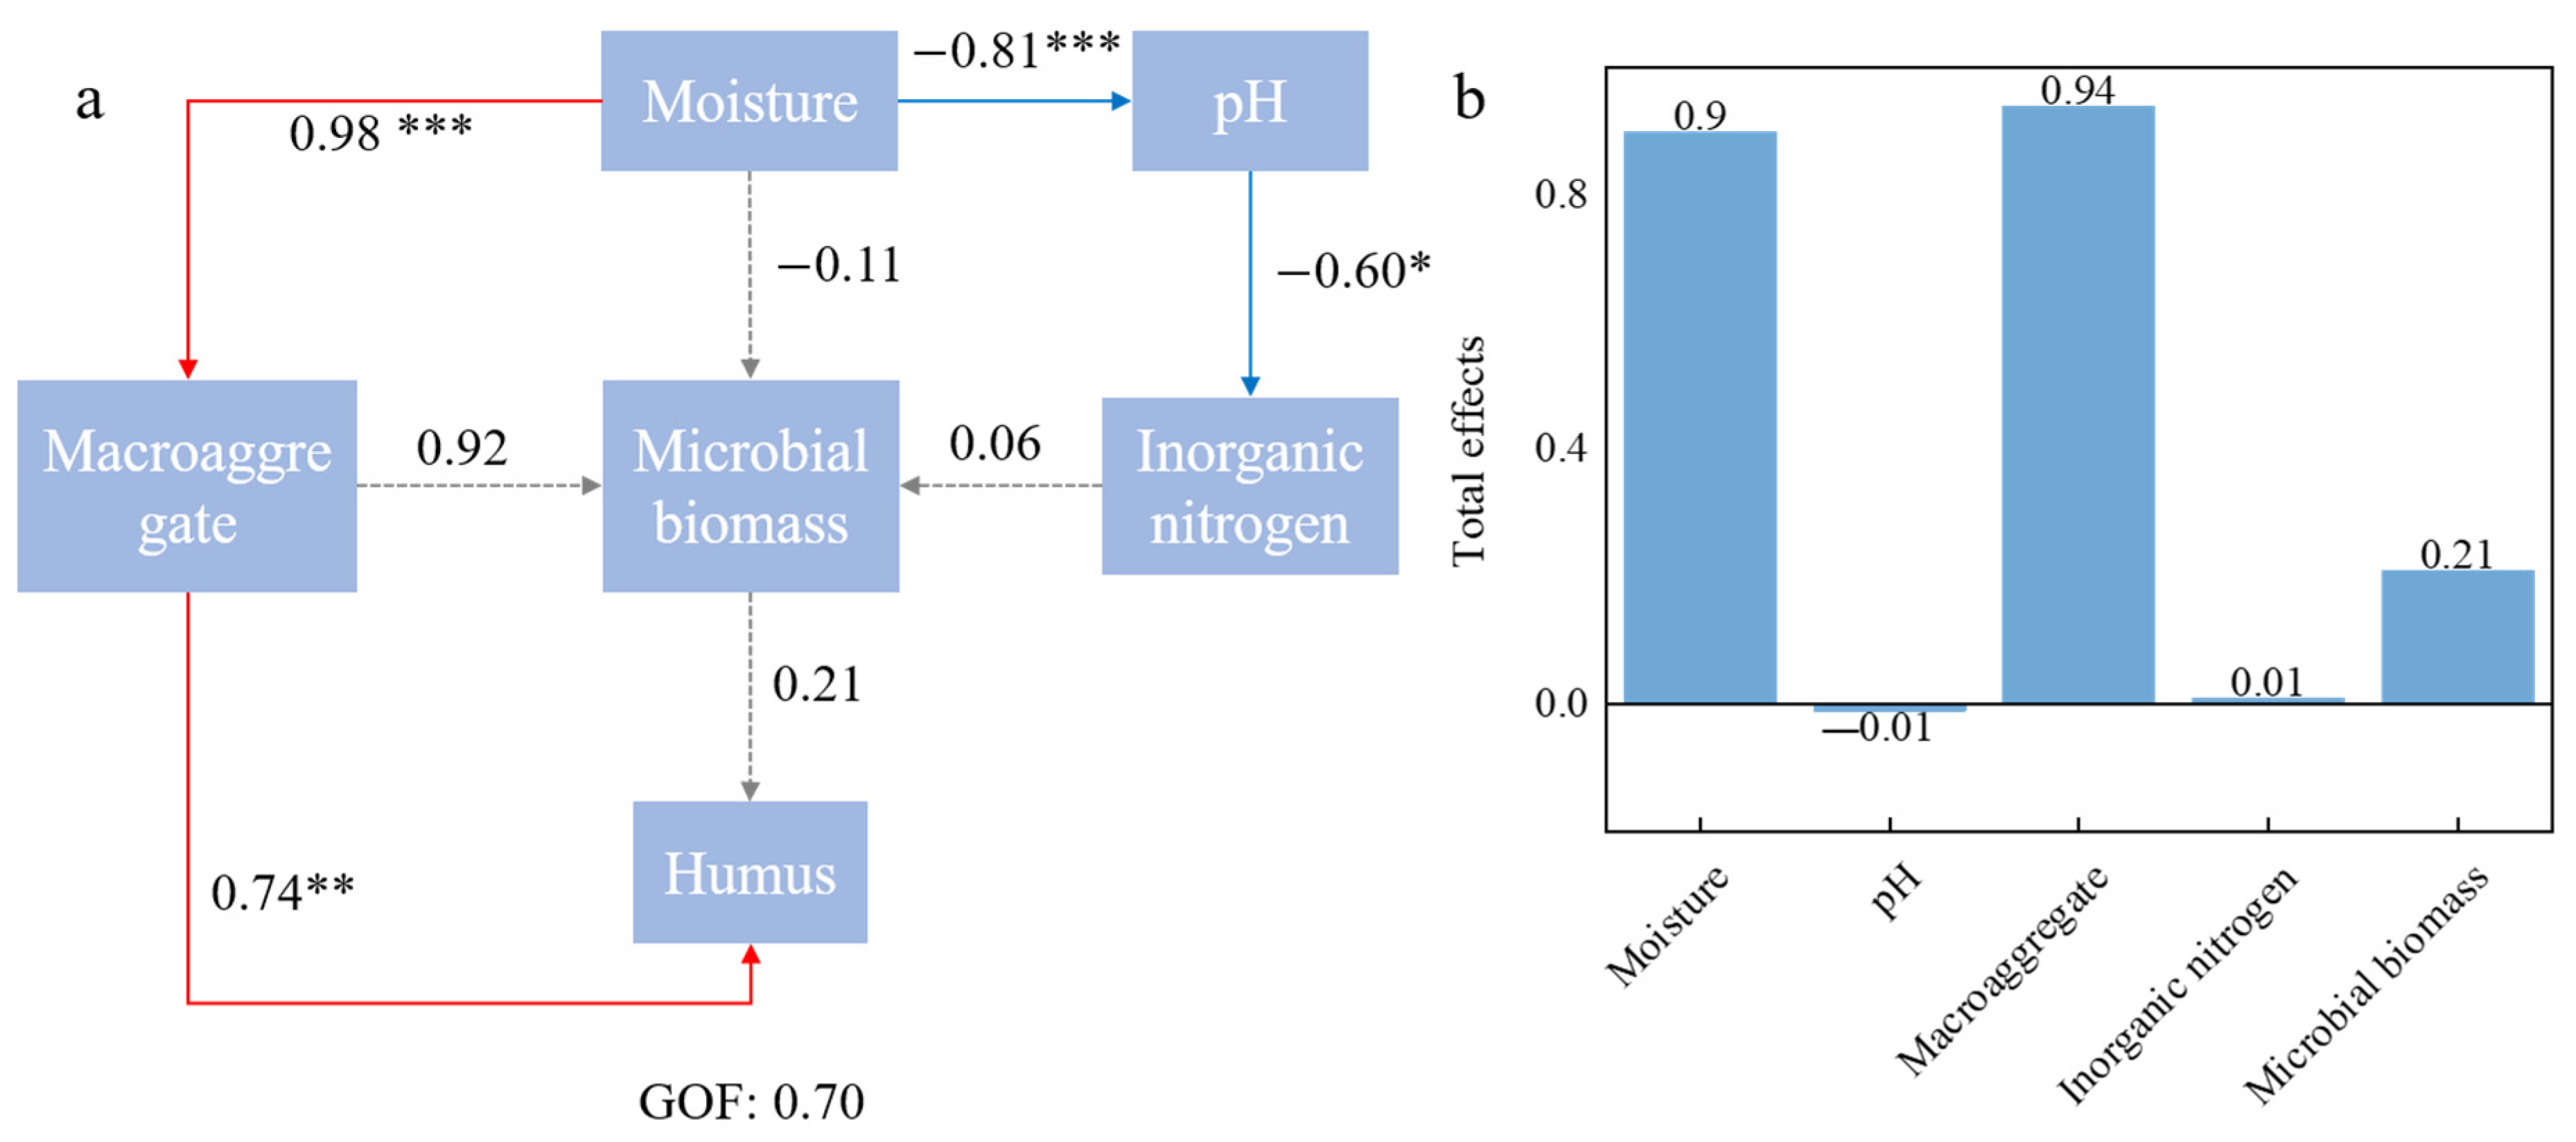
This study employed partial least squares path modeling (PLS-PM) to elucidate the key driving pathways and intrinsic mechanisms through which soil properties influence C and N sequestration (Figure 7). The PLS-PM model identified a significant negative correlation between soil moisture and pH, which drove an increase in pH under drought-affected conditions and consequently favored NH3 volatilization. Biochar addition also promoted the mineralization and release of N from green manure. These combined factors led to the accumulation of NH4+–N in the soil, further enhancing NH3 volatilization [58], which aligns with the discussion in Section 4.3. Furthermore, by driving the formation of soil macroaggregates through a significant-positive-correlation path, high soil moisture significantly increased the proportion of macroaggregates in the soil, and the formation of these macroaggregates played a critical role in promoting C and N sequestration. On the one hand, by providing an optimal microenvironment for microbial communities, macroaggregates led to a substantial increase in soil microbial biomass [59], thus promoting the decomposition and transformation of green manure. In addition, macroaggregates physically protected organic matter. Moreover, their formation drove the formation of soil humus via a significant-positive-correlation pathway, thereby sequestering soil C and N in the form of stable organic compounds [60]. The PLS-PM model further clarified that soil C and N sequestration was jointly influenced by soil pH, which regulated N speciation and gaseous losses, and by macroaggregate formation, which enhanced humification through microenvironment improvement.

5. Conclusions

This study showed that the electron-transfer capacity of BC750 and the water-retention capacity of BC350 appeared to promote green manure decomposition and increased soil NH4+–N content (>5%) under the experimental conditions. The addition of biochar under 65% soil WHC was associated with increased MBC and humus substances. This was accompanied by a greater-than-20% increase in soil total humus acid–N content following the combined application of biochar and green manure, which may have facilitated the turnover and conversion of soil N to stabilized forms. However, under 45% soil WHC, the addition of biochar was associated with an apparent increase in TN loss (>11%) under laboratory drought conditions. This could be tentatively attributed to a relatively low degree of humification and limited formation of macroaggregates, which may have resulted in a reduced capacity for soil N sequestration.
When applied as a water-retention agent under drought-affected laboratory conditions, biochar was observed to accelerate the decomposition of green manure. However, insufficient water supply limited the effective operation of soil N immobilization pathways. Therefore, rational water management is essential for minimizing total N loss. Meanwhile, biochar modification is also needed to improve N stability in soil, either by facilitating abiotic humification or by enhancing the adsorption and binding of soil N to mineral surfaces. Efficient N management plays a key role in mitigating agricultural non-point source pollution and curbing greenhouse gas emissions. Several limitations should be acknowledged: the laboratory incubation design, short duration (60 days), no field validation, and absence of functional analysis of microbial communities. These factors limit direct extrapolation to field conditions. Long-term field trials, functional microbial profiling, and quantitative partitioning of N loss pathways are required to bridge these knowledge gaps in future investigations.

Supplementary Materials

The following supporting information can be downloaded at: https://www.mdpi.com/article/10.3390/agronomy16151496/s1. Figure S1: Changes in soil nitrification potential with (a) represents soil WHC of 65% and (b) represents soil WHC of 45%. Figure S2: Accumulated CO2 (a) and N2O (b) release from soil under different treatments. The prefix “N” represents 65% soil WHC, and prefix “D” represents 45% soil WHC. Figure S3: The adsorption curve of biochar for NH4+-N (a) and FTIR spectroscopy of soil humic acid. The prefix “N” represents 65% soil WHC, and prefix “D” represents 45% soil WHC. Figure S4: The proportion of soil macroaggregates (>2 mm) (a) and microaggregates (<0.053 mm) (b) in each treatment group at the end of cultivation. Different lowercase letters indicate significant differences in soil aggregates under 45% soil WHC, and different uppercase letters indicate significant differences in soil aggregates under 65% soil WHC. Figure S5: Pearson correlation matrix of the indicators for each soil treatment group. Figure S6: Dynamic changes in soil pH with (a) represents soil WHC of 65% and (b) represents soil WHC of 45%; Text S1: Key methods and processes for gas collection and calculation.

Author Contributions

Conceptualization, Z.Z. and W.D.; Methodology, Z.Z., J.Z. and B.W.; Formal analysis, Z.Z. and D.Z.; Investigation, Z.Z., J.Z. and M.R.; Visualization, Z.Z., P.O. and M.R.; Writing—Original Draft Preparation, Z.Z.; Writing—Review and Editing, F.C., B.W., D.Z., P.O., M.R. and W.D.; Supervision, W.D.; Data Curation, F.C. and W.D.; Project Administration, W.D.; Funding Acquisition, W.D. All authors have read and agreed to the published version of the manuscript.

Funding

This work was supported by the National Natural Science Foundation of China (42267003), the Yunnan Science and Technology General Project (202301AT070451), the Yunnan Xingdian Talent Support Program–Youth Talent Program, and the Yunnan Science and Technology Planning Project (202303AC100010).

Data Availability Statement

The original contributions presented in this study are included in the article/Supplementary Materials. Further inquiries can be directed to the corresponding author.

Conflicts of Interest

The authors declare that they have no known competing financial interests or personal relationships that could have appeared to influence the work reported in this paper.

References

  1. Gao, X.; Liu, W.; Li, X.; Zhang, W.; Bu, S.; Wang, A. A novel fungal agent for straw returning to enhance straw decomposition and nutrients release. Environ. Technol. Innov. 2023, 30, 103064. [Google Scholar] [CrossRef]
  2. Zhang, X.; Zhang, R.; Gao, J.; Wang, X.; Fan, F.; Ma, X.; Yin, H.; Zhang, C.; Feng, K.; Deng, Y. Thirty-one years of rice-rice-green manure rotations shape the rhizosphere microbial community and enrich beneficial bacteria. Soil Biol. Biochem. 2017, 104, 208–217. [Google Scholar] [CrossRef]
  3. Berhane, M.; Xu, M.; Liang, Z.; Shi, J.; Wei, G.; Tian, X. Effects of long-term straw return on soil organic carbon storage and sequestration rate in North China upland crops: A meta-analysis. Glob. Change Biol. 2020, 26, 2686–2701. [Google Scholar] [CrossRef] [PubMed]
  4. Yin, H.; Zhao, W.; Li, T.; Cheng, X.; Liu, Q. Balancing straw returning and chemical fertilizers in China: Role of straw nutrient resources. Renew. Sustain. Energy Rev. 2018, 81, 2695–2702. [Google Scholar] [CrossRef]
  5. Zhao, S.; Qiu, S.; Xu, X.; Ciampitti, I.A.; Zhang, S.; He, P. Change in straw decomposition rate and soil microbial community composition after straw addition in different long-term fertilization soils. Appl. Soil Ecol. 2019, 138, 123–133. [Google Scholar] [CrossRef]
  6. Butterbach-Bahl, K.; Baggs, E.M.; Dannenmann, M.; Kiese, R.; Zechmeister-Boltenstern, S. Nitrous oxide emissions from soils: How well do we understand the processes and their controls? Philos. Trans. R. Soc. B 2013, 368, 20130122. [Google Scholar] [CrossRef] [PubMed]
  7. Li, B.; Zhou, G. Advance in the study on drought index. Acta Ecol. Sin. 2014, 34, 1043–1052. (In Chinese) [Google Scholar] [CrossRef]
  8. Zuo, Y.; Jia, Z. The influence and dynamic changes of soil moisture content on straw decomposition. J. Northwest A F Univ. (Nat. Sci. Ed.) 2004, 05, 61–63. (In Chinese) [Google Scholar] [CrossRef]
  9. Zhou, Y.; Zhang, Y.; Tian, D.; Mu, Y. The influence of straw returning on N2O emissions from a maize-wheat field in the North China Plain. Sci. Total Environ. 2017, 584–585, 935–941. [Google Scholar] [CrossRef] [PubMed]
  10. Li, M.; Wang, J.; Li, X. Alterations in microhabitat can impact litter decomposition by modifying the litter C/N ratio and regulating soil microbial activity. Front. Plant Sci. 2026, 16, 1660144. [Google Scholar] [CrossRef] [PubMed]
  11. Wang, X.; Ma, H.; Guan, C.; Guan, M. Germplasm screening of green manure rapeseed through the effects of short-term decomposition on soil nutrients and microorganisms. Agriculture 2021, 11, 1219. [Google Scholar] [CrossRef]
  12. Clough, T.J.; Condron, L.M.; Kammann, C.; Müller, C. A review of biochar and soil nitrogen dynamics. Agronomy 2013, 3, 275–293. [Google Scholar] [CrossRef]
  13. Cayuela, M.L.; van Zwieten, L.; Singh, B.P.; Jeffery, S.; Roig, A.; Sánchez-Monedero, M.A. Biochar’s role in mitigating soil nitrous oxide emissions: A review and meta-analysis. Agric. Ecosyst. Environ. 2014, 191, 5–16. [Google Scholar] [CrossRef]
  14. López-Cano, I.; Roig, A.; Cayuela, M.L.; Alburquerque, J.A.; Sánchez-Monedero, M.A. Biochar improves N cycling during composting of olive mill wastes and sheep manure. Waste Manag. 2016, 49, 553–559. [Google Scholar] [CrossRef] [PubMed]
  15. Hu, W.; Zhang, Y.; Rong, X.; Zhou, X.; Fei, J.; Peng, J.; Luo, G. Biochar and organic fertilizer applications enhance soil functional microbial abundance and agroecosystem multifunctionality. Biochar 2024, 6, 3. [Google Scholar] [CrossRef]
  16. Chen, W.; Meng, J.; Han, X.; Lan, Y.; Zhang, W. Past, present, and future of biochar. Biochar 2019, 1, 75–87. [Google Scholar] [CrossRef]
  17. Razzaghi, F.; Obour, P.B.; Arthur, E. Does biochar improve soil water retention? A systematic review and meta-analysis. Geoderma 2020, 361, 114055. [Google Scholar] [CrossRef]
  18. Strunecký, O.; Shreedhar, S.; Kolář, L.; Maroušková, A. Changes in soil water retention following biochar amendment. Energy Sources Part A Recovery Util. Environ. Eff. 2025, 47, 7145–7152. [Google Scholar] [CrossRef]
  19. Zarezadeh, S.; Zheng, Y.; Jenkins, S.N.; Mercer, G.D.; Moheimani, N.R.; Singh, P.; Mickan, B.S. Sustainable soil management in agriculture under drought stress: Utilising waste-derived organic soil amendments and beneficial impacts on soil bacterial processes. Appl. Soil Ecol. 2025, 206, 105870. [Google Scholar] [CrossRef]
  20. Li, R.; Wang, Q.; Zhang, Z.; Zhang, G.; Li, Z.; Wang, L.; Zheng, J. Nutrient transformation during aerobic composting of pig manure with biochar prepared at different temperatures. Environ. Technol. 2014, 36, 815–826. [Google Scholar] [CrossRef] [PubMed]
  21. Prost, K.; Borchard, N.; Siemens, J.; Kautz, T.; Séquaris, J.-M.; Möller, A.; Amelung, W. Biochar affected by composting with farmyard manure. J. Environ. Qual. 2013, 42, 164–172. [Google Scholar] [CrossRef] [PubMed]
  22. Uchimiya, M.; Wartelle, L.H.; Klasson, K.T.; Fortier, C.A.; Lima, I.M. Influence of pyrolysis temperature on biochar property and function as a heavy metal sorbent in soil. J. Agric. Food Chem. 2011, 59, 2501–2510. [Google Scholar] [CrossRef] [PubMed]
  23. Zhang, Y.; Xu, X.; Cao, L.; Ok, Y.S.; Cao, X. Characterization and quantification of electron donating capacity and its structure dependence in biochar derived from three waste biomasses. Chemosphere 2018, 211, 1073–1081. [Google Scholar] [CrossRef] [PubMed]
  24. Wang, S.; Han, J.; Ge, Z.; Su, X.; Shi, Y.; Xia, F.; Huang, Y.; Meng, J. Mechanistic insight into enhancement of undissolved rice husk biochar on Tetracycline biodegradation by strain Serratia marcescens basing on electron transfer response. J. Hazard. Mater. 2025, 491, 137895. [Google Scholar] [CrossRef] [PubMed]
  25. Liu, Z.; Xu, N.; Cao, T.; An, Z.; Yang, X.; He, T.; Yang, T.; Meng, J. Maize straw is more effective than maize straw biochar at improving soil N availability and gross N transformation rate. Eur. J. Soil Sci. 2023, 74, e13403. [Google Scholar] [CrossRef]
  26. Pan, F.; Lu, J.; Liu, W.; Geng, M. Study on characteristics of decomposing and nutrients releasing of three kinds of green manure crops. J. Plant Nutr. Fertil. 2011, 17, 216–223. (In Chinese) [Google Scholar] [CrossRef]
  27. Kumada, K.; Sato, O.; Ohsumi, Y.; Ohta, S. Humus composition of mountain soils in Central Japan with special reference to the distribution of P type humic acid. Soil Sci. Plant Nutr. 1967, 13, 151–158. [Google Scholar] [CrossRef]
  28. An, M.; Chang, D.; Hong, D.; Fan, H.; Wang, K. Metabolic regulation in soil microbial succession and niche differentiation by the polymer amendment under cadmium stress. J. Hazard. Mater. 2021, 416, 126094. [Google Scholar] [CrossRef] [PubMed]
  29. Liu, Q.; Wu, C.; Wei, L.; Wang, S.; Deng, Y.; Ling, W.; Xiang, W.; Kuzyakov, Y.; Zhu, Z.; Ge, T. Microbial mechanisms of organic matter mineralization induced by straw in biochar-amended paddy soil. Biochar 2024, 6, 18. [Google Scholar] [CrossRef]
  30. Malinowski, M.; Wolny-Koładka, K.; Vaverková, M.D. Effect of biochar addition on the OFMSW composting process under real conditions. Waste Manag. 2019, 84, 364–372. [Google Scholar] [CrossRef] [PubMed]
  31. Minamino, Y.; Fujitake, N.; Suzuki, T.; Yoshitake, S.; Koizumi, H.; Tomotsune, M. Effect of biochar addition on leaf-litter decomposition at soil surface during three years in a warm-temperate secondary deciduous forest, Japan. Sci. Rep. 2019, 9, 16961. [Google Scholar] [CrossRef] [PubMed]
  32. de Vries, F.T.; Griffiths, R.I.; Bailey, M.; Craig, H.; Girlanda, M.; Gweon, H.S.; Hallin, S.; Kaisermann, A.; Keith, A.M.; Kretzschmar, M.; et al. Soil bacterial networks are less stable under drought than fungal networks. Nat. Commun. 2018, 9, 3033. [Google Scholar] [CrossRef] [PubMed]
  33. Wardle, D.A.; Bardgett, R.D.; Klironomos, J.N.; Setälä, H.; van der Putten, W.H.; Wall, D.H. Ecological linkages between aboveground and belowground biota. Science 2004, 304, 1629–1633. [Google Scholar] [CrossRef] [PubMed]
  34. Yang, H.; Chen, N.; Wang, Z.; Liu, J.; Qin, J.; Zhu, K.; Jia, H. Biochar-associated free radicals reduce soil bacterial diversity: New insight into ecoenzymatic stoichiometry. Environ. Sci. Technol. 2023, 57, 20238–20248. [Google Scholar] [CrossRef] [PubMed]
  35. Liu, Q.; He, X.; Wang, K.; Li, D. Biochar drives humus formation during composting by regulating the specialized metabolic features of microbiome. Chem. Eng. J. 2023, 458, 141380. [Google Scholar] [CrossRef]
  36. Gao, X.; Tan, W.; Zhao, Y.; Wu, J.; Sun, Q.; Qi, H.; Xie, X.Y.; Wei, Z. Diversity in the mechanisms of humin formation during composting with different materials. Environ. Sci. Technol. 2019, 53, 3653–3662. [Google Scholar] [CrossRef] [PubMed]
  37. Wang, Q.; Zhu, Y.; Xu, L.; Chen, B.; Liu, C.; Ma, X.; Meng, Q.; Liu, B.; Huang, Z.; Jiao, Y.; et al. Responses of soil humus composition and humic acid structural characteristics to the addition of different types of biochar in phaeozems. J. Soil Sci. Plant Nutr. 2023, 23, 1611–1618. [Google Scholar] [CrossRef]
  38. Qian, X.; Li, Q.; Chen, H.; Zhao, L.; Wang, F.; Zhang, Y.; Zhang, J.; Müller, C.; Yi, Z. Enhancing soil nitrogen retention capacity by biochar incorporation in the acidic soil of pomelo orchards: The crucial role of pH. Agronomy 2023, 13, 2110. [Google Scholar] [CrossRef]
  39. Wang, N.; Zhao, K.; Li, F.; Peng, H.; Lu, Y.; Zhang, L.; Pan, J.; Jiang, S.; Chen, A.; Yan, B.; et al. Characteristics of carbon, nitrogen, phosphorus and sulfur cycling genes, microbial community metabolism and key influencing factors during composting process supplemented with biochar and biogas residue. Bioresour. Technol. 2022, 366, 128224. [Google Scholar] [CrossRef] [PubMed]
  40. Han, L.; Sun, K.; Yang, Y.; Xia, X.; Li, F.; Yang, Z.; Xing, B. Biochar’s stability and effect on the content, composition and turnover of soil organic carbon. Geoderma 2020, 364, 114184. [Google Scholar] [CrossRef]
  41. Wang, L.; Dong, M.; Zhang, L.; Du, X. Effects of organic manures with different carbon-to-nitrogen ratios on soil microbial biomass of organic agriculture. Chin. J. Eco-Agric. 2013, 21, 1073–1077. (In Chinese) [Google Scholar] [CrossRef]
  42. Bonfante, P.; Venice, F. Mucoromycota: Going to the roots of plant-interacting fungi. Fungal Biol. Rev. 2020, 34, 100–113. [Google Scholar] [CrossRef]
  43. Cleveland, C.C.; Liptzin, D. C:N:P stoichiometry in soil: Is there a “Redfield ratio” for the microbial biomass? Biogeochemistry 2007, 85, 235–252. [Google Scholar] [CrossRef]
  44. Zhang, L.; Zhou, J.; George, T.S.; Limpens, E.; Feng, G. Arbuscular mycorrhizal fungi conducting the hyphosphere bacterial orchestra. Trends Plant Sci. 2022, 27, 402–411. [Google Scholar] [CrossRef] [PubMed]
  45. Bin, Z.; Qi, C.; Xueli, D. Research progress on accumulation, turnover and stabilization of microbial residues in soil. Acta Pedol. Sin. 2022, 59, 1479–1491. (In Chinese) [Google Scholar] [CrossRef]
  46. Zhang, J.; Fan, B.; Zhao, L.; Zhao, C.; Yang, F. Biochar promotes compost humification by regulating bacterial and fungal communities. Front. Microbiol. 2024, 15, 1470930. [Google Scholar] [CrossRef] [PubMed]
  47. Li, Y.; Herbst, M.; Chen, Z.; Chen, X.; Xu, X.; Xiong, Y.; Huang, Q.; Huang, G. Long term response and adaptation of farmland water, carbon and nitrogen balances to climate change in arid to semi-arid regions. Agric. Ecosyst. Environ. 2024, 364, 108882. [Google Scholar] [CrossRef]
  48. Huang, M.; Zhou, X.; Chen, J.; Cao, F.; Jiang, L.; Zou, Y. Interaction of changes in pH and urease activity induced by biochar addition affects ammonia volatilization on an acid paddy soil following application of urea. Commun. Soil Sci. Plant Anal. 2017, 48, 107–112. [Google Scholar] [CrossRef]
  49. Kim, M.S.; Min, H.G.; Koo, N.; Kim, J.G. Response to ammonia emission flux to different pH conditions under biochar and liquid fertilizer application. Agriculture 2021, 11, 136. [Google Scholar] [CrossRef]
  50. Wu, D.; Senbayram, M.; Moradi, G.; Mörchen, R.; Knief, C.; Klumpp, E.; Jones, D.L.; Well, R.; Chen, R.; Bol, R. Microbial potential for denitrification in the hyperarid Atacama Desert soils. Soil Biol. Biochem. 2021, 157, 108248. [Google Scholar] [CrossRef]
  51. Hu, J.; Cyle, K.T.; Yuan, W.; Shi, W. Soil dependence of biochar composts in mitigating greenhouse gas emissions: An overlooked biophysical mechanism. Appl. Soil Ecol. 2024, 198, 105374. [Google Scholar] [CrossRef]
  52. Fan, F.; Yin, C.; Tang, Y.; Li, Z.; Song, A.; Wakelin, S.A.; Zou, J.; Liang, Y. Probing potential microbial coupling of carbon and nitrogen cycling during decomposition of maize residue by 13C-DNA-SIP. Soil Biol. Biochem. 2014, 70, 12–21. [Google Scholar] [CrossRef]
  53. Sun, X.; Yang, X.; Hu, Z.; Liu, F.; Xie, Z.; Li, S.; Wang, G.; Li, M.; Sun, Z.; Bol, R. Biochar effects on soil nitrogen retention, leaching and yield of perennial citron daylily under three irrigation regimes. Agric. Water Manag. 2024, 296, 108788. [Google Scholar] [CrossRef]
  54. Iqbal, S.; Xu, J.; Khan, S.; Worthy, F.R.; Khan, H.Z.; Nadir, S.; Ranjitkar, S. Regenerative fertilization strategies for climate-smart agriculture: Consequences for greenhouse gas emissions from global drylands. J. Clean. Prod. 2023, 398, 136650. [Google Scholar] [CrossRef]
  55. Pei, J.; Fang, C.; Li, B.; Nie, M.; Li, J. Aridity-driven change in microbial carbon use efficiency and its linkage to soil carbon storage. Glob. Change Biol. 2024, 30, e17565. [Google Scholar] [CrossRef] [PubMed]
  56. Xiao, S.; Ye, Y.; Xiao, D.; Chen, W.; Zhang, W.; Wang, K. Effects of tillage on soil N availability, aggregate size, and microbial biomass in a subtropical karst region. Soil Tillage Res. 2019, 192, 187–195. [Google Scholar] [CrossRef]
  57. Wei, L.; Ge, T.; Zhu, Z.; Ye, R.; Peñuelas, J.; Li, Y.; Lynn, T.M.; Jones, D.L.; Wu, J.; Kuzyakov, Y. Paddy soils have a much higher microbial biomass content than upland soils: A review of the origin, mechanisms, and drivers. Agric. Ecosyst. Environ. 2022, 326, 107798. [Google Scholar] [CrossRef]
  58. Feng, Y.; Sun, H.; Xue, L.; Liu, Y.; Gao, Q.; Lu, K.; Yang, L. Biochar applied at an appropriate rate can avoid increasing NH3 volatilization dramatically in rice paddy soil. Chemosphere 2017, 168, 1277–1284. [Google Scholar] [CrossRef] [PubMed]
  59. Li, N.; Han, X.; You, M.; Xu, Y. Research review on soil aggregates and microbes. Ecol. Environ. Sci. 2013, 22, 1625–1632. (In Chinese) [Google Scholar] [CrossRef]
  60. Bai, Y.; Hou, S.; Zhao, Y.; Zhang, R.; Zhang, A.; Li, X.; Wang, X. Soil organic carbon accumulation and aggregate stabilization processes and their interactions. Soil Fertil. Sci. China 2024, 7, 208–220. (In Chinese) [Google Scholar] [CrossRef]
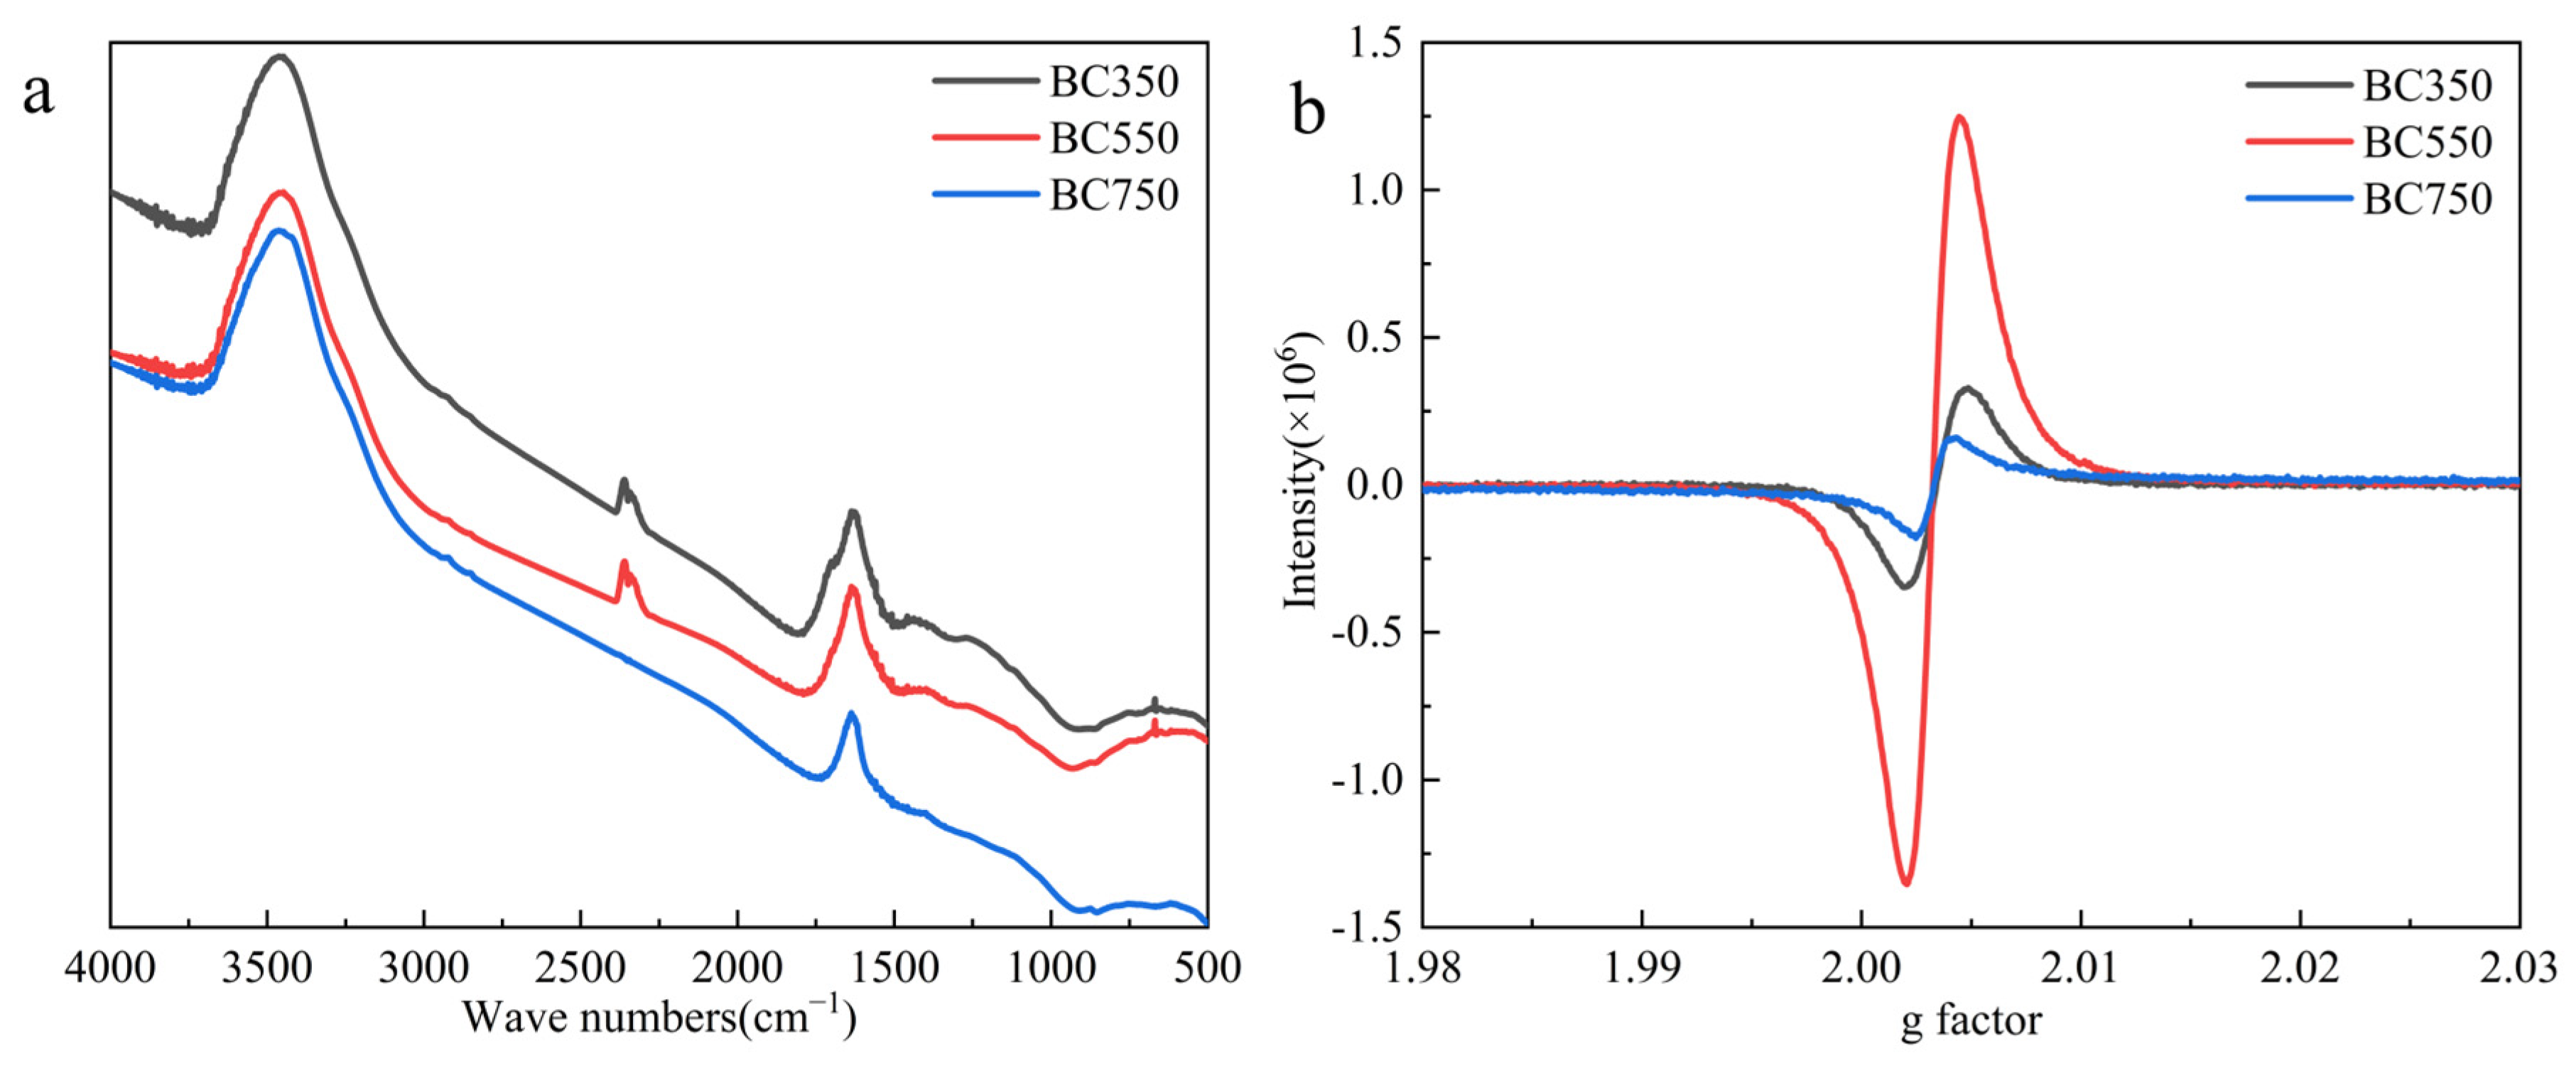
Figure 1. FTIR spectroscopy (a) and EPR spectroscopy (b) of biochar.
Agronomy 16 01496 g001
Figure 2. Changes in soil NH4+–N and NO3–N: (a,b) represent 65% soil WHC, and (c,d) represent 45% soil WHC.
Agronomy 16 01496 g002
Figure 3. Changes in soil TN and TC at the initial stage and end-stage of cultivation: (a,b) represent 65% soil WHC, and (c,d) represent 45% soil WHC. Different lowercase letters indicate significant differences in soil TN or TC on the 5th day, and different uppercase letters indicate significant differences in soil TN or TC on the 60th day, at a significance level of p < 0.05.
Agronomy 16 01496 g003
Figure 4. Changes in soil total humus acid–C (a), humic acid–C (b) and total humus acid–N (c) content at the end-stage of cultivation. Different lowercase letters indicate significant differences among various treatments under 45% soil WHC, and different uppercase letters indicate significant differences among various treatments under 65% soil WHC, at a significance level of p < 0.05.
Agronomy 16 01496 g004
Figure 5. Proportion of various N contents at the end-stage of cultivation.
Agronomy 16 01496 g005
Figure 6. Changes in soil microorganisms at the end-stage of cultivation: (a) phylum Fungi, (b) genus Fungi, (c) phylum Bacteria, and (d) genus Bacteria. The prefix “N” represents 65% soil WHC, and prefix “D” represents 45% soil WHC.
Agronomy 16 01496 g006
Figure 7. The influencing pathways of various factors on C and N sequestration based on PLS-PM (a) and their total effects (b). Solid arrows indicate significant paths (red for positive, blue for negative), while dashed arrows represent non-significant paths (p > 0.05). The numbers adjacent to the arrows denote standardized path coefficients, with * p < 0.05, ** p < 0.01, and *** p < 0.001. Here, “Inorganic nitrogen” includes NH4+–N and NO3–N; “Microbial biomass” includes MBC, MBN, and MBC/MBN; and “Humus” includes total humus acid–N, total humus acid–C, and humic acid–C.
Agronomy 16 01496 g007
Table 1. The changes in N and C content of biochar before and after 60-day cultivation. Different letters in the same column indicate significant differences between samples at the same time.
BC350BC550BC750 BC350BC550BC750
Uncultivated (initial value)N %1.33 ± 0.01 ab1.44 ± 0.06 a1.27 ± 0.01 bC %65.54 ± 0.08 c66.81 ± 0.00 c70.44 ± 0.05 c
D group (after cultivation)1.22 ± 0.04 b1.35 ± 0.04 a1.33 ± 0.04 ab67.00 ± 0.04 a68.87 ± 0.19 b79.04 ± 0.06 a
N group (after cultivation)1.36 ± 0.03 a1.30 ± 0.02 a1.42 ± 0.03 a66.60 ± 0.11 b69.50 ± 0.11 a78.24 ± 0.77 a
Table 2. Basic properties of biochar and green manure.
C H O NpHEC (μS/cm)Specific Surface
Area (m2/g)
Pore Volume (cm3/g)
N%C%H%O%H/C(O+N)/CC/N
BC3501.3365.542.8116.790.510.2057.497.120.45 × 10−34.520.0044
BC5501.4466.812.3813.470.430.1754.138.577.25 × 10−334.190.0265
BC7501.2770.441.417.670.240.1064.7110.421.56 × 103127.220.0868
Green manure5.1643.845.85---9.91----
Table 3. Changes in MBC and MBN contents in soil.
Treatment (Soil WHC)45% Soil WHC65% Soil WHC
IndexTime
(Day)
CKGMGB350GB550GB750CKGMGB350GB550GB750
MBC (mg/g)30th0.05 ± 0.00 c0.12 ± 0.00 b0.17 ± 0.01 a0.16 ± 0.02 a0.16 ± 0.02 a0.04 ± 0.01 C0.22 ± 0.00 B0.28 ± 0.01 A0.26 ± 0.06 AB0.25 ± 0.00 AB
60th0.01 ± 0.00 c0.06 ± 0.00 b0.16 ± 0.01 a0.16 ± 0.02 a0.17 ± 0.03 a0.03 ± 0.01 C0.28 ± 0.01 B0.26 ± 0.01 B0.29 ± 0.01 AB0.30 ± 0.03 A
MBN (mg/g)30th0.00 ± 0.00 c0.01 ± 0.01 bc0.02 ± 0.00 a0.02 ± 0.00 ab0.01 ± 0.00 bc0.00 ± 0.00 C0.04 ± 0.00 B0.04 ± 0.01 AB0.06 ± 0.02 AB0.08 ± 0.00 A
60th0.00 ± 0.00 c0.04 ± 0.01 a0.03 ± 0.01 ab0.03 ± 0.00 a0.02 ± 0.00 bc0.00 ± 0.00 C0.05 ± 0.01 A0.01 ± 0.00 BC0.02 ± 0.00 B0.04 ± 0.01 A
MBC/MBN30th12.019.366.939.0817.0812.325.906.404.543.26
60th3.421.395.834.5810.478.445.4818.5314.837.14
Note: The 30th day is the mid-stage of cultivation, and the 60th day is the end-stage of cultivation. Different letters in the same row indicate significant differences and are distinguished by uppercase and lowercase letters in different moisture groups, at a significance level of p < 0.05.
Disclaimer/Publisher’s Note: The statements, opinions and data contained in all publications are solely those of the individual author(s) and contributor(s) and not of MDPI and/or the editor(s). MDPI and/or the editor(s) disclaim responsibility for any injury to people or property resulting from any ideas, methods, instructions or products referred to in the content.