Article

Contrasting Soil Organic Carbon Fractions in Woody Versus Herbaceous Coastal Riparian Habitats by Integrating Litter-Derived DOM and Edaphic Properties


1
State Power Environmental Protection Research Institute, Nanjing 210031, China
2
School of Environmental Science and Safety Engineering, Tianjin University of Technology, Tianjin 300384, China
*
Author to whom correspondence should be addressed.
Agronomy 2026, 16(15), 1462; https://doi.org/10.3390/agronomy16151462
Submission received: 29 May 2026 / Revised: 22 July 2026 / Accepted: 29 July 2026 / Published: 1 August 2026

Abstract

Coastal riparian zones are important transitional areas for carbon cycling between terrestrial and aquatic ecosystems. However, the associations among litter-derived dissolved organic matter (DOM), soil DOM composition, and soil organic carbon (SOC) fractions across habitats remain insufficiently understood. This study aimed to clarify SOC fraction distribution in woody and herbaceous habitats and evaluate its associations with litter-derived DOM, soil DOM composition, and soil environmental factors in different seasons from a coastal riparian zone. In this study, woody habitats had higher SOC content in March, whereas herbaceous habitats showed greater SOC content in November. Particulate organic carbon (POC) and mineral-associated organic carbon (MAOC) were generally higher in different habitats. MAOC accounted for a large proportion of the measured SOC-related pools and showed a consistent positive association with SOC content. Soil DOM consisted of protein-like and humic-like components, with herbaceous habitats showing a stronger protein-like component and woody habitats showing a stronger humic-like component in March. Woody litter showed greater DOC and DON release potential than herbaceous litter leachates, while litter-derived humic-like DOM was closely associated with a soil humic-like component. The labile SOC pool was mainly associated with vegetation type and electrical conductivity, whereas MAOC was positively associated with soil moisture content and total phosphorus. Overall, the distribution of SOC fractions in coastal riparian habitats is shaped by habitat-specific environmental factors, including vegetative carbon inputs, litter leaching and soil physicochemical properties. This finding is critical for developing targeted management strategies to facilitate SOC accumulation in coastal zones.

1. Introduction

Soil organic carbon (SOC) is the largest active carbon pool in terrestrial ecosystems, storing more than twice as much carbon as the atmosphere and playing a central role in global carbon cycling, soil quality maintenance, and climate change mitigation [1,2]. However, SOC is not a homogeneous carbon pool. Different SOC fractions vary substantially in their sources, turnover rates, sensitivity to environmental change, and potential for stabilization [1,2]. Mineral-associated organic carbon (MAOC) is typically bound to mineral particles or mineral surfaces and is regarded as a major component of the relatively stable SOC pool, whereas dissolved organic carbon (DOC), easily oxidizable organic carbon (EOC), and particulate organic carbon (POC) are more labile, turn over more rapidly, and can reflect short-term SOC responses to vegetation inputs and environmental change [3,4]. Therefore, separating SOC into functional fractions can improve process-level understanding of soil carbon distribution and stabilization potential.
The distribution and persistence of SOC fractions are shaped by multiple environmental factors, including salinity, nitrogen availability, oxygen status, and soil moisture [2,5,6,7]. Under climate change, shifts in precipitation regimes and soil moisture conditions may further alter the transformation, turnover, and stabilization of SOC fractions. In particular, under seasonal water limitation, reduced soil moisture may constrain solute diffusion and microbial activity and modify interactions between organic molecules and mineral surfaces, thereby affecting labile SOC turnover and MAOC formation. However, in riparian habitats, the responses of different SOC fractions to seasonal water limitation remain poorly understood, particularly when vegetation type and plant litter inputs are considered together.
Dissolved organic matter (DOM) is an important intermediate product of soil organic matter and plant litter decomposition [8]. Because of its high mobility, reactivity, and bioavailability, DOM is closely linked to SOC formation, greenhouse gas emissions, humification, and the turnover of different SOC fractions [9,10,11]. Plant litter is an important source of soil DOM and organic carbon inputs [12,13]. During litter decomposition, the release of DOC, dissolved organic nitrogen (DON), protein-like components, and humic-like components may be closely associated with soil DOM composition and SOC fraction distribution. Differences in litter quality, decomposition rate, and DOM release among plant types may therefore lead to distinct SOC fraction distributions. Previous studies have shown that plant-type-related differences in SOC are often associated with soil DOC content, litter lignin and protein proportions, and DOM composition [14]. For example, differences in cellulose, lignin, and other constituents between Pinus tabulaeformis and Quercus acutissima litter may influence POC and MAOC accumulation [15]. However, under changing environmental conditions, it remains unclear whether DOM derived from woody and herbaceous vegetation shows similar or divergent associations with soil DOM composition and SOC fractions.
Riparian zones are critical transition areas between terrestrial and aquatic ecosystems and play important roles in organic carbon transport, retention, and transformation [16,17]. Influenced by plant growth, hydrological processes, sedimentation, and soil erosion, riparian zones often exhibit highly dynamic carbon cycling. Riparian vegetation can influence soil carbon inputs through litter decomposition, root turnover, and root exudation, while vegetated buffer strips can reduce erosion-induced carbon loss and promote organic matter retention in soils [17,18]. Most previous studies on riparian ecosystems and vegetated buffer strips have focused on vegetation restoration, water quality improvement, nutrient retention, erosion control, changes in total SOC, or DOC export [18,19,20]. In contrast, the integrated links among litter-derived DOM quality, soil DOM composition, and SOC fraction allocation remain insufficiently explored. In coastal riparian zones, the combined effects of soil salinity, hydrological fluctuation, vegetation differentiation, and seasonal water limitation may further complicate DOM transformation and SOC fraction dynamics [21,22]. Therefore, integrating SOC fractionation, litter-derived DOM characterization, and soil DOM spectral analysis is necessary to evaluate associations between DOM and SOC fractions across different vegetation habitats.
This study was conducted in the riparian zone of the Duliujian River in Tianjin, an area characterized by clayey soils, pronounced seasonal hydrological variation, and distinct woody and herbaceous vegetation habitats [23]. By integrating SOC fractions, litter-derived DOM characterization, soil DOM fluorescence analysis, and multivariate statistical approaches, this study aimed to: (1) determine the distribution patterns of POC, MAOC, DOC, and EOC across different vegetation habitats; (2) compare the fluorescence characteristics and DOC/DON patterns of litter-derived DOM and soil DOM; and (3) evaluate associations among season, vegetation type, environmental factors, DOM components, and SOC fractions. By establishing a robust theoretical basis for managing coastal SOC pools, this study underscores their critical role in sustaining ecological security and informs policy frameworks essential for realizing China’s dual carbon targets.

2. Materials and Methods

2.1. Study Area

The study area is located in the Duliujian River Basin, Tianjin, China (38°44′–39°04′ N, 116°54′–117°30′ E). The basin connects the Tuanbo and Beidagang wetland reserves, both of which are important wetland resources in Tianjin. The study area represents a typical coastal riparian habitat characterized by frequent land–water interactions and pronounced seasonal hydrological variation. Precipitation is unevenly distributed in this region and is mainly concentrated in summer, whereas spring and autumn typically differ markedly in soil moisture conditions. The soils are dominated by clayey textures, and vegetation is clearly differentiated into woody and herbaceous belts. The woody belt is mainly composed of Populus lasiocarpa, Tamarix chinensis, Salix matsudana, and Robinia pseudoacacia, whereas the herbaceous belt is dominated by Phragmites australis and Suaeda salsa.

2.2. Soil and Litter Sample Collection

This study focused on soils and plant litter from woody and herbaceous habitats in the riparian zone of the Duliujian River Basin. Samples were collected in March and November 2023, representing the spring and autumn sampling periods, respectively. Because this study included only these two sampling periods, the results were used to compare SOC fractions and DOM characteristics between seasonal stages.
To minimize the influence of local hydrological conditions and microhabitat heterogeneity, 13 representative sampling locations were selected along the Duliujian River riparian zone, with efforts made to keep topography, slope position, vegetation cover, and distance from the river as consistent as possible among sites. Areas with visible waterlogging, severe erosion, animal disturbance, recent sediment deposition, or obvious human disturbance were avoided during sampling. At each sampling location, one 20 m × 20 m quadrat was established in each of the tree, mixed-forest, and waterfront vegetation belts, resulting in 13 quadrats for each original vegetation belt. Based on vegetation life form and community composition, the tree and mixed-forest belts were grouped as woody vegetation, whereas the waterfront vegetation belt was classified as herbaceous vegetation for subsequent data processing and statistical analyses. Within each 20 m × 20 m quadrat, five 1 m × 1 m subplots were randomly established. After visible litter and plant residues were removed from the soil surface, non-rhizosphere soil was collected from the 0–10 cm depth. Soil subsamples from the five subplots within each quadrat were thoroughly homogenized to form one composite soil sample representing that 20 m × 20 m quadrat. The 1 m × 1 m subplots were used primarily to reduce within-quadrat spatial heterogeneity and were not treated as independent field replicates; instead, the composite sample from each 20 m × 20 m quadrat served as the basic analytical unit.
Sampling was conducted during two seasonal periods. In each season, 13 composite soil samples were collected from each of the tree, mixed-forest, and waterfront vegetation belts, yielding 39 samples per season and 78 composite soil samples in total. After vegetation reclassification, the woody category included 26 samples per season from the tree and mixed-forest belts, for a total of 52 samples across two seasons, whereas the herbaceous category included 13 samples per season from the waterfront vegetation belt, for a total of 26 samples. Representative plant litter samples were collected from the corresponding quadrats at the same time as soil sampling. Litter with identifiable plant sources and no obvious decomposition was selected, and adhering sediment, stones, animal remains, and other impurities were removed. When litter from multiple plant species was clearly mixed within a quadrat, mixed litter samples were collected according to the dominant vegetation composition to characterize litter-derived DOM from different vegetation belts. Collected soil and litter samples were separately placed in clean resealable bags, labeled, kept at low temperature, and transported to the laboratory as soon as possible. In the laboratory, stones, shells, animal remains, visible roots, and other impurities were removed from the soil samples, which were then air-dried under ventilated conditions. The air-dried soil samples were ground, passed through a 100-mesh sieve, and subsampled for analyses of SOC, SOC fractions, soil physicochemical properties, and DOM-related parameters. Litter samples were air-dried or oven-dried at low temperature, ground, and used for subsequent DOM extraction and analyses of DOC, DON, and fluorescence spectra.

2.3. Measurement of Soil and Litter Parameters

Soil pH and electrical conductivity (EC) were measured using a pH meter at a soil:water ratio of 1:2.5 (Delta320, Mettler Toledo, Greifensee, Switzerland) and a conductivity meter at a soil:water ratio of 1:5 (DDSJ-308A, Leici, Shanghai, China), respectively [24]. Soil moisture content (MC) was determined using the aluminum-dish oven-drying method according to HJ 613—2011. Ammonium nitrogen (NH4+-N) and nitrate nitrogen (NO3-N) were extracted with 1 mol L−1 KCl. NO3-N was determined by ultraviolet spectrophotometry, with absorbance measured at 220 and 275 nm for correction, whereas NH4+-N was determined by the indophenol blue colorimetric method, with absorbance measured at 630 nm after color development [25]. Soil total phosphorus (TP) was determined by inductively coupled plasma optical emission spectrometry (ICP-OES; VISTA-MPX, Varian, Palo Alto, CA, USA). Briefly, 0.15 g of 100-mesh soil was placed in a Teflon digestion tube, digested with an HF:HNO3 solution at a ratio of 1:9 at 160 °C for 2 h, evaporated to remove excess acid, and then analyzed [26].
Soil organic carbon (SOC) was determined using the potassium dichromate external-heating method. Particulate organic carbon (POC) and mineral-associated organic carbon (MAOC) were separated using a dispersion–wet sieving method with sodium hexametaphosphate solution (5 g L−1) [27,28]. Air-dried soil was dispersed by shaking with sodium hexametaphosphate solution, and the resulting slurry was passed through a 53 μm standard sieve. The fraction retained on the sieve (>53 μm) was washed, dried, and analyzed for carbon content using the same method as SOC; this fraction was defined as POC. The fraction passing through the sieve (<53 μm) was operationally defined as MAOC. Because the soils in the study area are dominated by clayey textures, sodium hexametaphosphate and sufficient shaking were used before sieving to reduce potential bias in POC/MAOC separation caused by incomplete aggregate dispersion. Easily oxidizable organic carbon (EOC) was determined using the potassium permanganate oxidation method [29]. Air-dried 100-mesh soil was reacted with 333 mmol L−1 KMnO4 solution by shaking, after which absorbance was measured at 565 nm and EOC content was calculated from a standard curve. All samples were processed using consistent shaking, sieving, washing, and drying procedures to minimize operational variability in the fractionation results. Because soil bulk density was not measured directly, SOC stock was estimated using an empirical relationship between SOC content and bulk density that has previously been applied to coastal wetland soils [30]; the detailed calculation procedure and estimated values are provided in Supplementary Method S1 and Table S4.
Soil DOM was extracted using a water-extraction method. Ultrapure water was added at a water:soil ratio of 5:1, and the mixture was shaken in the dark at 25 °C and 180 r min−1 for 24 h. The suspension was then centrifuged at 4000 r min−1 for 20 min, and the supernatant was filtered through a 0.45 μm membrane to obtain the DOM extract, which was stored at 4 °C until analysis [31,32]. Dissolved organic carbon and nitrogen (DOC and DON) concentrations were measured using a total organic carbon analyzer (SOP-Vario, Elementar, Langenselbold, Germany).
After drying and grinding, litter samples were extracted with water using the same solid:liquid ratio and extraction conditions as those used for soil DOM, and the filtrates were used for DOC, DON, and fluorescence spectral analyses [33,34].

2.4. Dissolved Organic Matter Characterization

Fluorescence excitation–emission matrix (EEM) spectra of soil and litter DOM extracts were measured using a three-dimensional fluorescence spectrometer (FS5, Edinburgh Instruments, Livingston, UK). Excitation wavelengths ranged from 200 to 500 nm at 5 nm intervals, and emission wavelengths ranged from 250 to 600 nm at 1 nm intervals. Ultrapure water was used as a blank, and the blank signal was subtracted during subsequent data processing. The EEM data were first preprocessed by removing Raman and Rayleigh scattering, applying interpolation correction and smoothing, and performing Raman normalization; fluorescence intensity was then normalized to Raman units (R.U.) [35,36]. Parallel factor analysis (PARAFAC) was then performed using the drEEM toolbox in MATLAB R2024a to identify independent fluorescent DOM components. During PARAFAC modeling, the optimal number of components was determined using outlier removal, residual analysis, and split-half validation to improve model stability and component identification reliability [36,37]. A four-component model was retained, and the identified fluorescent components were labeled C1, C2, C3, and C4. The putative sources of each component were assigned based on excitation/emission peak positions, the OpenFluor database, and previous studies [38]. The characteristic fluorescence peak regions of litter DOM and their corresponding compound types are provided in Table S1.
To further characterize DOM sources, autochthonous contributions, and humification degree, the fluorescence index (FI), biological index (BIX), and humification index (HIX) were calculated according to established fluorescence-spectroscopic methods [39,40,41], and their formulas and ecological interpretations are provided in Table S2.

2.5. Data Analysis

Bar and stacked plots were used to visualize changes in SOC fractions, DOM components, and fluorescence indices across seasons and vegetation types, and figures were generated using the “ggplot2” package in R 4.4.1 (https://ggplot2.tidyverse.org/). The effects of season and vegetation type on SOC fractions, DOM components, fluorescence indices, litter DOC/DON, and soil environmental factors were tested using two-way analysis of variance, with season, vegetation type, and their interaction included as fixed factors. When significant main effects or interactions were detected, Tukey’s HSD test was used for multiple comparisons. Before analysis, variables were tested for normality and homogeneity of variance; variables that did not meet these assumptions were appropriately transformed or further checked using nonparametric tests. Statistical significance was set at p < 0.05 for all tests. Based on the turnover characteristics of different SOC fractions, the sum of DOC, EOC, and POC was defined as the labile SOC pool, whereas MAOC was defined as the relatively stable SOC pool. Within each season–vegetation type combination, simple linear regression was used to examine the relationships of labile and stable SOC pools with total SOC content. Relationships among DOM variables from different sources were fitted using simple linear regression models, with slopes and significance levels reported. All continuous variables included in the RDA, random forest, and SEM analyses were Z-score standardized to reduce the influence of differences in measurement scale.
Redundancy analysis (RDA) was used to evaluate associations among soil environmental factors, litter DOM parameters, soil DOM parameters, and SOC fractions [42]. RDA was performed in Canoco 5, and the statistical significance of ordination axes and explanatory variables was assessed using permutation tests. To reduce the influence of multicollinearity on the ordination results, explanatory variables were screened using variance inflation factors before RDA, and highly collinear variables were removed [43]. A random forest model was further used to assess the relative importance of environmental factors and DOM parameters in explaining variation in SOC fractions. Random forest analysis was performed using the “randomForest” package in R. Variable importance was ranked according to the increase in mean squared error (%IncMSE), and the statistical significance of variable importance was assessed using permutation tests [44].
Finally, based on the study hypotheses and the results of correlation analysis, RDA, and random forest modeling, an exploratory structural equation model (SEM) was constructed to evaluate hypothesized association pathways among environmental factors, vegetation type, season, litter-derived DOM, soil DOM, and SOC fractions. Continuous variables were standardized before SEM analysis, and the number of paths was constrained according to sample size and model complexity. Model fit was evaluated using the chi-square-to-degrees of freedom ratio ( χ 2/df < 2), a nonsignificant chi-square test (p > 0.05), the goodness-of-fit index (GFI > 0.90), and the root mean square error of approximation (RMSEA < 0.08) [45,46].

3. Results

3.1. Changes in Environmental Factors

Soil environmental factors varied across seasons and vegetation types (Table S3). When grouped by season, all environmental factors except NO3-N differed significantly. Specifically, pH, MC, and EC were significantly higher in autumn than in spring (p < 0.05), whereas NH4+-N and TP were significantly higher in spring than in autumn (p < 0.05). NO3-N did not differ significantly between spring and autumn (p = 0.103). When grouped by vegetation type, pH, MC, and EC were significantly higher in herbaceous than in woody vegetation habitats (p < 0.05), whereas NO3-N, NH4+-N, and TP did not differ significantly between vegetation types (p > 0.05). Among these variables, pH, MC, and EC differed significantly by both season and vegetation type, indicating that they were the main environmental characteristics distinguishing seasonal stages and vegetation habitats.

3.2. Distribution Patterns of SOC and Its Fractions

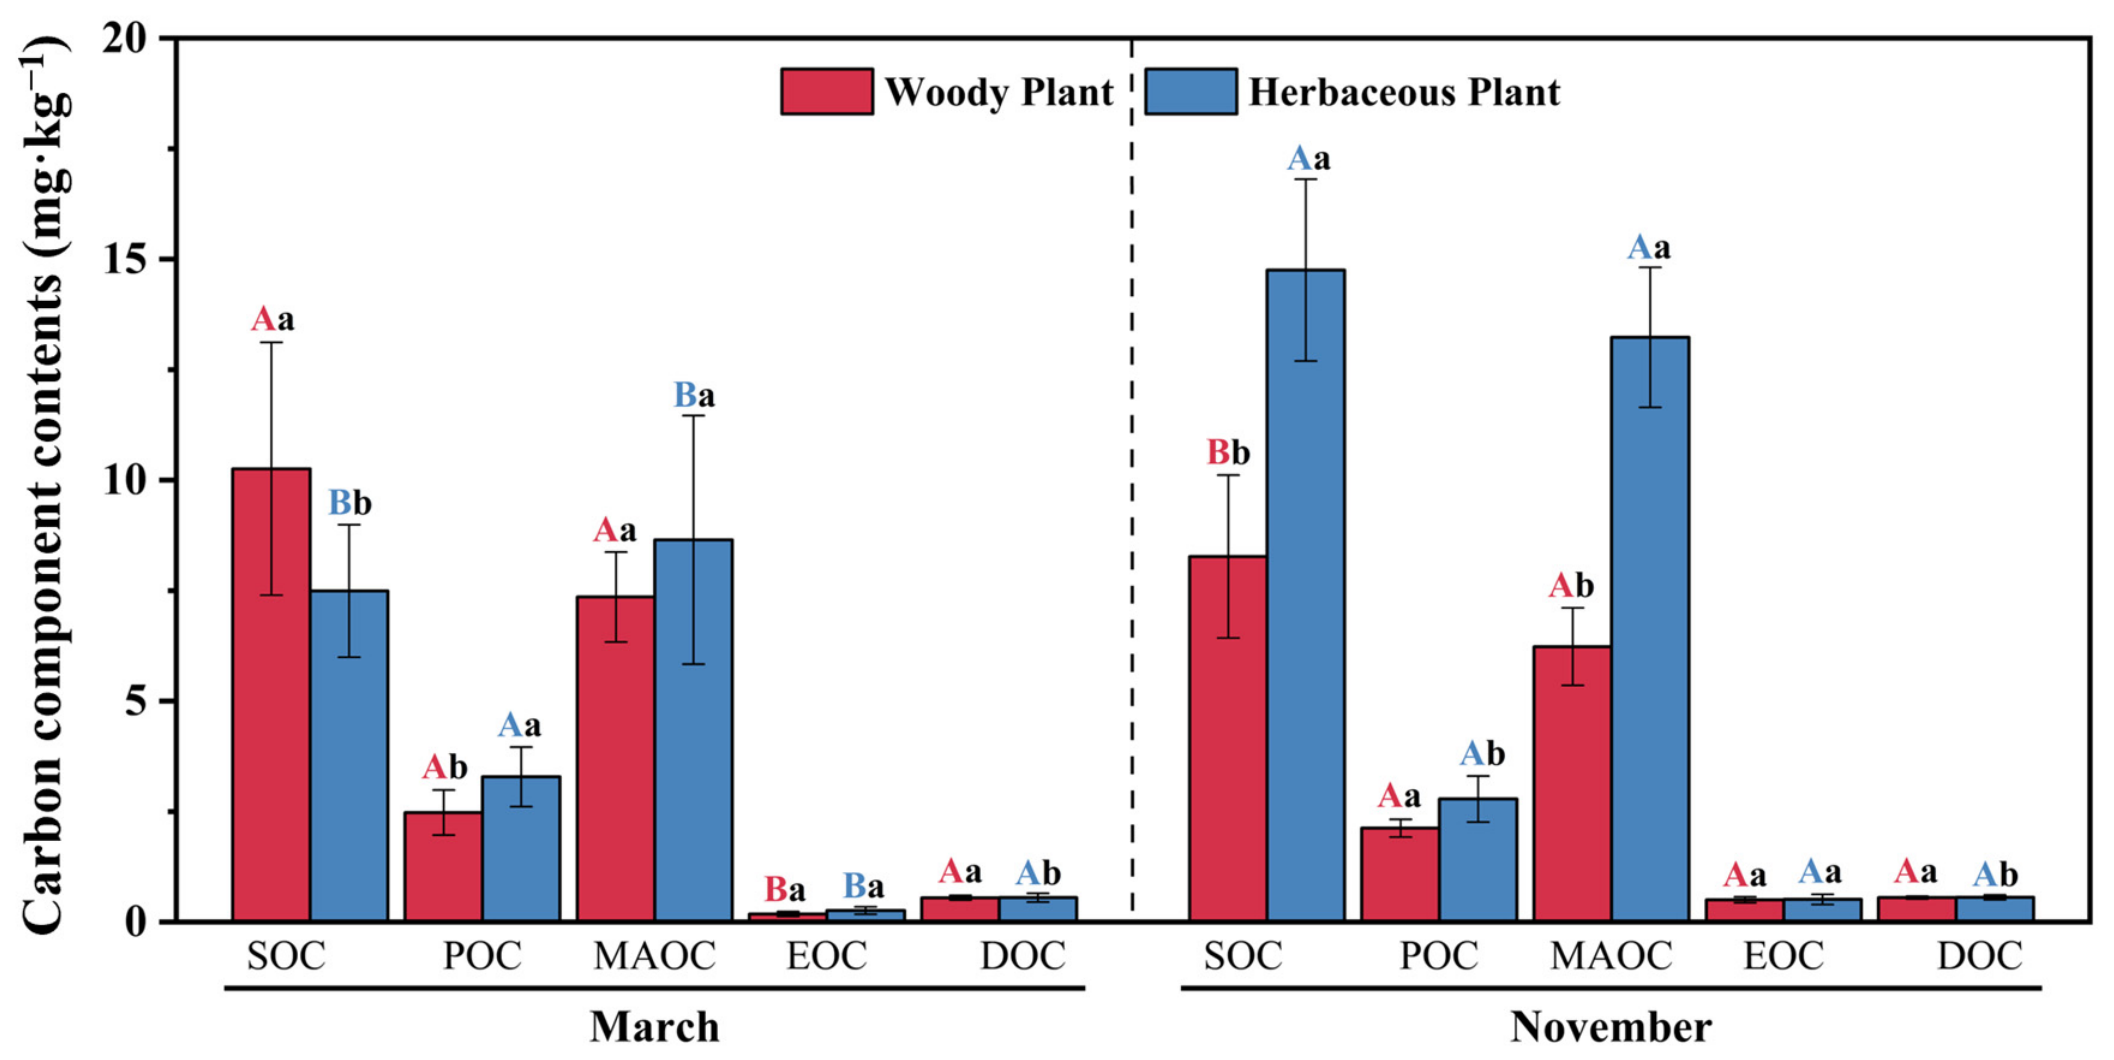
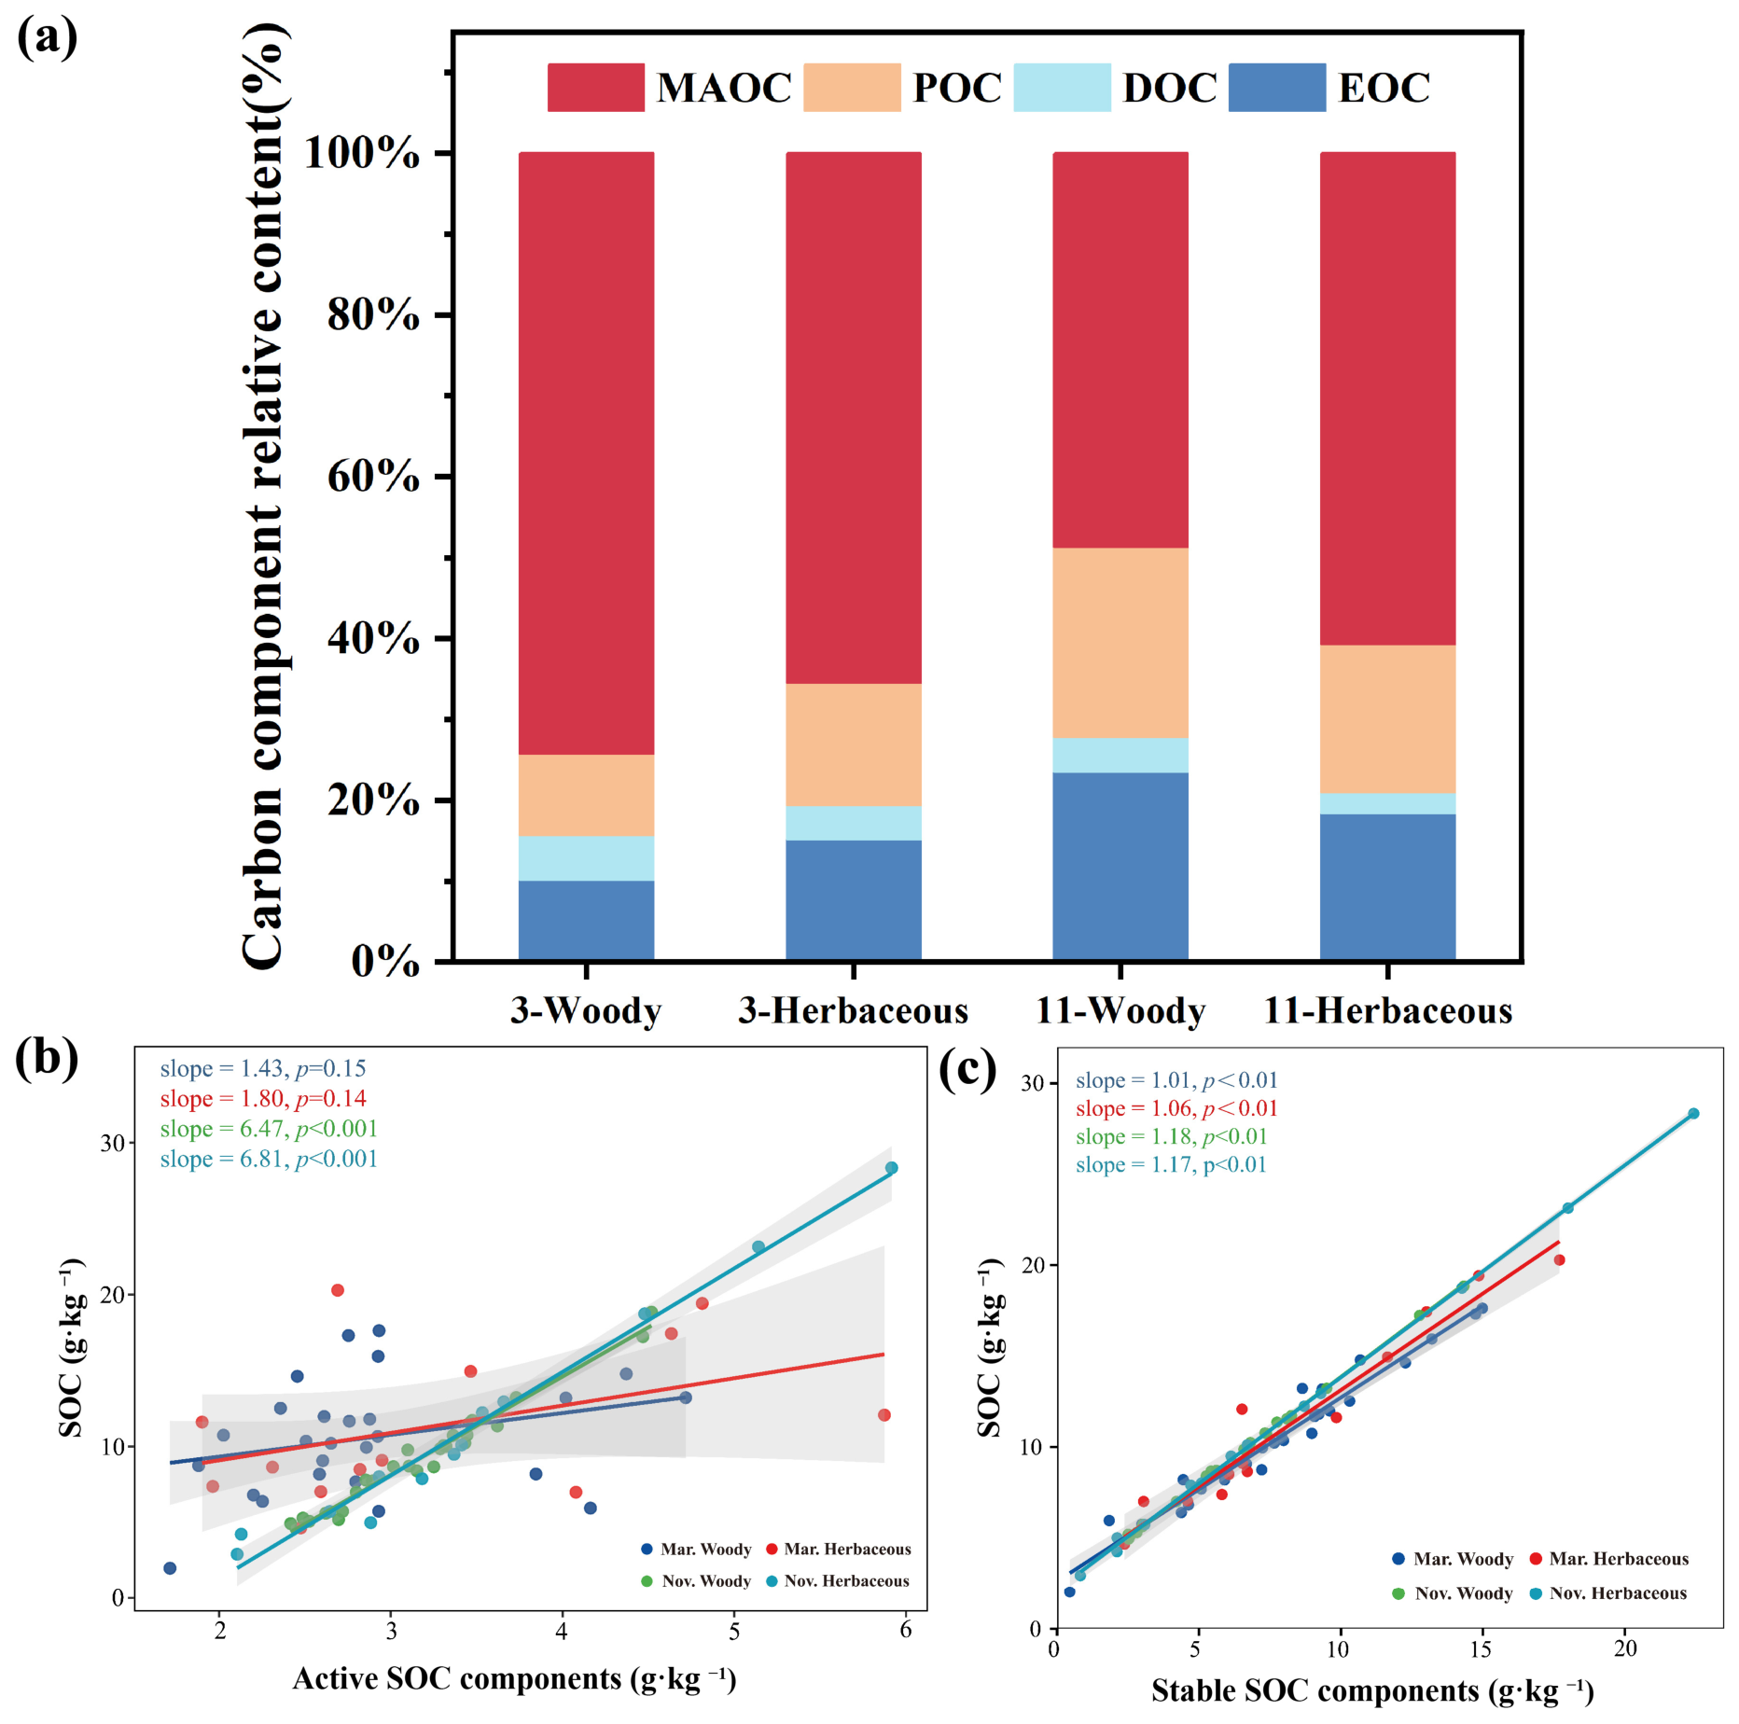
The SOC and its fractions showed distinct distribution patterns across seasons and vegetation types (Figure 1). In March, SOC content was higher in woody than in herbaceous vegetation habitats, whereas the opposite pattern was observed in November. POC and MAOC were generally higher in herbaceous vegetation habitats, with MAOC accounting for the largest proportion across all groups. DOC contributed a relatively small proportion, whereas the relative proportion of EOC increased in woody vegetation habitats in November (Figure 2a). The relatively stable SOC fraction, represented by MAOC, was significantly and positively correlated with SOC content across all groups (p < 0.01; Figure 2c). In contrast, the labile SOC pool, defined as DOC + EOC + POC, was significantly and positively correlated with SOC content only in both woody and herbaceous vegetation habitats in November (p < 0.001; Figure 2b). The estimated 0–10 cm SOC stock, calculated using bulk density estimated from SOC content, ranged from 11.44 to 21.12 Mg C ha−1. It was higher in woody than in herbaceous vegetation habitats in March but higher in herbaceous than in woody vegetation habitats in November, showing an overall pattern consistent with SOC content; detailed results are provided in Table S4.

3.3. Changes in Soil DOM Fluorescent Components and Fluorescence Indices

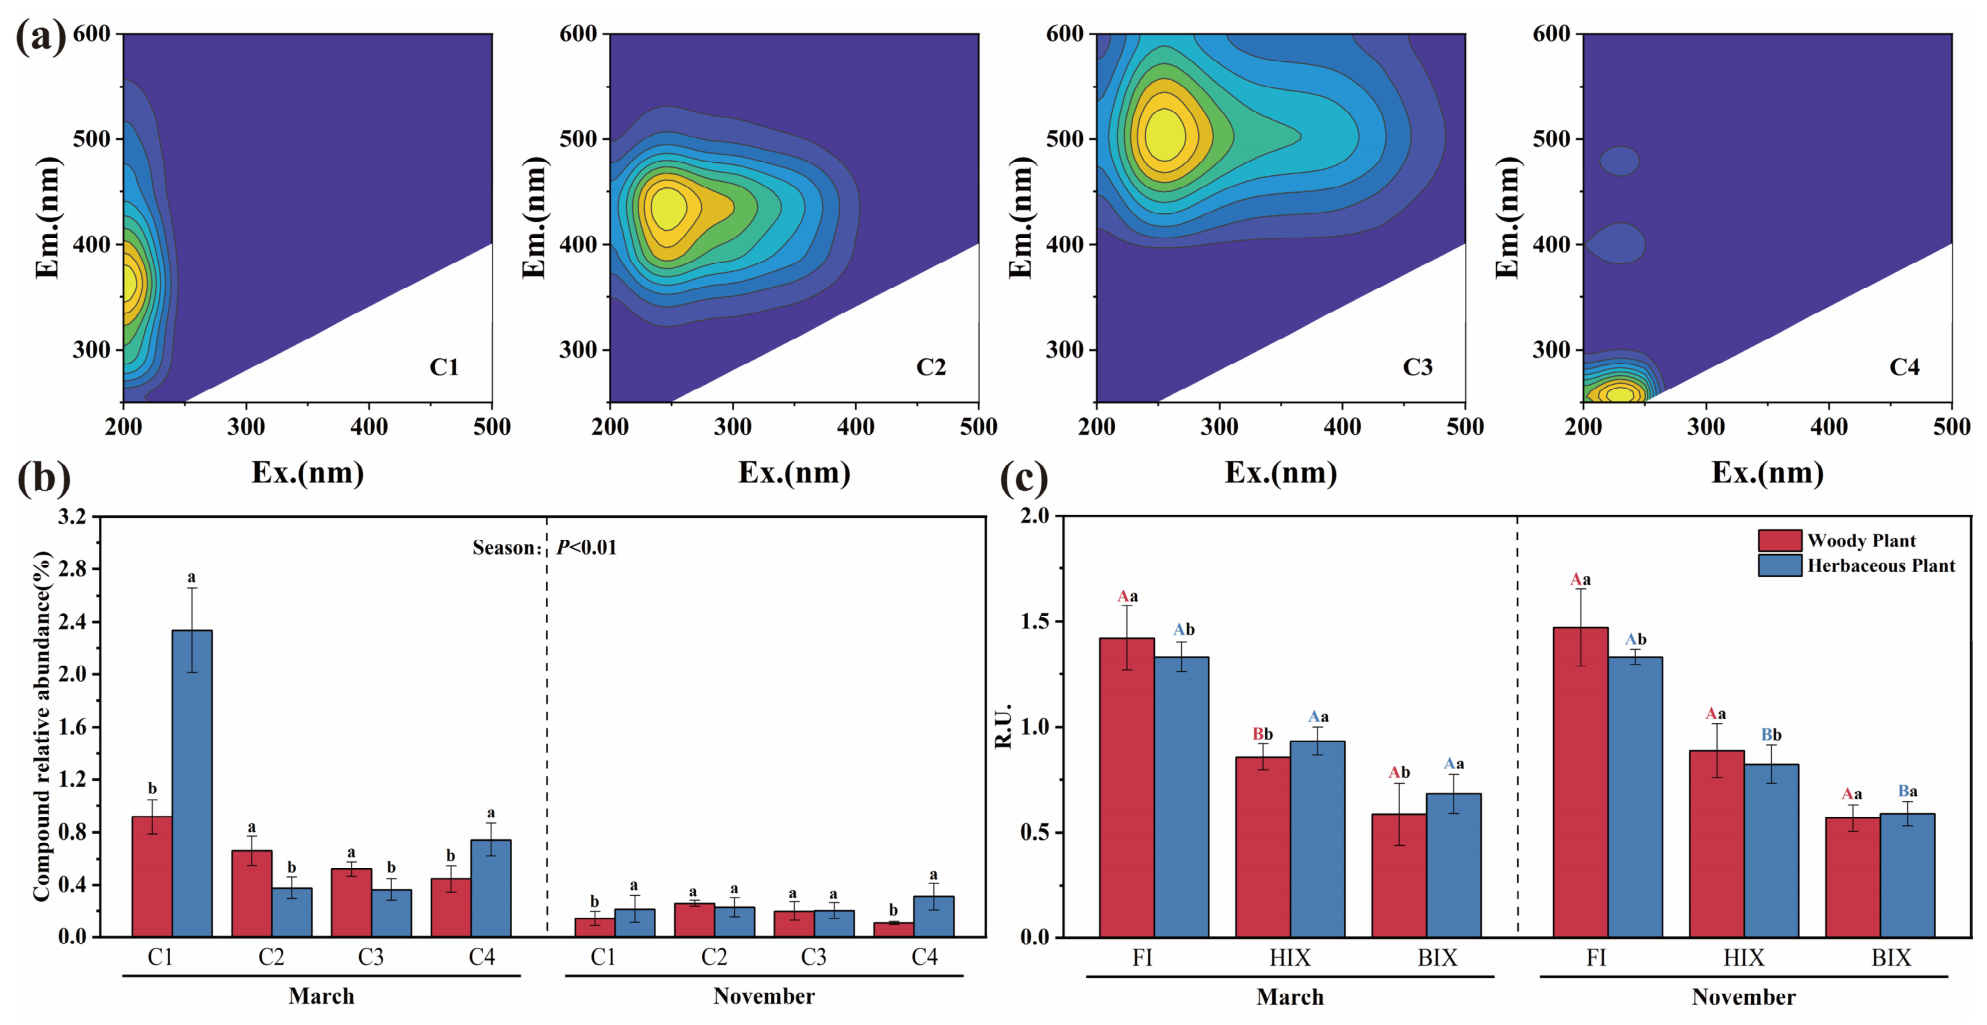
Four major DOM fluorescent components were identified using PARAFAC analysis (Figure 3a). C1 was assigned to a tyrosine-like protein component, which is commonly associated with small-molecule, readily transformable, or microbially derived organic matter [47]. C2 and C3 were assigned to humic-like components and may be associated with allochthonous inputs and humified DOM characteristics, respectively [48,49]. C4 was assigned to a protein-like component, which is often associated with fresh organic matter inputs or microbially derived DOM [48,49,50].
DOM fluorescent components varied markedly across seasons and vegetation types. In March, the fluorescence intensities of C1 and C4 were higher in herbaceous than in woody vegetation habitats, whereas C2 and C3 were higher in woody vegetation habitats (p < 0.05; Figure 3b). In November, the overall fluorescence intensities of DOM components decreased, differences between vegetation types became less pronounced, and only some components remained significantly different. These results suggest that soil DOM component distributions were associated with seasonal stage and vegetation type, with more pronounced differences in DOM composition between vegetation habitats in spring. Fluorescence indices were further used to evaluate soil DOM sources, autochthonous contributions, and humification degree (Figure 3c). The low-to-moderate FI values, together with generally low BIX and HIX values, indicated that soil DOM was mainly influenced by terrestrial inputs, with relatively limited autochthonous microbial contributions and a low degree of humification.

3.4. Fluorescence Characteristics of Litter-Derived DOM and DOC/DON Release

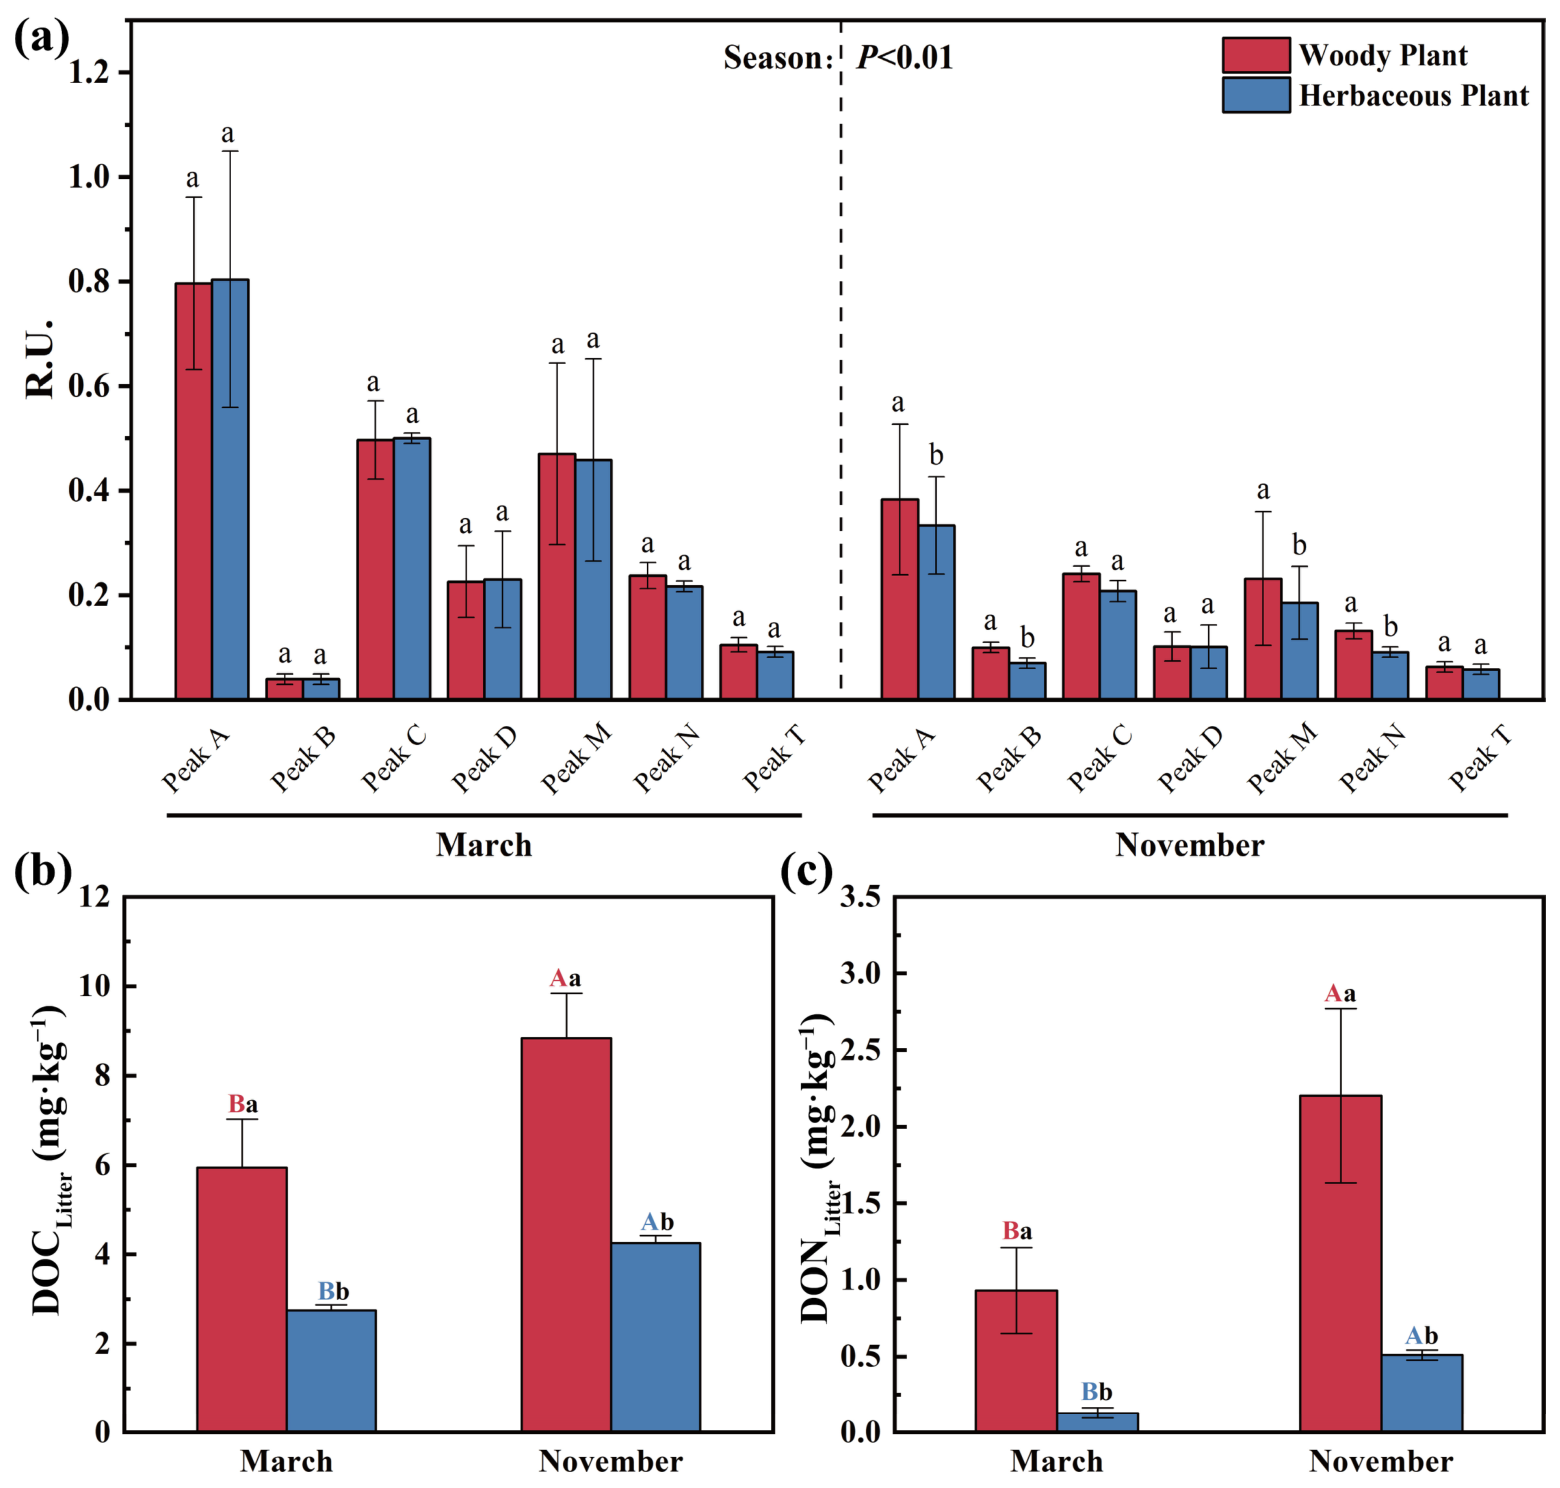
Characteristic peak analysis of excitation–emission matrix spectra from different plant litter leachates identified seven typical fluorescence peaks (Figure 4a). The characteristic fluorescence peaks of litter-derived DOM differed significantly between seasons (p < 0.01; Figure 4a). Overall, some fluorescence peaks still differed significantly between woody and herbaceous litter in November. Most humic-like peaks, including peaks A, C, and M, showed higher fluorescence intensities in March than in November, whereas the tyrosine-like protein peak B was relatively higher in November. The fluorescence intensities of humic-like peaks, such as A, C, and M, were generally higher than those of the other characteristic peaks, suggesting that humic-like substances were among the dominant fluorescent components in the litter leachates. DOC and DON concentrations in litter leachates differed significantly between vegetation types, with woody litter leachates showing significantly higher DOC and DON concentrations than herbaceous litter leachates (p < 0.05; Figure 4b,c). Seasonal differences were also evident, as DOC and DON concentrations in both woody and herbaceous litter leachates were higher in November than in March (p < 0.05; Figure 4b,c).

3.5. Potential Association Pathways of Soil Organic Carbon Fractions

3.5.1. Associations Between Litter-Derived DOM and Soil DOM

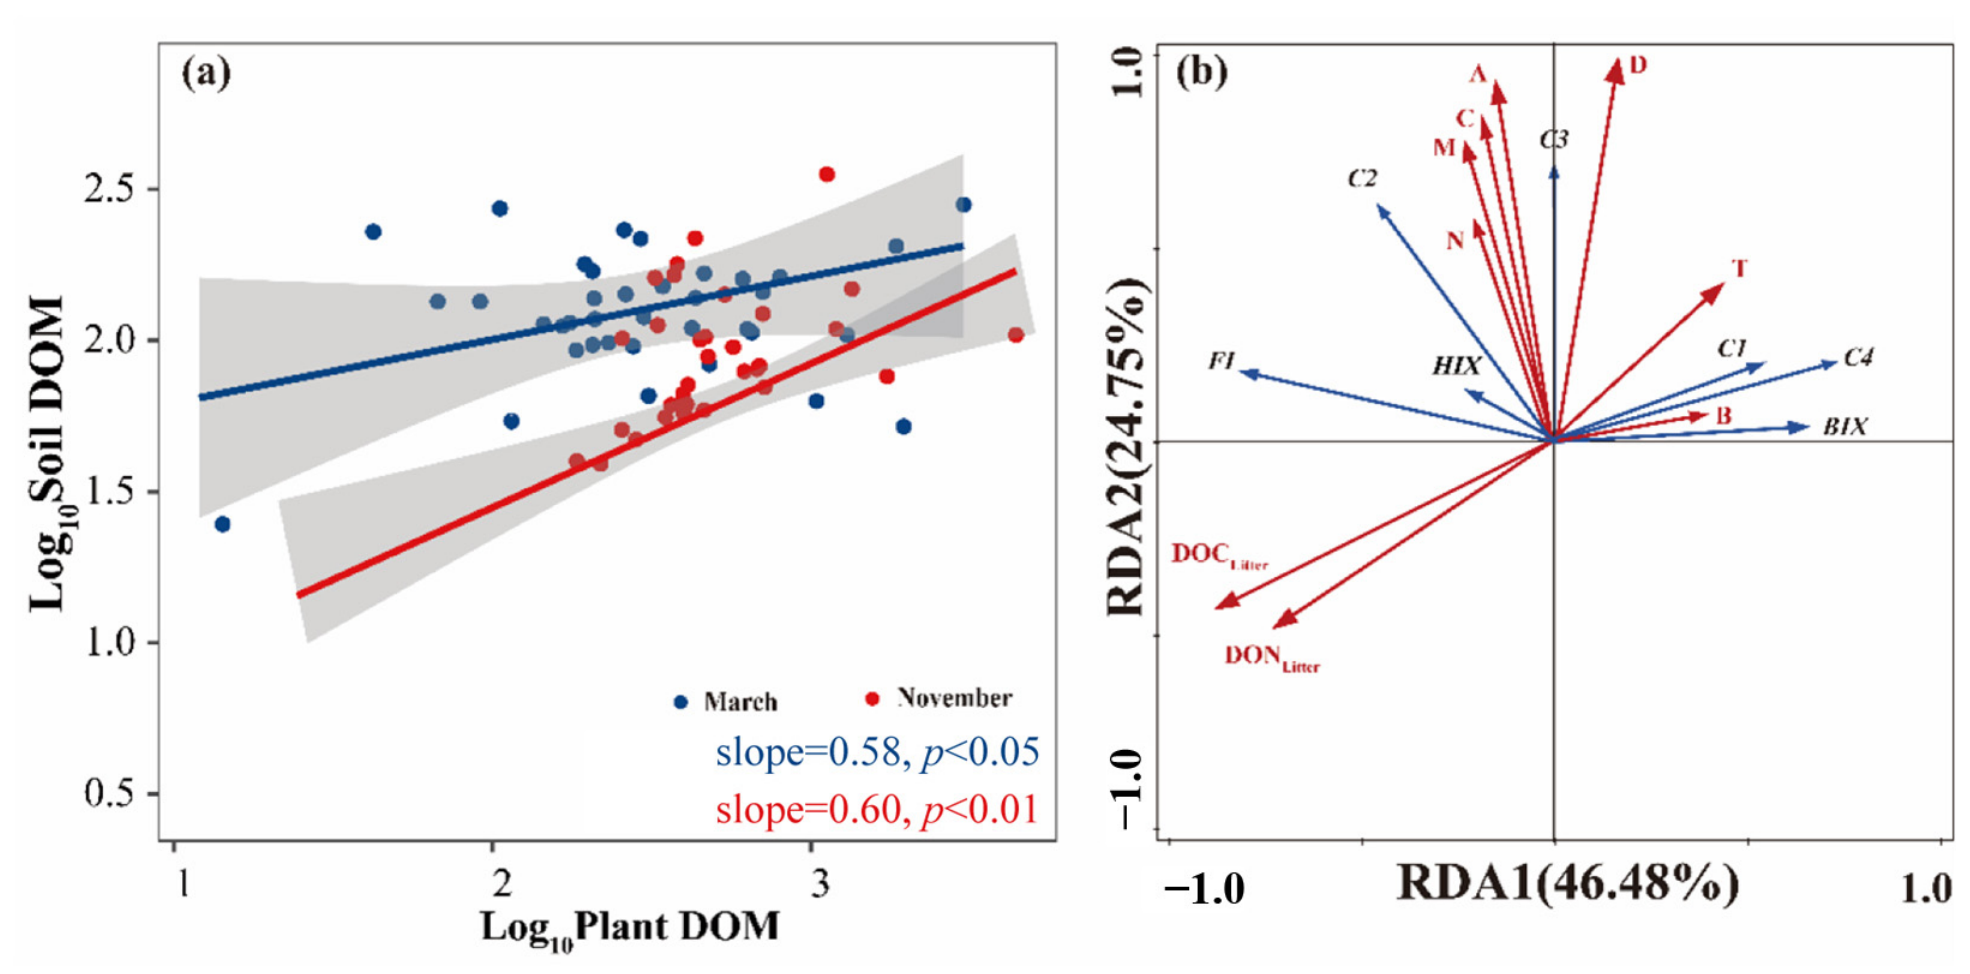
Litter-derived DOM represents a potential source of soil DOM in riparian zones. Litter-derived DOM and soil DOM were significantly and positively correlated in both seasons, with slightly stronger statistical support in November than in March (March: slope = 0.58, p < 0.05; November: slope = 0.60, p < 0.01; Figure 5a). In the RDA, litter-derived DOM parameters were used as explanatory variables, whereas soil DOM parameters were used as response variables (Figure 5b). The first two RDA axes explained 46.48% and 24.75% of the variation, respectively (Figure 5b). Humic-like litter peaks A, C, M, and D were oriented similarly to soil humic-like components, particularly C3, whereas protein-like peaks B and T were more closely aligned with C1, C4, and BIX.

3.5.2. Associations of Soil Environmental Factors with SOC Fractions and DOM Components

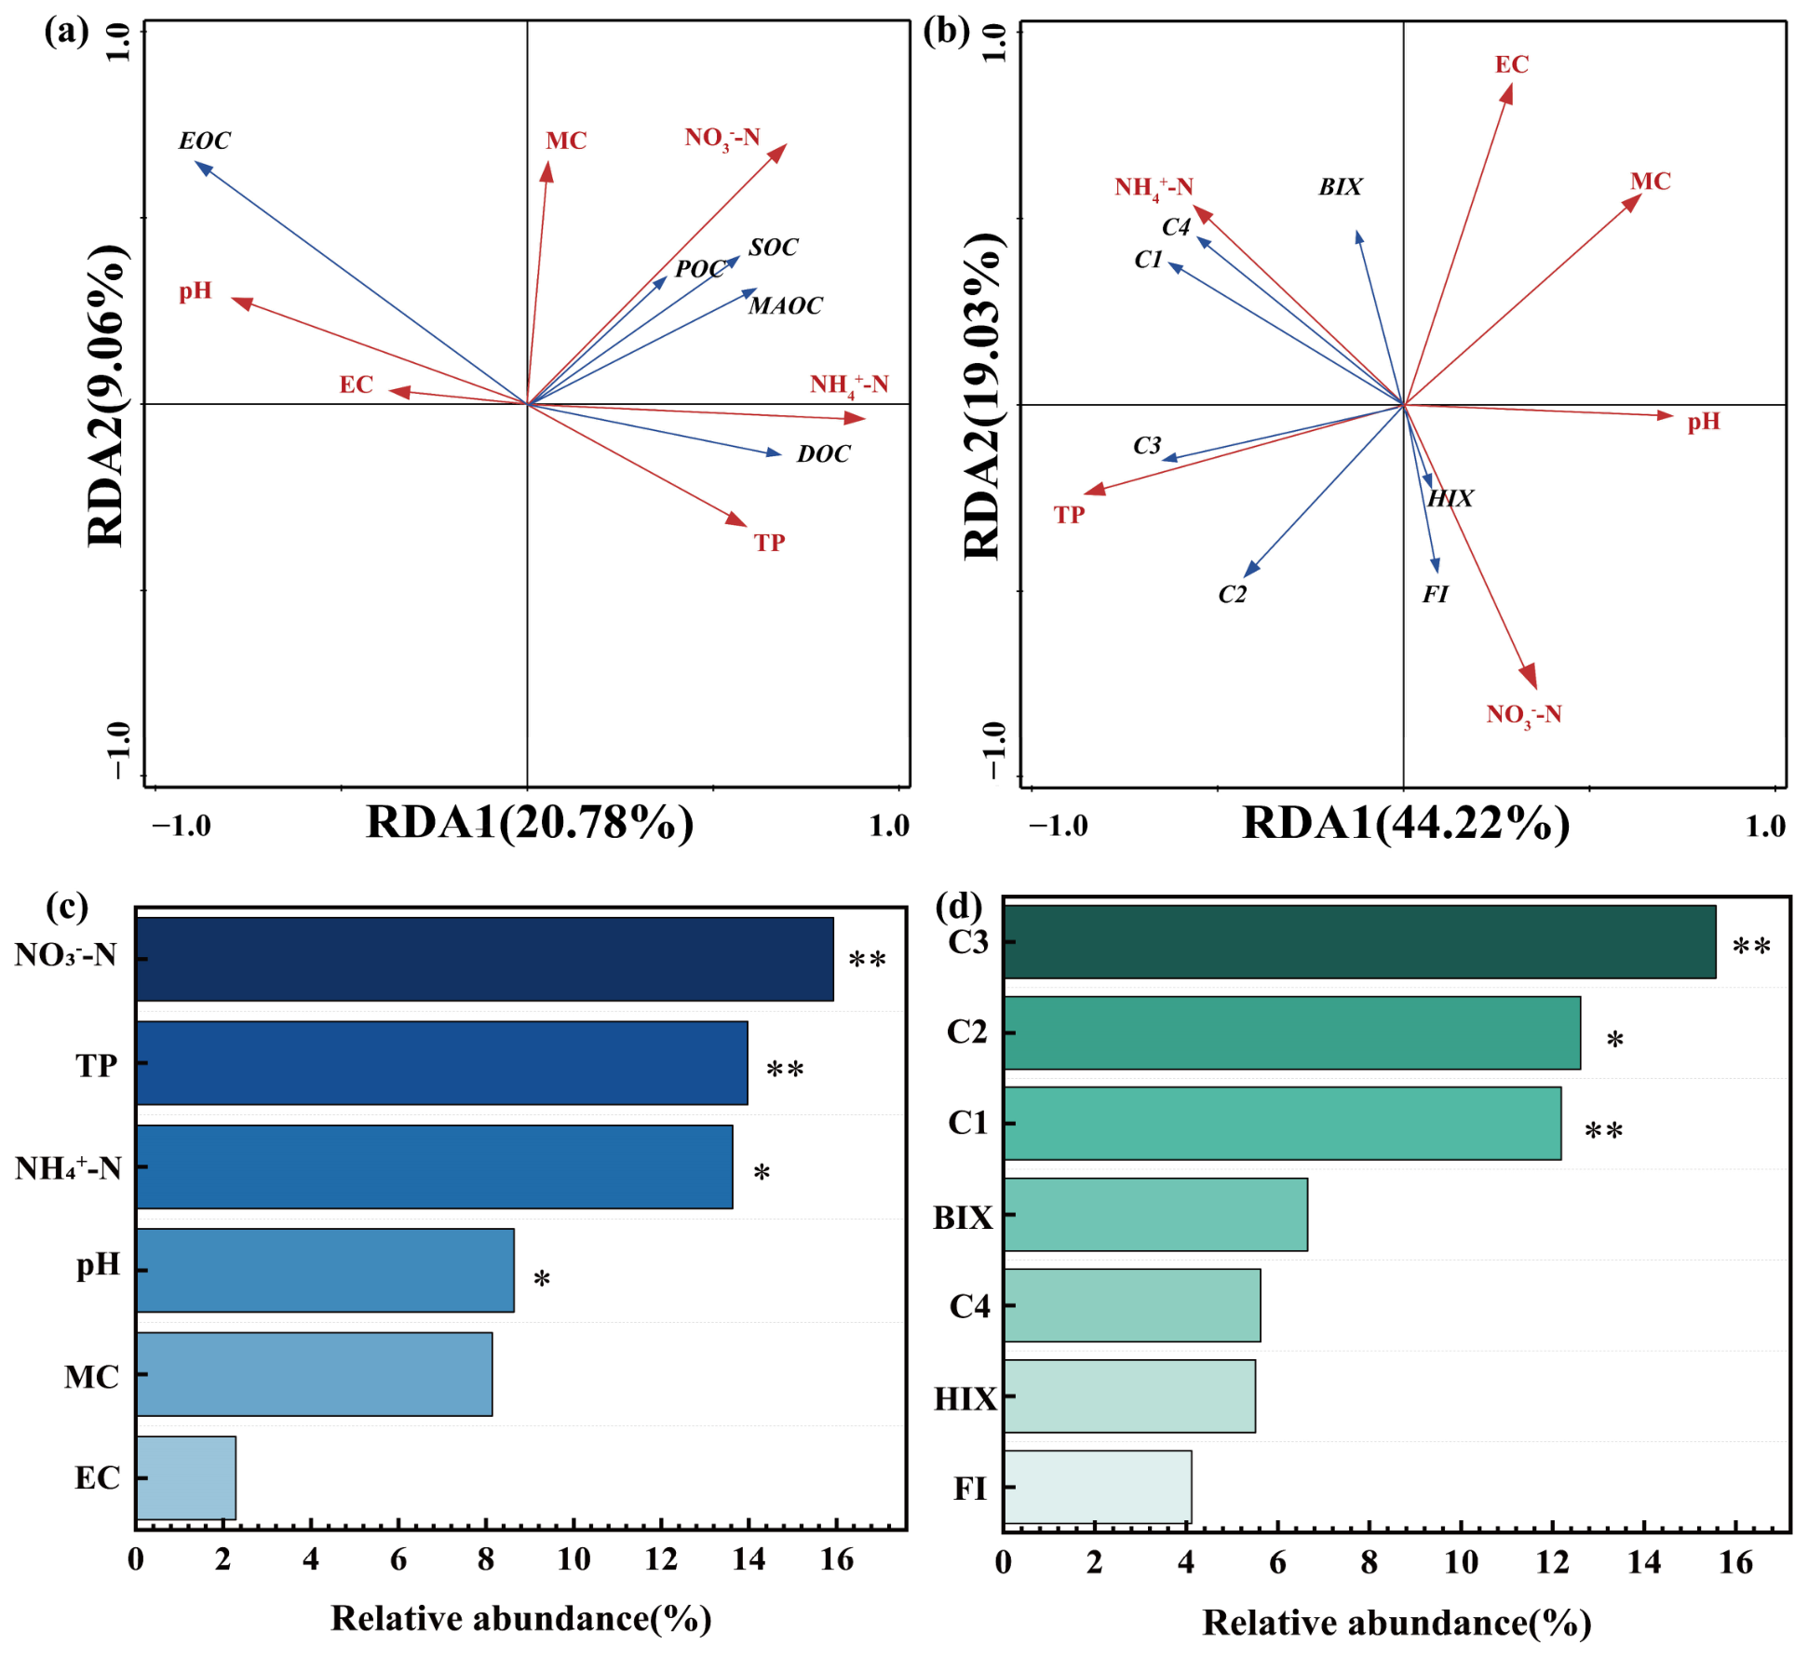
RDA was used to examine associations between soil environmental factors and SOC fractions, and the first two RDA axes explained 29.84% of the variation in SOC fractions (Figure 6a). SOC, POC, and MAOC were oriented more closely with NO3-N and opposite to pH, whereas DOC was more closely aligned with NH4+-N and TP. Random forest analysis showed that NO3-N, TP, NH4+-N, and pH had relatively high importance in explaining variation in SOC fractions (Figure 6c). For associations between environmental factors and DOM components, the first two RDA axes explained 63.25% of the variation (Figure 6b). C1 and C4 were more closely aligned with NH4+-N, C2 and C3 with TP, and FI and HIX with NO3-N and pH. Random forest results indicated that C3, C2, and C1 were relatively important in explaining variation in SOC content (Figure 6d).

3.5.3. Association Pathways of Labile and Relatively Stable SOC Pools

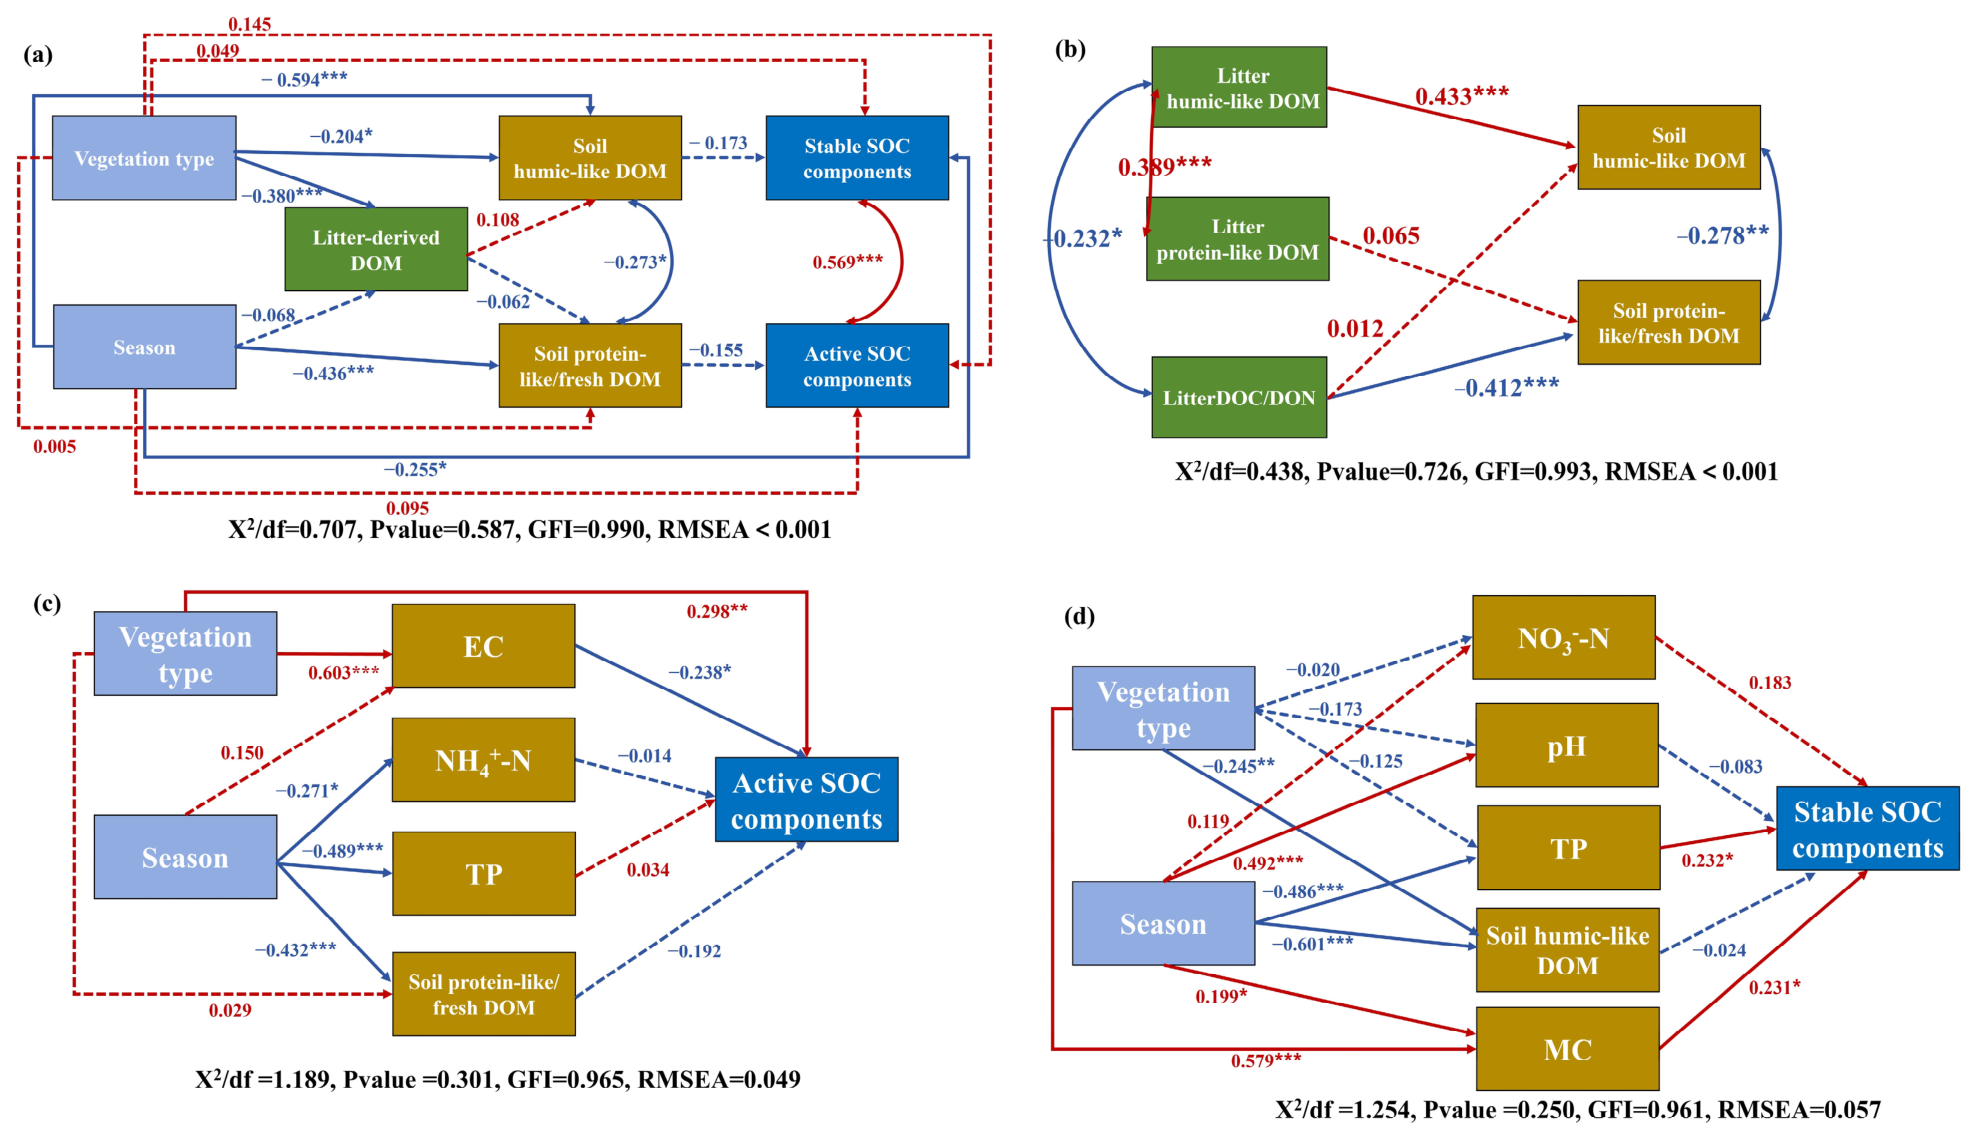
SEM was further used to evaluate association pathways among vegetation type, season, litter-derived DOM, soil DOM, environmental factors, and SOC fractions (Figure 7). The overall SEM showed a good model fit (χ2/df = 0.707, p = 0.587, GFI = 0.990, RMSEA < 0.001; Figure 7a). The three submodels also showed acceptable fit (χ2/df = 0.438–1.254, p = 0.250–0.726, GFI = 0.961–0.993, RMSEA ≤ 0.057; Figure 7b–d). In the overall model, vegetation type was significantly associated with litter-derived DOM and soil humic-like DOM, while season was significantly associated with soil protein-like DOM components and the labile SOC pool. The labile SOC pool was also significantly and positively correlated with the relatively stable SOC pool. In the litter-derived DOM–soil DOM submodel, litter humic-like DOM was significantly and positively associated with soil humic-like DOM, whereas litter DOC/DON was significantly and negatively associated with soil protein-like DOM components (Figure 7b). In the labile SOC model, vegetation type was significantly and positively associated with the labile SOC pool. Vegetation type was also significantly and positively associated with EC, while EC was significantly and negatively associated with the labile SOC pool (Figure 7c). In the relatively stable SOC model, MC and TP were significantly and positively associated with the relatively stable SOC pool (Figure 7d).

4. Discussion

4.1. Associations of Season, Vegetation Type, and Environmental Factors with SOC Fraction Distribution

SOC fractions differ in their sources, turnover rates, environmental sensitivity, and stabilization potential. Therefore, their distributions likely reflected the combined influence of seasonal stage, vegetation type, and soil environmental conditions. In this study, SOC content was higher in woody than in herbaceous vegetation habitats in March, whereas the opposite pattern was observed in November (Figure 1). This suggests that SOC fraction distribution in the study area was not associated with a single vegetation type or seasonal factor alone, but rather resulted from the combined effects of vegetation-specific inputs, seasonal environmental shifts, and related microhabitat conditions. Previous studies have also shown that vegetation can influence SOC fractions through litter and root inputs, although these effects are often constrained by soil moisture, salinity, and nutrient availability [51,52,53].
Differences in vegetation type partly explained the spatial variation in SOC fractions. Woody litter leachates contained higher DOC and DON concentrations than herbaceous litter leachates, indicating greater soluble C and N release potential from woody litter. However, POC and MAOC were generally higher in herbaceous vegetation habitats during both sampling periods. This contrast indicates that vegetation type influenced SOC fraction distribution not only through soluble C and N release from litter, but also through distinct carbon input, transformation, and retention pathways. Herbaceous habitats were more closely linked to the accumulation or retention of POC and MAOC, whereas woody vegetation showed stronger soluble DOC/DON release potential. Therefore, SOC fraction differences were not explained solely by litter-derived soluble C and N release, but may also be associated with root inputs, soil moisture and salinity conditions, mineral-association processes, and microbial transformation [54,55,56]. MAOC accounted for the largest proportion of measured SOC fractions across all groups, while POC also contributed substantially and DOC accounted for a relatively small proportion. Given the dominance of clayey soils in the study area, the high proportion of MAOC is consistent with the potential contribution of mineral-associated protection to SOC retention [57,58].
Soil environmental factors also contributed to SOC fraction variation. As shown in Table S3, pH, MC, and EC differed significantly by both season and vegetation type, indicating that soil acidity, moisture, and salinity were key environmental characteristics distinguishing seasonal stages and vegetation habitats. RDA showed that SOC, POC, and MAOC were more closely aligned with NO3-N and oriented opposite to pH, whereas DOC was more closely aligned with NH4+-N and TP (Figure 6a). Random forest analysis further indicated that NO3-N, TP, NH4+-N, and pH had relatively high importance in explaining variation in SOC fractions (Figure 6c). These results suggest that nitrogen form, phosphorus availability, and soil acidity were closely involved in SOC fraction differentiation [59,60,61].
The SEM results further showed distinct environmental pathways for labile and relatively stable SOC pools. Vegetation type and EC formed the main significant paths in the labile SOC pool model, with EC negatively associated with the labile SOC pool. In contrast, MC and TP were significantly and positively associated with the relatively stable SOC pool represented by MAOC (Figure 7c,d). These findings indicate that moisture–salinity conditions and nutrient availability were not only background environmental variables, but were closely involved in differentiating labile and relatively stable SOC pools [62,63,64]. The negative association between EC and the labile SOC pool suggests that salinity-related stress may constrain the accumulation or persistence of more labile carbon fractions, whereas the positive associations of MC and TP with MAOC indicate that moisture and phosphorus availability may favor relatively stable SOC retention. However, environmental factors had limited explanatory power for SOC fraction variation, as the first two RDA axes explained only 29.84% of the variation in SOC fractions. Therefore, soil environmental factors should be interpreted as part of a broader context that includes vegetation type, seasonal stage, litter-derived DOM, and unmeasured microbial processes, rather than as the sole drivers of SOC fraction distribution.
The relationships between SOC content and labile and relatively stable SOC pools also differed. MAOC was significantly and positively related to SOC content across seasons and vegetation types, indicating a relatively consistent statistical association between MAOC and SOC content (Figure 2c). In contrast, the labile SOC pool, defined as DOC, EOC, and POC, was significantly related to SOC content mainly in November, suggesting greater sensitivity to seasonal variation (Figure 2b). It should be noted that MAOC is itself an important component of SOC; therefore, the significant relationship between MAOC and SOC may partly reflect compositional dependence and should not be interpreted by itself as evidence that MAOC directly drives SOC accumulation. Overall, MAOC showed a relatively stable statistical association with SOC content, whereas the labile SOC pool appeared to be more responsive to seasonal variation. Taken together, these findings indicate that SOC fraction differentiation in this coastal riparian zone was closely linked to vegetation-specific carbon inputs, moisture–salinity constraints, nutrient status, and mineral-associated retention.

4.2. Links Between Litter-Derived DOM and Soil DOM Composition

DOM is an important intermediate linking plant litter inputs, soil organic matter transformation, and SOC fraction distribution [65]. In this study, soil DOM consisted of both protein-like DOM components and humic-like components. C1 and C4 mainly showed protein-like or fresh organic matter characteristics, whereas C2 and C3 showed humic-like characteristics (Figure 3a). The fluorescence indices further indicated that soil DOM had an overall allochthonous input signature and a relatively low degree of humification (Figure 3c), suggesting that riparian soil DOM was influenced by both terrestrial plant inputs and fresh organic matter transformation.
Soil DOM composition showed clear seasonal and vegetation-related differences. Soil DOM fluorescence intensities were generally higher in March than in November. In March, herbaceous habitats showed stronger C1 and C4 signals, whereas woody habitats showed stronger C2 and C3 signals (Figure 3b). This pattern indicates that herbaceous habitats were more closely associated with protein-like DOM characteristics, while woody habitats were more closely associated with humic-like DOM characteristics. In November, the overall fluorescence intensities of soil DOM components decreased and differences between vegetation types became weaker, suggesting that the seasonal stage may influence soil DOM input, transformation, and retention.
The positive correlations between litter-derived DOM and soil DOM in both sampling periods indicate a close linkage between plant litter inputs and soil DOM composition (Figure 5a). RDA further showed that humic-like litter peaks A, C, M, and D were oriented similarly to soil humic-like DOM components, particularly C3, whereas protein-like peaks B and T were more closely aligned with C1, C4, and BIX (Figure 5b). These results suggest that litter-derived humic-like and protein-like substances may contribute differently to soil DOM composition, with humic-like litter-derived DOM showing a stronger correspondence with soil humic-like DOM.
Woody litter leachates showed higher DOC and DON concentrations than herbaceous litter leachates, indicating greater soluble C and N release potential from woody litter under the same water-extraction conditions (Figure 4b,c). However, soil DOM fluorescence intensities were higher in March, whereas litter DOC and DON concentrations were higher in November. This contrast indicates that soluble C and N release from litter cannot be directly equated with soil DOM fluorescence signals or compositional changes. The transformation from litter-derived DOM to soil DOM may also be modulated by microbial utilization, mineral adsorption, and organic matter–mineral interfacial interactions [65,66]. Therefore, litter-derived DOM should be interpreted as an important potential source contributing to soil DOM compositional variation, rather than as the sole determinant of soil DOM abundance or SOC fraction distribution.
The different characteristics of protein-like and humic-like DOM further help explain their potential roles in SOC fraction differentiation. Protein-like DOM is generally more bioavailable and may be more readily involved in microbial metabolism and short-term carbon turnover [67]. In contrast, humic-like DOM usually has stronger humification characteristics and may be more likely to participate in mineral-associated retention and longer-term organic matter stabilization [66]. Together with the RDA ordination patterns and the relatively high importance of C3, C2, and C1 in explaining SOC variation in the random forest analysis (Figure 6d), these results suggest that soil DOM components, especially humic-like DOM, may serve as important intermediate links between litter inputs and SOC fraction distribution. Overall, the coupling between litter-derived humic-like DOM and soil humic-like DOM represents a key compositional linkage connecting vegetation inputs, soil DOM transformation, and SOC fraction differentiation in this coastal riparian zone.

4.3. Potential Association Pathways and Ecological Implications of SOC Fraction Distribution

Integrating the RDA, random forest, and SEM results identified two major association pathways underlying SOC fraction differentiation in this coastal riparian zone: a vegetation–DOM compositional pathway and an environmental differentiation pathway involving moisture–salinity conditions and nutrient status. The overall SEM showed that vegetation type was mainly associated with litter-derived DOM and soil humic-like DOM, whereas season was mainly associated with soil protein-like DOM components and the labile SOC pool. In addition, the labile SOC pool was significantly and positively correlated with the relatively stable SOC pool (Figure 7a). This pattern suggests that labile and relatively stable SOC pools may vary in a coordinated manner under similar vegetation and seasonal contexts. However, this relationship should not be interpreted as direct evidence for the transformation of labile SOC into relatively stable SOC.
The vegetation–DOM compositional pathway was mainly reflected by the correspondence between litter-derived DOM and soil DOM. In the litter-derived DOM–soil DOM submodel, litter humic-like DOM was significantly and positively associated with soil humic-like DOM, whereas litter DOC/DON was significantly and negatively associated with soil protein-like DOM components (Figure 7b). Together with the RDA results, this indicates that humic-like substances released from litter may represent an important compositional linkage between vegetation inputs and soil humic-like DOM. In contrast, the negative association between litter DOC/DON and soil protein-like DOM components suggests that soluble carbon and nitrogen released from litter may be rapidly utilized, transformed, adsorbed, or transported after entering the soil. Therefore, the influence of litter-derived DOM on soil DOM composition depends not only on the amount of soluble C and N released from litter, but also on DOM quality and subsequent transformation and retention processes [65,66,67].
The environmental differentiation pathway was mainly reflected by the contrasting responses of labile and relatively stable SOC pools to soil moisture, salinity, and nutrient status. In the labile SOC pool model, vegetation type was significantly and positively associated with the labile SOC pool, whereas EC was negatively associated with it (Figure 7c). This suggests that labile SOC fractions may be particularly sensitive to vegetation habitat and salinity-related constraints. In contrast, MC and TP were significantly and positively associated with the relatively stable SOC pool represented by MAOC (Figure 7d), indicating that soil moisture and phosphorus status were more closely linked to relatively stable SOC retention. Soil moisture can influence SOC stabilization by affecting microbial activity, plant-derived carbon transformation, aggregate formation, and organic matter–mineral interactions [64,66]. Phosphorus status may also influence SOC retention through its effects on plant inputs and microbial metabolism [68]. These results highlight that moisture–salinity conditions and nutrient status are not merely background variables, but are closely involved in differentiating labile and relatively stable SOC pools.
RDA, random forest, and SEM provide complementary perspectives on these association pathways. RDA revealed the overall ordination structure and directions of association among variables, random forest identified variables with relatively high explanatory importance, and SEM integrated direct and indirect association pathways within a predefined conceptual framework. Therefore, the fact that NO3-N, NH4+-N, and some DOM components showed relatively high importance in RDA or random forest analyses but did not form significant direct SEM paths does not necessarily indicate that they were unimportant. Rather, their effects may have been expressed through indirect pathways, shared explanatory variance, interactions with other factors, or nonlinear responses. This complementary interpretation helps explain why SOC fraction distribution was not linked to a single dominant factor, but instead reflected the combined effects of vegetation inputs, DOM composition, environmental constraints, and mineral-associated retention.
From an ecological perspective, these findings suggest that vegetation type may influence SOC fraction distribution through distinct carbon input and DOM-related pathways. Herbaceous habitats were more closely linked to higher POC and MAOC levels, whereas woody litter showed greater DOC and DON release potential. Meanwhile, the correspondence between litter-derived humic-like DOM and soil humic-like DOM suggests that DOM quality is important for understanding SOC fraction differentiation. The positive association of MC and TP with MAOC further indicates that moisture and phosphorus status may favor relatively stable SOC retention, while the negative association between EC and the labile SOC pool suggests that salinity-related stress may constrain more labile carbon fractions. Overall, SOC retention and stabilization potential in this coastal riparian zone appear to be closely linked to the combined effects of vegetation-specific carbon inputs, litter-derived DOM characteristics, soil DOM transformation, moisture–salinity conditions, nutrient status, and mineral-associated protection.
Several limitations should be considered when interpreting these findings. First, this study included only spring and autumn sampling periods; the results should be interpreted primarily as evidence of statistical associations and potential linkages rather than direct causal relationships. Second, soil samples were collected only from the 0–10 cm surface layer at a fixed depth rather than from pedogenetic horizons, which limited our ability to evaluate the vertical distribution of SOC fractions and horizon-specific stabilization processes. Accordingly, the findings apply specifically to surface soils and should not be extrapolated to the entire soil profile. In addition, soil bulk density was not measured directly, and SOC stock was estimated from SOC content using empirical equations. The estimated SOC stock should therefore be regarded as Supplementary Information and should not be used to infer long-term carbon sequestration rates. Furthermore, the pathway relationships among DOM, environmental factors, and SOC fractions were derived mainly from observational data and exploratory SEM. Future studies should incorporate multiple soil depths or pedogenetic horizons, microbial community and enzyme activity measurements, mineralogical characterization, direct bulk-density measurements, and isotope tracing to further test the mechanisms underlying DOM transformation and SOC stabilization.

5. Conclusions

This study examined SOC fraction distribution and DOM-related associations in woody and herbaceous habitats of the Duliujian River coastal riparian zone by integrating SOC fractionation, litter-derived DOM characterization, soil DOM fluorescence analysis, and multivariate statistical modeling. SOC fractions varied markedly across seasons and vegetation habitats. MAOC represented a large proportion of the measured SOC-related pools and showed a relatively consistent positive association with SOC content, whereas labile SOC fractions were more sensitive to seasonal variation. Litter-derived DOM showed a clear correspondence with soil DOM, particularly between litter-derived humic-like DOM and soil humic-like DOM. This suggests that, beyond soluble C and N release, the composition of litter-derived DOM was closely associated with soil DOM changes and SOC fraction distribution. Further analyses showed that the labile SOC pool was mainly associated with vegetation type and EC, whereas MAOC was positively associated with MC and TP. Together, these results indicate that vegetation inputs, DOM composition, moisture and salinity conditions, nutrient status, and potential mineral-associated protection were jointly associated with SOC fraction distribution in this region. The results of this study are helpful for understanding SOC retention and stabilization characteristics in coastal riparian zones and can also provide a reference for carbon management under different vegetation habitats.

Supplementary Materials

The following supporting information can be downloaded at: https://www.mdpi.com/article/10.3390/agronomy16151462/s1, Supplementary Method S1: Estimation of soil bulk density and SOC stock; Table S1: Fluorescence characteristic peak ranges and their corresponding compound assignments; Table S2: Description and ecological significance of DOM fluorescence indices; Table S3: Changes in environmental factors based on seasonal variation and vegetation type; Table S4: Estimated soil bulk density and SOC stock under different seasons and vegetation types.

Author Contributions

B.L.: Data curation, Visualization, Writing—original draft, Writing—review and editing; Q.J.: Formal analysis, Methodology, Writing—original draft, Writing—review and editing; M.H.: Investigation, Formal analysis; X.L.: Investigation, Formal analysis; W.Q.: Investigation, Formal analysis; Y.F.: Investigation, Formal analysis; F.L.: Conceptualization, Investigation, Formal analysis, Funding acquisition, Project administration, Writing—original draft, Writing—review and editing; H.W.: Conceptualization, Formal analysis, Investigation, Writing—original draft, Writing—review and editing. All authors have read and agreed to the published version of the manuscript.

Funding

This research was funded by the Research on Emission Standards for Air Pollutants from Coal-Fired Power Plants and Supporting Control Measures, grant number HBHZ2025Y01.

Institutional Review Board Statement

Not applicable.

Informed Consent Statement

Not applicable.

Data Availability Statement

The original contributions presented in this study are included in the article/Supplementary Material. Further inquiries can be directed to the corresponding author.

Conflicts of Interest

The authors declare no conflicts of interest.

References

  1. Lavallee, J.M.; Soong, J.L.; Cotrufo, M.F. Conceptualizing soil organic matter into particulate and mineral-associated forms to address global change in the 21st century. Glob. Change Biol. 2020, 26, 261–273. [Google Scholar] [CrossRef] [PubMed]
  2. Schmidt, M.W.I.; Torn, M.S.; Abiven, S.; Dittmar, T.; Guggenberger, G.; Janssens, I.A.; Kleber, M.; Kögel-Knabner, I.; Lehmann, J.; Manning, D.A.C.; et al. Persistence of soil organic matter as an ecosystem property. Nature 2011, 478, 49–56. [Google Scholar] [CrossRef] [PubMed]
  3. Haynes, R.J. Labile organic matter fractions as central components of the quality of agricultural soils: An overview. Adv. Agron. 2005, 85, 221–268. [Google Scholar] [CrossRef]
  4. Cao, X.; Xu, Y.; Wang, F.; Zhang, Z.; Xu, X. Changes of soil organic carbon and aggregate stability along elevation gradient in Cunninghamia lanceolata plantations. Sci. Rep. 2024, 14, 31778. [Google Scholar] [CrossRef] [PubMed]
  5. Setia, R.; Gottschalk, P.; Smith, P.; Marschner, P.; Baldock, J.; Setia, D.; Smith, J. Soil salinity decreases global soil organic carbon stocks. Sci. Total Environ. 2013, 465, 267–272. [Google Scholar] [CrossRef] [PubMed]
  6. Ling, J.; Dungait, J.A.J.; Delgado-Baquerizo, M.; Cui, Z.; Zhou, R.; Zhang, W.; Gao, Q.; Chen, Y.; Yue, S.; Kuzyakov, Y.; et al. Soil organic carbon thresholds control fertilizer effects on carbon accrual in croplands worldwide. Nat. Commun. 2025, 16, 3009. [Google Scholar] [CrossRef] [PubMed]
  7. Manzoni, S.; Schaeffer, S.M.; Katul, G.; Porporato, A.; Schimel, J.P. A theoretical analysis of microbial eco-physiological and diffusion limitations to carbon cycling in drying soils. Soil Biol. Biochem. 2014, 73, 69–83. [Google Scholar] [CrossRef]
  8. Bolan, N.S.; Adriano, D.C.; Kunhikrishnan, A.; James, T.; McDowell, R.; Senesi, N. Dissolved organic matter: Biogeochemistry, dynamics, and environmental significance in soils. Adv. Agron. 2011, 110, 1–75. [Google Scholar] [CrossRef]
  9. Gmach, M.R.; Cherubin, M.R.; Kaiser, K.; Cerri, C.E.P. Processes that influence dissolved organic matter in the soil: A review. Sci. Agric. 2020, 77, e20180164. [Google Scholar] [CrossRef]
  10. He, F.; Ma, J.; Lai, Q.Y.; Pei, D.Y.; Li, W.X. Association between greenhouse gases and dissolved organic matter composition in the main rivers around Taihu Lake. J. Freshw. Ecol. 2022, 37, 467–479. [Google Scholar] [CrossRef]
  11. Lehmann, J.; Kleber, M. The contentious nature of soil organic matter. Nature 2015, 528, 60–68. [Google Scholar] [CrossRef] [PubMed]
  12. Uselman, S.M.; Qualls, R.G.; Lilienfein, J. Quality of soluble organic C, N, and P produced by different types and species of litter: Root litter versus leaf litter. Soil Biol. Biochem. 2012, 54, 57–67. [Google Scholar] [CrossRef]
  13. Niu, G.; Yin, G.; Wang, J.; Zhang, P.; Xuan, Y.; Mao, Q.; Chen, W.; Lu, X. Changes in plant resource inputs lead to rapid alterations in soil dissolved organic matter composition in an old-growth tropical forest. Geoderma 2024, 450, 117047. [Google Scholar] [CrossRef]
  14. Thieme, L.; Graeber, D.; Hofmann, D.; Bischoff, S.; Schwarz, M.T.; Steffen, B.; Meyer, U.-N.; Kaupenjohann, M.; Wilcke, W.; Michalzik, B.; et al. Dissolved organic matter characteristics of deciduous and coniferous forests with variable management: Different at the source, aligned in the soil. Biogeosciences 2019, 16, 1411–1432. [Google Scholar] [CrossRef]
  15. Min, X.X.; Xiao, L.; Li, Z.B.; Li, P.; Ma, J.Y.; Wang, B.; Du, D.D.; Qiu, W.T. Litter decomposition stage exerted a stronger influence on soil organic carbon fractions than forest litter type. Land Degrad. Dev. 2025, 36, 4643–4657. [Google Scholar] [CrossRef]
  16. Sutfin, N.A.; Wohl, E.E.; Dwire, K.A. Banking carbon: A review of organic carbon storage and physical factors influencing retention in floodplains and riparian ecosystems. Earth Surf. Process. Landf. 2016, 41, 38–60. [Google Scholar] [CrossRef]
  17. Dodds, W.K.; Barmuta, L.A.; Bernal, S.; Corman, J.; Harms, T.K.; Johnson, S.L.; Li, L.; Fernandes Cunha, D.G.; Olden, J.D.; Riis, T.; et al. Defining stream riparian zones across multidimensional environmental gradients. J. Environ. Qual. 2025, 54, 1674–1697. [Google Scholar] [CrossRef] [PubMed]
  18. Dosskey, M.G.; Vidon, P.; Gurwick, N.P.; Allan, C.J.; Duval, T.P.; Lowrance, R. The role of riparian vegetation in protecting and improving chemical water quality in streams. J. Am. Water Resour. Assoc. 2010, 46, 261–277. [Google Scholar] [CrossRef]
  19. Stutter, M.I.; Chardon, W.J.; Kronvang, B. Riparian buffer strips as a multifunctional management tool in agricultural landscapes: Introduction. J. Environ. Qual. 2012, 41, 297–303. [Google Scholar] [CrossRef] [PubMed]
  20. Cole, L.J.; Stockan, J.; Helliwell, R. Managing riparian buffer strips to optimise ecosystem services: A review. Agric. Ecosyst. Environ. 2020, 296, 106891. [Google Scholar] [CrossRef]
  21. Wu, L.; Song, Z.; Wu, Y.; Xia, S.; Kuzyakov, Y.; Hartley, I.P.; Fang, Y.; Yu, C.; Wang, Y.; Chen, J.; et al. Organic matter composition and stability in estuarine wetlands depending on soil salinity. Sci. Total Environ. 2024, 945, 173861. [Google Scholar] [CrossRef] [PubMed]
  22. Shao, P.; Han, H.; Sun, J.; Yang, H.; Xie, H. Salinity effects on microbial-derived C of coastal wetland soils in the Yellow River Delta. Front. Ecol. Evol. 2022, 10, 872816. [Google Scholar] [CrossRef]
  23. Zhang, T.Y.; Zhang, Y.; Jia, Q.; Zhou, S.; Li, T.L.; Li, C.X.; Liu, F.D. Characteristics of spatial distribution of soil organic carbon and its seasonal change of different vegetation buffer zones in Duliujian River. Huan Jing Ke Xue 2024, 45, 6527–6537. (In Chinese) [Google Scholar] [CrossRef] [PubMed]
  24. Liu, J.Y.; Feng, Y.; Zhang, Y.; Liang, N.; Wu, H.L.; Liu, F.D. Allometric releases of nitrogen and phosphorus from sediments mediated by bacteria determines water eutrophication in coastal river basins of Bohai Bay. Ecotoxicol. Environ. Saf. 2022, 235, 113426. [Google Scholar] [CrossRef] [PubMed]
  25. Zhang, N.; Liu, J.Y.; Zhang, T.Y.; Teng, Y.M.; Meng, Z.Y.; Liu, F.D. Sources and composition of sediment dissolved organic matter determine the ecological strategies of bacteria in rivers: Evidence, mechanism, and implications. J. Soils Sediments 2023, 23, 2613–2627. [Google Scholar] [CrossRef]
  26. Xia, Y.F.; Ling, X.F.; Fang, Y.; Xu, Z.; Liu, J.Y.; Liu, F.D. Effects of tide dikes on the distribution and accumulation risk of trace metals in the coastal wetlands of Laizhou Bay, China. Water 2024, 16, 3230. [Google Scholar] [CrossRef]
  27. Cambardella, C.A.; Elliott, E.T. Particulate soil organic-matter changes across a grassland cultivation sequence. Soil Sci. Soc. Am. J. 1992, 56, 777–783. [Google Scholar] [CrossRef]
  28. Cotrufo, M.F.; Ranalli, M.G.; Haddix, M.L.; Six, J.; Lugato, E. Soil carbon storage informed by particulate and mineral-associated organic matter. Nat. Geosci. 2019, 12, 989–994. [Google Scholar] [CrossRef]
  29. Blair, G.J.; Lefroy, R.D.B.; Lisle, L. Soil carbon fractions based on their degree of oxidation, and the development of a carbon management index for agricultural systems. Aust. J. Agric. Res. 1995, 46, 1459–1466. [Google Scholar] [CrossRef]
  30. Liu, J.; Zhang, N.; Miao, X.; Xu, Z.; Zhang, T.; Wei, Y.; Wu, H.; Liu, F. Contrasting soil organic carbon sequestration mechanisms in intertidal and supratidal habitats of coastal wetlands divided by seawalls. J. Clean. Prod. 2025, 526, 146636. [Google Scholar] [CrossRef]
  31. Zhang, R.; Li, M.; Gao, X.; Duan, Y.; Cai, Y.; Li, H.; Zhao, X.; Wang, Y. Changes in the characteristics of soil dissolved organic matter over time since inter-planting with white clover (Trifolium repens L.) in apple orchards on the Loess Plateau in China. Plant Soil 2024, 499, 293–310. [Google Scholar] [CrossRef]
  32. Shi, S.; Chang, D.; Liang, T.; Gao, S.; Zhou, G.; Cao, W.-D. Long-term organic fertilization decreases soil carbon biodegradability by mediating molecular transformation of dissolved organic matter. Resour. Environ. Sustain. 2025, 22, 100261. [Google Scholar] [CrossRef]
  33. Soong, J.L.; Calderón, F.J.; Betzen, J.; Cotrufo, M.F. Quantification and FTIR characterization of dissolved organic carbon and total dissolved nitrogen leached from litter: A comparison of methods across litter types. Plant Soil 2014, 385, 125–137. [Google Scholar] [CrossRef]
  34. Franklin, H.M.; Carroll, A.R.; Chen, C.R.; Maxwell, P.; Burford, M.A. Plant source and soil interact to determine characteristics of dissolved organic matter leached into waterways from riparian leaf litter. Sci. Total Environ. 2020, 703, 134530. [Google Scholar] [CrossRef] [PubMed]
  35. Lawaetz, A.J.; Stedmon, C.A. Fluorescence intensity calibration using the Raman scatter peak of water. Appl. Spectrosc. 2009, 63, 936–940. [Google Scholar] [CrossRef] [PubMed]
  36. Murphy, K.R.; Stedmon, C.A.; Graeber, D.; Bro, R. Fluorescence spectroscopy and multi-way techniques. PARAFAC. Anal. Methods 2013, 5, 6557–6566. [Google Scholar] [CrossRef]
  37. Stedmon, C.A.; Bro, R. Characterizing dissolved organic matter fluorescence with parallel factor analysis: A tutorial. Limnol. Oceanogr. Methods 2008, 6, 572–579. [Google Scholar] [CrossRef]
  38. Murphy, K.R.; Stedmon, C.A.; Wenig, P.; Bro, R. OpenFluor—An online spectral library of auto-fluorescence by organic compounds in the environment. Anal. Methods 2014, 6, 658–661. [Google Scholar] [CrossRef]
  39. McKnight, D.M.; Boyer, E.W.; Westerhoff, P.K.; Doran, P.T.; Kulbe, T.; Andersen, D.T. Spectrofluorometric characterization of dissolved organic matter for indication of precursor organic material and aromaticity. Limnol. Oceanogr. 2001, 46, 38–48. [Google Scholar] [CrossRef]
  40. Ohno, T. Fluorescence inner-filtering correction for determining the humification index of dissolved organic matter. Environ. Sci. Technol. 2002, 36, 742–746. [Google Scholar] [CrossRef] [PubMed]
  41. Huguet, A.; Vacher, L.; Relexans, S.; Saubusse, S.; Froidefond, J.M.; Parlanti, E. Properties of fluorescent dissolved organic matter in the Gironde Estuary. Org. Geochem. 2009, 40, 706–719. [Google Scholar] [CrossRef]
  42. Legendre, P.; Anderson, M.J. Distance-based redundancy analysis: Testing multispecies responses in multifactorial ecological experiments. Ecol. Monogr. 1999, 69, 1–24. [Google Scholar] [CrossRef]
  43. Dormann, C.F.; Elith, J.; Bacher, S.; Buchmann, C.; Carl, G.; Carré, G.; García Márquez, J.R.; Gruber, B.; Lafourcade, B.; Leitão, P.J.; et al. Collinearity: A review of methods to deal with it and a simulation study evaluating their performance. Ecography 2013, 36, 27–46. [Google Scholar] [CrossRef]
  44. Wu, Y.Y.; Zhou, S.B.; Li, Y.; Niu, L.H.; Wang, L.Q. Climate and local environment co-mediate the taxonomic and functional diversity of bacteria and archaea in the Qinghai-Tibet Plateau rivers. Sci. Total Environ. 2024, 912, 168968. [Google Scholar] [CrossRef] [PubMed]
  45. Hu, L.T.; Bentler, P.M. Cutoff criteria for fit indexes in covariance structure analysis: Conventional criteria versus new alternatives. Struct. Equ. Model. 1999, 6, 1–55. [Google Scholar] [CrossRef]
  46. Hooper, D.; Coughlan, J.; Mullen, M.R. Structural equation modelling: Guidelines for determining model fit. Electron. J. Bus. Res. Methods 2008, 6, 53–60. [Google Scholar] [CrossRef]
  47. Stedmon, C.A.; Markager, S.; Bro, R. Tracing dissolved organic matter in aquatic environments using a new approach to fluorescence spectroscopy. Mar. Chem. 2003, 82, 239–254. [Google Scholar] [CrossRef]
  48. Coble, P.G. Characterization of marine and terrestrial DOM in seawater using excitation-emission matrix spectroscopy. Mar. Chem. 1996, 51, 325–346. [Google Scholar] [CrossRef]
  49. Zhang, D.P.; Meng, F.S.; Wang, Y.Y.; Zhang, L.S.; Xue, H.; Liang, Z.M.; Zhang, J.S. Seasonal and spatial variations in the optical characteristics of dissolved organic matter in the Huma River Basin, China. Water 2023, 15, 1579. [Google Scholar] [CrossRef]
  50. Moona, N.; Holmes, A.; Wünsch, U.J.; Pettersson, T.J.R.; Murphy, K.R. Full-scale manipulation of the empty bed contact time to optimize dissolved organic matter removal by drinking water biofilters. ACS EST Water 2021, 1, 1117–1126. [Google Scholar] [CrossRef]
  51. Jackson, R.B.; Lajtha, K.; Crow, S.E.; Hugelius, G.; Kramer, M.G.; Piñeiro, G. The ecology of soil carbon: Pools, vulnerabilities, and biotic and abiotic controls. Annu. Rev. Ecol. Evol. Syst. 2017, 48, 419–445. [Google Scholar] [CrossRef]
  52. Wiesmeier, M.; Urbanski, L.; Hobley, E.; Lang, B.; von Lützow, M.; Marin-Spiotta, E.; van Wesemael, B.; Rabot, E.; Ließ, M.; Garcia-Franco, N.; et al. Soil organic carbon storage as a key function of soils—A review of drivers and indicators at various scales. Geoderma 2019, 333, 149–162. [Google Scholar] [CrossRef]
  53. Sokol, N.W.; Kuebbing, S.E.; Karlsen-Ayala, E.; Bradford, M.A. Evidence for the primacy of living root inputs, not root or shoot litter, in forming soil organic carbon. New Phytol. 2019, 221, 233–246. [Google Scholar] [CrossRef] [PubMed]
  54. Zhang, Y.; Tang, Z.; You, Y.; Guo, X.; Wu, C.; Liu, S.; Sun, O.J. Differential effects of forest-floor litter and roots on soil organic carbon formation in a temperate oak forest. Soil Biol. Biochem. 2023, 180, 109017. [Google Scholar] [CrossRef]
  55. Mao, H.R.; Cotrufo, M.F.; Hart, S.C.; Sullivan, B.W.; Zhu, X.; Zhang, J.; Liang, C.; Zhu, M. Dual role of silt and clay in the formation and accrual of stabilized soil organic carbon. Soil Biol. Biochem. 2024, 192, 109390. [Google Scholar] [CrossRef]
  56. Cotrufo, M.F.; Wallenstein, M.D.; Boot, C.M.; Denef, K.; Paul, E. The Microbial Efficiency-Matrix Stabilization (MEMS) framework integrates plant litter decomposition with soil organic matter stabilization: Do labile plant inputs form stable soil organic matter? Glob. Change Biol. 2013, 19, 988–995. [Google Scholar] [CrossRef] [PubMed]
  57. Kleber, M.; Sollins, P.; Sutton, R. A conceptual model of organo-mineral interactions in soils: Self-assembly of organic molecular fragments into zonal structures on mineral surfaces. Biogeochemistry 2007, 85, 9–24. [Google Scholar] [CrossRef]
  58. Yu, W.; Huang, W.; Weintraub-Leff, S.R.; Hall, S.J. Where and why do particulate organic matter (POM) and mineral-associated organic matter (MAOM) differ among diverse soils? Soil Biol. Biochem. 2022, 172, 108756. [Google Scholar] [CrossRef]
  59. Rath, K.M.; Rousk, J. Salt effects on the soil microbial decomposer community and their role in organic carbon cycling: A review. Soil Biol. Biochem. 2015, 81, 108–123. [Google Scholar] [CrossRef]
  60. Wang, C.; Kuzyakov, Y. Soil organic matter priming: The pH effects. Glob. Change Biol. 2024, 30, e17349. [Google Scholar] [CrossRef] [PubMed]
  61. Possinger, A.R.; Bailey, S.W.; Inagaki, T.M.; Kögel-Knabner, I.; Dynes, J.J.; Arthur, Z.A.; Lehmann, J. Organo-mineral interactions and soil carbon mineralizability with variable saturation cycle frequency. Geoderma 2020, 375, 114483. [Google Scholar] [CrossRef]
  62. Kang, M.; Zhao, C.; Ma, M.; Li, X. Characteristics of soil organic carbon fractions in four vegetation communities of an inland salt marsh. Carbon Balance Manag. 2024, 19, 3. [Google Scholar] [CrossRef] [PubMed]
  63. Wang, L.; Luo, N.; Shi, Q.; Sheng, M. Responses of soil labile organic carbon fractions and enzyme activities to long-term vegetation restorations in the karst ecosystems, Southwest China. Ecol. Eng. 2023, 194, 107034. [Google Scholar] [CrossRef]
  64. Sokol, N.W.; Foley, M.M.; Blazewicz, S.J.; Bhattacharyya, A.; DiDonato, N.; Estera-Molina, K.; Firestone, M.; Greenlon, A.; Hungate, B.A.; Kimbrel, J.; et al. The path from root input to mineral-associated soil carbon is dictated by habitat-specific microbial traits and soil moisture. Soil Biol. Biochem. 2024, 193, 109367. [Google Scholar] [CrossRef]
  65. Cotrufo, M.F.; Haddix, M.L.; Kroeger, M.E.; Stewart, C.E. The role of plant input physical-chemical properties, and microbial and soil chemical diversity on the formation of particulate and mineral-associated organic matter. Soil Biol. Biochem. 2022, 168, 108648. [Google Scholar] [CrossRef]
  66. Kleber, M.; Bourg, I.C.; Coward, E.K.; Hansel, C.M.; Myneni, S.C.B.; Nunan, N. Dynamic interactions at the mineral–organic matter interface. Nat. Rev. Earth Environ. 2021, 2, 402–421. [Google Scholar] [CrossRef]
  67. Fellman, J.B.; Hood, E.; Spencer, R.G.M. Fluorescence spectroscopy opens new windows into dissolved organic matter dynamics in freshwater ecosystems: A review. Limnol. Oceanogr. 2010, 55, 2452–2462. [Google Scholar] [CrossRef]
  68. Luo, R.; Kuzyakov, Y.; Zhu, B.; Qiang, W.; Zhang, Y.; Pang, X. Phosphorus addition decreases plant lignin but increases microbial necromass contribution to soil organic carbon in a subalpine forest. Glob. Change Biol. 2022, 28, 4194–4210. [Google Scholar] [CrossRef] [PubMed]
Figure 1. Variations in SOC and its fractions among different groups. Lowercase letters indicate differences between vegetation types within the same season, whereas uppercase letters indicate seasonal differences within the same vegetation type.
Agronomy 16 01462 g001
Figure 2. Relative composition of SOC fractions across seasons and vegetation types and their linear relationships with SOC content. (a) Relative proportions of MAOC, POC, DOC, and EOC in the total of the four measured carbon pools; (b) linear relationship between the labile SOC pool (DOC + EOC + POC) and SOC content; and (c) linear relationship between the relatively stable SOC pool, represented by MAOC, and SOC content. Solid lines indicate fitted linear regressions, and shaded areas represent 95% confidence intervals.
Agronomy 16 01462 g002
Figure 3. Variations in soil DOM fluorescent components and fluorescence indices across different habitats. (a) Four DOM fluorescent components identified by PARAFAC. The color gradient in the spectra represents fluorescence intensity, with values increasing gradually from blue (low intensity) to yellow (high intensity). (b) Relative fluorescence intensities of different DOM components across groups. (c) Changes in fluorescence indices across different groups. Bar colors indicate plant type. Red and blue denote woody and herbaceous plants, respectively. Lowercase letters indicate group differences for the same indicator among different plant types. Uppercase letters indicate statistical differences for the same indicator across different seasons. Same letters indicate no significant difference (p > 0.05), while different letters indicate a statistically significant difference (p < 0.05).
Agronomy 16 01462 g003
Figure 4. Spatiotemporal distribution characteristics of DOM parameters in litter from different vegetation types. (a) Distribution characteristics of fluorescence intensity for seven characteristic fluorescence peaks identified from EEM spectra. (b,c) Seasonal variation in DOC and DON in litter from different plants. In figure, red and blue denote woody and herbaceous plants, respectively. Lowercase letters indicate group differences for the same indicator among different plant types. Uppercase letters indicate statistical differences for the same indicator across different seasons. Same letters indicate no significant difference (p > 0.05), while different letters indicate a statistically significant difference (p < 0.05).
Agronomy 16 01462 g004
Figure 5. Associations between litter-derived DOM and soil DOM. (a) Linear relationships between litter-derived DOM and soil DOM across seasons. (b) Redundancy analysis of litter-derived DOM components and soil DOM spectral parameters. Red arrows represent litter-derived DOM parameters as explanatory variables, whereas blue arrows represent soil DOM spectral parameters as response variables.
Agronomy 16 01462 g005
Figure 6. Redundancy analysis showing associations between soil physicochemical properties and SOC fractions (a), and between soil physicochemical properties and DOM-related parameters (b). The blue and red lines represent the affected factors and the influencing factor, respectively. Importance rankings of soil physicochemical properties (c) and soil DOM-related parameters (d) in explaining variation in SOC-related variables. *, p < 0.05; **, p < 0.01.
Agronomy 16 01462 g006
Figure 7. Structural equation models showing associations among vegetation type, season, litter-derived DOM, soil DOM, environmental factors, and SOC fractions. (a) Overall SEM association pathway model; (b) litter-derived DOM–soil DOM association pathway model; (c) labile SOC pool association pathway model; and (d) relatively stable SOC pool association pathway model. *, p < 0.05; **, p < 0.01; ***, p < 0.001.
Agronomy 16 01462 g007
Disclaimer/Publisher’s Note: The statements, opinions and data contained in all publications are solely those of the individual author(s) and contributor(s) and not of MDPI and/or the editor(s). MDPI and/or the editor(s) disclaim responsibility for any injury to people or property resulting from any ideas, methods, instructions or products referred to in the content.