1. Introduction
In the steppe zone of Northern Kazakhstan, soil moisture deficit is a primary limiting factor for crop yield and represents a major agronomic constraint. Recent agroclimatic studies demonstrate pronounced spatial heterogeneity in heat and moisture availability, with aridization intensifying along a north-south gradient [
1,
2,
3]. Consequently, growing-season moisture availability serves as a key criterion for agroclimatic zoning and assessing the sustainability of rainfed agriculture in this region.
Under conditions of increasing climate variability, technologies that regulate the local soil water regime are becoming essential as they increase available moisture in the root zone without substantially raising irrigation requirements. One promising approach is the application of superabsorbent polymers (SAPs), which absorb large quantities of water, retain it within the polymer network structure, and release it gradually as the surrounding water potential declines [
4,
5,
6,
7]. A global meta-analysis of over 1500 observations reported that SAP application increases crop yields by 12.8% and water use efficiency by 17.2% on average, demonstrating their potential under water-scarce conditions [
7]. However, the effectiveness of SAPs depends on multiple factors, including soil texture, polymer chemistry, application method, and particle morphology [
8].
At the hydrophysical level, SAPs increase the water-holding capacity of the soil-polymer system by creating additional water reservoirs within the pore space. Consequently, SAP application improves the soil water retention curve, decreases evaporation rates, and increases soil resistance to drying [
5,
8,
9]. Increasing the SAP dosage enhances moisture retention, but this relationship is nonlinear. Beyond a specific threshold, the water retention effect stabilizes [
7]. Furthermore, particle morphology significantly influences water retention dynamics. Fine particles possess a larger specific surface area and facilitate rapid swelling, whereas larger spherical granules function as localized water reservoirs, providing prolonged moisture release [
8]. Although these hydrophysical mechanisms are well-documented, their interactive effects in specific regional soils remain poorly understood.
In addition to synthetic polymers, recent studies have increasingly investigated the application of mineral porous materials such as agroperlite. Owing to its porous structure, perlite retains significant volumes of water, and its combination with SAPs forms composite systems with enhanced water-retention properties [
10]. However, most existing studies have examined SAPs and perlite separately or in limited soil types, and their combined effects on water retention remain poorly understood, particularly in the chernozem and dark chestnut soils of Northern Kazakhstan. Furthermore, the literature emphasizes the need to optimize application rates to achieve maximum agronomic effectiveness while minimizing excessive polymer accumulation [
11,
12]. Moreover, the influence of SAP particle morphology (e.g., powder, beads, granules) on water retention has received less attention than dosage effects, despite its potential to affect swelling kinetics and spatial distribution in the soil matrix.
For Ordinary Chernozem and dark chestnut soils in Northern Kazakhstan, systematic comparisons of SAP, agroperlite, and their composite are limited, and dose- and particle-form responses have not been tested within a unified gravimetric framework. The objective of this study was to quantify short-term evaporation loss from open-top laboratory vessels amended with SAP-P, agroperlite, and SAP-P + agroperlite across two soil types and three local texture classes, and to evaluate SAP dose and particle-form effects over standardized observation periods. Three hypotheses were tested: H1, amendment treatment affects cumulative and mean daily water loss across soil-texture blocks; H2, SAP dose affects 12-day water loss within each SAP form; and H3, SAP particle form affects 12-day water loss in light- and heavy-loam soils. These hypotheses were evaluated using omnibus ANOVA, Fisher’s LSD only after a significant omnibus test, and nonparametric sensitivity analyses.
2. Materials and Methods
2.1. Soil Materials and Open-Top Laboratory Setup
The soils originated from the steppe zone of Northern Kazakhstan, which extends approximately from 48° to 55° N and from 60° to 79° E. The region has a strongly continental climate. Annual precipitation generally declines from about 320–340 mm in the north to 250–300 mm in the central zone and approximately 200 mm in the south; May–August precipitation ranges from about 160–170 mm in the north to 60–80 mm in the south [
1]. This pronounced moisture gradient makes evaporation control and short-term soil–water conservation agronomically important.
Two regionally widespread soils were studied: dark chestnut soil (Haplic Kastanozem) and Ordinary Chernozem (Haplic Chernozem). Each soil was represented by the local Kachinsky textural classes light loam, medium loam, and heavy loam. Particle-size classification was performed by the Kachinsky sedimentation (pipette) method [
13]. The local class names are retained throughout the manuscript and are not treated as direct equivalents of USDA textural classes.
Soils were air-dried, cleared of visible plant residues and coarse inclusions, and passed through a 2 mm sieve. A 100 g dry-soil portion was used per container. Each treatment was originally established in five containers. The containers had impermeable bottoms and no drainage holes, but their tops remained open throughout drying. Thus, the response variable was gravimetric water loss from an open-top, no-drainage laboratory system. It should not be interpreted as direct measurement of field capacity, capillary water retention, or plant-available water.
An equal nominal quantity of water was added within each experiment. Because the soils differed in texture and pore structure, treatment comparisons were made within soil-texture blocks, and absolute losses among texture classes were not interpreted as direct measurements of intrinsic field water retention.
Humus content was determined by the Tyurin method in the Simakov modification [
14], soil reaction by the potentiometric method [
15], and bulk density by the core method [
16]. Field capacity and wilting point were not used as response variables; the analysis was based on gravimetric water-balance measurements (
Table 1).
2.2. Water-Retaining Materials and Nomenclature
The synthetic amendment was a cross-linked potassium polyacrylate superabsorbent polymer (SAP) was obtained from Henan Materials Co., Ltd. (Zhengzhou, China). Three size-defined forms were used consistently throughout the study: SAP-P, powder (100 mesh; approximately 0.15 mm); SAP-B, spherical beads (2.0–2.5 mm); and SAP-G, coarse granules (5–10 mesh; approximately 2.0–4.0 mm). Agroperlite was used as a porous mineral amendment supplied by Henan Materials Co., Ltd.
Agroperlite consisted of irregular, porous expanded-mineral particles and was applied as received. The untreated control is described as an experimental treatment in
Section 2.3 rather than as a material in
Table 2.
2.3. Experimental Design and Standardized Observation Windows
The three experiments were conducted as independent laboratory runs with separate hydration and drying periods. Consequently, their untreated controls represent experiment-specific baselines and were analyzed only within the corresponding experimental design.
Experiment 1 compared four treatments within each of six soil-type × texture blocks: untreated control; SAP-P at 0.20% of dry-soil mass; agroperlite at 5.0%; and SAP-P + agroperlite at the same component rates. Amendments were thoroughly mixed with soil. Samples were wetted using the common within-experiment procedure and allowed to hydrate for 12–24 h. A common endpoint of 7 elapsed days (eight weighing dates) was used for every block, and all endpoint losses were recalculated from the daily weighing series.
Experiment 2 evaluated 0, 0.05, 0.10, 0.20, and 0.30 g SAP per 100 g dry soil for SAP-P, SAP-B, and SAP-G. The analysis covered 10–22 February 2026, corresponding to 12 elapsed days. A quadratic optimum was not imposed because the observed responses did not show the monotonic decrease followed by a biologically interpretable plateau required for such inference.
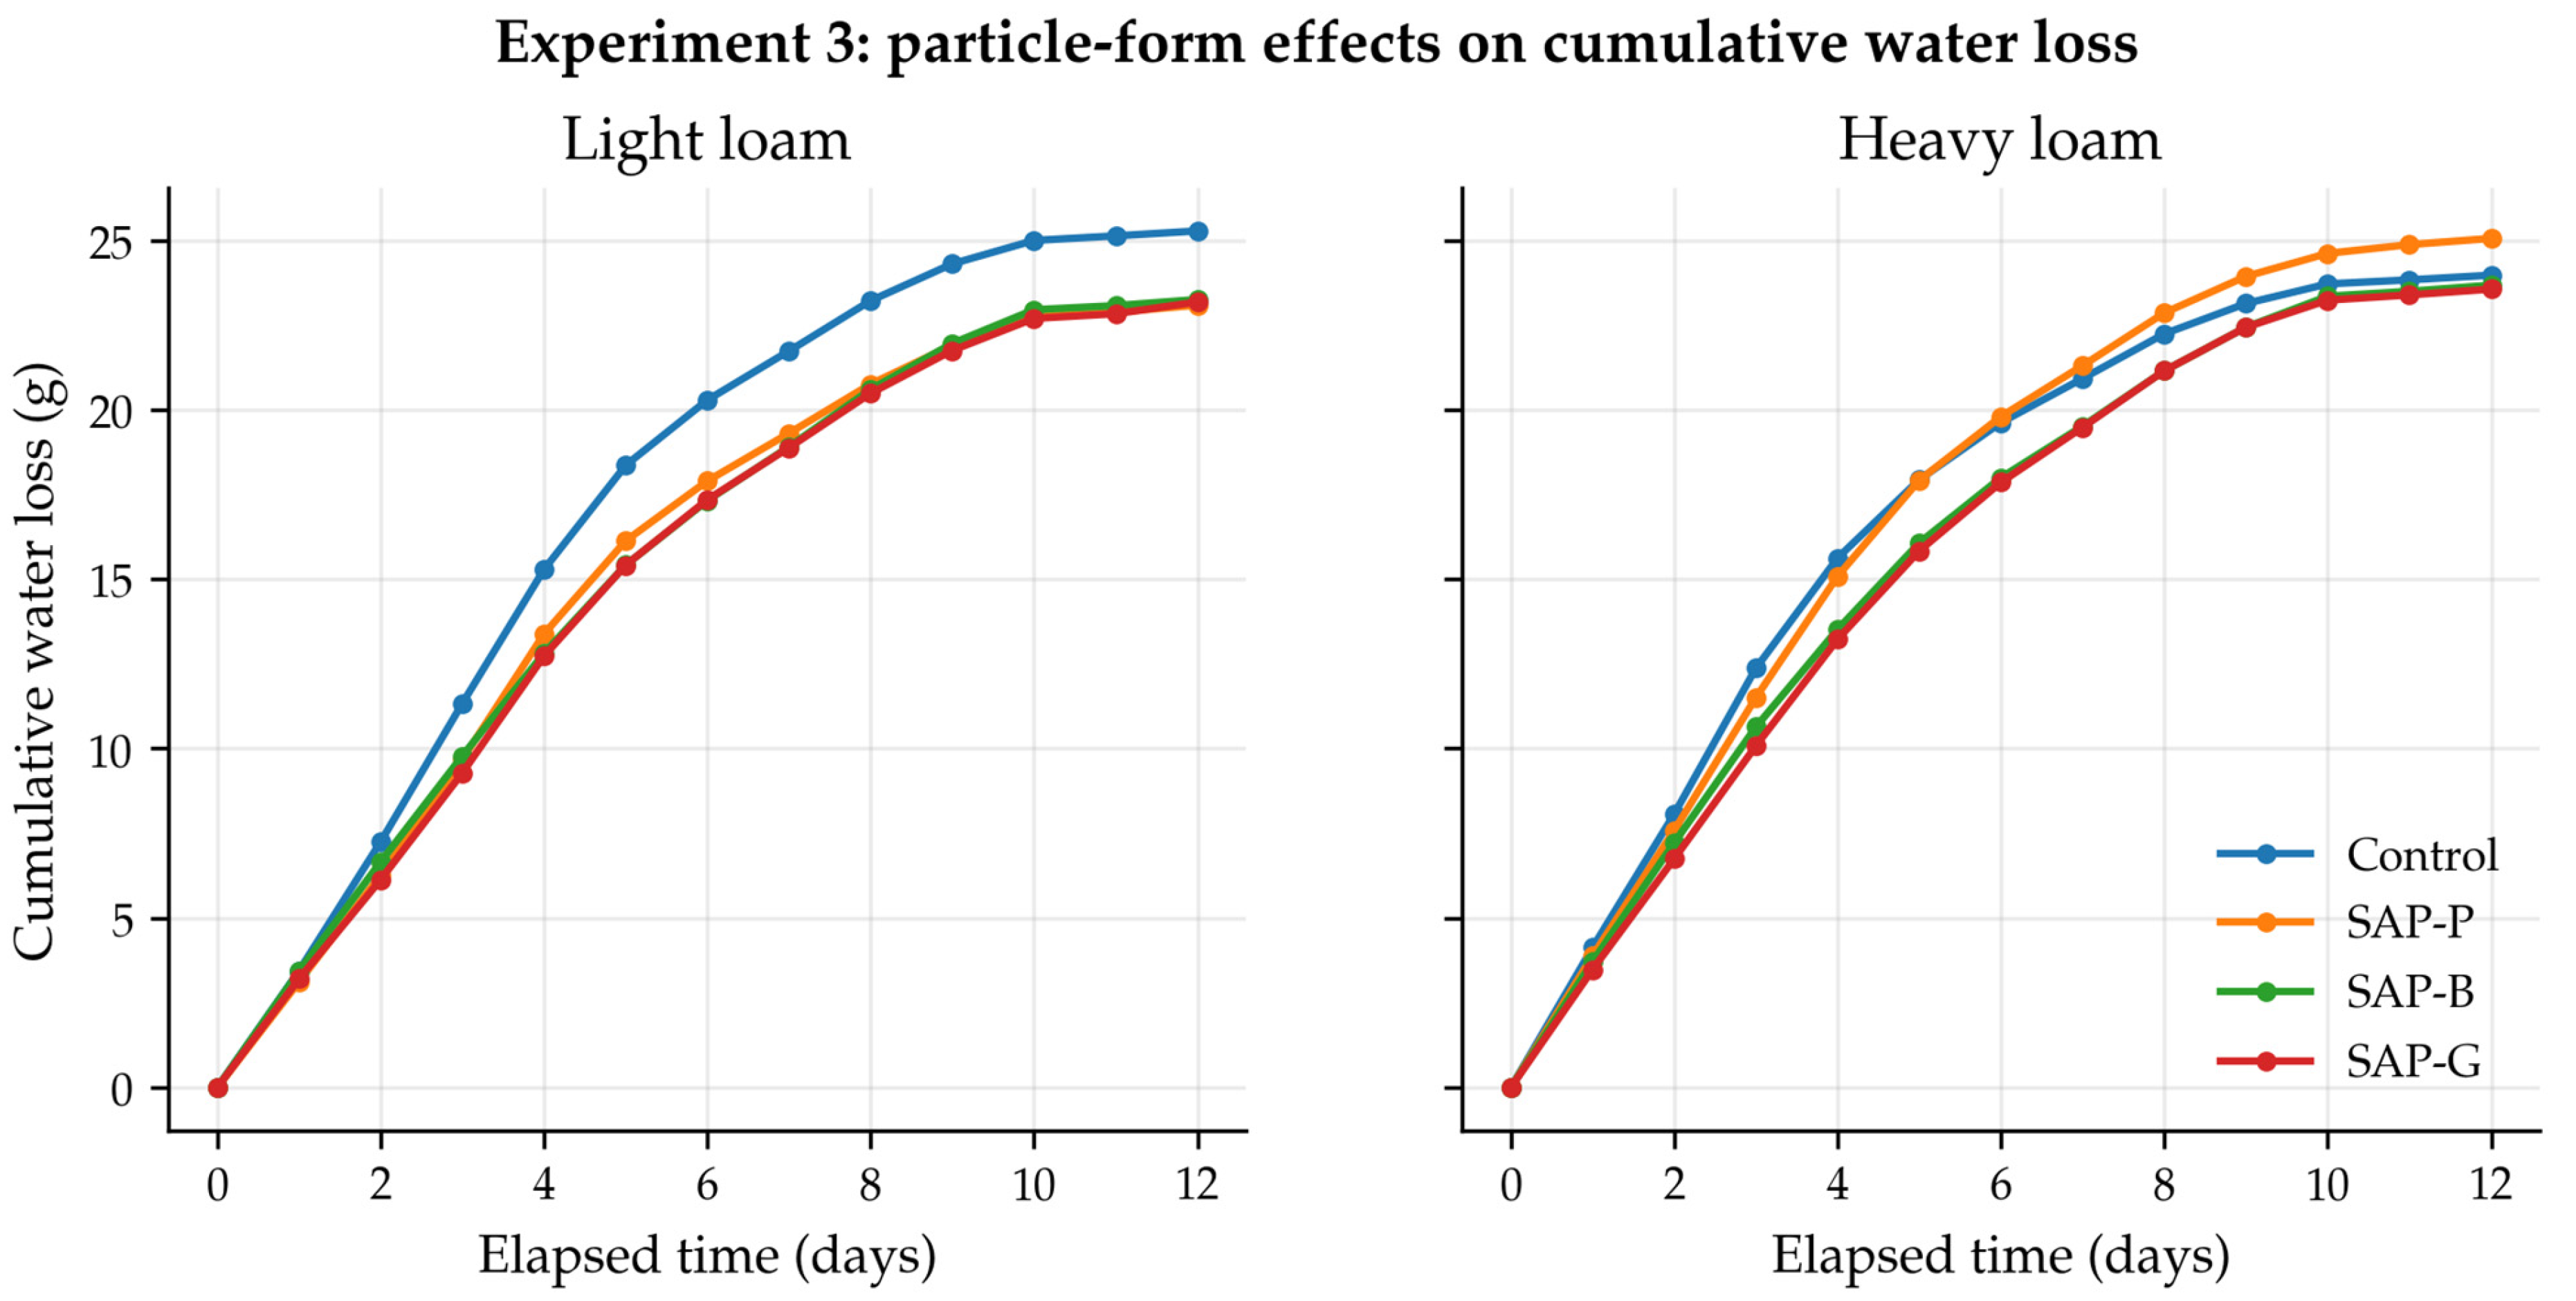
Experiment 3 compared the untreated control with SAP-P, SAP-B, and SAP-G in light- and heavy-loam dark chestnut soil over 16–28 February 2026 (12 elapsed days).
2.4. Weighing-Lysimetry Water-Balance Calculations
The open-top vessels were treated as small laboratory weighing lysimeters. Because the vessels had impermeable bottoms, no drainage, and no plants, the decrease in system mass over each observation interval was attributed to water loss by evaporation.
Cumulative water loss at time t was calculated as Lt = M0 − Mt, where M0 is system mass after hydration and Mt is system mass at time t.
Interval water-loss rate was vi = (Mi − 1 − Mi)/(ti − ti − 1), where i denotes the observation interval, Mi is the system mass at the end of interval i, and ti is the corresponding elapsed time and mean daily water loss was Lt/T, where T is elapsed time in days.
Control-relative change was calculated as 100 × (Ltreatment − Lcontrol)/Lcontrol. Negative values indicate lower evaporation loss than the corresponding control, whereas positive values indicate greater evaporation loss.
2.5. Statistical Analysis
Daily gravimetric observations were converted to interval water-loss rates and organized by treatment and elapsed-time block. Experiment 1 used the six soil-type × texture combinations as blocks. Experiments 2 and 3 used 12 daily equivalent intervals to assess the consistency of treatment trajectories. In the SAP-B and SAP-G series of Experiment 2, one weighing interval spanned two elapsed days (13–15 February); the observed mass difference was divided by two and the resulting average daily rate was assigned to each of the two elapsed-day blocks. This alignment affected only the temporal analysis and not the observed 12-day endpoint loss. Block standard errors (SE) in Experiment 1 were calculated across the six soil-texture blocks. Temporal SEs in Experiments 2 and 3 describe day-to-day variation among the 12 daily equivalent interval rates.
Experiment 1 was analyzed as a randomized complete block design with treatment as a fixed effect and the six soil-type × texture combinations as blocks. Experiments 2 and 3 were evaluated as repeated-block series with elapsed day as the blocking factor. Fisher’s least significant difference (LSD) was applied at α = 0.05 only after a significant omnibus ANOVA. For Experiment 1, Duncan’s multiple range test was calculated only as a secondary robustness check to determine whether an alternative mean-separation procedure produced the same grouping; because it agreed fully with Fisher’s LSD, only Fisher LSD letters are presented. No mean-separation test was performed or reported when the primary omnibus ANOVA was non-significant.
Friedman tests were used as nonparametric sensitivity analyses. ANOVA was treated as the primary inferential analysis. When ANOVA and Friedman tests produced inconsistent outcomes, no treatment-specific post hoc inference was made. Analyses were performed in Python 3.13.5 using SciPy 1.17.0 and statsmodels 0.14.6.
3. Results
3.1. Experiment 1: Sap-P, Agroperlite, and Composite Treatments
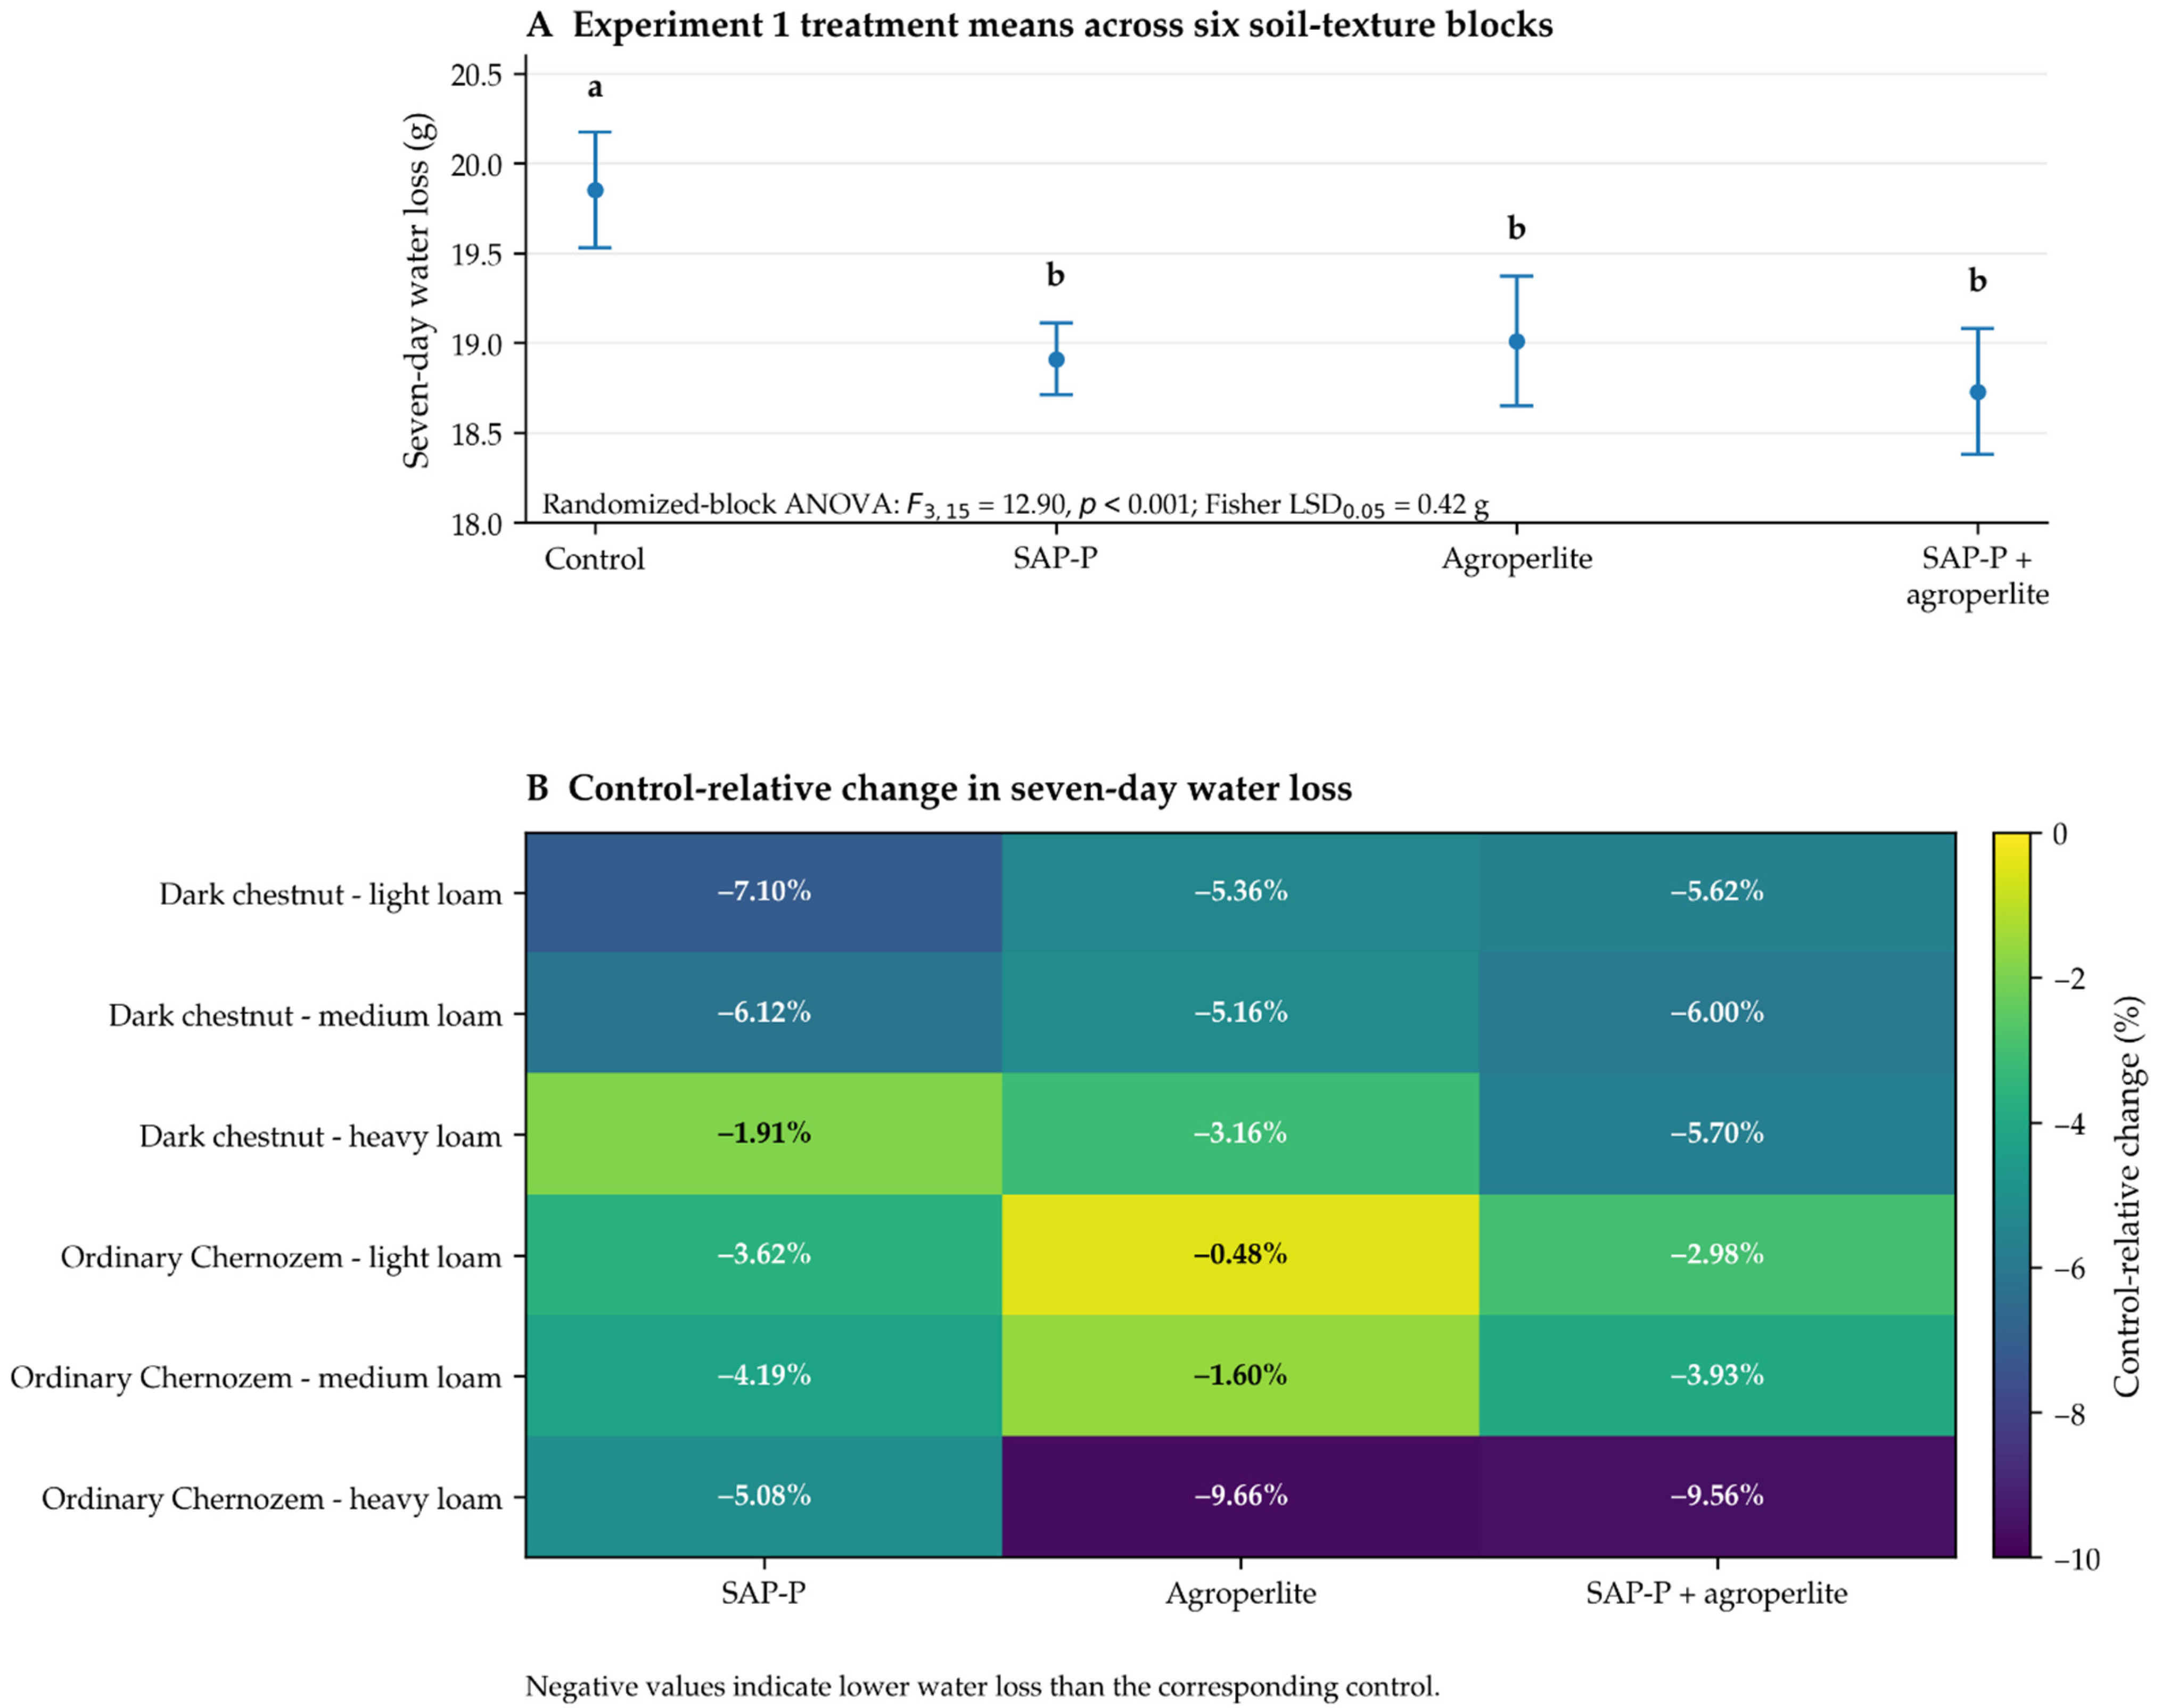
All three amendments descriptively reduced 7-day endpoint water loss relative to the control in each soil-texture block (
Table 3). The lowest endpoint was associated with SAP-P in the light- and medium-loam blocks, whereas agroperlite or the composite had the lowest endpoint in the heavy-loam blocks. These within-block rankings are descriptive and should not be read as separate significance tests for each soil.
The treatment effect was significant in the randomized-block ANOVA (F
3,15 = 12.90,
p = 0.00020). Fisher’s LSD
0.05 was 0.42 g and separated the untreated control from the three amended treatments, while SAP-P, agroperlite, and the composite did not differ from one another (
Table 4). Duncan’s test was used only as a robustness check and produced the same grouping. The Friedman sensitivity test was also significant (
= 12.20,
p = 0.0067; Kendall’s W = 0.678).
Treatment means and texture-specific control-relative changes are summarized in
Figure 1. The most negative changes occurred in heavy-loam Ordinary Chernozem under agroperlite (−9.66%) and SAP-P + agroperlite (−9.56%), whereas the smallest absolute change occurred for agroperlite in light-loam Ordinary Chernozem (−0.48%).
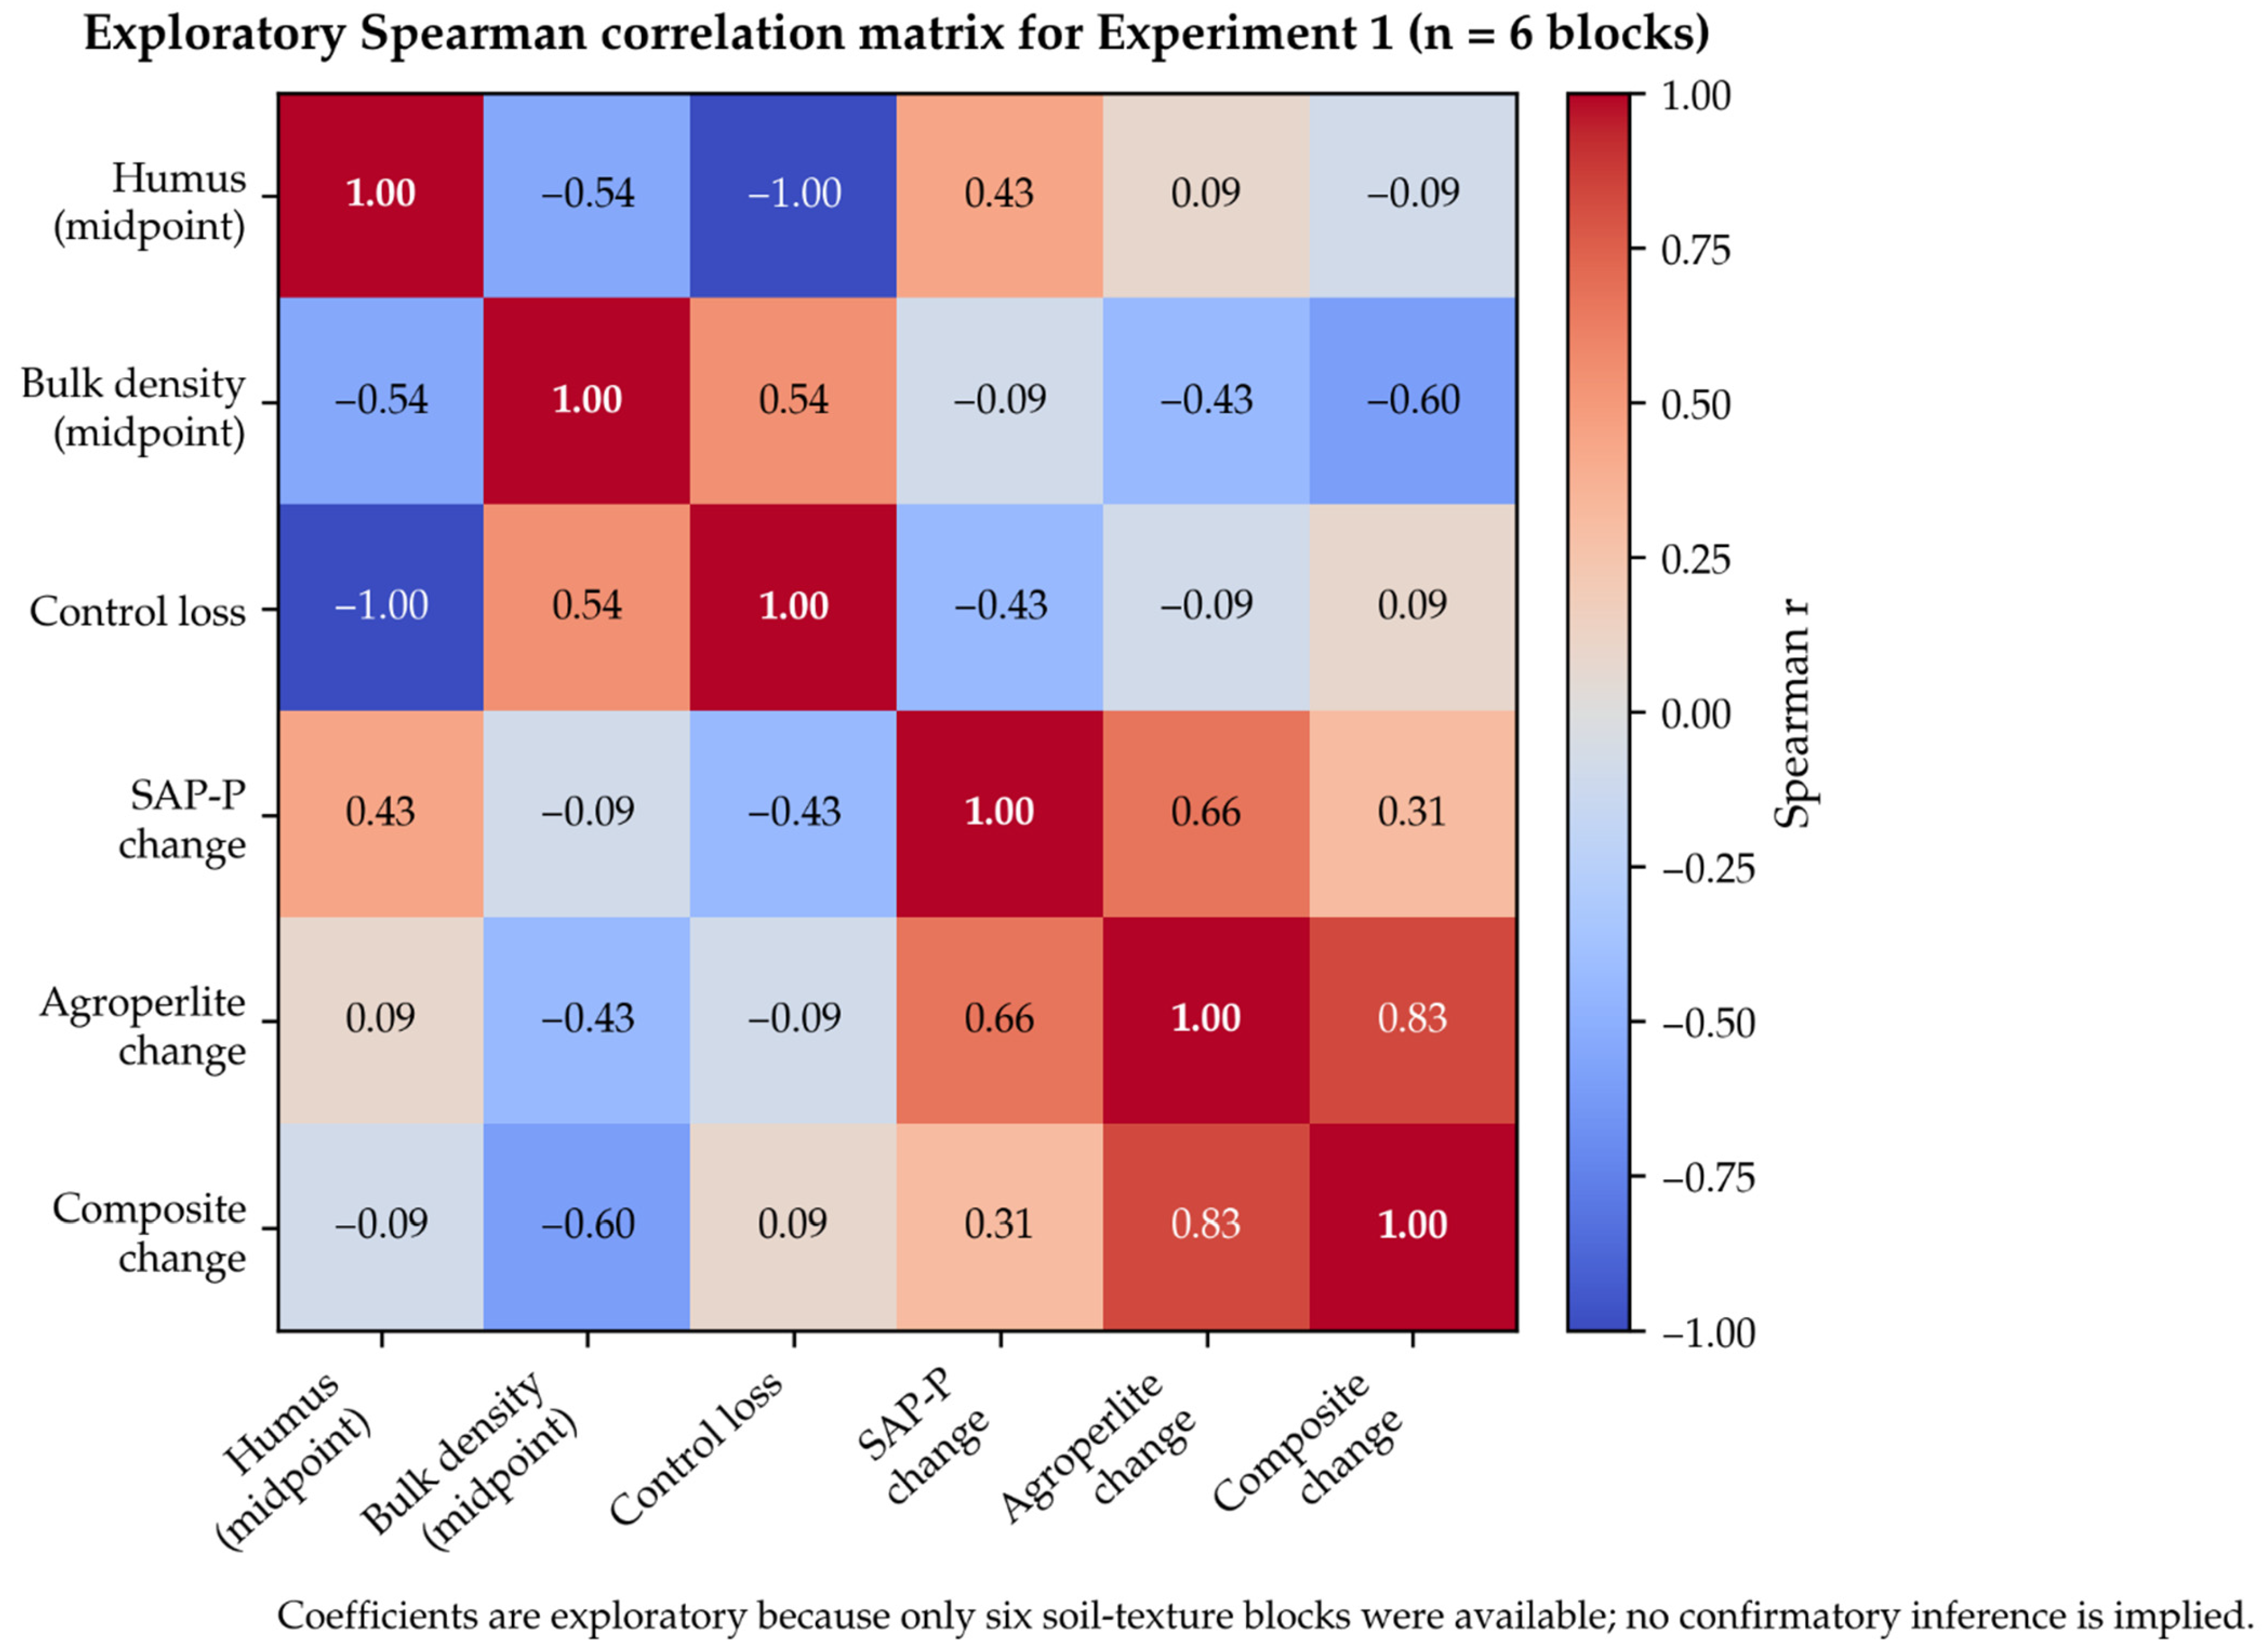
The Spearman matrix was examined only as an exploratory description (
Figure 2). The control-relative changes under agroperlite and the composite had r
s = 0.83 (nominal
p = 0.042), but the analysis was based on only six soil-texture blocks. Accordingly, no coefficient was used as confirmatory evidence or to support causal or treatment-specific conclusions.
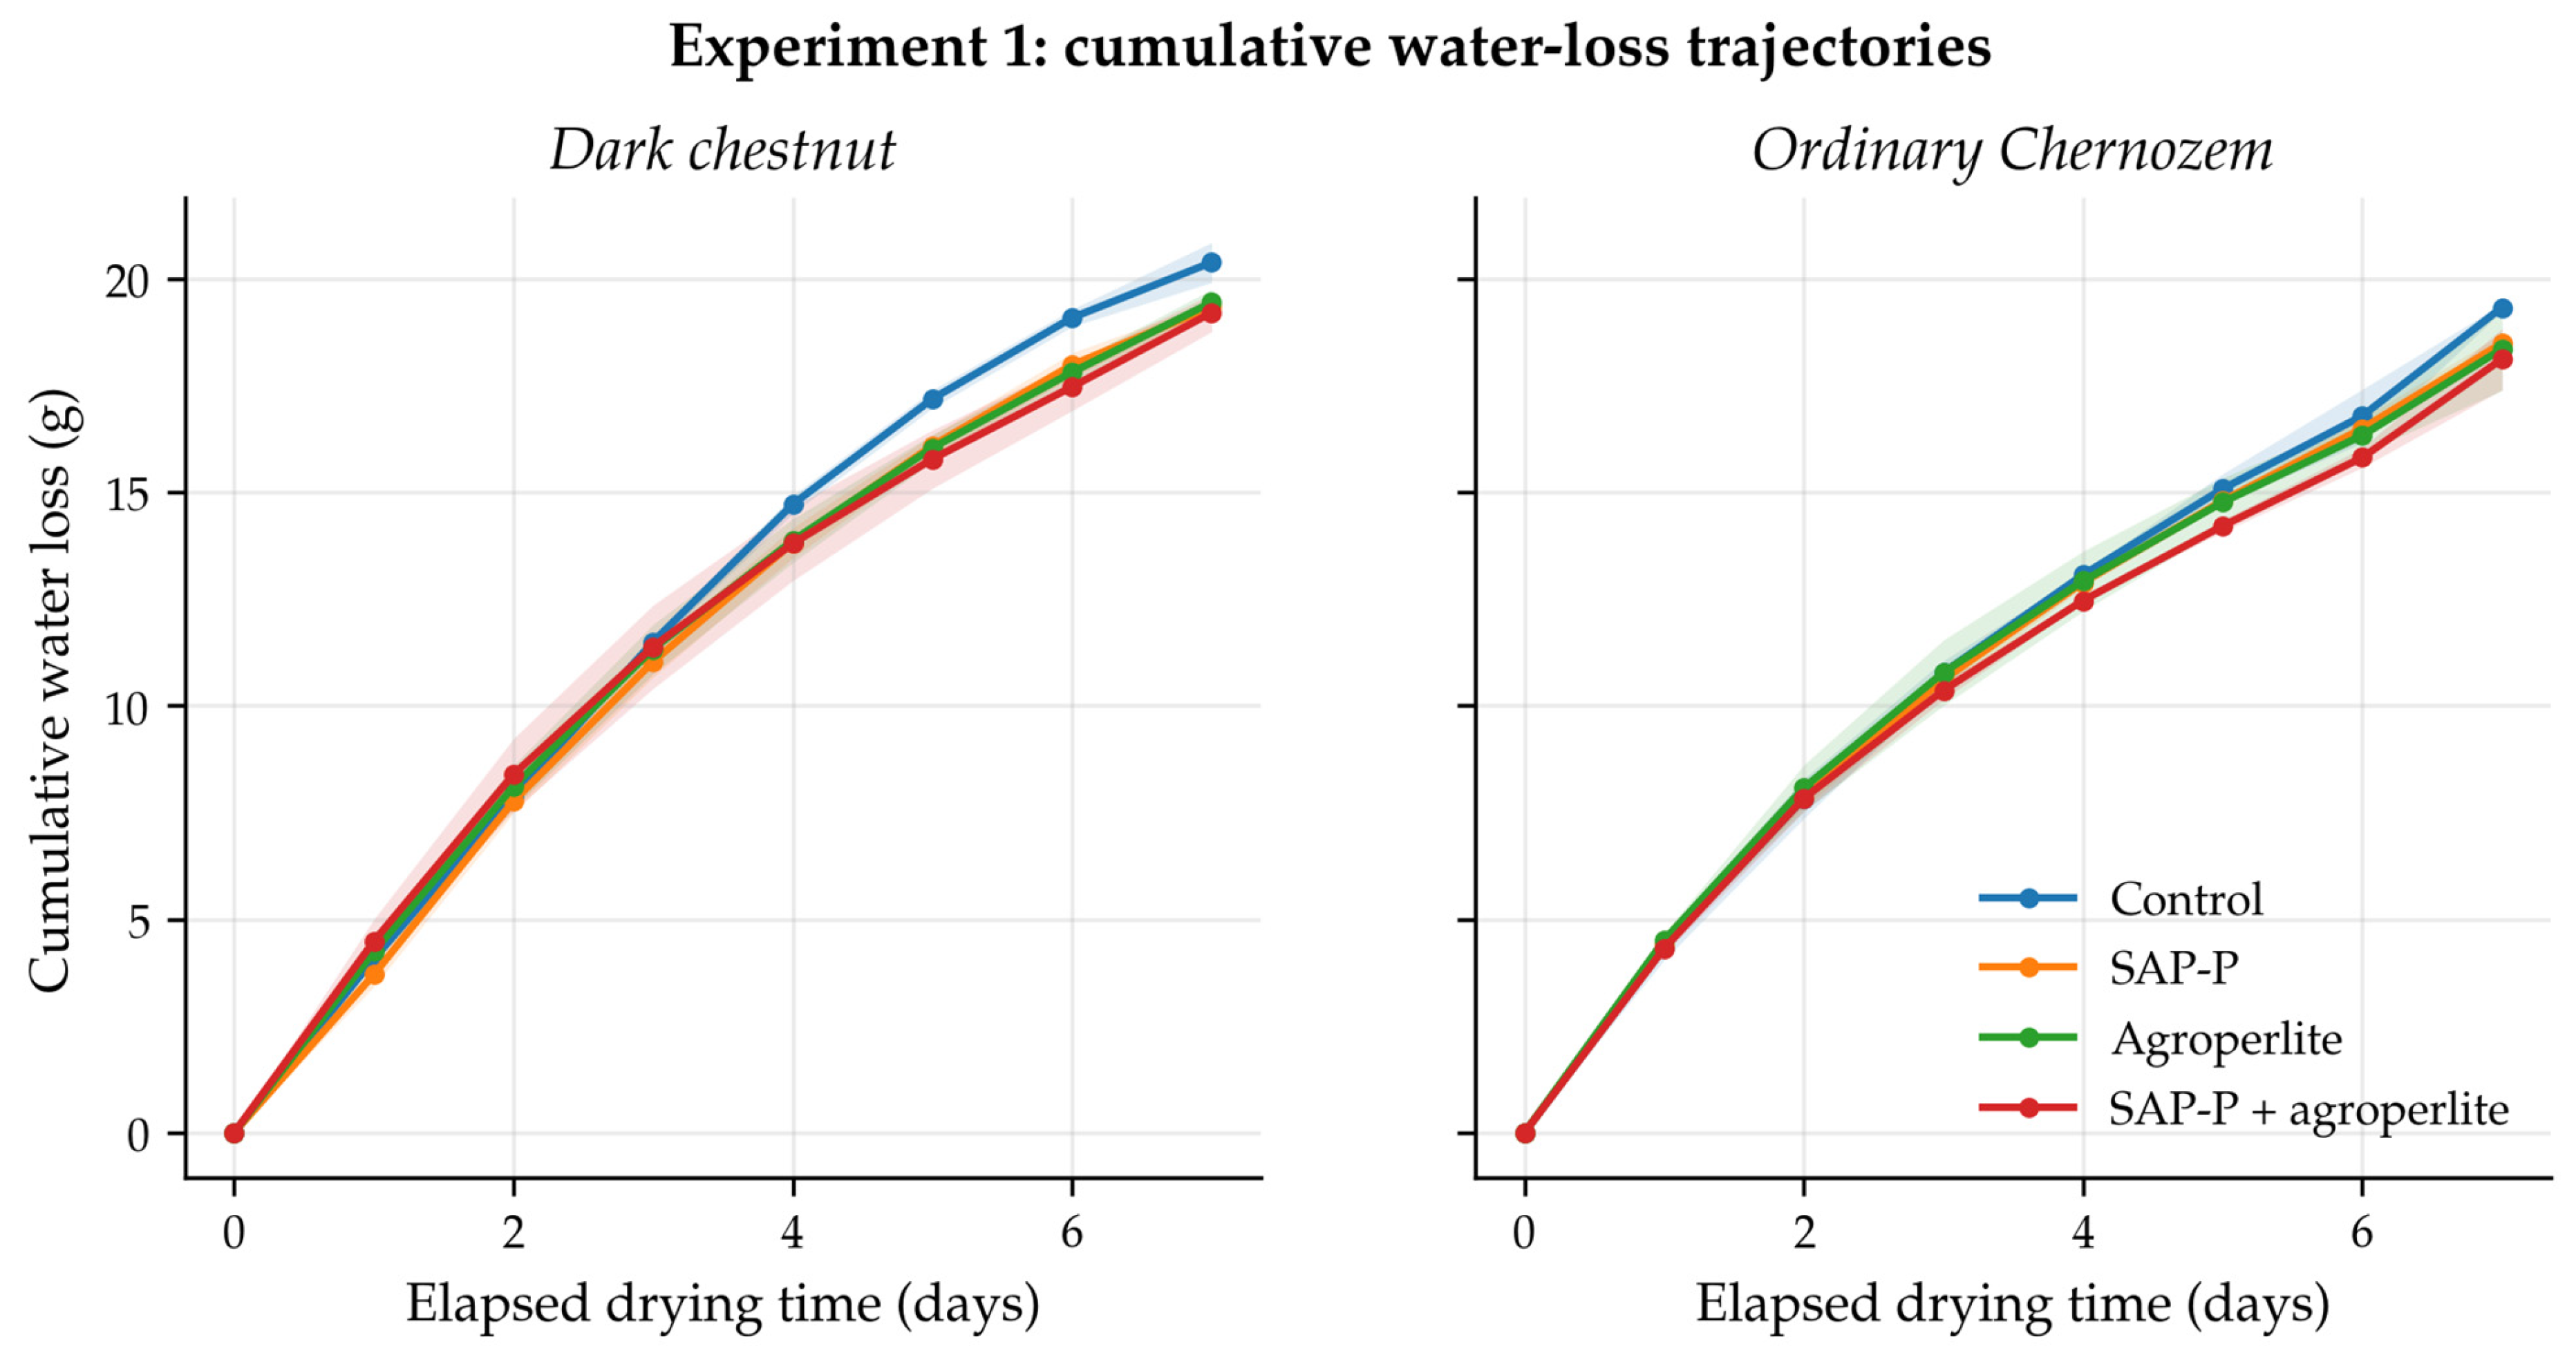
The cumulative trajectories showed progressive separation of the untreated control from the amended treatments over the seven-day interval, with the clearest late-stage separation in dark chestnut soil and heavy-textured Ordinary Chernozem (
Figure 3).
3.2. Experiment 2: Dose Responses of Three Sap Forms
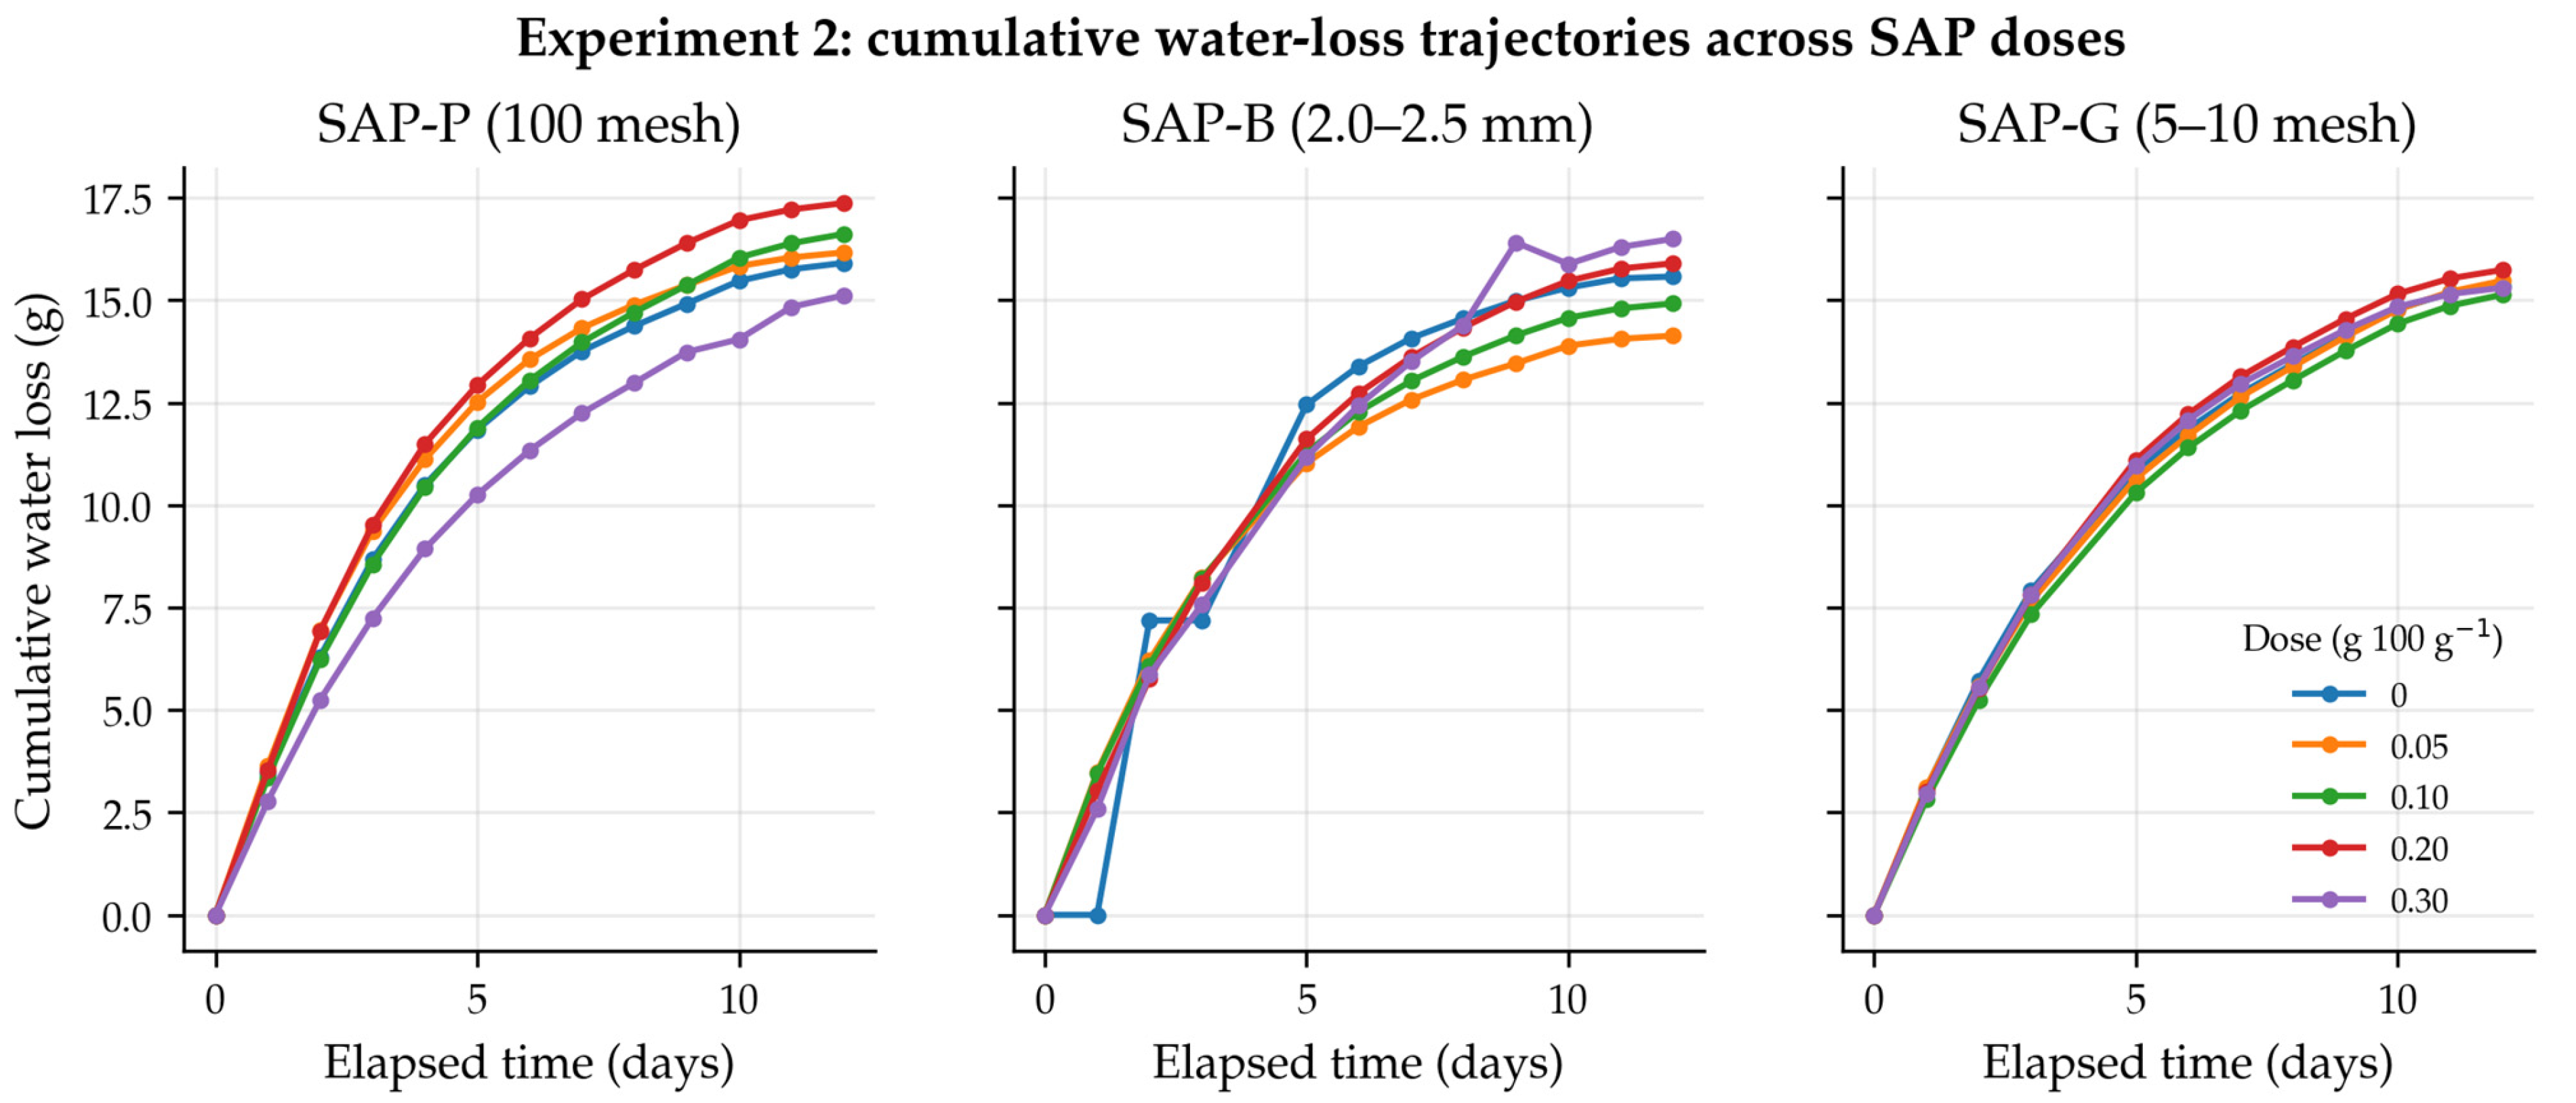
Standardization to the common 12-day window changed the interpretation of the dose experiment. None of the three SAP forms showed a monotonic decline in endpoint water loss with increasing dose (
Table 5 and
Table 6). Descriptively, the lowest endpoint occurred at 0.30 g for SAP-P, 0.05 g for SAP-B, and 0.10 g for SAP-G. Because these minima occurred at different rates and the primary ANOVA detected no dose effect, an “optimal” dose was not estimated.
The primary ANOVA did not detect a significant dose effect for SAP-P, SAP-B, or SAP-G. The Friedman sensitivity tests were significant for SAP-P and SAP-B, but the disagreement between the primary and sensitivity analyses was not considered robust evidence of dose-specific differences. Therefore, no pairwise post hoc conclusions were drawn (
Figure 4).
3.3. Experiment 3: Particle Form in Light and Heavy Loams
In light loam, all three size-defined SAP forms had lower 12-day endpoint losses than the control, with descriptive control-relative changes of −8.01% to −8.66%. In heavy loam, SAP-B and SAP-G produced small negative changes (−1.23% and −1.72%), whereas SAP-P produced a positive change (+4.53%), indicating greater loss than the control (
Table 7). The primary omnibus tests were non-significant, and the results do not support a universal advantage of the finest fraction.
Table 8.
Experiment 3 primary ANOVA and nonparametric sensitivity tests for mean daily loss.
Table 8.
Experiment 3 primary ANOVA and nonparametric sensitivity tests for mean daily loss.
| Texture | ANOVA F3,33 | ANOVA p | Friedman | Friedman p | Kendall W |
|---|
| Light loam | 1.90 | 0.148 | 2.70 | 0.440 | 0.075 |
| Heavy loam | 0.74 | 0.536 | 3.80 | 0.284 | 0.106 |
The descriptive cumulative curves differed between textures: all three harmonized SAP forms remained below the control in light loam, whereas the SAP-P trajectory approached and then exceeded the control in heavy loam (
Figure 5). These patterns are descriptive and do not constitute evidence of a significant texture × particle-form interaction.
4. Discussion
Experiment 1 demonstrated a significant overall amendment effect, but SAP-P, agroperlite, and SAP-P + agroperlite did not differ significantly from one another. Descriptive rankings suggested that SAP-P tended to produce relatively low evaporation losses in some light- and medium-loam blocks, whereas agroperlite or the composite ranked favorably in some heavy-loam blocks. These within-texture contrasts were not tested as separate significant effects and should be regarded as hypotheses for further study rather than demonstrated texture-specific responses.
Previous studies suggest that polymer swelling, specific surface area, spatial distribution, and pore-space confinement can influence soil-SAP behavior [
17,
18,
19,
20,
21]. These mechanisms may offer possible explanations for the descriptive rankings observed here, but the present experiment did not measure swelling, pore connectivity, or water-potential distributions directly. They therefore cannot be treated as confirmed explanations of treatment performance.
Agroperlite is known to modify pore structure and aeration in soil or substrate mixtures [
22,
23], and a composite may combine mineral structural effects with polymeric water storage. However, the absence of significant differences among the three amendments in Experiment 1 precludes attributing the observed heavy-loam rankings to a confirmed material-specific mechanism.
The heatmap summarizes descriptive control-relative changes, while the correlation matrix is exploratory only. Agroperlite and the composite had a Spearman coefficient of rs = 0.83 across the six blocks, but this estimate is highly uncertain at n = 6 and does not establish a shared mechanism or causal relationship.
The cumulative trajectories also indicate that treatment differences accumulated gradually during drying rather than arising from a single anomalous interval. By contrast, the crossing trajectories in Experiments 2 and 3 explain why endpoint minima did not translate into stable dose or particle-form rankings.
Experiment 2 did not show a statistically significant or consistently monotonic dose response for any SAP form. SAP performance is known to depend jointly on concentration, ionic environment, wetting–drying history, swelling confinement, and soil pore geometry [
19,
20,
21,
24,
25]. The present response pattern therefore supports evaluating application rate as a soil- and formulation-specific factor rather than inferring a quadratic optimum.
Experiment 3 likewise did not demonstrate a general particle-form effect. SAP-P was descriptively favorable in light loam but not in heavy loam, whereas the omnibus tests were non-significant in both textures. The mechanisms proposed for fine particles–rapid swelling, greater surface area, and more uniform spatial distribution–remain plausible [
19,
25], but their expression may depend on texture-related constraints [
17,
21].
The experimental design defines the scope of inference. Open-top vessels with impermeable bottoms isolated gravimetric loss dominated by evaporation and did not reproduce drainage, root uptake, or field redistribution. Equal nominal water addition did not impose an identical initial matric potential across contrasting textures, and the three experiments were independent runs with experiment-specific controls. Consequently, the results describe comparative laboratory evaporation dynamics within each experimental design.
Field validation should therefore include drainage, natural temperature and precipitation variability, plant uptake, repeated wetting-drying cycles, and long-term assessment of SAP stability and environmental safety. Such validation is essential before translating the laboratory response into application recommendations [
17,
18,
19,
20,
21,
24,
25].
5. Conclusions
The study quantified short-term evaporation loss from open-top laboratory vessels containing dark chestnut soil and Ordinary Chernozem of contrasting local texture classes. In Experiment 1, treatment significantly affected 7-day water loss across six soil-type × texture blocks (F3,15 = 12.90, p < 0.001). Fisher’s LSD separated the untreated control from all amended treatments, while SAP-P, agroperlite, and SAP-P + agroperlite did not differ from one another. Experiment 2 showed no significant primary ANOVA dose effect for SAP-P, SAP-B, or SAP-G, and Experiment 3 showed no significant particle-form effect in either light or heavy loam. Thus, the data support a general amendment effect under the conditions of Experiment 1 but do not identify a superior amendment, universal optimum dose, or generally superior SAP particle form.
Under the tested open-top, no-drainage laboratory conditions, SAP-P, agroperlite, and SAP-P + agroperlite reduced short-term evaporation loss relative to the untreated control in Experiment 1, but the three amendments were not significantly different from one another. Effects of SAP dose and particle form were not significant in the primary analyses. Replicated field experiments incorporating drainage, plant water uptake, natural weather variability, repeated wetting–drying cycles, and long-term environmental safety assessment are required before these amendments, application rates, or formulations can be recommended for agricultural practice.
Author Contributions
Conceptualization, N.M. and N.S.; methodology, N.M., N.S. and A.N.; investigation, A.N., B.A., N.Z., A.T., N.J., F.H. and A.O.; data curation, B.A., A.N. and A.O.; formal analysis, N.M., A.N. and B.A.; visualization, B.A. and N.Z.; writing—original draft preparation, N.M., B.A. and A.N.; writing—review and editing, N.S., A.K., N.J. and A.O.; supervision, N.M., F.H. and N.S.; project administration, N.M.; funding acquisition, N.M. All authors have read and agreed to the published version of the manuscript.
Funding
This research was conducted within the framework of Project AP26104511, “Study of the Effects of Integrated Agromeliorative Practices on Soil Water Regime, Soil Fertility, and Forage Crop Productivity in the Steppe Zone of Northern Kazakhstan” (2025–2027), funded under Budget Program 217 “Development of Science”, Subprogram 102 “Grant Funding for Scientific Research”, within the priority area “Sustainable Development of the Agro-Industrial Complex and Safety of Agricultural Products” and the specialized scientific field “Intensive Agriculture and Crop Production” of the Ministry of Science and Higher Education of the Republic of Kazakhstan. This research was also supported by the National Key Research and Development Program of China (Grant No. 2025YFE0212000) and the Innovation Platform Plan Program of Gansu Province (Grant No. 26JDWA001).
Data Availability Statement
The gravimetric measurements and statistical calculation files supporting the findings of this study are available from the corresponding author on reasonable request. The data are not publicly available because the research project is ongoing.
Acknowledgments
The authors sincerely thank the College of Pastoral Agriculture Science and Technology at Lanzhou University for hosting and supporting this project within its facilities. The authors also acknowledge the China–Kazakhstan Belt and Road Joint Laboratory on Grassland Ecological Restoration for its institutional support and coordination of the collaborative research.
Conflicts of Interest
Author Nurlan Serekpayev was employed by the company «AgroInnovaConsalt» LLP. Author Almas Kurbanbayev was employed by the company LLP “A.I. Baraev Scientific and Production Center of Grain Farming”. The remaining authors declare that the research was conducted in the absence of any commercial or financial relationships that could be construed as a potential conflict of interest.
References
- Baisholanov, S.; Akshalov, K.; Mukanov, Y.; Zhumabek, B.; Karakulov, E. Agro-Climatic Zoning of the Territory of Northern Kazakhstan for Zoning of Agricultural Crops Under Conditions of Climate Change. Climate 2024, 13, 3. [Google Scholar] [CrossRef]
- Zheng, H.; Mei, P.; Wang, W.; Yin, Y.; Li, H.; Zheng, M.; Ou, X.; Cui, Z. Effects of super absorbent polymer on crop yield, water productivity and soil properties: A global meta-analysis. Agric. Water Manag. 2023, 282, 108290. [Google Scholar] [CrossRef]
- Mukhanov, N.; Serekpayev, N.; Balgabayev, N.; Stybayev, G.; Baitelenova, A.; Nogaev, A.; Kurbanbayev, A.; Akhylbekova, B. Efficiency of Japanese Millet (Echinochloa frumentacea) Fodder Crop Cultivation in the Arid Steppe. Online J. Biol. Sci. 2023, 23, 424–431. [Google Scholar] [CrossRef]
- Chang, L.; Xu, L.; Liu, Y.; Qiu, D. Superabsorbent polymers used for agricultural water retention. Polym. Test. 2021, 94, 107021. [Google Scholar] [CrossRef]
- Guilherme, M.R.; Aouada, F.A.; Fajardo, A.R.; Martins, A.F.; Paulino, A.T.; Davi, M.F.; Rubira, A.F.; Muniz, E.C. Superabsorbent hydrogels based on polysaccharides for application in agriculture as soil conditioner and nutrient carrier: A review. Eur. Polym. J. 2015, 72, 365–385. [Google Scholar] [CrossRef]
- Saha, A.; Sekharan, S.; Manna, U. Superabsorbent hydrogel (SAH) as a soil amendment for drought management: A review. Soil Tillage Res. 2020, 204, 104736. [Google Scholar] [CrossRef]
- Abedi-Koupai, J.; Sohrab, F.; Swarbrick, G. Evaluation of Hydrogel Application on Soil Water Retention Characteristics. J. Plant Nutr. 2008, 31, 317–331. [Google Scholar] [CrossRef]
- Bai, W.; Zhang, H.; Liu, B.; Wu, Y.; Song, J. Effects of super-absorbent polymers on the physical and chemical properties of soil following different wetting and drying cycles. Soil Use Manag. 2010, 26, 253–260. [Google Scholar] [CrossRef]
- Lee, K.-S.; Lee, D.-S.; Lim, C.-S.; Lee, S.-P.; Yang, J.-E.; Chung, D.-Y. Water Retention Characteristics of Various Sizes of Expanded Perlite Produced from Two Different Types of Rocks. Horticulturae 2022, 8, 805. [Google Scholar] [CrossRef]
- Krasnopeeva, E.L.; Panova, G.G.; Yakimansky, A.V. Agricultural Applications of Superabsorbent Polymer Hydrogels. Int. J. Mol. Sci. 2022, 23, 15134. [Google Scholar] [CrossRef] [PubMed]
- Adjuik, T.A.; Nokes, S.E.; Montross, M.D.; Wendroth, O. The Impacts of Bio-Based and Synthetic Hydrogels on Soil Hydraulic Properties: A Review. Polymers 2022, 14, 4721. [Google Scholar] [CrossRef] [PubMed]
- Agaba, H.; Orikiriza, L.J.B.; Esegu, J.F.O.; Obua, J.; Kabasa, J.D.; Hüttermann, A. Effects of Hydrogel Amendment to Different Soils on Plant Available Water and Survival of Trees under Drought Conditions. CLEAN–Soil Air Water 2010, 38, 328–335. [Google Scholar] [CrossRef]
- Kachinsky, N. Soil Physics. Part 1; Vysshaya Shkola: Moscow, Russia, 1965. [Google Scholar]
- Tyurin, I.V. A new modification of the volumetric method of determining soil organic matter by means of chromic acid. Pochvovedenie 1931, 26, 36–47. [Google Scholar]
- ISO 10390:2021; Soil, Treated Biowaste and Sludge–Determination of pH. International Organization for Standardization: Geneva, Switzerland, 2021.
- ISO 11272:2017; Soil Quality—Determination of Dry Bulk Density. International Organization for Standardization: Geneva, Switzerland, 2017.
- Saha, A.; Rattan, B.; Sekharan, S.; Manna, U. Quantifying the interactive effect of water absorbing polymer (WAP)-soil texture on plant available water content and irrigation frequency. Geoderma 2020, 368, 114310. [Google Scholar] [CrossRef]
- Abdallah, A.M. The effect of hydrogel particle size on water retention properties and availability under water stress. Int. Soil Water Conserv. Res. 2019, 7, 275–285. [Google Scholar] [CrossRef]
- Yu, J.; Shi, J.G.; Ma, X.; Dang, P.F.; Yan, Y.L.; Mamedov, A.I.; Shainberg, I.; Levy, G.J. Superabsorbent Polymer Properties and Concentration Effects on Water Retention under Drying Conditions. Soil Sci. Soc. Am. J. 2017, 81, 889–901. [Google Scholar] [CrossRef]
- Malik, S.; Chaudhary, K.; Malik, A.; Punia, H.; Sewhag, M.; Berkesia, N.; Nagora, M.; Kalia, S.; Malik, K.; Kumar, D.; et al. Superabsorbent Polymers as a Soil Amendment for Increasing Agriculture Production with Reducing Water Losses under Water Stress Condition. Polymers 2022, 15, 161. [Google Scholar] [CrossRef] [PubMed]
- Ji, B.-Y.; Zhao, C.-P.; Wu, Y.; Han, W.; Song, J.-Q.; Bai, W.-B. Effects of different concentrations of super-absorbent polymers on soil structure and hydro-physical properties following continuous wetting and drying cycles. J. Integr. Agric. 2022, 21, 3368–3381. [Google Scholar] [CrossRef]
- Al Naddaf, O.; Livieratos, I.; Stamatakis, A.; Tsirogiannis, I.; Gizas, G.; Savvas, D. Hydraulic characteristics of composted pig manure, perlite, and mixtures of them, and their impact on cucumber grown on bags. Sci. Hortic. 2011, 129, 135–141. [Google Scholar] [CrossRef]
- Dzięcioł, J.; Szlachetka, O.; Tavares, J.M.R. From Volcanic Popcorn to the Material of the Future: A Critical Review of Expanded Perlite Applications and Environmental Impacts. Sustainability 2025, 17, 1454. [Google Scholar] [CrossRef]
- Campanile, A.; Liguori, B.; Lama, G.C.; Recupido, F.; Donatiello, S.; Gagliardi, M.; Morone, A.; Verdolotti, L. The Role of Superabsorbent Polymers and Polymer Composites in Water Resource Treatment and Management. Polymers 2024, 16, 2337. [Google Scholar] [CrossRef] [PubMed]
- Palma, D.; Lagos, O.; Souto, C.; Pérez, A.; Quezada, L.; Hirzel, J.; Vera, M.; Ulloa, J.; Urbano, B. Evaluation of a Natural Superabsorbent Polymer on Water Retention Capacity in Coarse-Textured Soils. Water 2024, 16, 3186. [Google Scholar] [CrossRef]
| Disclaimer/Publisher’s Note: The statements, opinions and data contained in all publications are solely those of the individual author(s) and contributor(s) and not of MDPI and/or the editor(s). MDPI and/or the editor(s) disclaim responsibility for any injury to people or property resulting from any ideas, methods, instructions or products referred to in the content. |




 ,
,