Article

Co-Culture of Rice–Chinese Soft-Shell Turtle Increased the Food Yields and Economic Benefit with Less Greenhouse Gas Emissions

China National Rice Research Institute, Hangzhou 310006, China
*
Authors to whom correspondence should be addressed.
These authors contributed equally to this work.
Agronomy 2026, 16(15), 1451; https://doi.org/10.3390/agronomy16151451
Submission received: 1 July 2026 / Revised: 28 July 2026 / Accepted: 29 July 2026 / Published: 31 July 2026
(This article belongs to the Section Farming Sustainability)

Abstract

Converting conventional rice monoculture to co-culture with fish is a common strategy to increase farmers’ incomes. The Chinese soft-shell turtle is a typical high-value species for paddy co-culture, but the effects of the co-culture system (RT) on greenhouse gas emissions (GHG) are poorly understood. This study evaluated the impacts of RT on economic benefits and greenhouse gas emissions. Our results showed that RT co-culture did not significantly increase rice yield, but it provided additional income from turtle sales, increasing net profits. GHG emission responses to RT differed between the two farms. In farm 1, RT increased CH4 emissions from the rice-cultivated area but decreased them from the turtle culture area, resulting in no net effect on total CH4 emissions. The reduction of CH4 emissions in the turtle culture area was associated with lower DOC content and reduced methanogenic gene mcrA abundance. In farm 2, RT reduced CH4 emissions from both areas, lowering total CH4 emissions by 36.5%, which was linked to less water flooding and higher methanotrophic gene (pmoA) abundance. Total N2O emissions were not significantly affected by RT at either farm. RT increased indirect GHG emissions, but these accounted for only 7.2–16.9% of total emissions. Overall, RT reduced total GHG emissions by 27.7% at farm 2, with no significant change at farm 1. These findings suggest that RT can enhance economic benefit while lessening total GHG emissions.

1. Introduction

Economic growth has driven a global shift toward healthy diets rich in high-quality protein, significantly increasing fish consumption [1]. Inland aquaculture plays an important role in meeting this demand, providing 52% of global fish and 17% of animal-derived protein for human consumption [2]. However, the rapid development of inland intensive aquaculture has also caused serious environment problems, such as eutrophication and greenhouse gas emissions [3,4]. Resolving the contradiction between food production and environmental sustainability requires a shift towards a more comprehensive and resource efficient farming model.
Rice–aquatic animal co-culture systems have been proposed as a sustainable model that can enhance food production and reduce its environmental impact [5,6,7]. In these systems, rice paddies provide suitable habitats for aquatic animals that contribute to pest control and nutrient cycling. These integrated practices have been widely adopted by Asian countries [8]. Besides fish, various other species have been introduced into rice paddies, including turtles, crayfishes, frogs, and crabs [9,10,11,12,13].
The Chinese soft-shell turtle (Pelodiscus sinensis) has become a particularly valuable co-culture species due to its high nutritional properties and economic value [14]. Since 2005, rice–soft-shell turtle (RT) co-culture has expanded significantly in southern China [15] and is mainly distributed in the middle and lower reaches of the Yangtze River, with a cultivation area second only to the three major cultivation models (rice–crayfish, rice–fish, and rice–crab) [16]. Previous studies have demonstrated that RT co-culture reduces environmental impacts by decreasing reliance on chemical herbicides through effective weed control, while also enhancing productivity by improving rice tillering and panicle formation [12,17]. However, a comprehensive understanding of its effects on greenhouse gas (GHG) emissions remains unclear. Culturing soft-shell turtles in rice paddies may modify the field micro-environment through their foraging, stirring, and burrowing activities, which are hypothesized to influence greenhouse gas emissions by enhancing soil–water gas exchange and altering sediment redox conditions [18]. However, direct field measurements quantifying GHG fluxes in RT co-culture systems are currently lacking, leaving their actual impact on methane (CH4) and nitrous oxide (N2O) emissions poorly understood. Previous studies on other rice–aquatic animal systems reveal inconsistent patterns in GHG emissions. For instance, rice–duck and rice–crayfish systems reduced CH4 emissions by 20–21% in the meta-analysis, while rice–fish systems increased CH4 emissions by 29% [8]. Similarly, a meta-analysis of 34 studies indicated that the co-culture systems in rice paddies increased N2O emissions by 11.3% [19], while other research reduced N2O emissions [20]. These conflicting findings highlight the complexity and variability of GHG emissions in different co-culture systems. Given the unique biological and behavioral characteristics of soft-shell turtles, there is an urgent need for comprehensive field studies that directly measure GHG fluxes in RT co-culture systems, especially those studying long-term emission patterns.
CH4 emissions are governed by the balance between methanogenesis and methanotrophs, regulated by mcrA and pmoA, respectively [21]. Methanogens produce CH4 under anaerobic conditions using substrates derived from root exudates and soil organic carbon, whereas methanotrophs consume CH4 under aerobic conditions in the rhizosphere and topsoil [22,23,24]. N2O emissions are primarily driven by nitrification and denitrification [25,26]. Ammonia oxidation, the first and rate-limiting step of nitrification, is mediated by ammonia-oxidizing archaea (AOA) and bacteria (AOB) [27,28]. Key functional genes nirK, nirS (nitrite reduction), and nosZ (N2O reduction to N2) play critical roles in regulating net N2O fluxes [29,30]. Nevertheless, how RT co-culture influences these microbial pathways and subsequent GHG emissions remains poorly understood.
In this study, we evaluate the RT co-culture system from the perspective of agroecological and sustainable rice production, considering both environmental (GHG emissions) and economic benefits in the Yangtze River Delta region. The objectives of this study are (1) to assess the economic benefits of RT co-culture systems; (2) to determine the effect of RT co-culture on GHG emissions; and (3) to identify the main factors influencing GHG emissions from an RT co-culture system.

2. Materials and Methods

2.1. Experimental Setup and Design

The field experiment was established at two farms in Hangzhou, Zhejiang Province, China: farm 1 (30°29′ N, 121°33′ E) and farm 2 (30°26′ N, 119°37′ E). This region has a subtropical monsoon climate. The temporal changes of precipitation and air temperature are shown in Figure S1.
Field experiments were conducted from June to October 2024 at two farms. At each farm, two treatments, rice monoculture (RM) and rice–Chinese soft-shell turtle (Pelodicus sinensis) (RT), were arranged in a completely randomized design with three independent field plots per treatment (total of six plots per farm). Each plot measured 17 m × 120 m at farm 1 and 25 m × 160 m at farm 2 and was separated by field ridges. Each rice–turtle co-culture rice paddy was divided into two functional areas, the rice-cultivated area (RT-R) and turtle culture area (RT-T) (Figure S2), which comprised 90–92% and 8–10% of the total paddy area, respectively. The turtle culture area was located on one side of the rice-cultivated area. The turtle is an omnivorous species with a typical growth cycle of 2–3 years to marketable size. It has become a particularly valuable co-culture species due to its high nutritional properties and economic value. The basic soil properties of the rice paddy of the two farms are listed in Table S1.
Farm 1 (2-year co-culture): Rice was transplanted on 12 June and harvested on 21 October. The nitrogen application rates were 269.3 kg N ha−1 and 321.0 kg N ha−1 for the RT and RM systems, respectively. The irrigation management methods of the two modes were consistent, both adopting wet–dry alternation irrigation. The turtles (one year old) were stocked at a density of 2250 kg ha−1 (approximately 0.6 kg per individual and about 3000 pieces per hectare) into the turtle culture area in May, and the co-culture period began on July 29. Turtles were fed commercially formulated feed (crude protein > 46%) one time per day during June to September. The total input of feed was 1350 kg ha−1. The water depth in the turtle culture area maintained at 80cm. Turtles were harvested between rice harvest and May 2025.
Farm 2 (8-year co-culture): Rice was direct-seeded on 29 May and was harvested on 24 October. The nitrogen application rates were 85.5 kg N ha−1 and 150.0 kg N ha−1 for the RT and RM systems, respectively. RM adopted alternating wet–dry irrigation; RT adopted moist irrigation during the tillering stage and subsequently adopted alternating wet–dry irrigation. The turtles (one year old) were stocked at a density of about 825 kg ha−1 (approximately equivalent to 0.65–0.70 kg per individual−1 and about 1200 pieces per hectare) into the turtle culture area in May. There was no net between the rice fields and the turtle culture area during the whole co-culture period. Turtles were fed commercially formulated feed (crude protein > 46%) one time per day during June to September. The total input of feed was 750 kg ha−1. The water depth in the turtle culture area was maintained at 40–50 cm. Turtles were harvested between rice harvest and May 2025.

2.2. Yields and Economic Benefit

The rice yields were determined based on the yields of three randomly selected sample plots (1 m × 1 m) at rice maturity stage. The yield of turtles is the actual cumulative catch recorded by farmers in the current year. The calculation of equivalent yield (kg ha−1) in the system is as shown in Equation (1), while the specific content can be found in Table S3:
Equivalent yield = Yrice + Yturtle × Pturtle/Price
where Yrice is the rice grain yield per unit hectare (kg ha−1); Yturtle is the fresh weight of actual harvested turtle of per unit hectare (kg ha−1); Pturtle is the average actual sales price of turtle (135 CNY ka−1); Price is the local rice purchase price (3.34 CNY ka−1).
We further investigated the cost, incomes and economic benefits of each farm and performed simple calculations on the actual economic benefits of each farm to evaluate its profitability Equations (2)–(4). Cost accounting encompassed all inputs including land preparation, irrigation, and harvesting, including seedlings (rice seeds and turtle fry), fertilizers, pesticides, machinery, labor, and land rent (Table S4). The total income comprised revenue from rice sales and additional turtle income.
C o s t = i = 1 n P i   F i ,   i = 1,2 , , n
Revenue = Price Yrice + Pturtle Yturtle
Profit = RevenueCost
where Pi is the price of the ith input of the materials and labor CNY kg−1; Fi is the ith input of the material; Pturtle is the sale price of turtle (CNY kg−1); Yrice is the rice grain yield per unit hectare (kg ha−1); Price is the sale price of rice (CNY kg−1); Yturtle is the fresh weight of harvested turtle yield per unit hectare (kg ha−1).

2.3. Direct and Indirect GHG Emissions

The direct GHG emissions (CH4 and N2O) from RT and RM were monitored by using the static chamber method [31]. The static chamber was made of stainless-steel material (length, width, and height of 0.5 m × 0.5 m × 0.5 m), covered with insulation and reflective materials to avoid interference from temperature and sunlight. Before the start of the experiment, stainless steel bases with annular grooves were inserted into the paddy soil to ensure gapless contact with the soil surface. Before each sampling, we filled the groove with liquid and placed the chamber on the base to seal the gap and prevent air exchange. Gas samples were collected from one sampling point per plot, with three replicate plots per treatment at each farm. Automatic gas samplers were used to collect gas samples at the 0, 10th, 20th, and 30th minutes between 8:00 a.m. and 11:00 a.m. Gas samples were commonly collected once a week during the rice growing season. Additional samples were taken on the 1st, 3rd, and 7th days after fertilization or drainage. The collected gas samples were brought back to the laboratory for the determination of CH4 and N2O contents using gas chromatography (GC 2010, Shimadzu, Kyoto, Japan), and the fluxes of CH4 and N2O were calculated using the classic methods reported in previous studies [31,32].
Indirect GHG emissions (kg CO2-eq ha−1) indicate the total indirect CO2-eq emissions from field management. The indirect GHG emission assessment follows the LCA (life cycle assessment) method. In this study, we only considered the period from rice cultivation to harvest, because the turtles hardly feed after the rice is harvested, and their metabolic emissions can be ignored. Although fishing and sales are still ongoing, we believe that this stage has limited contribution to GHG emissions. Therefore, we define this assessment as a partial seasonal assessment. The indirect GHG emission of crop production was estimated by quantifying the GHG emissions associated with agricultural inputs and farm management practices up to the farm gate (from sowing to harvest, Table S5) [33], which was calculated according to
I n d i r e c t   G H G   e m i s s i o n = i = 1 n F i C i
Fi is the amount of each management input and Ci is CO2-eq emission coefficient.
The total GHG emissions (kg CO2-eq ha−1) from different farming systems were calculated by the sum of direct and indirect GHG emissions (Equation (6)). Direct CH4 and N2O emissions were transferred to global warming potential by multiplying the 100-year radiative forcing potential coefficients (27 for CH4 and 273 for N2O) [34]:
Total GHG emission = CH4 × 27 + N2O × 273 + Indirect GHG emission

2.4. Soil Sampling and Soil Physiochemical Properties and Microbial Diversity Measurements

Soil samples were collected during the main growth stage of rice. A stainless-steel soil drill (with an inner diameter of 5 cm) was used to collect soil samples from the 0–20 cm plough layer. Every three soil cores were mixed into one repetition. Three replicate soil samples were collected for each treatment in the experimental farms. After removing impurities including plant roots and gravel, each composite soil sample was divided into three subsamples. One subsample was air-dried at room temperature, and another fresh subsample was stored at −20 °C. The physical and chemical indicators were determined immediately after the sample processing was completed. A third fresh subsample was placed into a 100 mL centrifuge tube and stored at −80 °C for subsequent soil microbial analysis.
The soil physicochemical properties, including soil pH, soil organic matter (SOM), total nitrogen (TN), total phosphorus (TP), total potassium (TK), dissolved organic carbon (DOC), soil nitrate-N (NO3-N), and ammonium-N (NH4+-N), were determined using the standard methods of soil agrochemical analysis [35]. Total genomic DNA was purified from 0.25 g fresh sediment using the DNeasy Pow-erLyzer Power Soil Kit (QIAGEN, Germany). High-quality DNA extracts were used to quantify the abundances of key functional genes underlying CH4 and N2O emission mechanisms. Quantification of gene copy numbers for mcrA, pmoA, nirK, nirS, nosZ, AOA and AOB were performed via quantitative real-time polymerase chain reaction (qPCR) with a Bio-Rad CFX96 Real-Time System (Table S7).

2.5. Statistical Analysis

The data were statistically analyzed using R software (version 4.4.2). The normality and homogeneity of variance tests were conducted using the basic package of R software before statistical analysis. One-way ANOVA with Duncan’s multiple range test was used to test the differences in CH4 and N2O emissions, soil properties and functional genes. Duncan’s test of variables between treatments were conducted using the “agricolae” package. A t-test was used to test the differences in CH4 and N2O, GHG emissions and GHG emissions intensity between RM and RT. Statistical significance was determined at p < 0.05. All graphs were plotted using Origin 2026.

3. Results

3.1. Food Productivity and Economic Benefits

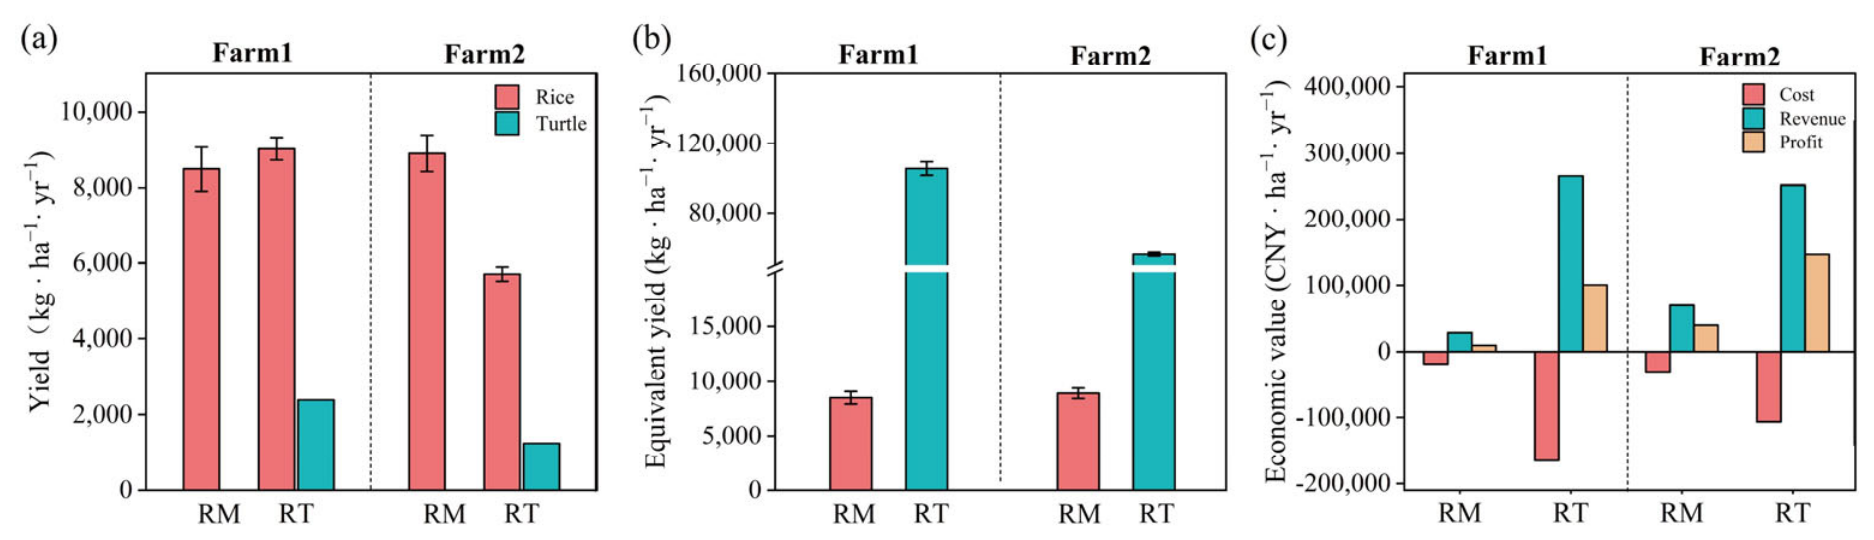
Rice yield of RT was comparable to that of RM at farm 1, whereas lower rice yield was observed for RT relative to RM at farm 2 (Figure 1a). RT gained additional yields of soft-shell turtle both at farm 1 and farm 2. The overall equivalent yields, including rice and turtle, were increased 12.4 and 6.3 times by RT compared to RM at farm 1 and farm 2, respectively (Figure 1b). The economic analysis showed that RT reduced the cost of fertilizer and pesticides used for rice production in this co-culture system but increased the cost of turtle culture (Figure S3). The total cost was higher for RT than RM both at farm 1 and farm 2 (Figure 1c). The net profit increased 9.5 and 2.7 times for RT compared to RM at farm 1 and farm 2, respectively.

3.2. CH4 and N2O Emissions

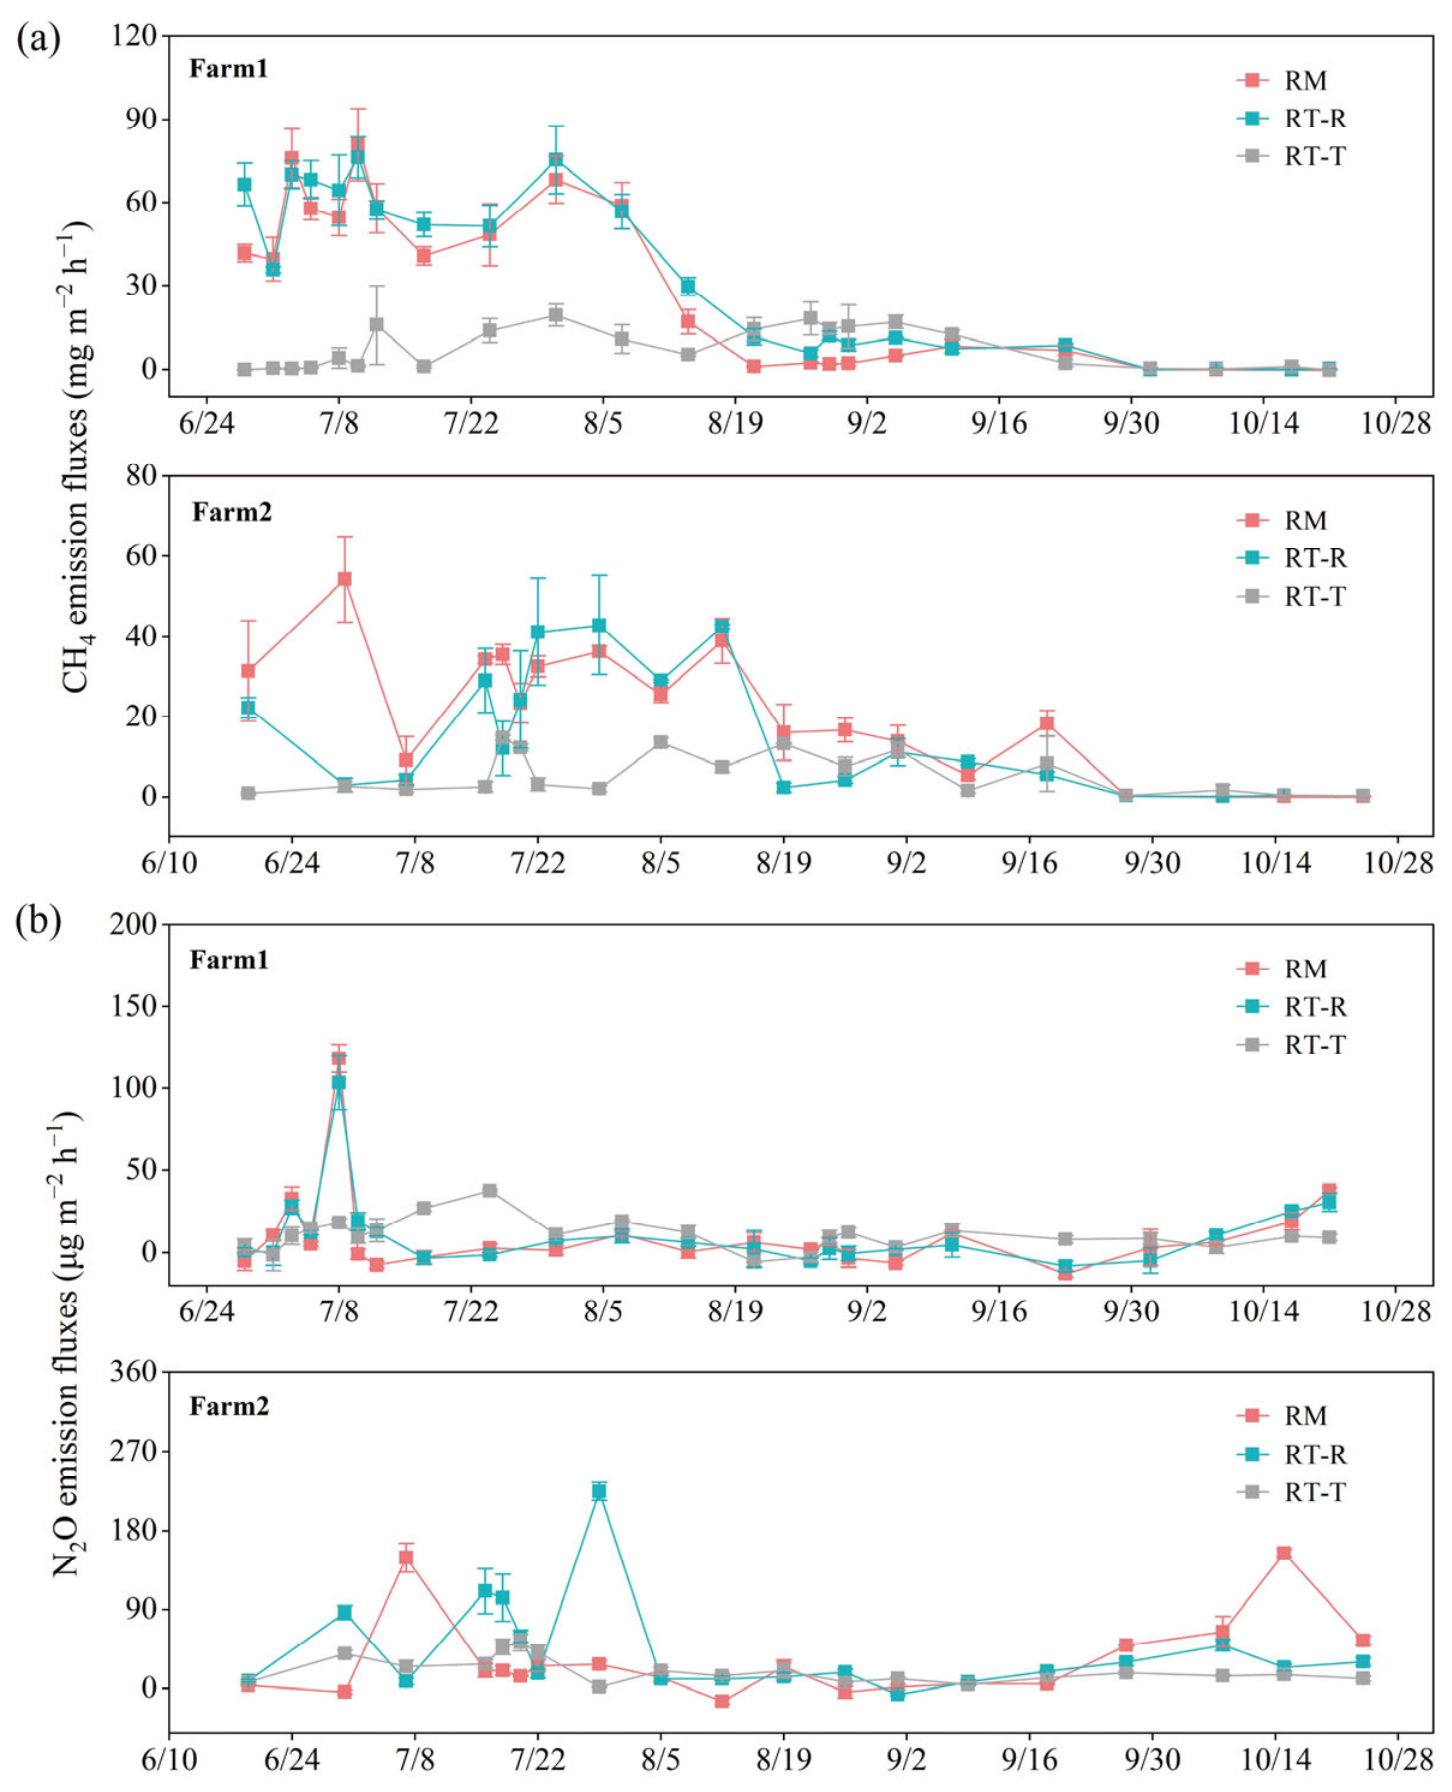
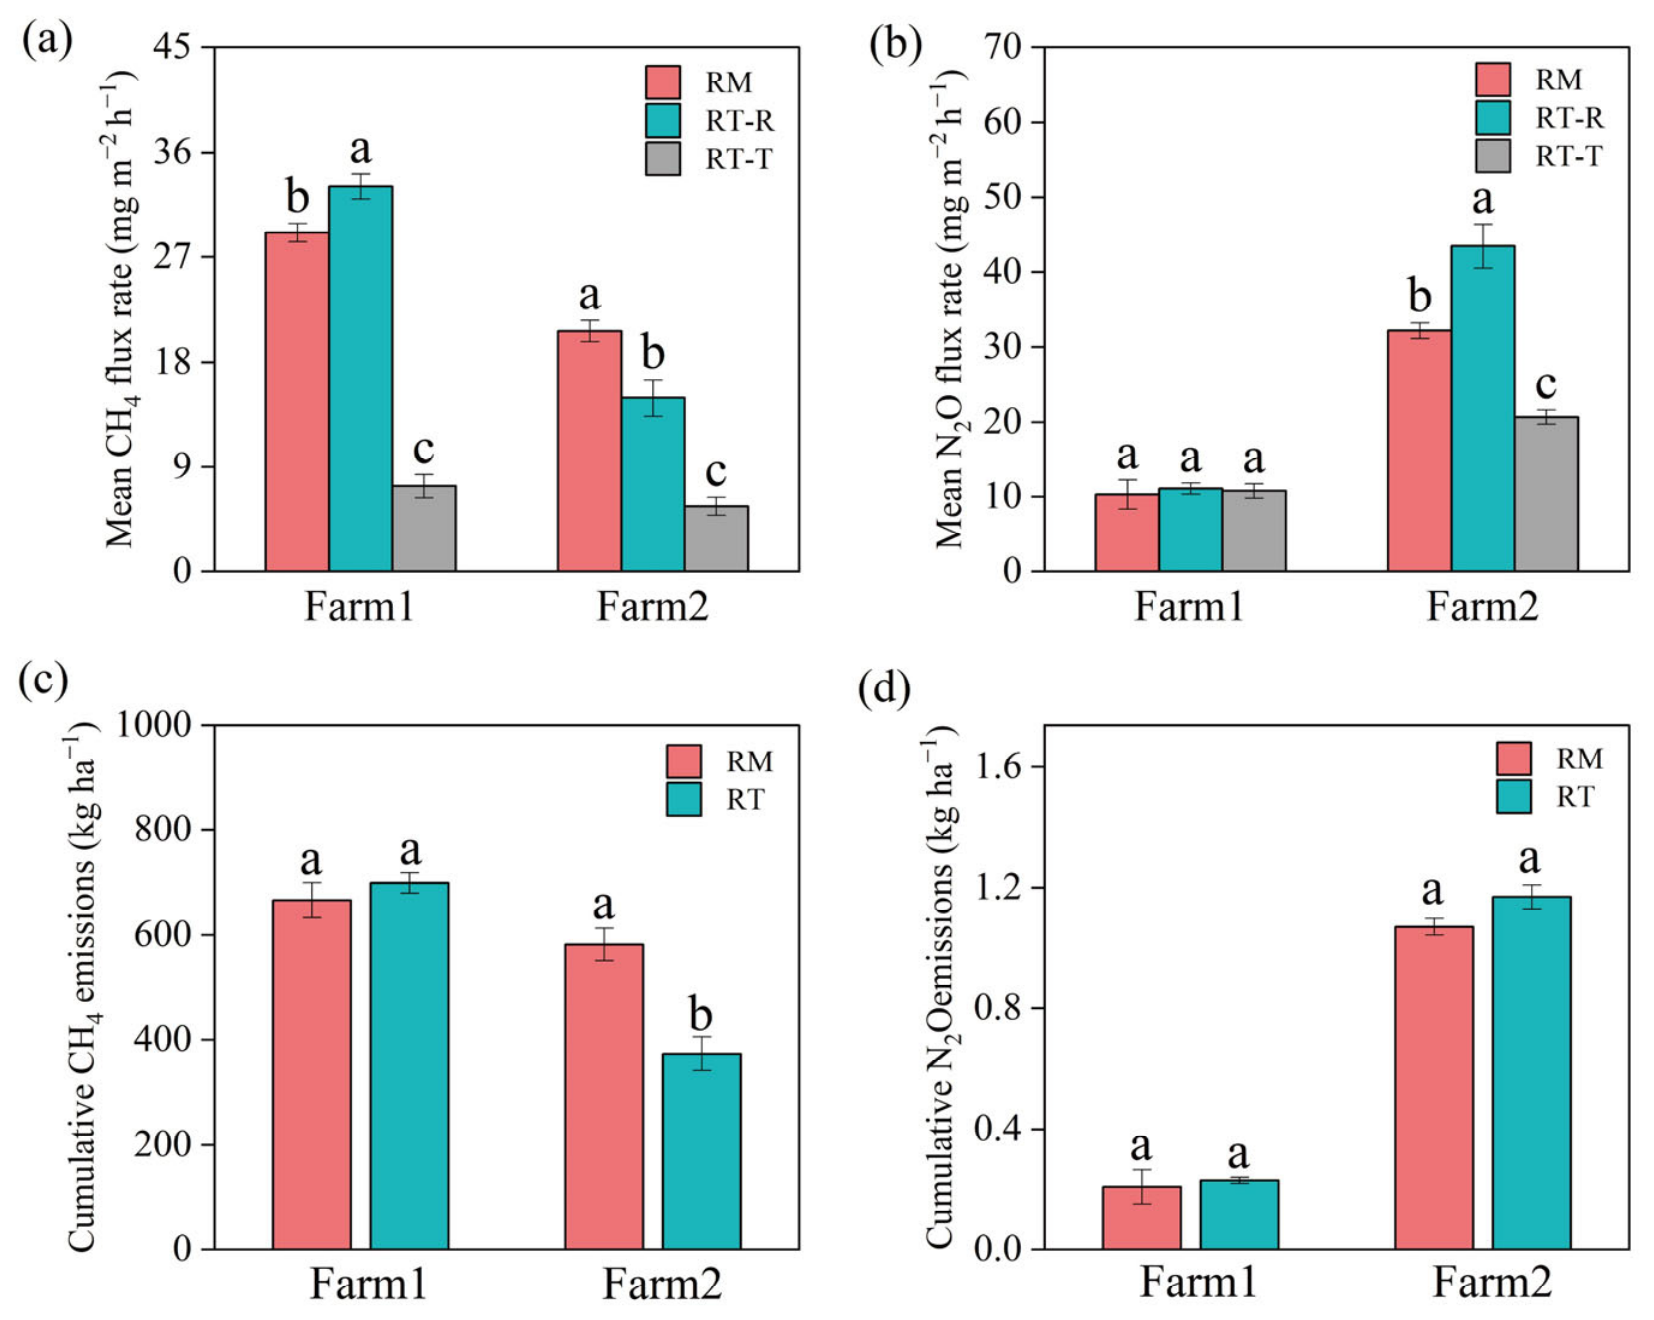
The dynamic of CH4 emission from the rice-cultivated area of the RT (RT-R) system presented a similar pattern to that of RM (Figure 2a) at farm 1. The mean CH4 flux rate of RT-R during the sampling period was significantly higher than that of RM at this farm (Figure 3a). However, the total CH4 emission of RT, including the rice-cultivated area (RT-R) and turtle culture area (RT-T), did not show significant difference as compared with that of RM (Figure 3c), which was primarily due to the significantly lower CH4 emission from the turtle culture area under the RT system (Figure 3a). As at farm 2, the rice-cultivated area and turtle culture area of the RT system both had a lower mean CH4 flux rate than RM (Figure 3b). The total CH4 emission was decreased 36.5% by RT compared to RM at this farm.
The flux rate of N2O showed sporadic flux peaks during the sampling period at two farms (Figure 2b). The mean N2O flux rate did not present a significant difference among RT-R, RT-T, and RM at farm 1 (Figure 3b). The total N2O emission did not significantly differ between RT and RM at this farm (Figure 3c). As at farm 2, the mean N2O flux rate was significantly higher for RT-R than RM; whereas RT-T presented less N2O emissions than RM. The total N2O emission also did not significantly differ between RT and RM at this farm (Figure 3d).
Figure 2. Dynamics of (a) CH4 and (b) N2O fluxes from rice–soft-shell turtle (RT) and rice monoculture (RM) at farm 1 and farm 2. RT-R: rice-cultivated area of RT, RT-T: turtle culture area of RT.
Agronomy 16 01451 g002
Figure 3. The (a,b) average and (c,d) cumulative CH4 and N2O emissions from rice–soft-shell turtle (RT) and rice monoculture (RM) at farm 1 and farm 2. RT-R: rice-cultivated area of RT, RT-T: turtle culture area of RT. The total CH4 and N2O emissions of the RT system was calculated as the weighted sum of emissions from the rice-cultivated area and the turtle culture area, with weights of 0.9 and 0.1 for farm 1, and 0.92 and 0.08 for farm 2, respectively, based on their respective area proportions. The error bars represent the standard error (n = 3); Different lowercase letters indicate significant differences between different treatments (p < 0.05).
Agronomy 16 01451 g003

3.3. Parameters Related to CH4 and N2O Emissions

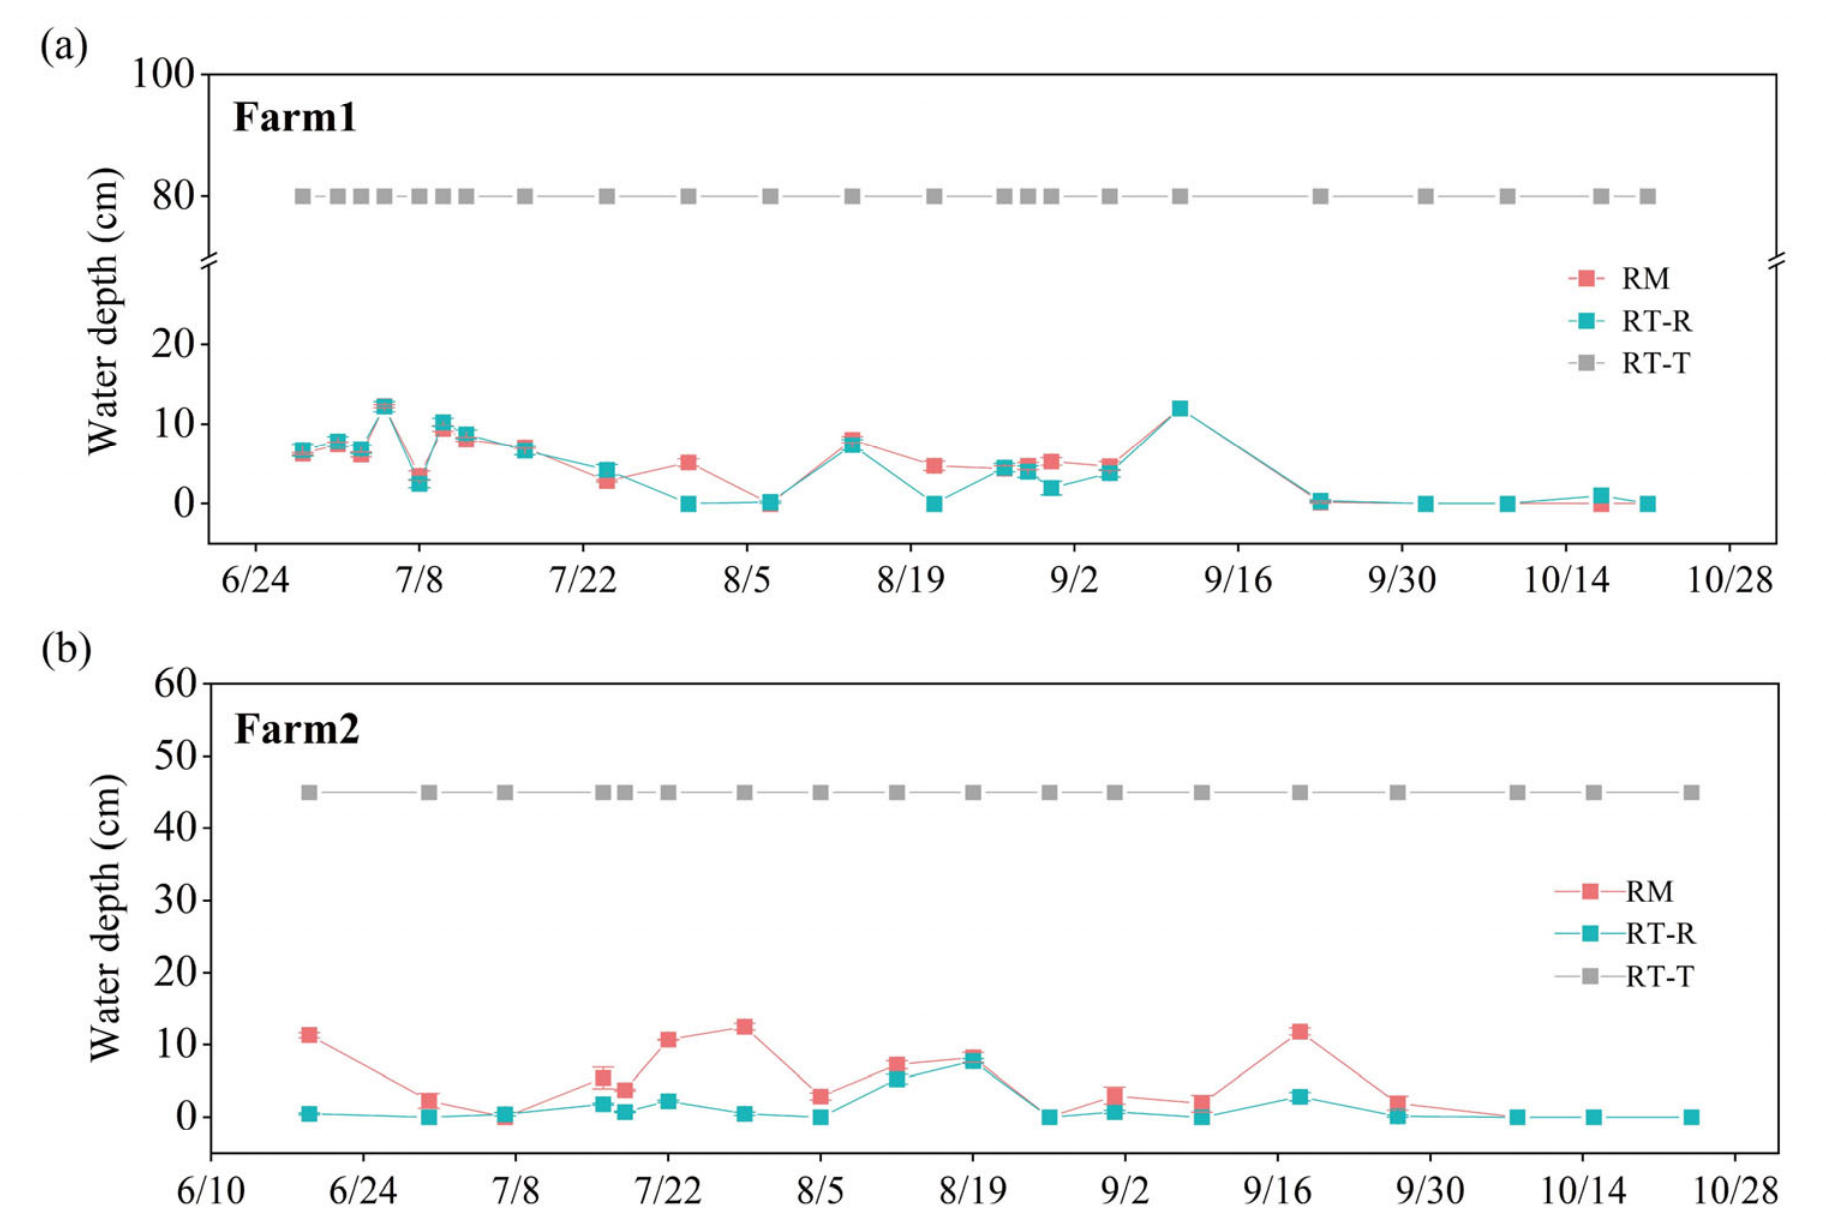
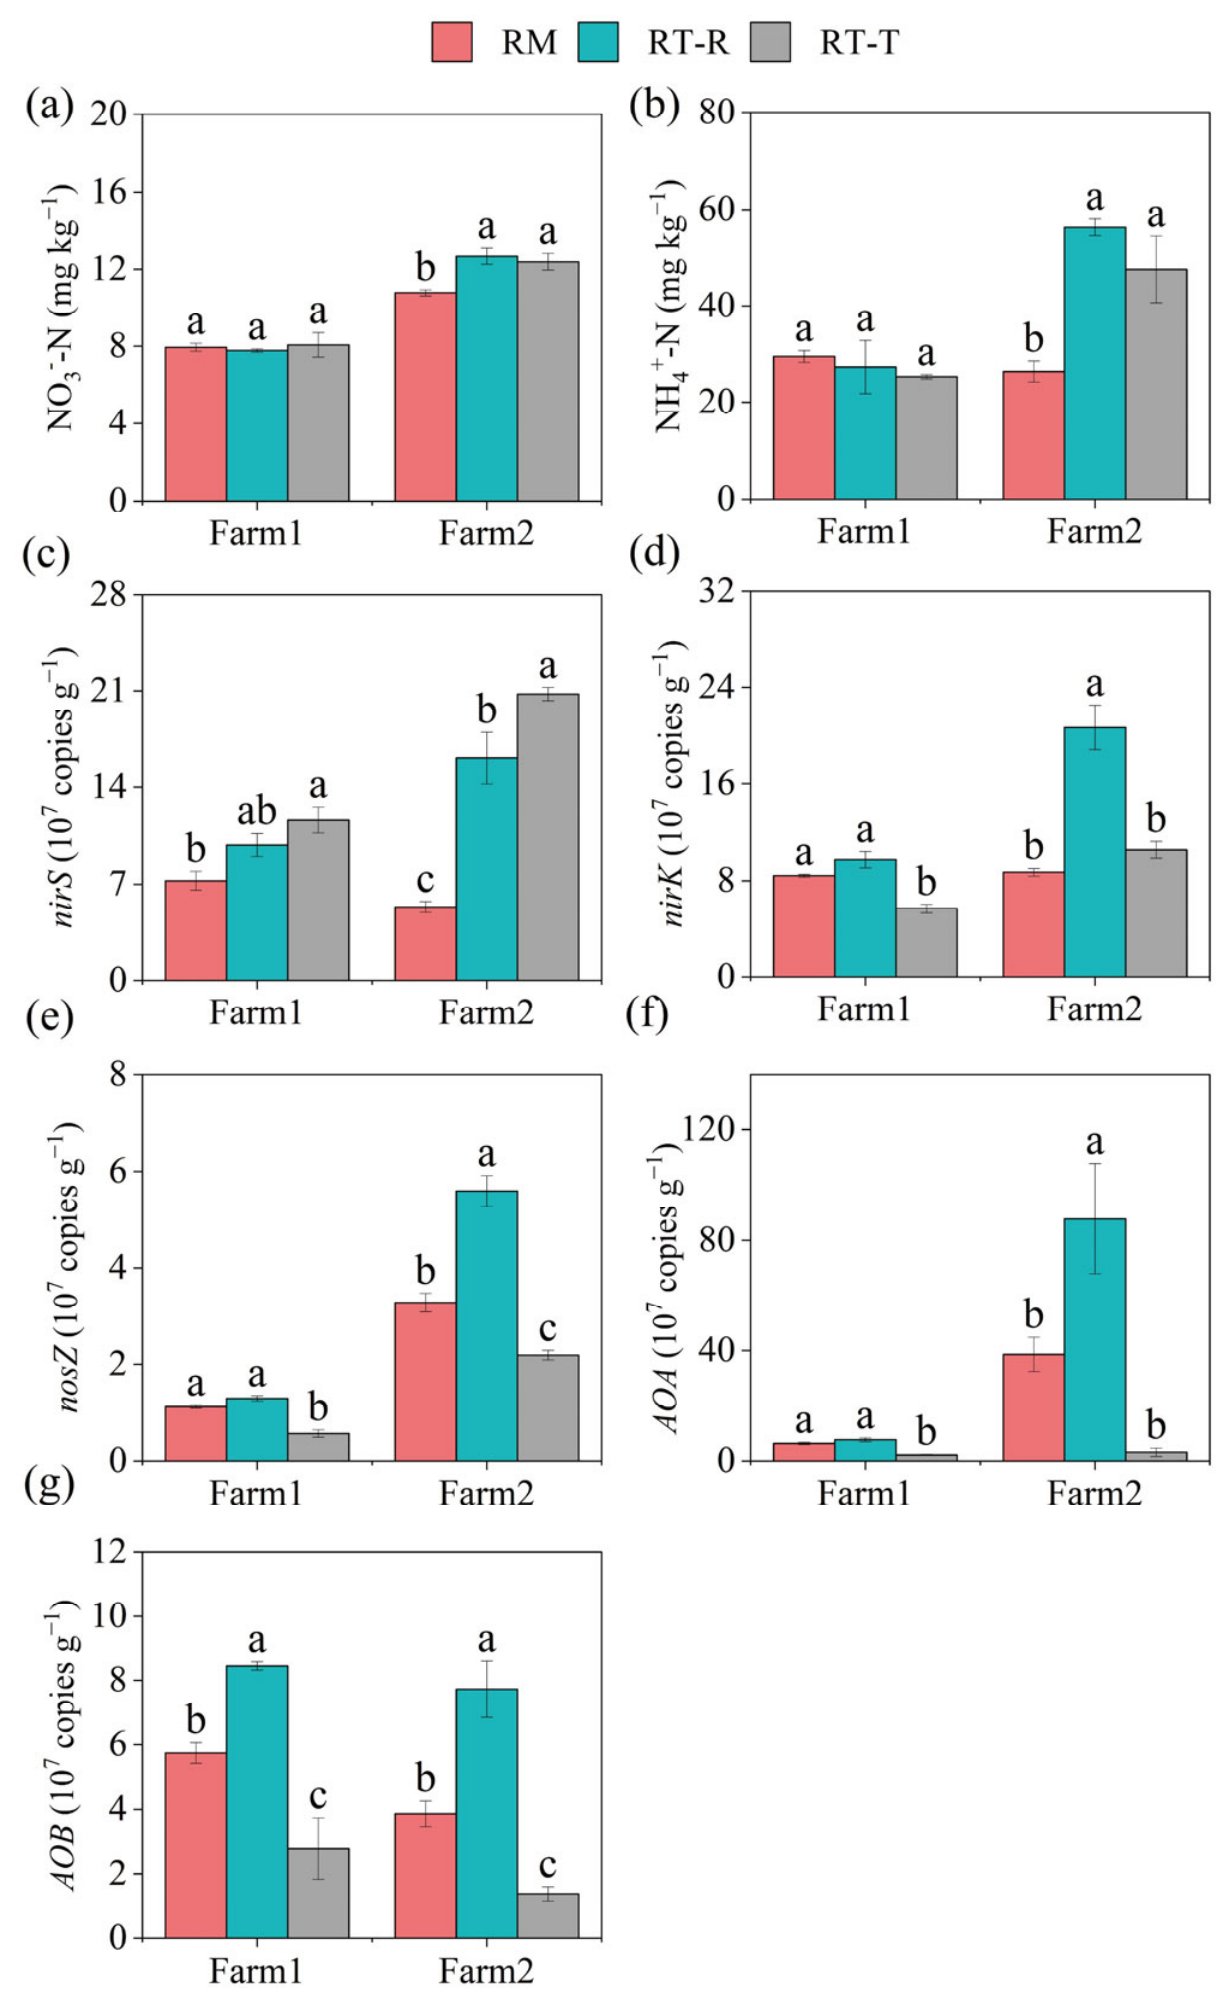
We further analyzed the main parameters related to CH4 and N2O emissions, including water depth, available carbon and nitrogen, and related functional genes in the soil (Figure 4, Figure 5 and Figure 6). The turtle culture area (RT-T) of the RT system kept a continuous flooding condition, and the water depth of RT-T in the two farms was far higher than that of RM (Figure 4). The water depth of the rice cultivated area (RT-R) was similar to that of RM at farm 1 but lower than that of RM at farm 2. RT-R in farm 2 showed less water flooding than RM.
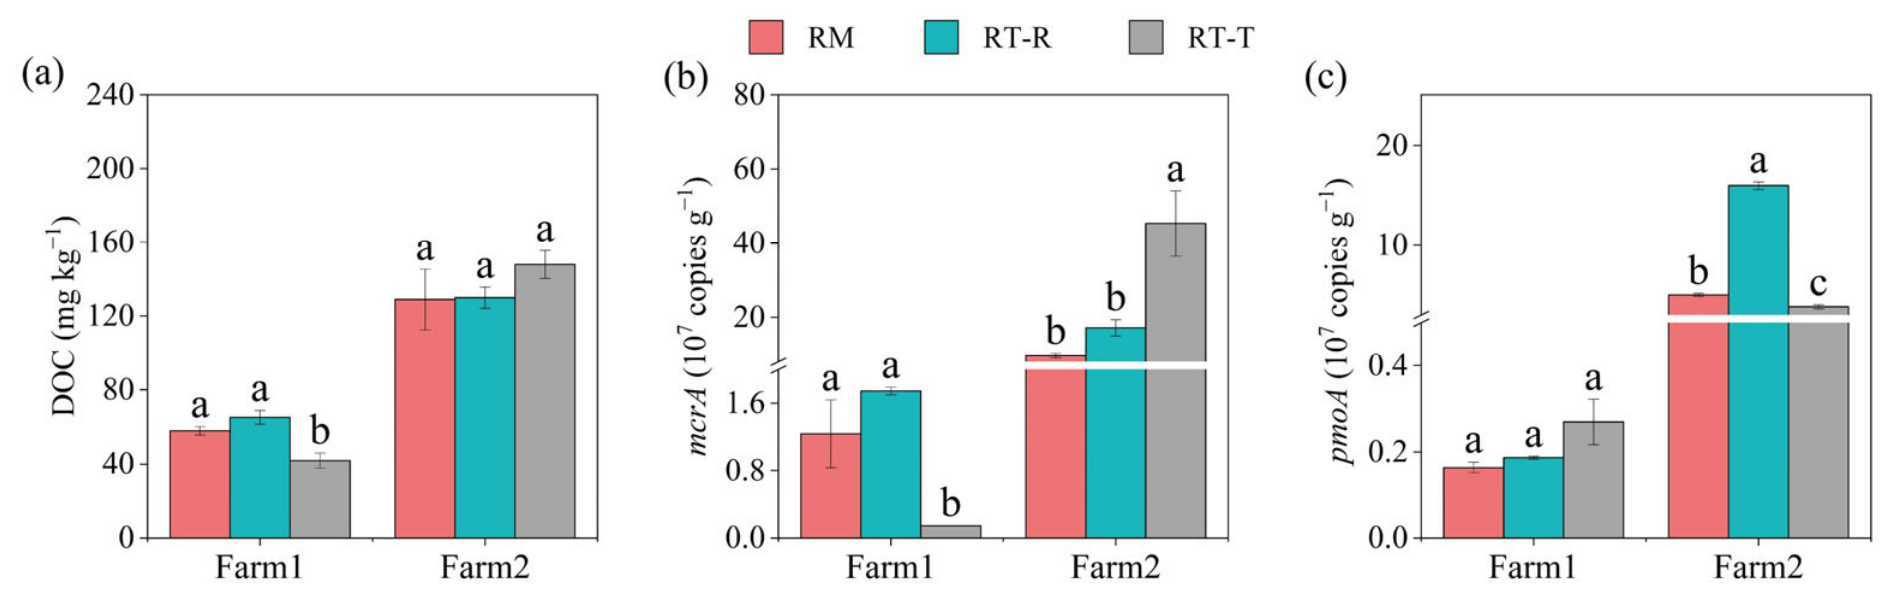
The contents of available carbon and functional genes related to CH4 emissions in the soil were presented in Figure 5. RT-T presented significantly lower content of DOC and abundance of methanogens (mcrA) than RM at farm 1 (Figure 5a,b), which may be the main reason for less CH4 emissions from RT-T than RM at this farm. RT-R presented a higher abundance of methanotrophic bacteria (pmoA) than RM at farm 2.
As shown in Figure 6, RT-T presented significantly higher contents of NO3-N and NH4+-N and higher abundance of five functional genes related to nitrification and denitrification processes than RM at farm 2 (Figure 6b,c). This was consistent with the results that RT-T presented higher N2O emissions than RM at this farm (Figure 3b).

3.4. Indirect and Total GHG Emissions

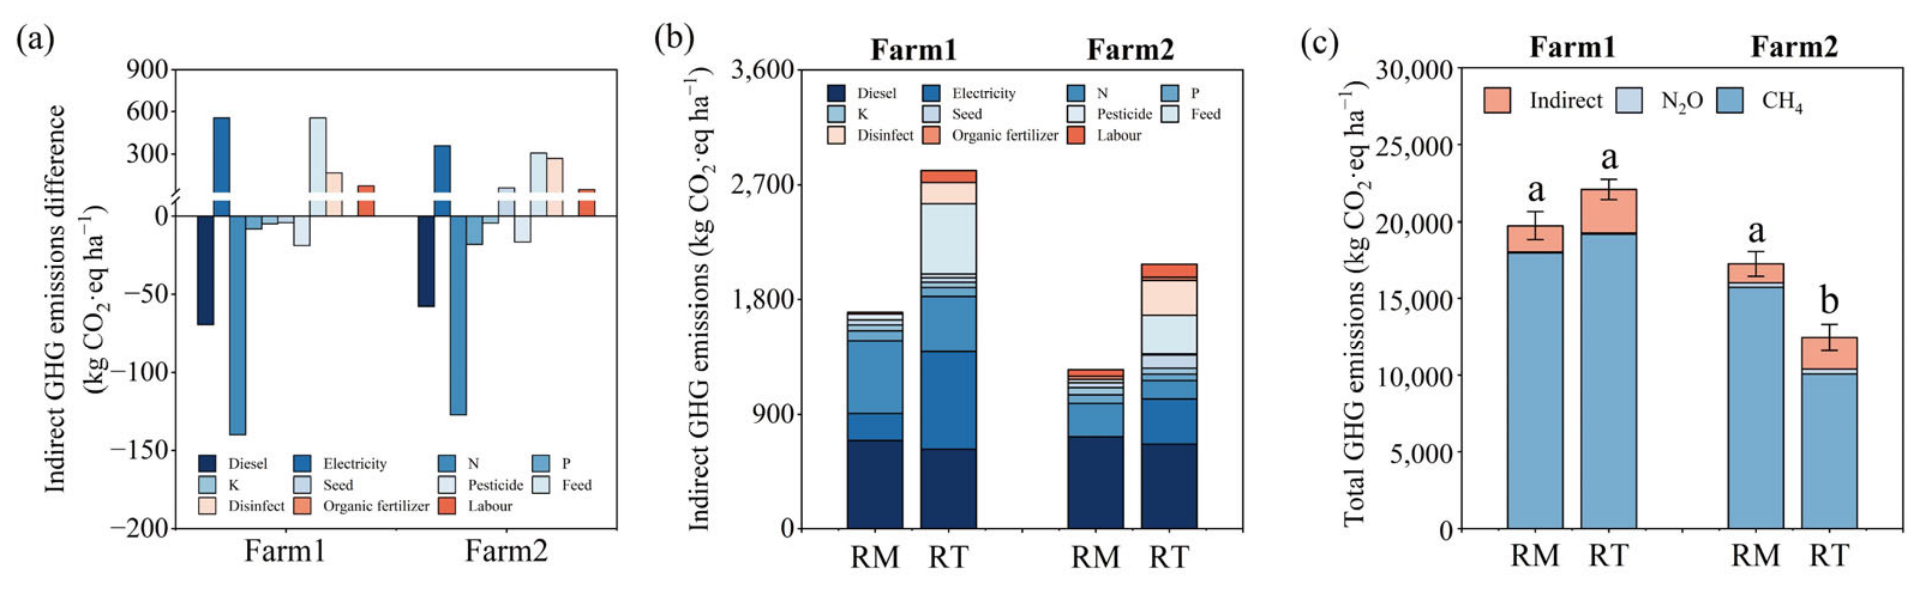
RT reduced the indirect GHG emissions originating from the chemical fertilizer and pesticide (Figure 7a) but increased the indirect GHG emissions originating from feed, disinfectant, and electricity used for irrigation, which were primarily used for turtle cultivation. The total indirect GHG emissions increased 65.0% and 66.4% by RT compared to RM respectively at farm 1 and 2 (Figure 7b), whereas the indirect GHG emissions only contributed 7.2–16.9% to the total GHG emissions in the RM and RT treatments at the two farms. The total GHG emissions, including direct and indirect emissions, were significantly reduced 27.7% by RT compared to RM in farm 2, but did not show a significant difference between RT and RM in farm 1 (Figure 7c).

3.5. GHG Emission Intensity

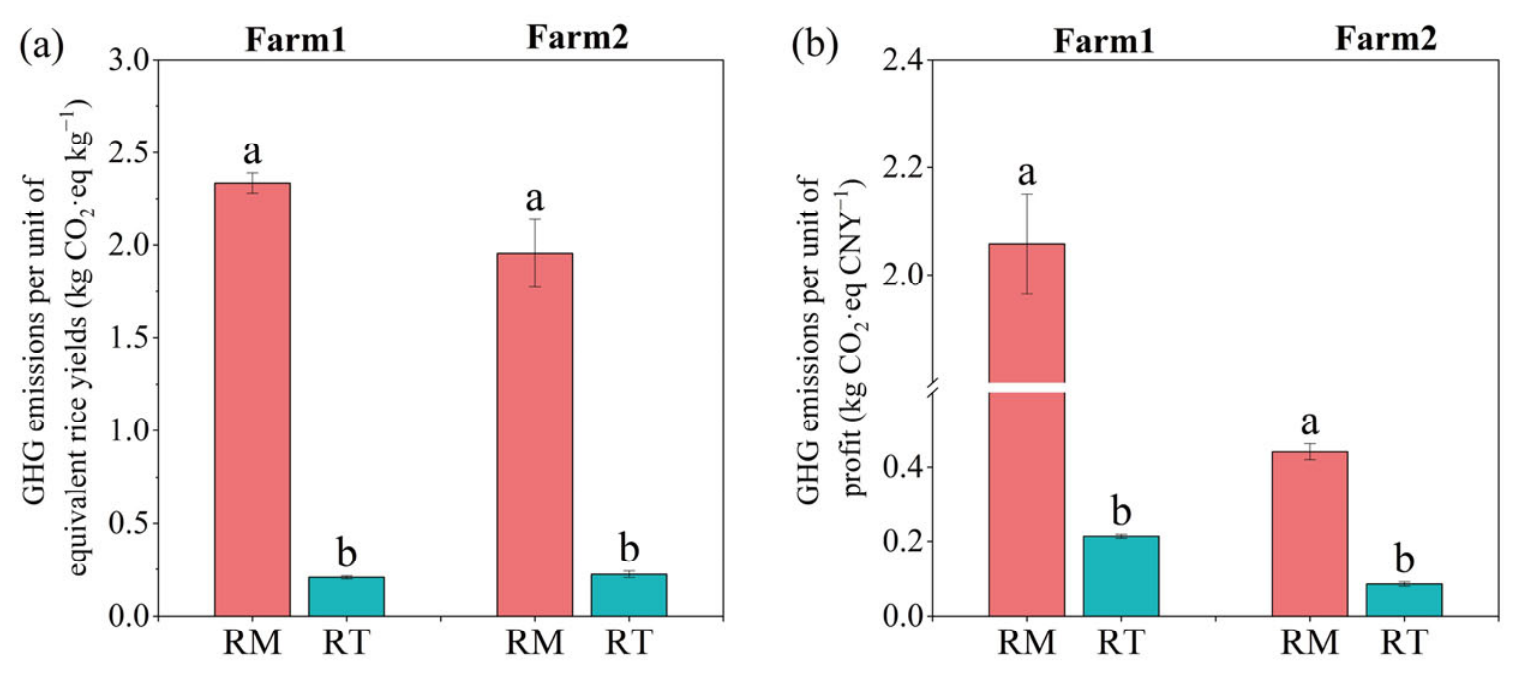
We further evaluated the GHG emission intensity per unit outputs, including equivalent yield and economic benefit (Figure 8). The GHG emission per unit equivalent yield and net profit were respectively reduced 91.15% and 89.60% by RT compared to RM at farm 1 and were respectively reduced 88.58% and 80.65% by RT compared to RM at farm 2.

4. Discussion

4.1. Impact of Rice–Soft-Shell Turtle Co-Culture on Food Productivity

The results of this study showed that RT increased the net profit over two times as compared with RM at two farms (Figure 1). This economic advantage substantially exceeds the profitability documented in other co-culture systems, such as rice–crayfish (+197%) and rice–fish (+98%), based on previously published meta-analyses [8]. Similar to most co-culture systems conducted in rice fields, RT decreased rice production costs, primarily through the combined effects of decreased fertilizer and pesticide use. Our results found RT decreased pesticide and chemical fertilizer costs by 7.5–15.7% and 23.0–70.0%, respectively (Figure S3). These reductions can be attributed to the ecological functions of soft-shell turtles, which effectively control pests, diseases, and weeds through their foraging activities, which is consistent with findings that aquatic animals can reduce rice plant hopper populations by 26% and significantly lower pest incidence [36]. At the same time, nutritional compensation through the residues and excretions of soft-shell turtles increased soil C, N, and P concentrations [37]. In addition, another advantage comes from the high market value of soft-shell turtles themselves. As a traditional tonic food, the price of soft-shell turtles is much higher than rice and traditional aquatic products. Therefore, despite higher initial investments, the return on investment for rice–soft-shell turtle co-culture significantly exceeds that of traditional agricultural models. Moreover, our results indicated a decrease in rice yield for RT in farm 2. This difference stems from the varietal selection: RT typically uses traditional Japonica varieties, which are valued for their quality to integrated farming [38], while RM often prioritizes high-yield hybrid cultivars to maximize grain output.

4.2. Impact of Rice–Soft-Shell Turtle Co-Culture on GHG Emissions

Water flooding condition was an important factor influencing CH4 emissions from rice fields and aquatic systems [39,40,41]. Previous studies reported that reducing water flooding was beneficial to mitigate CH4 emissions from rice fields [42,43]. The results of this study showed that the rice cultivated area (RT-R) of the RT system showed significantly lower CH4 emission than RM at farm 2 (Figure 3a). This may be mainly associated with the differences in field water management between the two modes. RT-R in farm 2 showed less water flooding than RM (Figure 4b), which might have enhanced the CH4 oxidation. This was indirectly supported by the significantly higher abundance of methanotrophic bacteria (pmoA) in the soil of RT-R than RM at farm 2 (Figure 5c). However, the soil oxidation status requires Eh and DO for further direct validation. The turtle culture area (RT-T) of the RT system at the two experiment farms both presented significantly lower CH4 emissions than RM (Figure 3a), which was possibly attributed to their far higher water flooding depth than RM. Indeed, continuous flooding provided a favorite habitat for CH4 production, whereas high water depth also inhibited the diffusion of CH4 from the flooding soil into the atmosphere [40,44]. Therefore, we speculated that persistent deep flooding in the turtle culture area was one possible reason for less CH4 emissions from this area. Additionally, RT-T at farm 1 presented significantly lower content of DOC and lower abundance of methanogens (mcrA) than RM. This might also be another reason for its relatively low CH4 emission [45,46].
The RT system significantly decreased indirect GHG emissions associated with the application of chemical fertilizers and pesticides (Figure 7a). This reduction can be attributed to the effects of decreased fertilizer and pesticide use. However, RT increased indirect emissions from labor and electricity consumption. Despite this net increase in indirect emissions, their contribution to the total GHG emissions remained minor (2.9–22.9%). Therefore, the total GHG emissions of the RT system decreased significantly, primarily driven by the reduction in direct CH4 emissions per unit of land area.
Increasing studies have suggested that a comprehensive assessment of agricultural GHG emissions must extend beyond emissions per unit area to include carbon intensity per unit food yields and net profit [47,48,49]. Our results showed that RT gained far higher food yields and economic benefits with less or similar GHG emission and greatly reduced the GHG emissions per unit of food yields and net profit (Figure 8), which was consistent with the results of rice–fish or rice–crayfish co-culture systems reported in previous studies [50,51,52]. Rice–soft-shell turtle co-culture system holds considerable potential for reducing the overall carbon footprint of rice production.

4.3. Limitations of This Study

The impact of a rice–aquatic animals co-culture system on CH4 and N2O emissions from rice fields may be affected by various co-culture options, e.g., water management, feed application, stocking density, and the bio-disturbance of animals in rice fields [53,54,55,56]. This study mainly compared the emission patterns of CH4 and N2O from the rice-turtle co-culture and rice monoculture systems and analyzed the potential influencing factors based on limited parameters measured at two farms. Future studies could focus on exploring the effect of these co-culture options on CH4 and N2O emissions from rice fields based on controlled field trials and gain a deep insight into the mechanisms of how rice–turtle co-culture regulates the production and diffusion processes of CH4 and N2O.

5. Conclusions

Rice–soft-shell turtle co-culture (RT) significantly increased net profit compared to rice monoculture (RM) at both farms, despite no improvement in rice yield. RT did not significantly affect direct CH4 emissions at farm 1 but reduced them at farm 2, primarily related to less water flooding and a higher abundance of pmoA. N2O emissions were not significantly altered by RT at either farm. External inputs (feed, electricity and disinfectants) are the main contributors to indirect GHG emissions for RT at both farms, but increased GHG emissions can be offset by the reduction of direct CH4 emissions in the field. Importantly, RT consistently lowered the GHG emission intensity per unit equivalent yields and net profit at both farms, indicating that the system can improve economic returns while mitigating environmental impact.

Supplementary Materials

The following supporting information can be downloaded at: https://www.mdpi.com/article/10.3390/agronomy16151451/s1, Figure S1. Dynamics of local meteorological indicators (daily mean temperature and precipitation) during the experimental period in farm 1 (a) and farm 2 (b); Figure S2. On-site pictures of the experimental and investigation farms of the rice–soft-shell turtle coculture model in the Yangtze River Delta region; Figure S3. Comparison of the cost input of pesticides (a) and chemical fertilizers (b) between rice monoculture (RM) and rice–soft-shell turtle (RT) co-culture systems in the experiment farms; Table S1: Soil parameters of the rice–soft-shell turtle coculture (RT) and the rice monoculture (RM) in the experimental farms; Table S2. The co-culture duration years and rice variety of experiment farms; Table S3. Rice and turtle yields and selling prices on the two experimental farms. Table S4. Composition of cost input and revenue per hectare of different production systems; Table S5. Life cycle inventory of agricultural inputs of different production systems; Table S6. The GHG emission coefficients of different agricultural material inputs; Table S7. Primers information for qPCR and high-throughput sequencing [27,57,58,59,60,61,62,63,64,65,66,67,68,69].

Author Contributions

Writing—original draft preparation, X.W. and T.B.; validation, X.W., M.W. and C.X.; data curation, F.L., T.B. and M.W.; formal analysis, X.W. and K.C.; investigation, X.W. and F.L.; software, K.C. and C.X.; conceptualization, J.F.; writing—review and editing, J.F. and F.F.; funding acquisition, J.F. and F.F. All authors have read and agreed to the published version of the manuscript.

Funding

This research was funded by the Central Public-interest Scientific Institution Basal Research Fund-CNRRI (No.8), “Pioneer” and “Leading Goose” R&D Program of Zhejiang (2024C02001), Agricultural Science and Technology Innovation Program (ASTIP), and Chinese Agrosystem Long-Term Observation Network (CALTON-FY).

Data Availability Statement

Data will be made available on request.

Acknowledgments

Thanks to all the farmers surveyed for sharing their field record data.

Conflicts of Interest

The authors declare no conflicts of interest.

References

  1. Costello, C.; Cao, L.; Gelcich, S.; Cisneros-Mata, M.Á.; Free, C.M.; Froehlich, H.E.; Golden, C.D.; Ishimura, G.; Maier, J.; Macadam-Somer, I.; et al. The future of food from the sea. Nature 2020, 588, 95–100. [Google Scholar] [CrossRef] [PubMed]
  2. FAO. The State of World Fisheries and Aquaculture; FAO: Rome, Italy, 2020. [Google Scholar]
  3. Prosekov, A.Y.; Ivanova, S.A. Food security: The challenge of the present. Geoforum 2018, 91, 73–77. [Google Scholar] [CrossRef]
  4. Roe, S.; Streck, C.; Obersteiner, M.; Frank, S.; Griscom, B.; Drouet, L.; Fricko, O.; Gusti, M.; Harris, N.; Hasegawa, T.; et al. Contribution of the land sector to a 1.5 °C world. Nat. Clim. Change 2019, 9, 817–828. [Google Scholar] [CrossRef]
  5. Naylor, R.; Burke, M. Aquaculture and ocean resources: Raising tigers of the sea. Annu. Rev. Environ. Resour. 2005, 30, 185–218. [Google Scholar] [CrossRef]
  6. Klinger, D.; Naylor, R. Searching for solutions in aquaculture: Charting a sustainable course. Annu. Rev. Environ. Resour. 2012, 37, 247–276. [Google Scholar] [CrossRef]
  7. Ahmed, N.; Turchini, G.M. The evolution of the blue-green revolution of rice–fish cultivation for sustainable food production. Sustain. Sci. 2021, 16, 1375–1390. [Google Scholar] [CrossRef]
  8. Cui, J.; Liu, H.; Wang, H.; Wu, S.; Bashir, M.A.; Reis, S.; Sun, Q.; Xu, J.; Gu, B. Rice-animal co-culture systems benefit global sustainable intensification. Earth’s Future 2023, 11, e2022EF002984. [Google Scholar] [CrossRef]
  9. Mirhaj, M.; Boit, A.; Razzak, M.A.; Wahab, M.A. Yield performance comparison between cultures of rice cum prawn (Macrobrachium rosenbergii) and rice cum fish (Cyprinus carpio, Oreochromis niloticus) in North-Eastern Bangladesh. Aquaculture 2013, 392–395, 26–33. [Google Scholar] [CrossRef]
  10. Yan, Y.; Liu, M.; Yang, D.; Zhang, W.; An, H.; Wang, Y.; Xie, H.; Zhang, X. Effect of different rice-crab coculture modes on soil carbohydrates. J. Integr. Agric. 2014, 13, 641–647. [Google Scholar] [CrossRef]
  11. Souty-Grosset, C.; Anastácio, P.M.; Aquiloni, L.; Banha, F.; Choquer, J.; Chucholl, C.; Tricarico, E. The red swamp crayfish Procambarus clarkii in Europe: Impacts on aquatic ecosystems and human well-being. Limnologica 2016, 58, 78–93. [Google Scholar] [CrossRef]
  12. Zhang, J.; Hu, L.; Ren, W.; Guo, L.; Tang, J.; Shu, M.; Chen, X. Rice-soft shell turtle coculture effects on yield and its environment. Agric. Ecosyst. Environ. 2016, 224, 116–122. [Google Scholar] [CrossRef]
  13. Sha, Z.; Chu, Q.; Zhao, Z.; Yue, Y.; Lu, L.; Yuan, J.; Cao, L. Variations in nutrient and trace element composition of rice in an organic rice-frog coculture system. Sci. Rep. 2017, 7, 15706. [Google Scholar] [CrossRef] [PubMed]
  14. Chen, T.; Chang, H.; Lue, K. Unregulated Trade in Turtle Shells for Chinese Traditional Medicine in East and Southeast Asia: The Case of Taiwan. Chelonian Conserv. Biol. 2009, 8, 11–18. [Google Scholar] [CrossRef]
  15. Li, X.; Li, J.; Wang, Y.; Fu, L.; Fu, Y.; Li, B.; Jiao, B. Aquaculture industry in China: Current state, challenges, and outlook. Rev. Fish. Sci. 2011, 19, 187–200. [Google Scholar] [CrossRef]
  16. Yu, X.; Hao, X.; Dang, Z.; Yang, L. China rice–fish comprehensive breeding industry development report (2023). China Fish. 2023, 8, 19–26. [Google Scholar]
  17. Zhao, J. Ecological Effects and Mechanisms of the Integrated Rice–Soft-Shell Turtle Farming System. Ph.D. Thesis, Zhejiang University, Hangzhou, China, 2018. [Google Scholar]
  18. Bhattacharyya, P.; Sinhababu, D.P.; Roy, K.S.; Dash, P.K.; Sahu, P.K.; Dandapat, R.; Neogi, S.; Mohanty, S. Effect of fish species on methane and nitrous oxide emission in relation to soil C, N pools and enzymatic activities in minted shallow lowland rice–fish farming system. Agric. Ecosyst. Environ. 2013, 176, 53–62. [Google Scholar] [CrossRef]
  19. Sun, G.; Sun, M.; Du, L.; Zhang, Z.; Wang, Z.; Zhang, G.; Xu, H.; Wang, H. Ecological rice-cropping systems mitigate global warming—A meta-analysis. Sci. Total Environ. 2021, 789, 147900. [Google Scholar] [CrossRef] [PubMed]
  20. Wang, H.; Guan, D.; Zhang, R.; Chen, Y.; Hu, Y.; Xiao, L. Nitrous oxide emissions in Chinese vegetable systems: A meta-analysis. Environ. Pollut. 2018, 239, 375–383. [Google Scholar] [CrossRef] [PubMed]
  21. Conrad, R. Microbial ecology of methanogens and methanotrophs. Adv. Agron. 2007, 96, 1–63. [Google Scholar] [CrossRef]
  22. Lu, Y.; Wassmann, R.; Neue, H.U.; Huang, C.; Bueno, C.S. Methanogenic responses to exogenous substrates in anaerobic rice soils. Soil Biol. Biochem. 2000, 32, 1683–1690. [Google Scholar] [CrossRef]
  23. Wu, L.; Ma, K.; Lu, Y. Rice roots select for type I methanotrophs in rice field soil. Syst. Appl. Microbiol. 2009, 32, 421–428. [Google Scholar] [CrossRef] [PubMed]
  24. Qian, H.; Zhu, X.; Huang, S.; Linquist, B.; Kuzyakov, Y.; Wassmann, R.; Minamikawa, K.; Martinez-Eixarch, M.; Yan, X.; Zhou, F.; et al. Greenhouse gas emissions and mitigation in rice agriculture. Nat. Rev. Earth Environ. 2023, 4, 716–732. [Google Scholar] [CrossRef]
  25. Richardson, A.E.; Barea, J.; McNeill, A.M.; Prigent-Combaret, C. Acquisition of phosphorus and nitrogen in the rhizosphere and plant growth promotion by microorganisms. Plant Soil 2009, 321, 305–339. [Google Scholar] [CrossRef]
  26. Signor, D.; Cerri, C.E.P. Nitrous oxide emissions in agricultural soils: A review. Pesqui. Agropecuária Trop. 2013, 43, 322–338. [Google Scholar] [CrossRef]
  27. Francis, C.A.; Roberts, K.J.; Beman, J.M.; Santoro, A.E.; Oakley, B.B. Ubiquity and diversity of ammonia-oxidizing archaea in water columns and sediments of the ocean. Proc. Natl. Acad. Sci. USA 2005, 102, 14683–14688. [Google Scholar] [CrossRef] [PubMed]
  28. Jia, Z.; Conrad, R. Bacteria rather than Archaea dominate microbial ammonia oxidation in an agricultural soil. Environ. Microbiol. 2009, 11, 1658–1671. [Google Scholar] [CrossRef] [PubMed]
  29. Xing, X.; Tang, Y.; Xu, H.; Qin, H.; Liu, Y.; Zhang, W.; Chen, A.; Zhu, B. Warming shapes nirS- and nosZ-type denitrifier communities and stimulates N2O emission in acidic paddy soil. Appl. Environ. Microb. 2021, 87, e0296520. [Google Scholar] [CrossRef] [PubMed]
  30. Qin, H.; Wang, D.; Xing, X.; Tang, Y.; Wei, X.; Chen, X.; Zhang, W.; Chen, A.; Li, L.; Liu, Y.; et al. A few key nirK- and nosZ-denitrifier taxa play a dominant role in moisture-enhanced N2O emissions in acidic paddy soil. Geoderma 2021, 385, 114917. [Google Scholar] [CrossRef]
  31. Liu, S.; Hu, Z.; Wu, S.; Li, S.; Li, Z.; Zou, J. Methane and nitrous oxide emissions reduced following conversion of rice paddies to inland crab–fish aquaculture in southeast China. Environ. Sci. Technol. 2016, 50, 633–642. [Google Scholar] [CrossRef] [PubMed]
  32. Kim, G.W.; Gutierrez-Suson, J.; Kim, P.J. Optimum N rate for grain yield coincides with minimum greenhouse gas intensity in flooded rice fields. Field Crops Res. 2019, 237, 23–31. [Google Scholar] [CrossRef]
  33. Ling, L.; Shuai, Y.; Xu, Y.; Zhang, Z.; Wang, B.; Liangzhi, Y.; Sun, Z.; Zhang, H.; Zhan, M.; Li, C.; et al. Comparing rice production systems in China: Economic output and carbon footprint. Sci. Total Environ. 2021, 791, 147890. [Google Scholar] [CrossRef]
  34. IPCC. Climate Change 2021: The Physical Science Basis; Cambridge University Press: Cambridge, UK; New York, NY, USA, 2021. [Google Scholar] [CrossRef]
  35. Lu, R. Analysis Method of Soil Agricultural Chemistry; China Agricultural Science and Technology Press: Beijing, China, 2000. [Google Scholar]
  36. Xie, J.; Hu, L.; Tang, J.; Wu, X.; Li, N.; Yuan, Y.; Yang, H.; Zhang, J.; Luo, S.; Chen, X. Ecological mechanisms underlying the sustainability of the agricultural heritage rice–fish coculture system. Proc. Natl. Acad. Sci. USA 2011, 108, E1381–E1387. [Google Scholar] [CrossRef] [PubMed]
  37. Du, L.; Wang, H.; Zhang, Z.; Zhou, Y.; Xiao, Z.; Shaaban, M.; Núñez-Delgado, A.; Sun, G.; Yu, Y.; Xiao, Z.; et al. Effects of long-term rice–crayfish farming on soil CNP storage and stoichiometry. Soil Tillage Res. 2024, 235, 105882. [Google Scholar] [CrossRef]
  38. Li, W.; He, Z.; Wu, L.; Liu, S.; Luo, L.; Ye, X.; Gao, H.; Ma, C. Impacts of co-culture of rice and aquatic animals on rice yield and quality: A meta-analysis of field trials. Field Crops Res. 2022, 280, 108468. [Google Scholar] [CrossRef]
  39. Bednarík, A.; Bodmer, P.; Darenova, E.; Kokrda, L.; Pavelka, M. Temperature, water depth, and flow velocity are important drivers of methane ebullition in a temperate lowland stream. J. Geophys. Res. Biogeosci. 2024, 129, e2023JG007597. [Google Scholar] [CrossRef]
  40. Min, Y.E.; Gao, Q.; Wang, Y.; Yu, X.F.; Tong, L.; Su, P.C.; Bian, H.F. Flooding lowers the emissions of CO2 and CH4 during the freeze-thaw process in a lacustrine wetland. Catena 2023, 227, 107132. [Google Scholar] [CrossRef]
  41. Minamikawa, K. Climate-smart water management in rice paddies: A meta-synthesis on greenhouse gas emissions and yield impacts. Paddy Water Environ. 2025, 23, 525–532. [Google Scholar] [CrossRef]
  42. Du, S.; Chen, P.; Lin, G.; Zhang, Z.; Song, J.; Guan, S.; Han, Y.; Deng, M.; Liu, M.; Qi, Z.; et al. Controlled irrigation and straw-decomposing microbial inoculant mitigate CH4 emissions and increase rice yield in straw return mollisols of paddy fields. Agric. Water Manag. 2026, 327, 110269. [Google Scholar] [CrossRef]
  43. Jiang, Y.; Carrijo, D.; Huang, S.; Chen, J.; Balaine, N.; Zhang, W.; van Groenigen, K.J.; Linquist, B. Water management to mitigate the global warming potential of rice systems: A global meta-analysis. Field Crops Res. 2019, 234, 47–54. [Google Scholar] [CrossRef]
  44. Zhong, J.; Yang, F.; Zhang, M.; Sun, C.; Wang, S.; Chen, Q.; Wang, H.; Zhang, L. Water depth and productivity regulate methane (CH4) emissions from temperate cascade reservoirs in northern China. J. Hydrol. 2023, 626, 130170. [Google Scholar] [CrossRef]
  45. He, Z.; Hou, Y.; Li, Y.; Bei, Q.; Li, X.; Zhu, Y.-G.; Liesack, W.; Rillig, M.C.; Peng, J. Increased methane production associated with community shifts towards Methanocella in paddy soils with the presence of nanoplastics. Microbiome 2024, 12, 259. [Google Scholar] [CrossRef] [PubMed]
  46. Dai, Y.; Cao, J.; Li, H.; Hu, J.; Liu, G.; Su, R.; Wu, X.; Wang, Y.; Hu, R. Methane emissions from rice paddies are regulated by carbon availability and soil pH along a mean annual temperature gradient. Sci. Rep. 2026, 16, 14129. [Google Scholar] [CrossRef] [PubMed]
  47. Du, C.; Hu, L.; Yuan, S.; Xu, L.; Wang, W.; Cui, K.; Peng, S.; Huang, J. Ratoon rice-duck co-culture maintains rice grain yield and decreases greenhouse gas emissions in central China. Eur. J. Agron. 2023, 149, 126911. [Google Scholar] [CrossRef]
  48. Fang, K.; Gao, H.; Sha, Z.; Dai, W.; Yi, X.; Chen, H.; Cao, L. Mitigating global warming potential with increase net ecosystem economic budget by integrated rice-frog farming in eastern China. Agric. Ecosyst. Environ. 2021, 308, 107235. [Google Scholar] [CrossRef]
  49. Sun, Z.; Guo, Y.; Li, C.; Cao, C.; Yuan, P.; Zou, F.; Wang, J.; Jia, P.; Wang, J. Effects of straw returning and feeding on greenhouse gas emissions from integrated rice-crayfish farming in Jianghan Plain, China. Environ. Sci. Pollut. Res. 2019, 26, 11710–11718. [Google Scholar] [CrossRef] [PubMed]
  50. Jiang, R.; Xu, Q.; Li, J.; Dai, L.; Ao, D.; Dou, Z.; Gao, H. Sensitivity and uncertainty analysis of carbon footprint evaluation: A case study of rice–crayfish coculture in China. Chin. J. Eco-Agric. 2022, 30, 1577–1587. [Google Scholar]
  51. Wang, R.; Feng, L.; Xu, Q.; Jiang, L.; Liu, Y.; Xia, L.; Zhu, Y.; Liu, B.; Zhuang, M.; Yang, Y. Sustainable Blue Foods from Rice−Animal Coculture Systems. Environ. Sci. Technol. 2024, 58, 5310–5324. [Google Scholar] [CrossRef] [PubMed]
  52. Zou, Z.; Chu, K.; Wang, M.; Guo, S. Carbon footprint assessment and economic benefits of rice–fish/poultry co-culture in China. J. Clean. Prod. 2025, 527, 146651. [Google Scholar] [CrossRef]
  53. An, Z.; Gao, D.; Chen, F.; Wu, L.; Zhou, J.; Zhang, Z.; Dong, H.; Yin, G.; Han, P.; Liang, X.; et al. Crab bioturbation alters nitrogen cycling and promotes nitrous oxide emission in intertidal wetlands: Influence and microbial mechanism. Sci. Total Environ. 2021, 797, 149176. [Google Scholar] [CrossRef] [PubMed]
  54. Guo, L.; Lin, W.; Cao, C.; Li, C. Integrated rice-crayfish farming system does not mitigate the global warming potential during rice season. Sci. Total Environ. 2023, 867, 161520. [Google Scholar] [CrossRef] [PubMed]
  55. Luo, J.; Qian, K.; Xu, B.; Li, H.; Liu, S.; Xiong, Q.; Li, S.; Sun, R.; Zhang, C.; Ye, X. Effects of lobster species and breeding density on CH4 and N2O emissions under rice shrimp co-cropping. J. Agro-Environ. Sci. 2023, 42, 1852–1859. [Google Scholar]
  56. Xu, Y.; Li, H.; Wang, H.; Du, X.; Bashir, M.A.; Zhang, X.; Sun, W.; An, M.; Liu, H. Optimizing nitrogen fertilizer application for synergistic enhancement of economic and ecological benefits in rice-crab co-culture systems. Agronomy 2024, 14, 2219. [Google Scholar] [CrossRef]
  57. Wernet, G.; Bauer, C.; Steubing, B.; Reinhard, J.; Moreno-Ruiz, E.; Weidema, B. The ecoinvent database version 3 (part I): Overview and methodology. Int. J. Life Cycle Assess. 2016, 21, 1218–1230. [Google Scholar] [CrossRef]
  58. Chinese Life Cycle Database (CLCD). Available online: https://ghgprotocol.org/Third-Party-Databases/CLCD (accessed on 1 December 2025).
  59. Wu, F.; Ji, J.; Xu, H. Carbon footprint of shrimp pond aquaculture based on the LCA method. Chin. J. Manag. Sci. 2011, 668–672. [Google Scholar]
  60. Song, B.; Qin, H.; Ma, G. Analysis for dynamic changes of wastewater treatment plant carbon emissions in operation phase: With a wastewater treatment plant in Shenzhen as an example. Environ. Sci. Technol. 2015, 38, 204–209. [Google Scholar]
  61. Liu, X.; Xu, W.; Li, Z.; Chu, Q.; Yang, X.; Chen, F. The missteps, improvement and application of carbon footprint methodology in farmland ecosystems with the case study of analyzing the carbon efficiency of China’s intensive farming. Chin. J. Agric. Resour. Reg. Plan. 2014, 35, 1–7. [Google Scholar]
  62. Luton, P.E.; Wayne, J.M.; Sharp, R.J.; Riley, P.W. The mcrA gene as an alternative to 16S rRNA in the phylogenetic analysis of methanogen populations in landfill. Microbiology 2002, 148, 3521–3530. [Google Scholar] [CrossRef] [PubMed]
  63. Juottonen, H.; Galand, P.E.; Yrjälä, K. Detection of methanogenic Archaea in peat: Comparison of PCR primers targeting the mcrA gene. Res. Microbiol. 2006, 157, 914–921. [Google Scholar] [CrossRef] [PubMed]
  64. Holmes, A.J.; Costello, A.; Lidstrom, M.E.; Murrell, J.C. Evidence that participate methane monooxygenase and ammonia monooxygenase may be evolutionarily related. FEMS Microbiol. Lett. 1995, 132, 203–208. [Google Scholar] [CrossRef]
  65. Lin, J.; Joye, S.B.; Scholten, J.C.M.; Schäfer, H.; McDonald, I.R.; Murrell, J.C. Analysis of methane monooxygenase genes in mono lake suggests that increased methane oxidation activity may correlate with a change in methanotroph community structure. Appl. Environ. Microbiol. 2005, 71, 6458–6462. [Google Scholar] [CrossRef] [PubMed]
  66. Kandeler, E.; Deiglmayr, K.; Tscherko, D.; Bru, D.; Philippot, L. Abundance of narG, nirS, nirK, and nosZ genes of denitrifying bacteria during primary successions of a glacier foreland. Appl. Environ. Microbiol. 2006, 72, 5957–5962. [Google Scholar] [CrossRef] [PubMed]
  67. Braker, G.; Fesefeldt, A.; Witzel, K.P. Development of PCR primer systems for amplification of nitrite reductase genes (nirK and nirS) to detect denitrifying bacteria in environmental samples. Appl. Environ. Microbiol. 1998, 64, 3769–3775. [Google Scholar] [CrossRef] [PubMed]
  68. Henry, S.; Bru, D.; Stres, B.; Hallet, S.; Philippot, L. Quantitative detection of the nosZ gene, encoding nitrous oxide reductase, and comparison of the abundances of 16S rRNA, narG, nirK, and nosZ genes in soils. Appl. Environ. Microbiol. 2006, 72, 5181–5189. [Google Scholar] [CrossRef] [PubMed]
  69. Rotthauwe, J.H.; Witzel, K.P.; Liesack, W. The ammonia monooxygenase structural gene amoA as a functional marker: Molecular fine-scale analysis of natural ammonia-oxidizing populations. Appl. Environ. Microbiol. 1997, 63, 4704–4712. [Google Scholar] [CrossRef] [PubMed]
Figure 1. Yields and economic benefits of rice monoculture (RM) and rice–soft-shell turtle (RT) co-culture systems. (a) yields; (b) equivalent yields; (c) economic value. Error bars represent standard error of the mean.
Agronomy 16 01451 g001
Figure 4. Water depth of rice–soft-shell turtle (RT) and rice monoculture (RM) at (a) farm 1 and (b) farm 2. RT-R: rice-cultivated area of RT, RT-T: turtle culture area of RT.
Agronomy 16 01451 g004
Figure 5. Mean value of (a) DOC content, (b) mcrA, and (c) pmoA in the soil of rice–soft-shell turtle (RT) and rice monoculture (RM) at farm 1 and farm 2. RT-R: rice-cultivated area of RT, RT-T: turtle culture area of RT. The error bars represent the standard error (n = 3); Different lowercase letters indicate significant differences between different treatments (p < 0.05).
Agronomy 16 01451 g005
Figure 6. Mean value of (a) NO3-N content, (b) NH4+-N content, (c) nirS, (d) nirK, (e) nosZ, (f) AOA, and (g) AOB in the soil of rice–soft-shell turtle (RT) and rice monoculture (RM) at farm 1 and farm 2. RT-R: rice-cultivated area of RT, RT-T: turtle culture area of RT. The error bars represent the standard error (n = 3); Different lowercase letters indicate significant differences between different treatments (p < 0.05).
Agronomy 16 01451 g006
Figure 7. The (a) Indirect GHG emissions differences (RT relative to RM), (b) indirect GHG emissions, and (c) total GHG emissions from rice–soft-shell turtle (RT) and rice monoculture (RM) at farm 1 and farm 2. The error bars represent the standard error (n = 3); Different lowercase letters indicate significant differences between different treatments (p < 0.05).
Agronomy 16 01451 g007
Figure 8. GHG emissions intensity per (a) unit equivalent yields and (b) unit profit of rice–soft-shell turtle (RT) and rice monoculture (RM) at farm 1 and farm 2. The error bars represent the standard error (n = 3); Different lowercase letters indicate significant differences between different treatments (p < 0.05).
Agronomy 16 01451 g008
Disclaimer/Publisher’s Note: The statements, opinions and data contained in all publications are solely those of the individual author(s) and contributor(s) and not of MDPI and/or the editor(s). MDPI and/or the editor(s) disclaim responsibility for any injury to people or property resulting from any ideas, methods, instructions or products referred to in the content.