Article

Multifunctional Characterization and Inter-Annual Variability of Bioactive Compounds in Hippophae rhamnoides L. Sea Buckthorn Varieties


1
Faculty of Food Engineering, Stefan cel Mare University of Suceava, 720229 Suceava, Romania
2
Faculty of Food Technology, Technical University of Moldova, MD-2045 Chisinau, Moldova
*
Authors to whom correspondence should be addressed.
Agronomy 2026, 16(15), 1446; https://doi.org/10.3390/agronomy16151446
Submission received: 25 June 2026 / Revised: 27 July 2026 / Accepted: 28 July 2026 / Published: 30 July 2026

Abstract

The growing interest in natural bioactive compounds has positioned sea buckthorn (Hippophae rhamnoides L.) as a source of high-value phytochemicals for pharmaceutical and functional applications. Renowned for its complex biochemical profile, this species synthesizes significant levels of lipophilic and hydrophilic antioxidants, notably carotenoids and ascorbic acid (vitamin C). These constituents provide extensive therapeutic and pharmacological benefits, including strong antioxidant, anti-inflammatory, and tissue-regenerative properties. Consequently, characterizing the exact bioactive composition of sea-buckthorn is essential for identifying cultivars with exceptional multi-functional potential. However, a major challenge in exploiting this botanical resource lies in the significant variability of its chemical profile. While the fundamental pharmacological attributes of the plant are genetically determined, the absolute concentration of its bioactive compounds can vary. Factors such as specific cultivar traits and inter-annual climatic conditions, including severe seasonal droughts, are known to influence secondary metabolite accumulation. Although individual varieties exhibit distinct nutritional profiles, systematic data tracking these fluctuations over consecutive years remain limited, particularly regarding certified cultivars adapted to specific regional ecosystems. To extend current understandings, this study evaluates the multi-functional characteristics and inter-annual stability of 17 distinct sea buckthorn varieties over a continuous three-year monitoring period. Specifically, this research focuses on four select varieties officially registered in the Republic of Moldova Official Catalogue of Plant Varieties and Species. The primary aim of this investigation is twofold: first, to quantify key quality parameters—including carotenoid levels, vitamin C content, total acidity, pH, and dry matter—across the different cultivars; and second, to determine whether genetic variety or inter-annual climatic variations exert the dominant influence on these bioactive levels over the medium term. By evaluating these parameters, this study establishes reliable baselines for selecting stable, high-yield cultivars optimized for targeted pharmacological applications.

1. Introduction

Consumer interest in natural antioxidant products and antioxidant-rich natural derivatives increased markedly between 2020 and 2024. Sea buckthorn, belonging to the genus Hippophae L. (family Elaeagnaceae), includes species known to contain a broad spectrum of bioactive compounds with multiple pharmacological effects, including cholesterol-lowering, anticancer, and anti-inflammatory activities [1,2,3]. The fruits are particularly valued for their high content of antioxidant compounds, which contribute to their numerous health-promoting properties. In addition to the fruits, the leaves have also attracted considerable interest because of their pronounced adaptogenic capacity and their potential to stimulate the immune response, as evidenced by the proliferation of lymphoid tissue in various organs [4,5].
Taxonomic classification of the genus Hippophae (2 n = 24) is based on morphological variations as follows: H. rhamnoides L., H. salicifolia D. Don, and H. tibetana Schlecht [1]. The berries are orange-yellow to orange-red in color, weigh between 0.2 and 1 g, and measure 4–10 mm in diameter (spherical form) and 10–20 mm in length (oblong form) [2]. Native to Europe and Asia, statistical data indicate a global distribution of approximately 2.33 million hectares (ha) of sea buckthorn, with the majority in China (2 million ha), Mongolia, India, Russia, Pakistan and about 15,000 ha distributed in Eastern Europe [3]. Of this predominant area, artificial plantations account for 55% of the total cultivation in China, which highlights the importance of cultivated varieties and market demand for sea buckthorn [4].
The composition of bioactive compounds is influenced by both genetic factors and environmental conditions, including harvest time, growing conditions, and fruit maturity. In addition, differences among cultivars reflect variations in the regulation of metabolic pathways responsible for the biosynthesis of these compounds. Some studies argue that variability in the biosynthesis of bioactive compounds is mainly genetically determined. Ding et al. (2022) confirmed that the metabolic flux of fatty acids is regulated by phosphatidylcholine and can lead to an accumulation of oil in fruit pulp with a high C16:1 content [5]. Kallio et al. (2002) [6] demonstrated that both the genetic background and the timing of berry harvest influence the accumulation of bioactive compounds. They reported vitamin C concentrations that were up to five-fold higher than those previously observed in berries from Europe and Russia. In addition, carotenoid content showed considerable regional variation in China and, in some cases, exceeded the levels reported for samples from Inner Mongolia. Similarly, Yang et al. (2009) found that the concentrations of these compounds were strongly affected by harvest date and genetic background [7]. Specifically, flavonol glycoside content increased in berries harvested between late September and early October before declining at later harvest stages.
High antioxidant activity and elevated polyphenol content were reported by Zheng et al. (2025) in 21 sea buckthorn samples representing different varieties harvested between 2019 and 2020 in China, with significantly higher total polyphenol levels observed in 14 wild varieties [4]. The drying method used for samples is of major importance in preserving antioxidant capacity. Chen et al. [8] identified antioxidant activity regardless of the drying method (freeze-drying, spray-drying, and microwave vacuum drying); however, a peak in vacuum freeze-dried samples of 1.5 mg/mL was observed, suggesting exceptional antioxidant properties for this drying method.
In the Republic of Moldova, sea buckthorn fruits have gained increasing interest due to their nutritional value and potential health benefits. Traditionally, the berries have been used in various forms, particularly for the preparation of fresh juices, juice blends, and infusions. In addition, small local producers process sea buckthorn fruits into products such as jams and preserves, contributing to the diversification of value-added products derived from this species. These traditional and emerging uses highlight the importance of selecting and characterizing high-quality varieties with superior biochemical profiles suitable for both fresh consumption and processing.
In the present study, 17 sea buckthorn (Hippophae rhamnoides L.) cultivars were evaluated over three consecutive growing seasons under the pedoclimatic conditions of the Republic of Moldova. These cultivars were selected because of their vigorous growth, high fruit yield, and good adaptability, making them promising candidates for commercial cultivation. Although sea buckthorn cultivation in the Republic of Moldova is relatively recent, with the first commercial plantations established in 2014 on approximately 40 ha and expanding to about 180 ha by 2018 [9], the crop has considerable potential due to favorable environmental conditions and its recognized nutritional value. Depending on the cultivation system and management practices, fruit productivity ranges from approximately 1.5 t/ha in natural stands to 10 t/ha in intensive orchards [1]. Despite the growing interest in sea buckthorn, most published studies have focused on a single harvest period or a limited number of cultivars. For example, Ran et al. (2026) developed a rapid authentication approach combining hyperspectral imaging, deep learning, and metabolomics, but their analysis was restricted to samples collected at a single harvest stage, emphasizing geographical rather than temporal variation [10]. The present study addresses these limitations by evaluating a broader set of cultivars over three consecutive years, providing a more comprehensive assessment of the variability in fruit composition. Furthermore, it substantially extends our previous work, in which only physicochemical characteristics of eight cultivars (R1, R2, R4, R5, Leikora (L1), C6, AGG, and AGA) harvested in 2020 were reported [11].

2. Materials and Methods

2.1. Materials and Reagents

Materials

The samples were prepared from fruits from 17 sea buckthorn varieties (Hippophaë rhamnoides L.) named AGA, AGG, C6, Clara, Cora, Dora, Hergo, Leikora (L1), Mara, Mr. Sandu, Pomorancevaia, R1, R2, R4, R5, Roori, and Seirola. Clara, Cora, Dora and Mara are listed in the Republic of Moldova Official Catalogue of the Varieties and Plant Species [12]. All varieties were evaluated over a three-year period, covering the consecutive years 2020, 2021, and 2022.
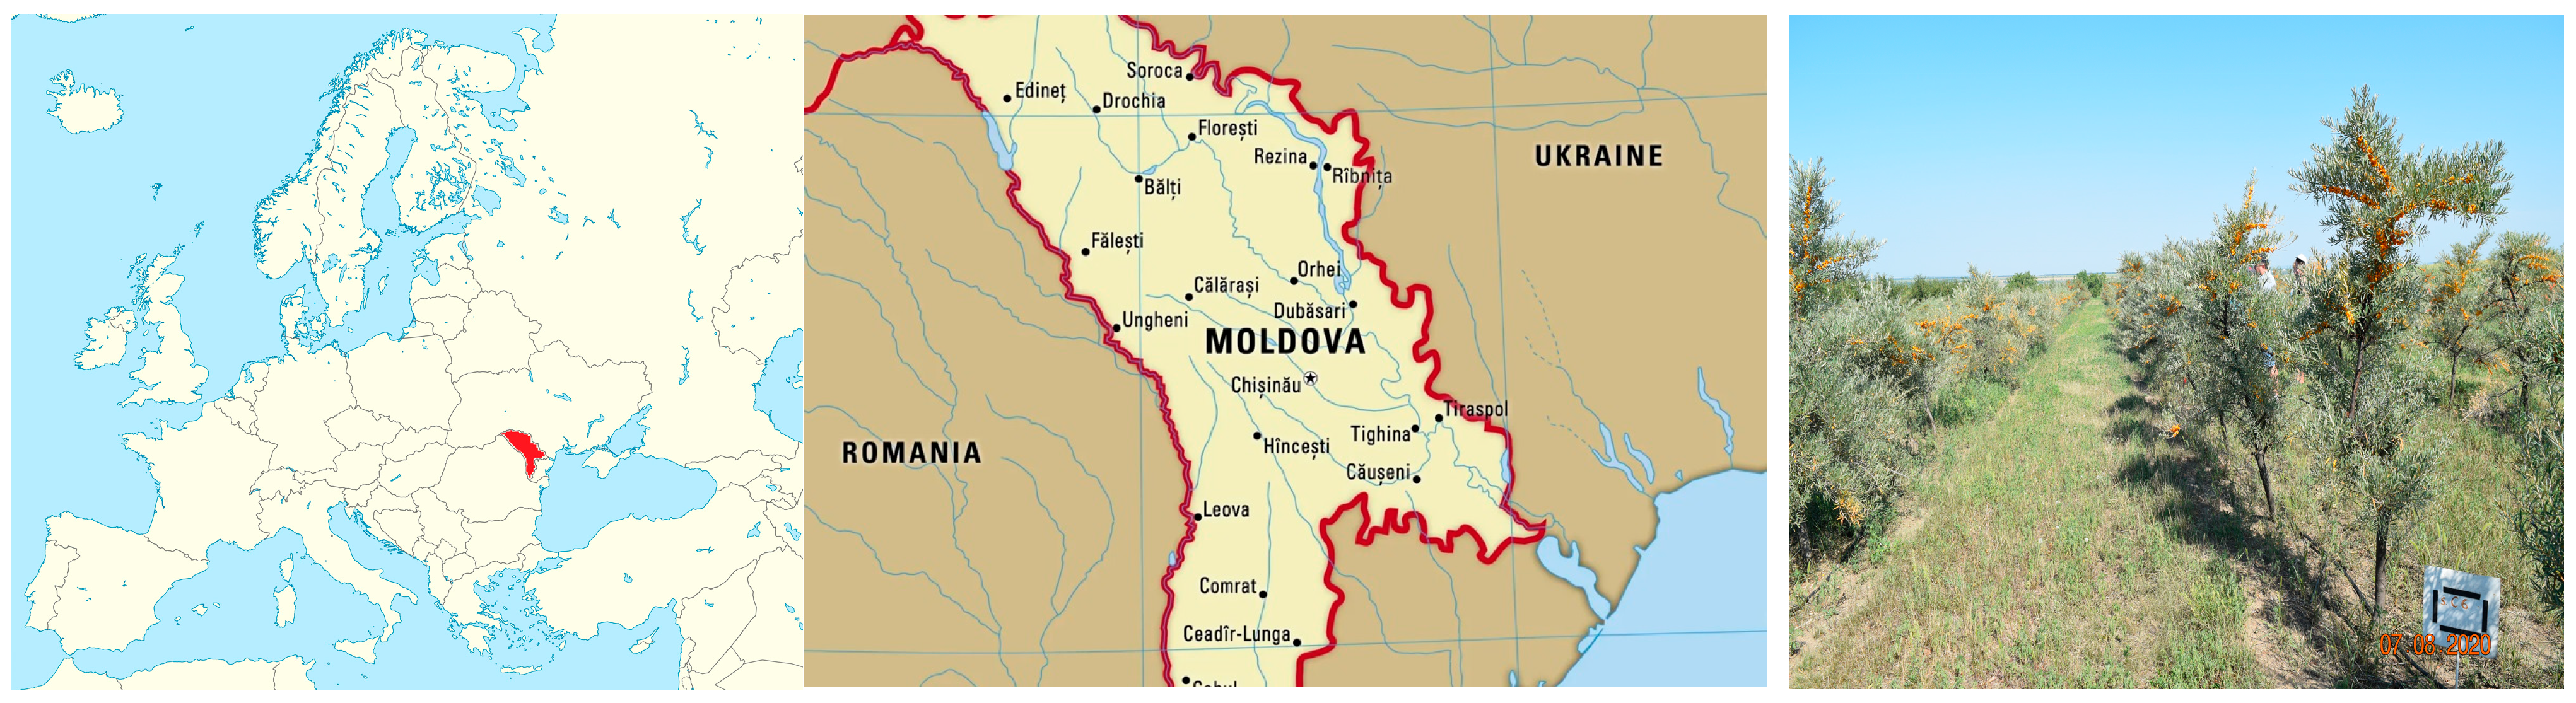
These species were collected from the experimental sea buckthorn plantation located in Pohrebea village, Dubossary District, Republic of Moldova (47°10′34″ N, 29°10′04″ E, Figure 1). The soil type of this locality is predominantly represented by chernozems, which are the dominant and most fertile soils of the Republic of Moldova [13,14]. Chernozems are characterized by high natural fertility, well-developed structure, and the presence of carbonate accumulations in the soil profile [13]. The groundwater table is relatively shallow and varies according to relief conditions, ranging from approximately 1.5 m in valleys to up to 20 m in elevated areas. According to available soil characterization data for Moldovan chernozems, these soils generally exhibit neutral to slightly alkaline pH values and variable carbonate contents depending on the soil subtype [15].
Fresh sea buckthorn berries, which were summer species (July) except for the Cora variety, were harvested from a sea buckthorn plantation in the Republic of Moldova and transported to the laboratory for analysis. The initial moisture content of the sea buckthorn fruits was measured using the method of drying by complete evaporation of water to constant weight [16]. The laboratory oven used was (SLW 115 SMART, Pol-Eco Aparatura, Wodzisław Śląski, Poland), at a temperature of t = 105 °C, τ = 3 h. The determined values ranged between 71.83 and 82.99% wet basis. To prevent moisture loss, the fruits were packed in plastic bags and kept frozen at −18 °C before performing the experiments.

2.2. General Climatic and Agricultural Data

Sea buckthorn is a moderately drought-tolerant plant and can grow on dry land [17]. However, during the flowering and fruit ripening periods, sea buckthorn requires adequate soil moisture of about 70% [18]. Precipitation deficits and wildfires in the period 2018–2022 had a particularly negative effect on the flora in Central Europe and to a lesser extent in the Nordic countries [19]. Regarding sea buckthorn, even though natural drought resistance is an advantage, meteorological peaks are associated with poor harvests in consecutive years of severe water deficit in crops that are not properly irrigated. The negative impact of arid climatic conditions can be represented by pests that can attack the plant with direct effects on production [17].
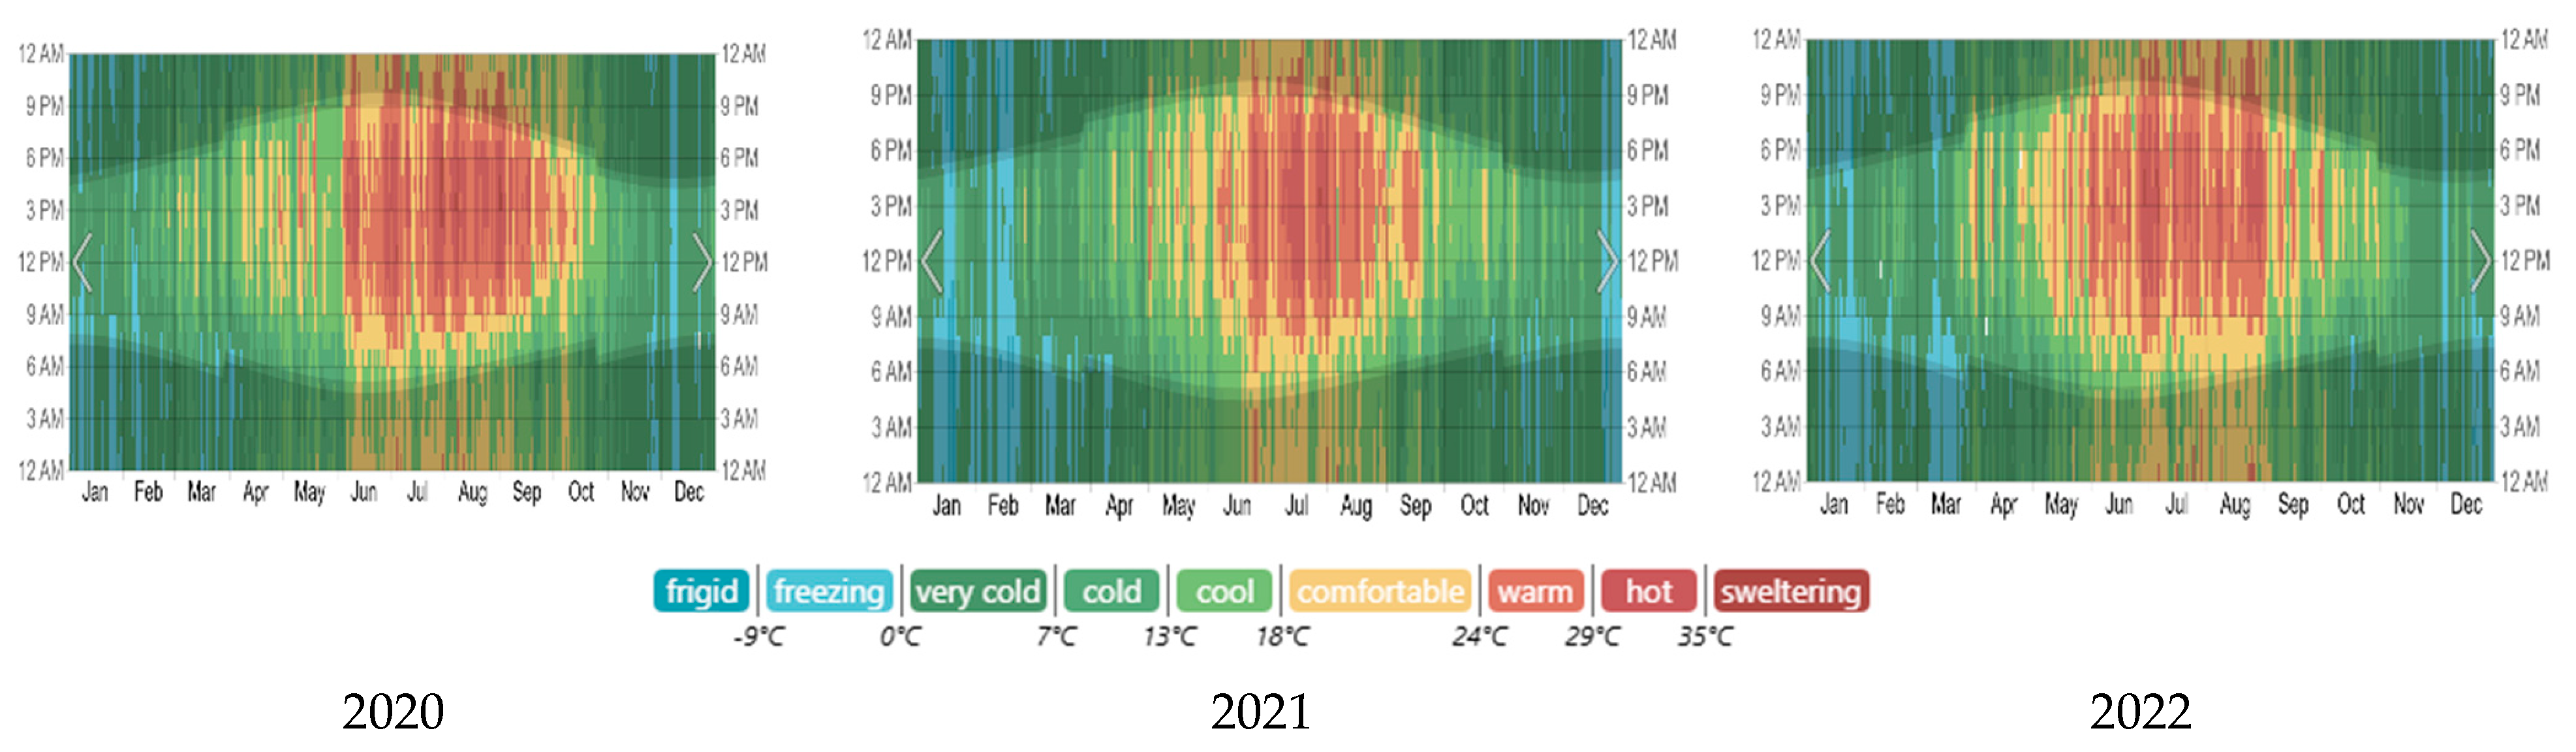
Distributed by year, 2020 continued the period of a long series of severe droughts that started in 2018 with a drought that sounded the alarm for agricultural policies and affected many crops [20]. The drought continued into the following year and had implications for agricultural crops in the first part of the year in 2021 on the European continent [19]. Starting in late 2021, a severe drought emerged and persisted throughout 2022 across the Euro-Mediterranean region, negatively impacting agricultural production [21,22]. A general presentation of hourly temperatures during the three years of interest in sea buckthorn fruit harvesting is represented in Figure 2.

2.3. Methods

2.3.1. Reagents

For the laboratory analyses, including ascorbic acid content, total carotenoid content, and mineral composition, analytical−grade reagents and chemicals were used. Reagents were Methanol (gradient grade ≥ 99.9%, Honeywell, Charlotte, NC, USA) and ethyl acetate (gradient grade ≥ 99.9%, Honeywell), Petroleum ether (puriss. p.a., ACS reagent, reag. ISO, low boiling point hydrogen-treated naphtha, bp > 90%, 40−60 °C, ≥90%, Sigma-Aldrich, Schnelldorf, Germany), hydrochloric acid (37%, Sigma Aldrich, Germany), the ascorbic acid standard solution (0.1 g/dm3), and the titration solution containing 2,6−dichlorophenolindophenolate were obtained from Sigma-Aldrich (Schnelldorf, Germany). For mineral content analysis, Fluka™ Atomic Absorption Spectrometry (AAS) stock solutions (1000 mg/L) of Na, Fe, Ca, Cu, and Pb, manufactured by Sigma-Aldrich, Germany, were used.

2.3.2. Morphometric Variability

Morphometric analysis of the sea buckthorn varieties was carried out following procedures described in the literature and adapted from [24]. The hundred berry weight (HBW) was determined using 100 freshly harvested berries. Additionally, the number of fruits per 100 g and the pulp−to−fruit ratio were evaluated.

2.3.3. Soluble and Insoluble Substances

Water-soluble dry matter content (according to the regulation Codex Alimentarius 3-1-558/93) was determined in °Brix with a digital refractometer PAL-1 (Atago Co., Ltd., Tokyo, Japan), in accordance with the standard ISO 750:2014 [25,26].
Insoluble dry matter content (%) was determined by filtering the sample (filtration system, Buchner funnel, and vacuum filter) and drying the filter with the residue at 105 °C for 2.5 h until it reached constant weight.
Total dry matter content was determined by complete evaporation of water at 105 °C to constant weight (approximately 3 h) using a laboratory oven (SLW 115 SMART, Pol-Eco, Wodzisław Śląski, Poland), and a gravimetric method based on the GOST 28561-90 standard.

2.3.4. pH and Titrable Acidity

Twenty-five grams of the homogenized sample were taken, weighed with an accuracy of 0.01 g, and transferred to a 250 mL graduated flask. One-third of the flask volume was filled with distilled water preheated at 80 °C were added to this quantity and maintained at this temperature in a water bath (SBS40 STUART, Cole-Parmer, Staffordshire, UK) for 30 min. After this stage, the sample was cooled, brought to the mark, homogenized, and filtered. From the filtrate obtained, 25 mL were transferred to an Erlenmeyer flask and titrated by stirring with 0.1 M NaOH using TitroLine 5000, SI Analytics, Mainz, Germany. Titratable acidity (%) was calculated according to the formula (ISO 750:2014 [27])
A T = V c M m V 0 V 1 0.1   ( %   m a l i c   a c i d )
where
V—Volume of the 0.1 M NaOH solution used in titration, in mL;
c—Molar concentration of the sodium hydroxide solution, mol/L;
M—Molar mass of the organic acid predominant in the product being analyzed, g/mol;
m—Mass of the product taken for analysis, g;
V0—Total volume of the solution to be analyzed obtained from the quantity of product taken for analysis, mL;
V1—Volume of the solution to be analyzed, taken for determination, mL;

2.3.5. Total Carotenoid Content

To determine the total carotenoid content, 2 g of the sample was mixed with 25 mL of a solution made from methanol: ethyl acetate: petroleum ether (1:1:1, v/v/v) and vortexed (Vortex Boeco, Hamburg, Germany) [28,29]. After shaking, the samples were ultrasonicated for 15 min at 37 kHz, maintaining a temperature of 20 °C (ISOLAB Laborgeräte GmbH, Eschau, Germany) and centrifuged for 10 min at 5000 rpm (HERMLE Z 366 K, Hermle Labortechnik GmbH, Wehingen, Germany). The lipophilic part was extracted using a Pasteur pipette and transferred to measure volume. The sample, diluted 10 times, was analyzed using a UV-1900/UV–VIS Spectrophotometer (Shimadzu, Kyoto, Japan) at λ = 448 nm [30].
Carotenoid content was calculated using the following formula:
C a r o t e n e = A V e x t r . D 1000 2500 100   ( m g / 100   g )
where
A—Absorbance, nm;
Vextr.—Volume of the extract, mL;
D—Dilution.

2.3.6. Vitamin C Content

Five grams of the sea buckthorn fruit were thoroughly homogenized with 1 mL of 2% HCl, then transferred to a 100 mL flask and filled with HCl up to the mark. Extraction was carried out under continuous stirring for 10 min, and then the sample was filtered. For the titration procedure, an aliquot of 0.5 mL of the extract was added to 25 mL of 2% HCl solution in a beaker equipped with potentiometric electrodes. The resulting solution was titrated with 2,6-dichlorophenolindophenolate (DCPIP) according to the standard ISO 6557-2:1984 [31].
The mass fraction of ascorbic acid in % is calculated using the following formula:
X = ( V 1     V 2 ) T V 3 100 V 4 m   ( % )
where:
V1—Volume of 2,6-dichlorophenolindo-phenolate solution used for titration, cm3;
V2—Volume of 2,6-dichlorophenolindo-phenolate solution used for control test, cm3;
T—Titre of 2,6-dichlorophenolindo-phenolate solution, g/cm3;
V3—Volume of extract obtained from vitamin C extraction, cm3;
V4—Volume of extract used for titration, cm3;
m—Weight of product, g.

2.3.7. Ash Content

Ash represents the inorganic residue that remains after the ignition or complete oxidation of organic material in a food sample. Measuring the ash content is an important quality parameter for detailed elemental analysis [32]. Ash content was measured according to AOAC standards by keeping the samples in a calcination oven at a temperature of 550 °C for several hours. Ash content (%) was determined by a formula as given:
Ash content (%) = Weight of ash/Weight of sample × 100

2.3.8. Mineral Content

Elemental analysis of the sea buckthorn samples was determined by using atomic absorption spectroscopy (AAS, Shimadzu AA-6300, Japan). High-purity reagents (HNO3, Merck, Darmstadt, Germany, Suprapure grade) were used to dissolve the ash obtained at 550 °C (heating above this temperature significantly reduces the element recovery). For the analysis (AAS), a multi-element tube cathode lamp and air flame/acetylene were used. The concentrations of sodium (Na), iron (Fe), calcium (Ca), copper (Cu), and lead (Pb) were quantified. Each determination was performed in triplicate for accuracy. Stock standard solutions (1000 mg/L) of Ca (69349), Fe (16596), Pb (16595), Cu (38996) and Na (05201) were used for calibration. Calibration curves were constructed using five concentration points: 0.05–1 mg/L. Mineral content was calculated directly, considering the volume, weight, and dilution factors:
Actual concentration = Concentration × VF × DF × CF × WF−1 (mg·kg−1).
where
Concentration = concentration indicated by the device;
VF = volume factor;
DF = dilution factor;
CF = coefficient (1);
WF = sample weight taken in the analysis.

2.3.9. Statistical Analysis

All measurements were performed in triplicate. Results are expressed as means ± standard deviation (SD). Statistical analysis of the data was conducted using XLSTAT for Excel 2021 (Addinsoft, New York, NY, USA). One-way ANOVA, followed by post hoc Tukey’s HSD test for multiple comparisons, was performed to assess significant differences (p < 0.05) between samples.

3. Results and Discussion

3.1. Visual Analysis of the Sea Buckthorn Species

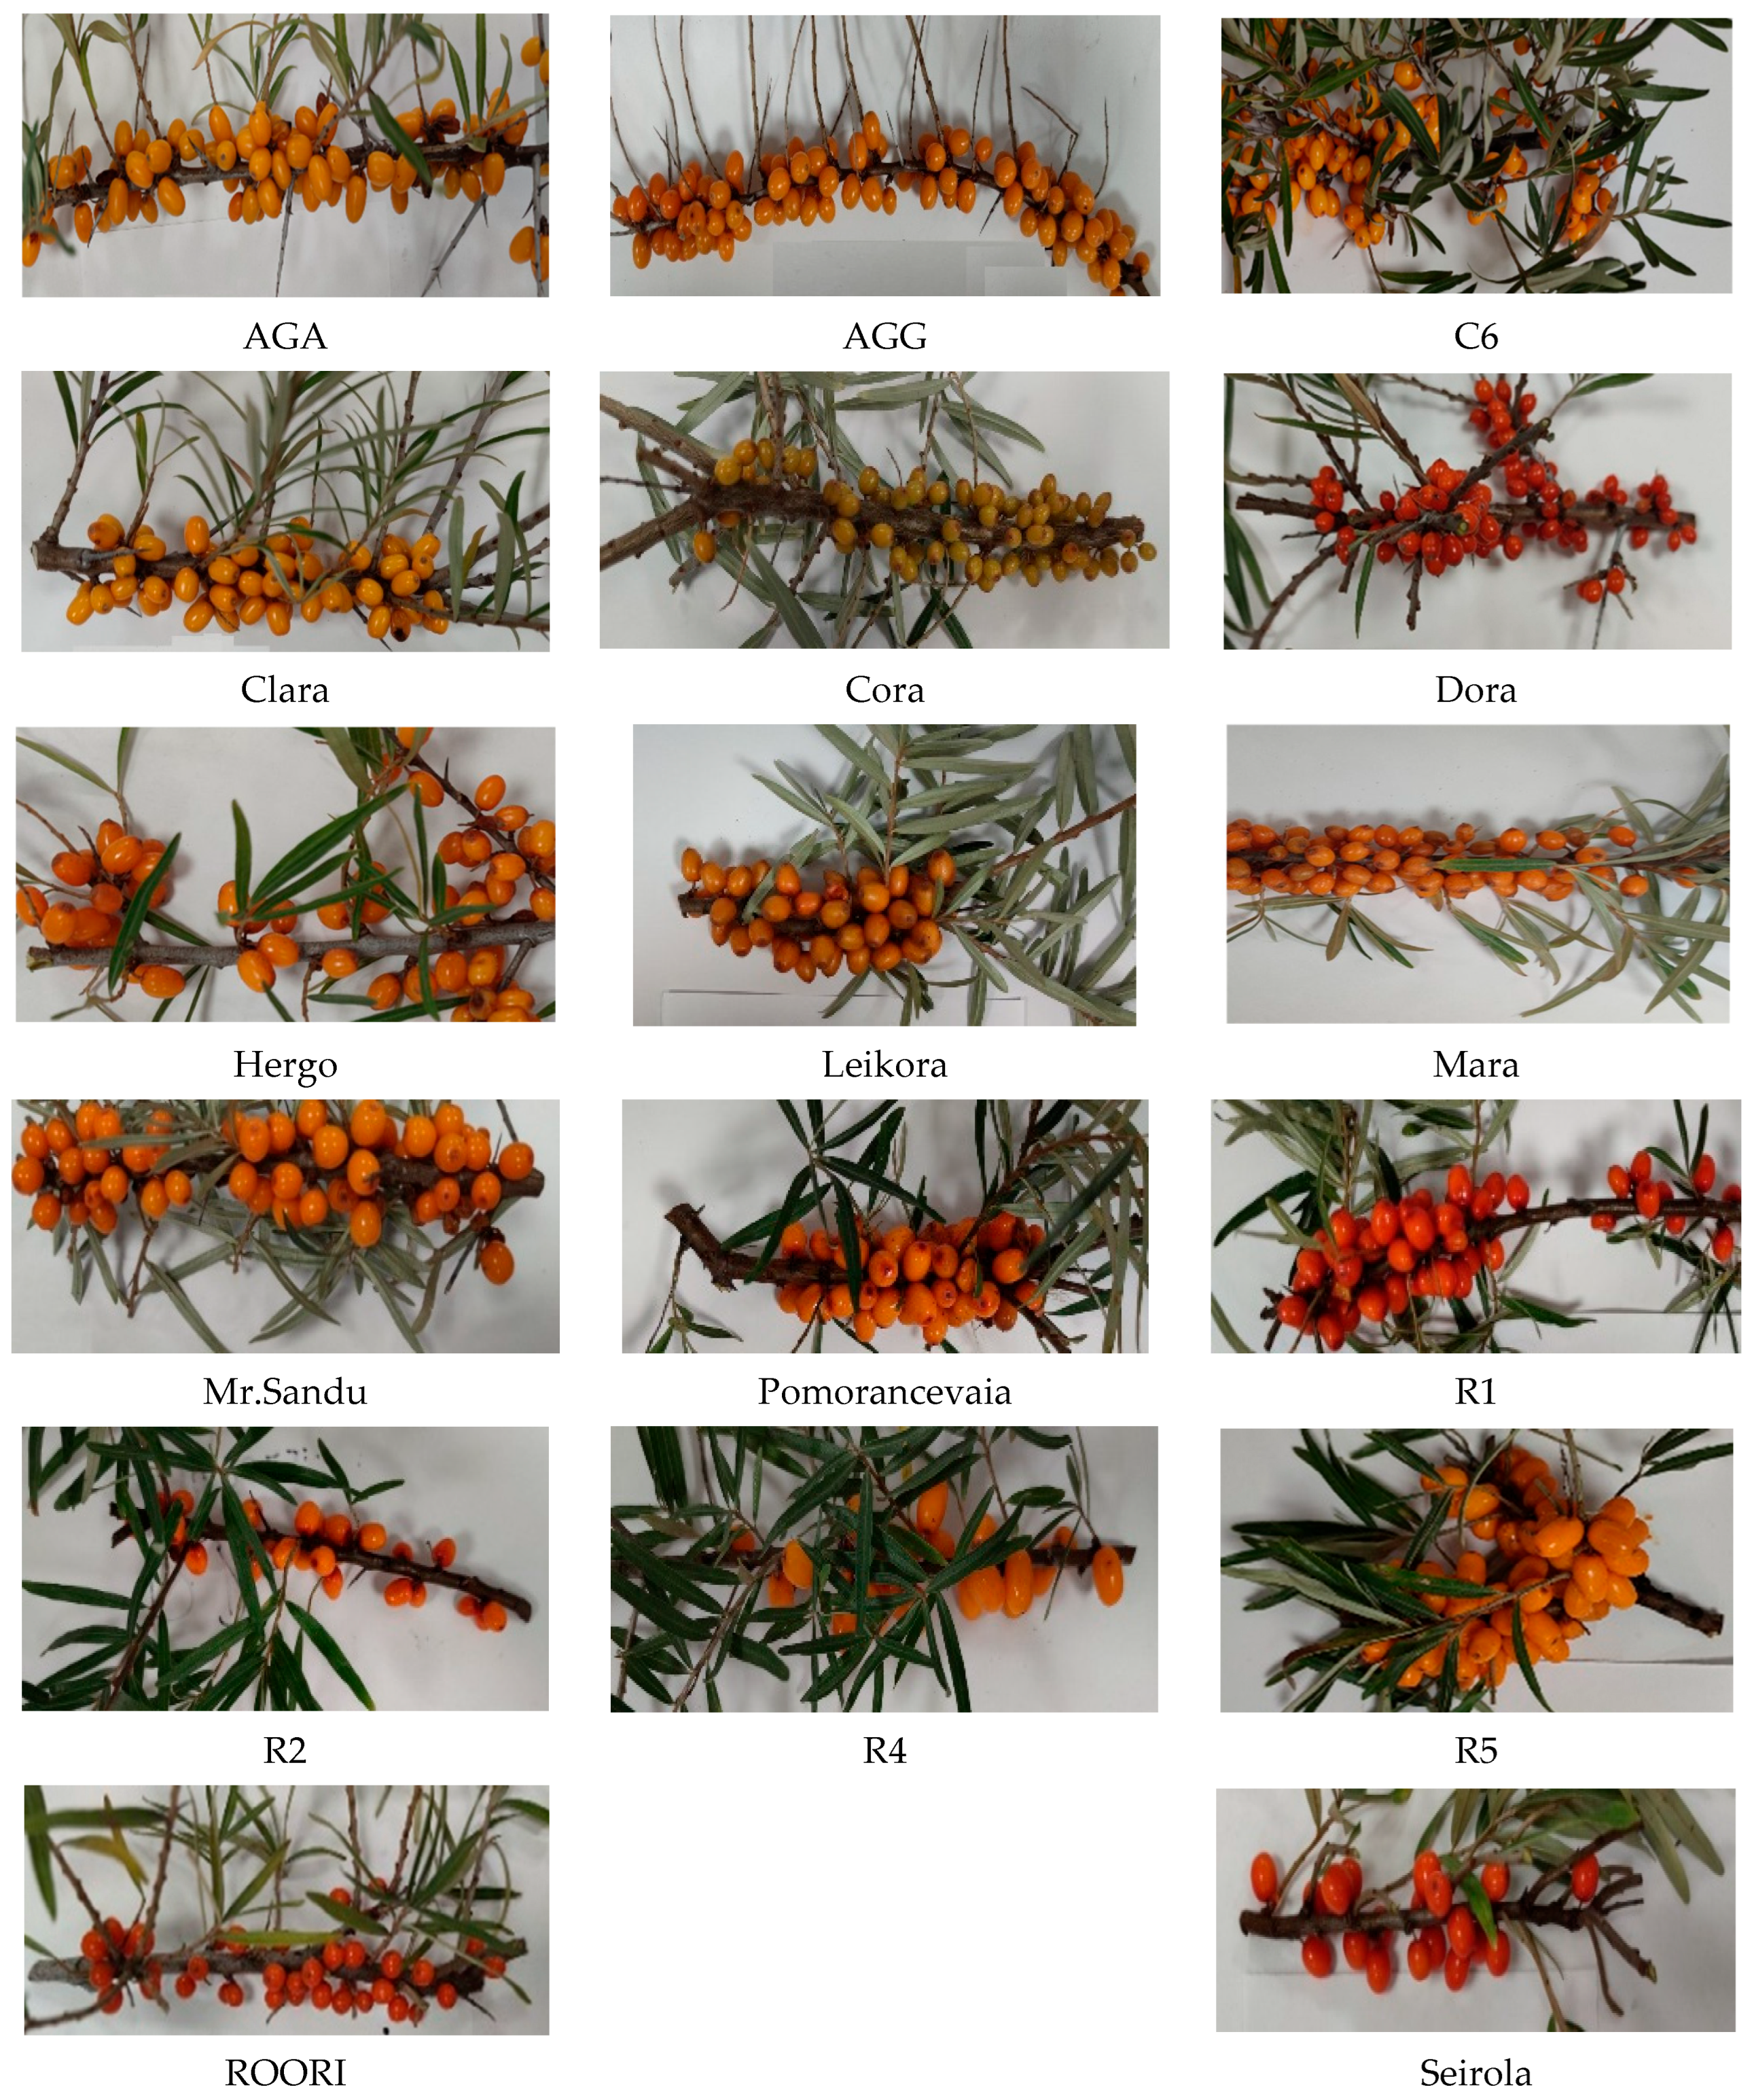
Differences in the appearance of fruits and leaves can be observed by comparing images of the sea buckthorn species analyzed. The collected images have not been edited to accurately reflect the appearance. From what is observed in Figure 3, the dominant color of the sea buckthorn berries is yellow-orange. Some samples, such as Dora, R1 and Seirola, possess an orange-reddish tint. Liang et al. (2022) [33] established that the pigmentation mechanisms in five sea buckthorn varieties are different and varied by identifying a total of 209 flavonoids and 41 carotenoids.
The shape of the berries varies, including round (Seirola, ROORI, Mr.Sandu, S1), elliptical (Hergo, Dora, Mara, Clara, R1, R4, Pomorancevaia, AGG) and oval (AGA, Cora, C6, R5, Leikora, R2) samples.
The color of the sea buckthorn leaves is green, with elliptical shapes in the species ROORI, Dora, C6, R5, Leikora, Pomorancevaia, R2, S1, R4 and elongated to elliptical in Hergo, AGA, Mr.Sandu, Cora, Mara, Clara, R1. On the back side, the color becomes pale green, while the size of the leaves varies between 4 and 7 cm. A more extensive visual analysis was performed by Xu et al. (2024) [34] on 180 kg of sea buckthorn, concluding that water content is strongly correlated with the appearance and color of the sea buckthorn. From the moment the fruit is transformed into juice, the intensity of the colors increases, as Rozhnov et al. (2020) [35] mentioned in his article on the optical properties of sea buckthorn drinks.

3.2. Morphometric Variability

In fruits, there are differences in the shape and color of the fruit and seeds, as well as the arrangement of the leaves on the shoots [36]. Fruit weight is one of the most important pomological traits of sea buckthorn (Hippophae rhamnoides L.), as it reflects berry size and directly influences processing efficiency, harvesting performance, and commercial value. In the present study, the overall mean weight of 100 fruits was 37.75 g over the 2020–2022 period (Table 1), revealing considerable variability among the analyzed genotypes. The lowest values were recorded in the cultivar Dora, with fruit weights ranging from 15.35 to 16.34 g per 100 fruits, whereas the highest values were observed in genotype R2, ranging from 69.38 to 69.91 g per 100 fruits. Thus, the difference between the minimum and maximum values exceeded fourfold, demonstrating pronounced phenotypic diversity for this trait within the studied germplasm.
The highest values for 100-fruit weight were consistently recorded in genotypes R2 (69.38–69.91 g), R4 (66.62–67.35 g), R5 (63.58–64.25 g), Pomorancevaia (62.16–63.02 g), and R1 (53.55–54.25 g). These results indicate the presence of large-sized fruits, which is further supported by biometric measurements of fruit diameter and length. For instance, R2 exhibited the highest fruit dimensions (8.64–9.03 mm in diameter and 13.63–14.03 mm in length), which directly explains its high fruit mass. A similar positive relationship between fruit size and mass has been reported by Yao, (1993) [38], who found that sea buckthorn genotypes with larger berry dimensions generally exhibit higher individual fruit weight.
In contrast, cultivars such as Dora, Hergo, Mara, and Cora showed the lowest values of 100-fruit weight (15.35–21.13 g), indicating smaller and more compact fruits. This observation is consistent with biometric data, as these genotypes also exhibited the lowest values for fruit diameter and length. For example, Dora recorded diameters of 4.18–4.50 mm and lengths of 5.98–6.16 mm, representing the smallest fruits among all studied genotypes.
The number of fruits per 100 g showed an inverse relationship with 100-fruit weight, which is expected due to the mathematical relationship between these two parameters. As fruit weight increases, the number of fruits required to reach 100 g decreases. Therefore, these traits are not independent but represent the same variation in fruit size expressed from different perspectives. Genotypes with larger fruits and higher 100-fruit weight exhibited fewer fruits per 100 g. Accordingly, R2, R4, and R5 recorded only 132–151 fruits per 100 g, whereas Dora and Hergo showed substantially higher values (542–666 fruits per 100 g). This inverse relationship is expected, as larger fruits contribute more to the total mass, reducing the number of fruits required to reach 100 g. Similar findings were reported by Negi & Rajani (2018) [39], who demonstrated a strong negative correlation between individual fruit weight and the number of fruits per unit weight in sea buckthorn germplasm.
A clear positive association was observed between fruit weight and biometric traits. Genotypes R2, R4, R5, R1, and Pomorancevaia, which exhibited higher fruit weight, also showed larger fruit diameter and length values. In contrast, Dora, Hergo, and Mara were characterized by smaller fruit size and lower weight. These results support the findings of T. S. C. Li & Schroeder, (1996) [1], who emphasized fruit size as a key selection criterion in sea buckthorn breeding programs due to its direct relationship with yield potential and commercial quality.
An important outcome of the present study is the relatively high stability of the analyzed traits over the three experimental years. Although minor annual fluctuations were observed, the ranking of genotypes remained largely consistent. This suggests a strong genetic control of fruit morphological traits and a relatively low environmental influence under the studied conditions. Bartish et al. (2002) [40] reported substantial genetic diversity within Hippophae rhamnoides, which contributes to stable phenotypic differentiation among genotypes, particularly for fruit size-related traits.
The results are also consistent with those reported by Macari et al. (2021) [37] for sea buckthorn grown under the pedoclimatic conditions of the Republic of Moldova, who highlighted significant variability in fruit physical and organoleptic traits among cultivars and selection lines. Notably, the R2, R4, and R5 genotypes in the present study exhibited values at the upper range of previously reported datasets, indicating their potential as valuable genetic resources for breeding programs aimed at improving fruit size.
Overall, the findings demonstrate considerable morphological variability among the studied sea buckthorn genotypes. Genotypes R2, R4, R5, Pomorancevaia, and R1 were characterized by large fruits with higher 100-fruit weight and larger biometric dimensions, whereas Dora, Hergo, and Mara showed smaller fruits but higher numbers per unit weight. These differences are highly relevant for breeding strategies and cultivar selection depending on intended technological and commercial uses.
The biometric analysis of sea buckthorn (Hippophae rhamnoides L.) fruits presented in this study revealed significant variability among genotypes and a relatively stable ranking over the three experimental years (2020–2022), indicating a strong genetic control over fruit size-related traits (Table 2). These findings are consistent with previous literature, which emphasizes that fruit morphological traits in sea buckthorn are highly heritable and exhibit considerable phenotypic stability across different environmental conditions [41,42].
The study conducted by Macari et al. (2021) [37] on sea buckthorn cultivars grown in the Republic of Moldova (including R1, R2, R4, R5, Leikora, C6, AGG, and AGA) provides strong support for the results obtained in the present work. The authors reported significant variation in fruit physical properties, including fruit diameter, length, 100-fruit weight, and the number of fruits per 100 g, while also highlighting the relatively limited influence of experimental conditions on these traits. This suggests a predominantly genetic control of morphological characteristics and a high level of phenotypic stability, which is consistent with the patterns observed in our study.
The grouping of genotypes identified in the present study into large-fruited genotypes (R2, R4, R5, R1, Pomorancevaia, and Seirola) versus small-fruited genotypes (Dora, Hergo, Mara, and Cora) is in agreement with previous studies by Ilhan et al. (2021) [41], who reported substantial morphological variability among sea buckthorn genotypes originating from different geographical regions. These studies confirm the existence of a wide genetic base within Hippophae rhamnoides, which is reflected in the strong differentiation of fruit size traits. Singh & Zubarev (2014) [43], in a comparative study on sea buckthorn, concluded that fine 9–14 mm in diameter Russian sea buckthorn showed higher performance in terms of oil content and bioactive substances than wild Chinese sea buckthorn berries.
Furthermore, the stability of genotype ranking across the years observed in the present study aligns closely with the findings of [41], who demonstrated that morphological traits in Hippophae are relatively stable over time and can be reliably used for germplasm characterization and breeding selection.
Minor inter-annual fluctuations observed in some genotypes in 2022 may be attributed to environmental variability or differences in crop load, both of which are commonly reported in perennial fruit species. Similar year-to-year variations in fruit size have been documented by [43], although these fluctuations do not alter the overall genotype ranking.
In conclusion, the integration of the present findings with those of Macari et al. (2021) [37] and other relevant studies confirms that fruit size traits in sea buckthorn exhibit high genetic variability; genotype ranking remains stable across years, indicating strong genetic determination; morphological differences among genotypes are consistent across studies conducted under comparable agroecological conditions; and these traits are highly valuable for breeding programs targeting both yield improvement and industrial processing efficiency.
Overall, the present study complements and strengthens the conclusions of [37], further confirming that sea buckthorn genotypes cultivated in the Republic of Moldova exhibit significant yet stable morphological diversity with high relevance for breeding and selection programs.

3.3. Soluble and Insoluble Substances

The data representing the values obtained for the soluble and insoluble substances of the 17 sea buckthorn varieties analyzed over a period of 3 consecutive years, 2020, 2021 and 2022, are presented in Table 3. Soluble solids content (°Bx) was determined as an overall measure of dissolved constituents in the fruit extract, consisting mainly of soluble sugars together with polysaccharides, soluble pectins, organic acids, and minor amounts of soluble proteins. Insoluble solids, expressed as a percentage, correspond to the undissolved fraction, comprising pulp residues, suspended solid particles, cellulose, and fiber.
The soluble solids content measured over a 3-year period in 17 varieties of sea buckthorn averaged 9.95 °Bx. The highest annual average of 11.40 °Bx was recorded in the year following the severe drought of 2018, which affected agricultural land (2020), and then dropped to an average of 8.26 °Bx the following year, 2021. The individually examined results ranged from 6.23 °Bx (Pomorancevaia, 2021) to 15.73 °Bx (Cora, 2020). Similar studies conducted over a three-year period reported values of 8.9–12.5 °Bx for sea buckthorn berries harvested in Canada from 1999 to 2002, as documented in a 2013 study that also compared buffaloberry (Shepherdia argentea) and chokecherry (Prunus virginiana) [44]. Furthermore, out of a total of six sea buckthorn cultivars commonly grown and collected in Poland in early July and August 2018, the highest soluble solids content was 7.2 °Bx [45], a value below the average of the results obtained in this study between 2020 and 2022. It is worth mentioning that of all 17 varieties analyzed, only four (Cora, Clara, Dora, Mara) are found in the database for varieties admitted for cultivation in the agri-food complex of the Republic of Moldova [46].
Regarding dry weight content, a downward annual trend can be observed starting in 2020, like that of soluble substances during dry periods. The three-year average for dry matter is 20.08%, with the highest peak in 2020 and the highest value of 28.17% for the Mara variety.

3.4. pH and Titratable Acidity

pH and titratable acidity are two dependent characteristics that provide a different perspective on the quality of a food product. Moreover, the ratio between total sugar content and titratable acidity influences the sour flavor of the resulting juice [47]. The acidity depends on the species, variety, degree of maturation and the method of expression (citric, malic, tartaric acid). Titrable acidity of the 17 varieties was closely related during the 3 years of study, with annual averages between 2.52 and 2.81 (Table 4).
Our study expressed titratable acidity in % malic acid, and the upper and lower limits identified were 1.3 in Pomorancevaia (2022) and 4.54 in AGG (2021). Hippophae rhamnoides L. ssp. Carpatica samples collected from 2017 and analyzed in Romania showed a lower titrable acidity content than our data, of 2.28, and a pH value of 2.6 [48]. Máté et al. (2022) [49] analyzed six sea buckthorn varieties harvested in Hungary in 2020, among which three are also analyzed in this paper. The titratable acidity identified was in the varieties Clara (1.9), Mara (1.4) and Leikora (2). In the present study, the titratable acidity values recorded in 2020 were higher for the analyzed varieties, reaching 2.00% in Clara, 4.24% in Mara, and 2.67% in Leikora. By corroborating the data from the two tables (Table 1 and Table 2), the highest values of the ratio between soluble substances and titratable acidity were identified as being 9.13 in the hybrid species R2 from 2022 (12.33/1.35). Based on the °Brix-to-titratable acidity ratio, the highest potential consumer acceptability, characterized by a sweeter taste perception, was observed for the R2 genotype harvested in 2022, followed by Pomorancevaia (2020), which exhibited a ratio of 7.62, and R2 (2021), with a ratio of 4.88. Conversely, the lowest °Brix/acidity ratios, indicative of a more pronounced acidic taste, were recorded in samples collected in 2021, namely Hergo (2.14), Mara (2.15), and AGG (2.42).
pH values increased slightly from year to year from 2.97 in 2020 to 3.24 in 2022. These results fall within the specific quality parameters and are consistent with the values reported in the literature [48,50].

3.5. Total Carotenoid Content and Vitamin C Content

Statistically positive correlations have previously been identified between the two compounds [51]. The analysis of total carotenoid content revealed substantial variability among the 17 sea buckthorn cultivars evaluated during the three-year study period, confirming the strong influence of genotype on carotenoid biosynthesis (Table 5). On the other hand, vitamin C content exhibited even greater variability than carotenoids, ranging from 23.19 mg/100 g in AGG (2022) to 777.20 mg/100 g in Roori (2020). However, the cultivation year also affected carotenoid accumulation, as demonstrated by the variation in annual mean values, which decreased from 41.23 mg 100 g−1 in 2020 to 14.91 mg 100 g−1 in 2021 and 16.57 mg 100 g−1 in 2022. Similarly, vitamin C content exhibited considerable inter-annual variability, with mean values of 163.24, 122.82, and 146.39 mg 100 g−1 in 2020, 2021, and 2022, respectively. Among the analyzed cultivars, vitamin C content ranged from 23.19 mg/100 g in AGG (2022) to 777.20 mg 100 g−1 in Roori (2020), demonstrating that both genotype and environmental conditions associated with the growing year contributed to the observed differences.
Across all years, the highest carotenoid concentrations were recorded in the cultivars Dora, Roori and Seirola, while AGA, AGG and C6 consistently exhibited lower values. The annual mean carotenoid content decreased markedly from 41.23% in 2020 to 14.91% in 2021, followed by a slight increase to 16.57% in 2022, indicating a significant environmental effect on pigment accumulation.
Among the cultivars studied, Dora showed the highest carotenoid concentration in 2020 (111.29 mg/100 g), followed by Roori (98.20 mg/100 g) and Seirola (72.70 mg/100 g). However, carotenoid levels declined considerably in subsequent years, suggesting a pronounced sensitivity to climatic conditions during fruit development. Similar fluctuations have been reported by Korekar et al. (2014) [52], who demonstrated that carotenoid accumulation in sea buckthorn berries varies substantially according to genetic background and geographical origin. Likewise, Yang, Kallio et al. (2009) [53] observed that carotenoid concentration is strongly influenced by harvest time and fruit maturity stage, with significant changes occurring during berry ripening. Recent investigations conducted on Chinese germplasm also confirmed considerable inter-varietal differences in carotenoid content, with certain genotypes accumulating two to three times higher concentrations than others under identical cultivation conditions [4].
The three-year average indicates that cultivars Dora, Roori, Seirola, Mara and R1 possessed superior carotenoid profiles, suggesting their suitability for functional food production and nutraceutical applications. Carotenoids are recognized as important antioxidants and precursors of vitamin A, contributing to the prevention of oxidative stress-related disorders [54,55]. Therefore, the high carotenoid concentrations observed in these cultivars represent a valuable trait for breeding and commercial exploitation.
For vitamin C, the overall three-year average reached 144.15 mg/100 g, confirming sea buckthorn as one of the richest natural sources of ascorbic acid. The cultivar Roori consistently recorded the highest vitamin C concentrations throughout the study, with values of 777.20, 419.44 and 615.02 mg/100 g in 2020, 2021 and 2022, respectively. Elevated concentrations were also observed in Leikora, Mara and Seirola, whereas AGG and Pomorancevaia exhibited the lowest levels. The exceptionally high vitamin C content detected in Roori agrees with previous reports describing sea buckthorn berries as a unique source of ascorbic acid, often containing several-fold higher concentrations than most common fruits [43,56,57]. According to Korekar et al. (2014) [52], certain sea buckthorn genotypes from Asia may accumulate vitamin C concentrations up to five times greater than those reported in European populations, highlighting the importance of genetic factors in determining ascorbic acid biosynthesis. Nevertheless, cultivars Roori, Leikora and Mara maintained comparatively high vitamin C concentrations throughout the experimental period, indicating greater biochemical stability under varying environmental conditions.
A notable observation was the reduction in average vitamin C concentration from 163.24 mg/100 g in 2020 to 122.82 mg/100 g in 2021, followed by a partial recovery in 2022 (146.39 mg/100 g). Such year-to-year fluctuations are consistent with previous findings showing that temperature, solar radiation, precipitation patterns and harvest maturity significantly affect ascorbic acid accumulation in sea buckthorn berries [3]. Of course, by contrast, in the years 1999–2002, ascorbic acid had low values with variations between 91 and 98 mg/100 g [44]. Nevertheless, cultivars Roori, Leikora and Mara maintained comparatively high vitamin C concentrations throughout the experimental period, indicating greater biochemical stability under varying environmental conditions.
When carotenoid and vitamin C contents are considered together, Dora, Roori, Seirola, Mara and Leikora emerge as the most promising cultivars to produce antioxidant-rich raw material. These genotypes combined elevated concentrations of both classes of bioactive compounds, supporting previous observations that sea buckthorn cultivars differ substantially in their nutraceutical value and antioxidant potential [4,55].

3.6. Ash and Mineral Content

The content of mineral substances and ash was determined in the 2020 samples on five elements: Na, Fe, Ca, Cu and Pb. As shown in Table 6, the analyzed sea buckthorn varieties did not exhibit contamination with lead (Pb). The highest concentration detected was 0.0256 mg/kg, which is well below the maximum permissible level of 0.3 mg/kg established by the World Health Organization for fresh fruits [58].
Mineral analysis showed that the average values of micronutrients varied between 0.37 and 1.60 mg/kg for sodium, 1.38–5.23 mg/kg for iron, 1.73–8.54 mg/kg for calcium and 0.27–1.12 mg/kg for copper. Copper is a necessary micronutrient, and toxicity limits have not been strictly established. Values between 1 and 100 mg/kg are common in vegetables [59]. The highest copper value was found in the Roori variety with a content of 1.12 mg/kg, most likely accumulated due to soil conditions. In contrast, Nazir et al. (2017) [60] identified elevated calcium values of up to 169 mg/kg, magnesium 19 mg/kg, iron 26 mg/kg, potassium 247 mg/kg and zinc 1.27 mg/kg in sea buckthorn samples from 2017. The ash content was higher than the results obtained in this study of 1.79%, while the highest ash content resulting from the 17 varieties was 0.5%. Eight sea buckthorn samples harvested in the fall of 2004 from Pakistan showed maximum calcium values of 1.25 g/kg, magnesium 240 mg/kg, iron 225 mg/kg and phosphorus 133 mg/kg [61].
The low content of mineral elements in the present study may be due to the soil being poor in minerals, so that the fruits will accumulate smaller amounts; inadequate fertilization causing a lack of essential nutrients; imbalances that can reduce mineral absorption; or drought affecting the ability of the roots to take up minerals from the soil [62,63].

4. Conclusions

Based on the present study, we can conclude that sea buckthorn is a valuable source of bioactive compounds. The phytochemical and nutritional composition of sea buckthorn is influenced by multiple factors, including genotype, soil characteristics, fruit maturity, cultivation practices, and environmental conditions. In the present study, however, the observed variation in bioactive compounds and physicochemical traits was primarily associated with varietal genetic characteristics and year-specific climatic conditions. Vitamin C was well preserved, and over the 3 years of analysis, it varied between 122 and 163 mg/100 g, which is known to be due to the lack of the enzyme ascorbic acid oxidase, which can lead to the degradation of ascorbic acid. The yellow-orange visual appearance is due to the high content of flavonoids and carotenoids. Carotenoid content ranged on average from 14 mg/100 g to 41 mg/100 g in 2020 samples that were affected by prolonged drought.
The total soluble solids content (°Bx) as an annual average varied inversely with acidity, which can influence sour flavor. The highest soluble solids content was recorded in 2020, with an annual average of 11.40 °Bx, while the highest acidity was 2.81 in 2021. In the present study, the highest sea buckthorn yield reported as weight of 100 fruit berries was 38.07 g in 2021. The three-year average was 37.75 g and the highest value was recorded for the hybrid variety R2 of 69.63 g (2020). The highest average annual length was recorded for the year 2022 of 9.77 mm, while the highest annual diameter was recorded in the year 2021 of 6.74 mm. The average of the years 2020–2022 over the 17 sea buckthorn species included values of 5.92 mm in diameter and 8.49 mm. The three-year average dry weight content ranged from 19.27 to 21.52%, with the highest values during the drought season.
The present study provides new insights into the comprehensive characterization of different sea buckthorn varieties and the inter-annual variability of their bioactive compounds under the same cultivation conditions over three consecutive years. The results demonstrate that cultivar selection plays a key role in maximizing the nutritional and health-promoting potential of sea buckthorn berries, while also highlighting the influence of environmental conditions, crop nutrition, and soil properties on the accumulation of bioactive compounds. These findings contribute to a better understanding of the interactions between genetic and environmental factors affecting fruit quality and provide valuable information for breeding programs, cultivar selection, and the development of commercial sea buckthorn plantations in the Republic of Moldova.

Author Contributions

Conceptualization, A.M., A.D., I.D., I.S., N.N., A.B., A.C., M.O. and I.A.; methodology, I.D. and A.M.; formal analysis, I.A.; investigation, I.D., A.M. and I.A.; resources A.M.; writing—original draft preparation, I.A. and I.D.; writing—review and editing, I.A. and I.D.; visualization, I.D.; supervision, A.M. and A.D.; project administration, A.D.; validation, A.D.; data curation, A.M. and I.D.; funding acquisition, A.D. All authors have read and agreed to the published version of the manuscript.

Funding

This work was supported by a grant of the Ministry of Education and Research, CCCDI-UEFISCDI, project number PN-IV-PCB-RO-MD-2024-0214, within PNCD IV.

Data Availability Statement

The original contributions presented in this study are included in the article. Further inquiries can be directed to the corresponding author.

Acknowledgments

This work was supported by a grant of the Ministry of Education and Research, CCCDI-UEFISCDI, project number PN-IV-PCB-RO-MD-2024-0214, within PNCD IV.

Conflicts of Interest

The authors declare no conflicts of interest.

References

  1. Li, T.S.C.; Schroeder, W.R. Sea Buckthorn (Hippophae rhamnoides L.): A Multipurpose Plant. Horttechnology 1996, 6, 370–380. [Google Scholar] [CrossRef]
  2. Tan, S.; Xu, Y.; Zhu, L.; Geng, Z.; Zhang, Q.; Yang, X. Hot Air Drying of Seabuckthorn (Hippophae rhamnoides L.) Berries: Effects of Different Pretreatment Methods on Drying Characteristics and Quality Attributes. Foods 2022, 11, 3675. [Google Scholar] [CrossRef] [PubMed]
  3. Nybom, H.; Ruan, C.; Rumpunen, K. The Systematics, Reproductive Biology, Biochemistry, and Breeding of Sea Buckthorn—A Review. Genes 2023, 14, 2120. [Google Scholar] [CrossRef] [PubMed]
  4. Zheng, Y.; Sun, K.; Sun, X.; Li, Y.; Xiao, P.; He, C. Quality Differences in Sea Buckthorn (Hippophaë rhamnoides L.) Berries of Major Varieties in China Based on Key Components and Antioxidant Activity. Food Chem. 2025, 465, 142139. [Google Scholar] [CrossRef] [PubMed]
  5. Ding, J.; Ruan, C.; Guan, Y.; Li, H.; Du, W.; Lu, S.; Wen, X.; Tang, K.; Chen, Y. Nontargeted Metabolomic and Multigene Expression Analyses Reveal the Mechanism of Oil Biosynthesis in Sea Buckthorn Berry Pulp Rich in Palmitoleic Acid. Food Chem. 2022, 374, 131719. [Google Scholar] [CrossRef] [PubMed]
  6. Kallio, H.; Yang, B.; Peippo, P. Effects of Different Origins and Harvesting Time on Vitamin C, Tocopherols, and Tocotrienols in Sea Buckthorn (Hippophaë rhamnoides) Berries. J. Agric. Food Chem. 2002, 50, 6136–6142. [Google Scholar] [CrossRef] [PubMed]
  7. Yang, B.; Halttunen, T.; Raimo, O.; Price, K.; Kallio, H. Flavonol Glycosides in Wild and Cultivated Berries of Three Major Subspecies of Hippophaë rhamnoides and Changes during Harvesting Period. Food Chem. 2009, 115, 657–664. [Google Scholar] [CrossRef]
  8. Chen, C.; Zhang, P.; Wei, Y.; Liang, X.; Wang, L.; Fu, X.; Zhang, J.; Zhao, Y. Different Drying Methods Drive Divergent Quality Profiles in Sea Buckthorn Protein Hydrolysates: Antioxidant Preservation versus Aroma Complexity. Food Chem. X 2026, 34, 103566. [Google Scholar] [CrossRef] [PubMed]
  9. Cimpoieş, G.; Popa, S.; Manziuc, V.; Rîbinţev, I.; Burduja, V.; Cvasov, I. Parametrii Ansamblului Vegetativ Ale Cătinei Albe În Funcție de Soi, Distanţă de Plantare Şi Modul de Conducere Al Pomilor. In Proceedings of the Horticultură, Viticultură şi Vinificaţie, Silvicultură şi Grădini Publice, Protecţia Plantelor, Chișinău, Moldova, 1–2 October 2018; Instrumentul Bibliometric National: Chișinău, Moldova, 2018; Volume 47, pp. 112–115. [Google Scholar]
  10. Ran, J.; Dong, G.; Xiao, W.; Yi, F.; Li, L.; Wu, Y. Explainable AI-Driven Hyperspectral Imaging for Non-Destructive Geographical Discrimination of Small-Fruited Sea Buckthorn: Metabolic Correlations and Feature Optimization. J. Food Compos. Anal. 2026, 151, 108985. [Google Scholar] [CrossRef]
  11. Macari, A.; Netreba, N.; Boeștean, O.; Sandulachi, E.; Sandu, I.; Dianu, I. ANALIZA INDICILOR FIZICO-CHIMICI A UNOR SOIURI DE CĂTINĂ ALBĂ ANALYSIS OF THE PHYSICO-CHEMICAL INDICES OF SOME VARIETY SEA VARIETIES Cătina (Hippophae rhamnoides L.) Este Bine Cunoscută ca o Plantă Multifuncțională, Care Este Cultivată Pe Scară Largă. Lucr. Ştiinţ. 2020, 743, 101–104. [Google Scholar]
  12. Available online: https://Ansa.Gov.Md/Sites/Default/Files/Documents/Materiale%20informative/Catalogul%20soiurilor%20soiurilor%20de%20plante%20RM.Pdf (accessed on 24 June 2026).
  13. Ursu, A.; Overenco, A.; Marcov, I.; Curcubặt, S. Chernozem: Soil of the Steppe. In Soil as World Heritage; Springer: Berlin/Heidelberg, Germany, 2013; pp. 3–8. [Google Scholar]
  14. Krupenikov, I.A.; Boincean, B.P.; Dent, D. The Chernozem Family. In The Black Earth: Ecological Principles for Sustainable Agriculture on Chernozem Soils; Springer: Berlin/Heidelberg, Germany, 2011; pp. 77–88. [Google Scholar]
  15. Jigău, G.; Dobrojan, S.; Moşoi, I.; Bunduc, P.T.; Turchin, B.; Dobrojan, G.; Jigău, C. Cernoziomurile Spaţiului Dintre Prut Şi Nistru În Contextul Modificărilor Actuale Ale Mediului. In Proceedings of the Serviciile Ecosistemice și Rolul Acestora în Sporirea Securității Ecologice și Rezilienței, Chișinău, Moldova, 31 May 2024; Instrumentul Bibliometric National: Chișinău, Moldova, 2024; pp. 69–78. [Google Scholar]
  16. Latimer, G.W., Jr. Official Methods of Analysis of AOAC INTERNATIONAL: 3-Volume Set; Oxford University Press: Oxford, UK, 2023. [Google Scholar]
  17. Nie, Y.; Yu, G.; Hu, H. Optimal Planting Areas of Sea Buckthorn (Hippophae rhamnoides) Under the Influences of Climate Change and Pests Using the MaxEnt Model. Agronomy 2025, 15, 2777. [Google Scholar] [CrossRef]
  18. Rajchal, R. Seabuckthorn (Hippophae salicifolia) Management Guide; The Rufford Small Grants for Nature Conservation: London, UK, 2009. [Google Scholar]
  19. Knutzen, F.; Averbeck, P.; Barrasso, C.; Bouwer, L.M.; Gardiner, B.; Grünzweig, J.M.; Hänel, S.; Haustein, K.; Johannessen, M.R.; Kollet, S. Impacts on and Damage to European Forests from the 2018–2022 Heat and Drought Events. Nat. Hazards Earth Syst. Sci. 2025, 25, 77–117. [Google Scholar] [CrossRef]
  20. Rakovec, O.; Samaniego, L.; Hari, V.; Markonis, Y.; Moravec, V.; Thober, S.; Hanel, M.; Kumar, R. The 2018–2020 Multi-year Drought Sets a New Benchmark in Europe. Earth’s Futur. 2022, 10, e2021EF002394. [Google Scholar] [CrossRef]
  21. Garrido-Perez, J.M.; Vicente-Serrano, S.M.; Barriopedro, D.; Garcia-Herrera, R.; Trigo, R.; Begueria, S. Examining the Outstanding Euro-Mediterranean Drought of 2021–2022 and Its Historical Context. J. Hydrol. 2024, 630, 130653. [Google Scholar] [CrossRef]
  22. Biella, R.; Shyrokaya, A.; Ionita, M.; Vignola, R.; Sutanto, S.J.; Todorovic, A.; Teutschbein, C.; Cid, D.; Llasat, M.C.; Alencar, P. The 2022 Drought Needs to Be a Turning Point for European Drought Risk Management. Nat. Hazards Earth Syst. Sci. 2025, 25, 4475–4501. [Google Scholar] [CrossRef]
  23. Available online: https://Weatherspark.Com/h/y/150254/2022/Historical-Weather-during-2022-in-Moldova#Figures-ColorTemperature (accessed on 24 June 2026).
  24. Stobdan, T.; Yadav, A.; Mishra, P.G.; Chaurasia, O.P.; Srivastava, R.B. Seabuckthorn: The Super Plant; DIHAR, Defence R&D Organisation: New Delhi, India, 2011; pp. 1–111. [Google Scholar]
  25. Li, H.; Ruan, C.; Ding, J.; Li, J.; Wang, L.; Tian, X. Diversity in Sea Buckthorn (Hippophae rhamnoides L.) Accessions with Different Origins Based on Morphological Characteristics, Oil Traits, and Microsatellite Markers. PLoS ONE 2020, 15, e0230356. [Google Scholar] [CrossRef] [PubMed]
  26. Lálity, Z.; Borsos, É.; Papp, Z.; Végvári, G.; Jócsák, I.; Kovács, B.H.; Simon, G. Sugar Content Analysis of Three Strawberry Cultivars Applying Two Different Cultivation Methods. Eur. J. Hortic. Sci. 2023, 88, 1–8. [Google Scholar] [CrossRef] [PubMed]
  27. Crucirescu, D. Physicochemical Characteristics of Unripe Apples. J. Eng. Sci. 2021, 28, 16. [Google Scholar] [CrossRef]
  28. Cristina Elena, G.; Bunea, A.; Rugină, D.; Pintea, A. Green Extraction of Carotenoids from Sea Buckthorn Pomace-the Effect of Solvent and Extraction Method. ProEnviron. Promediu 2023, 16, 41. [Google Scholar] [CrossRef]
  29. Ghendov-Mosanu, A.; Cristea, E.; Patras, A.; Sturza, R.; Padureanu, S.; Deseatnicova, O.; Turculet, N.; Boestean, O.; Niculaua, M. Potential Application of Hippophae rhamnoides in Wheat Bread Production. Molecules 2020, 25, 1272. [Google Scholar] [CrossRef] [PubMed]
  30. Tan, B.; Soderstrom, D.N. Qualitative Aspects of UV-Vis Spectrophotometry of Beta-Carotene and Lycopene. J. Chem. Educ. 1989, 66, 258. [Google Scholar] [CrossRef]
  31. Wolska, J.; Czop, M.; Jakubczyk, K.; Janda, K. Influence of Temperature and Brewing Time of Nettle (Urtica dioica L.) Infusions on Vitamin C Content. Rocz. Państw. Zakładu Hig. 2016, 67, 367–371. [Google Scholar]
  32. Ismail, B.P. Ash Content Determination. In Nielsen’s Food Analysis Laboratory Manual; Springer: Berlin/Heidelberg, Germany, 2024; pp. 129–131. [Google Scholar]
  33. Liang, J.; Zhang, G.; Song, Y.; He, C.; Zhang, J. Targeted Metabolome and Transcriptome Analyses Reveal the Pigmentation Mechanism of Hippophae (Sea Buckthorn) Fruit. Foods 2022, 11, 3278. [Google Scholar] [CrossRef] [PubMed]
  34. Xu, Y.; Yang, X.; Zhang, J.; Zhou, X.; Luo, L.; Zhang, Q. Visual Analysis of Sea Buckthorn Fruit Moisture Content Based on Deep Image Processing Technology. Food Chem. 2024, 453, 139558. [Google Scholar] [CrossRef] [PubMed]
  35. Rozhnov, E.D.; Shkolnikova, M.N.; Maksimiuk, N.N.; Voitsekhivskyi, V.I.; Tikhomirov, E.A.; Bobkova, E.Y. Optical Properties of Sea Buckthorn Drinks as the Main Physical Characteristic of Their Quality. In Proceedings of the IOP Conference Series: Earth and Environmental Science; IOP Publishing: Bristol, UK, 2020; Volume 613, p. 12126. [Google Scholar]
  36. Nicoleta, B.; Ghiorghi, G.; Viorel, I.; Nicu, D. MORPHOMETRIC VARIABILITY OF SEA BUCKTHORN SEEDS FROM WILD POPULATIONS AND CULTURE. Sci. Stud. Res. Ser. Biol. 2016, 25, 66–74. [Google Scholar]
  37. Macari, A.; Netreba, N.; Boeştean, O.; Sandu, I.; Dianu, I. Proprietăţile Fizice Şi Organoleptice Ale Fructelor de Cătina Albă Hippophae rhamnoides L. Cultivată În Republica Moldova. Ştiinţa Agric. 2021, 51–55. [Google Scholar]
  38. Yao, Y. Effects of Temperature Sum on Vitamin C Concentration and Yield of Sea Buckthorn (Hippophae rhamnoides) Fruit: Optimal Time of Fruit Harvest. Agric. Food Sci. 1993, 2, 497–505. [Google Scholar] [CrossRef]
  39. Negi, M.; Rajani. Morphological Description and Ecotypic Variability for Germplasm in Sea Buckthorn (Hippophae SalicifoliaD.Don.) Growing Under Higher Himalayan Region. Int. J. Curr. Microbiol. Appl. Sci. 2018, 7, 479–483. [Google Scholar] [CrossRef]
  40. Bartish, I.V.; Jeppsson, N.; Nybom, H.; Swenson, U. Phylogeny of Hippophae (Elaeagnaceae) Inferred from Parsimony Analysis of Chloroplast DNA and Morphology. Syst. Bot. 2002, 27, 41–54. [Google Scholar]
  41. Ilhan, G.; Gundogdu, M.; Karlović, K.; Židovec, V.; Vokurka, A.; Ercişli, S. Main Agro-Morphological and Biochemical Berry Characteristics of Wild-Grown Sea Buckthorn (Hippophae rhamnoides L. ssp. caucasica Rousi) Genotypes in Turkey. Sustainability 2021, 13, 1198. [Google Scholar] [CrossRef]
  42. Rousi, A. The Genus Hippophae L. A Taxonomic Study. In Proceedings of the Annales Botanici Fennici; JSTOR: New York, NY, USA, 1971; pp. 177–227. [Google Scholar]
  43. Singh, V.; Zubarev, Y. Breeding Strategies of Russian Seabuckthorn (Hippophae rhamnoides ssp. mongolica) Varieties and Their Global Introduction. In Seabuckthorn (Hippophae L.): A Multipurpose Wonder Plant: Emerging Trends in Research & Technologies; Daya Publishing House: New Delhi, India, 2014; Volume 4, pp. 71–88. [Google Scholar]
  44. Green, R.C.; Low, N.H. Physicochemical Composition of Buffaloberry (Shepherdia argentea), Chokecherry (Prunus virginiana) and Sea Buckthorn (Hippophae rhamnoides) Fruit Harvested in Saskatchewan, Canada. Can. J. Plant Sci. 2013, 93, 1143–1153. [Google Scholar] [CrossRef]
  45. Tkacz, K.; Wojdyło, A.; Turkiewicz, I.P.; Bobak, Ł.; Nowicka, P. Anti-Oxidant and Anti-Enzymatic Activities of Sea Buckthorn (Hippophaë rhamnoides L.) Fruits Modulated by Chemical Components. Antioxidants 2019, 8, 618. [Google Scholar] [CrossRef] [PubMed]
  46. Plante, S.D.E. Soiurilor de Plante Al Republicii Moldova Pentru Anul 2026; ANSA: Chișinău, Moldova, 2026. [Google Scholar]
  47. Tyl, C.; Sadler, G.D. PH and Titratable Acidity. In Food Analysis; Springer: Berlin/Heidelberg, Germany, 2017; pp. 389–406. [Google Scholar]
  48. Ion, V.A.; Parvulescu, O.C.; Velcea, D.; Popa, O.; Ahmadi, M. Physico-Chemical Parameters and Antioxidant Activity of Romanian Sea Buckthorn Berries. Rev. Chim. 2019, 70, 4187–4192. [Google Scholar] [CrossRef]
  49. Máté, M.; Selimaj, G.; Simon, G.; Szalóki-Dorkó, L.; Ficzek, G. Assessment of Berries of Some Sea Buckthorn Genotypes by Physicochemical Properties and Fatty Acid Content of the Seed. Plants 2022, 11, 3412. [Google Scholar] [CrossRef] [PubMed]
  50. Chirila, E.; Oancea, E.; Oancea, I.A. Physico-Chemical Characterisation of Sea Buckthorn Extracts for Cosmetic Use. Analele Univ. “Ovidius” Constanta—Ser. Chim. 2014, 25, 75–80. [Google Scholar] [CrossRef]
  51. Cardoso, P.C.; Tomazini, A.P.B.; Stringheta, P.C.; Ribeiro, S.M.R.; Pinheiro-Sant’Ana, H.M. Vitamin C and Carotenoids in Organic and Conventional Fruits Grown in Brazil. Food Chem. 2011, 126, 411–416. [Google Scholar] [CrossRef]
  52. Korekar, G.; Dolkar, P.; Singh, H.; Srivastava, R.B.; Stobdan, T. Variability and the Genotypic Effect on Antioxidant Activity, Total Phenolics, Carotenoids and Ascorbic Acid Content in Seventeen Natural Population of Seabuckthorn (Hippophae rhamnoides L.) from Trans-Himalaya. LWT-Food Sci. Technol. 2014, 55, 157–162. [Google Scholar] [CrossRef]
  53. Sadowska, U.; Słupski, J. The effect of the harvest date on the possibility of harvesting by shaking, chemical composition, color, and antioxidant properties of common sea buckthorn fruit (Hippophae rhamnoides L.). Agronomy 2025, 15, 1184. [Google Scholar] [CrossRef]
  54. Guo, R.; Guo, X.; Li, T.; Fu, X.; Liu, R.H. Comparative Assessment of Phytochemical Profiles, Antioxidant and Antiproliferative Activities of Sea Buckthorn (Hippophaë rhamnoides L.) Berries. Food Chem. 2017, 221, 997–1003. [Google Scholar] [CrossRef] [PubMed]
  55. Crupi, P.; Faienza, M.F.; Naeem, M.Y.; Corbo, F.; Clodoveo, M.L.; Muraglia, M. Overview of the Potential Beneficial Effects of Carotenoids on Consumer Health and Well-Being. Antioxidants 2023, 12, 1069. [Google Scholar] [CrossRef] [PubMed]
  56. Gutzeit, D.; Baleanu, G.; Winterhalter, P.; Jerz, G. Vitamin C Content in Sea Buckthorn Berries (Hippophaë rhamnoides L. ssp. rhamnoides) and Related Products: A Kinetic Study on Storage Stability and the Determination of Processing Effects. J. Food Sci. 2008, 73, C615–C620. [Google Scholar] [CrossRef] [PubMed]
  57. He, C.; Zhang, G.; Zhang, J.; Zeng, Y.; Liu, J. Integrated Analysis of Multiomic Data Reveals the Role of the Antioxidant Network in the Quality of Sea Buckthorn Berry. FASEB J. 2017, 31, 1929–1938. [Google Scholar] [CrossRef] [PubMed]
  58. Roba, C.; Roşu, C.; Piştea, I.; Ozunu, A.; Baciu, C. Heavy Metal Content in Vegetables and Fruits Cultivated in Baia Mare Mining Area (Romania) and Health Risk Assessment. Environ. Sci. Pollut. Res. 2016, 23, 6062–6073. [Google Scholar] [CrossRef] [PubMed]
  59. Pruteanu, A.; Voicea, I.; Fatu, V. Accumulation of Copper in Vegetables and Fruits. Eng. Rural Dev. 2022, 583–589. [Google Scholar]
  60. Nazir, F.; Salim, R.; Bashir, M. Chemical and Antioxidant Properties of Sea Buckthorn (Hippophae rhamnoides). Pharma Innov. J. 2017, 6, 173–176. [Google Scholar]
  61. Sabir, S.M.; Maqsood, H.; Ahmed, S.D.; Shah, A.H.; Khan, M.Q. Chemical and Nutritional Constituents of Sea Buckthorn (Hippophae rhamnoides ssp. turkestanica) Berries from Pakistan. Ital. J. Food Sci. 2005, 17, 455. [Google Scholar]
  62. Ciolacu, T. CURRENT STATE OF HUMUS IN ARABLE CHERNOZEMS OF MOLDOVA. Sci. Pap. Ser. A Agron. 2017, 60, 57–60. [Google Scholar]
  63. Ahmad, N.; Hussain, S.; Ali, M.A.; Minhas, A.; Waheed, W.; Danish, S.; Fahad, S.; Ghafoor, U.; Baig, K.S.; Sultan, H.; et al. Correlation of Soil Characteristics and Citrus Leaf Nutrients Contents in Current Scenario of Layyah District. Horticulturae 2022, 8, 61. [Google Scholar] [CrossRef]
Figure 1. Map of the geographical origin of different fruit species and the sea buckthorn culture of the C6 species (GPS coordinates: 47°10′34″ N, 29°10′04″ E).
Agronomy 16 01446 g001
Figure 2. Overview of hourly temperatures across the three years in Moldova. Hourly temperature is reported in colored bands [23].
Agronomy 16 01446 g002
Figure 3. Overall images of sea buckthorn fruits and the associated leaves.
Agronomy 16 01446 g003
Table 1. Number of berries identified in 100 g of fruit and average weight of 100 fruits.
VarietyNo. of Fruit Berries in 100 g (HBW)Average Weight of 100 Fruits, g
202020212022202020212022
AGA358 ± 1 g362 ± 1 f373 ± 2 f27.74 ± 0.38 j28.02 ± 0.27 j26.14 ± 0.12 j
AGG268 ± 2 j248 ± 2 j229 ± 2 j37.65 ± 0.42 g38.05 ± 0.25 g37.28 ± 0.16 f
C6331 ± 2 h311 ± 2 h332 ± 1 h30.64 ± 0.41 i30.85 ± 0.65 i29.96 ± 0.35 h
Clara363 ± 2 f345 ± 2 g348 ± 1 g27.94 ± 0.39 j28.35 ± 0.45 j28.08 ± 0.24 i
Cora490 ± 1 d482 ± 1 d492 ± 2 d20.45 ± 0.10 L21.13 ± 0.21 k20.89 ± 0.35 L
Dora666 ± 2 a648 ± 2 a659 ± 1 a15.35 ± 0.32 o16.34 ± 0.28 m16.04 ± 0.25 n
Hergo596 ± 2 b542 ± 2 b568 ± 1 b16.89 ± 0.11 n16.26 ± 0.12 m15.92 ± 0.11 n
Leikora320 ± 2 i311 ± 2 h332 ± 1 h31.69 ± 0.38 h32.05 ± 0.12 h31.85 ± 0.18 g
Mara533 ± 1 c528 ± 1 c552 ± 1 c18.99 ± 0.23 m19.20 ± 0.35 L18.93 ± 0.45 m
Mr.Sandu316 ± 1 i306 ± 1 i315 ± 2 i31.86 ± 0.21 h32.12 ± 0.48 h31.58 ± 0.24 g
Pomorancevaia161 ± 1 m142 ± 1 mn161 ± 1 l62.16 ± 0.29 d63.02 ± 0.35 d62.98 ± 0.28 c
R1187 ± 2 l163 ± 2 l168 ± 2 k53.62 ± 0.34 e54.25 ± 0.12 e53.55 ± 0.28 d
R2144 ± 1 o132 ± 1 o138 ± 2 o69.63 ± 0.37 a69.91 ± 0.45 a69.38 ± 0.27 a
R4151 ± 1 n138 ± 1 n143 ± 2 n66.62 ± 0.33 b67.35 ± 0.25 b66.89 ± 0.17 b
R5157 ± 1 m146 ± 1 m148 ± 1 m63.80 ± 0.22 c64.25 ± 0.32 c63.58 ± 0.25 c
Roori460 ± 2 e455 ± 2 e468 ± 2 e21.61 ± 0.50 k22.05 ± 0.30 k21.75 ± 0.20 k
Seirola230 ± 2 k226 ± 2 k232 ± 1 j43.69 ± 0.29 f44.06 ± 0.28 f43.08 ± 0.44 e
Annual mean337.11322.64332.8237.6638.0737.52
Three-year average330.8537.75
Within each year, mean values in the same column followed by different letters are significantly different (p < 0.001). Values in italics were previously discussed in Macari et al. (2021) [37].
Table 2. Diameter and length of sea buckthorn fruits.
VarietyDiameter (D), mmLength (L), mm
202020212022202020212022
AGA5.95 ± 0.53 efg5.03 ± 0.25 def4.89 ± 0.52 cd9.25 ± 0.54 cde9.15 ± 0.36 e9.05 ± 0.14 f
AGG6.42 ± 0.47 ef6.63 ± 0.21 bc6.28 ± 0.12 b9.23 ± 0.44 de9.12 ± 0.28 e8.99 ± 0.62 f
C66.95 ± 0.32 cde7.03 ± 0.26 b6.83 ± 0.18 b10.29 ± 0.55 cd10.13 ± 0.25 de10.05 ± 0.45 ef
Clara6.62 ± 0.50 de6.46 ± 0.30 bc6.32 ± 0.15 b10.72 ± 0.64 bcd10.05 ± 0.25 de9.96 ± 0.15 ef
Cora5.76 ± 0.58 efg5.38 ± 0.11 de5.24 ± 0.15 c7.76 ± 0.56 ef7.35 ± 0.38 f7.08 ± 0.52 gh
Dora4.50 ± 0.41 g4.23 ± 0.55 f4.18 ± 0.32 d6.16 ± 0.55 f6.13 ± 0.25 f5.98 ± 0.15 h
Hergo4.71 ± 0.51 g4.35 ± 0.30 f4.26 ± 0.14 d7.59 ± 0.48 ef7.28 ± 0.56 f7.25 ± 0.35 g
Leikora7.26 ± 0.51 bcde7.16 ± 0.26 b7.06 ± 0.12 b11.34 ± 0.66 bc11.13 ± 0.15 cd11.01 ± 0.35 de
Mara4.93 ± 0.34 fg4.53 ± 0.22 ef4.32 ± 0.11 d7.68 ± 0.56 ef7.38 ± 0.35 f7.26 ± 0.20 g
Mr.Sandu7.33 ± 0.36 abcde7.15 ± 0.02 b7.02 ± 0.01 b9.45 ± 0.51 cde9.12 ± 0.65 e9.06 ± 0.65 f
Pomorancevaia8.80 ± 0.72 ab8.60 ± 0.14 a8.42 ± 0.11 a12.64 ± 0.84 ab12.32 ± 0.65 bc12.18 ± 0.35 bcd
R18.39 ± 0.44 abc8.62 ± 0.28 a8.28 ± 0.35 a12.44 ± 0.72 ab12.24 ± 0.54 bc12.14 ± 0.25 cd
R28.91 ± 0.53 a9.03 ± 0.25 a8.64 ± 0.36 a14.03 ± 1.00 a13.86 ± 0.29 a13.63 ± 0.14 a
R48.41 ± 0.74 abc8.17 ± 0.35 a7.95 ± 0.48 a13.95 ± 1.08 a13.65 ± 0.85 ab13.42 ± 0.62 ab
R58.44 ± 0.71 abc8.22 ± 0.61 a8.10 ± 0.41 a13.72 ± 0.89 a13.29 ± 0.52 ab13.10 ± 0.32 abc
Roori5.88 ± 0.50 efg5.72 ± 0.20 cd5.28 ± 0.30 c6.71 ± 0.39 f6.95 ± 0.85 f6.56 ± 0.55 gh
Seirola8.10 ± 0.62 abcd8.30 ± 0.62 a8.09 ± 0.35 a9.88 ± 0.84 cd9.54 ± 0.54 e9.35 ± 0.45 f
Annual mean4.56.746.546.169.549.77
Three-year average5.928.49
Within each year, mean values in the same column followed by different letters are significantly different (p < 0.001). Values in italics were previously discussed in Macari et al. (2021) [37].
Table 3. Soluble and insoluble substances.
VarietySoluble Solids (°Bx)Dry Weight (%)
202020212022202020212022
AGA13.33 ± 0.06 d10.60 ± 0.02 ab9.03 ± 0.06 f22.22 ± 0.81 cd22.09 ± 0.12 a20.35 ± 0.35 bc
AGG15.00 ± 0.10 b11.01 ± 0.01 a10.30 ± 0.01 de20.75 ± 1.21 de18.15 ± 0.2 ghi19.57 ± 0.15 cd
C610.07 ± 0.26 h10.23 ± 0.06 bc10.77 ± 0.06 cd23.09 ± 0.36 c21.11 ± 0.23 cd20.13 ± 0.23 bc
Clara12.66 ± 0.06 e7.20 ± 0.06 hi7.73 ± 0.06 gh19.41 ± 0.25 efg18.91 ± 0.15 fg18.91 ± 0.11 de
Cora15.73 ± 0.06 a10.30 ± 0.03 bc12.27 ± 0.06 a25.34 ± 0.22 b18.84 ± 0.20 fg18.34 ± 0.32 efg
Dora11.7 ± 0.06 g7.17 ± 0.06 hi7.20 ± 0.01 h26.82 ± 0.38 ab20.25 ± 0.25 de19.95 ± 0.15 c
Hergo9.77 ± 0.06 h6.98 ± 0.02 hi8.20 ± 0.53 g22.16 ± 0.06 cd21.25 ± 0.06 bc20.95 ± 0.02 b
Leikora9.10 ± 0.06 i6.73 ± 0.25 ij8.20 ± 0.10 g20.58 ± 0.14 def19.54 ± 0.20 ef18.85 ± 0.45 def
Mara12.73 ± 0.06 e7.83 ± 0.06 fg11.53 ± 0.06 b28.17 ± 0.68 a23.15 ± 0.83 a22.05 ± 0.20 a
Mr.Sandu14.13 ± 0.06 c8.98 ± 0.10 d10.90 ± 0.10 bcd25.76 ± 0.06 b23.25 ± 0.06 a22.65 ± 0.04 a
Pomorancevaia12.13 ± 0.23 f6.23 ± 0.25 j11.53 ± 0.41 b19.57 ± 0.56 efg17.97 ± 0.10 hi18.54 ± 0.25 efg
R18.03 ± 0.15 k6.73 ± 0.25 ij11.30 ± 0.35 bc18.85 ± 0.25 gh17.32 ± 0.15 ij18.02 ± 0.25 fgh
R28.13 ± 0.12 k8.40 ± 0.27 e12.33 ± 0.11 a17.35 ± 0.86 h17.01 ± 0.25 j17.35 ± 0.11 h
R48.70 ± 0.10 j8.10 ± 0.2 ef10.80 ± 0.41 cd19.03 ± 0.37 fgh18.25 ± 0.1 gh17.95 ± 0.65 gh
R58.66 ± 0.12 j7.37 ± 0.4 gh10.60 ± 0.10 de18.59 ± 0.68 gh17.32 ± 0.35 ij18.02 ± 0.15 fgh
Roori14.80 ± 0.10 b9.83 ± 0.12 c10.01 ± 0.01 e19.83 ± 0.64 efg18.53 ± 0.25 gh17.93 ± 0.40 gh
Seirola9.16 ± 0.06 i6.88 ± 0.02 hi10.70 ± 0.10 cd18.32 ± 0.53 gh17.75 ± 0.33 hij18.05 ± 0.22 efgh
Annual mean11.408.2610.2021.5219.4519.27
Three-year average9.9520.08
Within each year, mean values in the same column followed by different letters are significantly different (p < 0.001). Data are expressed as the mean of the data. Values in italics were previously discussed in Macari et al. (2020) [11].
Table 4. pH and titrable acidity.
VarietypHTitrable Acidity
202020212022202020212022
AGA2.77 ± 0.01 b3.30 ± 0.19 ab3.15 ± 0.02 bcd3.45 ± 0.14 b3.87 ± 0.12 b3.34 ± 0.02 c
AGG2.71 ± 0.08 b2.75 ± 0.01 def3.14 ± 0.05 bcd4.39 ± 0.01 a4.54 ± 0.14 a3.65 ± 0.03 b
C62.82 ± 0.02 ab2.92 ± 0.09 bcdef3.25 ± 0.04 bcd3.17 ± 0.10 bc3.04 ± 0.25 e2.58 ± 0.03 f
Clara3.08 ± 0.01 ab2.83 ± 0.06 cdef3.26 ± 0.02 bcd2.00 ± 0.07 e2.57 ± 0.09 f2.23 ± 0.13 g
Cora2.80 ± 0.02 b2.72 ± 0.03 f3.12 ± 0.12 bcd4.31 ± 0.09 a3.59 ± 0.23 bc3.79 ± 0.02 b
Dora3.05 ± 0.03 ab2.94 ± 0.02 bcdef3.23 ± 0.05 bcd2.75 ± 0.09 d2.15 ± 0.05 gh1.63 ± 0.05 hi
Hergo2.90 ± 0.01 ab3.03 ± 0.2 abcdef3.39 ± 0.08 ab3.19 ± 0.20 bc3.25 ± 0.03 de3.07 ± 0.01 d
Leikora3.00 ± 0.03 ab3.01 ± 0.08 abcdef3.25 ± 0.18 bcd2.67 ± 0.10 d2.67 ± 0.1 f2.69 ± 0.08 ef
Mara2.78 ± 0.02 b2.73 ± 0.02 ef3.07 ± 0.03 d4.24 ± 0.17 a3.64 ± 0.06 bc4.31 ± 0.02 a
Mr.Sandu2.93 ± 0.56 ab3.04 ± 0.05 abcdef3.18 ± 0.09 bcd2.45 ± 0.06 d3.34 ± 0.05 cde2.94 ± 0.14 de
Pomorancevaia3.13 ± 0.02 ab2.96 ± 0.07 bcdef3.15 ± 0.04 bcd1.59 ± 0.0 fg1.87 ± 0.02 hi1.30 ± 0.01 j
R13.24 ± 0.01 a3.37 ± 0.05 a3.09 ± 0.09 cd1.34 ± 0.09 g1.74 ± 0.03 i1.74 ± 0.26 h
R23.05 ± 0.04 ab3.08 ± 0.37 abcdef3.58 ± 0.01 a1.80 ± 0.01 ef1.72 ± 0.07 i1.35 ± 0.01 j
R43.09 ± 0.01 ab3.13 ± 0.05 abcd3.37 ± 0.14 abc1.93 ± 0.02 e2.20 ± 0.05 g1.47 ± 0.03 ij
R53.03 ± 0.01 ab3.23 ± 0.05 ab3.28 ± 0.21 bcd2.05 ± 0.19 e1.99 ± 0.05 ghi1.65 ± 0.02 hi
Roori3.03 ± 0.01 ab3.11 ± 0.11 abcde3.23 ± 0.04 bcd3.09 ± 0.13 c3.52 ± 0.02 cd3.06 ± 0.01 d
Seirola3.13 ± 0.06 ab3.21 ± 0.04 abc3.28 ± 0.02 bcd2.07 ± 0.01 e2.21 ± 0.03 g2.04 ± 0.04 g
Annual mean2.973.023.242.732.812.52
Three-year average3.072.68
Within each year, mean values in the same column followed by different letters are significantly different (p < 0.001). Values in italics were previously discussed in Macari et al. (2020) [11].
Table 5. Carotenoid and vitamin C content evolution during the 3-year study of sea buckthorn samples.
VarietyChemical Indicators
Total Carotenoid Content, mg/100 gVitamin C Content, mg/100 g
202020212022202020212022
AGA6.78 ± 0.06 p6.23 ± 0.252 hi3.35 ± 0.11 f102.50 ± 0.10 g83.39 ± 0.50 h70.03 ± 0.1 l
AGG10.84 ± 0.03 n5.43 ± 0.09 i8.29 ± 0.29 j26.70 ± 0.10 j26.42 ± 0.17 n23.19 ± 0.45 o
C610.49 ± 0.14 o8.55 ± 1.1 g7.93 ± 0.56 j134.60 ± 7.60 f125.17 ± 0.29 e70.24 ± 0.39 L
Clara25.40 ± 0.01 j11.13 ± 0.53 f10.47 ± 0.38 h145.30 ± 0.10 e115.61 ± 0.35 f98.63 ± 0.38 h
Cora23.33 ± 0.01 k4.92 ± 0.57 i6.02 ± 0.02 k103.80 ± 0.10 g66.03 ± 0.2 j49.65 ± 0.07 m
Dora111.29 ± 0.14 a48.92 ± 0.61 a21.65 ± 0.31 d180.00 ± 0.10 d198.68 ± 0.2 d148.67 ± 0.46 e
Hergo30.33 ± 0.07 i8.65 ± 0.06 g10.74 ± 0.02 h103.50 ± 0.10 g83.39 ± 0.34 h94.31 ± 0.13 i
Leikora34.93 ± 0.07 h12.61 ± 0.7 f16.65 ± 0.11 ef313.10 ± 0.10 b228.26 ± 1.58 c296.83 ± 0.37 b
Mara65.48 ± 0.07 d17.40 ± 0.38 e18.26 ± 0.62 e206.30 ± 0.10 c264.95 ± 0.1 b200.00 ± 0.01 d
Mr.Sandu42.71 ± 0.14 g7.83 ± 0.2 gh9.89 ± 0.15 hi98.30 ± 0.10 g83.33 ± 0.17 h75.74 ± 0.19 k
Pomorancevaia49.05 ± 0.07 f15.44 ± 0.34 e15.70 ± 0.57 f38.01 ± 0.48 i39.51 ± 0.08 m45.74 ± 0.63 n
R158.24 ± 0.07 e19.65 ± 1.09 d26.97 ± 0.91 c96.91 ± 0.01 g62.67 ± 0.36 k141.32 ± 0.80 f
R218.61 ± 0.01 m12.07 ± 1.12 f31.08 ± 0.63 b98.00 ± 5.40 g65.89 ± 0.42 j138.01 ± 0.38 g
R419.09 ± 0.01 L5.79 ± 0.79 hi13.91 ± 0.87 g83.00 ± 0.12 h79.27 ± 0.33 i92.55 ± 0.26 j
R523.54 ± 0.07 k5.51 ± 0.34 i15.23 ± 0.37 fg79.70 ± 6.10 h41.83 ± 0.22 L94.40 ± 0.27 j
Roori98.20 ± 0.07 b38.85 ± 0.90 b30.58 ± 0.64 b777.20 ± 0.01 a419.44 ± 0.097 a615.02 ± 0.68 a
Seirola72.70 ± 0.07 c24.49 ± 1.14 c34.92 ± 0.91 a188.20 ± 0.01 d104.17 ± 0.74 g234.36 ± 0.33 c
Annual mean41.2314.9116.57163.24122.82146.39
Three-year average24.23144.15
Within each year, mean values in the same column followed by different letters are significantly different (p < 0.001). Values in italics were previously discussed in Macari et al. (2020) [11].
Table 6. Mineral content of sea buckthorn varieties, for samples from 2020, n = 3 (mg/kg).
SampleNa (mg/kg)Fe (mg/kg)Ca (mg/kg)Cu (mg/kg)Pb (mg/kg)Ash (%)
AGA1.2408 ± 0.09 cd3.4497 ± 0.04 d5.4971 ± 0.01 c0.6082 ± 0.00 cde0.0146 ± 0.00 ab0.4214 ± 0.02 cd
AGG1.2222 ± 0.07 d2.8971 ± 0.00 e5.6566 ± 0.01 c0.5822 ± 0.00 cde0.0099 ± 0.00 ab0.42810 ± 0.01 bc
C61.2461 ± 0.04 d3.7859 ± 0.05 c4.1787 ± 0.01 f0.4131 ± 0.00 ef0.0084 ± 0.00 ab0.3608 ± 0.11 ef
CLARA1.0739 ± 0.06 e3.5321 ± 0.00 cd4.081 ± 0.02 f0.5109 ± 0.00 de0.0034 ± 0.00 ab0.4598 ± 0.02 abc
CORA1.6051 ± 0.06 a5.2343 ± 0.05 a8.5411 ± 0.02 a0.9963 ± 0.00 ab0.0152 ± 0.00 a0.3808 ± 0.00 de
DORA0.3788 ± 0.04 h1.3865 ± 0.00 i1.7345 ± 0.00 j0.2755 ± 0.00 f0.0026 ± 0.00 b0.1306 ± 0.03 i
HERGO0.9597 ± 0.14 f3.6575 ± 0.01 cdn.d.0.4005 ± 0.00 ef0.0142 ± 0.00 ab0.5017 ± 0.00 a
Leikora0.9379 ± 0.00 f2.5534 ± 0.01 f5.0916 ± 0.06 d0.7027 ± 0.00 bcd0.0025 ± 0.00 b0.4831 ± 0.04 ab
MARA1.3245 ± 0.07 bc4.5001 ± 0.09 b6.078 ± 0.00 b0.8244 ± 0.00 a0.0256 ± 0.00 ab0.4398 ± 0.00 c
MR. SANDU1.2150 ± 0.12 d2.9602 ± 0.01 e5.3923 ± 0.00 cd0.4765 ± 0.00 ef0.0081 ± 0.00 ab0.3474 ± 0.00 efg
POMORANCEVAIA1.0656 ± 0.20 e2.2803 ± 0.03 gh3.1787 ± 0.00 h0.4547 ± 0.00 ef0.0036 ± 0.00 ab0.2560 ± 0.02 h
R10.9644 ± 0.03 f2.2216 ± 0.02 g3.3302 ± 0.01 gh0.6257 ± 0.00 de0.0019 ± 0.00 ab0.3349 ± 0.00 efg
R21.4579 ± 0.24 b4.5934 ± 0.19 b3.6092 ± 0.00 g0.9198 ± 0.00 abc0.0147 ± 0.00 ab0.3191 ± 0.00 gh
R40.9692 ± 0.06 f3.0655 ± 0.12 e2.6464 ± 0.00 i0.5031 ± 0.00 ef0.0172 ± 0.00 ab0.3170 ± 0.02 fg
R50.7582 ± 0.05 g2.0142 ± 0.24 h3.1024 ± 0.31 h0.4581 ± 0.21 ef0.0114 ± 0.12 ab0.2922 ± 0.00 gh
ROORI1.1963 ± 0.18 d3.4917 ± 0.12 d5.2948 ± 0.00 cd1.1237 ± 0.00 a0.0063 ± 0.00 ab0.4633 ± 0.03 abc
SEIROLA0.9595 ± 0.13 f2.5947 ± 0.02 f4.4707 ± 0.04 e0.5173 ± 0.00 ef0.0092 ± 0.00 ab0.4313 ± 0.05 c
Mean values in the same column followed by different letters are significantly different (p < 0.001). Pb content data not significant (Pr > F = 0.098). n.d.—not detected.
Disclaimer/Publisher’s Note: The statements, opinions and data contained in all publications are solely those of the individual author(s) and contributor(s) and not of MDPI and/or the editor(s). MDPI and/or the editor(s) disclaim responsibility for any injury to people or property resulting from any ideas, methods, instructions or products referred to in the content.