Article

Trehalose-6-Phosphate Promotes Growth, Yield, and Recovery After Pre-Flowering Drought Stress in Adzuki Bean (Vigna angularis)

1
Crop Research Institute, Liaoning Academy of Agricultural Sciences, Shenyang 110161, China
2
College of Agronomy, Shenyang Agricultural University, Shenyang 110866, China
*
Authors to whom correspondence should be addressed.
Agronomy 2026, 16(13), 1279; https://doi.org/10.3390/agronomy16131279
Submission received: 4 June 2026 / Revised: 26 June 2026 / Accepted: 29 June 2026 / Published: 2 July 2026
(This article belongs to the Special Issue Crop Agronomic Traits and Performances Under Stress)

Abstract

Trehalose-6-phosphate (T6P) is involved in the regulation of plant growth and stress-related responses; however, its potential role in post-drought recovery remains unclear in legume crops. This study evaluated whether foliar application of native T6P could improve growth, yield formation, and physiological recovery in adzuki bean after pre-flowering drought stress. We aimed to propose a model for the production and drought tolerance regulation in adzuki bean. A three-year field experiment was conducted by applying T6P at both the budding stage and the initial pod stage. The plant architecture, yield, photosynthetic characteristics, defensive enzyme activity, sugar metabolism and hormone changes were evaluated. The results indicated that T6P significantly increased root, stem and leaf parameters in adzuki bean it also increased all yield traits except for the main stem branches and sections during post-drought recovery. Indeed, the yield per block of 5μM and 10μM of T6P application during post-drought recovery increased by 20.66% and 31.60% on average compared to the control under well-watered conditions and by 47.68% and 60.20% under drought stress during the three experimental years. Foliar T6P treatment was associated with higher antioxidant enzyme activities and related gene expression, lower ROS accumulation and proline content, and changes in sugar- and hormone-related traits during post-drought recovery. Therefore, foliar application of T6P at the budding and initial pod stages improved growth, yield formation, and post-drought recovery in adzuki bean. The result provide a novel strategy for T6P application for coordinating the high production potential and crop resilience.

1. Introduction

Drought stress stands as a critical environmental factor that negatively impacts plant growth and productivity, primarily by limiting water and nutrient uptake and substantially reducing overall yield [1,2,3]. It disrupts plant growth and development through various physiological and molecular alterations, such as impairment of photosynthesis, respiration, sugar metabolism, hormonal equilibrium, defense enzyme activities, and gene and protein expression [4]. To cope with water scarcity, plants have developed numerous adaptive strategies. For instance, drought can trigger the production of stress-protective compounds like sugars and proline, as well as activate antioxidant systems to sustain redox homeostasis [5,6,7,8]. Additionally, drought stress modifies the levels of key phytohormones, including abscisic acid (ABA), jasmonic acid, and indole-3-acetic acid (IAA), influencing their respective signaling pathways. Numerous plant responses to drought involve the regulation of defensive genes that contribute to enhanced drought tolerance [9,10].
Trehalose (Tre) metabolism, particularly the role of trehalose-6-phosphate (T6P), has gained significant attention for its essential function in regulating sucrose utilization and distribution, which is crucial for plant growth and development [11,12,13,14]. T6P has been identified as a key molecule associated with carbon supply, acting as a mediator in sugar sensing [15]. The concentration of T6P, a principal sugar signal in plants, shows a positive correlation with sucrose levels, effectively functioning as a sucrose sensor [13]. In plants, T6P undergoes dephosphorylation via trehalose-6-phosphate phosphatase (TPP) to form Tre [16,17]. Tre contributes to resilience against various environmental stresses, including drought, salinity, and low temperatures [18,19,20,21]. Previous studies have shown that chemical strategies designed to enhance T6P signaling can improve crop performance. For example, Griffiths et al. demonstrated that a cell-permeable T6P precursor increased yield and improved drought recovery in wheat [22].
Adzuki bean (Vigna angularis) is an essential cash crop in China, valued for its unique health-promoting components that are beneficial to the food industry [23]. However, the role of T6P in regulating the coordination of growth and development in adzuki bean during post-drought recovery remains unclear. In this study, the variety “Lhxd08” was selected to examine the impact of T6P application on growth and drought tolerance in adzuki bean. The objectives included evaluating the influence of T6P on plant structure, yield, photosynthetic performance, defensive enzyme activities, sugar metabolism, and hormone variations. Consequently, the results establish a theoretical basis for maximizing productivity and drought resilience by enhancing T6P usage and reveal a new mechanism of T6P-mediated growth regulation and drought tolerance in adzuki bean. Additionally, it is anticipated that a T6P-based approach will offer a sustainable, environmentally friendly strategy for improving crop resilience and supporting sustainable agricultural practices.

2. Materials and Methods

2.1. Experimental Site

Field experiments were conducted at the experimental station of Liaoning Academy of Agricultural Sciences (LAAS, Shenyang, China) (41°48′11.75″ N, 123°25′31.18″ E, and 50 m above sea level) in the 2021, 2022 and 2023 growing seasons. This region has a warm and semi-humid continental monsoon climate. Weather statistics during the adzuki bean growth cycle in the interval from the end of May to the end of September (2021 and 2023) are shown in Figure S1. The soil in the study area is classified as Eutric Cambisol (sand 42.6%, silt 38.7%, and clay 18.7%) according to the World Reference Base for Soil Resources [22]. The farm soil characteristics (0–50 cm) of the experimental site before planting were analyzed and are shown in Table S1.

2.2. Experimental Design

The adzuki bean (Vigna angularis) variety Lhxd08, provided by the Crop Research Institute, Liaoning Academy of Agricultural Sciences (LAAS, China), was used in this study. The experiment was conducted in a single shared field using a split-plot arrangement with three replications. Water regime was assigned as the main-plot factor, and the field was divided into two adjacent water-management sectors: a well-watered sector (C) and a pre-flowering drought-stress/recovery sector (D). The two sectors were separated by buffer ridges and protection rows to minimize lateral water movement. Within each water-management sector, T6P concentration was arranged as a randomized subplot factor, including 0, 5, and 10 μM. Thus, six treatment combinations were established: C0, C5, and C10 under well-watered conditions, and D0, D5, and D10 under pre-flowering drought followed by rewatering. Each plot covered 50 m2.
To establish and control drought stress under field conditions, plants in the D sector were grown under a rain shelter that prevented rainfall from reaching the crop. For the well-watered treatment, soil moisture was maintained at approximately 75–85% of field capacity throughout the growing season by supplemental irrigation. For the D treatment, irrigation was withheld after the appearance of the third trifoliate leaf and continued until 45 days after emergence (DAE), when plants had reached the early flowering stage. During this water-deficit period, soil moisture was controlled at approximately 35–45% of field capacity. After 45 DAE, the D plots were re-irrigated and subsequently maintained at 75–85% of field capacity until harvest (Table S2).
T6P solutions at 0, 5, and 10 μM were applied as foliar sprays twice during the vegetation cycle. The first foliar application was performed at 45 DAE, immediately after the pre-flowering drought-stress period and at the early flowering/budding stage, and the second application was performed three weeks later, at approximately 66 DAE, corresponding to the initial pod stage. All spray solutions contained 0.05% (v/v) Tween-20. The 0 μM T6P treatment contained 0.05% Tween-20 without T6P and served as the control. Foliar spraying was performed in the late afternoon using approximately 2.0 L of solution per plot until the leaf surfaces were uniformly wetted without runoff.
Field management practices included basal application of compound fertilizer before sowing, manual weeding at the seedling and flowering stages, pest and disease control according to local agronomic recommendations, and irrigation management according to the designed water regimes. No additional plant growth regulators were applied except for the T6P treatments.

2.3. Sampling and Determination

2.3.1. Plant Sampling

Twenty uniform and representative bean plants were sampled from the control and each treatment at the flower-pegging stage, pod-setting stage, and pod-filling stage, respectively. Ten plant samples were used to measure the plant architecture parameters. The third leaves of the other ten plant samples were immediately frozen in liquid nitrogen and stored at −80 °C for the measurement of defensive factors and enzyme activity, sugar level, plant hormones and defense-related gene expression.

2.3.2. Plant Architecture

Root length (RL) and plant height (PH) were measured using a steel ruler at the flower-pegging stage. Main root diameter (MRD) and main stem diameter (MSD) were measured using a vernier caliper. Leaf area (LA) of the third leaf from the main stem of each adzuki bean plant was measured using a YMJ-PC plant leaf area meter (Lvbo, Hangzhou, China). Root fresh weight (RFW) and leaf fresh weight (LFW) were measured immediately after sampling using an electronic analytical balance (FA2004, Shanghai Precision & Scientific Instrument Co., Ltd., Shanghai, China; accuracy 0.0001 g). For dry weight determination, root and leaf samples were first oven-dried at 105 °C for 30 min and then dried at 75 °C until reaching a constant weight, approximately 48 h. Constant weight was defined as a mass change of less than 0.001 g between two consecutive weighings. After drying, the samples were cooled to room temperature in a desiccator and weighed using the same analytical balance to determine root dry weight (RDW) and leaf dry weight (LDW). Ten plants from each treatment were used as biological replicates for these measurements.

2.3.3. Adzuki Bean Yield and Yield Trait

An area of 50 m2 (10 m × 5 m) was sampled in each experimental plot at maturity, and all plants in this area were harvested manually; all harvested pods were air-dried and threshed to obtain the yield per block (YPB) of adzuki bean. The number of plants in each area was recorded to determine yield per plant (YPP) based on YPB. Ten representative plants were sampled from each area to record main stem branches (MSB), main stem sections (MSS), and pods per plant (PPP). Twenty pods were sampled to measure pod length (PL) and seeds per pod (SPP), and hundred seed weight (HSW) was assessed through five replicates.

2.3.4. Photosynthetic Characteristics Analysis

The chlorophyll content of adzuki bean leaves was determined using a chemical extraction method. Briefly, 0.2 g of fresh leaf tissue was cut into small pieces and extracted with 10 mL of 80% acetone in the dark at 4 °C until the tissue became colorless. The extract was centrifuged at 5000× g for 10 min, and the absorbance of the supernatant was measured at 663 and 645 nm using a spectrophotometer. Total chlorophyll content was calculated according to the following formula: total chlorophyll content = [(8.02 × A663 + 20.20 × A645) × V]/(1000 × W), where A663 and A645 represent the absorbance values at 663 and 645 nm, respectively, V represents the final extract volume (mL), and W represents the fresh weight of the leaf sample (g). The chlorophyll content was expressed as mg/g fresh weight. The net photosynthetic rate (Pn), stomatal conductance (Gs), intercellular CO2 concentration (Ci), and transpiration rate (Tr) were measured using a GB-1102 portable photosynthesis system (BX51, Beijing, China). Five plants were selected from each plot, and the third leaf from the main stem of each plant was measured between 9:00 and 11:00 a.m. on sunny days.

2.4. Defensive Factor and Enzyme Assay

The malondialdehyde (MDA) content was analyzed using the trichloroacetic acid (TCA) method described by Ma et al. [24], with several modifications. Total hydrogen peroxide (H2O2) content was measured according to Sagisaka [25], with a few modifications: namely, absorbance of the supernatant was measured at 480 nm after a 12,000 rpm spin of the reaction mixture in an E5804 centrifuge (Eppendorf, Hamburg, Germany). Soluble protein content was quantified by the Bradford method [26], using bovine serum albumin (BSA) as the standard. The free proline protocol of Bates et al. [27] was employed to estimate the proline contents of adzuki bean leaves. The absorbance readings of standards and samples were taken at 520 nm against a toluene blank using the spectrophotometer. Superoxide dismutase (SOD) activity was assayed following the method; peroxidase (POD) activity was assayed according to the method of Do et al. [28]. Catalase (CAT) activity was measured following the methodology of Berrs and Sizer [29].

2.5. Sugar Measurement

The starch content was measured using the method of Fredeen et al. [30]. The 0.5 g leaf samples ground with 2 mL distilled water were incubated with 3.2 mL of 60% HClO4 for 10 min and then centrifuged at 5000× g for 5 min. The supernatants were diluted to 10 mL with distilled water, and the absorbance value was measured at 660 nm. Sucrose and glucose were estimated enzymatically as described [31]. Samples of approximately 0.5 g of leaves were subjected to extraction for 30 min with 10 mL of an ethanol/water mixture (80:20, v/v) used as a high-temperature (80 °C) extraction solvent. The solution was filtered and evaporated to dryness under nitrogen, with an aliquot of the filtrate redissolved in 0.5 mL of 0.1 mM ethylenediaminetetraacetic acid calcium disodium salt (CaEDTA) solution for measurement. The trehalose content was measured using a trehalose kit (Solarbio Science Technology, Beijing, China).

2.6. Plant Hormones

Endogenous plant hormones were quantified using liquid chromatography–tandem mass spectrometry (LC-MS/MS) with multiple reaction monitoring (MRM), with modifications according to previously described methods [32,33]. Leaf samples were collected from the middle portion of the third fully expanded leaves on the main stem at the flower-pegging, pod-setting, and pod-filling stages, avoiding the petiole and main vein. Samples were immediately frozen in liquid nitrogen and stored at −80 °C until analysis. C0 at the corresponding developmental stage and year was used as the well-watered baseline control, while D0 served as the corresponding 0 μM T6P control under the post-drought recovery condition.
Approximately 0.5 g of frozen leaf tissue was ground in liquid nitrogen and extracted with pre-cooled isopropanol:water acid solution at 2:1:0.002 (v/v/v). Isotope-labeled internal standards, including D5-IAA, D6-ABA, D2-GA3, D5-JA, and D6-SA, were added before extraction to correct for extraction losses and matrix effects. After dichloromethane extraction and centrifugation, the lower organic phase was collected, evaporated under nitrogen, redissolved in methanol containing 0.1% formic acid, and filtered through a 0.22 μm membrane. IAA, ABA, GA3, JA, and SA were quantified by LC-MS/MS using authentic standards and corresponding isotope-labeled internal standards. Hormone contents were normalized to fresh weight and expressed as ng g−1 FW.

2.7. RNA Extraction and Quantitative Real-Time PCR Analysis

Total RNA was extracted using TRIzol reagent (Tiangen, Beijing, China) and evaluated by a NanoDrop 2000 spectrophotometer for detecting RNA quality and quantity. cDNA was synthesized as a template using a reverse transcription kit (Tiangen, China), and the quantitative real-time PCR reaction (qRT-PCR) was performed using the SuperReal PreMix Plus reagent (Tiangen, Beijing, China) and a qTOWER 2.2 real-time PCR system (Analytikjena, Jena, Germany) with three biological replicates and the actin gene as an internal control to standardize the data [34]. Threshold values (CT) were used to quantify relative gene expression, followed by the comparative 2−ΔΔCT method [35]. All primers used for qRT-PCR were designed using Primer Premier 5.0 (PREMIER Biosoft International, Palo Alto, CA, USA), as shown in Table S3.

2.8. Statistical Analysis

The experiment was conducted in a split-plot design with three biological replicates in each growing season, with water regime as the main-plot factor and T6P concentration as the subplot factor. Each experimental plot was considered an independent experimental unit, and plant-level measurements within each plot were treated as subsamples and averaged before statistical analysis. Data, including the effects of year, water regime, T6P concentration, and their interactions, were analyzed using split-plot ANOVA. When significant effects were detected, Duncan’s multiple range test was used for mean separation at p < 0.05. Statistical analyses were performed using SPSS software (version 22.0; IBM Corp., Armonk, NY, USA), and Excel 2023 and Origin 2021 were used for data organization and figure preparation.

3. Results

3.1. Plant Architecture and Yield Traits

The plant architecture parameters of adzuki bean measured at the flower-pegging stage, approximately 52 days after emergence, are shown in Table 1. Pre-flowering drought stress followed by rewatering reduced RL, MRD, RFW, RDW, PH, MSD, LA, LFW, and LDW compared with the well-watered controls. However, T6P treatment mitigated several of these reductions during post-drought recovery. During the 2021–2023 growing seasons, T6P application significantly increased RL, MRD, RFW, RDW, and MSD in the D treatments compared with D0 (p < 0.05). Specifically, under the D10 treatment, these parameters increased by an average of 45.76%, 47.36%, 19.17%, 56.14%, and 55.11%, respectively, compared with D0. Conversely, PH, LA, LFW, and LDW were negatively affected by the pre-flowering water-deficit treatment, although T6P application increased LA, LFW, and LDW, but not PH, during post-drought recovery. In particular, LA, LFW, and LDW increased by 4.93%, 17.35%, and 15.98% under D5 and by 12.35%, 47.54%, and 47.30% under D10, respectively, compared with D0 across the three years. However, PH decreased by 16.15% and 36.25% under D5 and D10, respectively, compared with D0 (Figure S2A). These results indicate that T6P application was associated with improved recovery growth of root, stem, and leaf traits after pre-flowering drought stress.
As shown in Table 2, yield-related traits were measured at maturity. Pre-flowering drought stress followed by rewatering significantly decreased the yield traits of adzuki bean compared with the well-watered controls during the 2021–2023 growing seasons (p < 0.05). With T6P treatment, MSB and MSS declined under both well-watered and post-drought recovery conditions compared with C0 or D0. The largest reductions in MSB and MSS, averaging 16.92% and 9.53%, respectively, were observed in D5 relative to D0 from 2021 to 2023. However, PPP, PL, SPP, HSW, and YPP increased markedly in D10, with average increases of 68.77%, 24.88%, 29.81%, 35.82%, and 61.38%, respectively, compared with D0 (Figure S2B,C). D10 showed a stronger effect on these parameters than D5. YPB also increased substantially in D5 and D10, with average increases of 47.68% and 60.20% over D0, respectively, and by 20.66% and 31.60% compared with C0. These findings suggest that T6P application promoted yield formation during post-drought recovery after pre-flowering drought stress.

3.2. The Chlorophyll Content and Photosynthetic Characteristics

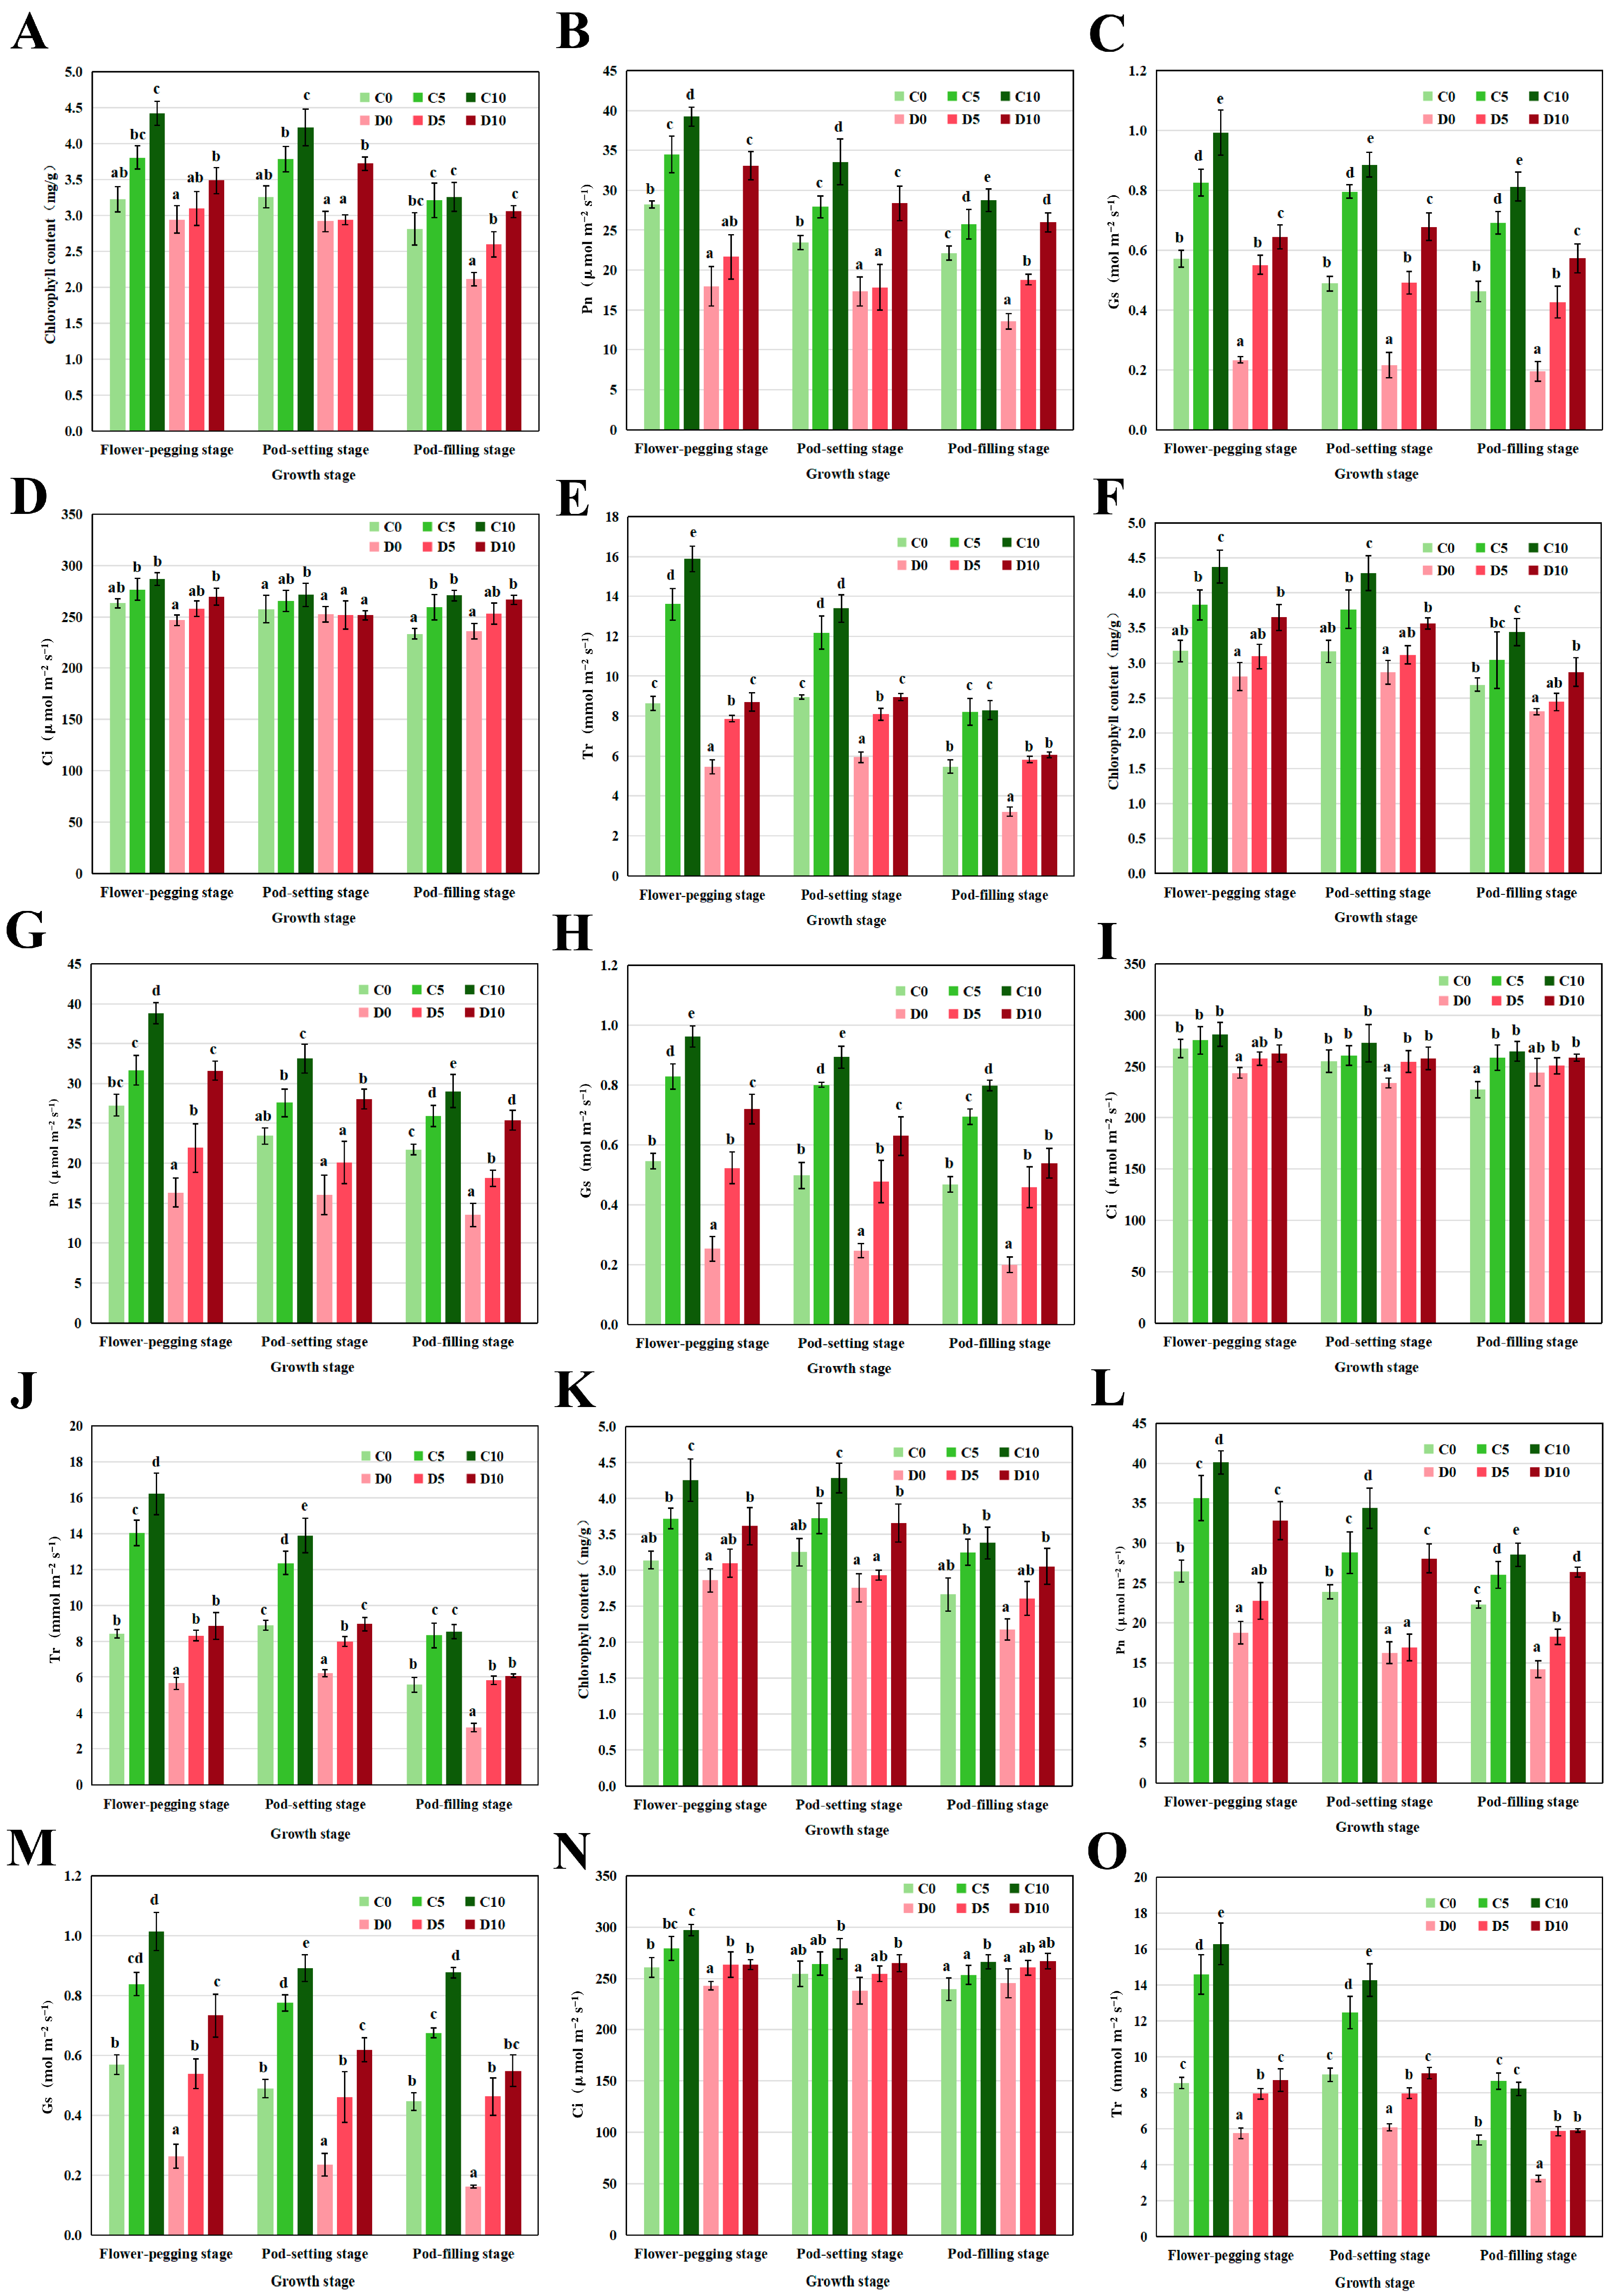
As illustrated in Figure 1, the drought stress caused a decline in the chlorophyll content of adzuki bean leaves, while T6P application significantly enhanced the chlorophyll levels under both drought and well-watered conditions, with increases corresponding to higher T6P concentrations. At the flower-pegging, pod-setting, and pod-filling stages, 10 μM T6P treatment led to the highest chlorophyll content in drought-stressed plants. Specifically, during post-drought recovery without T6P application (D0), the minimum chlorophyll levels were 2.17, 2.31, and 2.11 mg/g, while the maximum chlorophyll content observed in well-watered plants with 10 μM T6P (C10) during the flower-pegging stage from 2021 to 2023 reached 4.26, 4.37, and 4.42 mg/g, respectively (Figure 1A,F,K). Additionally, the net photosynthetic rate increased with higher T6P levels (Figure 1B,G,L), likely due to the enhanced chlorophyll content and photosynthetic efficiency provided by T6P. During post-drought recovery, both chlorophyll content and photosynthetic rate in D5 and D10 were greater than D0, though lower than well-watered controls. In D10, the average net photosynthetic rate at the flower-pegging, pod-setting, and pod-filling stages was 32.50, 28.17, and 25.92 μmol/m−2·s−1 across the three years, even surpassing the control (C0). Comparing well-watered plants (CK) treated with T6P (C5, C10) to those without (C0), we observed that the stomatal conductance, the intercellular CO2 concentration, and the transpiration rates from 2021 to 2023 obviously decreased. In drought-stressed plants, T6P applications under D5 and D10 significantly increased these parameters compared to D0. At the flower-pegging stage in D10, the average stomatal conductance, intercellular CO2 concentration, and transpiration rate over three experimental years were 0.70 mol m−2·s−1, 265.15 μmol/m−2·s−1, and 8.76 mmol/m−2·s−1, respectively, exceeding D0 levels and comparable to C0. These results suggest that foliar T6P treatment was associated with improved photosynthetic performance in drought-recovering plants after pre-flowering water deficit.

3.3. The Defense-Related Enzyme Activity and Relative Gene Expression

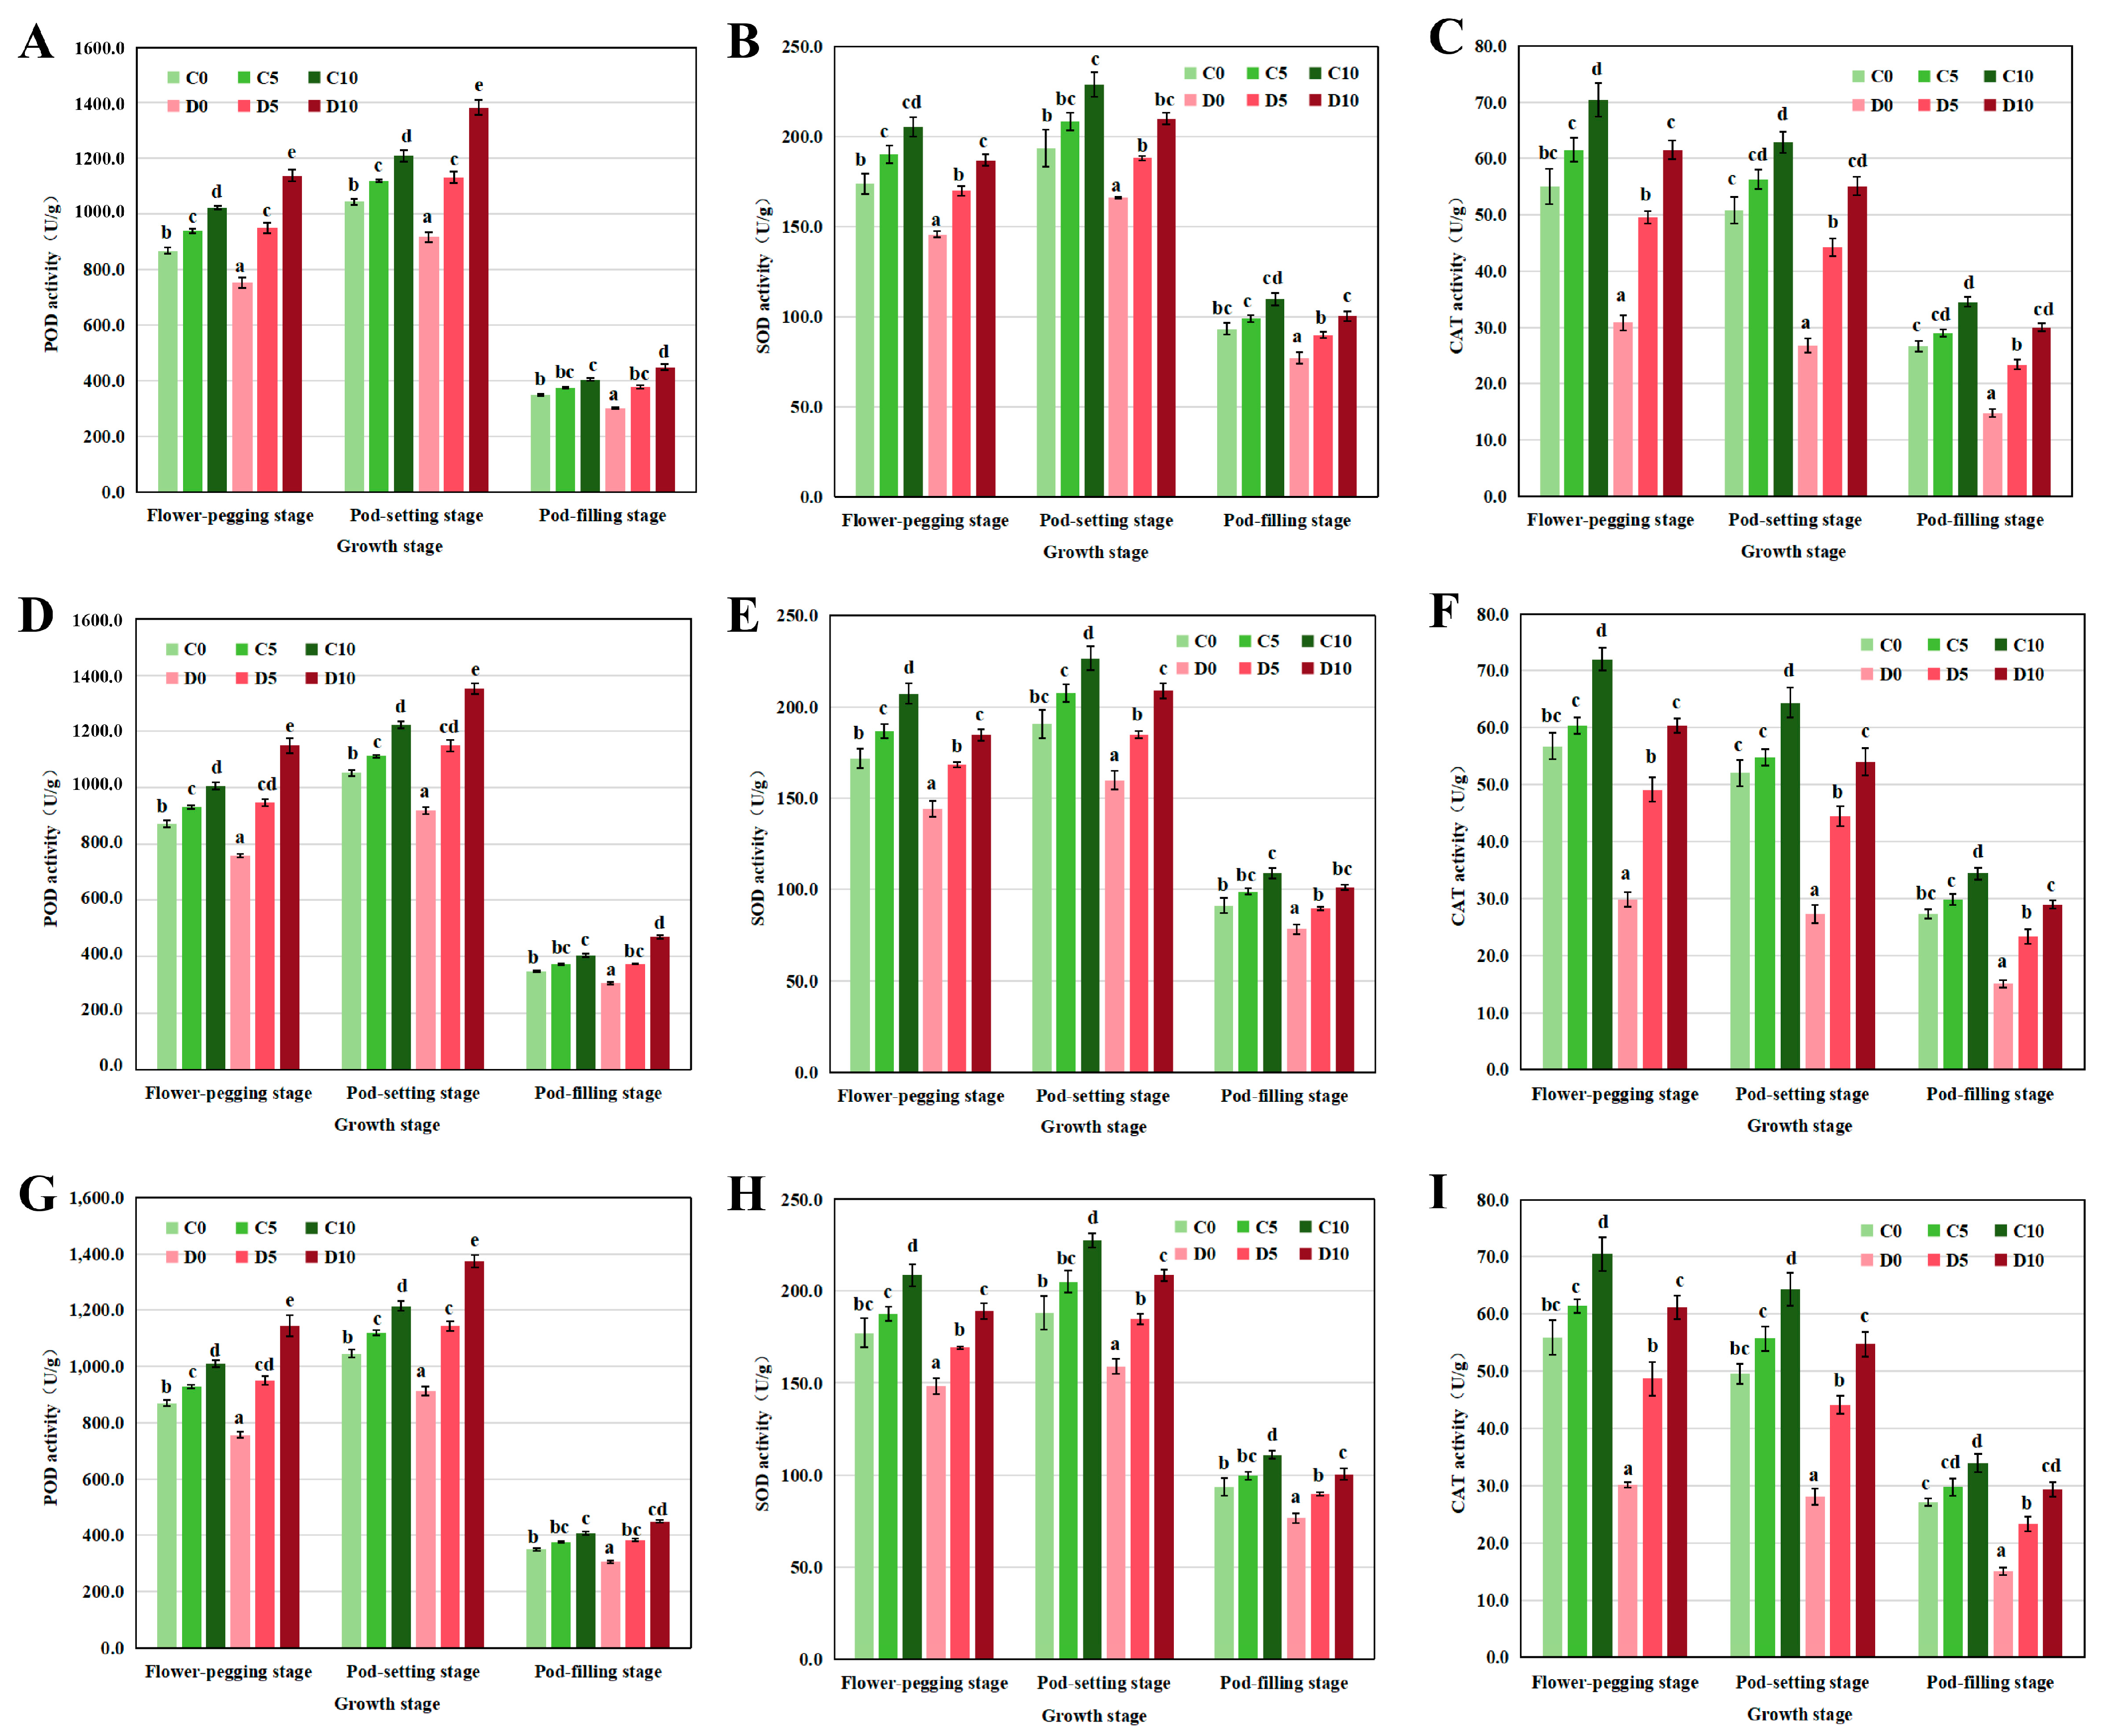
The activity of three key enzymes involved in the plant defense response was analyzed in adzuki bean leaves during the flower-pegging, pod-setting, and pod-filling stages. As shown in Figure 2, T6P application significantly boosted POD, SOD, and CAT activities compared to controls, and the enzyme activity levels rose with T6P concentrations. Remarkably, POD activity in D10 during post-drought recovery even exceeded that of well-watered controls. The highest values of 1383.55, 1351.38, and 1372.48 U/g were observed at the pod-setting stage across the three years. SOD and CAT activities also peaked in D10, with their average maximums reaching 209.17 and 61.01 U/g at the pod-setting and flower-pegging stages, respectively. However, the three enzyme activities at the pod-filling stage were significantly lower than at the other two stages. These results suggested that T6P enhances drought resistance by activating the key defensive enzymes in adzuki bean.
Real-time quantitative PCR was used to analyze the expression of genes encoding these enzymes at the three growth stages (Figure S3). T6P treatment led to significantly higher expression levels of POD, SOD, and CAT genes than the controls. The incremental coding gene expression of the three key enzymes after T6P treatment may be one of the major factors for the increased enzyme activity in adzuki bean leaves.

3.4. MDA, H2O2, Proline and Soluble Protein Contents

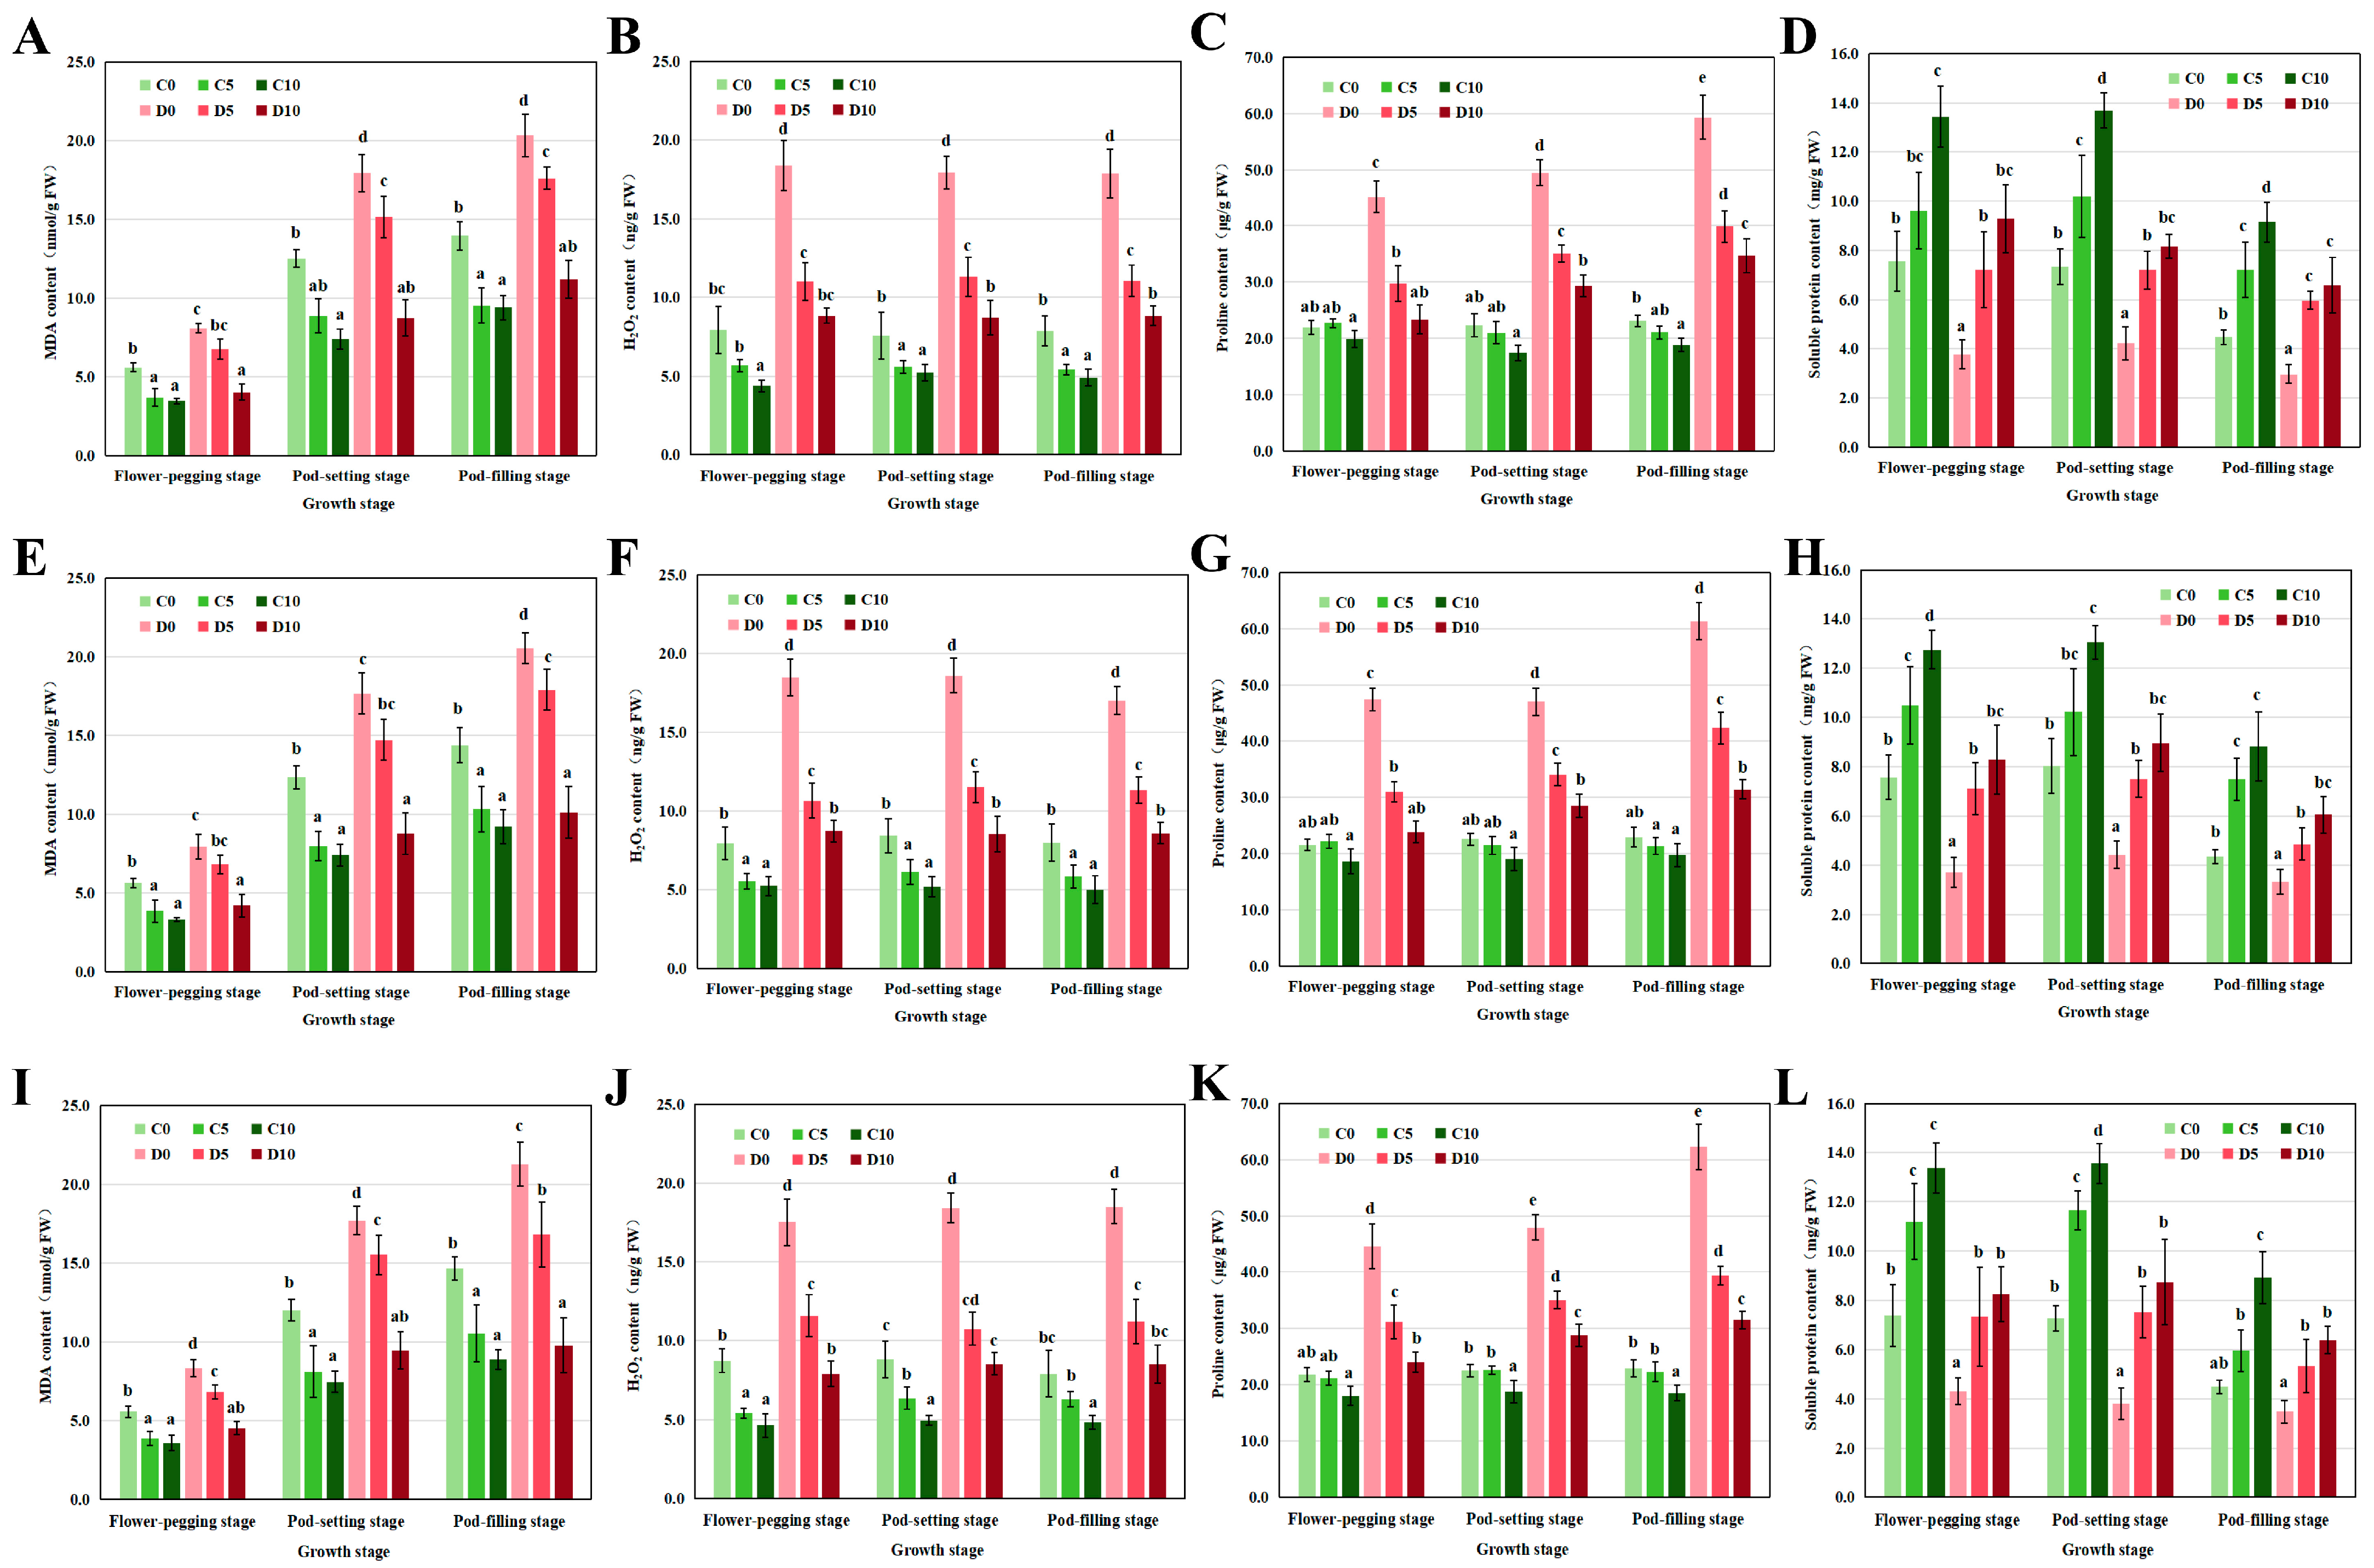
In Figure 3, the drought stress led to increases in MDA, H2O2, and proline levels of adzuki bean leaves, while T6P application reduced these levels. The pattern changes of MDA were similar to those observed for H2O2 and proline, and the enhancement of the three defensive factors caused by drought stress was distinctly inhibited by T6P. Among these, MDA and proline levels were significantly lower at the flower-pegging stage than at the other two stages during the three experimental years. C10 reduced MDA levels to a minimum of 3.45, 3.30, and 3.56 nmol/g fresh weight and decreased the proline levels to 19.85, 18.63, and 17.95 μg/g fresh weight during the flower-pegging stage. Conversely, the soluble protein content, which decreased during post-drought recovery, was enhanced by T6P (Figure 3D,H,L). Soluble protein levels were noticeably higher at the flower-pegging and pod-setting stages than at the pod-filling stage, reaching the peaks of 13.43, 13.04, and 13.55 mg/g fresh weight during the experimental years. These findings indicate that T6P plays a key role in alleviating drought stress in adzuki bean by lowering MDA, H2O2, and proline levels while enhancing soluble protein content.

3.5. Carbohydrate Content

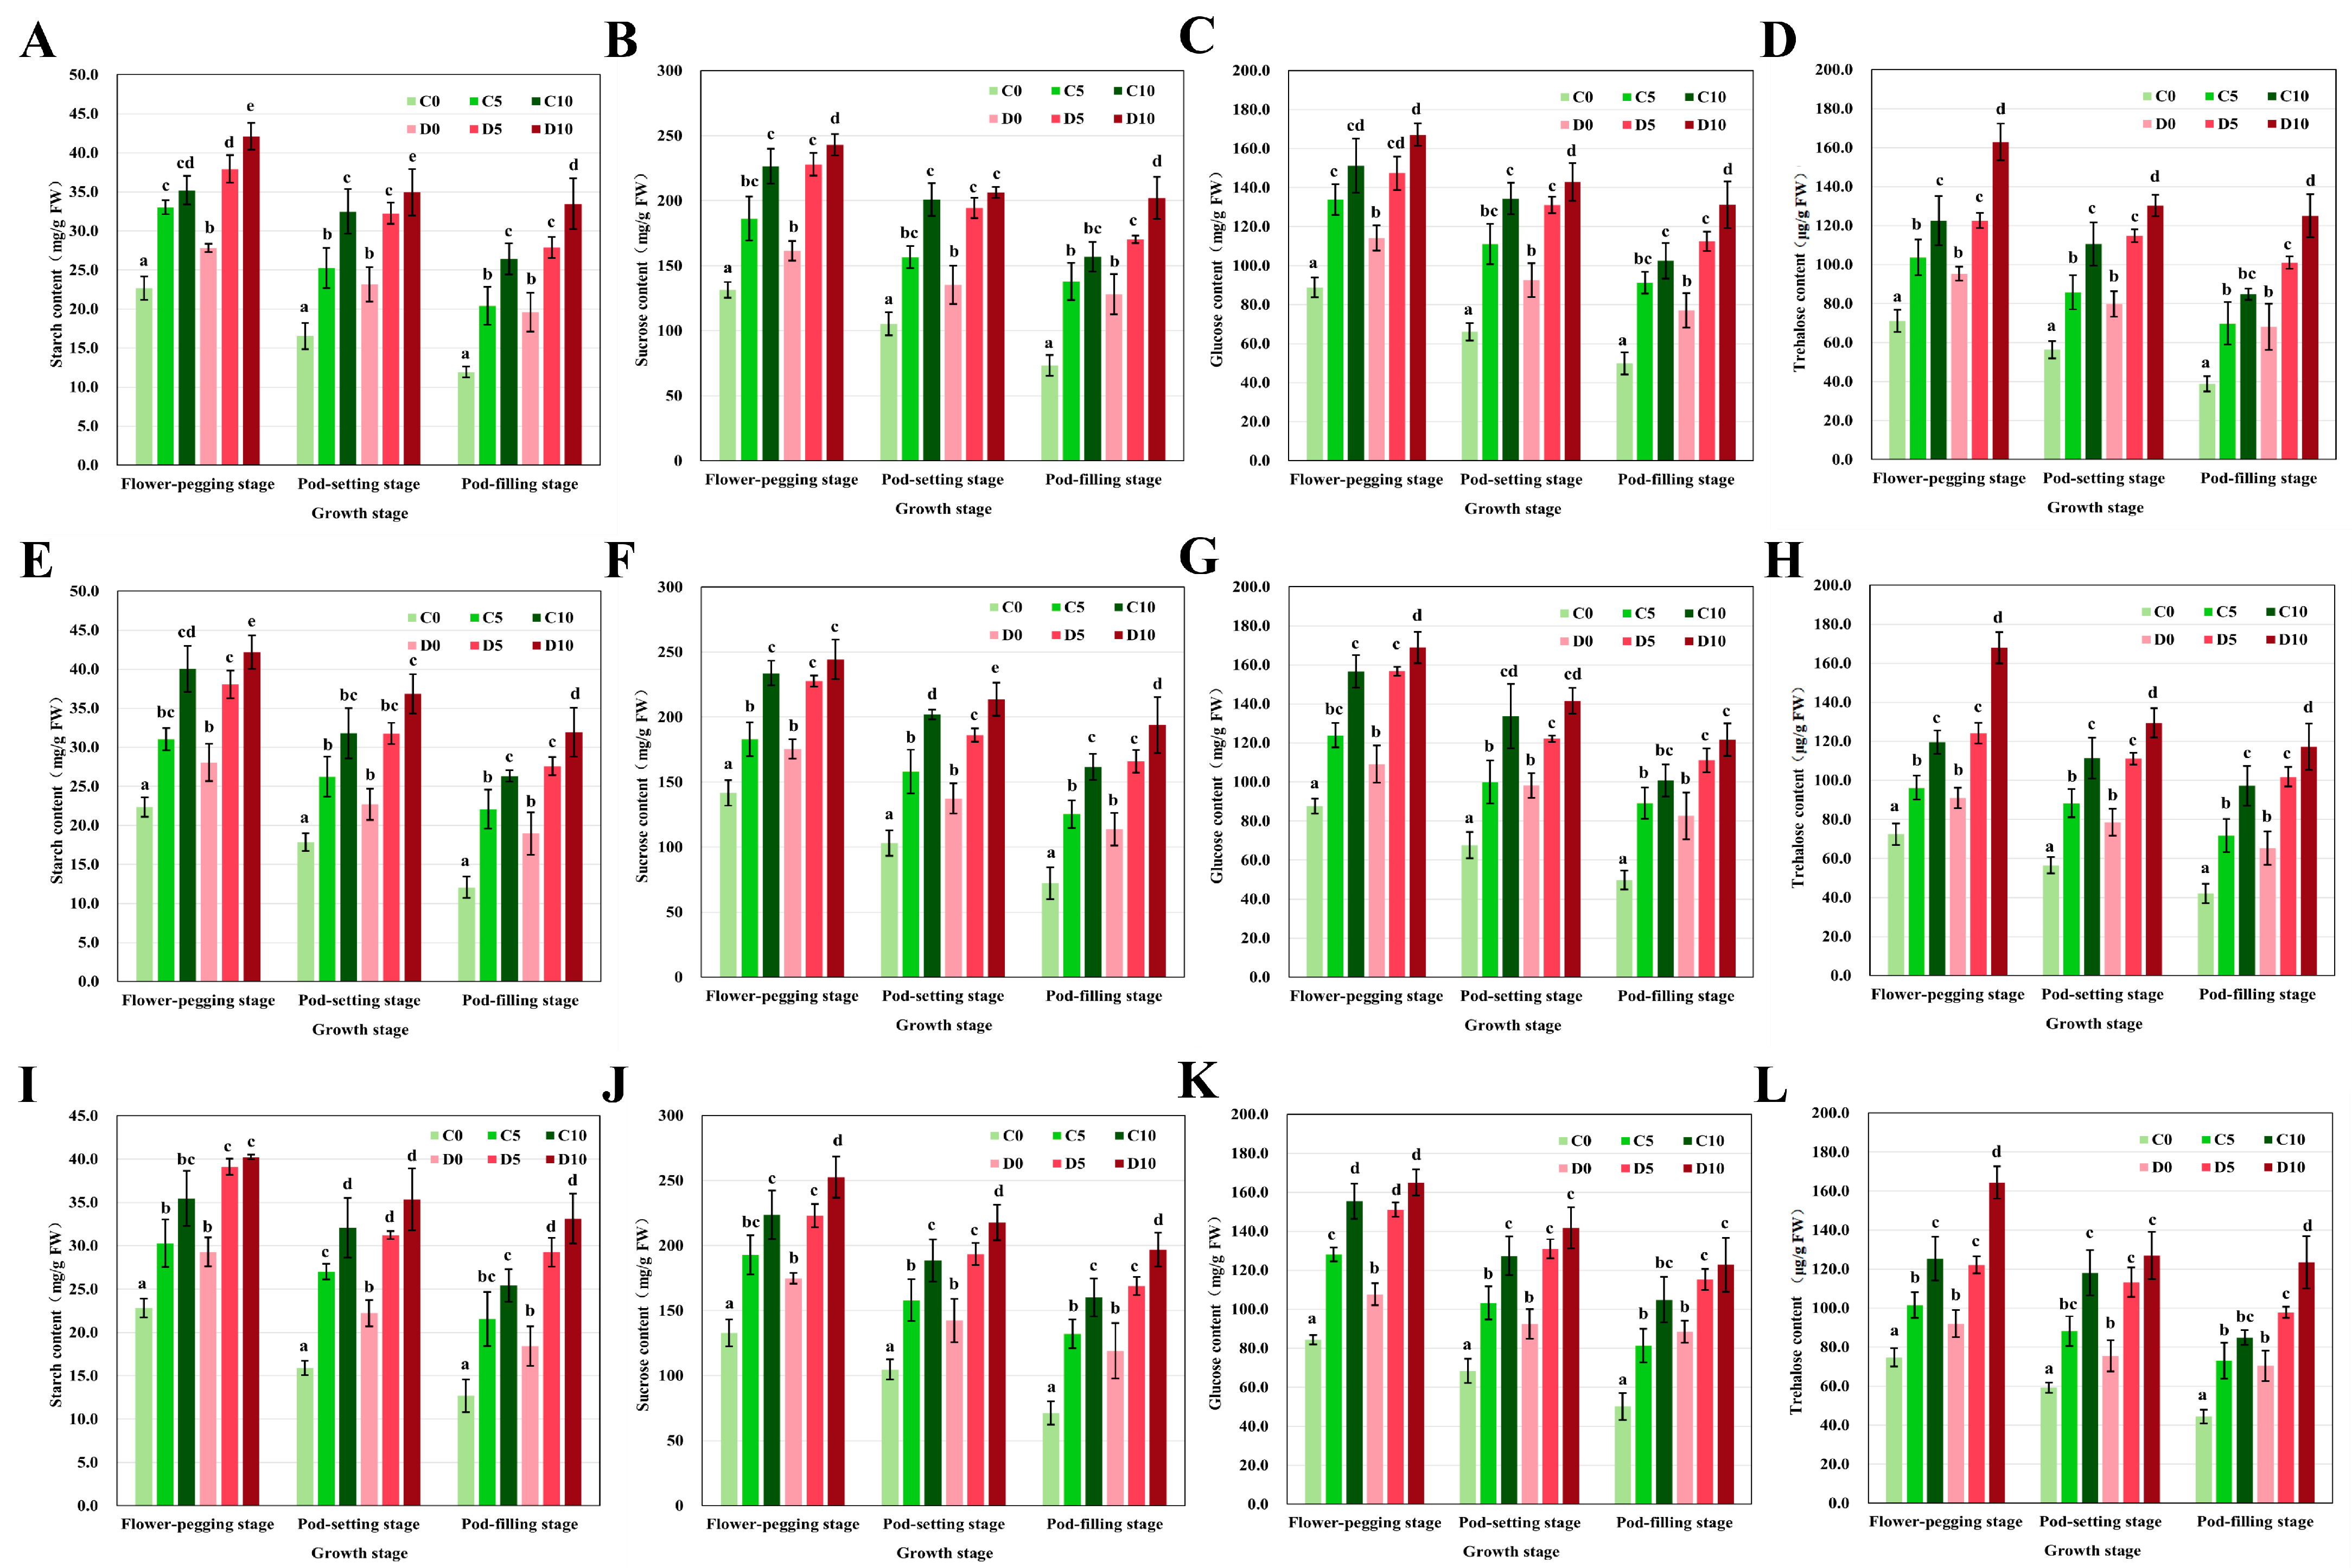
To assess whether T6P influences plant carbohydrate levels during post-drought recovery, the contents of starch, sucrose, glucose, and trehalose were measured. Drought stress significantly elevated these carbohydrates at the flower-pegging, pod-setting, and pod-filling stages. T6P treatment further enhanced the carbohydrate levels compared to controls without T6P, and drought also dramatically increased sugar content (Figure 4). Under drought, T6P-treated plants exhibited significantly higher levels of starch, sucrose, glucose, and trehalose than untreated controls, with slightly higher levels observed at the flower-pegging stage compared to the other stages. Notably, trehalose content reached the peak values of 162.85, 168.01, and 164.35 μg/g fresh weight in D10 at the flower-pegging stage over the experimental years (Figure 4). These results suggested that T6P contributes to drought stress mitigation by raising carbohydrate levels, with glucose and trehalose serving key roles as primary sugar signaling molecules in drought tolerance.

3.6. Plant Hormones

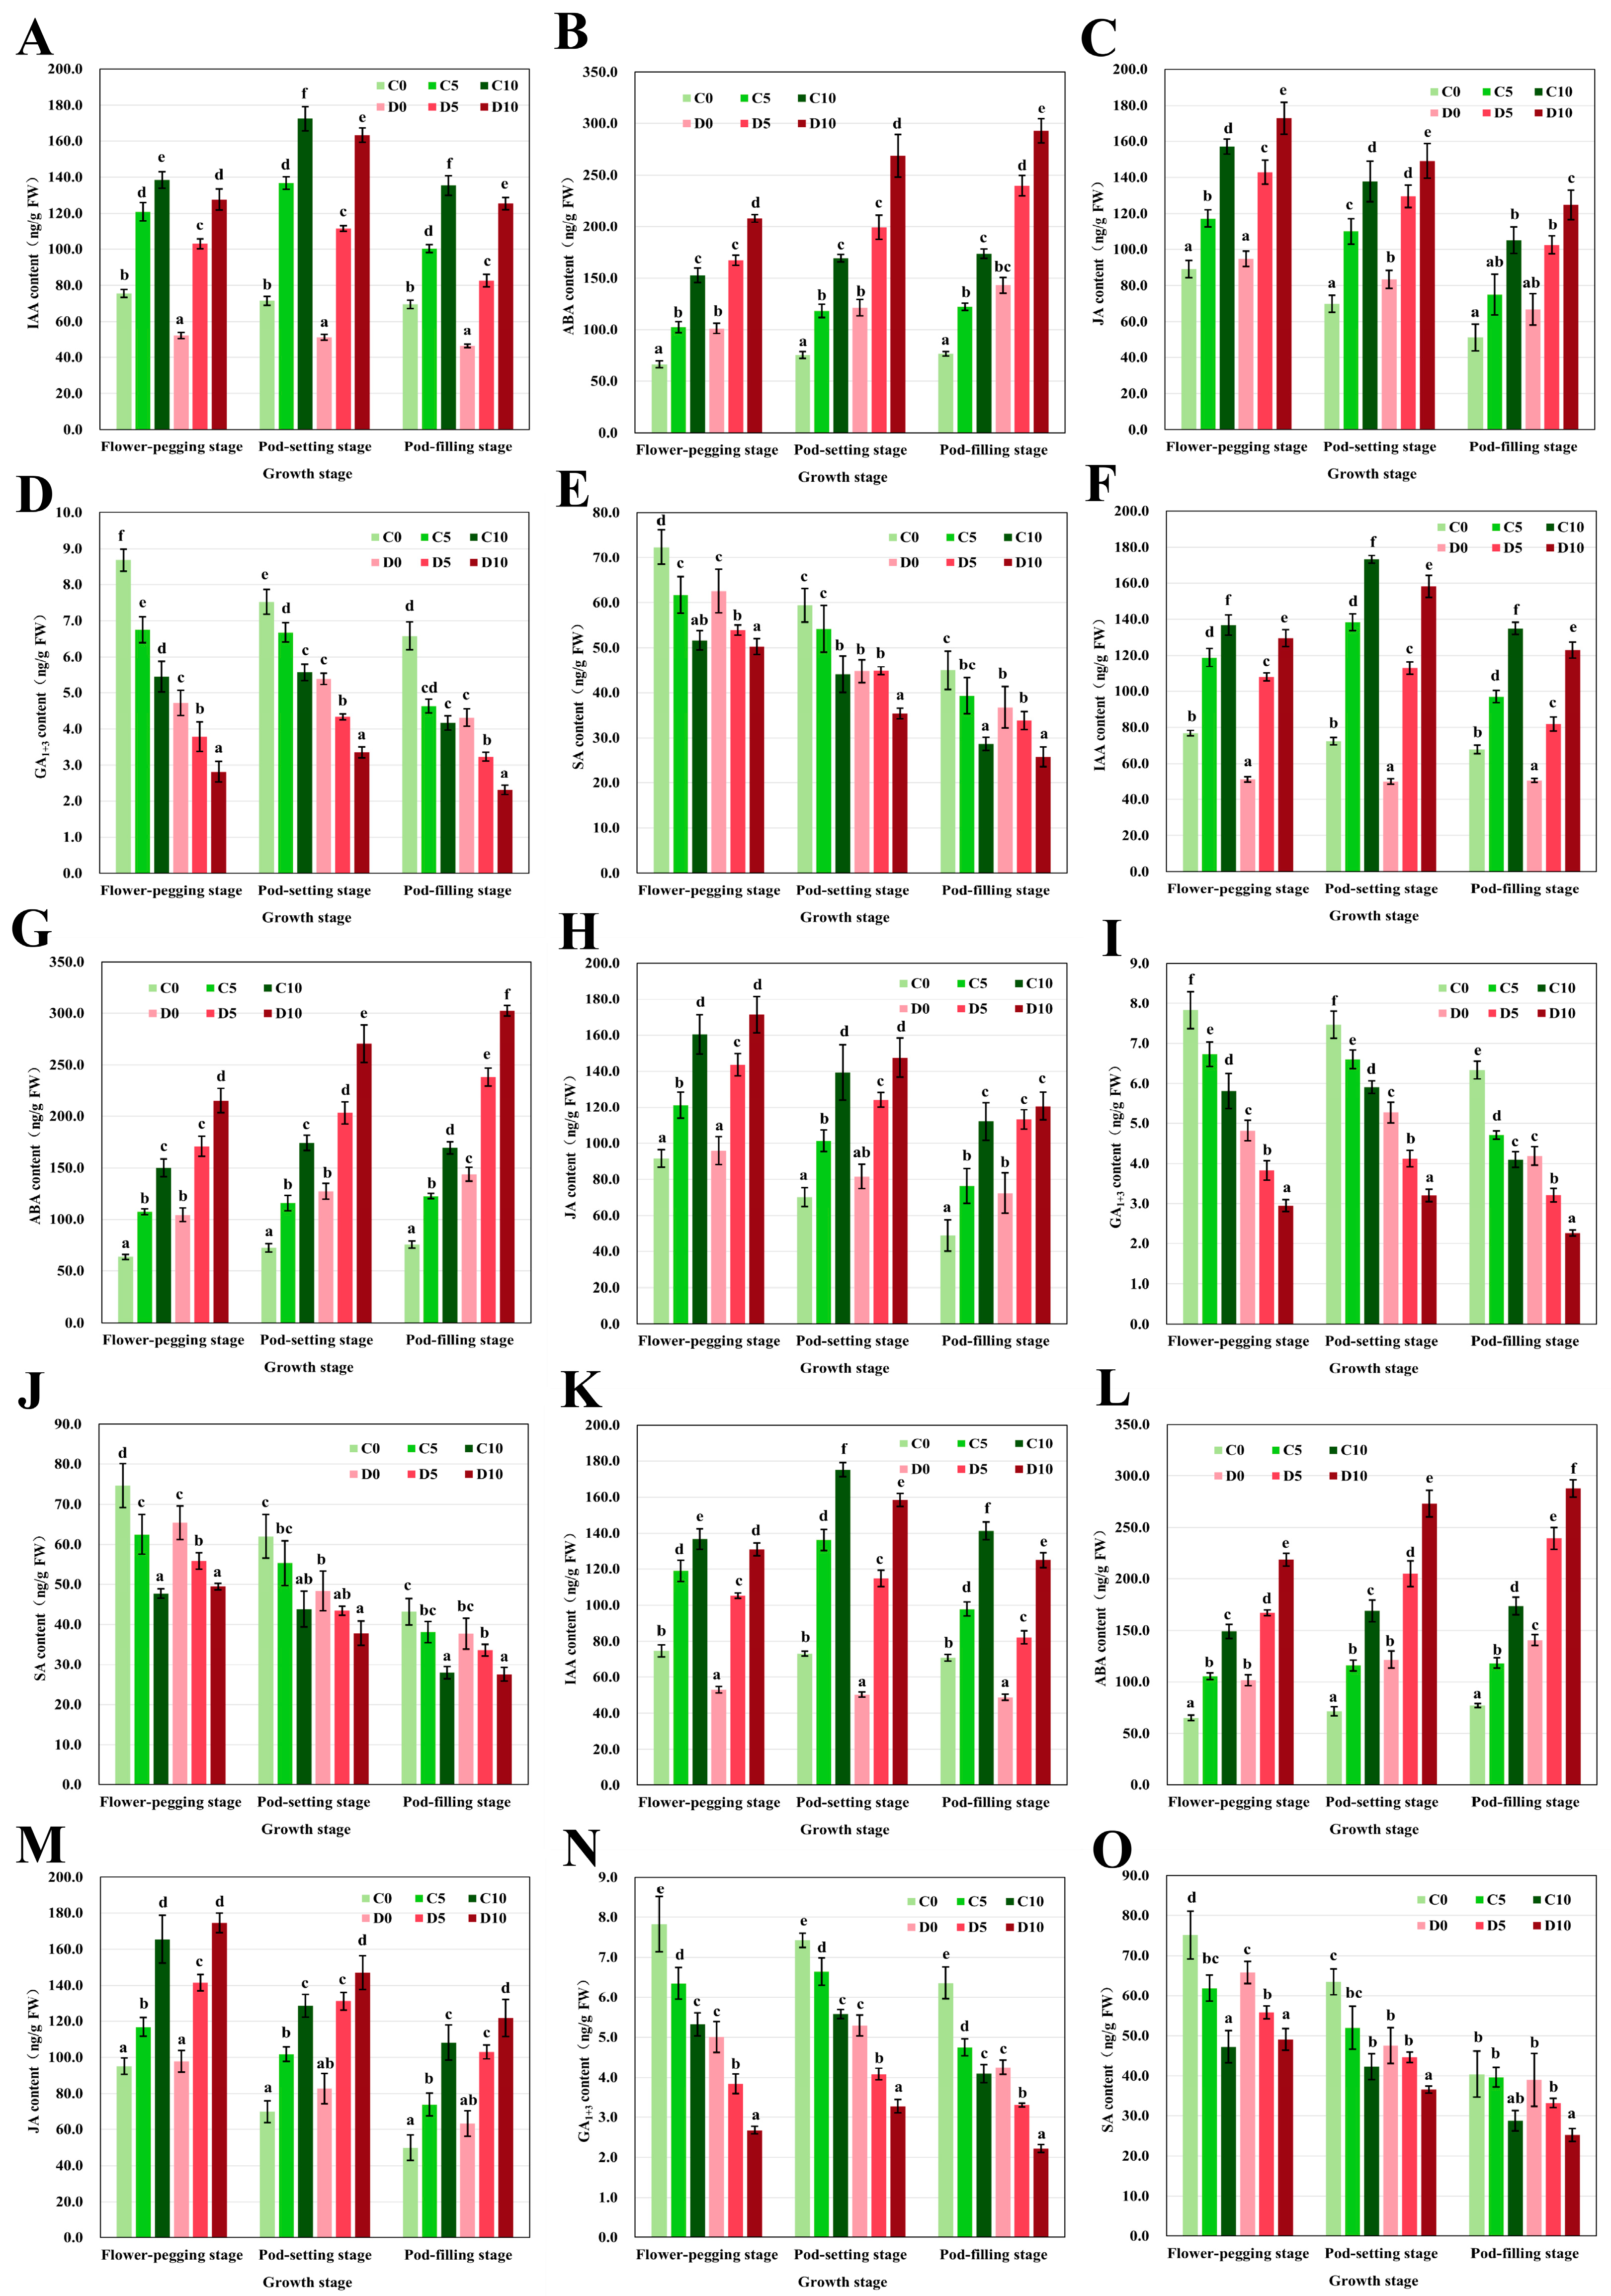
To characterize hormone-related physiological responses during post-drought recovery in adzuki bean, endogenous hormone levels in leaves, including IAA, GA, JA, ABA, and SA, were measured. Foliar T6P application increased IAA content within both the well-watered (C) and post-drought recovery (D) treatments, with the highest IAA levels observed at the pod-setting stage under 10 μM T6P. Specifically, IAA content reached 173.56 ng/g fresh weight in C10 and 159.89 ng/g fresh weight in D10. However, although T6P increased IAA within the D treatments compared with the corresponding 0 μM T6P control (D0), IAA levels in the D treatments did not exceed those of the well-watered control plants (C0) at the corresponding growth stages. This indicates that T6P partially promoted IAA recovery after pre-flowering drought stress but did not fully restore IAA accumulation to the level observed under well-watered conditions.
The response patterns of ABA and JA differed from that of IAA. Compared with the well-watered treatments, the D treatments showed higher ABA and JA accumulation during post-drought recovery, and T6P application further enhanced these increases. The peak ABA levels in D10 were 292.80, 302.47, and 287.84 ng/g fresh weight at the pod-filling stage in 2021, 2022, and 2023, respectively, while the highest JA levels in D10 were 157.07, 160.35, and 165.43 ng/g fresh weight at the flower-pegging stage in 2021, 2022, and 2023, respectively. In contrast, GA and SA contents generally declined from the flower-pegging stage to the pod-filling stage under both well-watered and post-drought recovery conditions, and T6P treatment further reduced their levels. Across the three years, the lowest average levels of GA and SA were observed at the pod-filling stage in D10, reaching 2.56 ng/g fresh weight and 26.16 ng/g fresh weight, respectively. Overall, these results indicate that foliar T6P treatment was associated with distinct hormone accumulation profiles during post-drought recovery: IAA showed partial recovery within D treatments but remained lower than the well-watered control level, whereas ABA and JA showed stronger accumulation in D treatments, and GA and SA tended to decrease.

3.7. Principal Component Analysis

In the PCA, the first two principal components accounted for 97.08% of the total variance, with PC1 representing 86.46% and PC2 representing 10.62% (Figure S4A). Obviously, the treatments were distinctly grouped into six categories by the principal components (Figure S4A). From Figure S4A, CAT and CHL were observed to have the largest contribution to PC1, while MDA, H2O2, and Pro were significantly negatively correlated with PC1. On the other hand, ABA, Glu, and SUC provided the largest contributions to PC2, with SA and Pn showing the smallest contributions (Figure S4B). Therefore, CAT and CHL contributed more to T6P treatment, while ABA appeared to be more correlated with drought stress.

3.8. Correlation Analysis Among Plant Architecture Parameters, Yield Traits, Photosynthetic Characteristics, Defense-Related Factors, Carbohydrate Content and Plant Hormones

The relationships among plant architecture parameters, yield traits, photosynthetic characteristics, defense factors, carbohydrate content, and plant hormones are shown in Figure S5. The results showed that HSW was significantly (p < 0.01) positively correlated with POD, SOD, CAT, SUC, Glu, IAA, ABA, CHL, Pn, RL, RDW, LA, and YPP, while showing a negative correlation with MDA, H2O2, Pro, SA, and PH (p < 0.01). Similar correlations were found for LA and YPP with other parameters, except for a weaker positive correlation with ABA (p < 0.05) compared to HSW. Additionally, RL and RDW exhibited significant positive correlations (p < 0.01) with POD, SOD, CAT, SUC, Glu, IAA, ABA, CHL, Pn, LA, and YPP, and a negative correlation with MDA, SA, and PH (p < 0.01) as well as with H2O2 and Pro (p < 0.05). In contrast, PH displayed an opposite correlation pattern to that of HSW (p < 0.01).
The correlation analysis revealed that root and leaf architecture parameters, along with yield traits, were significantly positively correlated with photosynthetic characteristics, defense enzymes, sugar content, and plant hormones, while showing negative correlations with defensive factors (MDA, H2O2, and Pro), SA, and plant height. This suggested that T6P application could improve photosynthetic capacity, defense enzyme activity, sugar levels, and hormones (such as IAA and ABA), while reducing MDA, H2O2, Pro, and SA, thereby preventing growth inhibition and reducing plant height to prevent lodging.

4. Discussion

4.1. Effects of T6P on the Plant Architecture and Yield Traits of Adzuki Bean During Post-Drought Recovery

T6P has been proposed as a signaling molecule that regulates various metabolic and developmental processes in plants [36]. It is widely recognized for its role in controlling carbon assimilation and sugar levels among different plant species, such as rice (Oryza sativa) [37], potato (Solanum tuberosum) [38], cucumber (Cucumis sativus) [39], maize (Zea mays) [40], and wheat (Triticum aestivum) [41]. Generally, high T6P levels support developmental progression, while low levels restrict growth and development [42]. In this study, T6P was applied to adzuki bean to investigate its effects on growth and yield. Compared to untreated plants, the different T6P concentrations significantly increased RL, MRD, RFW, RDW, MSD, LA, LFW, and LDW but not PH in adzuki bean (Table 1). PH showed a notable decrease with T6P application, even under drought conditions. The results further indicated that T6P enhanced PPP, PL, SPP, HSW, YPP, and YPB under drought, thus alleviating stress and promoting growth (Table 2). Although MSB and MSS decreased after T6P treatment, the yield capacity remained unaffected. This suggests that T6P has the potential to increase lodging resistance by reducing plant height in adzuki bean, thereby enhancing planting density and improving yield.

4.2. Effects of T6P on the Chlorophyll Content and Photosynthetic Characteristics During Post-Drought Recovery

Li et al. [37] found that the sugar-inducible transcription factor NAC23 suppressed TPP1 expression, leading to increased T6P levels in rice and an accompanying increase in the photosynthetic rate of rice leaves. However, it remains unclear whether this effect on photosynthesis is directly mediated by T6P signaling or is a consequence of altered source–sink dynamics. Previous studies have suggested that modifying sucrose allocation through T6P-related pathways can enhance leaf photosynthesis [43], further supporting the role of T6P as a potential source–sink integrator. To date, adjustment of T6P-related signaling has been considered an effective strategy for improving photosynthetic performance and yield formation, although direct manipulation of photosynthetic components, such as Rubisco expression, has also shown potential in rice [44].
In our study, foliar T6P application increased chlorophyll content and net photosynthetic rate in adzuki bean leaves under both well-watered and post-drought recovery conditions (Figure 1). A possible explanation is that T6P treatment may help maintain sugar availability and source–sink coordination during recovery, thereby providing carbon skeletons and energy required for chlorophyll biosynthesis and chloroplast function. In addition, the higher antioxidant enzyme activities and lower MDA and H2O2 contents observed in T6P-treated plants may reduce oxidative damage to chlorophyll molecules, thylakoid membranes, and photosynthetic apparatus during post-drought recovery. Therefore, the increased chlorophyll accumulation in T6P-treated plants may contribute to maintaining photosynthetic capacity by improving light capture, protecting the photosynthetic system, and supporting CO2 assimilation. The increases in intercellular CO2 concentration and transpiration rate observed in T6P-treated plants during post-drought recovery further suggest that T6P treatment was associated with improved gas exchange and photosynthetic recovery.
These findings indicate that foliar T6P treatment was associated with improved photosynthetic performance during post-drought recovery, which may partly contribute to yield formation in adzuki bean. However, because endogenous T6P was not directly quantified in this study, these effects should be interpreted as physiological responses associated with foliar T6P treatment rather than direct evidence of intracellular T6P signaling. Further studies are needed to determine whether exogenous native T6P directly regulates chlorophyll biosynthesis, chlorophyll degradation, or photosynthetic carbon assimilation pathways in adzuki bean. Given recent progress in improving yield by modulating T6P-related pathways beyond traditional domestication and breeding strategies, T6P-based approaches may provide a potential strategy for improving crop productivity and recovery capacity after early-season water deficits [45].

4.3. Effects of T6P on the Defense-Related Enzyme, MDA, H2O2, Proline and Soluble Protein Content During Post-Drought Recovery

In adverse environments, plants adopt defensive adaptation mechanisms to survive, often producing excess ROS, including H2O2. However, excessive ROS buildup leads to oxidative damage and membrane impairment, necessitating enhanced antioxidant capacity to remove H2O2 by upregulating antioxidant enzymes [46]. Drought stress, a major stress factor, raises H2O2 and MDA levels while reducing SOD, POD, and CAT activities and their gene expression, as observed in wheat [47], cucumber [48], soybean [49], potato [50], and pea [51]. This study found that T6P contributes to adzuki bean drought tolerance, with T6P treatment inducing Tre level changes in response to water deficit. As a downstream molecule in T6P metabolism, Tre plays a vital role in development and stress adaptation [16] and alleviates drought in plants like radish, tomato, and cucumber [52,53,54]. However, T6P’s full regulatory mechanisms remain unclear. Our study revealed that T6P application under drought reduced H2O2 levels, which otherwise rose sharply with drought alone (Figure 3B,J,K). Figure 2 shows antioxidant enzyme activities (SOD, POD, and CAT) and their coding genes in adzuki bean. Drought stress decreased SOD, POD, and CAT activities alongside gene downregulation, whereas T6P application enhanced both enzyme activities and gene expression (Figure S3). MDA, reflecting lipid peroxidation in cell membranes [2], has shown reduced stress-induced increases with Tre treatment [55]. Our results showed that foliar T6P treatment was associated with lower H2O2, MDA, and proline levels and higher antioxidant enzyme activities during post-drought recovery. These observations indicate that T6P-treated plants maintained a more favorable redox status after pre-flowering drought stress. Altered protein synthesis and accumulation due to water stress have been reported in various species [56,57], with drought stress decreasing soluble protein content, as seen in Glycine max L. [58]. T6P treatment increased soluble protein content in adzuki bean leaves and improved drought resistance under water deficit (Figure 3D,I,M). These results provide insights into the mechanism by which exogenous T6P mitigates excessive ROS, MDA, proline, and soluble protein accumulation due to drought stress in adzuki bean.

4.4. Effects of T6P on the Carbohydrate Content During Post-Drought Recovery

Soluble sugars such as starch, sucrose, glucose, and trehalose are crucial for maintaining plant structure and growth [59]. Beyond serving as nutrients, sugars regulate growth, development, metabolism, and stress responses throughout a plant’s lifecycle, from embryogenesis to senescence [11,60]. In this study, drought stress upregulated the levels of starch, sucrose, glucose, and trehalose in adzuki bean leaves. T6P treatments at varying concentrations further elevated sugar content, indicating the essential role of sugars in promoting growth and enhancing drought tolerance (Figure 4). Previous research also showed that higher sucrose levels in potatoes increased tuber number and induced starch synthesis [61]. In legumes, glucose promotes cell division during embryogenesis, while sucrose supports cell expansion and storage [61]. Additionally, trehalose influences organ growth, affecting functions like flowering, leaf, tuber, and seed development [62]. In most plants, sugars play a central role in growth, development, and abiotic stress adaptation. Sugars such as sucrose and trehalose help maintain water content, aid osmotic adjustment, and protect cell membranes from oxidative damage under drought. Nemati et al. [63] further reported that drought-tolerant wheat seedlings benefit from sucrose synthesis, improving energy storage and sustaining cell metabolism. In conclusion, our results suggest that T6P significantly boosted starch, sucrose, glucose, and trehalose accumulation, thereby reducing drought stress and supporting plant growth.

4.5. Effects of T6P on Plant Hormones During Post-Drought Recovery

Previous studies have shown that phytohormones like IAA, JA, GA, ABA, and SA play essential roles in the complex signaling pathways of plant growth and development and are integral to current models of stress response [64]. Our findings revealed that T6P mitigated the growth and development inhibition in adzuki bean induced by drought stress, resulting in higher IAA, JA, and ABA levels and lower GA and SA levels compared to plants without T6P treatment (Figure 5). Meitzel et al. [65] indicated that auxin functions downstream of T6P to promote seed filling, highlighting a connection between auxin and T6P in this process. Additionally, as noted, exogenous foliar application of T6P significantly increased Tre levels. Li et al. [66] reported that Tre reversed the decrease in IAA and ABA and the increase in GA3 in cucumber, with similar phytohormone responses observed in T6P-treated adzuki bean. However, until now, it was unclear if T6P modulates plant hormones to influence growth and responds to drought stress in adzuki bean. Our results suggest potential interactions between T6P and plant hormones in regulating growth, productivity, and response to abiotic stress.

5. Conclusions

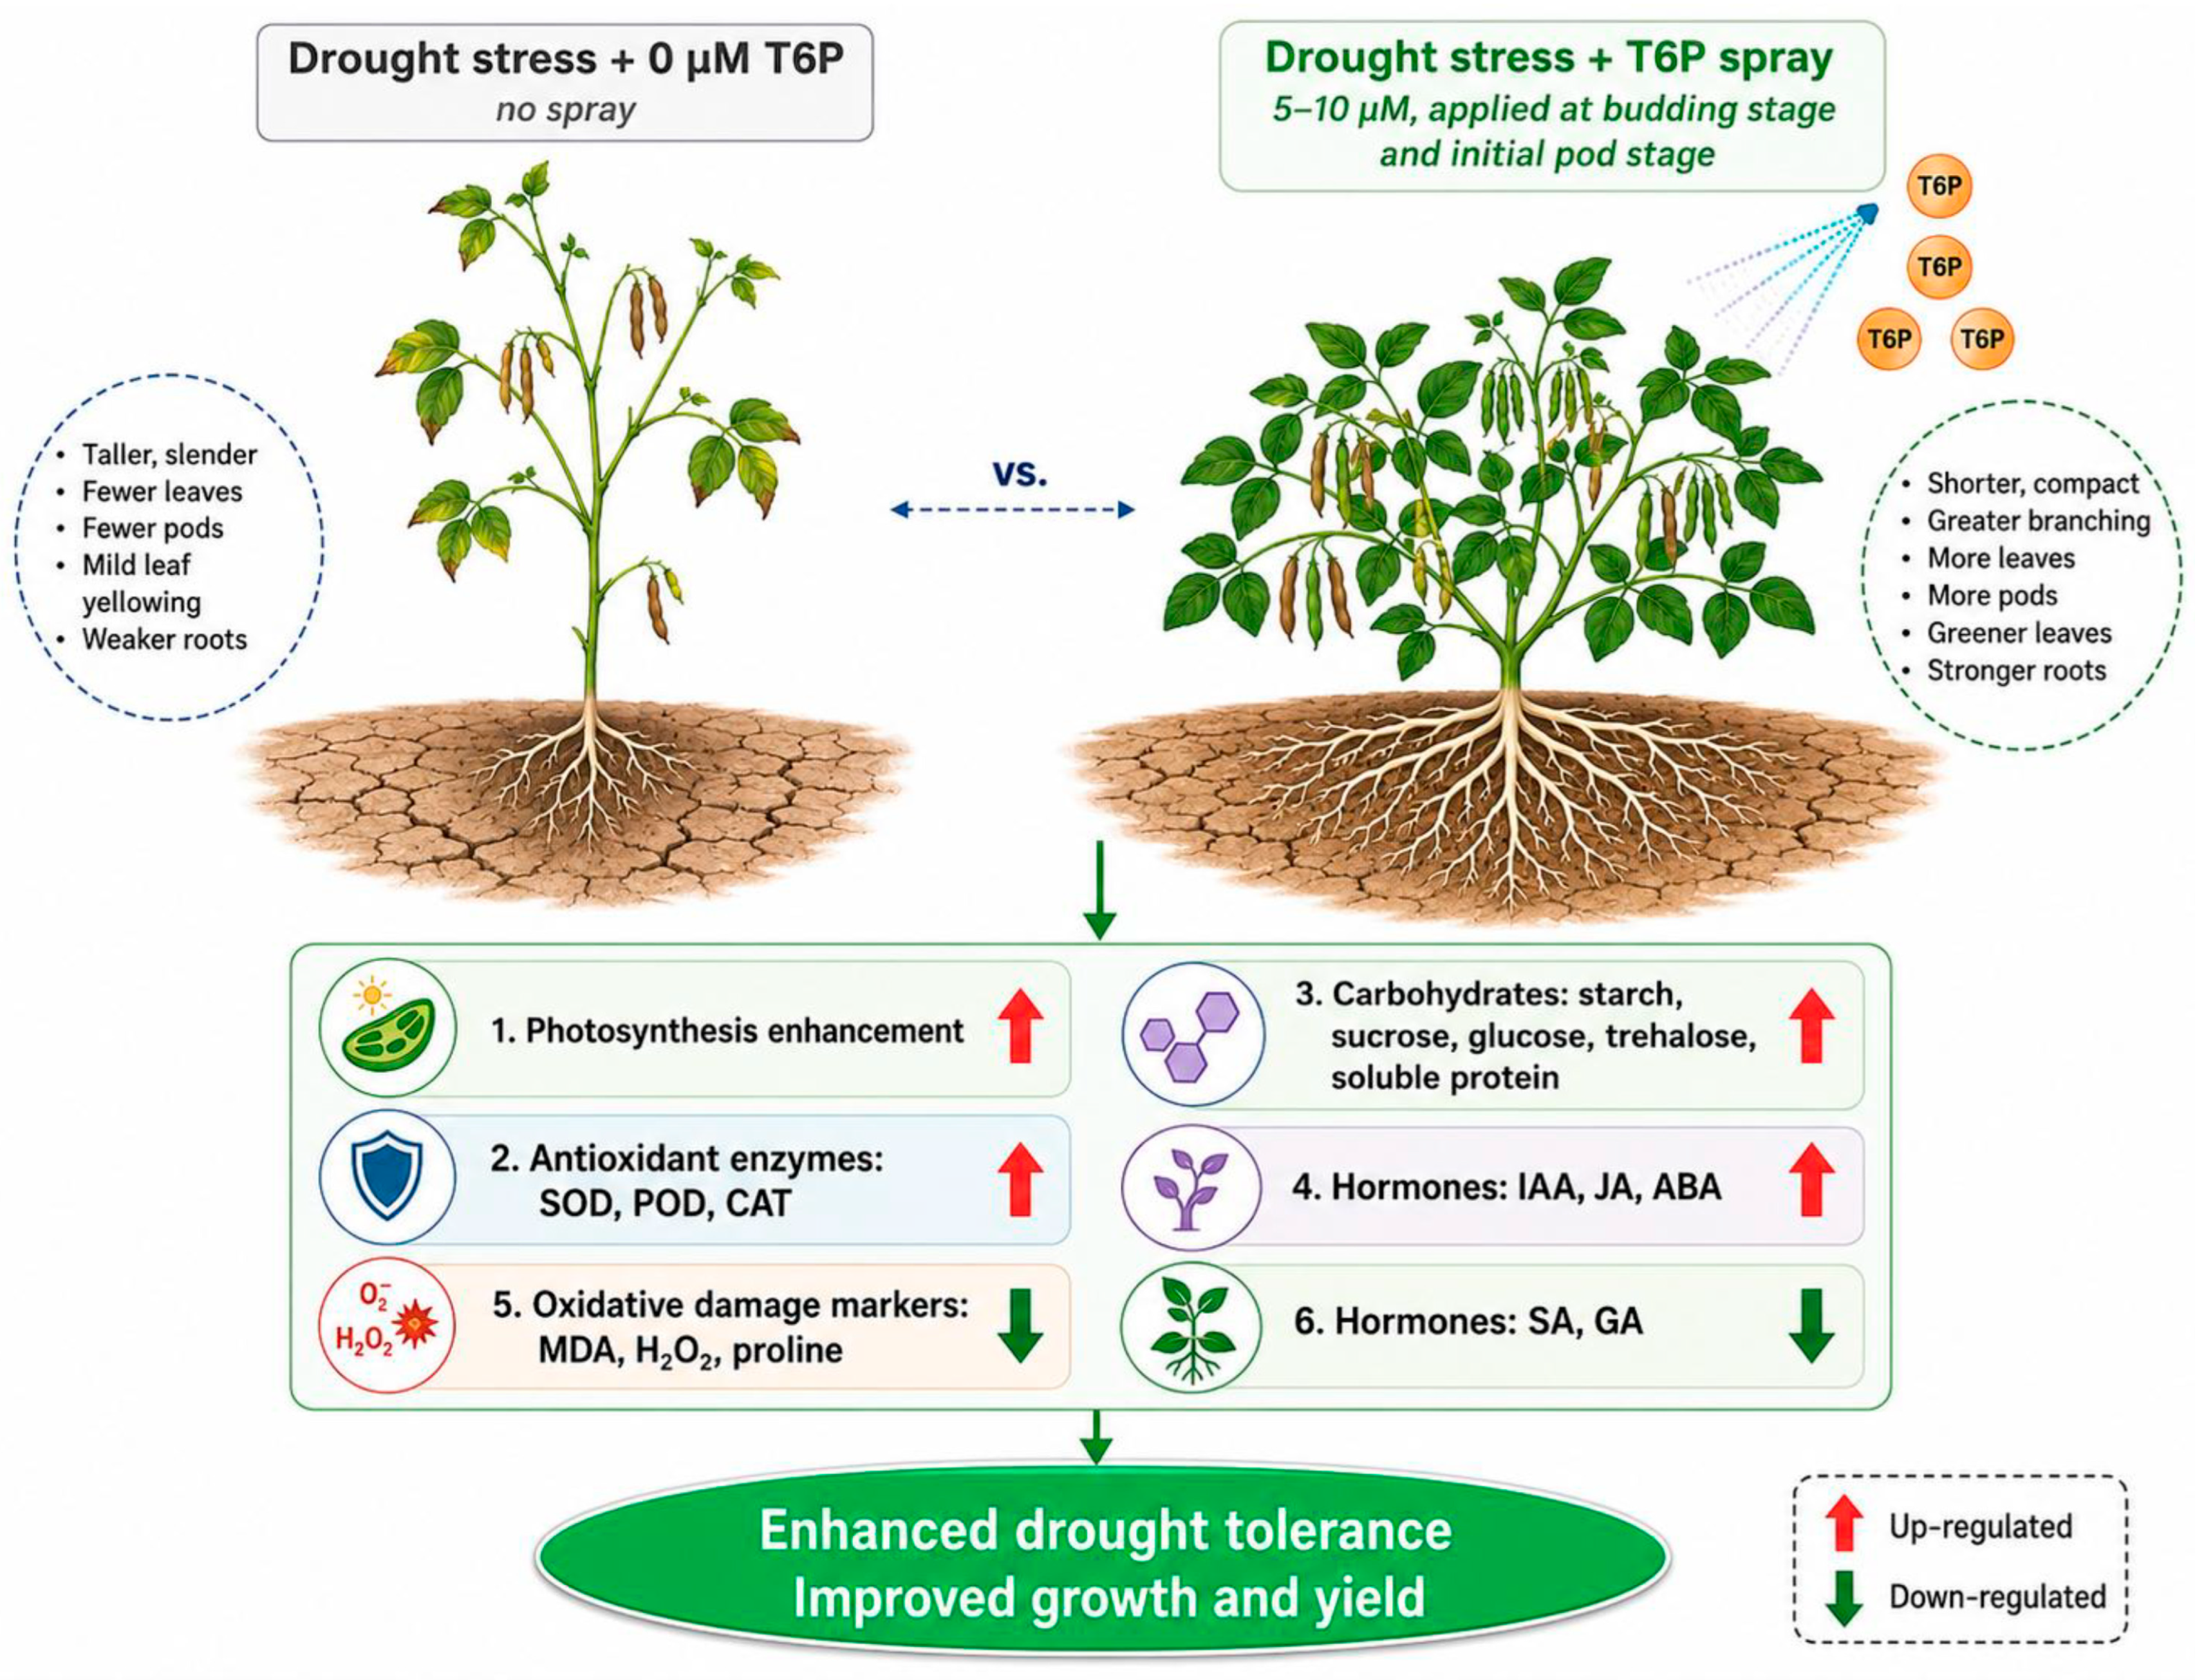
This study demonstrates that foliar application of T6P promotes growth, yield formation, and post-drought recovery in adzuki bean after pre-flowering drought stress. The results suggest that the positive effects of T6P during the recovery period were associated with changes in four physiological processes: ROS homeostasis, amino acid and protein metabolism, sugar-related traits, and plant hormone balance. Specifically, T6P-treated plants showed lower ROS accumulation, as indicated by reduced MDA and H2O2 contents, together with higher POD, SOD, and CAT gene expression and enzyme activities during post-drought recovery. In addition, proline accumulation induced by the previous water-deficit period was reduced by T6P treatment, while soluble protein content was increased, which may contribute to improved recovery growth. T6P application was also associated with increased carbohydrate levels, particularly glucose and trehalose, suggesting that sugar-related changes may be involved in growth recovery and yield formation after drought stress. Furthermore, T6P treatment modified the changes in plant hormone levels during the recovery period, including GA, SA, IAA, ABA, and JA, which may be related to the restoration of growth and development in adzuki bean (Figure 6). Overall, this study suggests that foliar application of native T6P may be a potential agronomic approach for improving crop recovery and yield formation after early-season water deficit. However, further studies are needed to verify whether exogenous native T6P directly enters plant cells and regulates endogenous T6P-mediated signaling pathways.

Supplementary Materials

The following supporting information can be downloaded at: https://www.mdpi.com/article/10.3390/agronomy16131279/s1, Table S1: Analysis of soil characteristics of the experimental site before planting (2021–2023); Table S2: Soil moisture dynamics corresponding to T6P application and sampling stages during the 2021–2023 growing seasons; Table S3: The primers used for qRT-PCR in this experiment; Figure S1: Weather statistics during the experimental period from 2021 to 2023 in the field; Figure S2: Effects of T6P on the phenotype characteristic of adzuki bean plants in 2021; Figure S3: Changes in SOD, POD, and CAT gene expressions of adzuki bean plants during T6P alleviation during post-drought recovery; Figure S4: Principal component analysis (PCA) of six treatments and 19 measured variables; Figure S5: Correlations among plant architecture parameters, yield traits, photosynthetic characteristics, defensive enzymes and factors, sugar levels and plant hormones.

Author Contributions

Conceptualization, R.X., C.Z. and W.G.; methodology, Z.J. and J.C.; software, Z.L. and D.D.; validation, Y.Z., M.F. and R.X.; formal analysis, T.L.; investigation, Y.H.; resources, C.Z.; data curation, Z.J.; writing—original draft preparation, W.G.; writing—review and editing, J.C.; visualization, R.X.; supervision, W.G.; project administration, C.Z.; funding acquisition, W.G. All authors have read and agreed to the published version of the manuscript.

Funding

This research was funded by the Youth Top Talent Project of Liaoning Revitalization Talent Plan (3203201), China Agriculture Research System of MOF and MARA-Food Legumes (CARS-08-Z07), Liaoning Provincial Science and Technology Major Project (2025JH1/11700019), and Special Program for Green and High-Quality Agricultural Development of Liaoning Academy of Agricultural Sciences (2025HQ1303).

Data Availability Statement

Data will be made available on request.

Conflicts of Interest

The authors declare no conflicts of interest.

References

  1. Xiong, L.; Zhu, J.K. Molecular and Genetic Aspects of Plant Responses to Osmotic Stress. Plant Cell Environ. 2002, 25, 131–139. [Google Scholar] [CrossRef] [PubMed]
  2. Chinnusamy, V.; Zhu, J.-K. Epigenetic Regulation of Stress Responses in Plants. Curr. Opin. Plant Biol. 2009, 12, 133–139. [Google Scholar] [CrossRef] [PubMed]
  3. Salehi-Lisar, S.Y.; Bakhshayeshan-Agdam, H. Drought Stress in Plants: Causes, Consequences, and Tolerance. In Drought Stress Tolerance in Plants, Vol 1: Physiology and Biochemistry; Hossain, M.A., Wani, S.H., Bhattacharjee, S., Burritt, D.J., Tran, L.-S.P., Eds.; Springer International Publishing: Cham, Switzerland, 2016; pp. 1–16. [Google Scholar]
  4. Razi, K.; Muneer, S. Drought Stress-Induced Physiological Mechanisms, Signaling Pathways and Molecular Response of Chloroplasts in Common Vegetable Crops. Crit. Rev. Biotechnol. 2021, 41, 669–691. [Google Scholar] [CrossRef] [PubMed]
  5. Rellán-Álvarez, R.; Lobet, G.; Dinneny, J.R. Environmental Control of Root System Biology. Annu. Rev. Plant Biol. 2016, 67, 619–642. [Google Scholar] [CrossRef] [PubMed]
  6. Bailey-Serres, J.; Parker, J.E.; Ainsworth, E.A.; Oldroyd, G.E.; Schroeder, J.I. Genetic Strategies for Improving Crop Yields. Nature 2019, 575, 109–118. [Google Scholar] [CrossRef] [PubMed]
  7. Dinneny, J.R. Developmental Responses to Water and Salinity in Root Systems. Annu. Rev. Cell Dev. Biol. 2019, 35, 239–257. [Google Scholar] [CrossRef] [PubMed]
  8. Gupta, A.; Rico-Medina, A.; Caño-Delgado, A.I. The Physiology of Plant Responses to Drought. Science 2020, 368, 266–269. [Google Scholar] [CrossRef] [PubMed]
  9. Shinozaki, K.; Yamaguchi-Shinozaki, K. Gene Networks Involved in Drought Stress Response and Tolerance. J. Exp. Bot. 2007, 58, 221–227. [Google Scholar] [PubMed]
  10. Hirayama, T.; Shinozaki, K. Research on Plant Abiotic Stress Responses in the Post-Genome Era: Past, Present and Future. Plant J. 2010, 61, 1041–1052. [Google Scholar] [PubMed]
  11. O’Hara, L.E.; Paul, M.J.; Wingler, A. How Do Sugars Regulate Plant Growth and Development? New Insight into the Role of Trehalose-6-Phosphate. Mol. Plant 2013, 6, 261–274. [Google Scholar] [CrossRef] [PubMed]
  12. Nuccio, M.L.; Wu, J.; Mowers, R.; Zhou, H.-P.; Meghji, M.; Primavesi, L.F.; Paul, M.J.; Chen, X.; Gao, Y.; Haque, E.; et al. Expression of Trehalose-6-Phosphate Phosphatase in Maize Ears Improves Yield in Well-Watered and Drought Conditions. Nat. Biotechnol. 2015, 33, 862–869. [Google Scholar] [PubMed]
  13. Figueroa, C.M.; Lunn, J.E. A Tale of Two Sugars: Trehalose 6-Phosphate and Sucrose. Plant Physiol. 2016, 172, 7–27. [Google Scholar] [CrossRef] [PubMed]
  14. Paul, M.J.; Watson, A.; Griffiths, C.A. Trehalose 6-Phosphate Signalling and Impact on Crop Yield. Biochem. Soc. Trans. 2020, 48, 2127–2137. [Google Scholar] [CrossRef] [PubMed]
  15. Schluepmann, H.; Pellny, T.; van Dijken, A.; Smeekens, S.; Paul, M. Trehalose 6-Phosphate Is Indispensable for Carbohydrate Utilization and Growth in Arabidopsis thaliana. Proc. Natl. Acad. Sci. USA 2003, 100, 6849–6854. [Google Scholar] [CrossRef] [PubMed]
  16. Avonce, N.; Mendoza-Vargas, A.; Morett, E.; Iturriaga, G. Insights on the Evolution of Trehalose Biosynthesis. BMC Evol. Biol. 2006, 6, 109. [Google Scholar] [CrossRef] [PubMed]
  17. Cabib, E.; Leloir, L.F. The Biosynthesis of Trehalose Phosphate. J. Biol. Chem. 1958, 231, 259–275. [Google Scholar] [CrossRef] [PubMed]
  18. Fernandez, O.; Béthencourt, L.; Quero, A.; Sangwan, R.S.; Clément, C. Trehalose and Plant Stress Responses: Friend or Foe? Trends Plant Sci. 2010, 15, 409–417. [Google Scholar] [CrossRef] [PubMed]
  19. Tournu, H.; Fiori, A.; Van Dijck, P. Relevance of Trehalose in Pathogenicity: Some General Rules, yet Many Exceptions. PLoS Pathog. 2013, 9, e1003447. [Google Scholar] [CrossRef] [PubMed]
  20. Henry, C.; Bledsoe, S.W.; Griffiths, C.A.; Kollman, A.; Paul, M.J.; Sakr, S.; Lagrimini, L.M. Differential Role for Trehalose Metabolism in Salt-Stressed Maize. Plant Physiol. 2015, 169, 1072–1089. [Google Scholar] [CrossRef] [PubMed]
  21. Fichtner, F.; Lunn, J.E. The Role of Trehalose 6-Phosphate (Tre6p) in Plant Metabolism and Development. Annu. Rev. Plant Biol. 2021, 72, 737–760. [Google Scholar] [CrossRef] [PubMed]
  22. Griffiths, C.A.; Xue, X.; Miret, J.A.; Salvagiotti, F.; Acevedo-Siaca, L.G.; Gimeno, J.; Reynolds, M.P.; Hassall, K.L.; Halsey, K.; Puranik, S.; et al. Membrane-Permeable Trehalose 6-Phosphate Precursor Spray Increases Wheat Yields in Field Trials. Nat. Biotechnol. 2026, 44, 316–325. [Google Scholar] [PubMed]
  23. Deng, Y.Y.; Pu, S.J.; Liu, Z.P.; Lei, G.J.; Wan, P. Influences of Sugar on Quality of Adzuki Bean Paste. J. Agric. Sci. Technol. 2011, 13, 78–84. [Google Scholar]
  24. Ma, Q.; Zhang, T.; Zhang, P.; Wang, Z.-Y. Melatonin Attenuates Postharvest Physiological Deterioration of Cassava Storage Roots. J. Pineal Res. 2016, 60, 424–434. [Google Scholar] [CrossRef] [PubMed]
  25. Sagisaka, S. The Occurrence of Peroxide in a Perennial Plant, Populus gelrica. Plant Physiol. 1976, 57, 308–309. [Google Scholar] [CrossRef] [PubMed]
  26. Bradford, M.M. A Rapid and Sensitive Method for the Quantitation of Microgram Quantities of Protein Utilizing the Principle of Protein-Dye Binding. Anal. Biochem. 1976, 72, 248–254. [Google Scholar] [CrossRef] [PubMed]
  27. Bates, L.S.; Waldren, R.P.; Teare, I.D. Rapid Determination of Free Proline for Water-Stress Studies. Plant Soil 1973, 39, 205–207. [Google Scholar] [CrossRef]
  28. Do, H.M.; Hong, J.K.; Jung, H.W.; Kim, S.H.; Ham, J.H.; Hwang, B.K. Expression of Peroxidase-Like Genes, H2O2 Production, and Peroxidase Activity During the Hypersensitive Response to Xanthomonas campestris pv. vesicatoria in Capsicum annuum. Mol. Plant-Microbe Interact. 2003, 16, 196–205. [Google Scholar] [PubMed]
  29. Beers, R.F.; Sizer, I.W. A Spectrophotometric Method for Measuring the Breakdown of Hydrogen Peroxide by Catalase. J. Biol. Chem. 1952, 195, 133–140. [Google Scholar] [CrossRef] [PubMed]
  30. Fredeen, A.L.; Rao, I.M.; Terry, N. Influence of Phosphorus Nutrition on Growth and Carbon Partitioning in Glycine Max. Plant Physiol. 1989, 89, 225–230. [Google Scholar] [CrossRef] [PubMed]
  31. Morkunas, I.; Marczak, Ł.; Stachowiak, J.; Stobiecki, M. Sucrose-Induced Lupine Defense against Fusarium oxysporum: Sucrose-Stimulated Accumulation of Isoflavonoids as a Defense Response of Lupine to Fusarium oxysporum. Plant Physiol. Biochem. 2005, 43, 363–373. [Google Scholar] [PubMed]
  32. Pan, X.; Welti, R.; Wang, X. Quantitative Analysis of Major Plant Hormones in Crude Plant Extracts by High-Performance Liquid Chromatography–Mass Spectrometry. Nat. Protoc. 2010, 5, 986–992. [Google Scholar] [PubMed]
  33. Liu, J.; Zhai, R.; Liu, F.; Zhao, Y.; Wang, H.; Liu, L.; Yang, C.; Wang, Z.; Ma, F.; Xu, L. Melatonin Induces Parthenocarpy by Regulating Genes in Gibberellin Pathways of ‘Starkrimson’ Pear (Pyrus communis L.). Front. Plant Sci. 2018, 9, 946. [Google Scholar] [CrossRef] [PubMed]
  34. Chen, J.-B.; Wang, S.-M.; Jing, R.-L.; Mao, X.-G. Cloning the Pvp5cs Gene from Common Bean (Phaseolus vulgaris) and Its Expression Patterns under Abiotic Stresses. J. Plant Physiol. 2009, 166, 12–19. [Google Scholar] [PubMed]
  35. Livak, K.J.; Schmittgen, T.D. Analysis of Relative Gene Expression Data Using Real-Time Quantitative Pcr and the 2−Δδct Method. Methods 2001, 25, 402–408. [Google Scholar] [CrossRef] [PubMed]
  36. Ponnu, J.; Wahl, V.; Schmid, M. Trehalose-6-Phosphate: Connecting Plant Metabolism and Development. Front. Plant Sci. 2011, 2, 70. [Google Scholar] [CrossRef] [PubMed]
  37. Li, Z.; Wei, X.; Tong, X.; Zhao, J.; Liu, X.; Wang, H.; Tang, L.; Shu, Y.; Li, G.; Wang, Y.; et al. The Osnac23-Tre6p-Snrk1a Feed-Forward Loop Regulates Sugar Homeostasis and Grain Yield in Rice. Mol. Plant 2022, 15, 706–722. [Google Scholar] [PubMed]
  38. Debast, S.; Nunes-Nesi, A.; Hajirezaei, M.R.; Hofmann, J.; Sonnewald, U.; Fernie, A.R.; Börnke, F. Altering Trehalose-6-Phosphate Content in Transgenic Potato Tubers Affects Tuber Growth and Alters Responsiveness to Hormones During Sprouting. Plant Physiol. 2011, 156, 1754–1771. [Google Scholar] [CrossRef] [PubMed]
  39. Zhang, Z.; Deng, Y.; Song, X.; Miao, M. Trehalose-6-Phosphate and Snf1-Related Protein Kinase 1 Are Involved in the First-Fruit Inhibition of Cucumber. J. Plant Physiol. 2015, 177, 110–120. [Google Scholar] [CrossRef] [PubMed]
  40. Henry, C.; Bledsoe, S.W.; Siekman, A.; Kollman, A.; Waters, B.M.; Feil, R.; Stitt, M.; Lagrimini, L.M. The Trehalose Pathway in Maize: Conservation and Gene Regulation in Response to the Diurnal Cycle and Extended Darkness. J. Exp. Bot. 2014, 65, 5959–5973. [Google Scholar] [CrossRef] [PubMed]
  41. Martínez-Barajas, E.; Delatte, T.; Schluepmann, H.; de Jong, G.J.; Somsen, G.W.; Nunes, C.; Primavesi, L.F.; Coello, P.; Mitchell, R.A.C.; Paul, M.J. Wheat Grain Development Is Characterized by Remarkable Trehalose 6-Phosphate Accumulation Pregrain Filling: Tissue Distribution and Relationship to Snf1-Related Protein Kinase1 Activity. Plant Physiol. 2011, 156, 373–381. [Google Scholar] [CrossRef] [PubMed]
  42. Baena-González, E.; Lunn, J.E. Snrk1 and Trehalose 6-Phosphate—Two Ancient Pathways Converge to Regulate Plant Metabolism and Growth. Curr. Opin. Plant Biol. 2020, 55, 52–59. [Google Scholar] [PubMed]
  43. Oszvald, M.; Primavesi, L.F.; Griffiths, C.A.; Cohn, J.; Basu, S.S.; Nuccio, M.L.; Paul, M.J. Trehalose 6-Phosphate Regulates Photosynthesis and Assimilate Partitioning in Reproductive Tissue. Plant Physiol. 2018, 176, 2623–2638. [Google Scholar] [CrossRef] [PubMed]
  44. Yoon, D.-K.; Ishiyama, K.; Suganami, M.; Tazoe, Y.; Watanabe, M.; Imaruoka, S.; Ogura, M.; Ishida, H.; Suzuki, Y.; Obara, M.; et al. Transgenic Rice Overproducing Rubisco Exhibits Increased Yields with Improved Nitrogen-Use Efficiency in an Experimental Paddy Field. Nat. Food 2020, 1, 134–139. [Google Scholar] [CrossRef] [PubMed]
  45. Paul, M.J.; Miret, J.A.; Griffiths, C.A. Improving Rice Photosynthesis and Yield through Trehalose 6-Phosphate Signaling. Mol. Plant 2022, 15, 586–588. [Google Scholar] [CrossRef] [PubMed]
  46. Shan, C.; Liu, H.; Zhao, L.; Wang, X. Effects of Exogenous Hydrogen Sulfide on the Redox States of Ascorbate and Glutathione in Maize Leaves under Salt Stress. Biol. Plant. 2014, 58, 169–173. [Google Scholar]
  47. Luna, C.M.; Pastori, G.M.; Driscoll, S.; Groten, K.; Bernard, S.; Foyer, C.H. Drought Controls on H2O2 Accumulation, Catalase (Cat) Activity and Cat Gene Expression in Wheat. J. Exp. Bot. 2005, 56, 417–423. [Google Scholar] [PubMed]
  48. Wang, C.-J.; Yang, W.; Wang, C.; Gu, C.; Niu, D.-D.; Liu, H.-X.; Wang, Y.-P.; Guo, J.-H. Induction of Drought Tolerance in Cucumber Plants by a Consortium of Three Plant Growth-Promoting Rhizobacterium Strains. PLoS ONE 2012, 7, e52565. [Google Scholar] [CrossRef] [PubMed]
  49. Wang, N.; Zhang, W.; Qin, M.; Li, S.; Qiao, M.; Liu, Z.; Xiang, F. Drought Tolerance Conferred in Soybean (Glycine max. L) by Gmmyb84, a Novel R2r3-Myb Transcription Factor. Plant Cell Physiol. 2017, 58, 1764–1776. [Google Scholar] [PubMed]
  50. Quandahor, P.; Gou, Y.; Lin, C.; Coulter, J.A.; Liu, C. Comparison of Root Tolerance to Drought and Aphid (Myzus persicae Sulzer) Resistance among Different Potato (Solanum tuberosum L.) Cultivars. Sci. Rep. 2021, 11, 628. [Google Scholar] [CrossRef] [PubMed]
  51. Sutulienė, R.; Brazaitytė, A.; Małek, S.; Jasik, M.; Samuolienė, G. Biochemical Responses of Pea Plants to Drought Stress and in the Presence of Molybdenum Trioxide Nanoparticles. Plant Soil 2023, 492, 381–397. [Google Scholar] [CrossRef]
  52. Akram, N.A.; Waseem, M.; Ameen, R.; Ashraf, M. Trehalose Pretreatment Induces Drought Tolerance in Radish (Raphanus sativus L.) Plants: Some Key Physio-Biochemical Traits. Acta Physiol. Plant. 2015, 38, 3. [Google Scholar] [CrossRef]
  53. MacIntyre, A.M.; Meline, V.; Gorman, Z.; Augustine, S.P.; Dye, C.J.; Hamilton, C.D.; Iyer-Pascuzzi, A.S.; Kolomiets, M.V.; McCulloh, K.A.; Allen, C. Trehalose Increases Tomato Drought Tolerance, Induces Defenses, and Increases Resistance to Bacterial Wilt Disease. PLoS ONE 2022, 17, e0266254. [Google Scholar] [CrossRef] [PubMed]
  54. Li, C.; Lu, X.; Liu, Y.; Xu, J.; Yu, W. Trehalose Alleviates the Inhibition of Adventitious Root Formation Caused by Drought Stress in Cucumber through Regulating Ros Metabolism and Activating Trehalose and Plant Hormone Biosynthesis. Plant Physiol. Biochem. 2023, 205, 108159. [Google Scholar] [CrossRef] [PubMed]
  55. Kosar, F.; Akram, N.A.; Ashraf, M.; Ahmad, A.; Alyemeni, M.N.; Ahmad, P. Impact of Exogenously Applied Trehalose on Leaf Biochemistry, Achene Yield and Oil Composition of Sunflower under Drought Stress. Physiol. Plant. 2021, 172, 317–333. [Google Scholar] [PubMed]
  56. Mohammadkhani, N.; Heidari, R. Effects of Drought Stress on Soluble Proteins in Two Maize Varieties. Turk. J. Biol. 2008, 32, 23–30. [Google Scholar]
  57. Ali, F.; Bano, A.; Fazal, A. Recent Methods of Drought Stress Tolerance in Plants. Plant Growth Regul. 2017, 82, 363–375. [Google Scholar] [CrossRef]
  58. Jumrani, K.; Bhatia, V.S. Interactive Effect of Temperature and Water Stress on Physiological and Biochemical Processes in Soybean. Physiol. Mol. Biol. Plants 2019, 25, 667–681. [Google Scholar] [CrossRef] [PubMed]
  59. Rosa, M.; Prado, C.; Podazza, G.; Interdonato, R.; González, J.A.; Hilal, M.; Prado, F.E. Soluble Sugars. Plant Signal. Behav. 2009, 4, 388–393. [Google Scholar] [CrossRef] [PubMed]
  60. Sami, F.; Yusuf, M.; Faizan, M.; Faraz, A.; Hayat, S. Role of Sugars under Abiotic Stress. Plant Physiol. Biochem. 2016, 109, 54–61. [Google Scholar] [CrossRef] [PubMed]
  61. Gibson, S.I. Control of Plant Development and Gene Expression by Sugar Signaling. Curr. Opin. Plant Biol. 2005, 8, 93–102. [Google Scholar] [CrossRef] [PubMed]
  62. Paul, M.; Van Dijck, P. How Do Sugars Regulate Plant Growth? Front. Plant Sci. 2011, 2, 90. [Google Scholar]
  63. Nemati, F.; Ghanati, F.; Ahmadi Gavlighi, H.; Sharifi, M. Comparison of Sucrose Metabolism in Wheat Seedlings During Drought Stress and Subsequent Recovery. Biol. Plant. 2018, 62, 595–599. [Google Scholar] [CrossRef]
  64. Bari, R.; Jones, J.D.G. Role of Plant Hormones in Plant Defence Responses. Plant Mol. Biol. 2009, 69, 473–488. [Google Scholar] [PubMed]
  65. Meitzel, T.; Radchuk, R.; McAdam, E.L.; Thormählen, I.; Feil, R.; Munz, E.; Hilo, A.; Geigenberger, P.; Ross, J.J.; Lunn, J.E.; et al. Trehalose 6-Phosphate Promotes Seed Filling by Activating Auxin Biosynthesis. New Phytol. 2021, 229, 1553–1565. [Google Scholar] [PubMed]
  66. Li, Y.; Hua, J.; Hou, X.; Qi, N.; Li, C.; Wang, C.; Yao, Y.; Huang, D.; Zhang, H.; Liao, W. Brassinosteroids Is Involved in Methane-Induced Adventitious Root Formation Via Inducing Cell Wall Relaxation in Marigold. BMC Plant Biol. 2023, 23, 2. [Google Scholar] [CrossRef] [PubMed]
Figure 1. Photosynthetic characteristics in adzuki bean during post-drought recovery caused by T6P during growing seasons. Chlorophyll measurement: 2023 (A), 2022 (F), 2021 (K); net photosynthetic rate: 2023 (B), 2022 (G), 2021 (L); stomatal conductance: 2023 (C), 2022 (H), 2021 (M); intercellular CO2 concentration: 2023 (D), 2022 (I), 2021 (N); transpiration rate: 2023 (E), 2022 (J), 2021 (O). Vertical bars represent the standard error of the mean of three replicates (n = 30). Different letters on bars at the same growth stage indicate significant differences among treatments by Duncan’s multiple range test (p < 0.05). C0, C5 and C10 represent the combinations of control with the application of 0, 5 and 10 μM T6P, respectively; D0, D5 and D10 represent the combinations of drought stress with the application of 0, 5 and 10 μM T6P, respectively. C: control; D: drought.
Agronomy 16 01279 g001
Figure 2. Defense-related enzymes induced by T6P in adzuki bean during post-drought recovery during growing seasons. POD: 2023 (A), 2022 (D), 2021 (G); SOD: 2023 (B), 2022 (E), 2021 (H); CAT: 2023 (C), 2022 (F), 2021 (I). Vertical bars represent the standard error of the mean of three replicates (n = 30). Different letters on bars at the same growth stage indicate significant differences among treatments by Duncan’s multiple range test (p < 0.05). C0, C5 and C10 represent the combinations of control with the application of 0, 5 and 10 μM T6P, respectively; D0, D5 and D10 represent the combinations of drought stress with the application of 0, 5 and 10 μM T6P, respectively. C: control; D: drought. POD: peroxidase; SOD: superoxide dismutase; CAT: catalase.
Agronomy 16 01279 g002
Figure 3. Defensive factors induced by T6P in adzuki bean during post-drought recovery during growing seasons. MDA: 2023 (A), 2022 (E), 2021 (I); H2O2: 2023 (B), 2022 (F), 2021 (J); Proline: 2023 (C), 2022 (G), 2021 (K); Soluble protein: 2023 (D), 2022 (H), 2021 (L). Vertical bars represent the standard error of the mean of three replicates (n = 30). Different letters on bars at the same growth stage indicate significant differences among treatments by Duncan’s multiple range test (p < 0.05). C0, C5 and C10 represent the combinations of control with the application of 0, 5 and 10 μM T6P, respectively; D0, D5 and D10 represent the combinations of drought stress with the application of 0, 5 and 10 μM T6P, respectively. C: control; D: drought. MDA: malondialdehyde; H2O2: hydrogen peroxide.
Agronomy 16 01279 g003
Figure 4. T6P-mediated sugar molecules in adzuki bean during post-drought recovery during growing seasons. Starch: 2023 (A), 2022 (E), 2021 (I); sucrose: 2023 (B), 2022 (F), 2021 (J); glucose: 2023 (C), 2022 (G), 2021 (K); trehalose: 2023 (D), 2022 (H), 2021 (L). Vertical bars represent the standard error of the mean of three replicates (n = 30). Different letters on bars at the same growth stage indicate significant differences among treatments by Duncan’s multiple range test (p < 0.05). C0, C5 and C10 represent the combinations of control with the application of 0, 5 and 10 μM T6P, respectively; D0, D5 and D10 represent the combinations of drought stress with the application of 0, 5 and 10 μM T6P, respectively. C: control; D: drought.
Agronomy 16 01279 g004
Figure 5. Effects of foliar T6P application on endogenous hormone accumulation profiles in adzuki bean leaves during post-drought recovery across the growing seasons. IAA: 2023 (A), 2022 (F), 2021 (K); ABA: 2023 (B), 2022 (G), 2021 (L); JA: 2023 (C), 2022 (H), 2021 (M); GA: 2023 (D), 2022 (I), 2021 (N); SA: 2023 (E), 2022 (J), 2021 (O). Vertical bars represent the standard error of the mean of three replicates (n = 30). Different letters on bars at the same growth stage indicate significant differences among treatments by Duncan’s multiple range test (p < 0.05). C0, C5 and C10 represent the combinations of controls with the application of 0, 5 and 10 μM T6P, respectively; D0, D5 and D10 represent the combinations of drought stress with the application of 0, 5 and 10 μM T6P, respectively. C: control; D: drought. IAA: indoleacetic acid; ABA: abscisic acid; JA: jasmonic acid; GA: gibberellin; SA: salicylic acid.
Agronomy 16 01279 g005
Figure 6. The possible model for growth and drought tolerance in adzuki bean plants regulated by T6P.
Agronomy 16 01279 g006
Table 1. Effects of T6P on plant architectural parameters of adzuki bean at the flower-pegging stage, approximately 52 days after emergence, during the 2021–2023 growing seasons.
YearTreatmentRL (cm)MRDRFW (g)RDW (g)PH (cm)MSDLA (cm2)LFW (mg)LDW (mg)
2023C016.04 ± 1.35 c15.66 ± 1.64 e6.62 ± 0.47 c3.68 ± 0.29 d107.06 ± 2.82 a16.22 ± 1.30 c106.94 ± 1.77 c2.74 ± 0.15 c1.68 ± 0.27 ab
C520.26 ± 1.39 b19.69 ± 1.55 cd7.90 ± 1.05 b4.38 ± 0.37 cd87.2 ± 2.41 c19.2 ± 1.97 bc116.48 ± 3.33 b3.24 ± 0.08 b1.96 ± 0.28 ad
C1021.30 ± 1.30 b22.75 ± 1.06 ab6.54 ± 0.74 c5.3 ± 0.38 b68.16 ± 2.26 e21.48 ± 1.38 b121.9 ± 3.26 a3.84 ± 0.11 a2.18 ± 0.35 a
D016.77 ± 2.63 c17.51 ± 1.68 d7.63 ± 0.50 bc4.06 ± 0.49 d96.56 ± 2.02 b16.4 ± 1.54 c97 ± 2.19 d2.38 ± 0.21 d1.18 ± 0.20 b
D522.28 ± 0.97 ab22.45 ± 1.30 bc9.19 ± 0.41 a5.16 ± 0.46 bc76.5 ± 3.96 d21 ± 1.60 b105.18 ± 2.37 c2.78 ± 0.22 c1.42 ± 0.19 b
D1025.28 ± 1.51 a25.54 ± 1.93 a8.32 ± 0.32 ab6.52 ± 0.47 a60.68 ± 3.88 f26.44 ± 1.77 a108.08 ± 2.20 c3.28 ± 0.08 b1.68 ± 0.23 ab
2022C013.93 ± 1.17 c14.08 ± 1.00 d5.94 ± 0.69 b3.28 ± 0.38 d99.82 ± 4.75 a13.04 ± 0.89 d92.48 ± 2.96 b2.6 ± 0.18 c1.28 ± 0.19 b
C518.49 ± 1.82 ab17.73 ± 2.12 bc5.98 ± 0.36 b3.38 ± 0.38 cd84.96 ± 3.67 b16.86 ± 1.82 bc107.02 ± 3.50 a2.74 ± 0.26 bc1.34 ± 0.32 b
C1020.74 ± 0.99 ab20.76 ± 0.84 ab6.00 ± 0.60 b4.12 ± 0.34 b59.9 ± 1.64 c19.9 ± 1.58 ab112.7 ± 2.62 a3.26 ± 0.11 a1.84 ± 0.24 a
D014.39 ± 2.12 c14.95 ± 2.33 cd6.61 ± 0.21 ab3.62 ± 0.51 bc88.36 ± 3.31 b15.76 ± 2.57 cd91.6 ± 4.78 b1.96 ± 0.26 d1.06 ± 0.05 b
D520.09 ± 1.64 ab20.18 ± 1.86 b6.85 ± 0.38 ab4.02 ± 0.22 bc79.12 ± 10.32 b19.38 ± 1.04 b95.46 ± 2.97 b2.36 ± 0.24 cd1.22 ± 0.27 b
D1021.75 ± 1.06 a23.47 ± 0.58 a7.35 ± 0.48 a6.4 ± 0.33 a57.04 ± 1.98 c23.1 ± 1.81 a107.18 ± 2.79 a3.08 ± 0.27 ab1.32 ± 0.26 b
2021C014.50 ± 1.83 d17.95 ± 1.03 d8.18 ± 0.65 b4.46 ± 0.18 d113.04 ± 6.22 a17.6 ± 1.02 d115.28 ± 3.83 bc3.06 ± 0.15 bc1.5 ± 0.32 c
C521.31 ± 2.47 bc20.50 ± 0.90 bc7.74 ± 0.54 b6.02 ± 0.37 bc94.84 ± 2.76 b19.24 ± 1.22 cd117.96 ± 3.29 b3.64 ± 0.13 b1.66 ± 0.20 bc
C1024.33 ± 2.13 ab23.50 ± 1.00 b7.52 ± 0.89 b6.8 ± 0.52 ab69.26 ± 2.27 d24.5 ± 0.43 ab126.9 ± 6.02 a4.16 ± 0.26 a2.48 ± 0.25 a
D019.67 ± 2.90 c19.22 ± 2.73 cd7.89 ± 0.72 b5.8 ± 0.3 c100.52 ± 2.15 b17.76 ± 3.40 d107.62 ± 4.29 d2.56 ± 0.23 d1.28 ± 0.16 c
D522.55 ± 1.71 ab22.07 ± 1.58 bc8.46 ± 1.15 b6.24 ± 0.70 bc83.22 ± 3.48 c22.7 ± 2.39 bc109.92 ± 3.74 cd2.94 ± 0.23 cd1.44 ± 0.43 c
D1026.63 ± 2.10 a26.762 ± 1.74 a10.83 ± 0.72 a7.6 ± 0.66 a64.18 ± 3.69 d27.98 ± 0.95 a116.9 ± 3.54 b3.78 ± 0.38 ab2.24 ± 0.31 ab
Analysis of variance
Year (Y)******************
Treatment (T)******************
T6P ******************
Y × TNSNSNSNSNSNS**NSNS
Y × PNSNS**NS*NS**NS**
T × PNSNS*********NSNS
Y × T × P*NS****NSNSNSNSNS
Different letters in the same column and the same growing season indicate significant difference (p < 0.05). * and ** represent significance at the 0.05 and 0.01 probability levels; NS means the difference is not significant. C0, C5 and C10 represent the combinations of control with the application of 0, 5 and 10 μM T6P, respectively; D0, D5 and D10 represent the combinations of drought stress with the application of 0, 5 and 10 μM T6P, respectively. C: control; D: drought; RL: root length; MRD: main root diameter; RFW: root fresh weight; RDW: root dry weight; PH: plant height; MSD: main stem diameter; LA: leaf area; LFW: leaf fresh weight; LDW: leaf dry weight.
Table 2. Effects of T6P on yield-related traits of adzuki bean measured at maturity during the 2021–2023 growing seasons.
YearTreatmentMSBMSSPPPPL (cm)SPPHSW (g)YPP (g)YPB (kg)
2023C05.60 ± 0.54 a22.61 ± 0.89 a17.52 ± 0.38 d9.02 ± 0.32 bc6.64 ± 0.25 c8.53 ± 0.32 b37.08 ± 1.46 cd35.15 ± 6.82 bc
C55.42 ± 0.54 ab20.35 ± 1.22 bc25.32 ± 0.56 b9.66 ± 0.51 ab7.64 ± 0.30 b9.06 ± 0.18 b44.24 ± 4.10 bc50.25 ± 10.05 a
C105.23 ± 0.44 ab20.62 ± 1.34 ab27.11 ± 0.53 a10.52 ± 0.70 a8.74 ± 0.23 a9.84 ± 0.44 a54.52 ± 5.31 a55.90 ± 4.20 a
D05.41 ± 0.54 ab21.81 ± 1.48 ab13.76 ± 0.43 e8.22 ± 0.12 c5.76 ± 0.08 d7.62 ± 0.31 c29.88 ± 3.53 d30.10 ± 5.73 c
D54.44 ± 0.54 b19.43 ± 0.89 c22.02 ± 0.78 c9.42 ± 0.40 bc6.46 ± 0.34 c8.52 ± 0.22 b40.63 ± 3.62 bc47.25 ± 6.60 ab
D104.80 ± 0.83 ab20.29 ± 0.70 bc23.12 ± 0.76 c10.14 ± 0.81 a7.42 ± 0.37 b9.84 ± 0.14 a45.44 ± 3.80 b47.30 ± 3.91 ab
2022C05.22 ± 0.44 a22.81 ± 1.30 a16.32 ± 0.35 d9.00 ± 0.46 bc6.26 ± 0.20 d7.80 ± 0.11 d29.68 ± 2.95 d33.90 ± 2.45 b
C54.63 ± 0.54 a20.23 ± 1.09 ab25.38 ± 0.55 a9.08 ± 0.14 b7.42 ± 0.16 b9.13 ± 0.15 b41.62 ± 1.71 b45.45 ± 4.90 a
C104.79 ± 083 a20.84 ± 2.16 ab25.86 ± 0.53 a10.13 ± 0.35 a8.32 ± 0.16 a9.58 ± 0.14 a49.02 ± 2.94 a44.50 ± 2.85 a
D05.22 ± 0.83 a21.81 ± 1.09 ab13.52 ± 0.53 e7.62 ± 0.25 d5.22 ± 0.10 e6.96 ± 0.20 e24.26 ± 2.90 d23.30 ± 2.60 c
D54.61 ± 0.54 a19.62 ± 1.51 b21.24 ± 0.68 c8.44 ± 0.32 c6.44 ± 0.15 d8.43 ± 0.27 c36.04 ± 3.90 c41.80 ± 7.04 ab
D105.33 ± 0.70 a19.84 ± 1.64 b23.84 ± 0.73 b9.36 ± 0.23 b7.04 ± 0.28 c9.72 ± 0.19 a40.88 ± 2.16 bc44.90 ± 2.60 a
2021C06.32 ± 0.70 a22.60 ± 0.54 a17.64 ± 0.23 d8.86 ± 0.40 c6.46 ± 0.33 cd8.48 ± 0.31 c33.52 ± 1.47 c39.05 ± 8.85 b
C55.20 ± 0.44 a20.61 ± 0.51 ab27.76 ± 0.93 a10.04 ± 0.73 b7.54 ± 0.28 b9.48 ± 0.23 b46.88 ± 2.71 b46.60 ± 5.35 b
C105.42 ± 1.14 a21.82 ± 1.78 ab28.94 ± 0.63 a11.42 ± 0.44 a8.56 ± 0.29 a10.92 ± 0.74 a52.64 ± 1.95 a62.70 ± 6.22 a
D05.83 ± 0.83 a21.43 ± 1.14 ab16.06 ± 0.39 e8.11 ± 0.35 c5.98 ± 0.25 d7.26 ± 0.30 d28.26 ± 1.66 d38.20 ± 4.41 b
D54.64 ± 0.54 a19.81 ± 1.30 b23.14 ± 1.02 c8.88 ± 0.63 c6.52 ± 0.24 c8.64 ± 0.23 c43.52 ± 0.99 b40.75 ± 8.45 b
D105.22 ± 0.83 a19.62 ± 1.14 b26.08 ± 0.65 b10.42 ± 0.35 b7.52 ± 0.20 b10.08 ± 0.51 ab46.64 ± 4.98 b49.95 ± 4.25 ab
Analysis of variance
Year (Y)*NS************
Treatment (T)NS**************
T6P****************
Y × TNSNSNSNSNS*NSNS
Y × PNSNSNS*NS**NS**
T × PNSNS**NS****NSNS
Y × T × PNSNS**NSNSNSNS*
Different letters in the same column and the same growing season indicate significant difference (p < 0.05). * and ** represent significance at the 0.05 and 0.01 probability levels. MSB: main stem branches; MSS: main stem sections; PPP: pods per plant; PL: pod length; SPP: seeds per pod; HSW: hundred seed weight; YPP: yield per plant; YPB: yield per block. Other notes are the same as in Table 1.
Disclaimer/Publisher’s Note: The statements, opinions and data contained in all publications are solely those of the individual author(s) and contributor(s) and not of MDPI and/or the editor(s). MDPI and/or the editor(s) disclaim responsibility for any injury to people or property resulting from any ideas, methods, instructions or products referred to in the content.