Article

Genome-Wide Analysis and Characterization of CYP450 Gene Family and Its Functional Analysis in Celery Seeds (Apium graveolens L.)


1
Horticulture Research Institute, Shanghai Academy Agricultural Sciences, Key Laboratory of Protected Horticulture Technology, No. 1000 Jin Qi Road, Fengxian District, Shanghai 201403, China
2
College of Horticulture, Nanjing Agricultural University, State Key Laboratory of Crop Genetics and Germplasm Enhancement, Ministry of Agriculture and Rural Affairs Key Laboratory of Horticultural Crop Biology and Germplasm Creation in East China, Nanjing 210095, China
3
Institute of Horticulture, Guizhou Academy of Agricultural Sciences, Horticultural Engineering Technology Research Center of Guizhou, Ministry of Agriculture and Rural Affairs Key Laboratory of Crop Gene Resources and Germplasm Innovation in Karst Mountain Area, Guiyang 550006, China
4
Shanghai Xinghui Vegetable Co., Ltd., Shanghai 201419, China
*
Authors to whom correspondence should be addressed.
Agronomy 2026, 16(13), 1271; https://doi.org/10.3390/agronomy16131271
Submission received: 8 May 2026 / Revised: 17 June 2026 / Accepted: 28 June 2026 / Published: 30 June 2026
(This article belongs to the Section Horticultural and Floricultural Crops)

Abstract

The Cytochrome P450 (CYP) superfamily plays an important role in the regulation of plant growth and development. However, the composition, evolutionary characteristics, and potential functions of CYPs in celery remain largely unexplored. Therefore, the objective of this study was to perform a genome-wide characterization of the Apium graveolens Cytochrome P450 (AgCYP) gene family and investigate its potential roles in seed development. In this study, a total of 227 AgCYPs were identified, and phylogenetic analysis classified them into six clades. Conserved motif and domain evaluations indicated that most AgCYP proteins possess conserved P450 domains. Chromosomal localization revealed an unequal distribution of AgCYPs across the 11 celery chromosomes. Duplicated AgCYP gene pairs were identified by synteny and Ka/Ks analyses, indicating that the duplicated AgCYPs have undergone strong purifying selection. Inter-genomic synteny analysis further reflects the closer relationship within Apiaceae. Analysis of cis-acting elements in the promoter regions identified an abundance of elements associated with light, hormone, and environmental stress. Moreover, AgCYPs showed stage-specific expression patterns and were correlated with monoterpene and phthalide accumulation during celery seed development, suggesting their potential functions in secondary metabolism in seed development. Treatment with exogenous auxin and its transport and biosynthesis inhibitors differentially induced distinct expression responses among AgCYPs, indicating their possible participation in auxin-related regulatory pathways. Moreover, candidate genes were selected. They exhibited diverse tissue-specific expression patterns and were potentially localized to the endoplasmic reticulum and interacted with some auxin-related proteins. In conclusion, this study provides the first comprehensive framework for understanding the functional diversification of AgCYPs in celery seeds, providing new insights into the evolutionary features and biological functions of the AgCYP gene family and establishing a foundation for future functional studies and molecular breeding applications.

1. Introduction

Cytochrome P450s (CYP) are a superfamily of heme-thiolate proteins, identified by their spectral absorption peak of binding carbon monoxide at 450 nm [1,2]. CYPs are prevalent in various plant species, catalyzing the metabolism of a diverse range of substrates [3]. There are two primary functions of CYPs: some facilitate metabolic detoxification functions, converting environmental toxins, synthetic dyes, and agrochemicals into non-toxic forms [4,5]; others assist in metabolic processes, including the biosynthesis of terpenoids, phytohormones, phenylpropanoids, alkaloids, phenolic compounds, and sterols [6]. Since the identification of the first plant CYP gene in 1962, public databases have annotated over 300,000 CYP sequences from more than 670 families, including Arabidopsis thaliana, Ricinus communis, and Oryza sativa [7,8,9,10]. Regarding their classification, Plant CYPs were initially cataloged into plant-specific (A-type) and non-plant-specific (B-type) clades [11]. The concept of clan was subsequently introduced into the classification framework based on phylogenetic relationships and homology criteria. Seven clans contain a single CYP family (CYP51, CYP74, CYP97, CYP710, CYP711, CYP727, and CYP746), which typically exhibit a low copy number and are responsible for highly conserved biological functions. The four remaining clans (CYP71, CYP72, CYP85, and CYP86) generally possess higher copy numbers and show lineage-specific diversification, indicating a higher degree of specialization [12,13].
CYPs serve as essential catalytic components in the metabolic pathways of bioactive compounds. In terpenoid biosynthesis, the P450scc enzyme DlCYP87A4 catalyzes the cleavage of the side chains of both cholesterol and campesterol to yield pregnenolone in Digitalis lanata [14]. CYP725A5 catalyzes the formation of the critical oxetane ring in paclitaxel [15]. In flavonoid biosynthesis, the CYP82D subfamily was indicated as a catalyst for flavonoid 6/8-hydroxylation, 7-O-demethylation, and 6-hydroxylation reactions, revealing the essential enzymatic mechanisms of the distinct structures of flavonoids [16]. Moreover, CYPs play a crucial role in alkaloid synthesis. EnCYP81AN15 is essential for the tropane skeleton formation during cocaine biosynthesis in Erythroxylum novogranatense, which invalidated the previous hypothesis on the biosynthesis of 4-(1-methyl-2-pyrrolidinyl)-3-oxobutanoic acid [17]. Furthermore, 1-deoxynojirimycin, an antidiabetic active ingredient in the traditional Chinese medicinal herb mulberry (Morus alba), is produced by MaCYP71BG22 through the stereoselective hydroxylation of its precursor at the C4 position. providing an important target for enzyme engineering [18].
Beyond their functions in metabolite biosynthesis, CYPs are also essential for their involvement in the biosynthesis and metabolic regulation of hormone signaling, such as jasmonates, gibberellins, strigolactones, abscisic acid, and brassinosteroids [19]. Map-based cloning in maize revealed ZmCYP90D1 as a regulator of genes associated with cell division and cell wall biosynthesis within the BR pathway [20]. In the metabolism of gibberellin, CYP72A9 in Brassicaceae species could convert 13-H gibberellins into 13-OH gibberellins [21]. Similarly, two other CYP714 gene family members, CYP714B1 and CYP714B2, have been characterized as GA13 oxidases that inhibit stem elongation and contribute to the gibberellin homeostasis in rice [22]. In the metabolism of strigolactones, a novel noncanonical strigolactone 4-oxo-methyl carlactonoate (4-oxo-MeCLA) was identified in rice, biosynthesized by OsCYP706C2 with two methyltransferases (Os4OCLAMT1 and Os4OCLAMT2) using carlactone (CL) as the substrate [23].
CYPs play an important role in the biosynthesis of bioactive compounds and regulate plant growth and development through the regulation of phytohormone metabolism signaling. Genome-wide association studies (GWAS) are useful to dissect the genetic basis of complex metabolic and agronomic traits in plants [24]. Recent studies have identified candidate CYP genes involved in specialized metabolism through GWAS analysis. For example, the cytochrome P450 gene CYP94D144 was identified as being associated with diosgenin biosynthesis in Dioscorea zingiberensis [25]. Moreover, associations between CYPs and natural variation in secondary metabolites were identified in Populus trichocarpa through metabolite-GWAS analysis [26]. These findings highlight the value of integrating GWAS with functional genomics approaches for elucidating the biological roles of CYP450 genes. Celery is an economically important vegetable crop of the family, widely cultivated for its nutritional value and medicinal properties, particularly owing to its abundant bioactive compounds, including phthalides, flavonoids, and phenylpropanoids. In this study, a comprehensive investigation of the celery CYP superfamily is therefore expected to deepen our understanding of the functional diversification of CYPs in the accumulation of bioactive compounds and the regulation of growth and development in celery, and help to establish a comprehensive reference framework for future functional genomics and molecular breeding studies in celery.

2. Results

2.1. Identification and Phylogenetic Analysis of AgCYPs in Celery

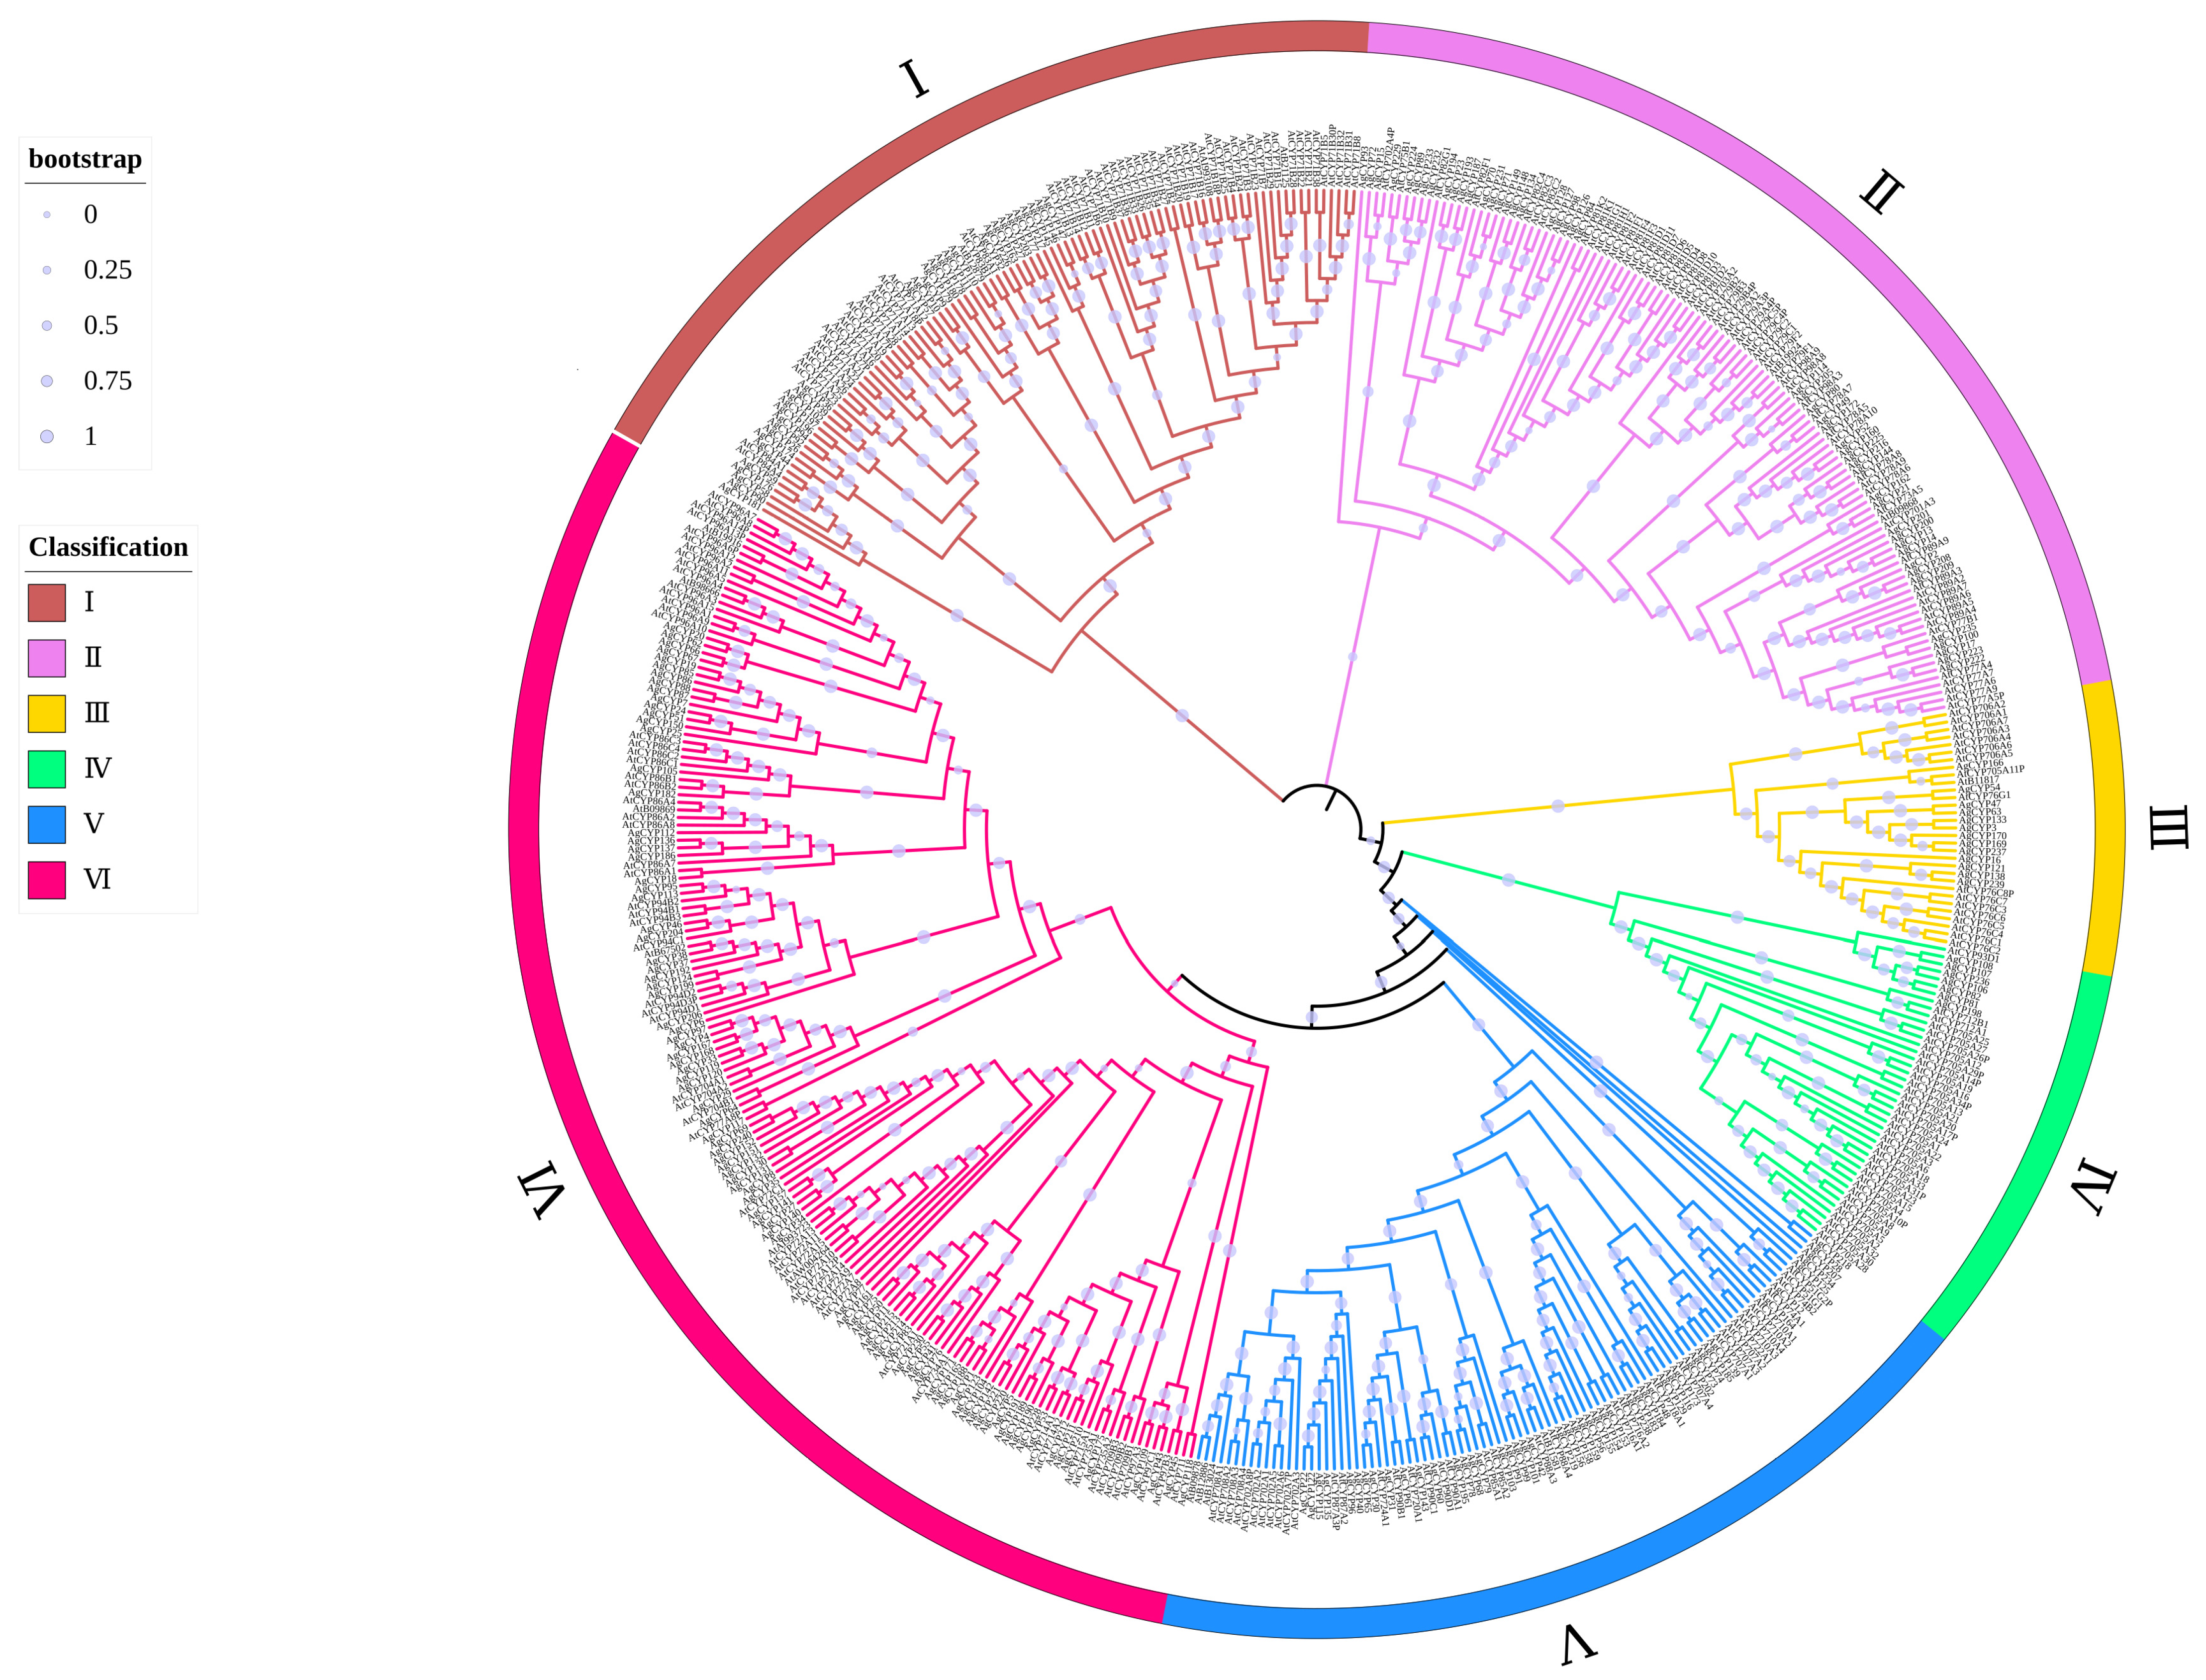
A genome-wide analysis of the CYP superfamily in celery was established utilizing the genome sequence. In total, 227 putative AgCYPs were identified and characterized, possessing conserved P450 domains after bioinformatics analysis (Table S1). The identified genes were named AgCYP1 to AgCYP227 based on their locations on chromosomes. Phylogenetic analysis among AgCYP superfamily genes was established alongside their Arabidopsis thaliana homologs (AtCYPs) (Figure 1). According to the topological structure of the phylogenetic tree, all AgCYPs were classified into six clades (I–VI) as follows: Clade I consisted of 33 members; Clade II comprised 42 members; Clade III included 11 members; Clade IV, the smallest clade, encompassed 6 members; Clade V comprised 46 members; and Clade VI, the largest clade, featured 89 members. The phylogenetic tree showed that most AgCYP proteins clustered with Arabidopsis CYP homologs, reflecting the evolutionary conservation across plant species. The uneven distribution of AgCYP members among the six clades suggests differential expansion and diversification during celery evolution. In particular, Clades V and VI contained substantially more members than the other clades, indicating that these groups may have undergone extensive gene duplication events. The phylogenetic relationships established in this study provide a useful framework for predicting their potential biological functions in celery.

2.2. Conserved Motif, Domains, and Gene Structure Analysis of the AgCYP Gene Family

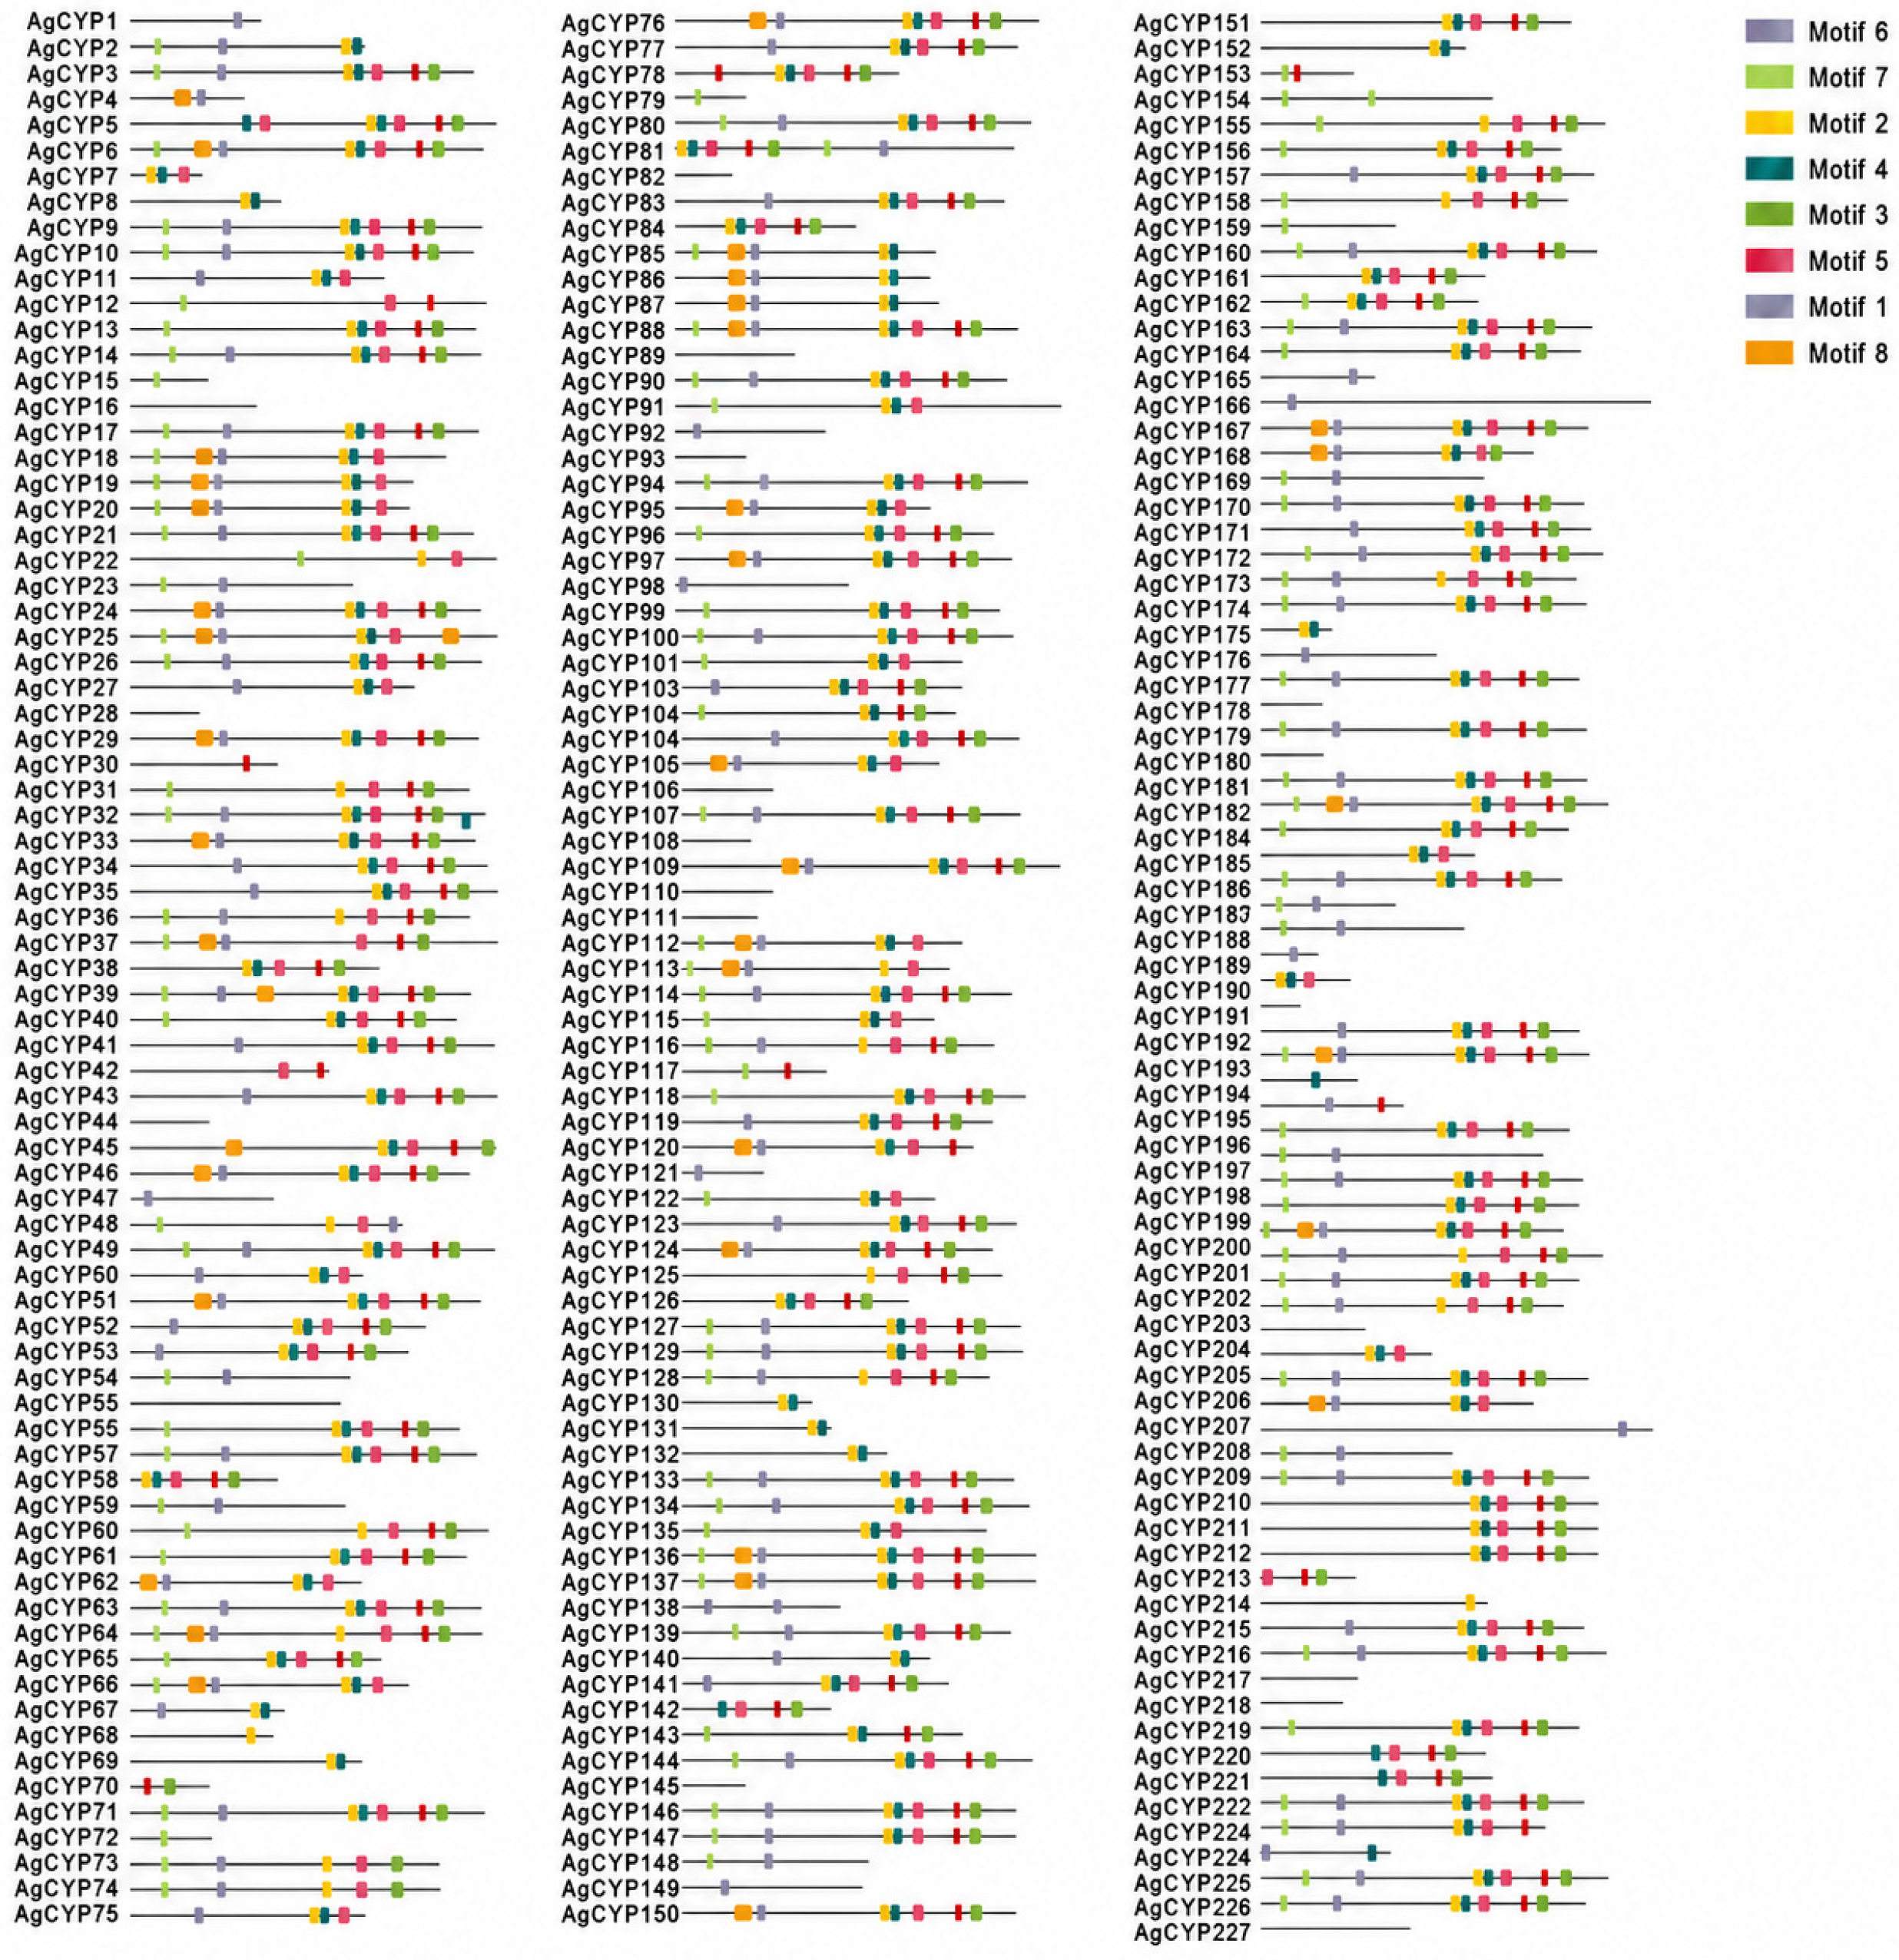
The conserved motifs and functional domains of AgCYP members were systematically analyzed using the MEME online tool and the NCBI Batch CD-Search tool, respectively. Eight conserved motifs were identified within the AgCYP protein sequences (Figure 2). The majority of proteins exhibited a similar motif composition and arrangement. Motifs 1, 2, 3, and 4 were the most widely distributed and present in nearly all members, suggesting that these motifs may form the structural core required for heme-binding and substrate interaction, whereas Motifs 5–8 showed a more restricted distribution, implying their sub-family-specific functions.
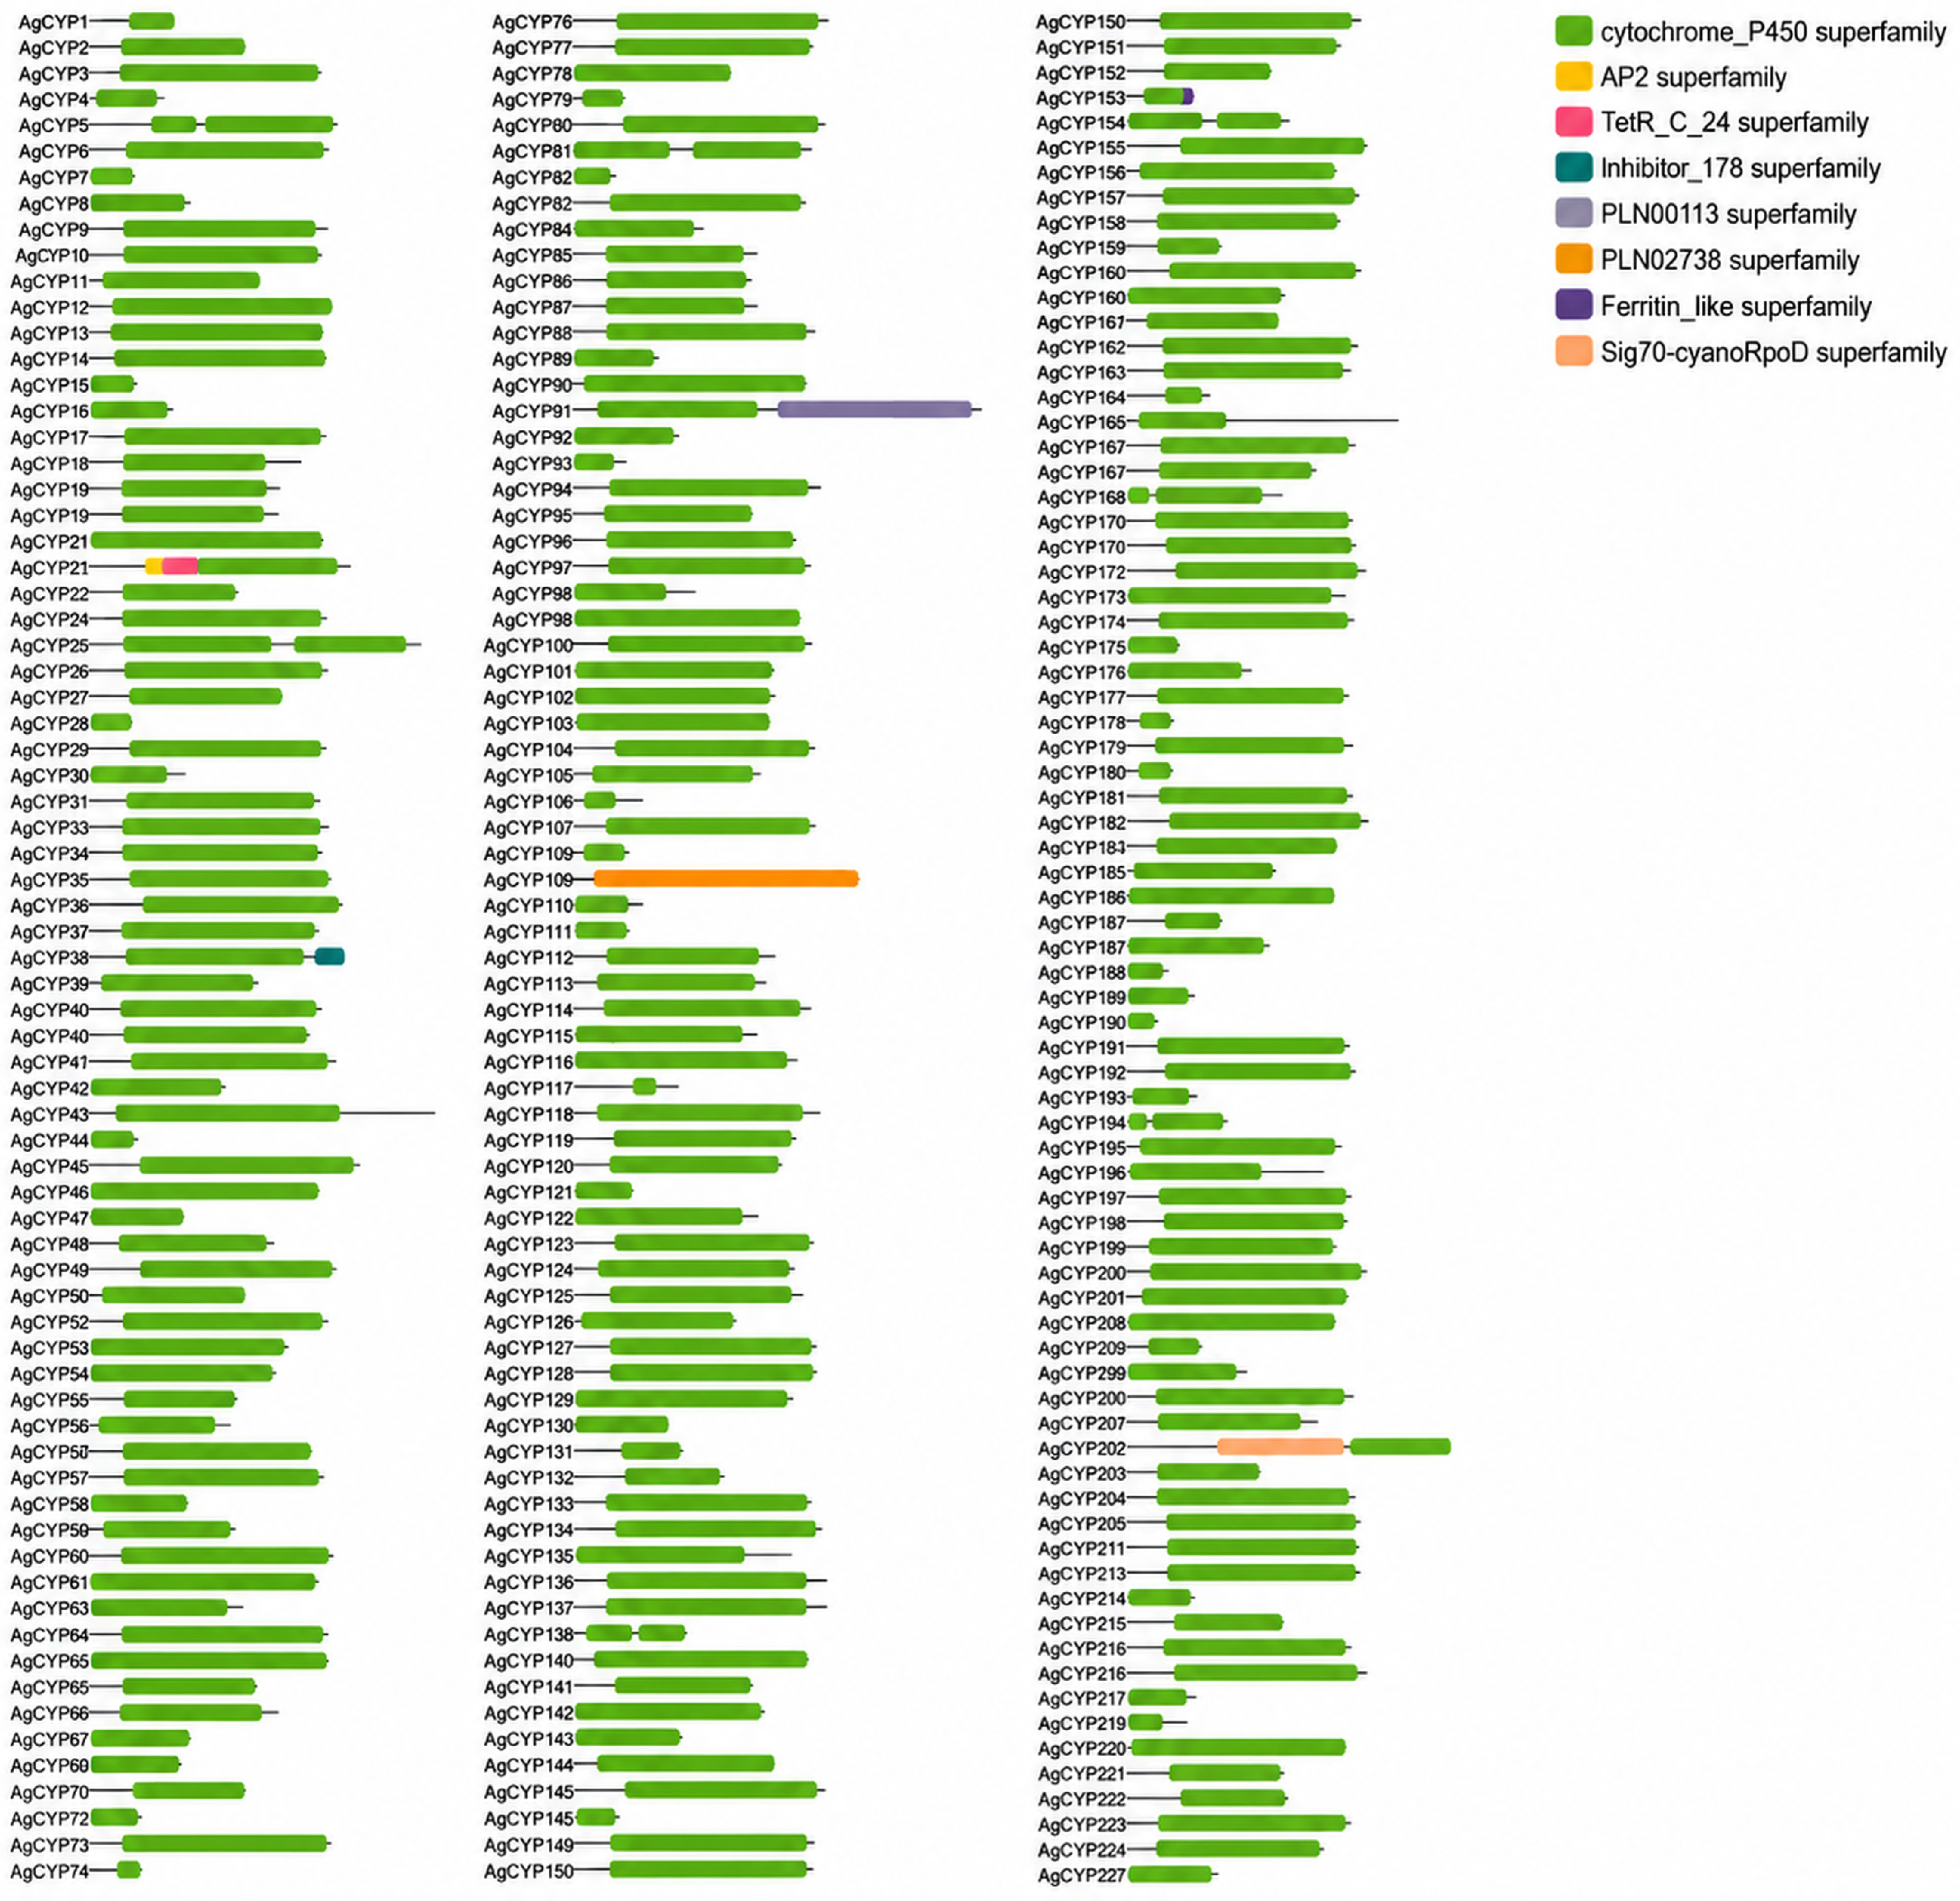
Moreover, conserved domain analysis revealed that the vast majority of AgCYP proteins contained the cytochrome P450 superfamily domain, confirming their classification within the CYP450 superfamily (Figure 3). Some other domains were found in a small number of these proteins. The existence of these domains indicated the potential regulatory or catalytic functions beyond the P450 enzymatic activity. The motif and domain composition analyses demonstrate that AgCYP proteins display significant structural conservation, reflecting their common evolutionary lineage within the CYP450 superfamily, while also revealing some structural variations that may facilitate the functional diversification of the CYP gene family in celery.
To further characterize the structural diversity of the AgCYP gene family, the exon–intron architectures of all 227 AgCYP members were reconstructed based on their genomic coordinates and annotation information (Figure S1). The gene structures exhibited considerable variation among members; some genes displayed a simple structure with few exons, whereas others exhibited complex multi-exon arrangements. This structural heterogeneity is consistent with patterns reported in CYP superfamilies of other plant species and likely contributes to the transcriptional and functional diversification of AgCYPs in celery.

2.3. Chromosomal Localization and Synteny Analysis of the AgCYP Gene Family

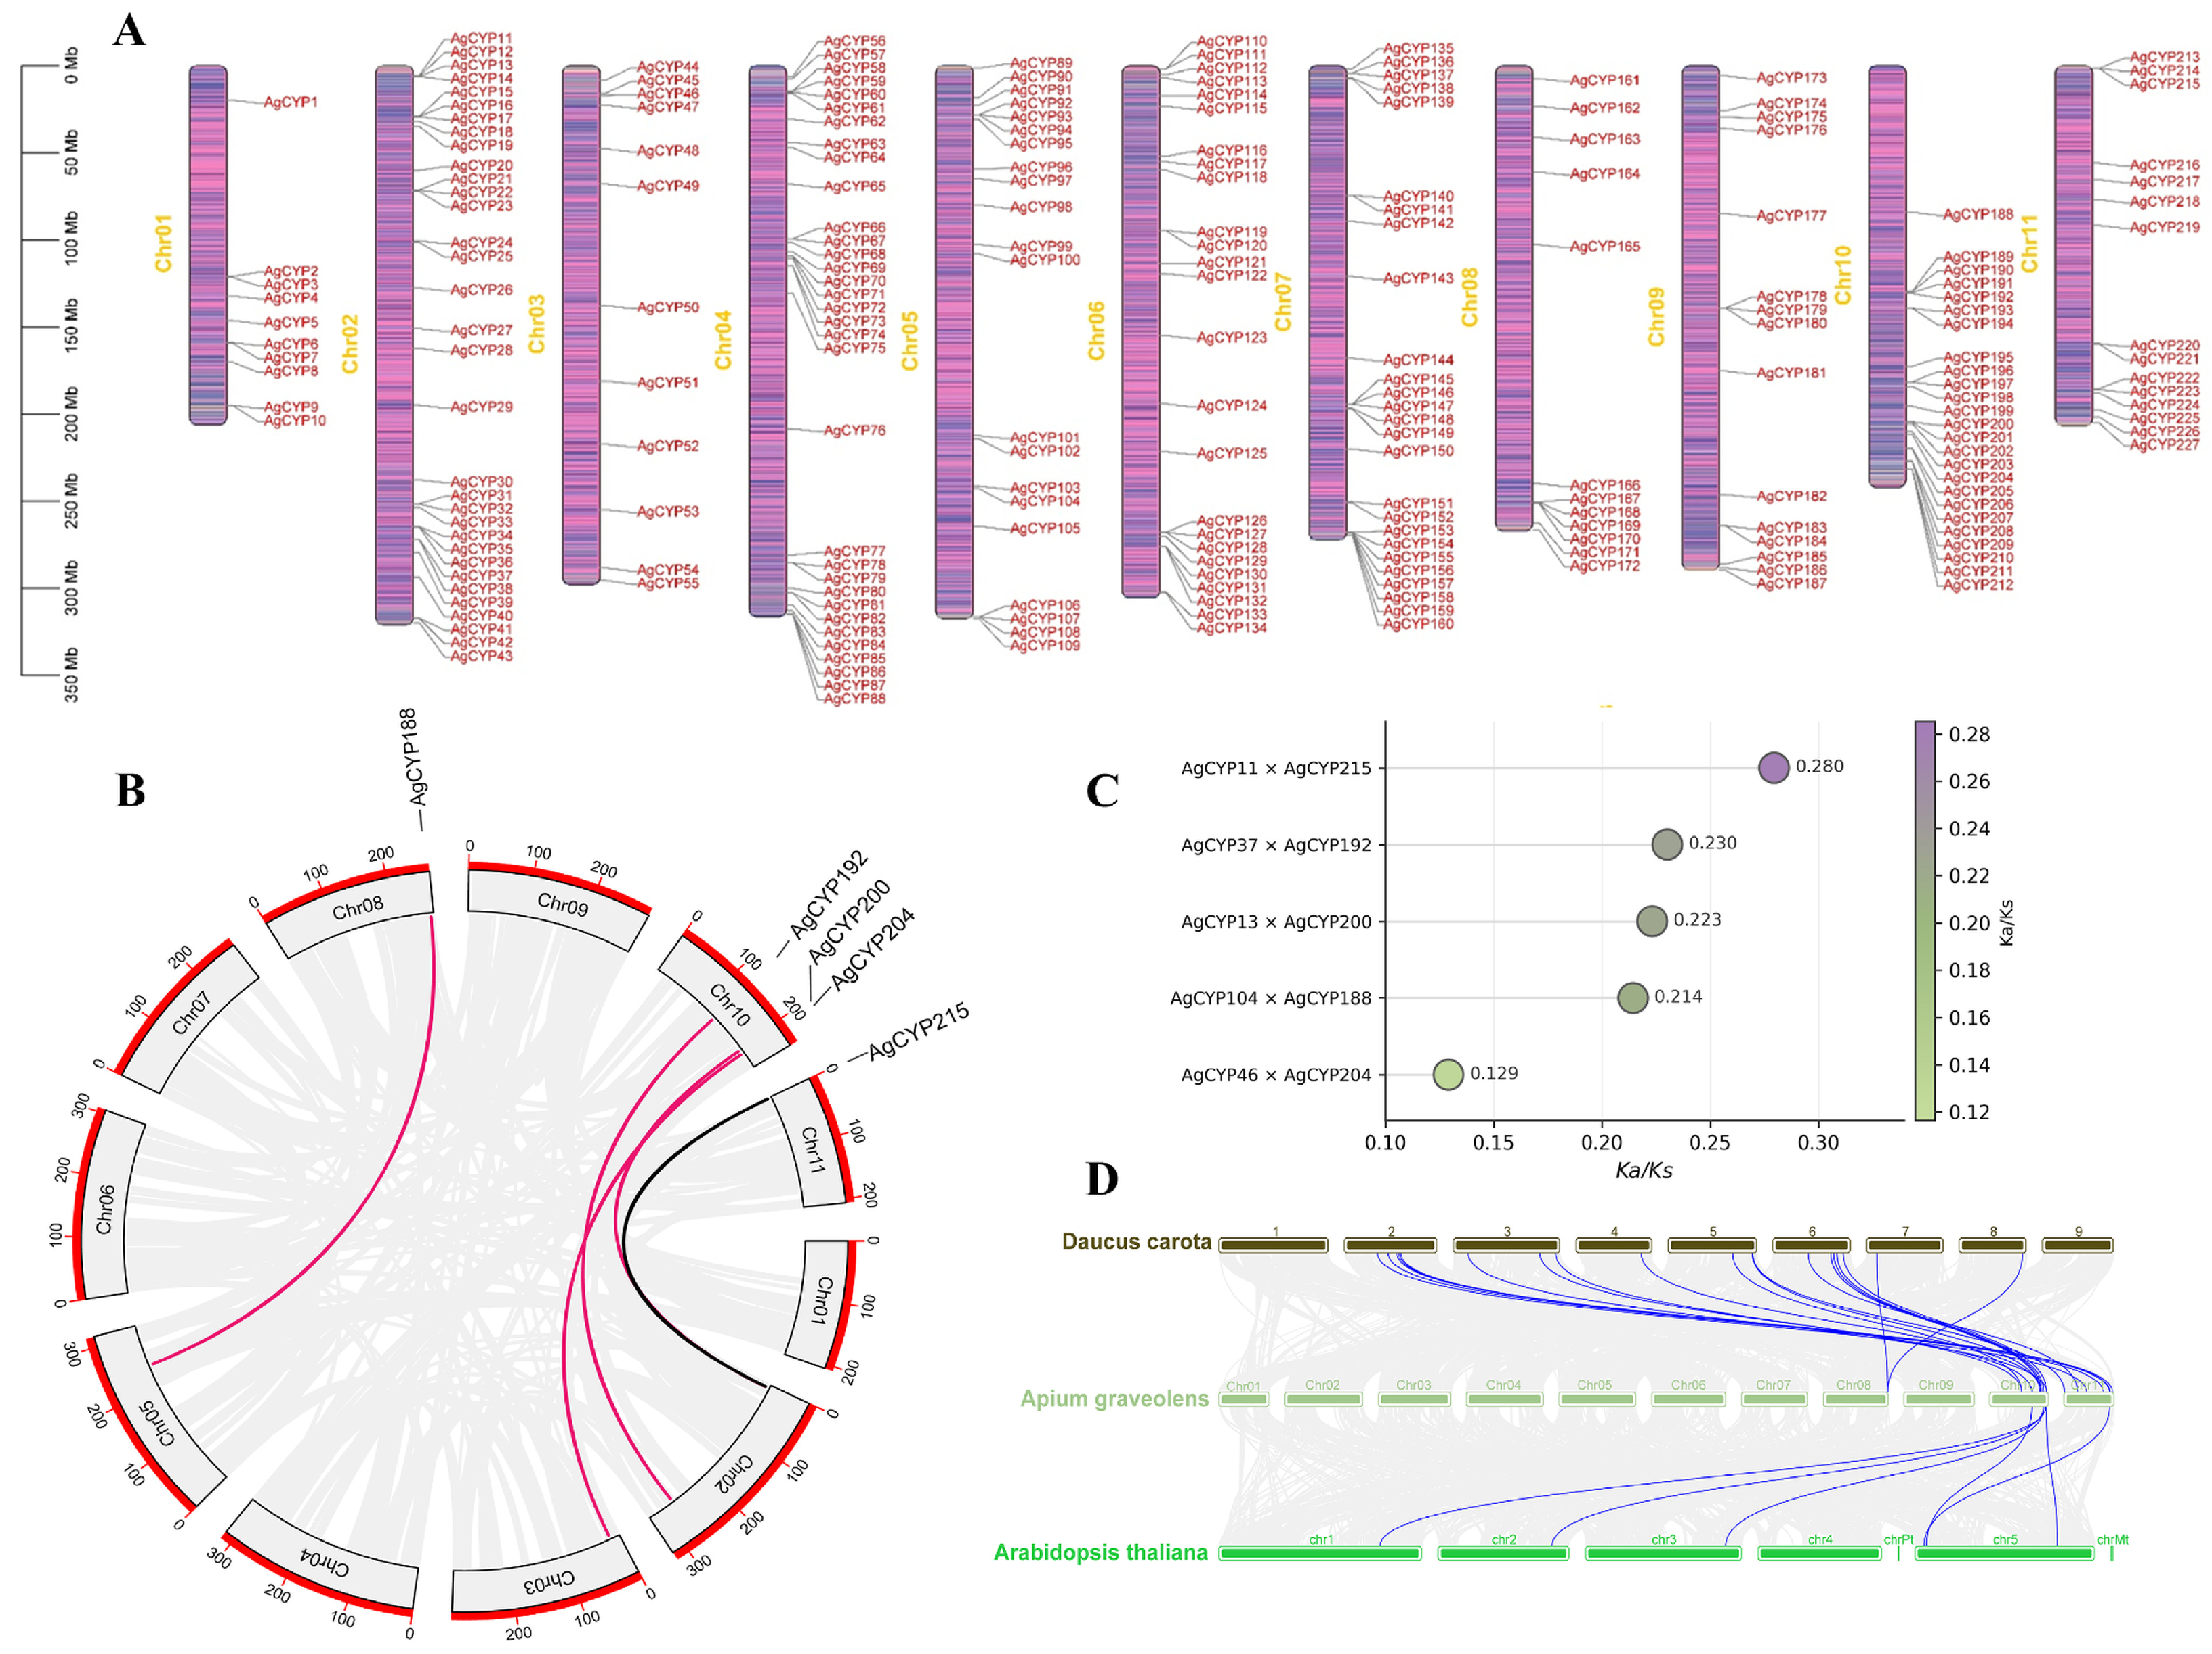
A chromosomal localization map was conducted based on genomic annotations (Figure 4). All identified AgCYP members were mapped onto the assembled celery genome. As illustrated in Figure 4, the AgCYP genes were distributed across all 11 chromosomes (Chr01–Chr11), but the distribution of AgCYP genes across chromosomes was markedly unequal. Chr04 and Chr06 possessed the highest number of AgCYP genes, while Chr01 and Chr11 contained fewer members. The AgCYP genes exhibit a non-random distribution throughout the celery genome, characterized by chromosomal bias and regional clustering, indicating that both tandem and segmental duplication events have played a role in the diversification of the AgCYP superfamily.
Synteny and duplication analysis were performed to better understand the evolutionary expansion of the AgCYP family within the celery genome (Figure 4B). A total of five syntenic gene pairs were identified, and most of these duplicated gene pairs were distributed on Chr10 and Chr11, suggesting that these chromosomes may have played important roles in the evolutionary expansion of AgCYP genes. The non-synonymous (Ka) to synonymous (Ks) substitution rate ratios were calculated to assess the selective pressures of duplicated gene pairs (Figure 4C). The Ka/Ks ratios ranged from 0.129 to 0.280. AgCYP11AgCYP215 displayed the highest Ka/Ks value, whereas AgCYP46AgCYP204 exhibited the lowest Ka/Ks value. These results indicate that the duplicated AgCYP genes have mainly undergone purifying selection during evolution, suggesting that their biological functions have been largely conserved following duplication events.
To further elucidate the evolutionary relationships of the AgCYP gene family with other plant species, synteny analysis was conducted between A. graveolens and two representative species, Daucus carota (family Apiaceae) and Arabidopsis thaliana (family Brassicaceae) (Figure 4D). A higher number of syntenic gene pairs was identified between celery and carrot. Multiple celery genes located on Chr10 and Chr11 exhibited syntenic relationships with carrot chromosomes 2, 5, 6, and 7, indicating a higher degree of genomic conservation between the two Apiaceae species. However, fewer syntenic AgCYP gene pairs were detected between celery and A. thaliana, reflecting the greater evolutionary distance between Apiaceae and Brassicaceae.

2.4. Cis-Acting Elements Analysis of the AgCYP Gene Family

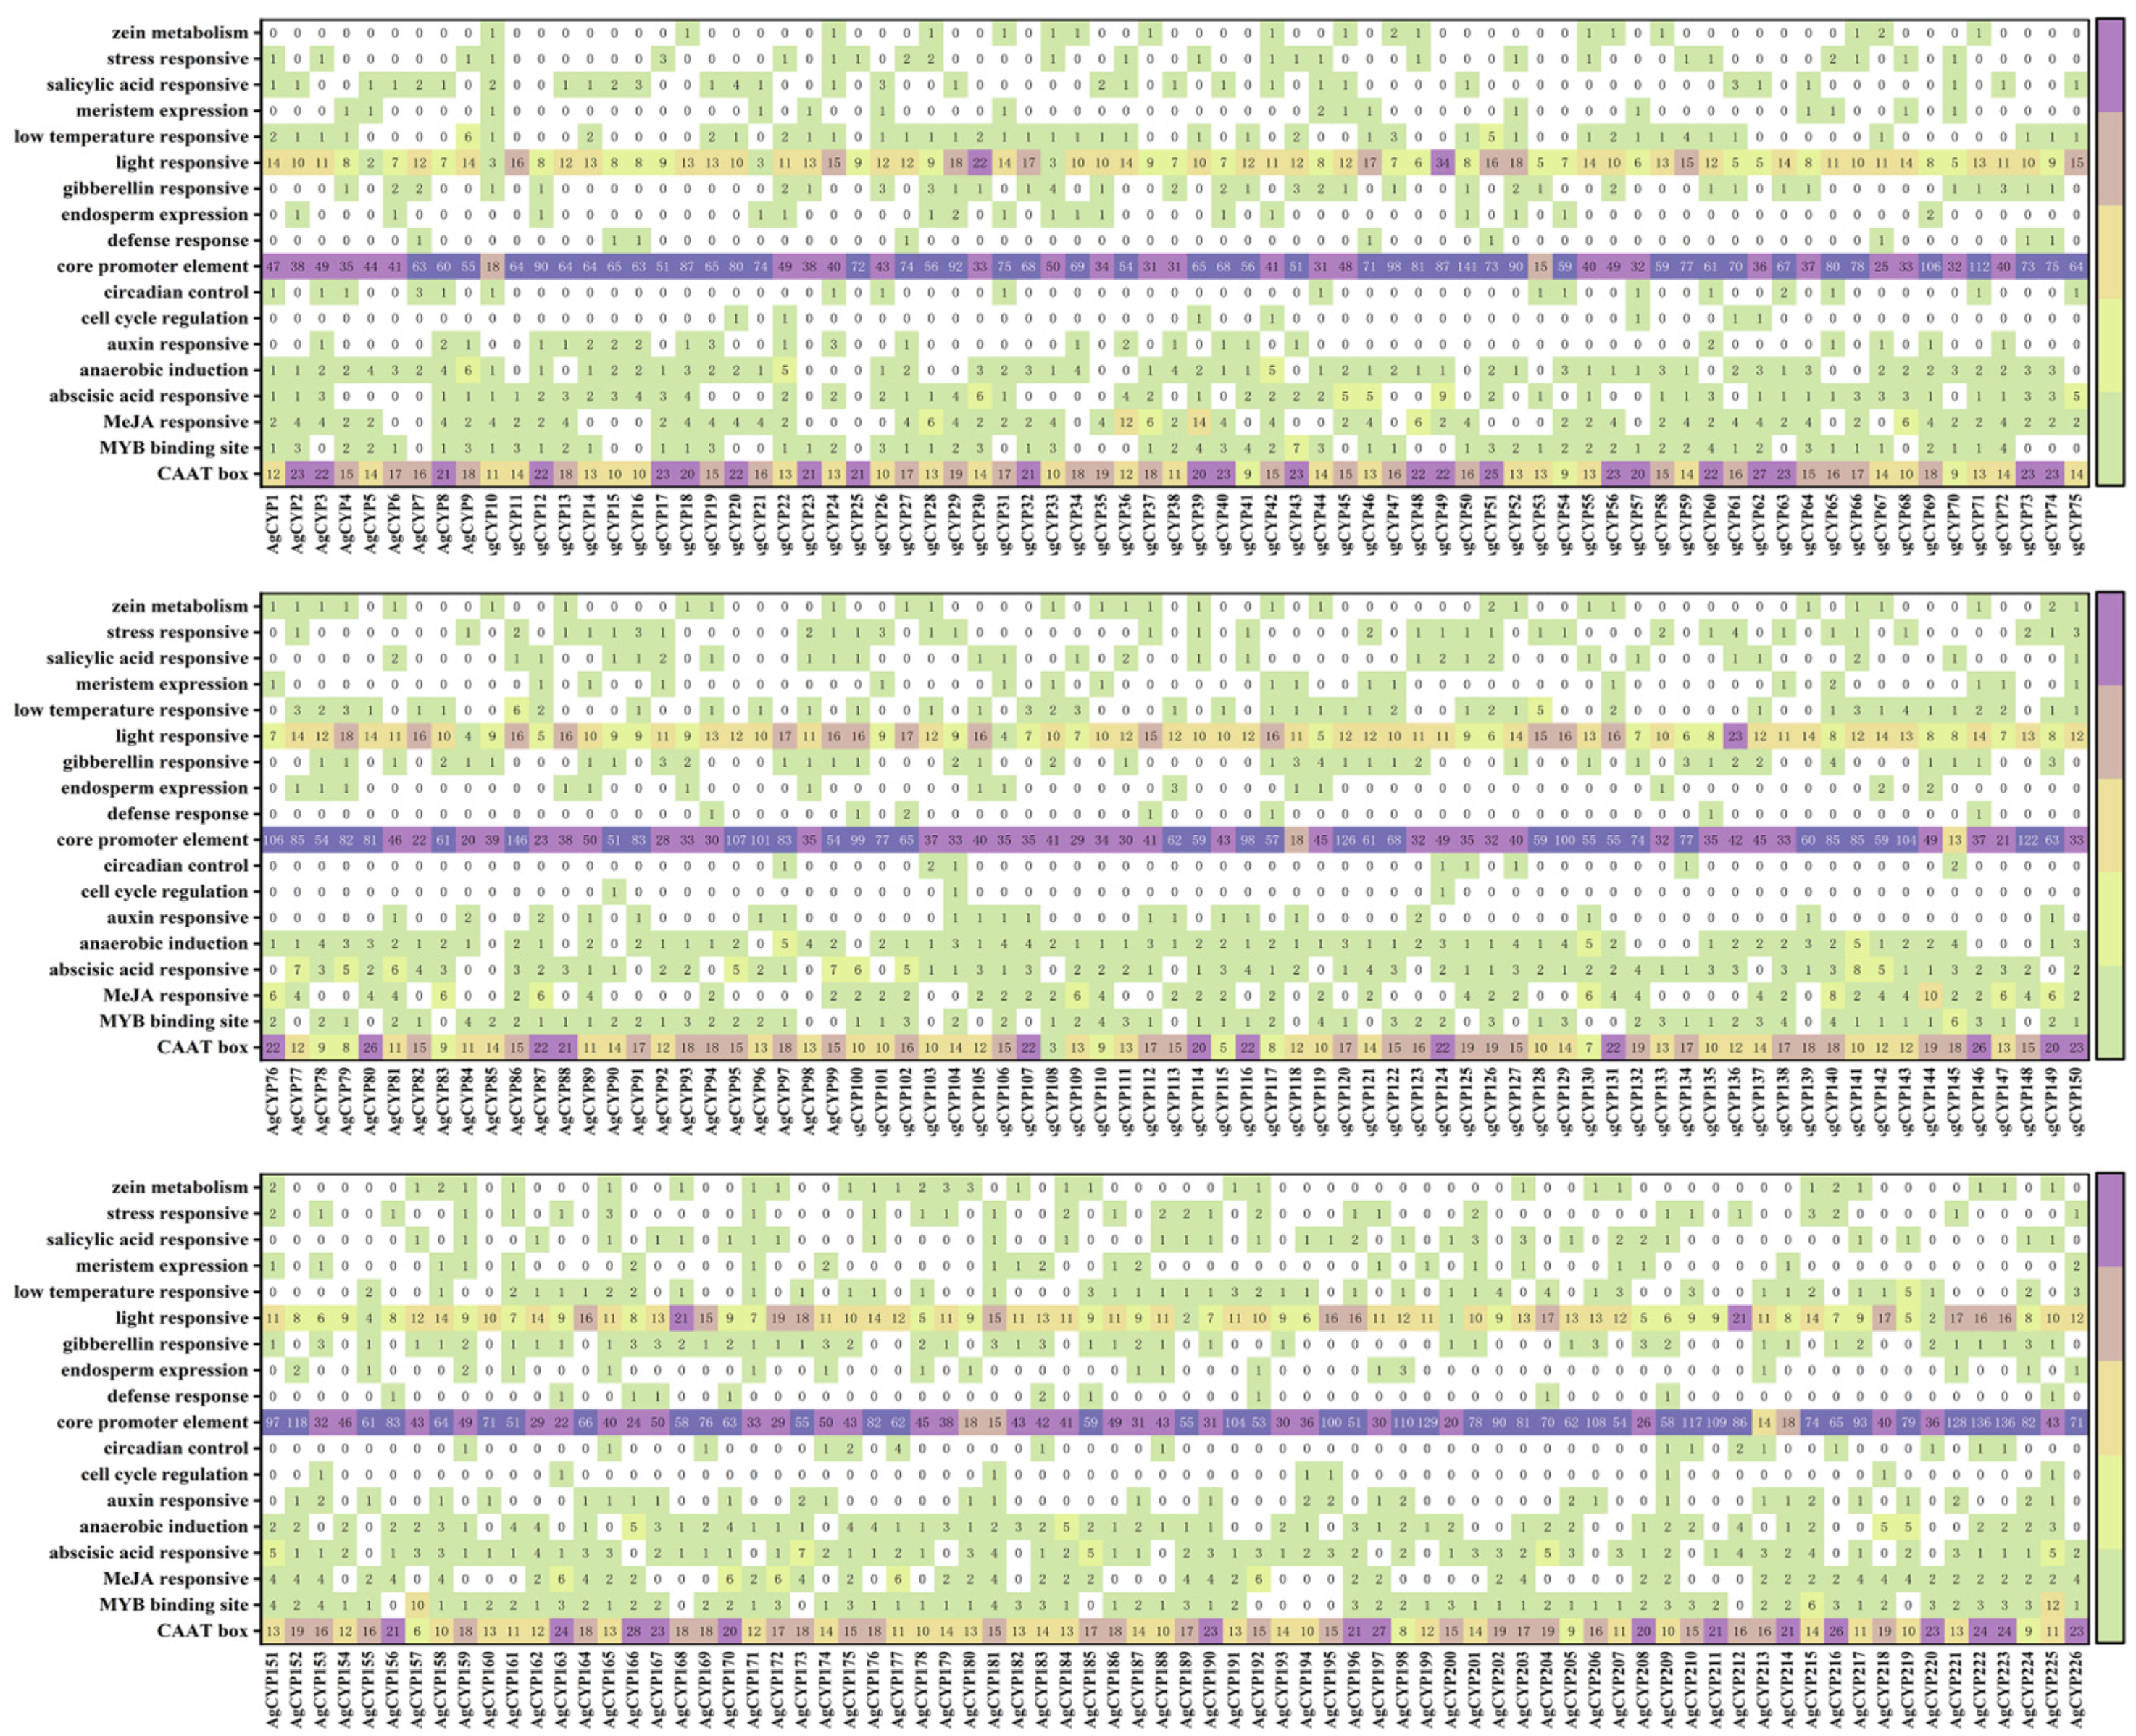
Cis-regulatory elements within the promoter region serve as recognition sites for transcription factors and play essential roles in the transcriptional regulation of gene expression. To identify cis-acting regulatory elements within the AgCYP gene family, the 2000 bp sequence upstream of the start codons of each AgCYP was obtained and analyzed by using the PlantCARE database. Eighteen functional categories of cis-regulatory elements were identified (Figure 5 and Figure S1). Among them, core promoter elements, which typically ranged from 29 to 146 per gene, were the most abundant and widely distributed cis-acting elements, reflecting their fundamental role in basal transcriptional regulation. Light-responsive elements constituted the second most abundant category, suggesting that a substantial proportion of AgCYP genes may be involved in light-mediated transcriptional regulation.
Moreover, five classes of hormone-responsive elements were detected, including MeJA-responsive, abscisic acid (ABA)-responsive, auxin-responsive, gibberellin (GA)-responsive, and salicylic acid (SA)-responsive elements. Furthermore, anaerobic induction elements, defense and stress-responsive elements, and low-temperature-responsive elements were identified in numerous AgCYP genes, suggesting their adaptations under adverse environmental conditions. The distribution of cis-regulatory elements varied among AgCYP genes. Specific members like AgCYP47, AgCYP148, AgCYP199, and AgCYP221 were found with a greater quantity of cis-elements. These findings indicate that AgCYPs are likely involved in diverse developmental, hormonal, and environmental signals, thereby supporting their diverse functions in celery.

2.5. Transcriptional Patterns of AgCYPs During Celery Seeds Development

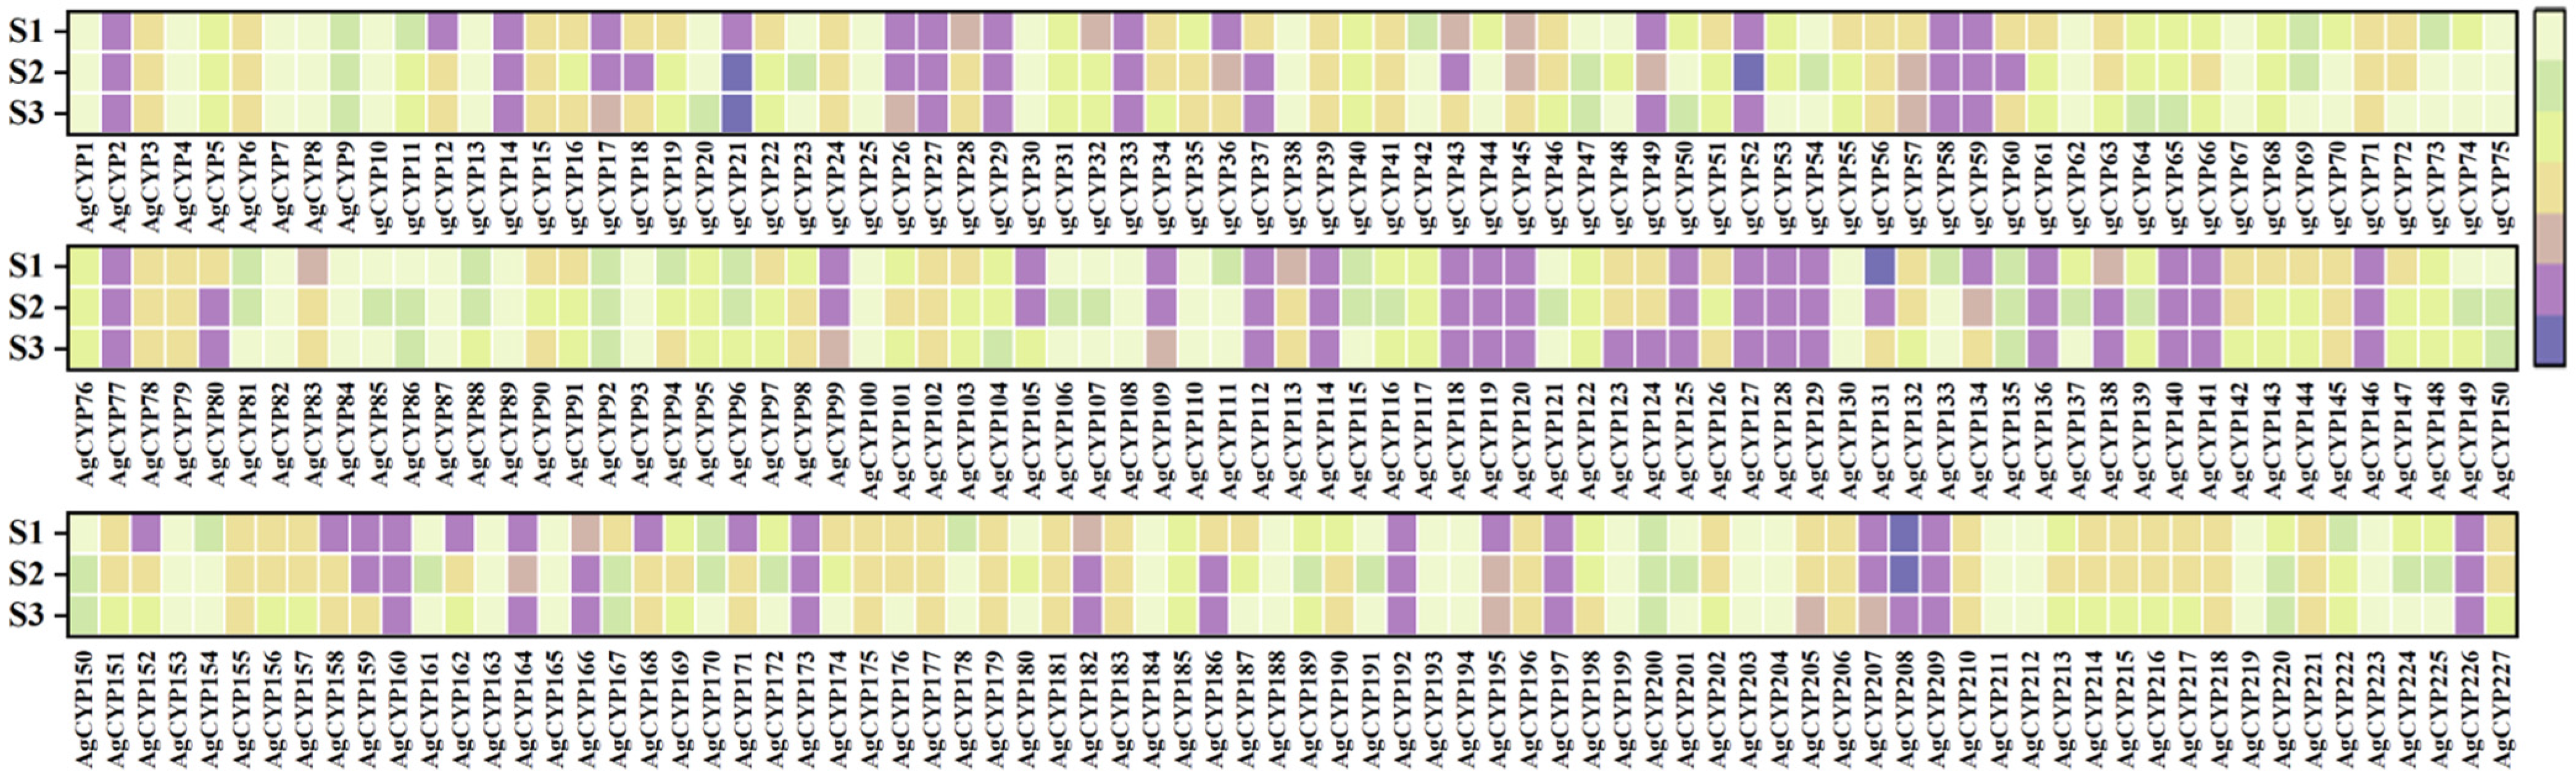
To explore the potential functions of AgCYPs in celery seed development, the expression levels of all AgCYP members were examined across three seed developmental stages: the initial formation stage of seeds (S1), the middle development stage of seeds (S2), and the maturation stage of seeds (S3) (Figure 6). Several AgCYP genes, like AgCYP21, AgCYP56, and AgCYP131, were highly expressed across all three developmental stages. Some genes, including AgCYP14, AgCYP17, AgCYP22, AgCYP26, AgCYP27, AgCYP44, AgCYP117, and AgCYP186, showed higher expression levels at S1 or S2 stages and were downregulated at S3, indicating their potential roles in early seed maturation. Furthermore, AgCYP58, AgCYP127, and AgCYP140 displayed high expression at S3. These findings demonstrated that AgCYP genes exhibited diverse and temporally regulated expression patterns during celery seed development, showing their potential diverse functions during seed maturity.
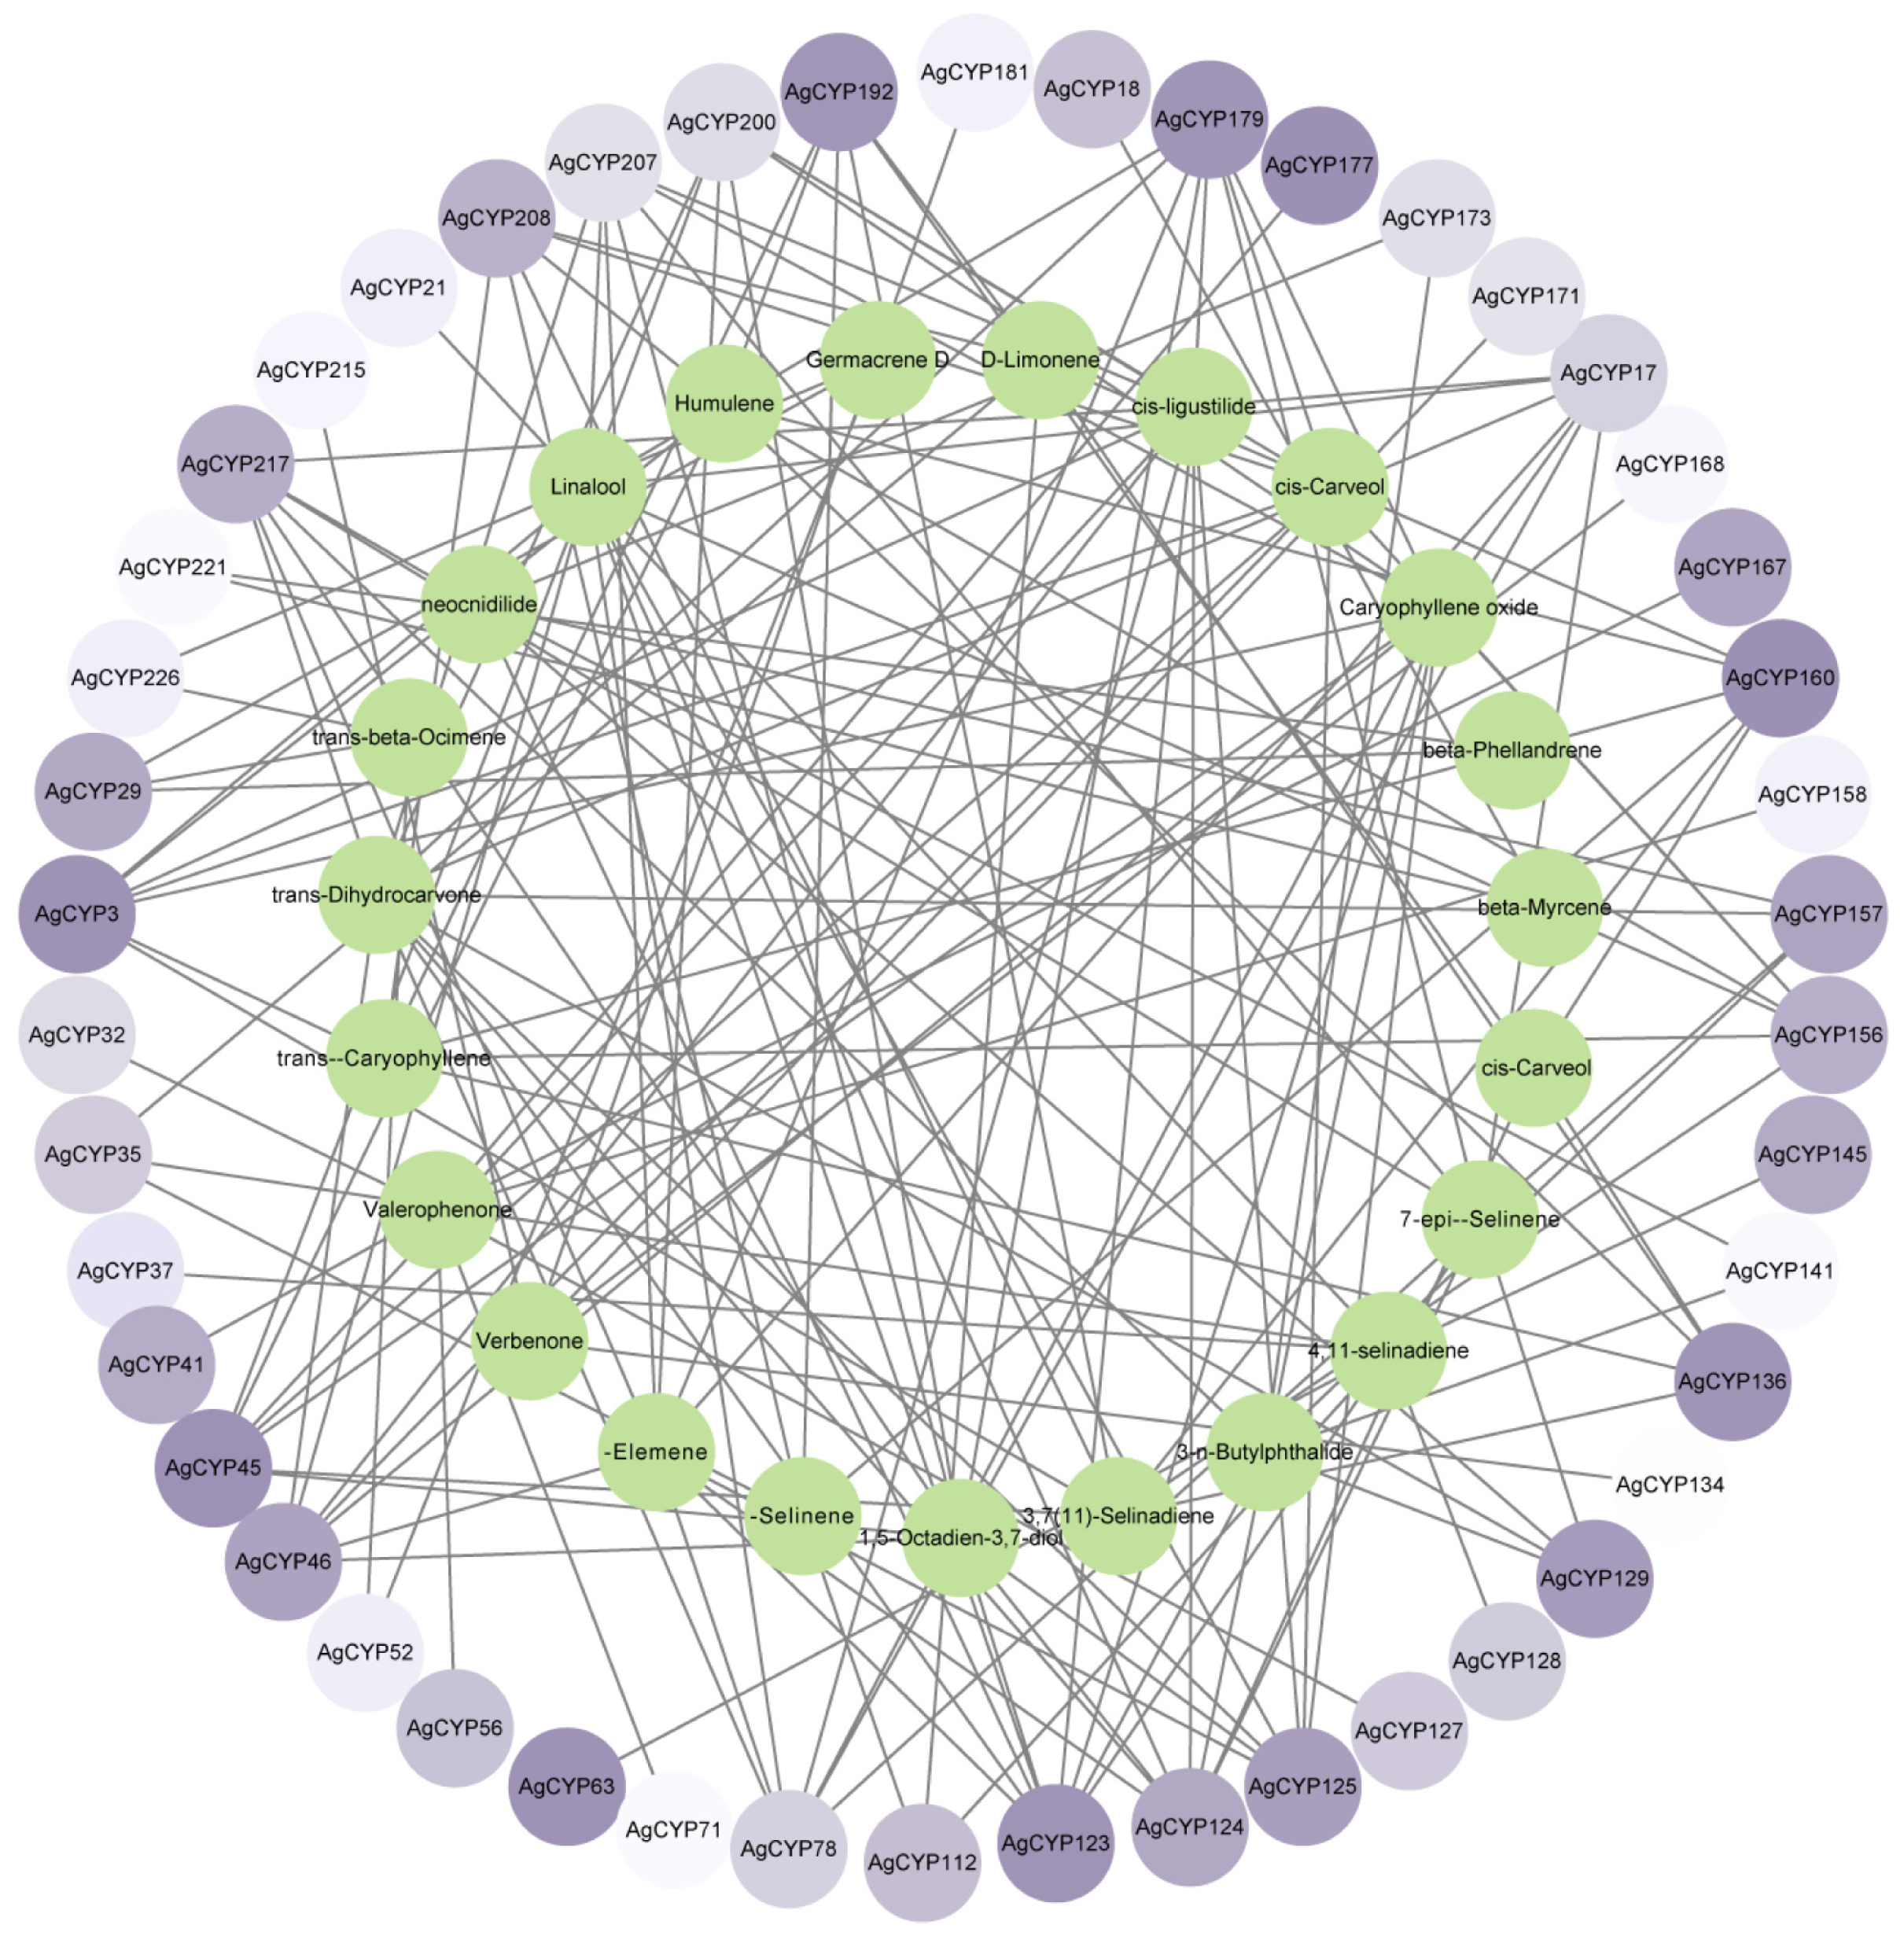
A co-expression analysis was conducted to clarify the potential roles of AgCYPs in seed development by analyzing the transcript levels of AgCYPs in relation to the differently accumulated metabolites. AgCYP genes exhibited strong correlation coefficient values with metabolites, which were presented and visualized by Cystoscope (Figure 7). The network consisted of peripheral nodes (purple) representing 40 differentially expressed AgCYP members, and central nodes (green) representing 22 differentially accumulated metabolites, including monoterpenes, sesquiterpenes, and phthalides, which are well-recognized constituents responsible for the characteristic aroma and bioactivity of celery. Multiple metabolites were correlated with more than one AgCYP member, suggesting complex potential associations between AgCYPs and metabolite accumulation during seed development. Several AgCYPs, including AgCYP3, AgCYP18, AgCYP125, AgCYP177, and AgCYP193, exhibited the highest connection with multiple metabolites and may represent putative candidate genes in this procedure.

2.6. Expression Profiles of AgCYPs in Response to Auxin

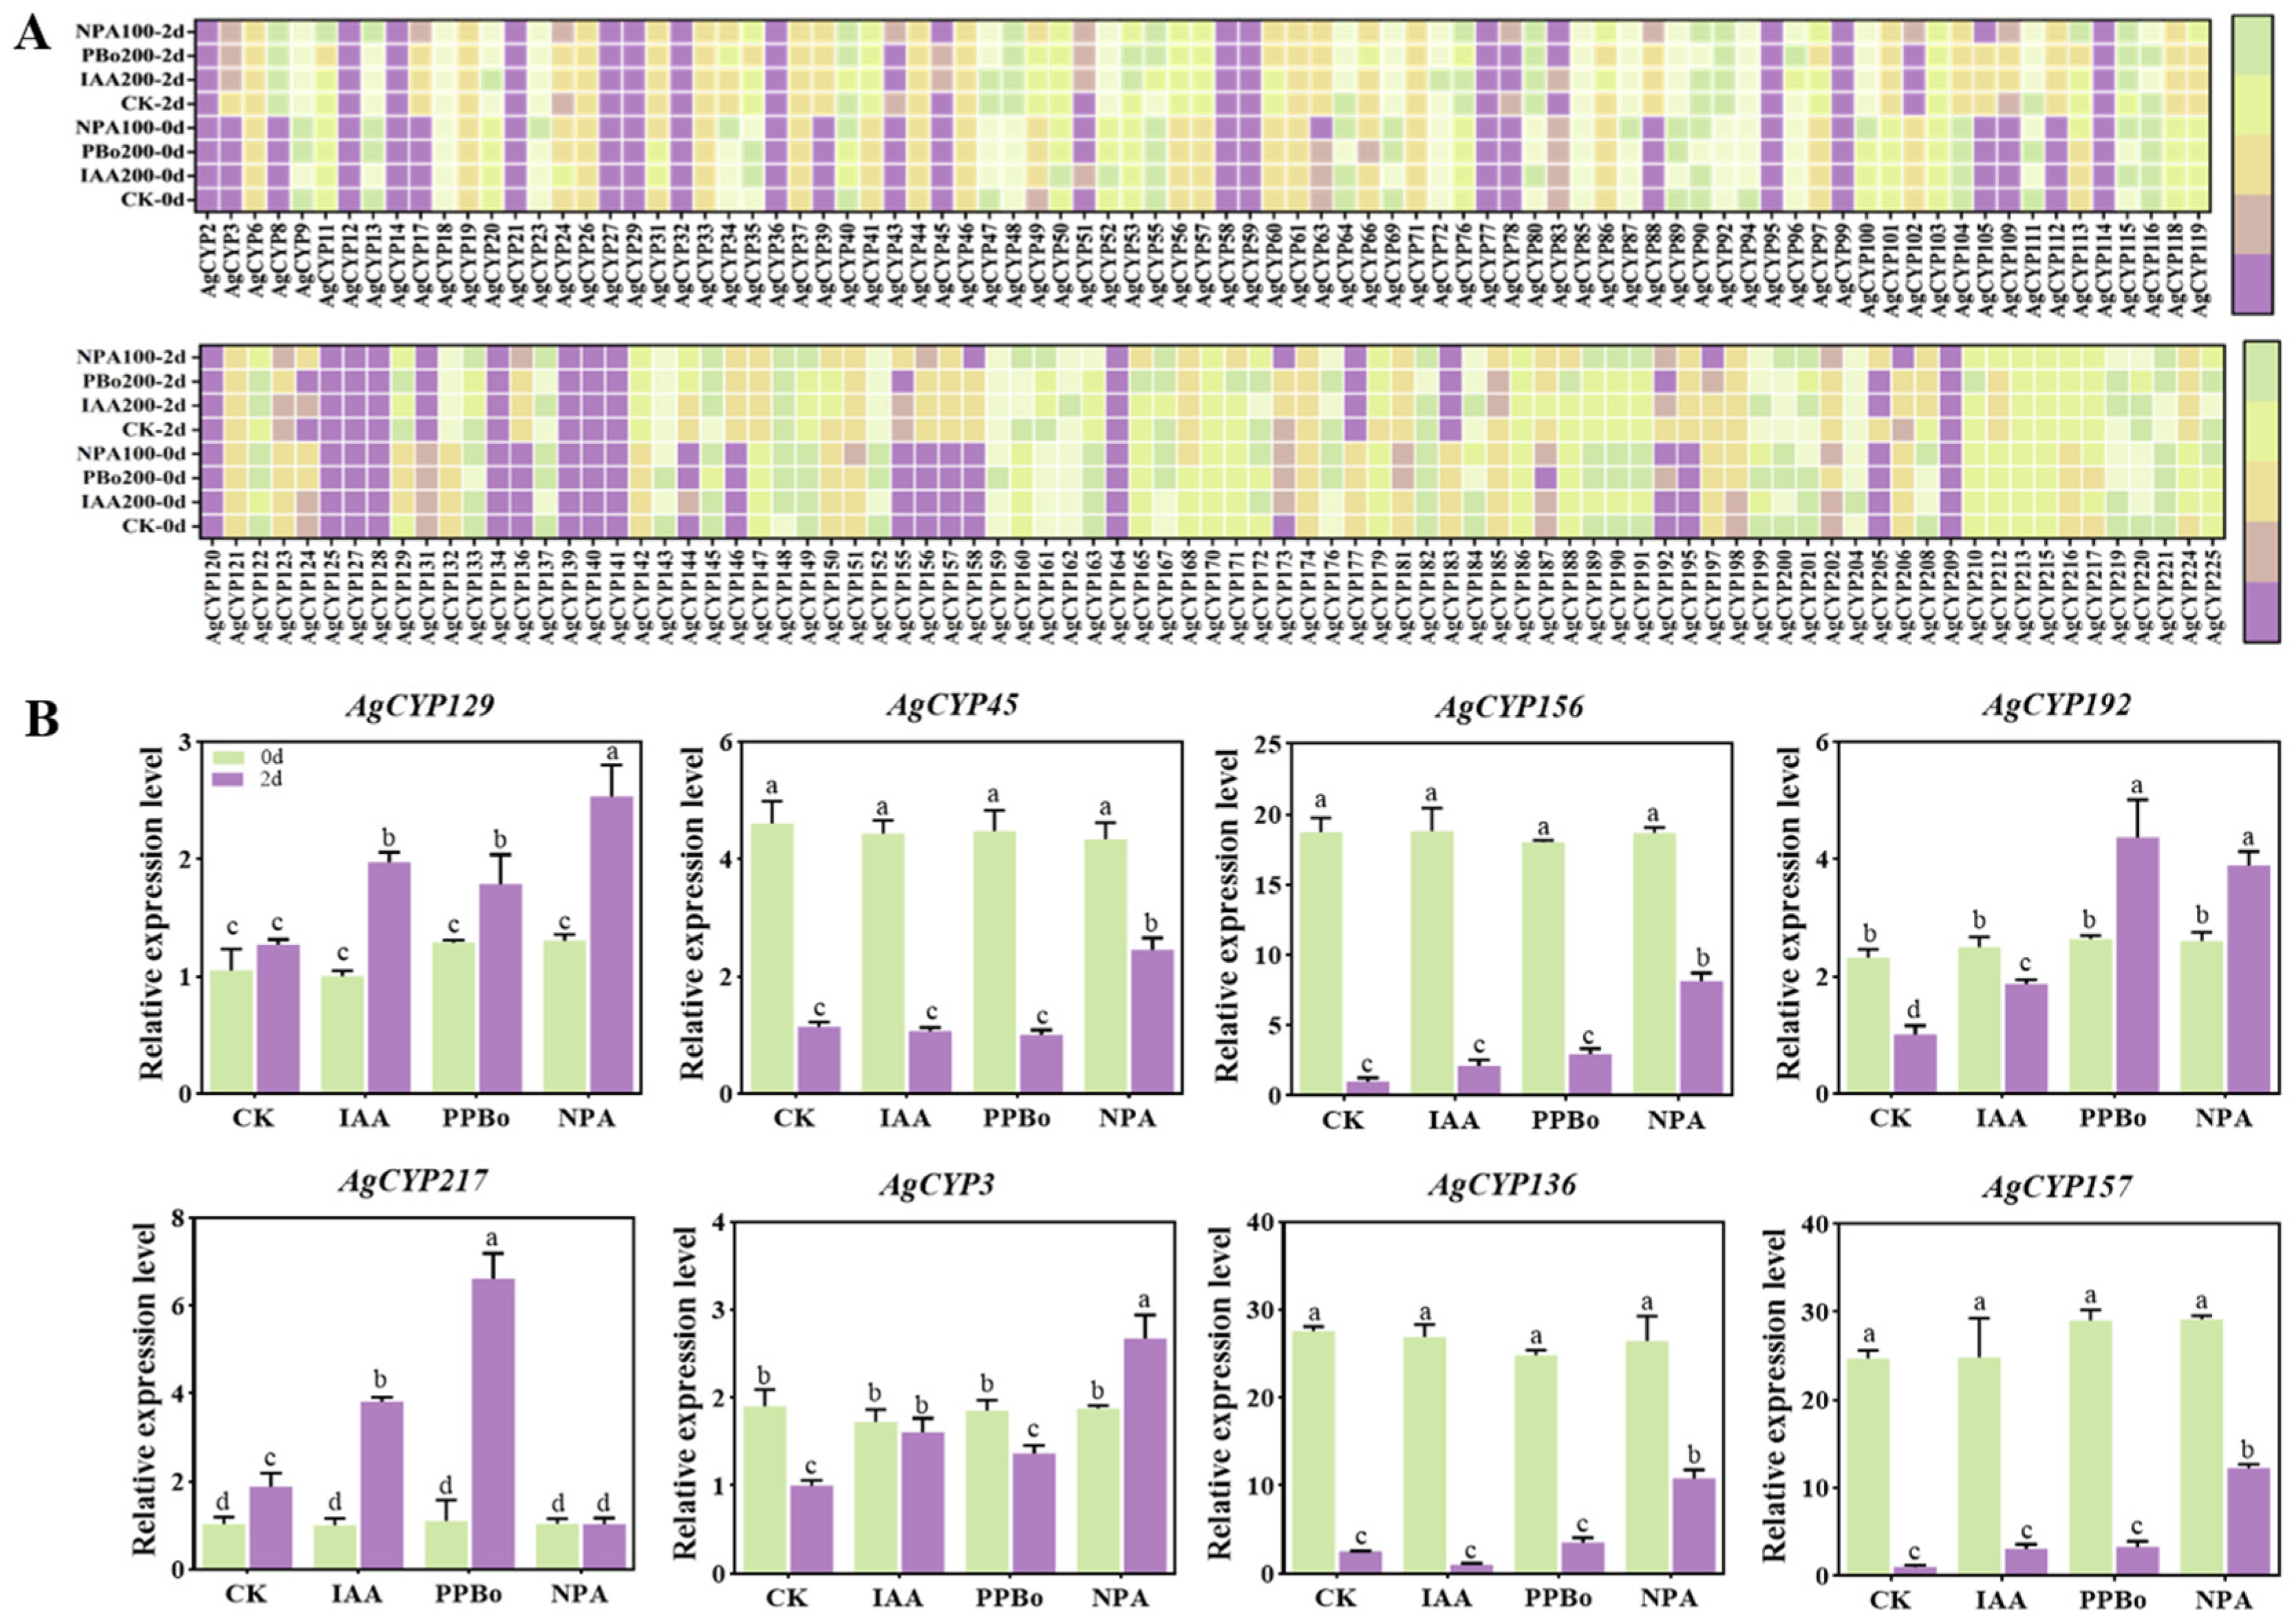
Several AgCYPs containing auxin-responsive cis-elements were examined for their sensitivity to IAA. To investigate the responsiveness of AgCYPs to auxin, celery (45 days post-cultivation) was treated with ddH2O (CK), 200 μM indole-3-acetic acid (IAA), 200 μM p-phenoxyphenyl boronic acid (PPBo) as an auxin biosynthesis inhibitor, and 100 μM N-1-naphthylphthalamic acid (NPA) as an auxin polar transport inhibitor. As illustrated in Figure 8A, gene expression levels of the majority of AgCYPs were modified between 0d and 2d. Some AgCYPs, such as AgCYP14, AgCYP45, AgCYP136, AgCYP156, and AgCYP157, displayed decreased transcript abundance under the IAA treatment, whereas some genes, including AgCYP129, AgCYP140, and AgCYP192, exhibited elevated expression levels. Moreover, several AgCYPs (e.g., AgCYP140, AgCYP145, AgCYP156, AgCYP217) were significantly induced by the PPBo treatment. A group of AgCYP genes (e.g., AgCYP3, AgCYP129, AgCYP141, AgCYP192, and AgCYP224) was also induced by the NPA treatment. Those results indicate distinct responses of AgCYPs to auxin in celery.
To further investigate the potential functions of AgCYPs, genes strongly correlated with celery-characteristic metabolites were first screened. Subsequently, AgCYPs showing significant differential expression during celery seed development and responsiveness to auxin treatment were selected as candidate genes. After analysis, eight candidate AgCYPs, including AgCYP3, AgCYP45, AgCYP129, AgCYP136, AgCYP156, AgCYP157, AgCYP192, and AgCYP217 were selected. The transcript abundance of these eight candidate genes was subsequently validated by RT-qPCR (Figure 8B). The qRT-PCR results showed that all candidate genes were modulated by exogenous IAA or inhibitor application, which was highly in agreement with the transcriptomic data.

2.7. Tissue-Specific Expression, Subcellular Localization Prediction, and Protein–Protein Interaction Network Analysis of the Candidate AgCYP Genes

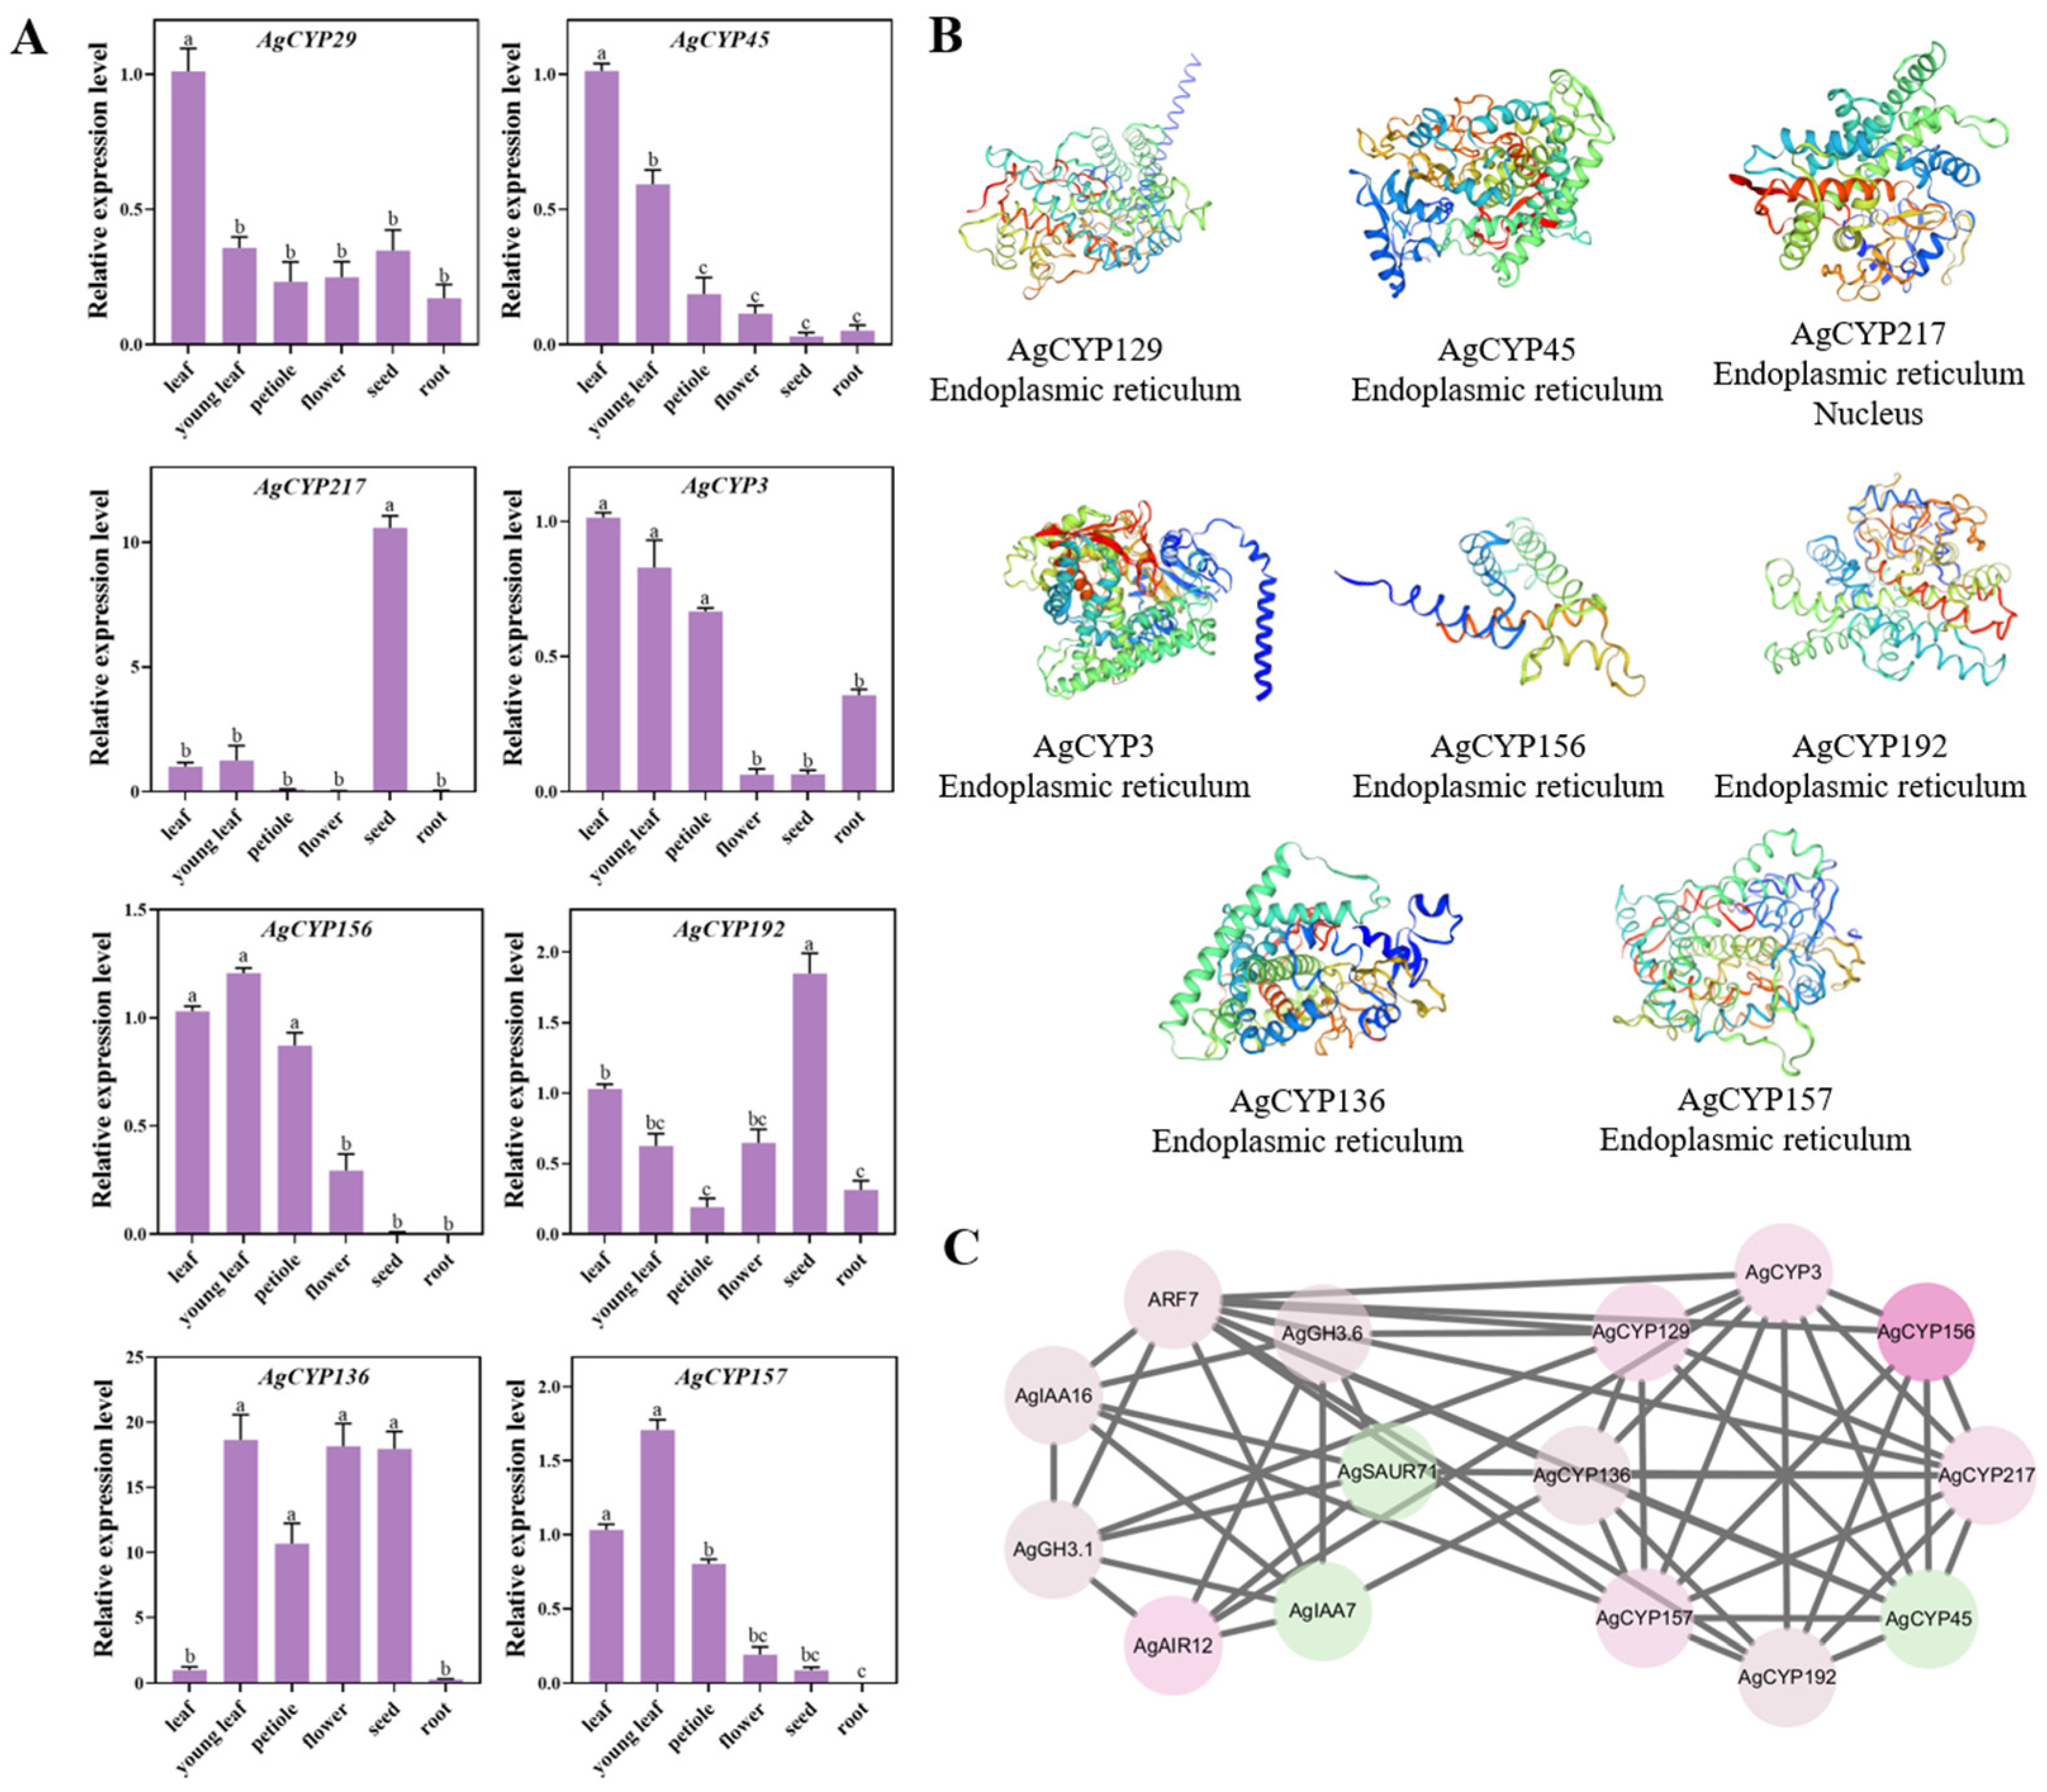
To investigate the tissue-specific expression patterns of the eight candidate genes, their transcriptional levels were measured by RT-qPCR across six celery tissues (Figure 9A). The results revealed that the eight AgCYPs exhibited distinct expression patterns. AgCYP29, AgCYP45, AgCYP3, and AgCYP157 displayed higher expression in leaves. AgCYP156 exhibited similar expression levels in leaves and petioles, but was barely detectable in seeds and roots. The transcriptional levels of AgCYP217 and AgCYP192 were higher in seeds. These tissue-specific expression patterns suggest that the candidate AgCYPs may participate in different biological processes in celery.
The subcellular localization was predicted subsequently by the Cell-PLoc 2.0, and their three-dimensional structures were modeled by the AlphaFold2 platform (Figure 9B). The results revealed that all AgCYP proteins were predicted to localize to the endoplasmic reticulum, which is in agreement with the subcellular distribution of plant cytochrome P450 monooxygenases. In particular, AgCYP217 was predicted to localize to both the endoplasmic reticulum and the nucleus. In addition, all eight proteins exhibited the typical cytochrome P450 fold, characterized by a conserved α-helical core flanked by β-sheets, further substantiating their belonging to the CYP450 superfamily and supporting their potential capacity for P450-mediated catalysis.
To further explore the connections between the candidate AgCYPs and auxin, a PPI analysis was performed using the STRING database based on orthologous interactions from Arabidopsis thaliana. Only those auxin-related proteins that exhibited direct interactions with the eight AgCYPs were selected and visualized by Cytoscape (Figure 9C). This network revealed predicted interactions between the eight AgCYPs and seven key auxin signaling proteins, including the auxin response factor AgARF7, the Aux/IAA family members AgIAA7 and AgIAA16, the GH3 family auxin-conjugating enzymes AgGH3.1 and AgGH3.6, the SAUR (Small Auxin-Up RNA) family member AgSAUR71, and AgAIR12 (Auxin-Induced in Root cultures 12). These results further strengthen our hypothesis that the candidate AgCYPs may play roles in auxin-related pathways in celery.

3. Discussion

CYPs constitute one of the largest enzyme superfamilies and play vital roles in plant growth and development [5]. This study identified 227 AgCYPs at the genome-wide level in celery, which is comparable to the numbers reported in other angiosperm genomes: 245 in Arabidopsis thaliana [10], 326 in Oryza sativa [9], 236 in Vitis vinifera [4], 371 in Chrysanthemum indicum [27], and 142 in Nicotiana tabacum [28]. Phylogenetic analysis classified the 227 AgCYPs into six clades, among which Clade VI (89 members) and Clade V (46 members) represented the largest groups, while Clade IV contained only six members. This irregular distribution is consistent with the pattern observed in other plant CYP families [29]. The conserved motif and domain analysis further indicated that the majority of AgCYP proteins shared a similar motif arrangement and cytochrome P450 superfamily domain, reflecting their common evolutionary origin and conserved catalytic mechanism. However, some additional non-P450 domains were also detected, suggesting that some AgCYPs may have acquired extra regulatory or catalytic properties, thereby contributing to the functional diversification [30]. Gene duplication is considered one of the primary factors contributing to the functional diversification and expansion of plant gene families [31]. In this study, the 227 AgCYPs were irregularly distributed across all 11 celery chromosomes. enrichment on Chr04 and Chr06 and relatively few members on Chr01 and Chr11. This non-random arrangement pattern has also been reported in the CYP superfamilies of many species, including grapevine, tobacco, and chrysanthemum [4,27,28].
Moreover, synteny analysis further revealed a closer evolutionary relationship between celery and carrot than between celery and Arabidopsis, consistent with their taxonomic classification. As most of the gene copies produced by the Apiaceae and Apiales wide whole-genome duplications were subsequently eliminated, only a small proportion of these ancestral duplicates can still be detected today. Colinear gene loss in celery averaged 47.78%, 50.09%, and 69.95% when carrot, coriander, and grape were each used as the reference genome, underscoring substantial fractionation and persistent instability within the celery genome long after divergence from related Apiaceae [32,33]. This pattern is consistent with the relatively small number of AgCYP duplicate pairs that remain identifiable as syntenic blocks in the present study. Furthermore, Carrot is known to have undergone two independent rounds of polyploidization [34]. The conserved synteny we observe between celery Chr10/11 and the corresponding carrot chromosomes, therefore, plausibly reflects shared retention rather than an independent, celery-restricted rearrangement.
The cis-regulatory elements of AgCYP promoters further support the functional versatility of this gene family. Eight functional categories of cis-elements were detected using the PlantCARE database, among which light-responsive, phytohormone-responsive, and stress-responsive elements were abundant, which corresponds to the previous studies [21,32,35]. Moreover, several AgCYPs, including AgCYP47, AgCYP148, AgCYP199, and AgCYP221, exhibited an increased number of cis-elements, implying that these genes may be involved in complex transcriptional regulation and may serve as key regulatory nodes that integrate developmental, hormonal, and environmental signals in celery.
CYP plays an essential role in seed development [36,37]. In celery, transcriptome analysis revealed the stage-specific expression patterns observed for many AgCYPs, further suggesting their potential involvement in distinct developmental processes during seed maturation, including maintaining cellular homeostasis, formation of the seed coat, and biosynthesis and deposition of storage compounds such as lipids or secondary metabolites. Previous studies in various species have demonstrated their functional significance. In wheat, TaCYP78A3 encodes a cytochrome P450 enzyme specifically expressed in reproductive tissues and regulates seed size by controlling integument cell proliferation during ovule and seed development, providing a clear molecular mechanism linking CYP gene activity to seed development [38]. Beyond this, the CYP78A subfamily has been shown to regulate grain size in rice through a CYP78A–SMG4–COPII pathway [39]. A comparable regulatory role appears to be conserved across multiple plant species, as exemplified by CYP78A98, which controls seed size in Jatropha [40]. P450-encoded genes have been implicated in promoting seed maturation traits in E. ferox, including size, color, hardness, and accumulation of medicinal components [41]. PaCYP78A9 has similarly been reported to play a pivotal role in regulating fruit size in sweet cherry [42]. However, further biochemical and genetic validation will be required to confirm the functional roles of AgCYPs.
The CYP450 superfamily is widely recognized as a key catalyst in the biosynthetic pathways of terpenoids, phenylpropanoids, alkaloids, and phthalides [33]. In celery, the co-expression network identified potential correlations between AgCYPs and key characteristic metabolites, particularly phthalides and terpenes. Ligustilide and 3-n-butylphthalide are signature phthalide compounds that contribute to the unique aroma and pharmacological properties of celery, including anti-inflammatory, neuroprotective, and antihypertensive activities [43,44]. Recent studies have made important advancements in phthalide metabolism. In Angelica sinensis, multiple CYP members have been identified and confirmed to participate in phthalide accumulation [45]. In Ligusticum chuanxiong, the functions of two CYP enzymes, LcCYP72A1132 and LcCYP716E110, were proven in catalyzing the production of butylphthalide and its analogs [46]. The correlation of AgCYPs with phthalides in celery suggests that the AgCYP superfamily may similarly participate in the oxidative tailoring steps of phthalide biosynthesis in celery. Terpenes are major contributors to celery essential oil, and their abundance was strongly correlated with multiple AgCYP members in our co-expression analysis. This is consistent with the established roles of CYP71 and CYP76 family members in terpenoid biosynthesis in other plant species [47]. For instance, 7-hydroxy limonene and three of the four allylic carbons in the olefin monoterpene were oxidized by CYP71D174 in Perilla frutescens [48]. P450-catalyzed dihydroxylation of 5-epi-aristolochene to capsidol [49]. The enzyme activity responsible for the C-6 hydroxylation of (+)-limonene to (+)-trans-carveol in caraway may be a cytochrome P450-dependent reaction [50]. CYP97A3 regulates the accumulation levels of α-carotene and total carotenoids in orange carrot roots by controlling the hydroxylation-mediated degradation of α-carotene and by mediating the negative feedback exerted by carotenoid metabolites on phytoene synthase protein levels [51]. These studies collectively demonstrated the catalytic functions of CYP450 enzymes in terpenoid alteration across diverse plants.
Beyond developmental processes, the differential responses of AgCYPs to exogenous IAA and auxin inhibitors, together with their predicted interactions with auxin-signaling components, suggest potential roles for AgCYPs in auxin-mediated regulatory pathways. Previous studies have explored the function of the CYP family in auxin signaling. CYP79B2 and CYP79B3 catalyzed the transformation of tryptophan to the important intermediate IAOx in auxin biosynthesis [52]. CYP87A3 in rice was immediately and transiently induced upon treatment with IAA [53]. Because the auxin efflux carrier PIN1 was distributed abnormally in the cyp77a4 embryos, the auxin response pattern was significantly disrupted [37]. The various effects of NPA and PPBo on AgCYPs indicate that auxin biosynthesis and transport functions via partial regulation of AgCYPs.
The integrated phylogenetic, conserved motif and domain, cis-regulatory, and expression analysis collectively suggest potential roles for AgCYPs in celery seed development and auxin signaling. This study will not only enhance the understanding of the molecular mechanisms of celery development and germination but also provide valuable molecular targets and genetic resources for the molecular breeding of celery.

4. Materials and Methods

4.1. Identification of the AgCYP Gene Family and Phylogenetic Tree Construction

To identify the CYP450 gene family in celery, full protein sequences of all Arabidopsis thaliana CYP450 members were retrieved from the Cytochrome P450 Homepage (http://drnelson.uthsc.edu/plants/, accessed on 20 June 2026). A local BLASTP search (E-value ≤ 1 × 10⁻¹⁰, identity > 75%, query coverage > 70%) was performed using the 227 known AtCYPs as a query to identify AgCYPs in the celery genome (http://tvir.bio2db.com/index.html, accessed on 20 June 2026). Moreover, the Hidden Markov Model (HMM) profile for the P450 domain (PF00067) in celery protein sequences was acquired from the Pfam database (http://pfam.xfam.org/, accessed on 20 June 2026) and employed in hmmsearch with an e-value cut-off of 0.01. The presence of a cytochrome P450 domain was double-validated in all candidate sequences using the Pfam and NCBI Conserved Domain Database (CDD; https://www.ncbi.nlm.nih.gov/Structure/cdd/wrpsb.cgi, accessed on 20 June 2026). The AgCYP and AtCYP protein sequences were subjected to multiple sequence alignment with ClustalW. A phylogenetic tree was established in MEGA7.0 using the Neighbor-Joining (NJ) method based on the p-distance model, with pairwise deletion applied for gaps and missing data. Branch support was assessed using 1000 bootstrap replicates [54]. The constructed tree was subsequently imported into iTOL (Interactive Tree of Life) (https://itol.embl.de/, accessed on 20 June 2026) for annotation and color-coded subfamily classification.

4.2. Conserved Motif, Gene Structure, Chromosomal Localization, and Cis-Acting Element Analysis

The conserved motifs of AgCYP proteins were analyzed by MEME suite (http://meme-suite.org/, accessed on 20 June 2026). Conserved domains were retrieved from NCBI-CDD. Exon–intron architectures were reconstructed using the TBtools (v2.481) gene structure visualization program [55]. Additionally, a 2000 bp upstream sequence for each AgCYP gene from the start codon was extracted from the celery reference genome and regarded as its putative promoter. The promoter sequences were subsequently individually submitted to the PlantCARE database (https://bioinformatics.psb.ugent.be/webtools/plantcare/html/, accessed on 20 June 2026) to identify the cis-regulatory elements. The physical positions of AgCYP genes on celery chromosomes were determined based on coordinate information extracted from the celery genome annotation file (GFF3 format) retrieved from TVIR. Chromosomal distribution maps were subsequently constructed and rendered using TBtools.

4.3. Synteny and Duplication Analysis

To investigate the synteny and gene duplication events within the celery genome, synteny analysis was performed and visualized using TBtools. To assess the selective pressures acting on duplicated gene pairs, Ka/Ks was calculated by TBtools. The evolutionary relationships of CYP in celery with other plant species were performed by interspecies synteny analysis, which was conducted between Apium graveolens and two representative species, Daucus carota (family Apiaceae) and Arabidopsis thaliana (family Brassicaceae), by TBtools. Protein sequences of the two species were retrieved from carrot (http://tvir.bio2db.com/index.html, accessed on 20 June 2026) and Arabidopsis (https://www.ncbi.nlm.nih.gov/datasets/taxonomy/3701/, accessed on 20 June 2026) genome databases.

4.4. Expression Pattern, RT-qPCR, and Correlation Analysis of AgCYP Genes

Transcriptional analysis of AgCYPs and metabolite accumulations during celery seed development was conducted based on the transcriptome and metabolome data reported by Yan et al. (2021) [56]. Pearson correlation coefficients (r) were calculated between AgCYP expression levels and metabolite contents using SPSS Statistics 20.0. Significantly correlated AgCYP–metabolite pairs (|r| ≥ 0.6, p < 0.05) were used to construct interaction networks, which were visualized using Cytoscape (v3.5.1). All experiments were conducted with three independent biological replicates.
To examine the expression patterns of AgCYP genes, ‘Shenqin No. 4’ (Apium graveolens L.) at commercial maturity (45 days of cultivation) was selected as the experimental material. Celeries were treated with ddH2O (CK), 200 μM of IAA (Aladdin, Shanghai, China), 200 μM of PPBo (Aladdin, Shanghai, China), and 100 μM of NPA (Aladdin, Shanghai, China). 100 mL of each treatment was applied to each plant. Samples were subsequently sealed in plastic bags and stored at 20 °C and 80% relative humidity for 2 days. Total RNA was extracted from samples collected at 0 and 2 days after treatment and subjected to transcriptome analysis. Library construction, RNA sequencing, and preliminary data processing were performed by OE Biotech Co., Ltd. (Shanghai, China).
To further validate the transcriptome results and analyze the tissue-specific expression patterns of the eight AgCYPs, total RNA was extracted from ‘Shenqin No.4’ using the FastPure Plant Total RNA Isolation Kit (Vazyme, Nanjing, China) according to the manufacturer’s instructions. First-strand cDNA was synthesized from 1 μg of total RNA using HiScript III RT SuperMix for qPCR (+gDNA wiper) (Vazyme, Nanjing, China). RT-qPCR was performed on a Bio-Rad IQ5 Real-Time System (Bio-Rad, Hercules, CA, USA) using SupRealQ Ultra Hunter SYBR qPCR Master Mix (Vazyme, Nanjing, China). Primers were designed using NCBI primers and listed in Table S2. Relative expression levels were calculated using the 2−ΔΔCT method. All experiments were performed in three independent biological replicates.

4.5. Subcellular Localization Prediction and PPI Network Analysis

The subcellular localization of the AgCYP proteins was predicted using the Cell-PLoc 2.0 web server (http://www.csbio.sjtu.edu.cn/bioinf/Cell-PLoc-2/, accessed on 20 June 2026). The three-dimensional (3D) protein structures of the eight AgCYPs were modeled using the AlphaFold2 platform (https://alphafold.ebi.ac.uk/, accessed on 20 June 2026). PPI network analysis of the eight candidate AgCYPs was performed using the STRING database (https://string-db.org/, accessed on 20 June 2026) with Arabidopsis thaliana as the reference organism based on orthologous protein mapping. Only auxin-related proteins that exhibited direct interactions with the eight AgCYPs were selected and retained for network construction. This network was visualized using Cytoscape (v3.5.1).

4.6. Statistical Analysis

Statistical differences among treatment groups were assessed by one-way ANOVA followed by Tukey’s HSD post hoc test (p < 0.05) in SPSS Statistics 20.0. Results are reported as mean ± standard deviation (SD). Heatmaps depicting expression patterns were generated by Origin2021.

5. Conclusions

In conclusion, this study performed the first systematic genome-wide identification of the celery CYP superfamily, identifying 227 AgCYPs categorized into six phylogenetic clades. These genes are non-randomly distributed across the celery genome. Integrated analysis of conserved motifs, domains, and cis-acting elements confirms that the AgCYP gene family maintains high structural conservation. Their expression patterns and correlation analysis further suggest the potential roles of AgCYPs in celery seed development, metabolites, and the IAA homeostasis. Further studies will focus on the gene function analysis and the regulatory mechanism of specific AgCYPs to confirm their putative functions in celery seeds. This work deepens our understanding of the molecular mechanisms of celery development and germination, and provides precious molecular targets and genetic resources for breeding.

Supplementary Materials

The following supporting information can be downloaded at: https://www.mdpi.com/article/10.3390/agronomy16131271/s1. Figure S1: Exon–intron architectures of AgCYPs. Figure S2: Cis-acting elements in the promoter regions of AgCYP genes; Table S1: CYP gene superfamily in celery. Table S2: The list of primers for qRT-PCR analysis.

Author Contributions

Conceptualization, Q.Q., W.Z., and J.Y.; Data curation, Q.Q.; Resources, Z.H., S.R., and D.G.; validation, Q.Q., Z.H., A.X., G.T., L.P., and H.M.; formal analysis, Q.Q.; writing—original draft, Q.Q.; writing—review and editing, W.Z., and J.Y.; supervision, J.Y.; project administration, W.Z.; funding acquisition, W.Z., and J.Y. All authors have read and agreed to the published version of the manuscript.

Funding

This research received funding from the Shanghai Agricultural Science and Technology Innovation Program (Grant No. K2023-02-08-00-12-F04620) and the Excellent Team Project (Nongkezhuo 2025(028)).

Data Availability Statement

All relevant data are within the manuscript and its Supplementary Files.

Conflicts of Interest

Authors Sucheng Ren and Daguo Gu are employed by the Shanghai Xinghui Vegetable Co., Ltd. The remaining authors declare that the research was conducted in the absence of any commercial or financial relationships that could be construed as a potential conflict of interest.

References

  1. Liu, X.; Gong, Q.; Zhao, C.; Wang, D.; Ye, X.; Zheng, G.; Wang, Y.; Cao, J.; Sun, C. Genome-wide analysis of cytochrome P450 genes in Citrus clementina and characterization of a CYP gene encoding flavonoid 3′-hydroxylase. Hortic. Res. 2023, 10, uhac283. [Google Scholar] [PubMed]
  2. Danielson, P.á. The cytochrome P450 superfamily: Biochemistry, evolution and drug metabolism in humans. Curr. Drug Metab. 2002, 3, 561–597. [Google Scholar] [CrossRef] [Scilit] [PubMed]
  3. Nelson, D.R. The cytochrome p450 homepage. Hum. Genom. 2009, 4, 59. [Google Scholar] [CrossRef] [Scilit]
  4. Jiu, S.; Xu, Y.; Wang, J.; Wang, L.; Liu, X.; Sun, W.; Sabir, I.A.; Ma, C.; Xu, W.; Wang, S.; et al. The Cytochrome P450 Monooxygenase Inventory of Grapevine (Vitis vinifera L.): Genome-Wide Identification, Evolutionary Characterization and Expression Analysis. Front. Genet. 2020, 11, 44. [Google Scholar] [CrossRef] [Scilit] [PubMed]
  5. Werck-Reichhart, D. Cytochromes P450 in phenylpropanoid metabolism. Drug Metab. Drug Interact. 1995, 12, 221–244. [Google Scholar] [CrossRef] [Scilit]
  6. Ghosh, S. Triterpene structural diversification by plant cytochrome P450 enzymes. Front. Plant Sci. 2017, 8, 1886. [Google Scholar] [CrossRef] [Scilit] [PubMed]
  7. Chen, L.; Zhao, Y.; He, S.; Lei, J.; Li, H.; Liu, Z.; Zhang, L.; Yang, L.; Deng, K.; Wan, R.; et al. Cytochrome P450 gene family: Cross-pathway functional conservation, novel catalytic reactions, and synthetic biology-driven applications in plant secondary metabolism. Front. Plant Sci. 2026, 17, 1765290. [Google Scholar] [CrossRef] [Scilit] [PubMed]
  8. Kumar, M.S.; Babu, P.R.; Rao, K.V.; Reddy, V.D. Organization and classification of cytochrome P450 genes in castor (Ricinus communis L.). Proc. Natl. Acad. Sci. India Sect. B Biol. Sci. 2014, 84, 131–143. [Google Scholar]
  9. Wei, K.; Chen, H. Global identification, structural analysis and expression characterization of cytochrome P450 monooxygenase superfamily in rice. BMC Genom. 2018, 19, 35. [Google Scholar] [CrossRef] [Scilit]
  10. Paquette, S.M.; Bak, S.; Feyereisen, R. Intron–exon organization and phylogeny in a large superfamily, the paralogous cytochrome P450 genes of Arab. thaliana. DNA Cell Biol. 2000, 19, 307–317. [Google Scholar] [CrossRef] [Scilit] [PubMed]
  11. Durst, F.; Nelson, D.R. Diversity and evolution of plant P450 and P450-reductases. Drug Metab. Drug Interact. 1995, 12, 189–206. [Google Scholar] [CrossRef] [Scilit]
  12. Nelson, D.R.; Schuler, M.A.; Paquette, S.M.; Werck-Reichhart, D.; Bak, S. Comparative genomics of rice and Arabidopsis. Analysis of 727 cytochrome P450 genes and pseudogenes from a monocot and a dicot. Plant Physiol. 2004, 135, 756–772. [Google Scholar] [CrossRef] [Scilit] [PubMed]
  13. Nelson, D.R.; Koymans, L.; Kamataki, T.; Stegeman, J.J.; Feyereisen, R.; Waxman, D.J.; Waterman, M.R.; Gotoh, O.; Coon, M.J.; Estabrook, R.W. P450 superfamily: Update on new sequences, gene mapping, accession numbers and nomenclature. Pharmacogenet. Genom. 1996, 6, 1–42. [Google Scholar] [CrossRef] [Scilit]
  14. Carroll, E.; Gopal, B.R.; Raghavan, I.; Mukherjee, M.; Wang, Z.Q. A cytochrome P450 CYP87A4 imparts sterol side-chain cleavage in digoxin biosynthesis. Nat. Commun. 2023, 14, 4042. [Google Scholar] [CrossRef] [Scilit] [PubMed]
  15. Jiang, B.; Gao, L.; Wang, H.; Sun, Y.; Zhang, X.; Ke, H.; Liu, S.; Ma, P.; Liao, Q.; Wang, Y. Characterization and heterologous reconstitution of Taxus biosynthetic enzymes leading to baccatin III. Science 2024, 383, 622–629. [Google Scholar] [CrossRef] [Scilit] [PubMed]
  16. Qiu, S.; Wang, J.; Pei, T.; Gao, R.; Xiang, C.; Chen, J.; Zhang, C.; Xiao, Y.; Li, Q.; Wu, Z. Functional evolution and diversification of CYP82D subfamily members have shaped flavonoid diversification in the genus Scutellaria. Plant Commun. 2025, 6, 101134. [Google Scholar] [CrossRef] [Scilit] [PubMed]
  17. Wang, Y.J.; Huang, J.P.; Tian, T.; Yan, Y.; Chen, Y.; Yang, J.; Chen, J.; Gu, Y.C.; Huang, S.X. Discovery and engineering of the cocaine biosynthetic pathway. J. Am. Chem. Soc. 2022, 144, 22000–22007. [Google Scholar] [CrossRef] [Scilit] [PubMed]
  18. Liao, Y.; Wu, M.; Fan, J.; Wan, J.; An, X.; Li, X.; Wei, Y.; Ouyang, Z. Mining and characterization of a novel cytochrome P450 MaCYP71BG22 involved in the C4-stereoselective hydroxylation of 1-deoxynojirimycin biosynthesis in mulberry leaves. Int. J. Biol. Macromol. 2024, 282, 136941. [Google Scholar] [PubMed]
  19. Liu, B.; Song, Z.; Qi, X. Plant cytochrome P450 enzymes for bioactive metabolites biosynthesis, growth regulation, and stress adaptation. Plant Physiol. 2025, 199, kiaf297. [Google Scholar] [CrossRef] [Scilit] [PubMed]
  20. Sun, C.; Liu, Y.; Li, G.; Chen, Y.; Li, M.; Yang, R.; Qin, Y.; Chen, Y.; Cheng, J.; Tang, J. ZmCYP90D1 regulates maize internode development by modulating brassinosteroid-mediated cell division and growth. Crop J. 2024, 12, 58–67. [Google Scholar] [CrossRef] [Scilit]
  21. He, J.; Chen, Q.; Xin, P.; Yuan, J.; Ma, Y.; Wang, X.; Xu, M.; Chu, J.; Peters, R.; Wang, G. CYP72A enzymes catalyse 13-hydrolyzation of gibberellins. Nat. Plants 2019, 5, 1057–1065. [Google Scholar] [CrossRef] [Scilit] [PubMed]
  22. Cui, Y.; Peng, Y.; Zhang, Q.; Xia, S.; Ruan, B.; Xu, Q.; Yu, X.; Zhou, T.; Liu, H.; Zeng, D. Disruption of EARLY LESION LEAF 1, encoding a cytochrome P450 monooxygenase, induces ROS accumulation and cell death in rice. Plant J. 2021, 105, 942–956. [Google Scholar] [PubMed]
  23. Li, C.; Haider, I.; Wang, J.Y.; Quinodoz, P.; Duran, H.G.S.; Méndez, L.R.; Horber, R.; Fiorilli, V.; Votta, C.; Lanfranco, L. OsCYP706C2 diverts rice strigolactone biosynthesis to a noncanonical pathway branch. Sci. Adv. 2024, 10, eadq3942. [Google Scholar] [CrossRef] [Scilit] [PubMed]
  24. Uffelmann, E.; Huang, Q.Q.; Munung, N.S.; de Vries, J.; Okada, Y.; Martin, A.R.; Martin, H.C.; Lappalainen, T.; Posthuma, D. Genome-wide association studies. Nat. Rev. Methods Primers 2021, 1, 59. [Google Scholar] [CrossRef] [Scilit]
  25. Sun, S.; Li, Y.; Jia, L.; Ye, S.; Luan, Y. Identification of genetic variants controlling diosgenin content in Dioscorea zingiberensis tuber by genome-wide association study. BMC Plant Biol. 2024, 24, 540. [Google Scholar] [CrossRef] [Scilit] [PubMed]
  26. Saint-Vincent, P.M.B.; Furches, A.; Galanie, S.; Prates, E.T.; Aldridge, J.L.; Labbe, A.; Zhao, N.; Martin, M.Z.; Ranjan, P.; Jones, P.; et al. Validation of a metabolite–GWAS network for Populus trichocarpa family 1 UDP-glycosyltransferases. Front. Plant Sci. 2023, 14, 1210146. [Google Scholar] [CrossRef] [Scilit] [PubMed]
  27. Chen, Y.; Zhou, T.; Zhong, J.; Xu, Y.; Zhang, P.; Yue, X.; Zhang, H.; Sun, M.; Fu, X. Genome-wide identification and expression analyses of CYP450 genes in Chrysanth. indicum. BMC Genom. 2025, 26, 494. [Google Scholar]
  28. Sha, Y.; Yu, S.; Cai, Z.; Zhang, Z.; Song, K.; Yang, L.; Shao, X. Genome-Wide Analysis and Characterization of CYP450 Gene Family in Tobacco (Nicotiana tabacum L). Plant Mol. Biol. Report. 2026, 44, 52. [Google Scholar] [CrossRef] [Scilit]
  29. Hansen, C.C.; Nelson, D.R.; Moller, B.L.; Werck-Reichhart, D. Plant cytochrome P450 plasticity and evolution. Mol. Plant 2021, 14, 1244–1265. [Google Scholar] [CrossRef] [Scilit] [PubMed]
  30. Werck-Reichhart, D. Promiscuity, a driver of plant cytochrome P450 evolution? Biomolecules 2023, 13, 394. [Google Scholar] [CrossRef] [Scilit] [PubMed]
  31. Cannon, S.B.; Mitra, A.; Baumgarten, A.; Young, N.D.; May, G. The roles of segmental and tandem gene duplication in the evolution of large gene families in Arabidopsis thaliana. BMC Plant Biol. 2004, 4, 10. [Google Scholar] [CrossRef] [Scilit] [PubMed]
  32. Li, M.-Y.; Feng, K.; Hou, X.-L.; Jiang, Q.; Xu, Z.-S.; Wang, G.-L.; Liu, J.-X.; Wang, F.; Xiong, A.-S. The genome sequence of celery (Apium graveolens L.), an important leaf vegetable crop rich in apigenin in the Apiaceae family. Hortic. Res. 2020, 7, 9. [Google Scholar] [CrossRef] [Scilit] [PubMed]
  33. Song, X.; Sun, P.; Yuan, J.; Gong, K.; Li, N.; Meng, F.; Zhang, Z.; Li, X.; Hu, J.; Wang, J.; et al. The celery genome sequence reveals sequential paleo-polyploidizations, karyotype evolution and resistance gene reduction in apiales. Plant Biotechnol. J. 2020, 19, 731–744. [Google Scholar] [CrossRef] [Scilit] [PubMed]
  34. Iorizzo, M.; Ellison, S.; Senalik, D.; Zeng, P.; Satapoomin, P.; Huang, J.; Bowman, M.; Iovene, M.; Sanseverino, W.; Cavagnaro, P.; et al. A high-quality carrot genome assembly provides new insights into carotenoid accumulation and asterid genome evolution. Nat. Genet. 2016, 48, 657–666. [Google Scholar] [CrossRef] [Scilit] [PubMed]
  35. Nomura, T.; Bishop, G.J. Cytochrome P450s in plant steroid hormone synthesis and metabolism. Phytochem. Rev. 2006, 5, 421–432. [Google Scholar] [CrossRef] [Scilit]
  36. Xiang, F.; Liu, W.-C.; Liu, X.; Song, Y.; Zhang, Y.; Zhu, X.; Wang, P.; Guo, S.; Song, C.-P. Direct balancing of lipid mobilization and reactive oxygen species production by the epoxidation of fatty acid catalyzed by a cytochrome P450 protein during seed germination. New Phytol. 2023, 237, 2104–2117. [Google Scholar] [PubMed]
  37. Kawade, K.; Li, Y.; Koga, H.; Sawada, Y.; Okamoto, M.; Kuwahara, A.; Tsukaya, H.; Hirai, M.Y. The cytochrome P450 CYP77A4 is involved in auxin-mediated patterning of the Arabidopsis thaliana embryo. Development 2018, 145, dev168369. [Google Scholar] [CrossRef] [Scilit] [PubMed]
  38. Ma, M.; Wang, Q.; Li, Z.; Cheng, H.; Li, Z.; Liu, X.; Song, W.; Appels, R.; Zhao, H. Expression of TaCYP78A3, a gene encoding cytochrome P450 CYP78A3 protein in wheat (Triticum aestivum L.), affects seed size. Plant J. 2015, 83, 312–325. [Google Scholar] [CrossRef] [Scilit] [PubMed]
  39. Zhou, C.; Lin, Q.; Ren, Y.; Lan, J.; Miao, R.; Feng, M.; Wang, X.; Liu, X.; Zhang, S.; Pan, T.; et al. A CYP78As–small grain4–coat protein complex II pathway promotes grain size in rice. Plant Cell 2023, 35, 4325–4346. [Google Scholar] [CrossRef] [Scilit] [PubMed]
  40. Tian, Y.; Zhang, M.; Hu, X.; Wang, L.; Dai, J.; Xu, Y.; Chen, F. Over-expression of CYP78A98, a cytochrome P450 gene from Jatropha curcas L., increases seed size of transgenic tobacco. Electron. J. Biotechnol. 2016, 19, 15–22. [Google Scholar] [CrossRef] [Scilit]
  41. Liu, X.; He, Z.; Yin, Y.; Xu, X.; Wu, W.; Li, L. Transcriptome sequencing and analysis during seed growth and development in Euryale ferox Salisb. BMC Genom. 2018, 19, 343. [Google Scholar] [CrossRef] [Scilit]
  42. Qi, X.; Liu, C.; Song, L.; Li, Y.; Li, M. PaCYP78A9, a Cytochrome P450, Regulates Fruit Size in Sweet Cherry (Prunus avium L.). Front. Plant Sci. 2017, 8, 2076. [Google Scholar] [CrossRef] [Scilit] [PubMed]
  43. Sajjadi, S.; Shokoohinia, Y.; Mehramiri, P. Isolation and characterization of steroids, phthalide and essential oil of the fruits of Kelussia odoratissima Mozaff., an endemic mountain celery. Res. Pharm. Sci. 2013, 8, 35. [Google Scholar] [PubMed]
  44. Li, J.; Li, Y.; Ogle, M.; Zhou, X.; Song, M.; Yu, S.P.; Wei, L. DL-3-n-butylphthalide prevents neuronal cell death after focal cerebral ischemia in mice via the JNK pathway. Brain Res. 2010, 1359, 216–226. [Google Scholar] [CrossRef] [Scilit] [PubMed]
  45. Feng, W.-M.; Liu, P.; Yan, H.; Yu, G.; Zhang, S.; Jiang, S.; Shang, E.-X.; Qian, D.-W.; Duan, J.-A. Investigation of enzymes in the phthalide biosynthetic pathway in Angelica sinensis using integrative metabolite profiles and transcriptome analysis. Front. Plant Sci. 2022, 13, 928760. [Google Scholar] [CrossRef] [Scilit] [PubMed]
  46. Nie, B.; Chen, X.; Hou, Z.; Guo, M.; Li, C.; Sun, W.; Ji, J.; Zang, L.; Yang, S.; Fan, P. Haplotype-phased genome unveils the butylphthalide biosynthesis and homoploid hybrid origin of Ligusticum chuanxiong. Sci. Adv. 2024, 10, eadj6547. [Google Scholar] [CrossRef] [Scilit]
  47. Banerjee, A.; Hamberger, B. P450s controlling metabolic bifurcations in plant terpene specialized metabolism. Phytochem. Rev. 2018, 17, 81–111. [Google Scholar]
  48. Mau, C.J.; Karp, F.; Ito, M.; Honda, G.; Croteau, R.B. A candidate cDNA clone for (−)-limonene-7-hydroxylase from Perilla frutescens. Phytochemistry 2010, 71, 373–379. [Google Scholar] [CrossRef] [Scilit]
  49. Takahashi, S.; Zhao, Y.; O’Maille, P.E.; Greenhagen, B.T.; Noel, J.P.; Coates, R.M.; Chappell, J. Kinetic and molecular analysis of 5-epiaristolochene 1, 3-dihydroxylase, a cytochrome P450 enzyme catalyzing successive hydroxylations of sesquiterpenes. J. Biol. Chem. 2005, 280, 3686–3696. [Google Scholar] [CrossRef] [Scilit] [PubMed]
  50. Bouwmeester, H.J.; Konings, M.C.; Gershenzon, J.; Karp, F.; Croteau, R. Cytochrome P-450 dependent (+)-limonene-6-hydroxylation in fruits of caraway (Carum carvi). Phytochemistry 1999, 50, 243–248. [Google Scholar] [CrossRef] [Scilit]
  51. Arango, J.; Jourdan, M.; Geoffriau, E.; Beyer, P.; Welsch, R. Carotene hydroxylase activity determines the levels of both α-carotene and total carotenoids in orange carrots. Plant Cell 2014, 26, 2223–2233. [Google Scholar] [CrossRef] [Scilit]
  52. Zhao, Y.; Hull, A.K.; Gupta, N.R.; Goss, K.A.; Alonso, J.; Ecker, J.R.; Normanly, J.; Chory, J.; Celenza, J.L. Trp-dependent auxin biosynthesis in Arabidopsis: Involvement of cytochrome P450s CYP79B2 and CYP79B3. Genes Dev. 2002, 16, 3100–3112. [Google Scholar] [CrossRef] [Scilit] [PubMed]
  53. Chaban, C.; Waller, F.; Furuya, M.; Nick, P. Auxin responsiveness of a novel cytochrome p450 in rice coleoptiles. Plant Physiol. 2003, 133, 2000–2009. [Google Scholar] [CrossRef] [Scilit] [PubMed]
  54. Kumar, S.; Stecher, G.; Tamura, K. MEGA7: Molecular evolutionary genetics analysis version 7.0 for bigger datasets. Mol. Biol. Evol. 2016, 33, 1870–1874. [Google Scholar] [CrossRef] [Scilit] [PubMed]
  55. Chen, C.; Wu, Y.; Li, J.; Wang, X.; Zeng, Z.; Xu, J.; Liu, Y.; Feng, J.; Chen, H.; He, Y. TBtools-II: A “one for all, all for one” bioinformatics platform for biological big-data mining. Mol. Plant 2023, 16, 1733–1742. [Google Scholar] [CrossRef] [Scilit] [PubMed]
  56. Yan, J.; Wang, H.; Wang, Y.; Xu, S.; Wan, Y.; He, L.; Yu, L.; Zhu, W. Integrated metabolome and transcriptome analysis reveals candidate genes involved in metabolism of terpenoids and phthalides in celery seeds. Ind. Crops Prod. 2021, 172, 114011. [Google Scholar] [CrossRef] [Scilit]
Figure 1. Phylogenetic analysis of the CYP superfamily in Apium graveolens and Arabidopsis thaliana. A phylogenetic tree was constructed based on the full-length amino acid sequences of AgCYP and AtCYP proteins. All members were classified into six major clades (Clades I–VI), with bootstrap support values at each node represented by filled circles of varying sizes.
Agronomy 16 01271 g001
Figure 2. Distribution of conserved motifs within AgCYP proteins.
Agronomy 16 01271 g002
Figure 3. Conserved domain architecture of AgCYP proteins.
Agronomy 16 01271 g003
Figure 4. Chromosomal localization, gene duplication, and evolutionary analysis of AgCYPs within the celery genome. (A) The vertical bars represent the 11 celery chromosomes (Chr01–Chr11, labeled in yellow) with chromosome lengths drawn to scale in megabases (Mb) as indicated on the left. (B) Intraspecies collinearity analysis of AgCYP genes within the celery genome. Colored lines represent segmentally duplicated AgCYP gene pairs, while gray lines indicate genome-wide syntenic relationships. (C) Ka/Ks ratios of the five duplicated AgCYP gene pairs. (D) Synteny analysis of CYP genes between Apium graveolens and Daucus carota or Arabidopsis thaliana.
Agronomy 16 01271 g004
Figure 5. The distribution of cis-acting elements in the promoter regions of AgCYP genes. The numerical value within each cell represents the number of corresponding cis-elements identified in the promoter region of each gene. Color intensity reflects element abundance.
Agronomy 16 01271 g005
Figure 6. Expression profiles of AgCYPs during celery seed development. Expression values were normalized and mapped to a color gradient. Purple indicates high and light green indicates low expression levels. S1: the initial formation stage of seeds; S2: middle development stage of seeds; S3: maturation stage of seeds.
Agronomy 16 01271 g006
Figure 7. Co-expression network analysis between AgCYPs and differentially accumulated metabolites in celery. Correlation analysis was performed to determine AgCYP genes with transcript levels significantly correlated to the content of differentially accumulated metabolites. Green nodes in the central region represent differentially accumulated metabolites. Purple nodes comprising terpenoids represent differentially expressed AgCYP genes, with node color intensity reflecting p-value.
Agronomy 16 01271 g007
Figure 8. Expression profiles of AgCYPs in response to auxin. Celery was treated with 100 mL per plant of ddH2O (CK), 200 μM IAA, 200 μM PPBo, or 100 μM NPA. Samples were collected at 0d and 2d after treatment. (A) Heatmap of expression levels of AgCYPs under the four treatments. Expression levels were visualized using a color gradient ranging from green (low) to purple (high). (B) Validation of the expression patterns for eight selected candidate AgCYPs by RT-qPCR. Data are presented as mean ± standard deviation (SD) of three independent biological replicates. Different lowercase letters above the bars indicate statistically significant differences among treatments and time points (p < 0.05).
Agronomy 16 01271 g008
Figure 9. Multi-functional predictions of the eight candidate AgCYPs in celery. (A) Tissue-specific expression profiles of the eight AgCYPs were analyzed by RT-qPCR across six representative celery tissues. Data are presented as mean ± standard deviation (SD) of three independent biological replicates. Different lowercase letters above the bars indicate statistically significant differences among tissues (p < 0.05). (B) Predicted subcellular localization and three-dimensional structural models of the eight AgCYP proteins. (C) Protein–protein interaction (PPI) network among the eight AgCYPs and auxin-related proteins. Node color reflects the degree of connectivity, with a color gradient ranging from green (low) to purple (high).
Agronomy 16 01271 g009
Disclaimer/Publisher’s Note: The statements, opinions and data contained in all publications are solely those of the individual author(s) and contributor(s) and not of MDPI and/or the editor(s). MDPI and/or the editor(s) disclaim responsibility for any injury to people or property resulting from any ideas, methods, instructions or products referred to in the content.