Article

Competitive Ability of Three-Crop Mixtures and Pure Stands of Pea, Oats, and Camelina on Weed Diversity in Organic Farming


1
Department of Agricultural Sciences, University of Helsinki, 00014 Helsinki, Finland
2
Department of Soil Science, School of Agriculture and Environment, Massey University, Palmerston North 4442, New Zealand
3
Key Laboratory of Agricultural Resources and Ecology in Poyang Lake Watershed of Ministry of Agriculture and Rural Affairs in China, College of Land Resource and Environment, Jiangxi Agricultural University, Nanchang 330045, China
4
Helsinki Institute of Sustainability Science (HELSUS), University of Helsinki, 00014 Helsinki, Finland
*
Author to whom correspondence should be addressed.
Agronomy 2026, 16(12), 1125; https://doi.org/10.3390/agronomy16121125
Submission received: 20 April 2026 / Revised: 2 June 2026 / Accepted: 4 June 2026 / Published: 8 June 2026
(This article belongs to the Section Farming Sustainability)

Abstract

Weed competition, persistent seed banks, and management costs can limit crop productivity in organic farming. A two-year field experiment was conducted in southern Finland to evaluate the effects of pea (Lathyrus oleraceus Lam.), oats (Avena sativa L.), and camelina (Camelina sativa (L.) Crantz.), grown as pure stands and as three-crop mixtures at varying seeding densities, on weed diversity and suppression. The seeding densities (%) were 50:20:30 and 33:33:33 of the pure stand density of pea, oats, and camelina in 2022 and 50:50:50 and 33:33:33 of the pure stand density in 2023. Weed diversity was assessed at five sampling times, species were identified and analyzed for biomass, richness, Shannon-Wiener index (H), evenness, and dominance. Weed diversity and suppression varied with crop composition, growth stage, and seasonal conditions. In 2022, the 33% mix had the highest H (2.22) and evenness (0.77), enhancing weed suppression while controlling dominance. In 2023, pure oats had the highest H (1.65) and evenness (0.87), and pure peas had the lowest H (1.41) and evenness (0.67). Although pure oat stands provided the strongest weed suppression, crop mixtures enhanced species diversity and evenness, suggesting potential for more balanced weed management in organic systems, with short-term results indicating potential benefits for weed control.

1. Introduction

Weeds are a critical component of farmland ecosystems, with their richness, density, and biomass contributing significantly to overall farmland biodiversity. However, excessive weeds can compete with crops for both above- and belowground resources such as light, water, and nutrients [1,2]. Weed management is especially challenging in organic farming where chemical herbicides are not used and is identified as one of the most difficult, frustrating, expensive, and time-consuming management practices [3,4]. Mixed cropping has been shown to suppress weeds due to higher resource competition among the crops, the smothering effect, and, in some cases, allelopathy [5,6]. Although intercropping systems have been widely studied, most research has focused on two-species mixtures, particularly cereal–legume combinations [7,6]. In contrast, evidence on the performance of three-species mixtures is still emerging, diverse and three cover crop mixtures are described as relatively limited and inconsistent results, especially regarding weed control [8,9]. In particular, the functional interactions among species with different traits, such as rapid canopy development in cereals, nitrogen fixation in legumes, and complementary resource use in oilseed species, are not yet fully understood [7,9]. Therefore, this study addresses a clear research gap by assessing three-species crop mixtures under organic, cool–humid conditions, with explicit assessment of weed suppression and weed community dynamics relative to corresponding pure stands.
The competitive ability of crop species in organic farming systems is largely determined by species-specific functional traits such as early vigor, canopy architecture, growth rate, and resource capture strategies [10]. Cereals, such as oats (Avena sativa L.), are highly competitive due to rapid early establishment, strong tillering, and greater height, which may promote earlier canopy closure and reduce light availability for weeds, potentially contributing to weed suppression [11,12]. Grain legumes, such as the pea (Lathyrus oleraceus Lam.), tend to have a more open canopy and slower early growth, resulting in weaker early-season weed suppression, though their nitrogen (N)-fixing ability can indirectly affect weed communities by altering soil nutrients [13]. Emerging oilseed crops, such as camelina (Camelina sativa (L.) Crantz.), show intermediate competitive ability with traits such as early vigor and allelopathic potential [14]. When combined in crop mixtures, these traits can complement each other through varying light interception capabilities, rooting patterns, and nutrient use, potentially increasing overall weed suppression and influencing weed diversity [13,14].
Weed diversity indices, such as species richness, the Shannon-Wiener index, and evenness, are fundamental tools for understanding how diverse cropping systems influence weed communities and the degree of weed suppression within agricultural systems [15]. These indices allow researchers to quantify and compare the structural changes, competition, and interactions among weed communities under various agricultural management practices [16]. Weed diversity, together with weed density and biomass, can be used to identify productive and environmentally sustainable cropping systems, providing views on weed suppression and management decisions [17]. Different response mechanisms of mixed-cropping and pure-stand systems can lead to variation in weed community structure. Sugar beet (Beta vulgaris L. ssp. var. altissima Döll.)–winter wheat (Triticum aestivum L.) rotations reduced the weed seedbank by 28% to a density of 4500 seeds m−2, which was lower than the approximately 6300 seeds m−2 found in continuous winter wheat [18]. Similarly, maize (Zea mays L.)–winter wheat rotations also led to a 12% reduction in the seed bank compared with continuous winter wheat [18]. More competitive cultivars or higher planting densities tend to reduce weed species richness and diversity because a more competitive crop can suppress a wider range of weed species more effectively [15].
Maintaining a diverse weed community is important in agroecosystems because high weed evenness, where no single species dominates, can enhance ecosystem stability, support biodiversity, and reduce the risk of herbicide resistance [19]. However, high evenness does not always lead to reduced crop competition or improved yield, as the impact on crops depends on the competitive ability of the dominant weed species and the total weed biomass present [17,20]. Diversity indices, such as the Shannon index and evenness, primarily describe the weed community structure but should be interpreted alongside crop performance to understand their implications for weed management [17,20].
From a practical perspective, identifying crop combinations that enhance weed suppression while maintaining balanced weed communities is particularly relevant for organic and low-input farming systems, where options for chemical weed control are limited. Understanding the effects of crop species composition and seeding density on weed biomass and community structure can inform crop selection and mixture design, particularly under cool, humid conditions. The results contribute to the development of cropping systems with improved competitive ability and more sustainable weed management.
This study assessed the interactions among pea, oats, and camelina in a novel three-crop mixture, evaluating their effects on weed suppression, weed community diversity, and weed community dynamics under organic, humid conditions. The specific objectives were to quantify the effects of crop composition and mixture effects on weed density and biomass and to assess how pure stands and mixtures influence weed community structure, including species richness, the Shannon-Wiener index, and evenness. This supports the hypothesis that crop diversification practices, including crop mixtures, enhance crop competitiveness, reduce weed density and biomass, and promote or maintain weed diversity.

2. Materials and Methods

2.1. Experimental Location

Two field experiments were conducted in 2022 and 2023 at an organic farm in Hyvinkää, southern Finland (60°59′ N, 24°92′ E, 84 m above sea level). The soil was silt loam with a pH of 5.9 in 2022 and 6.3 in 2023. The soil organic carbon content of the topsoil (0–20 cm) was 24.3 g kg−1 in 2022 and 31.5 g kg−1 in 2023. Total soil N content of the topsoil was 1.49 g kg−1 in 2022 and 2.3 g kg−1 in 2023.

2.2. Weather Conditions

The growing seasons of 2022 and 2023 were slightly above long-term average temperatures (1991–2020) (Table 1), and July and August 2022, in particular, had the highest temperatures [21]. Precipitation for the entire growing season in 2022 was below the long-term average of 1991–2020 (Table 1). In 2023, precipitation in July, August, and September exceeded the long-term average while other months remained relatively low (Table 1).

2.3. Pre-Crop History and Soil Preparation

The pre-crop in the 2022 field experiment was a four-year forage grass mixture that was harvested once during summer 2021. The pre-crop in the 2023 field experiment was rye (Secale cereale L., cv. Walet), with white clover (Trifolium repens L., cv. Huja) as a companion crop sown in 2021 and harvested in 2022. The experimental area was non-inversion tilled with a cultivator to a depth of 20 cm in the preceding autumn. In the spring, one week before seeding, the area was disc-harrowed twice to a depth of 10 cm and once immediately before seeding.

2.4. Crop Establishment and Experimental Design

Oats cv. Ivory, pea cv. Astronaute, and camelina cv. landrace were sown on 19 May 2022 and 2023 with a plot seeder (Wintersteiger TC2700, Wintersteiger AG, Ried, Austria) at depths of 5 cm for pea and oats and 1 cm for camelina. The row spacing was 12.5 cm. Pure stand seeding densities were 600 viable seeds m−2 for camelina, 500 viable seeds m−2 for oats, and 120 viable seeds m−2 for pea. The species mixture seeding densities (%) for oats, pea, and camelina were 50:20:30 and 33:33:33 in 2022 and 50:50:50 and 33:33:33 in 2023, based on their respective pure stand seeding densities (Table 2). The experiments were arranged in a randomized complete block design (RCBD) with four replicates, and no fertilizers, pesticides and external chemical inputs were applied. The plot size was 1.5 m × 15 m. Mixture ratios differed between years, with 50:20:30 used in 2022 and 50:50:50 in 2023 to reduce oat dominance and better evaluate crop complementarity. Since mixture composition and environmental conditions varied between years, treatment effects were evaluated within each year (Figure 1).

2.5. Sampling and Measurements

Plant samples were collected by uprooting all plants from an area of 0.25 m2 (50 × 50 cm) during five sampling points at each growing season. Samples were collected at five sampling times (tillering, stem elongation, flowering, grain filling, and yellow maturity) in both years from fixed sampling points (Table 3). These sampling time labels represent approximate equivalent developmental stages across oats, pea, and camelina, whereas crop-specific phenological development was assessed using species-specific scales. All plants within the sampled area, including all three crop species of oats, pea, and camelina and all weed species, were uprooted and transported to the laboratory in ice boxes. Only aboveground fresh biomass was used for species identification and drying. In the laboratory, plants were separated into species, and crop and weed species were counted and identified. Samples were dried in an oven at 105 °C for one hour, followed by continued drying at 65 °C to constant weight. Dried samples were ground into fine powder (1 mm sieve, ZM 200, Retsch GmbH, Haan, Germany). An intact area of 10 m2 was harvested with a plot combine harvester (Wintersteiger Classic Plus, Wintersteiger AG, Austria) at full maturity on 26 August 2022 and 6 September 2023. The seeds were dried, sorted (seed sorter, Westrup A/S, Slagelse, Denmark), and weighed.

2.6. Calculations and Indices

The Shannon-Wiener diversity index (H) equation [25] describing the weed diversity in pure stand and mixed cropping systems was calculated using Equation (1).
H = −ΣPi × ln(Pi),
where P i is the proportional abundance of species i , calculated as P i = x i / X , with x i representing the recorded value of species i in a quadrat and X the sum of all species values in that quadrat. Species dominance was calculated using Simpson’s dominance index (D) [26], as shown in Equation (2).
D = i = 1 s p i 2 ,
where pi is Ρi is the proportion of the entire community of species i species dominance and S is the total species count.
Weed species evenness was calculated according to [16] as Equation (3).
S p e c i e s e v e n n e s s = H l n ( S ) ,
where S is the total species count and H is the Shannon-Wiener diversity index.

2.7. Statistical Analysis

The data were analyzed with SPSS (Version 29.4, SPSS Inc., Chicago, IL, USA). A three-way analysis of variance (ANOVA) was used to determine the effects of crop stands, sampling times, and their interactions on weed composition and diversity indices at a significance level of p < 0.05. Tukey’s HSD test was used to identify multiple comparisons of experimental years, crop stands, and sampling times. Homogeneity of variances was estimated with Levene’s test. Because mixture composition and environmental conditions differed between the years, treatment effects were analyzed separately for each year. Cross-year data were presented descriptively.

3. Results

3.1. Weed Composition and Biomass on the Field Surface

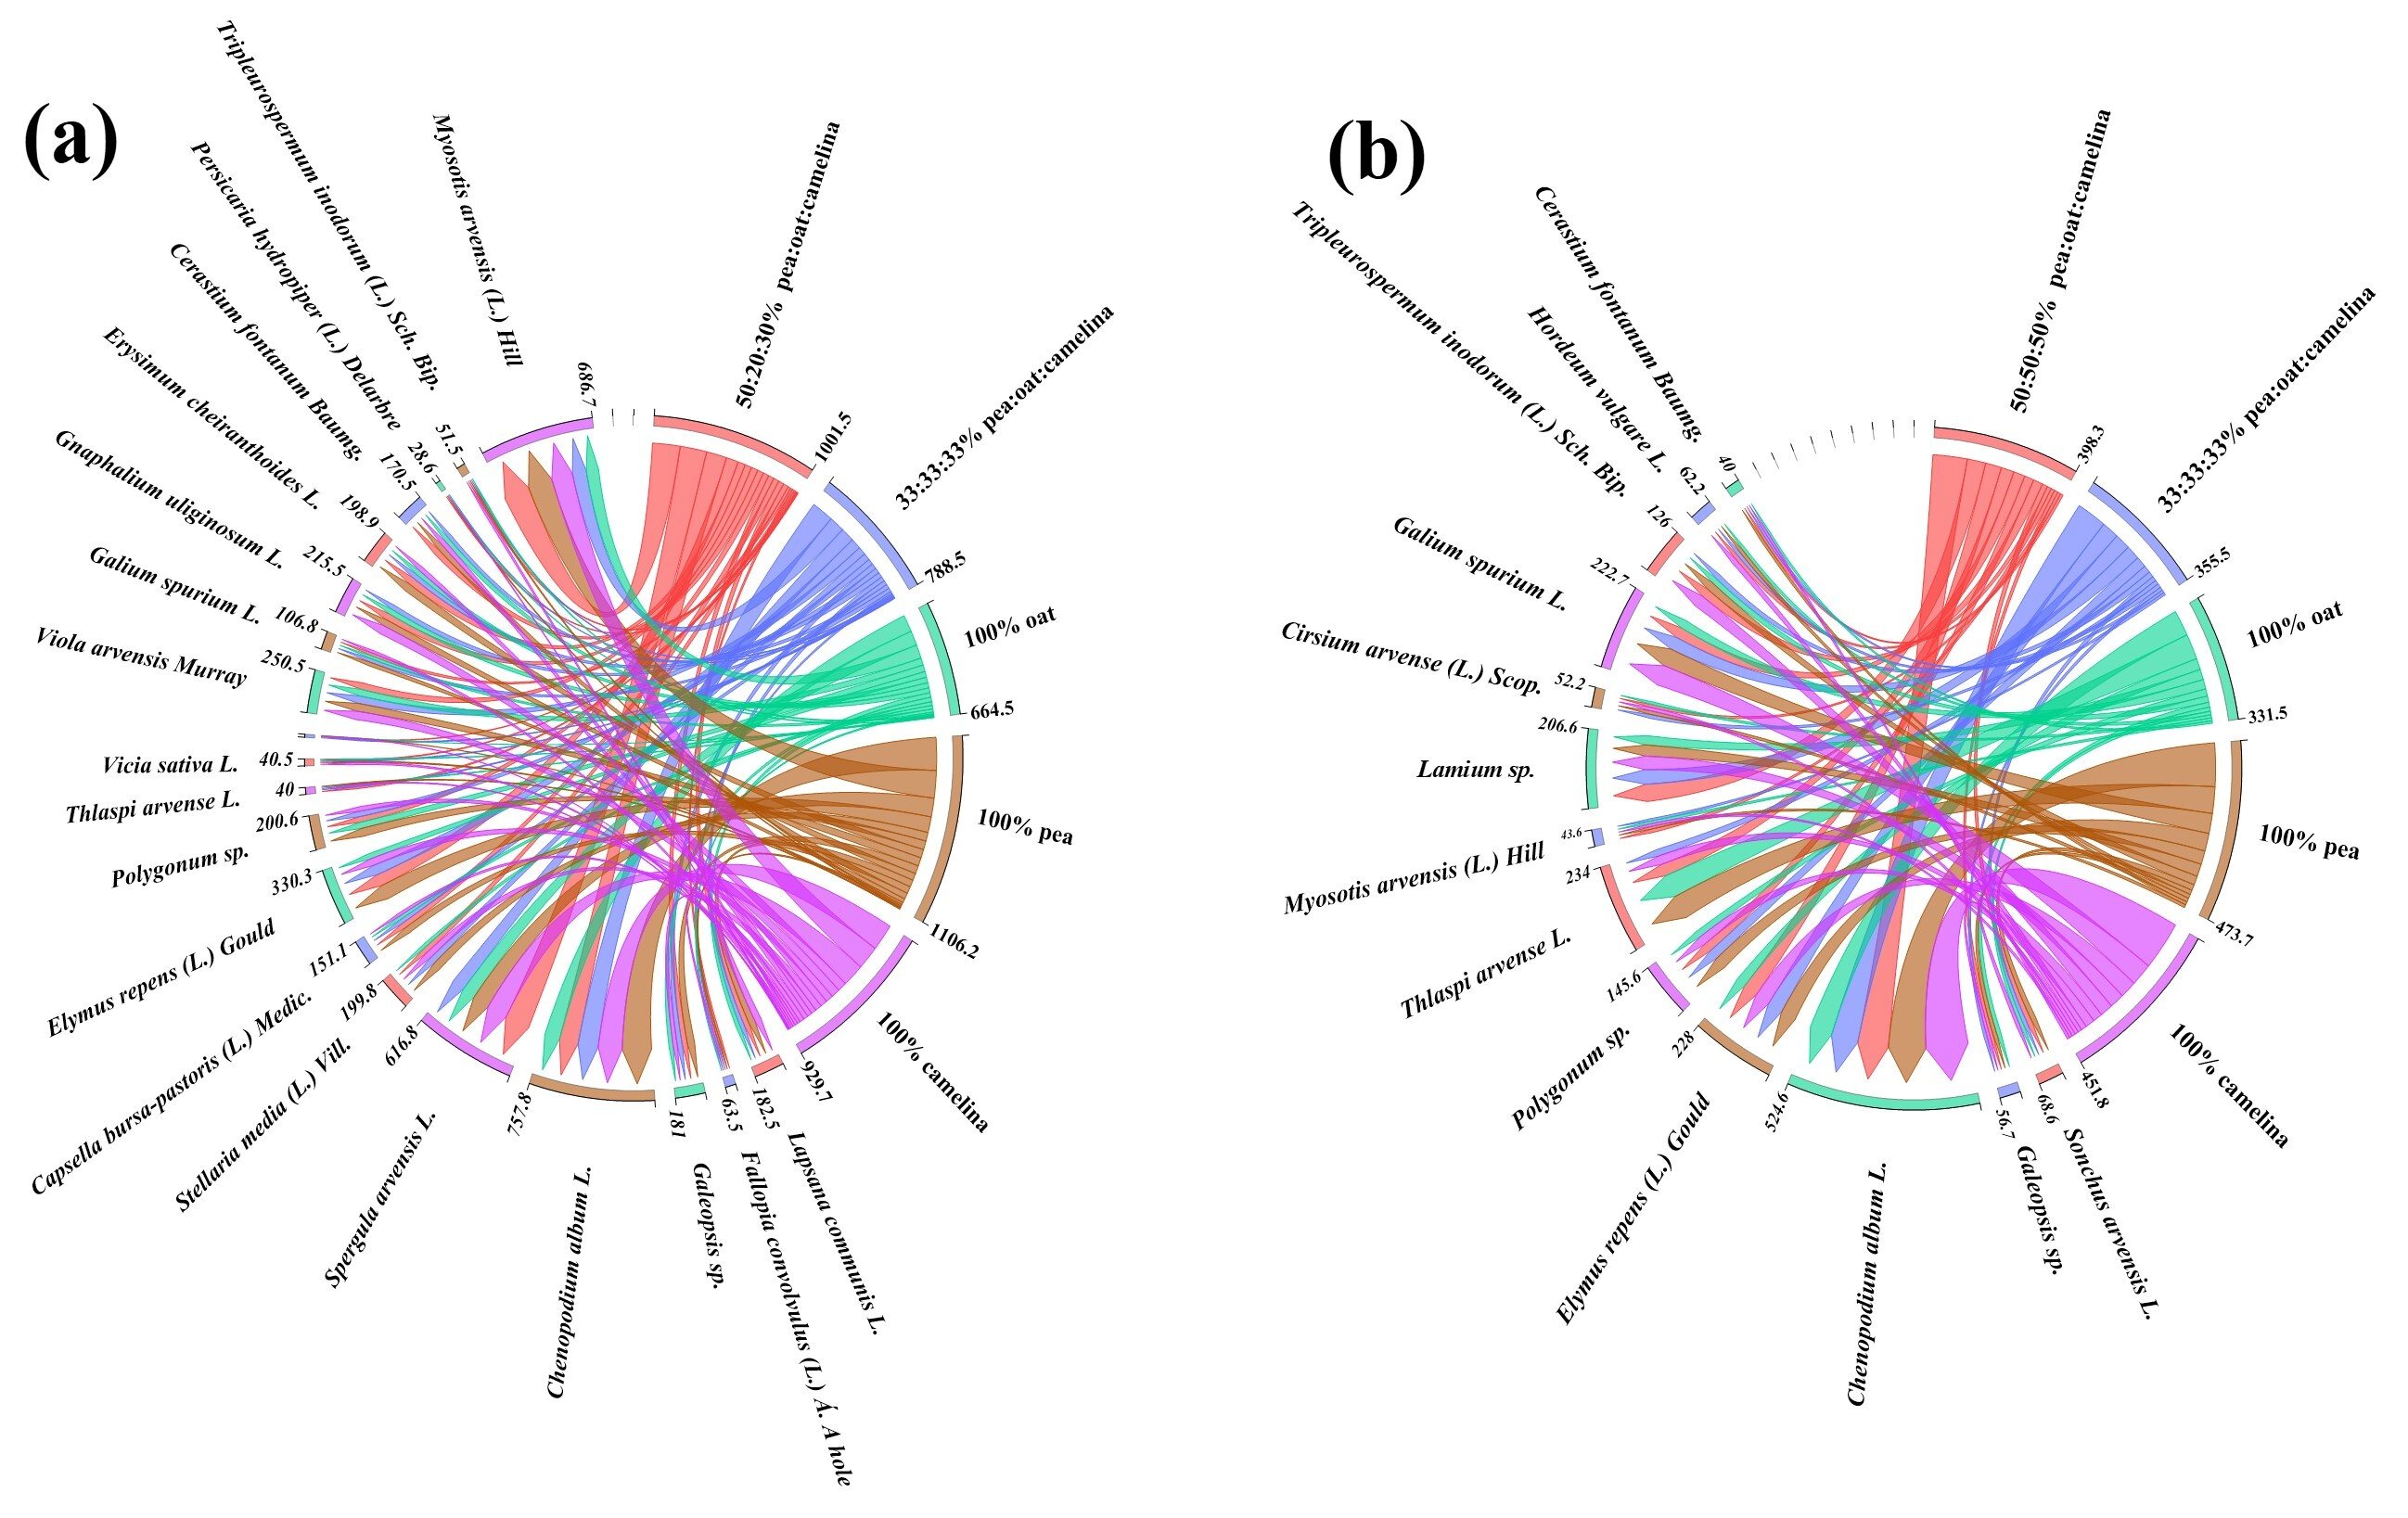
Weed density and weed biomass were affected by crop stand and sampling time (Table 4). Within each experimental year, pure pea had the highest weed density, whereas pure oats had the lowest weed density (Figure 2). The greater weed density observed in pure peas may be associated with a less competitive early growth habit relative to oats. Mixed cropping systems had lower weed densities compared with pure pea and pure camelina within each experimental year (Figure 2), which may be associated with differences in crop growth patterns and canopy development among the cropping systems.

3.2. Weed Community Composition and Diversity

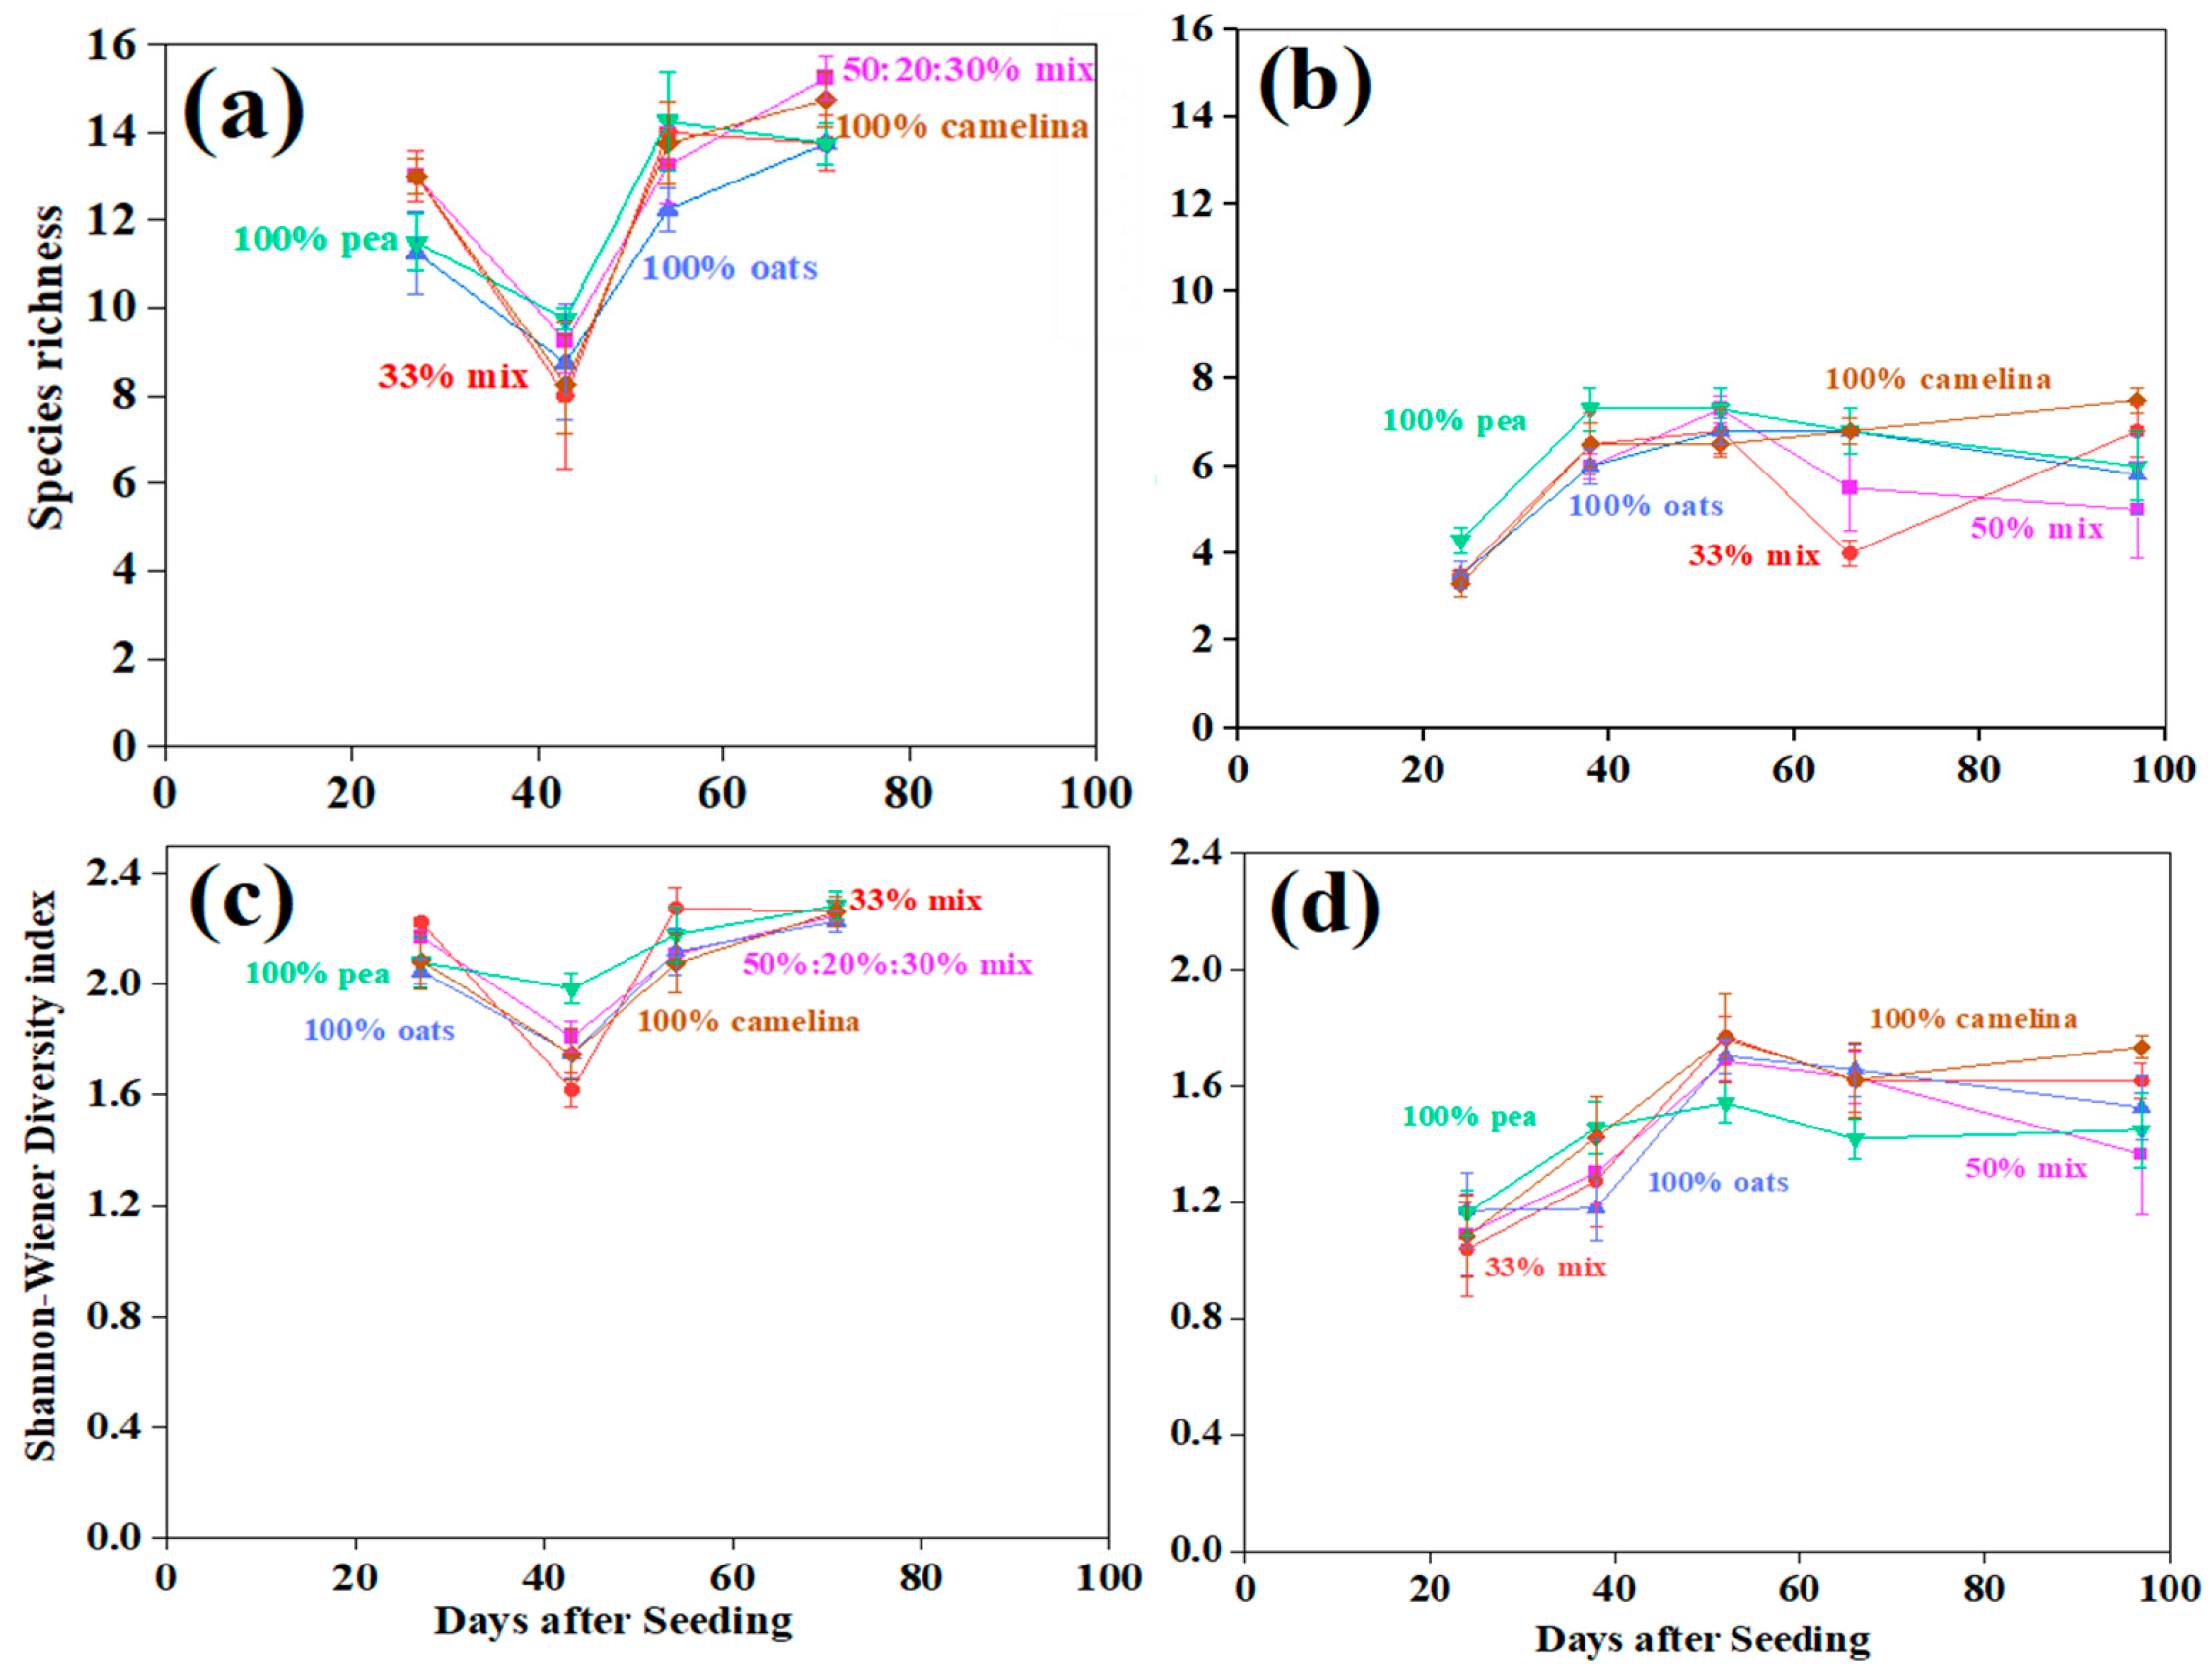
Weed species richness was affected by sampling time (p < 0.001) (Table 4). However, pure and mixed stands did not affect weed species richness. In 2022, species richness was highest (9.75) in pure peas at the stem elongation stage and lowest (8.00) in the 33% mix, while the 50:20:30% mix had the highest species richness (15.25) at the grain-filling stage (Figure 3). These results indicate temporal shifts in weed community composition across crop stands and crop growth stages. In 2023, at the tillering stage, species richness was highest (4.3) in pure peas and lowest (3.3) in camelina, and species richness at the grain-filling stage was 6.8 in pure camelina, oats, and pea and only 4.0 in the 33% mix (Figure 3).
The Shannon-Wiener diversity index was significantly affected by sampling time (p < 0.001). Significant variations in the Shannon-Wiener diversity index were observed at tillering and grain filling in 2022, with the 33% mix having the highest (2.22) and pure oats having the lowest (2.05) diversities at tillering (Figure 3). At grain filling, pure pea had the highest Shannon-Wiener diversity index (2.28), followed by the 33% mix (2.26), while pure oats had the lowest (2.22) diversity (Figure 3). Variations in the Shannon-Wiener diversity index in 2023 were at the grain-filling stage, where pure oats had the highest (1.65) and pure peas had the lowest values (1.41) (Figure 3).
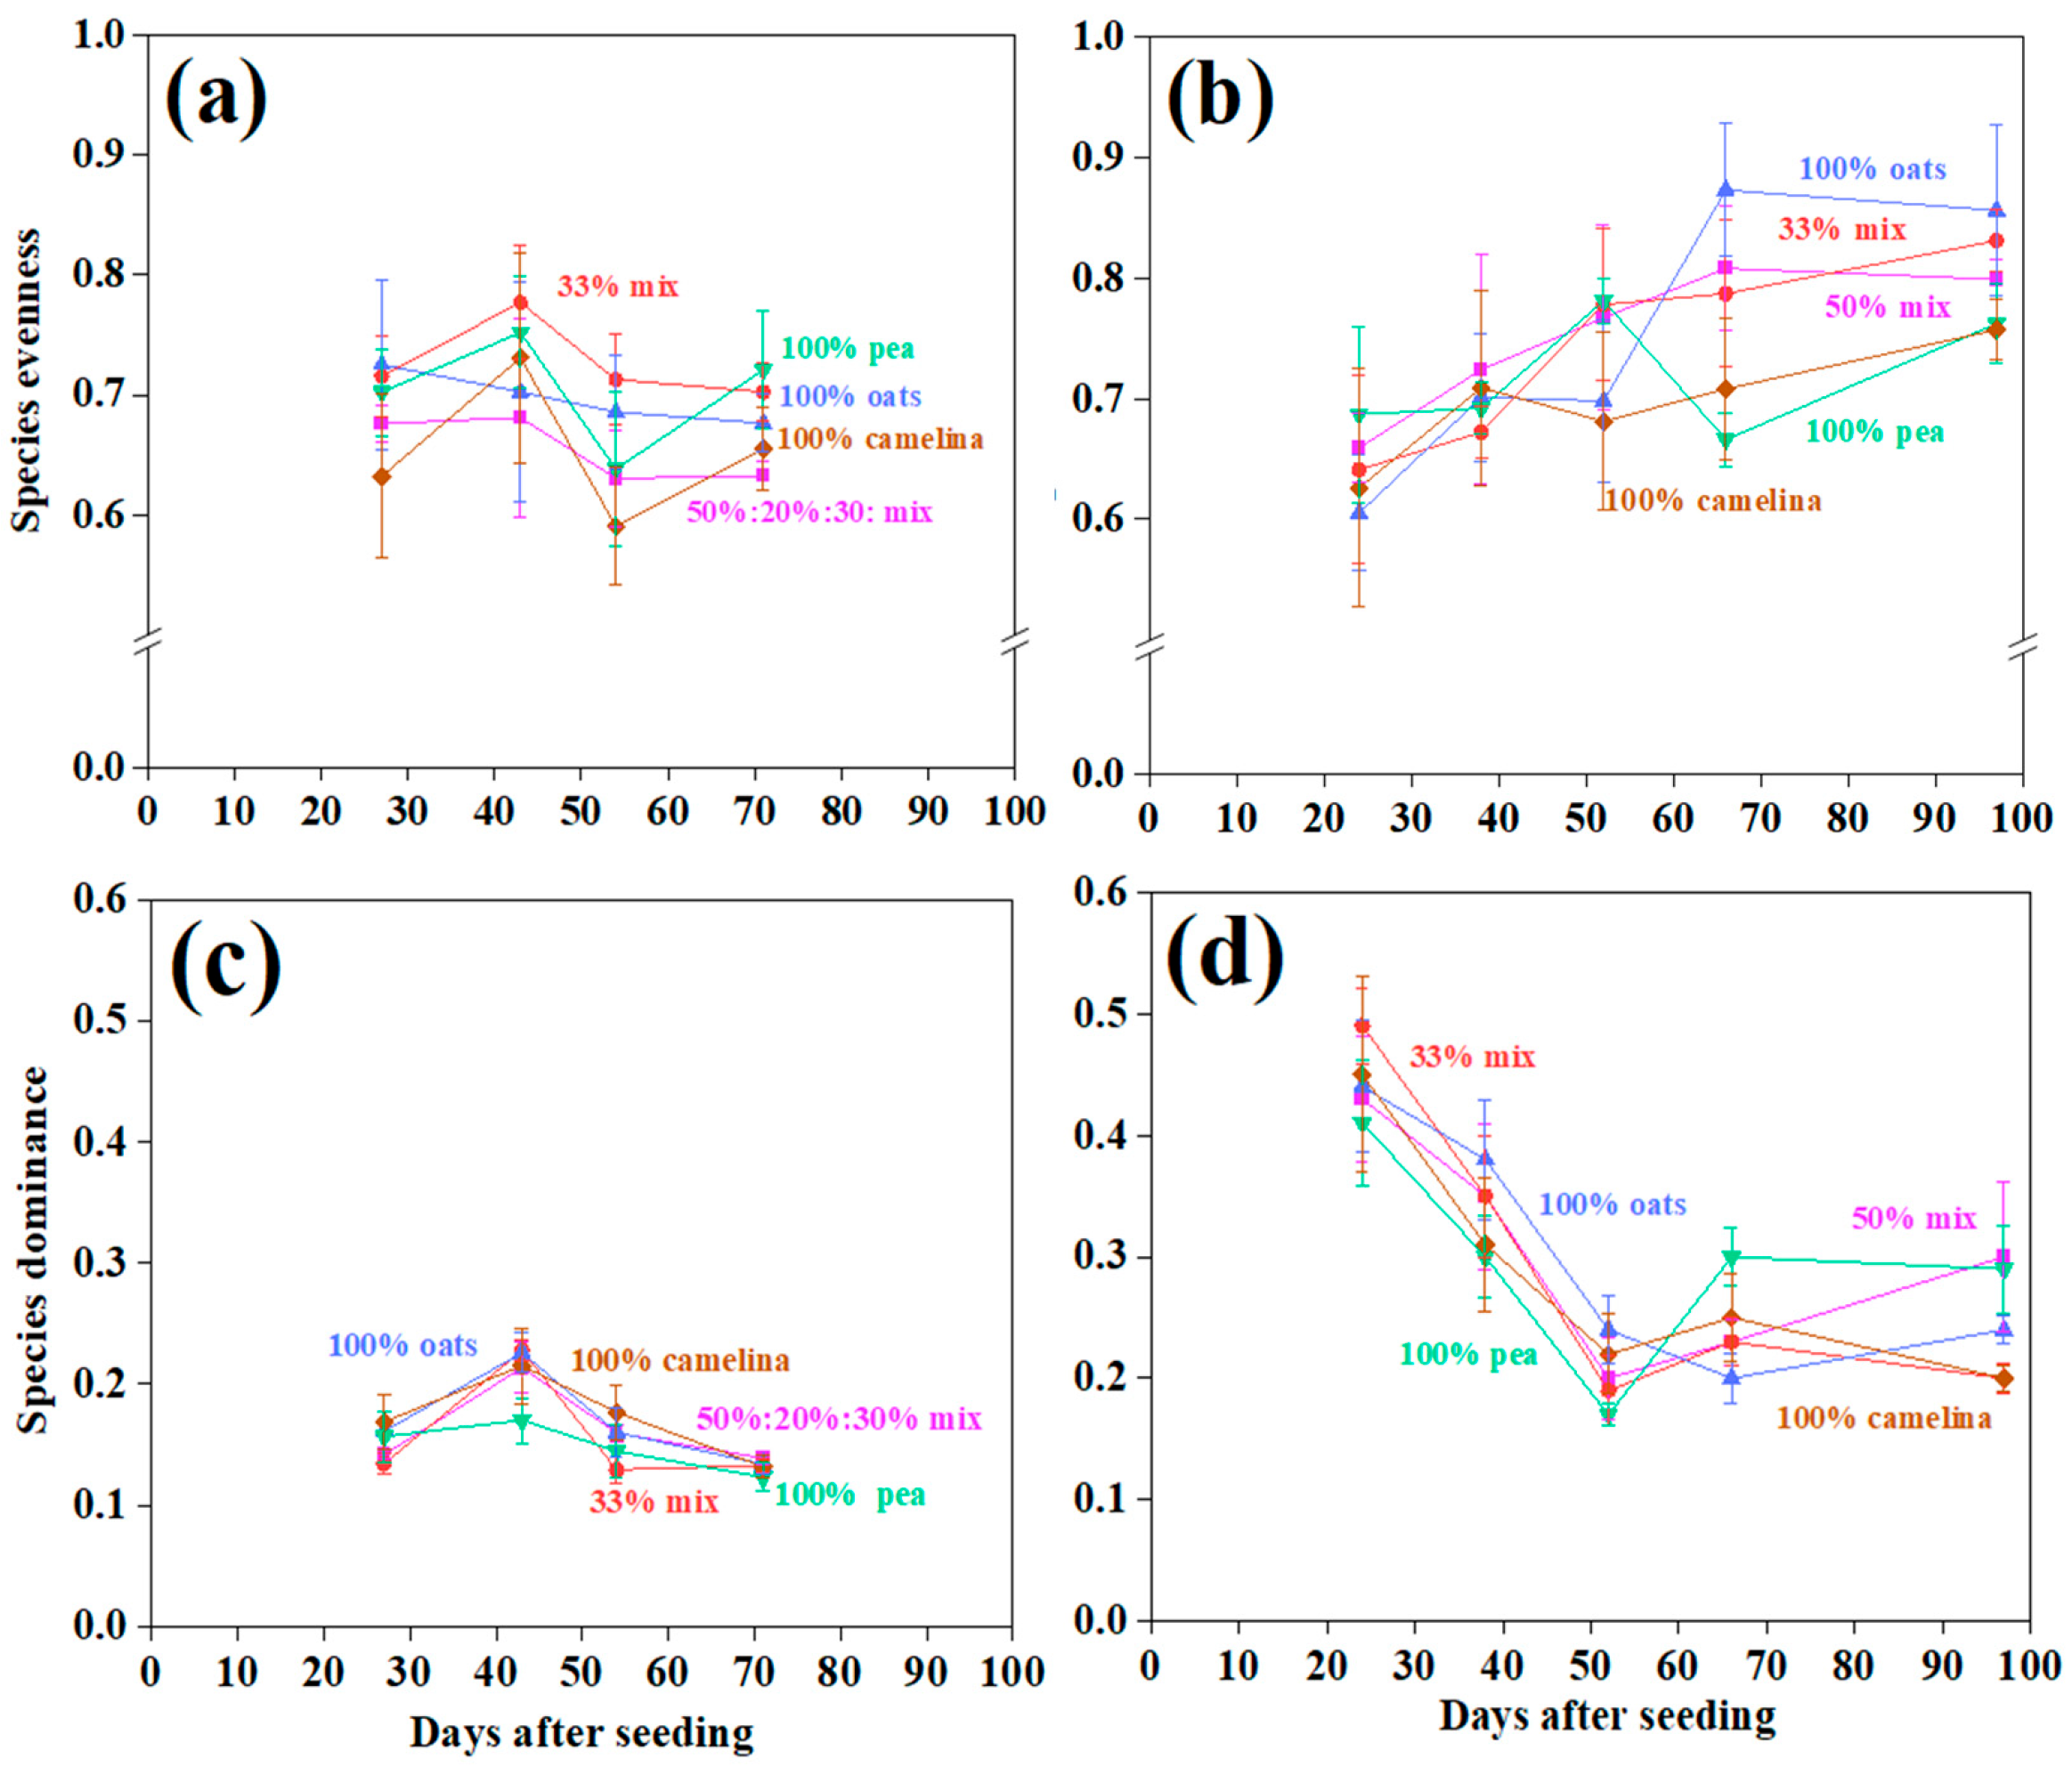
Species evenness was not affected by sampling time but was significantly impacted by the crop stand (p = 0.005) (Table 4). Differences among crop stands were observed across growth stages and years. Significant differences among crop stands occurred during stem elongation and flowering in 2022. At the stem elongation stage, the highest evenness was observed in the 33% mix (0.77), while the lowest evenness was recorded in the 50:20:30% mix (0.68) (Figure 4). The highest evenness at flowering was in the 33% mix (0.71), while the lowest was in pure camelina (0.59) (Figure 4), indicating a more uneven distribution of weed species under this stand. Significant variations in 2023 occurred during grain filling, with the highest species evenness observed in pure oats (0.87), followed by the 50% mix (0.81), while the lowest was observed in the pure pea (0.67) (Figure 4), suggesting less balanced weed community composition under pure pea stands.
The effect of crop stand on species dominance was not consistent over the years or sampling times, reflecting a significant three-way interaction (Table 4).

3.3. Relationships Between Crop Stands and Weed Aboveground Biomass with Community Diversity

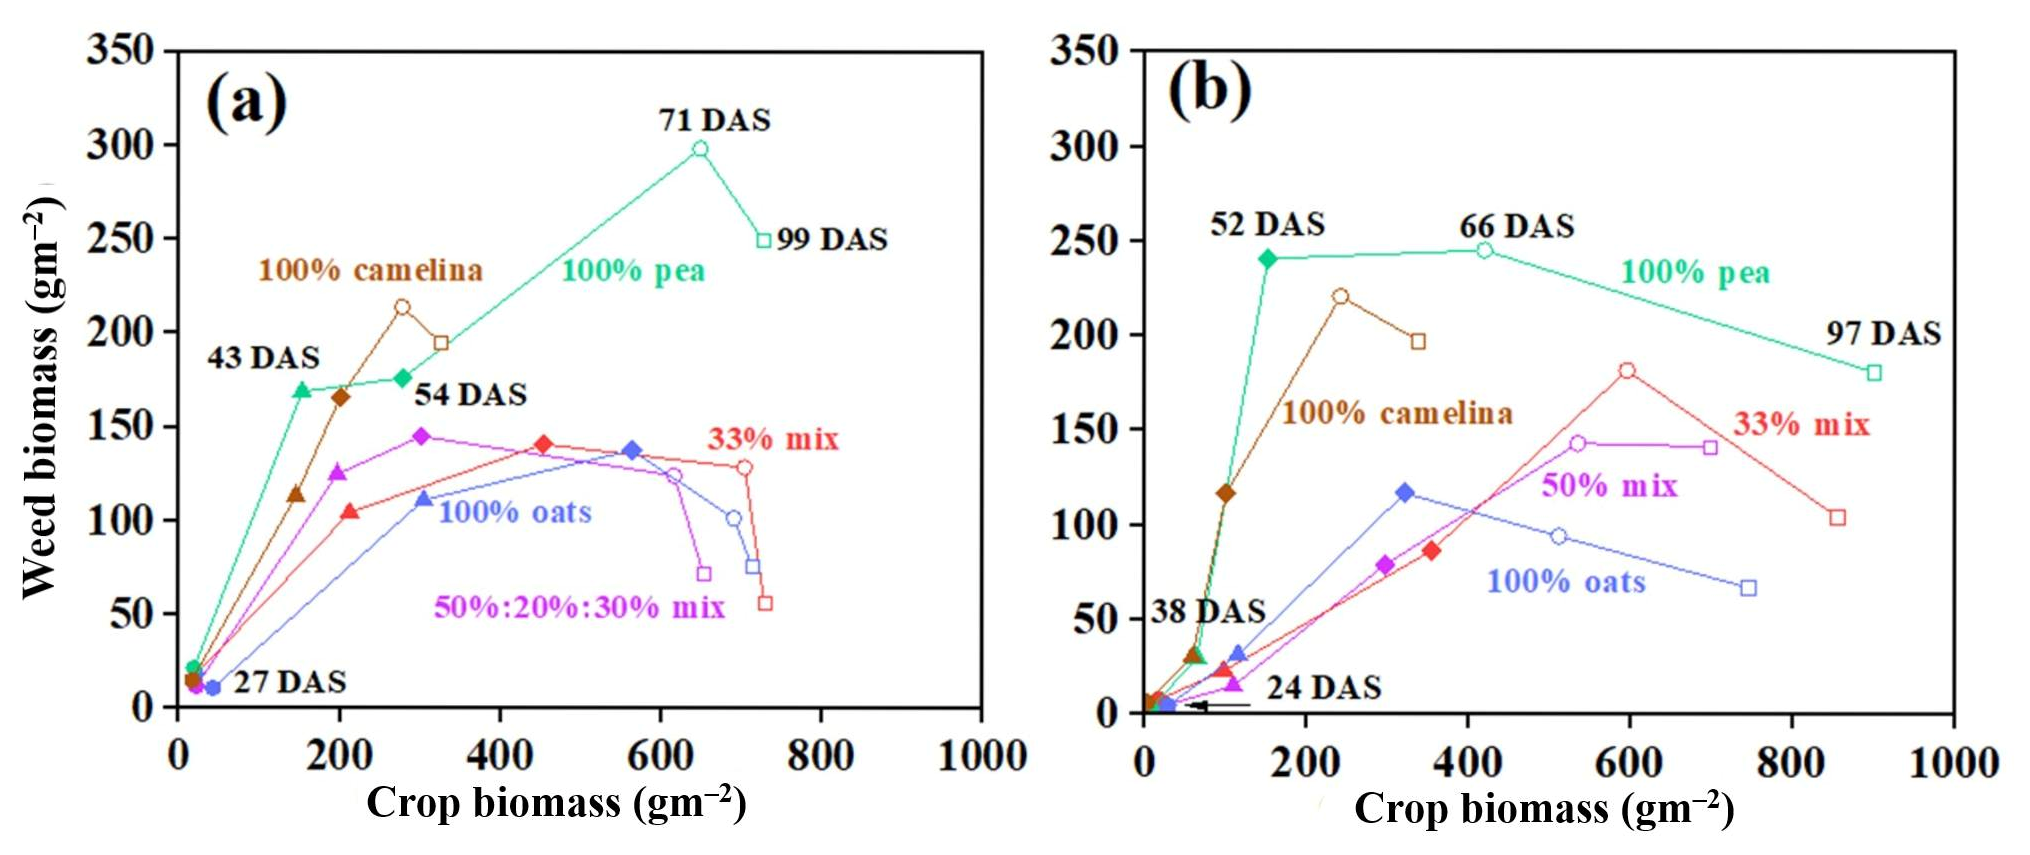
Weed biomass increased in all crop stands until the flowering stage in both years (Figure 5). From flowering to grain filling, weed biomass increased in pure pea and pure camelina, while it decreased in crop mixtures and pure oats in 2022, whereas in 2023 it increased in all stands except pure oats (Figure 5), suggesting differences in weed suppression among crop stands during later growth stages. We observed a decreasing trend in weed biomass in both years between grain filling and yellow maturity (Figure 5). Mixed crop stands had lower weed biomass in both experimental years compared with pure pea and camelina, with pure oats having the most effective weed suppression with the lowest weed biomass (Figure 5).
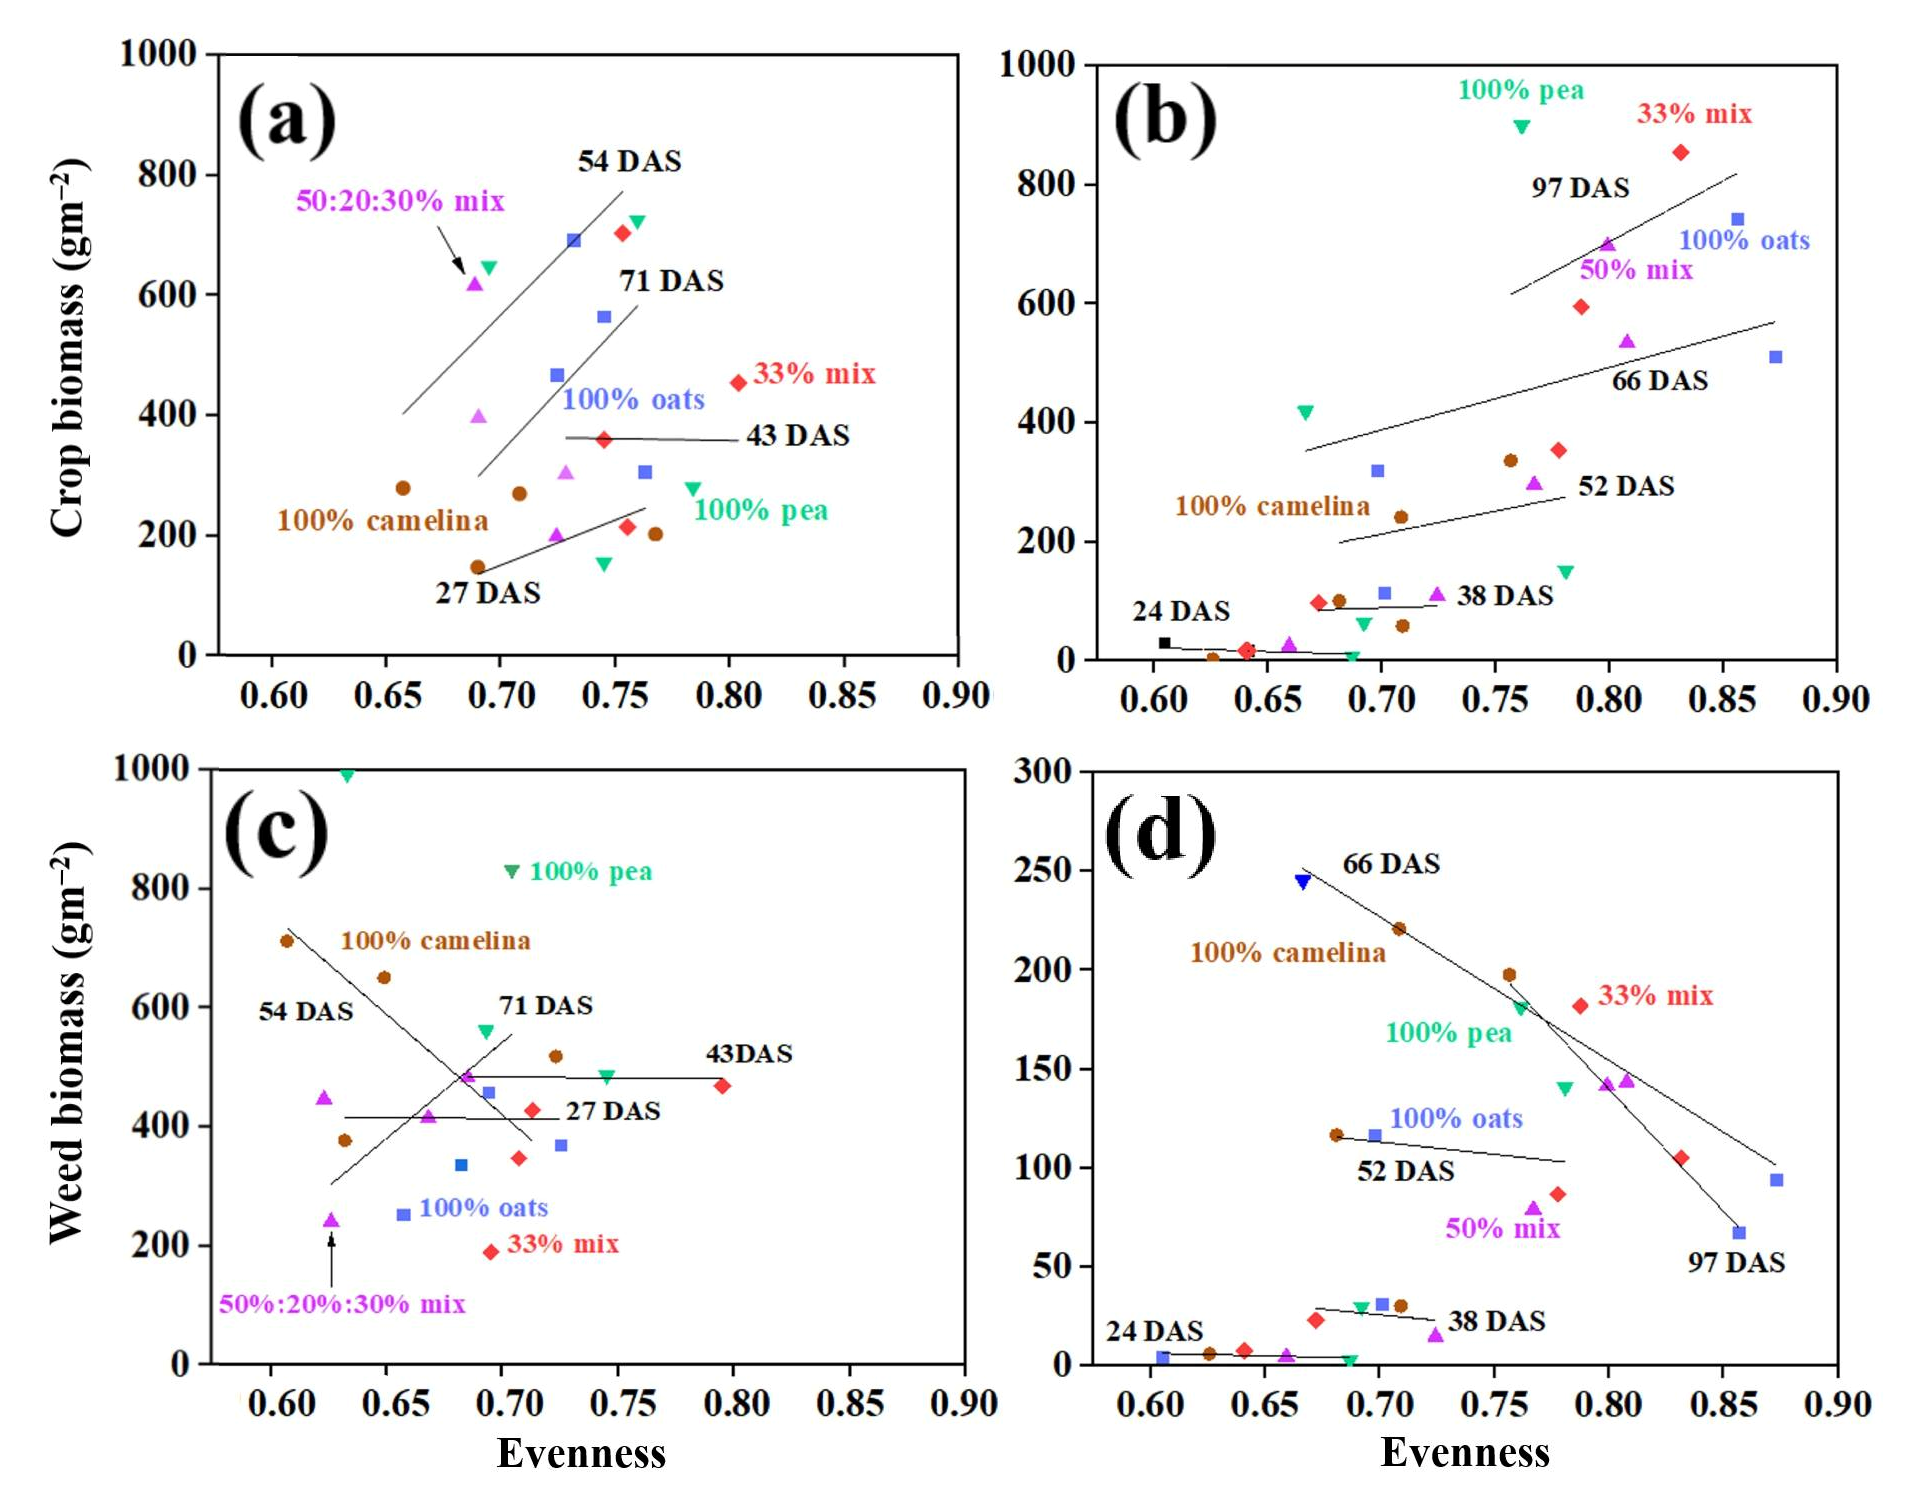
As weed species evenness increased from 0 to 0.9, crop biomass showed a positive correlation in both experimental years, except for the noticeable decreasing trend during flowering in 2022 and tillering in 2023 (Figure 6). As weed species evenness increased from 0 to 0.9, weed biomass showed a negative correlation in both experimental years, except for a noticeable increasing trend at yellow maturity in 2022 (Figure 6). These patterns suggest that more even weed communities were often associated with higher crop biomass and lower weed biomass across most growth stages.

4. Discussion

In this study, oats had lower weed biomass compared with pure pea and camelina. Although crop architectural traits, such as plant height, canopy closure, light interception, and allelopathic traits, were not directly measured in this study, they have consistently been linked to weed suppression under organic and low-input systems [27,28,29,30,31]. Therefore, the observed weed suppression is interpreted based on well-established functional relationships reported in previous studies [32,33,34,35]. Oats have been reported to exhibit traits associated with weed suppression, including high leaf area and greater plant height, which may contribute to denser canopy formation, reduced light availability at the soil surface, and the limitation of weed establishment and growth [36]. Moreover, oats have key traits, such as a rapid early growth rate, a good establishment rate, and a strong tillering ability to suppress weed growth and tolerate weed competition [27].
Pure pea stands had higher weed biomass, although responses varied among sampling times within each experimental year, consistent with significant Y × CS and CS × T interactions (Table 4). The pea has an open, sprawling growth habit with relatively slow early development, followed by rapid vegetative expansion that could suppress weeds later in the season, but its limited canopy closure at establishment may reduce early weed suppression [36]. The N fixation ability of the pea has been reported to increase soil nutrient availability, favoring fast-growing ruderal weeds [37,38], which could have contributed to the higher weed biomass observed in this study.
Pure camelina showed intermediate weed biomass, lower than pure pea but higher than pure oats, within each experimental year, with responses varying across sampling times. This is indicated by comparative field studies showing camelina’s moderate weed suppression relative to other crops [39,40]. Previous studies have reported that moderate canopy height, fine leaves, and early vigor may be associated with partial ground shading and reduced early weed establishment [39,40]. The slower initial biomass accumulation of camelina compared with oats may have reduced its competitive ability against early-emerging weeds, such as lambsquarters (Chenopodium album L.), to establish before full canopy closure [40]. Camelina’s allelopathic potential has been reported to include chemical compounds, such as benzylamine and glucosinolates [41], which may have contributed to moderate weed suppression and disease control.
Within each experimental year, crop mixtures reduced weed biomass compared to pure pea and camelina, although the magnitude of suppression varied among sampling times. This may be due to complementary canopy structures and rooting depths, which have been suggested in previous studies to enhance ground cover, light interception, and belowground resource use efficiency [42,43]. However, the mixture effect may be partially influenced by oat dominance, with higher relative oat abundance corresponding to stronger weed suppression [27,44,45].
The mixture proportions were adjusted between experimental years to reduce oat dominance in the mixture. In oat–forage legume relay cropping systems, oats dominated the intercrops, reducing legume aboveground mass by 91.4–98.9% compared with legume monocultures [46]. In oat–vetch mixtures, oats were more aggressive than vetch at most seed rate proportions, including 50:50, indicating that around half of the stand is still sufficient for oats to dominate the legumes [47]. In oat–faba bean intercrops, oats were identified as the relatively stronger competitor based on yield–density and competition parameters [48] showing that oats tend to dominate mixture partners at moderate or equal proportions.
Based on an agro-diversity field experiment conducted at 30 locations across Europe and Canada, the standard deviation of annual weed biomass was significantly lower in four-species grass–legume mixtures: 0.416 t DM ha−1 for a site plot vs. 1.770 t DM ha−1 for pure stands [49]. Although mixed cropping systems offer advantages, such as weed suppression, biomass productivity, and nutrient retention, mixtures have been reported to suppress weeds comparably or less effectively than the best pure stands, such as lopsided oat (Avena strigosa Schreb.) or oilseed radish (Raphanus sativus L. var. oleiformis Pers.), mainly because mixtures fail to develop a uniform canopy or do not achieve transgressive overyielding [50,51]. Effective weed suppression requires species with rapid, early growth and dense, vigorous canopy formation leading to high biomass.
The consistent dominance of C. album in crop stands may reflect its high ecological adaptability and global prevalence as a troublesome weed, supported by its ability to thrive under variable light and N conditions and its efficient resource use [52,53]. Its production of heterogynous seeds with diverse dormancy levels allows staggered germination, enabling it to utilize gaps in the crop canopy at various growth stages, which contributes to its persistence [52]. The species’ capacity for luxury N uptake, particularly in N-fixing crop systems, such as the pea, enhances its competitive advantage by efficiently utilizing nutrient-rich patches, as shown by its ability to access both organic and inorganic N forms [54,55]. Rapid growth under high light conditions and a broad germination temperature range may further support its competitive success and high abundance, similarly in the pure pea and camelina stands of the study [52,56]. Additionally, C. album’s physiological traits, such as high leaf N content and adaptive responses to N and light stress, contribute to its survival and dominance in diverse environments [52,53]. Although we identified weed species in our present experiment, they were not classified by life cycle as annual, biennial, or perennial, which limits the interpretation of weed community dynamics based on functional life-history groups.
Within each experimental year, pure pea stands had the highest species richness, whereas the 33% mix had the lowest species richness. Crop mixtures have been reported to form dense, heterogeneous canopies that may enhance light interception and nutrient uptake, potentially suppress the establishment of subordinate weed species and reduce weed species richness [42,43]. Pure stands, which lack rapid canopy development and efficient resource capture, generally leave more resources available early in the season, which may facilitate the emergence of greater weed species diversity [42,57]. Factors such as crop rotation with fallow, the use of competitive cultivars, higher planting density, and cover crops can reduce weed species richness and overall weed density in mixed cropping systems [15]. Weed species richness was reduced in the 33% crop mixture in our present experiment, suggesting the effective suppression of multiple weed species. The persistence of diversity at later stages suggests a balanced weed community in which no single species becomes dominant.
In our present study, the 33% mix had the highest evenness during the stem elongation and flowering stages in 2022, indicating that the crop mixture, especially with cereals and legumes, has been suggested to enhance functional diversity and niche differentiation, thereby improving resource use efficiency. However, their effect on weed suppression and crop performance depends on crop competitiveness and community structure [58,59,60]. This diversity disrupts weed development patterns and reduces the possibility of any weed species from dominating [51]. Crop mixtures can sustain species balance over time by optimizing complementary resource use and competitive interactions, thereby supporting the persistence of diversity–productivity effects [61]. However, in this study, the highest weed evenness during the 2023 grain-filling stage was in the pure oat stand. Variability in species evenness among crop stands can be largely influenced by environmental factors, such as rainfall, temperature, site characteristics, as well as by variations in nutrient availability and weed management intensity [62,63]. Moreover, variations in evenness tend to be greater in pure stands due to the influence of life-history traits on seed bank composition, while the effectiveness of weed suppression in mixtures depends on both the proportional evenness and identity of the component species [19,64].
Shannon diversity index values ranged from approximately 1.43 to 2.30 across observations, reflecting variation in weed community structure [65,66]. Increased weed evenness may enhance resource partitioning among weed species and sustain overall weed biomass [35,67,68]. Therefore, lower weed dominance or higher evenness may not necessarily be beneficial for weed management, and weed community indices should be interpreted in relation to crop traits and management practices when evaluating weed control and crop productivity [14,69]. Shannon diversity and species evenness describe weed community structure rather than agronomic performance. In the present study, higher diversity or evenness did not consistently correspond to lower weed biomass, greater crop biomass, or improved weed suppression across crop stands and growth stages. Therefore, these indices should be interpreted alongside measures of weed biomass and crop performance.
The relationship between crop and weed biomass, with weed biomass increasing until flowering in the present study, could suggest an early advantage of weeds in light interception during initial growth, as reported previously [70,71]. However, later reductions in weed growth may be associated with crop canopy development and reduced photosynthetically active radiation (PAR) availability, as observed earlier [72,73]. As crop stands mature, particularly in mixtures where complementary plant traits may enhance resource capture and shading, the increased competitive ability of the crops leads to a further decline in weed biomass because well-established crops become more effective at suppressing weed growth [74,75].
Pure pea supported the highest weed biomass in our present experiment, consistent with studies indicating three times greater weed suppression in legume–cereal intercrops than in pure legumes [76]. In the present study, pure oats maintained the lowest weed biomass, which might be due to their rapid canopy development, limited light accessibility, and allelopathic effects, which restrict weed germination and growth [45].
There was a positive relationship between weed evenness and crop biomass in the present study except for the noticeable decreasing trend during flowering in 2022 and tillering in 2023. As weed biomass evenness increased from 0 to 1, the biomass of winter cereals, specifically winter wheat and winter barley (Hordeum vulgare L.), increased the crop biomass by 23% across various crop stages, with observed dry matter increases of 98, 174, 263, and 262 g DM m−2 at stem elongation, heading, grain filling, and maturity, respectively, because weed evenness leads to higher crop biomass by mitigating weed–crop interference [17]. The underlying mechanism is that higher weed evenness was associated with lower weed biomass, similar to the present study, thereby reducing weed–crop interference and enhancing crop productivity [17]. This negative correlation suggests that greater evenness among weed species may limit intraspecific competition and resource overlap, reducing overall weed biomass [17]. Variation in weed species’ geometric distribution, which is not always constant, describes a highly uneven structure when dominance is high, and may contribute to reduced weed biomass [77]. However, the relationship between weed evenness and crop biomass is complex and depends on a variety of environmental factors, such as soil type, weather patterns, moisture, soil nutrient levels, and other abiotic factors that may impact plant growth [17]. Although higher weed evenness generally reduces weed biomass, competition can remain strong when highly competitive species, such as Alopecurus myosuroides Huds. or Galium aparine L., expand rapidly, as observed in winter wheat and barley, where late-season growth can outcompete the crop, highlighting the role of multiple growth factors in weed–crop interactions [17].
Differences in weed biomass and diversity were observed between experimental years. Below-average rainfall and higher temperatures were recorded in 2022, whereas 2023 experienced higher precipitation during July–September. Mixture effects were evaluated separately within each year, as direct between-year comparisons are confounded by differences in climate and mixture composition [11,78].
The initial weed seedbank was not quantified, so the observed weed density, biomass, and community composition reflect both pre-existing seedbank conditions and in-season dynamics. This limitation is particularly important when comparing results between years, because differences in pre-crop history, baseline soil fertility, and rainfall may have influenced the observed outcomes.
Our findings have direct practical implications for organic and low-input vegetable systems. The strong weed suppression observed in pure oats and mixtures with higher oat proportions indicates that the inclusion of competitive cereal species can reduce reliance on mechanical weed control. Although camelina showed intermediate weed suppression, its rapid early ground cover and functional complementarity with other crops may enhance overall weed control when included in mixtures. Crop combinations integrating cereals, legumes, and oilseeds provide a balance between biomass production, N fixation, and weed suppression, thereby improving resource use efficiency and cropping system productivity. Furthermore, improved understanding of the ecological traits of dominant weed species, such as C. album, can inform decisions on crop density, sowing timing, and crop selection to limit weed establishment opportunities.
In the present study, increases in weed diversity or evenness did not consistently correspond to improved crop biomass, as crop performance appeared to be more strongly influenced by total weed biomass and crop competitive ability. This suggests that diversity indices alone may have limited value in predicting short-term agronomic outcomes in field conditions. From a practical perspective, trade-offs may exist among weed diversity, weed suppression, and crop productivity. More even weed communities may reduce the dominance of highly competitive weed species and potentially contribute to greater long-term ecological stability. However, these communities may still compete with crops for resources.
Repeated use of competitive and well-adapted mixtures may improve ground cover consistency, resource capture, and longer-term weed suppression, while also supporting soil structure and nutrient cycling, mainly in diverse systems including legumes. However, year-to-year environmental variability and shifts in weed community composition and seedbank dynamics may alter crop–weed interactions and reduce the predictability of mixture performance over time. Therefore, although repeated use of crop stands may enhance management efficiency and system stability, their long-term effectiveness should be assessed under multi-year conditions, especially given the short-term nature of this study.

5. Conclusions

In conclusion, this study supports that crop stand, crop growth stage, and growing season conditions strongly influence weed suppression through their effects on weed diversity, evenness, and biomass. Pure oats consistently provided the strongest weed suppression due to rapid early growth, high leaf area, and allelopathic effects, competitive canopy development, highlighting its superior performance as a sole crop for weed control. The 33% crop mixture promoted higher weed species diversity and evenness, indicating a more balanced weed community compared with pure stands. Mixed cropping systems reduced weed biomass relative to pure pea and camelina by combining complementary crop traits, although their suppressive ability remained lower than that of pure oats. These results indicate a trade-off between maximizing weed suppression in pure oat stands and promoting greater weed community diversity and evenness in crop mixtures under organic conditions.

Author Contributions

Conceptualization P.S.A.M., L.A. and A.S., funding acquisition P.S.A.M., L.A. and A.S., investigation P.S.A.M., C.X., I.K., S.S. and S.J. methodology P.S.A.M., L.A., A.S. and C.X., project administration P.S.A.M., resources; supervision P.S.A.M., L.A. and A.S., data curation S.S., formal analysis S.S., visualization S.S., writing of original draft S.S., writing, review, and editing P.S.A.M., L.A., A.S., C.X., I.K. and S.J. All authors have read and agreed to the published version of the manuscript.

Funding

This work was supported by the CORE Organic Cofund 2021–2024 project DIVERSILIENCE, national grant number VN/22878/2021, and Hämeen rahasto Kärkihanke 15222030.

Data Availability Statement

The data supporting the findings of this article will be made available by the authors on request.

Acknowledgments

The authors thank Markku Tykkyläinen, Chandima Ekanayake, Ville Ikäheimo, Perttu Järvinen, Estelle Levallois, Zhiyuan Teng, and Jenni Uusitupa for all their assistance. Markus Eerola is thanked for providing and preparing the fields for the experiments.

Conflicts of Interest

The authors declare no conflicts of interest.

References

  1. Singh, G.; Dhakal, M.; Yang, L.; Kaur, G.; Williard, K.W.; Schoonover, J.E.; Sadeghpour, A. Decomposition and nitrogen release of cover crops in reduced- and no-tillage systems. Agron. J. 2020, 112, 3605–3618. [Google Scholar] [CrossRef]
  2. Reddy, C. A study on crop weed competition in field crops. J. Pharmacogn. Phytochem. 2018, 7, 3235–3240. [Google Scholar]
  3. Liebman, M.; Davis, A.S. Managing weeds in organic farming systems: An ecological approach. In Organic Farming: The Ecological System; Francis, C., Ed.; American Society of Agronomy: Madison, WI, USA, 2009; pp. 173–195. [Google Scholar]
  4. McErlich, A.F.; Boydston, R.A. Current state of weed management in organic and conventional cropping systems. In Automation: The Future of Weed Control in Cropping Systems; Young, S.L., Pierce, F.J., Eds.; Springer: Dordrecht, The Netherlands, 2014; pp. 11–32. [Google Scholar] [CrossRef]
  5. Saucke, H.; Ackermann, K. Weed suppression in mixed cropped grain peas and false flax (Camelina sativa). Weed Res. 2006, 46, 453–461. [Google Scholar] [CrossRef]
  6. Schappert, A.; Schumacher, M.; Gerhards, R. Weed control ability of single sown cover crops compared to species mixtures. Agronomy 2019, 9, 294. [Google Scholar] [CrossRef]
  7. Lebreton, P.; Bedoussac, L.; Bonnet, C.; Journet, E.; Justes, E.; Colbach, N. Optimal species proportions, traits and sowing patterns for agroecological weed management in legume–cereal intercrops. Eur. J. Agron. 2024, 159, 127266. [Google Scholar] [CrossRef]
  8. Malaspina, M.; Chantre, G.; Yanniccari, M. Effect of cover crops mixtures on weed suppression capacity in a dry sub-humid environment of Argentina. Front. Agron. 2024, 5, 1330073. [Google Scholar] [CrossRef]
  9. Baraibar, B.; Hunter, M.; Schipanski, M.; Hamilton, A.; Mortensen, D. Weed Suppression in Cover Crop Monocultures and Mixtures. Weed Sci. 2017, 66, 121–133. [Google Scholar] [CrossRef]
  10. Rempelos, L.; Wang, J.; Sufar, E.; Almuayrifi, M.; Knutt, D.; Leifert, H.; Leifert, A.; Wilkinson, A.; Shotton, P.; Hasanaliyeva, G.; et al. Breeding Bread-Making Wheat Varieties for Organic Farming Systems: The Need to Target Productivity, Robustness, Resource Use Efficiency and Grain Quality Traits. Foods 2023, 12, 1209. [Google Scholar] [CrossRef]
  11. Lebourgeois, F.; Gómez, N.; Pinto, P.; Mérian, P. Mixed stands reduce Abies alba tree-ring sensitivity to summer drought in the Vosges Mountains, western Europe. For. Ecol. Manag. 2013, 303, 61–71. [Google Scholar] [CrossRef]
  12. Silva, G.C.; Bagavathiannan, M. Mechanisms of weed suppression by cereal rye cover crop: A review. Agron. J. 2023, 115, 1571–1585. [Google Scholar] [CrossRef]
  13. Dayoub, E.; Piva, G.; Shirtliffe, S.; Fustec, J.; Corre-Hellou, G.; Naudin, C. Species choice influences weed suppression, N sharing and crop productivity in oilseed rape–legume intercrops. Agronomy 2022, 12, 2187. [Google Scholar] [CrossRef]
  14. Scavo, A.; Mauromicale, G. Integrated weed management in herbaceous field crops. Agronomy 2020, 10, 466. [Google Scholar] [CrossRef]
  15. Cléments, D.R.; Weise, S.F.; Swanton, C.J. Integrated weed management and weed species diversity. Phytoprotection 1994, 75, 1–18. [Google Scholar] [CrossRef]
  16. Travlos, I.S.; Cheimona, N.; Roussis, I.; Bilalis, D.J. Weed-species abundance and diversity indices in relation to tillage systems and fertilization. Front. Environ. Sci. 2018, 6, 11. [Google Scholar] [CrossRef]
  17. Adeux, G.; Vieren, E.; Carlesi, S.; Bàrberi, P.; Munier-Jolain, N.; Cordeau, S. Mitigating crop yield losses through weed diversity. Nat. Sustain. 2019, 2, 1018–1026. [Google Scholar] [CrossRef]
  18. Koocheki, A.; Nassiri, M.; Alimoradi, L.; Ghorbani, R. Effect of cropping systems and crop rotations on weeds. Agron. Sustain. Dev. 2009, 29, 401–408. [Google Scholar] [CrossRef]
  19. Légère, A.; Stevenson, F.; Benoit, D. Diversity and assembly of weed communities: Contrasting responses across cropping systems. Weed Res. 2005, 45, 303–315. [Google Scholar] [CrossRef]
  20. Esposito, M.; Westbrook, A.; Maggio, A.; Cirillo, V.; DiTommaso, A. Neutral weed communities: The intersection between crop productivity, biodiversity, and weed ecosystem services. Weed Sci. 2023, 71, 301–311. [Google Scholar] [CrossRef]
  21. FMI. Vuosi 2023—Ilmatieteen Laitos. Available online: https://www.ilmatieteenlaitos.fi/vuosi-2023 (accessed on 24 August 2025).
  22. Zadoks, J.C.; Chang, T.T.; Konzak, C.F. A decimal code for the growth stages of cereals. Weed Res. 1974, 14, 415–421. [Google Scholar] [CrossRef]
  23. Knott, C. A key for stages of development of the pea (Pisum sativum). Ann. Appl. Biol. 1987, 111, 233–245. [Google Scholar] [CrossRef]
  24. Martinelli, T.; Galasso, I. Phenological growth stages of Camelina sativa according to the extended BBCH scale. Ann. Appl. Biol. 2011, 158, 87–94. [Google Scholar] [CrossRef]
  25. Shannon, C.E.; Weaver, W. The Mathematical Theory of Communication; University of Illinois Press: Urbana, IL, USA, 1998. [Google Scholar]
  26. Thukral, A.K.; Bhardwaj, R.; Kumar, V.; Sharma, A. New indices regarding the dominance and diversity of communities, derived from sample variance and standard deviation. Heliyon 2019, 5, e02606, Corrigendum in Heliyon 2019, 5, e03017. https://doi.org/10.1016/j.heliyon.2019.e03017. [Google Scholar] [CrossRef]
  27. Fradgley, N.S.; Creissen, H.E.; Pearce, H.; Howlett, S.A.; Pearce, B.D.; Döring, T.F.; Girling, R.D. Weed suppression and tolerance in winter oats. Weed Technol. 2017, 31, 740–751. [Google Scholar] [CrossRef]
  28. Seavers, G.; Wright, K. Crop canopy development and structure influence weed suppression. Weed Res. 1999, 39, 319–328. [Google Scholar] [CrossRef]
  29. Teixeira, E.; George, M.; Johnston, P.; Malcolm, B.; Liu, J.; Ward, R.; Brown, H.; Cichota, R.; Kersebaum, K.; Richards, K.; et al. Phenotyping early-vigour in oat cover crops to assess plant-trait effects across environments. Field Crops Res. 2023, 291, 108781. [Google Scholar] [CrossRef]
  30. Ranaldo, M.; Carlesi, S.; Costanzo, A.; Bàrberi, P. Functional diversity of cover crop mixtures enhances biomass yield and weed suppression in a Mediterranean agroecosystem. Weed Res. 2020, 60, 391–403. [Google Scholar] [CrossRef]
  31. Jernigan, A.; Caldwell, B.; Cordeau, S.; DiTommaso, A.; Drinkwater, L.; Mohler, C.; Ryan, M. Weed abundance and community composition following a long-term organic vegetable cropping systems experiment. Weed Sci. 2017, 65, 639–649. [Google Scholar] [CrossRef]
  32. Santos, D.D.; Joner, F.; Teleginski, M.; Lucas, R.R.; Siddique, I. Crop functional redundancy is as important as crop functional diversity in weed suppression during early agroforest succession. Weed Res. 2025, 65, e70021. [Google Scholar] [CrossRef]
  33. Wacławowicz, R.; Giemza, M.; Pytlarz, E.; Wenda-Piesik, A. The impact of cultivation systems on weed suppression and the canopy architecture of spring barley. Agriculture 2023, 13, 1747. [Google Scholar] [CrossRef]
  34. Mwendwa, J.; Brown, W.; Weidenhamer, J.; Weston, P.; Quinn, J.; Wu, H.; Weston, L. Evaluation of commercial wheat cultivars for canopy architecture, early vigour, weed suppression, and yield. Agronomy 2020, 10, 983. [Google Scholar] [CrossRef]
  35. Jha, P.; Kumar, V.; Godara, R.; Chauhan, B. Weed management using crop competition in the United States: A review. Crop Prot. 2017, 95, 31–37. [Google Scholar] [CrossRef]
  36. Isaac, W.A.P. Contribution of Crop Morphological Characteristics and Density of Selected Crops to Weed Species Composition and Suppression. Master’s Thesis, Lincoln University, Canterbury, New Zealand, 2001. [Google Scholar]
  37. Fargione, J.E. Biodiversity and community structure in a tallgrass prairie: Consequences of resource competition in space and time. Ph.D. Thesis, University of Minnesota, Minnesota, MN, USA, 2004. [Google Scholar]
  38. Hitchmough, J. Naturalistic herbaceous vegetation for urban landscapes. In The Dynamic Landscape; Taylor & Francis: Abingdon, UK, 2004; pp. 172–245. [Google Scholar]
  39. Pagani, E.; Zanetti, F.; Ferioli, F.; Facciolla, E.; Monti, A. Camelina intercropping with pulses: A sustainable approach for land competition between food and non-food crops. Agronomy 2024, 14, 1200. [Google Scholar] [CrossRef]
  40. Pascual, N.C.; Torra, J.; Baraibar, B.; Royo-Esnal, A. Spring sown camelina (Camelina sativa) contributes to the management of three summer weeds. Ital. J. Agron. 2024, 19, 2211. [Google Scholar] [CrossRef]
  41. Ghidoli, M.; Pesenti, M.; Colombo, F.; Nocito, F.; Pilu, R.; Araniti, F. Camelina sativa (L.) Crantz as a promising cover crop species with allelopathic potential. Agronomy 2023, 13, 2187. [Google Scholar] [CrossRef]
  42. Gebru, H. A review on the comparative advantages of intercropping to mono-cropping system. J. Biol. Agric. Healthc. 2015, 5, 1–13. [Google Scholar]
  43. Malézieux, E.; Crozat, Y.; Dupraz, C.; Laurans, M.; Makowski, D.; Ozier-Lafontaine, H.; Rapidel, B.; de Tourdonnet, S.; Valantin-Morison, M. Mixing plant species in cropping systems: Concepts, tools and models. A review. Agron. Sustain. Dev. 2009, 29, 43–62. [Google Scholar] [CrossRef]
  44. Ahmadnia, F.; Ebadi, A.; Alebrahim, M.; Hashemi, M. Impact of monoculture and various ratios of intercropped oats and daikon radish cover crops on soil properties, weed suppression, and spinach yield. Agriculture 2025, 15, 2002. [Google Scholar] [CrossRef]
  45. Tang, W.; Li, Z.; Guo, H.; Chen, B.; Wang, T.; Miao, F.; Yang, C.; Xiong, W.; Sun, J. Annual weed suppression and oat forage yield responses to crop density management in an oat-cultivated grassland: A case study in eastern China. Agronomy 2024, 14, 583. [Google Scholar] [CrossRef]
  46. Gecaitė, V.; Arlauskienė, A.; Cesevičienė, J. Competition effects and productivity in oat–forage legume relay intercropping systems under organic farming conditions. Agriculture 2021, 11, 99. [Google Scholar] [CrossRef]
  47. Barsila, S.; Acharya, S.; Acharya, P. Herbage mass productivity, composition, and biological compatibility of oat and vetch mixture at different seed rate proportions in abandoned lands. Int. J. Agron. 2024, 2024, 5560158. [Google Scholar] [CrossRef]
  48. Helenius, J.; Jokinen, K. Yield advantage and competition in intercropped oats (Avena sativa L.) and faba bean (Vicia faba L.): Application of the hyperbolic yield-density model. Field Crops Res. 1994, 37, 85–94. [Google Scholar] [CrossRef]
  49. Connolly, J.; Sebastià, M.T.; Kirwan, L.; Finn, J.A.; Llurba, R.; Suter, M.; Collins, R.P.; Porqueddu, C.; Helgadóttir, Á.; Baadshaug, O.H. Weed suppression greatly increased by plant diversity in intensively managed grasslands: A continental-scale experiment. J. Appl. Ecol. 2018, 55, 852–862. [Google Scholar] [CrossRef]
  50. Florence, A.; McGuire, A. Do diverse cover crop mixtures perform better than monocultures? A systematic review. Agron. J. 2020, 112, 3513–3534. [Google Scholar] [CrossRef]
  51. Liebman, M.; Dyck, E. Crop rotation and intercropping strategies for weed management. Ecol. Appl. 1993, 3, 92–122. [Google Scholar] [CrossRef]
  52. Mahoney, K.; Swanton, C. Nitrogen and light affect the adaptive traits of common lambsquarters (Chenopodium album). Weed Sci. 2008, 56, 81–90. [Google Scholar] [CrossRef]
  53. Sage, R.; Pearcy, R. The nitrogen use efficiency of C3 and C4 plants: I. leaf nitrogen, growth, and biomass partitioning in Chenopodium album (L.) and Amaranthus retroflexus (L.). Plant Physiol. 1987, 84, 954–958. [Google Scholar] [CrossRef]
  54. Warren, N.; Hobbie, E.; Chen, J.; Smith, R. Relative uptake of organic and inorganic nitrogen by common weed species. Weed Sci. 2023, 71, 470–477. [Google Scholar] [CrossRef]
  55. Jäck, O.; Ajal, J.; Weih, M. Altered nitrogen availability in pea–barley sole- and intercrops changes dominance of two nitrophilic weed species. Agronomy 2021, 11, 679. [Google Scholar] [CrossRef]
  56. Oono, J.; Hatakeyama, Y.; Yabiku, T.; Ueno, O. Effects of growth temperature and nitrogen nutrition on expression of C3–C4 intermediate traits in Chenopodium album. J. Plant Res. 2021, 135, 15–27. [Google Scholar] [CrossRef]
  57. Halwas, S.; Worley, A.C. Incorporating Chenopodium berlandieri into a seasonal subsistence pattern: Implications of biological traits for cultural choices. J. Ethnobiol. 2019, 39, 510–529. [Google Scholar] [CrossRef]
  58. Brooker, R.; George, T.; Homulle, Z.; Karley, A.; Newton, A.; Pakeman, R.; Schöb, C. Facilitation and biodiversity–ecosystem function relationships in crop production systems and their role in sustainable farming. J. Ecol. 2021, 109, 2054–2067. [Google Scholar] [CrossRef]
  59. Santos, D.; Joner, F.; Shipley, B.; Teleginski, M.; Lucas, R.R.; Siddique, I. Crop functional diversity drives multiple ecosystem functions during early agroforestry succession. J. Appl. Ecol. 2021, 58, 2356–2367. [Google Scholar] [CrossRef]
  60. Drost, S.; Rutgers, M.; Wouterse, M.; Boer, W.; Bodelier, P. Decomposition of mixtures of cover crop residues increases microbial functional diversity. Geoderma 2020, 361, 114060. [Google Scholar] [CrossRef]
  61. Nyfeler, D.; Huguenin-Elie, O.; Suter, M.; Frossard, E.; Connolly, J.; Lüscher, A. Strong mixture effects among four species in fertilized agricultural grassland led to persistent and consistent transgressive overyielding. J. Appl. Ecol. 2009, 46, 683–691. [Google Scholar] [CrossRef]
  62. Doucet, C.; Weaver, S.E.; Hamill, A.S.; Zhang, J. Separating the effects of crop rotation from weed management on weed density and diversity. Weed Sci. 1999, 47, 729–735. [Google Scholar] [CrossRef]
  63. Hyvönen, T.; Salonen, J. Weed species diversity and community composition in cropping practices at two intensity levels—A six-year experiment. Plant Ecol. 2002, 159, 73–81. [Google Scholar] [CrossRef]
  64. Sanderson, M.A.; Brink, G.; Ruth, L.; Stout, R. Grass–legume mixtures suppress weeds during establishment better than monocultures. Agron. J. 2012, 104, 36–42. [Google Scholar] [CrossRef]
  65. Lisek, J. Diversity of summer weed communities in response to different plum orchard floor management in-row. Agronomy 2023, 13, 1421. [Google Scholar] [CrossRef]
  66. Anyoni, O.G.; Ekwangu, J.; Tumwebaze, S.; Obia, A. Minimum tillage and soil surface cover reduced weed density but not diversity over four growing cycles. East Afr. J. Agric. Biotechnol. 2024, 7, 39–58. [Google Scholar] [CrossRef]
  67. Zingsheim, M.; Döring, T. Does weed diversity mitigate yield losses? Front. Plant Sci. 2024, 15, 1395393. [Google Scholar] [CrossRef]
  68. Datta, A.; Ullah, H.; Tursun, N.; Pornprom, T.; Knezevic, S.; Chauhan, B. Managing weeds using crop competition in soybean [Glycine max (L.) Merr.]. Crop Prot. 2017, 95, 60–68. [Google Scholar] [CrossRef]
  69. Kaur, S.; Kaur, R.; Chauhan, B. Understanding crop–weed–fertilizer–water interactions and their implications for weed management in agricultural systems. Crop Prot. 2018, 103, 65–72. [Google Scholar] [CrossRef]
  70. Holt, J.S. Plant responses to light: A potential tool for weed management. Weed Sci. 1995, 43, 474–482. [Google Scholar] [CrossRef]
  71. Colbach, N.; Gardarin, A.; Moreau, D. The response of weed and crop species to shading: Which parameters explain weed impacts on crop production? Field Crops Res. 2019, 238, 45–55. [Google Scholar] [CrossRef]
  72. Bastiaans, L.; Kropff, M.J.; Goudriaan, J.; van Laar, H.H. Design of weed management systems with a reduced reliance on herbicides poses new challenges and prerequisites for modeling crop–weed interactions. Field Crops Res. 2000, 67, 161–179. [Google Scholar] [CrossRef]
  73. Grant, R.H.; Heisler, G.M. Obscured overcast sky radiance distributions for ultraviolet and photosynthetically active radiation. J. Appl. Meteorol. 1997, 36, 1336–1345. [Google Scholar] [CrossRef]
  74. Gibson, D.J.; Young, B.G.; Wood, A.J. Can weeds enhance profitability? Integrating ecological concepts to address crop–weed competition and yield quality. J. Ecol. 2017, 105, 900–904. [Google Scholar] [CrossRef]
  75. Liebman, M.; Mohler, C.L.; Staver, C.P. Ecological Management of Agricultural Weeds; Cambridge University Press: Cambridge, UK, 2001. [Google Scholar]
  76. Corre-Hellou, G.; Dibet, A.; Hauggaard-Nielsen, H.; Crozat, Y.; Gooding, M.; Ambus, P.; Dahlmann, C.; von Fragstein, P.; Pristeri, A.; Monti, M.; et al. The competitive ability of pea–barley intercrops against weeds and the interactions with crop productivity and soil N availability. Field Crops Res. 2011, 122, 264–272. [Google Scholar] [CrossRef]
  77. Poggio, S.L.; Ghersa, C.M. Species richness and evenness as a function of biomass in arable plant communities. Weed Res. 2011, 51, 241–249. [Google Scholar] [CrossRef]
  78. Brooker, R.; Pakeman, R.; Hewison, R.; Mitchell, C.; Newton, A.; Neilson, R.; Raubach, S.; Shaw, P.; Verrall, S.; Karley, A. Crop mixtures: Yield responses to climate and management and impacts on seed and soil chemical composition in a Scottish-based study. Plant Soil 2024, 1–19. [Google Scholar] [CrossRef]
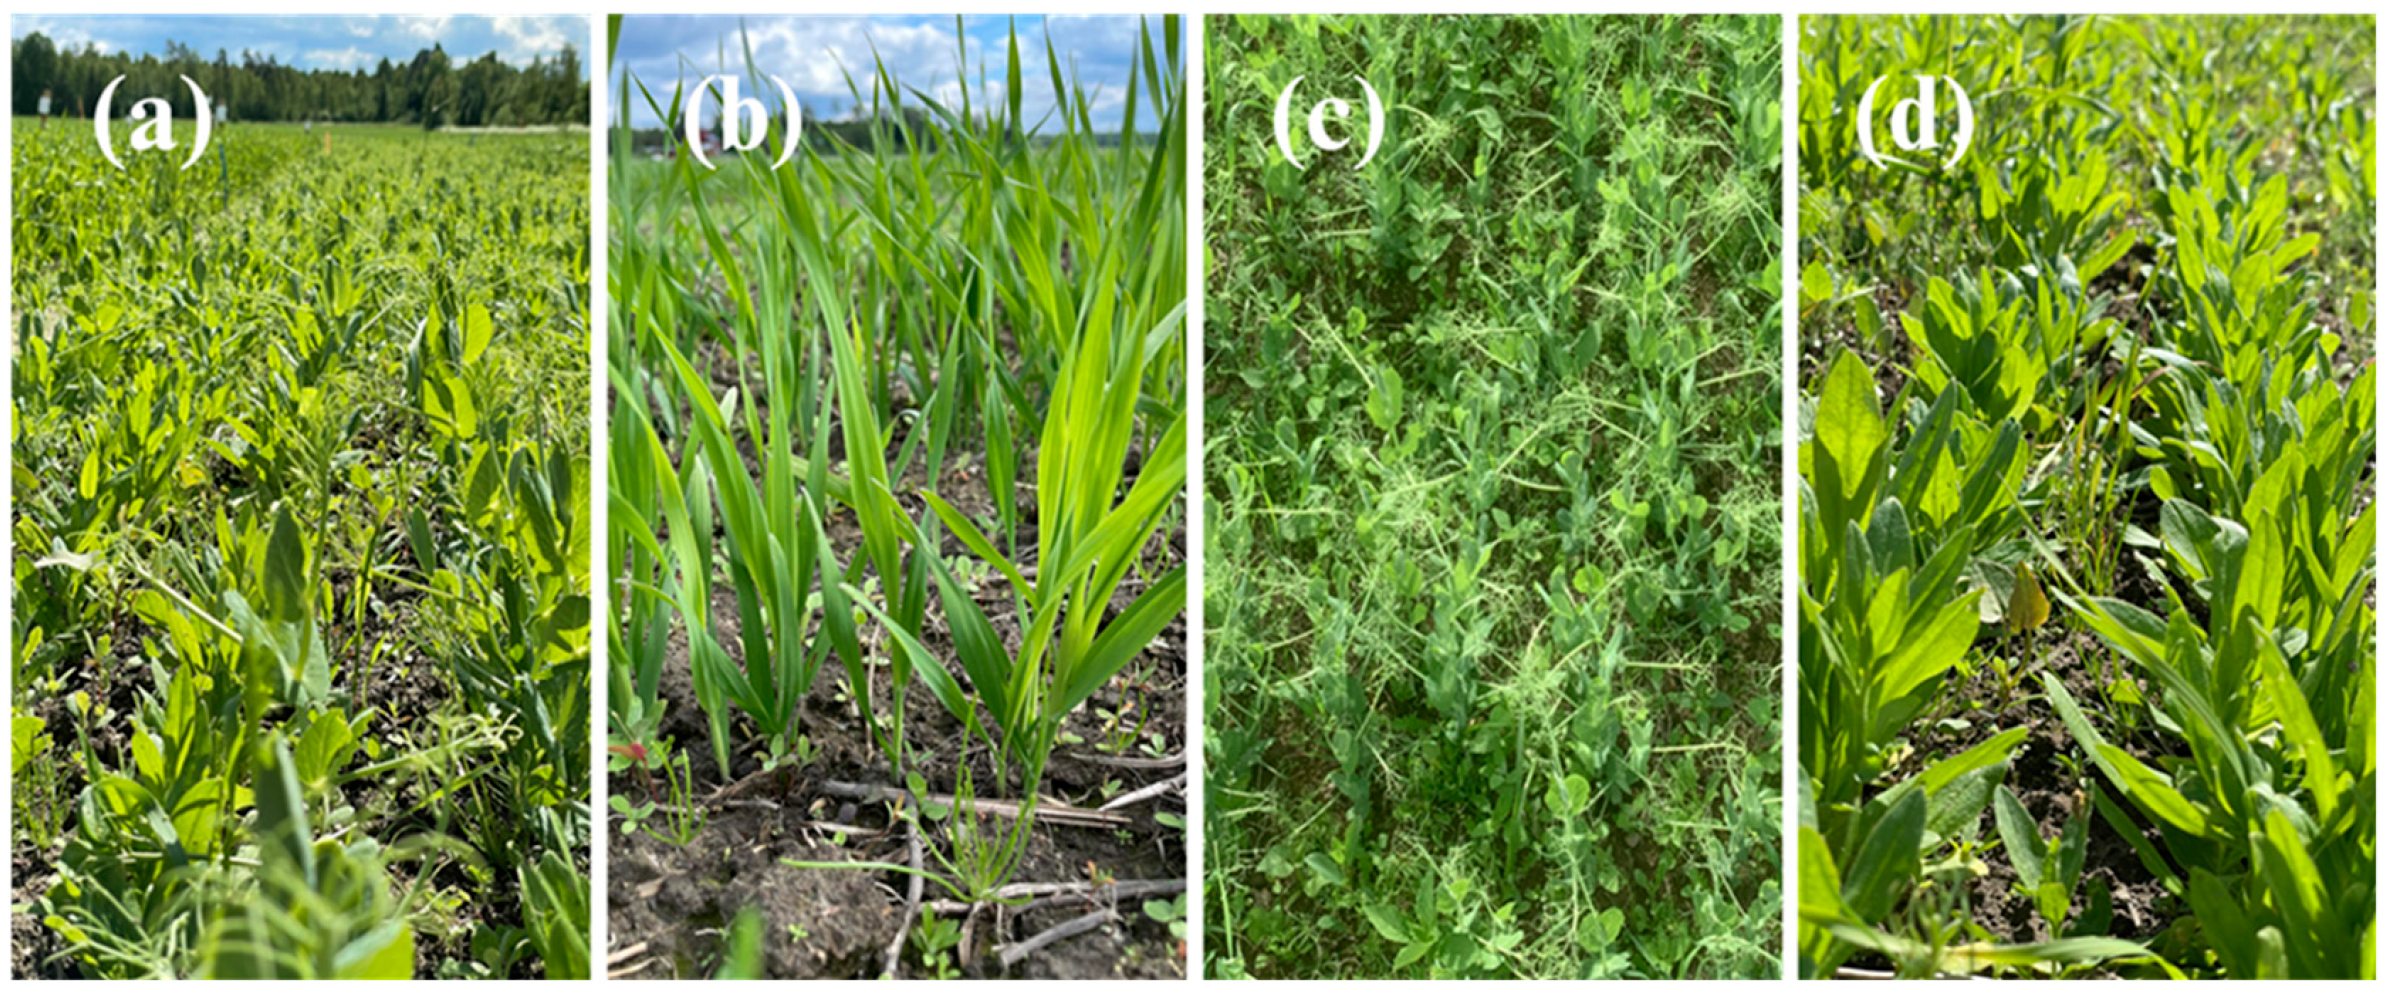
Figure 1. Weeds in (a) the 33% mix of oats, pea, and camelina, (b) 100% oat, (c) 100% pea, and (d) 100% camelina in the 2022 field experiment in Hyvinkää, Finland.
Agronomy 16 01125 g001
Figure 2. Weed species distribution in pure stands of oats, pea, and camelina, and their three-crop mixtures, from field experiments conducted in Hyvinkää, Finland, in (a) 2022 and (b) 2023. Line directions indicate the weed species associated with each crop stand. Colors indicate crop stands: red = 50% mixture, blue = 33% mixture, green = 100% oat, brown = 100% pea, and purple = 100% camelina.
Agronomy 16 01125 g002
Figure 3. The effect of pure stands and mixed stands of oats, pea, and camelina and sampling time on weed species diversity indices (a) species richness in 2022, (b) species richness in 2023, (c) Shannon-Wiener diversity index in 2022, and (d) Shannon-Wiener diversity index in 2023 in field experiments in Hyvinkää, Finland. Error bars represent the standard errors of the mean. Data shown are means, n = 4.
Agronomy 16 01125 g003
Figure 4. The effect of pure stands and mixed stands of oats, pea, and camelina and sampling time on weed species diversity indices (a) species evenness in 2022, (b) species evenness in 2023, (c) species dominance in 2022, and (d) species dominance in 2023 in field experiments in Hyvinkää, Finland. Error bars represent the standard errors of the mean. Data shown are means, n = 4.
Agronomy 16 01125 g004
Figure 5. Relationship between weed biomass and crop biomass in (a) 2022 and (b) 2023 in pure stands and mixed stands of oats, pea, and camelina in field experiments in Hyvinkää, Finland.
Agronomy 16 01125 g005
Figure 6. Relationships between crop biomass and weed evenness in (a) 2022 and (b) 2023, and weed biomass and weed evenness in (c) 2022 and (d) 2023 in field experiments in Hyvinkää, Finland. Lines in the relationships between evenness and crop and weed biomass represent a linear fit for each sampling time.
Agronomy 16 01125 g006
Table 1. Monthly mean temperature (T) and precipitation (P) during the growing period in May–September in 2022 and 2023 in the field experiment site in Hyvinkää, along with the long-term means from 1991 to 2020 in Hyvinkää (Hyvinkäänkylä (60°59′ N, 24°92′ E)), Finland [21].
Temperature, °CPrecipitation, mm
Month202220231991–2020202220231991–2020
May13.113.210.2391640
June17.717.014.5334665
July18.216.817.3559270
August18.616.715.54422575
September8.614.310.5377254
Table 2. Target seeding densities of pure stands and corresponding proportional contributions in the 33:33:33% mixture. This mixture is presented as a representative example to illustrate how mixture seeding densities were derived from pure crop stands.
Crop
Species
Pure Stand Seeding Density
(seeds m−2)
Proportion in 33:33:33 Mixture (%)Target Seeding Density in the Mixture (seeds m−2)
Camelina60033198
Oats50033165
Pea1203340
Table 3. Plant sampling times (days after seeding, DAS) and the corresponding growth stages of crops in the field experiments in 2022 and 2023 in Hyvinkää, Finland, based on Zadok’s scale [22] for oats, Knott’s scale [23] for pea, and extended BBCH scale [24] for camelina. Sampling time labels represent approximately equivalent developmental stages across species.
20222023
DASOatsPeaCamelinaDASOatsPeaCamelina
Tillering2713131424121115
Stem elongation4343393138323724
Flowering5461655152596063
Grain filling7173797166717681
Yellow maturity9992878797918488
Table 4. Results of the three-way ANOVA test with F values, partial η2 effect sizes (η2p), and significance levels (p values) for weed density, weed biomass, and weed diversity indices, significance level p < 0.05.
Weed
Density
Weed
Biomass
Species
Richness
Shannon
Index
Evenness Dominance
Fη2pp ValueFη2pp ValueFη2pp ValueFη2pp ValueFη2pp ValueFη2pp Value
Year (Y)24.130.573<0.00138.410.681<0.00178.360.975<0.001326.90.948<0.0012.170.1080.1430.5280.2090.543
Sampling time (T)2.80.427<0.00113.710.785<0.00128.790.885<0.00131.260.893<0.0011.540.2910.1950.240.0600.402
Crop stand (CS)4.940.5680.02540.340.915<0.0011.130.2320.3440.640.1460.6333.920.5110.00522.90.8590.017
Y × CS0.380.0920.8243.810.5040.0060.90.1940.4680.280.0690.8760.810.1770.520.150.0380.104
Y × T5.730.604<0.00114.970.800<0.00131.240.893<0.00119.090.836<0.0014.390.5390.0061.220.2450.362
CS × T0.280.0690.9974.510.546<0.0010.90.1940.571.20.2420.280.390.0940.9830.870.1880.093
Y × CS × T0.230.0580.9973.010.445<0.0010.690.1550.7560.660.1490.7840.720.1610.7280.470.1110.041
Disclaimer/Publisher’s Note: The statements, opinions and data contained in all publications are solely those of the individual author(s) and contributor(s) and not of MDPI and/or the editor(s). MDPI and/or the editor(s) disclaim responsibility for any injury to people or property resulting from any ideas, methods, instructions or products referred to in the content.