Article

Genetic Diversity Analysis of American Ginseng (Panax quinquefolius L.) Accessions Based on Phenotypic Traits and SSR Markers

1
College of Chinese Medicinal Materials, Jilin Agricultural University, Changchun 130118, China
2
Jilin Shenwang Plant Protection Technology Co., Ltd., Baishan 134505, China
3
National & Local Joint Engineering Research Centre for Ginseng Breeding and Development, Changchun 130118, China
4
Department of Biology, University of British Columbia, Okanagan, Kelowna, BC V1V 1V7, Canada
5
Faculty of Agronomy, Jilin Agricultural University, Changchun 130118, China
*
Authors to whom correspondence should be addressed.
Agronomy 2026, 16(11), 1098; https://doi.org/10.3390/agronomy16111098
Submission received: 16 April 2026 / Revised: 25 May 2026 / Accepted: 28 May 2026 / Published: 31 May 2026

Abstract

American ginseng (Panax quinquefolius L.) is an important medicinal crop, but its improvement in China is limited by variety degeneration and a shortage of elite cultivars. In this study, phenotypic traits and simple sequence repeat (SSR) markers were integrated to evaluate the genetic diversity of 51 selected accessions from major Chinese production regions. Phenotypic analysis showed that five of the 18 quantitative traits had phenotypic coefficients of variation exceeding 40%, mainly involving root traits such as fresh root weight and lateral root number. Broad-sense heritability for these root traits ranged from 61.70% to 74.80%, indicating substantial genetic contribution under standardized conditions. Principal component analysis identified five candidate elite accessions: CY3 and KD1 for tall stature and high yield, DH1 and LH2 for high ginsenoside content, and AT1 for well-developed lateral roots. A 12-accession representative subset was further proposed for conservation and pre-breeding. SSR-based clustering showed weak geographic differentiation, and Mantel analysis revealed no significant correlation between phenotypic and SSR-based genetic distances. These materials, together with the proposed accession-level conservation strategy, provide useful resources for germplasm preservation, parental selection, QTL mapping, and marker-assisted breeding.

1. Introduction

American ginseng (Panax quinquefolius L.), a perennial herbaceous medicinal plant of the family Araliaceae native to North America, is globally renowned for its potent bioactive properties and nutritional benefits. It produces diverse secondary metabolites, primarily tetracyclic triterpenoid saponins (ginsenosides), along with polysaccharides, polyacetylenes, amino acids, and volatile oils. These phytochemicals contribute to its pharmacological effects, including immunomodulation, anti-fatigue effects, anti-aging properties, and metabolic regulatory activities [1]. In Traditional Chinese Medicine (TCM), American ginseng is classified as a “Yin-nourishing” and “Qi-tonifying” herb, contrasting with the “heating” nature of Panax ginseng, and is used to alleviate fatigue and restore physiological balance [2].
Driven by these attributes, P. quinquefolius has evolved into a high-value economic commodity with expanding applications in functional foods, nutraceuticals, and cosmetics [3]. Global cultivation is concentrated in China, Canada, and the United States. Although China is the largest producer and consumer, with an annual output of approximately 3667 tonnes, domestic supply remains insufficient, requiring substantial imports from Canada and the United States [4,5]. However, expanding global production to close this market deficit is becoming increasingly difficult. On the supply side, wild P. quinquefolius populations are depleted and protected under the Convention on International Trade in Endangered Species (CITES), shifting reliance entirely to cultivated sources [6]. Unfortunately, cultivation is severely constrained by biological limitations. The species requires strict geo-environmental conditions (cool, shaded climates, and organic-rich soil) and has a lengthy growth cycle (3–4 years). Furthermore, it suffers from severe continuous cropping obstacles (replant disease), which render land unsuitable for replanting for decades, effectively making suitable arable land a non-renewable resource in the short term [7]. This mounting environmental and spatial pressure on cultivation highlights an urgent need for robust, resilient, and high-yielding cultivars to maximize land utilization efficiency.
Yet, germplasm improvement has lagged behind the expansion of cultivation scale. Since its successful introduction from North America in the 1980s, major cultivation bases have been established in provinces such as Jilin, Shandong, and Liaoning [8]. While Canada has developed varieties based on ginsenoside and sucrose levels, these are often not fully aligned with China’s distinct ecological environments and domestic market preferences for specific root morphologies. Consequently, China’s industry relies heavily on landraces with unclear genetic backgrounds [9]. To date, officially registered cultivars remain scarce in China, with Jilin Province being a primary contributor of varieties based on phenotypic characteristics, notably ‘Zhongnongyangshen No. 1’ (ZNYS-1), ‘Jinongyangshen No. 1’ (JNYS-1), and ‘Zhongnongyangshen No. 2’ (ZNYS-2) [10]. However, long-term unregulated introduction and the lack of standardized accessions management have led to serious issues, including germplasm homogenization, genetic degradation, and unstable root quality [11]. These issues not only reduce the economic value of the crop but also escalate the risk of genetic diversity loss, which is a core limiting factor in breeding high-yielding and stress-resistant varieties [12].
Given these challenges, characterizing genetic diversity in P. quinquefolius is fundamental to deciphering the hereditary architecture of complex agronomic traits, thereby enabling the strategic selection of superior accessions. Traditional diversity assessments for this species rely primarily on morphological traits, which are intuitive and cost-effective [13]. For instance, Abaya et al. [14] assessed phenotypic traits of P. quinquefolius in Ontario, Canada. However, morphological traits are strongly influenced by environmental plasticity, often resulting in limited discriminatory power among closely related accessions. To address these limitations, molecular markers have been widely adopted. Among them, Simple Sequence Repeat (SSR) markers are favored for their codominance, high reproducibility, and genome-wide coverage [15,16,17]. While SSRs have been utilized for species identification in the Panax genus [18,19], comprehensive genome-wide SSR studies specifically focused on the genetic diversity of P. quinquefolius accessions in China remain scarce.
Against this backdrop, this study seeks to bridge the gap between phenotypic variability and genomic diversity to support the genetic improvement of American ginseng. By comprehensively evaluating 51 selected P. quinquefolius accessions from all major Chinese production regions based on 28 integrated agronomic traits and novel genome-wide SSR markers, we identified superior breeding resources and clarified the genetic relationships among accessions. This integrated phenotypic–genomic analysis provides the first systematic profile of selected American ginseng accessions in China, offering a robust framework for germplasm identification and sustainable breeding.

2. Materials and Methods

2.1. Plant Material and Field Experiment

A total of 51 selected P. quinquefolius accessions (Table S1), comprising three registered cultivars (‘ZNYS-1’, ‘ZNYS-2’, ‘JNYS-1’) and 48 breeding lines from long-term cultivation sites, were evaluated. The 51 accessions were selected from an original collection of 153 P. quinquefolius accessions using a stratified sampling strategy that considered geographic origin, germplasm type, and phenotypic variation. Specifically, the selected panel was designed to cover all major Chinese production regions, represent the principal resource types maintained in the collection, and include accessions with distinct or extreme performance for major agronomic traits, including plant architecture, phenological traits, root morphology, fresh root weight, and ginsenoside content. This sampling strategy ensured broad representation of the available germplasm resources while retaining materials with potential breeding value. For the subsequent field experiments, all 51 selected accessions were cultivated at the Germplasm Resource Garden of Jilin Agricultural University (Changchun, China; 43°48′ N, 125°25′ E, 220 m a.s.l.) from 2021 to 2024, and all phenotypic evaluations were uniformly conducted on 4-year-old plants during the 2024 growing season. The genetic experimental site features a temperate continental monsoon climate with flat terrain. To minimize soil heterogeneity and ensure uniform seedling establishment, the cultivation substrate was standardized as a 1:1 (v/v) mixture of humus and peat soil. The experiment was arranged in a randomized complete block design (RCBD) with three replications [20,21]. Each plot consisted of five 1.5 m long rows. A standardized planting geometry of 10 cm × 20 cm (intra-row × inter-row) was maintained, ensuring a population of at least 50 plants per accession per plot. Agronomic management was strictly performed in accordance with the standard technical regulations of Jilin Province (DB22/T 1066-2018). Specifically, plants were grown under polyethylene shade nets allowing approximately 20–35% light transmittance. Manual weeding was performed monthly to prevent herbicide damage, and supplementary irrigation was applied during drought periods to maintain soil moisture at 40–50% of field capacity. The collection and experimental research of all Panax quinquefolius accessions were conducted in compliance with relevant institutional and national agricultural guidelines.

2.2. Accession Phenotyping

Twenty-eight agronomic traits were evaluated based on standard morphological descriptors for P. quinquefolius (Table 1). To ensure statistical representativeness, 20 healthy individuals were randomly selected per plot (60 plants per accession). Sampling was initiated at the seedling emergence stage (early May, for 4-year-old plants), where plants in the central rows were indexed and selected using a random number generator, strictly excluding marginal rows to avoid edge effects. These plants were tagged for continuous monitoring. Agronomic trait measurements were anchored to distinct developmental stages: inflorescence-related traits (e.g., IT and IFP) were recorded at the initial flowering stage (mid-June, approximately 40–55 days after emergence); vegetative traits (e.g., SH and LL) were measured during the fruit ripening stage (mid-August, approximately 100–115 days after emergence) when fruit turned fully red; root-related traits (e.g., NLR and TL) and ginsenoside content were quantified at the plant senescence stage (early October, approximately 150 days after emergence), characterized by aerial part withering and maximum root biomass accumulation (Table 1).
Measurement protocols were trait-specific: linear dimensions (e.g., SH, LL, and PL) were measured with a steel ruler (precision: 1 mm), diameters (e.g., SD, RT, and TD) were measured with digital vernier calipers (precision: 0.01 mm), and biomass traits (TSW and FRW) were weighed with an electronic analytical balance (Mettler Toledo, Zurich, Switzerland, precision: 0.01 g). Detailed definitions, including specific measurement loci for quantitative traits and scoring criteria for qualitative traits, are presented in Table 1. Root ginsenoside extraction and quantification followed a previously described protocol [22]. Briefly, dried root samples were ground to a fine powder, homogenized, extracted via ultrasonication in methanol, and analyzed using high-performance liquid chromatography (HPLC, Waters Corporation, Milford, MA, USA) to quantify ginsenosides Rg1, Re, and Rb1.

2.3. Development and Screening of SSR Markers

SSR loci were identified from the published P. quinquefolius genome [23] using Krait v1.5.1 software [24]. Search parameters targeted mono- to hexanucleotide motifs with minimum repeat thresholds of 10, 6, 5, 5, 5, and 5, respectively, and a maximum interval of 100 bp between adjacent loci. Primers were designed using specific constraints: a length of 18–27 bp (optimum 20 bp), a melting temperature (Tm) of 59–61 °C, a GC content of 40–60%, and an expected polymerase chain reaction (PCR) product size of 150–500 bp. Primers were synthesized by Sangon Biotech Co., Ltd., Shanghai, China.
To screen for effective markers, a random subset of 100 primer pairs was tested on five phenotypically diverse selected accessions. While 76 pairs (76%) successfully amplified genomic DNA, only 35 produced clear amplicons, and 12 exhibited polymorphism across the accessions (Table 2). These 12 polymorphic markers were selected for the subsequent genetic diversity analysis. This functional polymorphism rate (12%) aligns with prior reports on polyploid plant systems [25,26], reflecting the inherent genomic complexity of the species.

2.4. DNA Extraction, PCR Amplification and Polyacrylamide Gel Electrophoresis

Genomic DNA was extracted from fresh, young leaves of 4-year-old plants collected during the vigorous vegetative growth stage (late May, approximately 20–30 days after emergence). For each accession, young leaves were collected from three healthy plants, with one plant sampled from each of the three replicate plots, and pooled in equal amounts to form a single accession-level composite sample. This pooling strategy was adopted to capture the genetic profile of each accession while minimizing the influence of variation among individual plants within the accession. All 51 accessions were thus represented by 51 DNA samples for SSR analysis. Samples were processed using the Hi-DNAsecure Plant Kit (Tiangen Biotech Co., Ltd., Beijing, China), and DNA concentration and integrity were assessed using a NanoDrop spectrophotometer (Thermo Fisher Scientific, Waltham, MA, USA) and 1% agarose gel electrophoresis. PCR amplification was performed in 20 µL reactions containing 1 µL of genomic DNA (standardized to 50 ng/µL), 1 µL of each forward and reverse primer (10 µM), 10 µL of 2× PCR Master Mix (Beyotime Biotechnology Co., Ltd., Shanghai, China), and 7 µL of ddH2O. The thermal cycling profile was: initial denaturation at 94 °C for 5 min; 35 cycles of 94 °C for 30 s, primer-specific annealing temperatures (Table 2) for 45 s, and 72 °C for 1 min; followed by a final extension at 72 °C for 10 min. Amplicons were separated on a 6% polyacrylamide gel (180 V, 60 min), visualized via silver nitrate staining, and digitally documented.

2.5. Statistical Data Analysis

All phenotypic data processing and statistical analyses were performed using R software version 4.4.2 (R Foundation for Statistical Computing, Vienna, Austria). Descriptive statistics, including mean, range, and standard deviation, were computed using the psych package. The Shannon–Weaver diversity index (H′) for phenotypic traits was calculated according to the formula:
H   =   i = 1 S P i ln P i ,
where Pi represents the proportion of accessions belonging to category i within the total population, and S denotes the total number of phenotypic categories [27]. To evaluate the genetic potential of the accessions, analysis of variance (ANOVA) was performed based on the RCBD. Variance components were estimated from the expected mean squares following the method of Singh and Chaudhary [28]. Genotypic variance (Vg), phenotypic variance (Vp), and environmental variance (Ve) were derived as follows:
V g   =   ( M S g M S e ) / r ,   V e   =   M S e ,   and   V p   =   V g   +   V e ,
where M S g is the mean square of genotypes, M S e is the mean square of error, and r is the number of replications. Coefficients of variation were calculated to assess the magnitude of variability:
( 1 )   G C V   =   ( V g / X ¯ )   ×   100 ;   ( 2 )   P C V   =   ( V p / X ¯ )   ×   100 ;   ( 3 )   E C V   =   ( V e / X ¯ ) × 100 ,
where X ¯ is the grand mean of the trait [28]. Broad-sense heritability (H2) was computed as H 2   =   ( V g / V p )   ×   100 . Mean separation for quantitative traits was performed using Fisher’s least significant difference (LSD) test at p < 0.05 using the agricolae package. Pairwise Pearson correlation coefficients were calculated and visualized using the corrplot package. Prior to multivariate analysis, phenotypic data were standardized (Z-score normalization) to eliminate dimensional differences. Hierarchical clustering was performed based on Euclidean distance matrices using the unweighted pair group method with arithmetic mean (UPGMA) algorithm. Principal component analysis (PCA) was conducted using the FactoMineR package to reduce dimensionality. Mathematically, PCA transforms the original correlated variables into a new set of uncorrelated variables (principal components) through linear combinations:
Y k = j = 1 p w k j X j ,
where Yk is the k-th principal component, Xj represents the original variables, and wkj are the connection weights (loadings) [29]. To quantify the overall agronomic performance of each accession, a composite score (F) was calculated based on the weighted contribution of the principal components using the following equation [30]:
F = i = 1 m λ i   ×   F i / i = 1 m λ i ,
where F represents the comprehensive evaluation score, m is the number of extracted principal components (eigenvalues > 1.0), λ i is the variance contribution rate (eigenvalue) of the i-th principal component, and F i is the individual score of the accession on the i-th principal component. For SSR genotyping, data were encoded as a binary matrix (1 for presence, 0 for absence). Genetic diversity parameters—including observed alleles (Na), effective alleles (Ne), Nei’s gene diversity (H), and Shannon’s Information Index (I)—were computed using POPGENE32 v1.32 [31]. The polymorphism information content (PIC) was calculated using PowerMarker v3.25 [32] based on the formula:
P I C   =   1 i = 1 n p i 2 i = 1 n 1 j = i + 1 n 2 p i 2 p j 2 ,
where pi and pj are the frequencies of the i-th and j-th alleles. Nei’s genetic distance [33] was calculated based on allele frequencies. A Mantel test [34] with 999 permutations was performed to assess the correlation between the standardized phenotypic Euclidean distance matrix and the SSR-based Nei’s genetic distance matrix. The UPGMA dendrogram was constructed using MEGA 11 [35] and visualized with iTOL v6 [36].

3. Results and Discussion

3.1. Analysis of Morphological Genetic Diversity in P. quinquefolius Accessions

3.1.1. Differences in Morphological Characteristics of P. quinquefolius

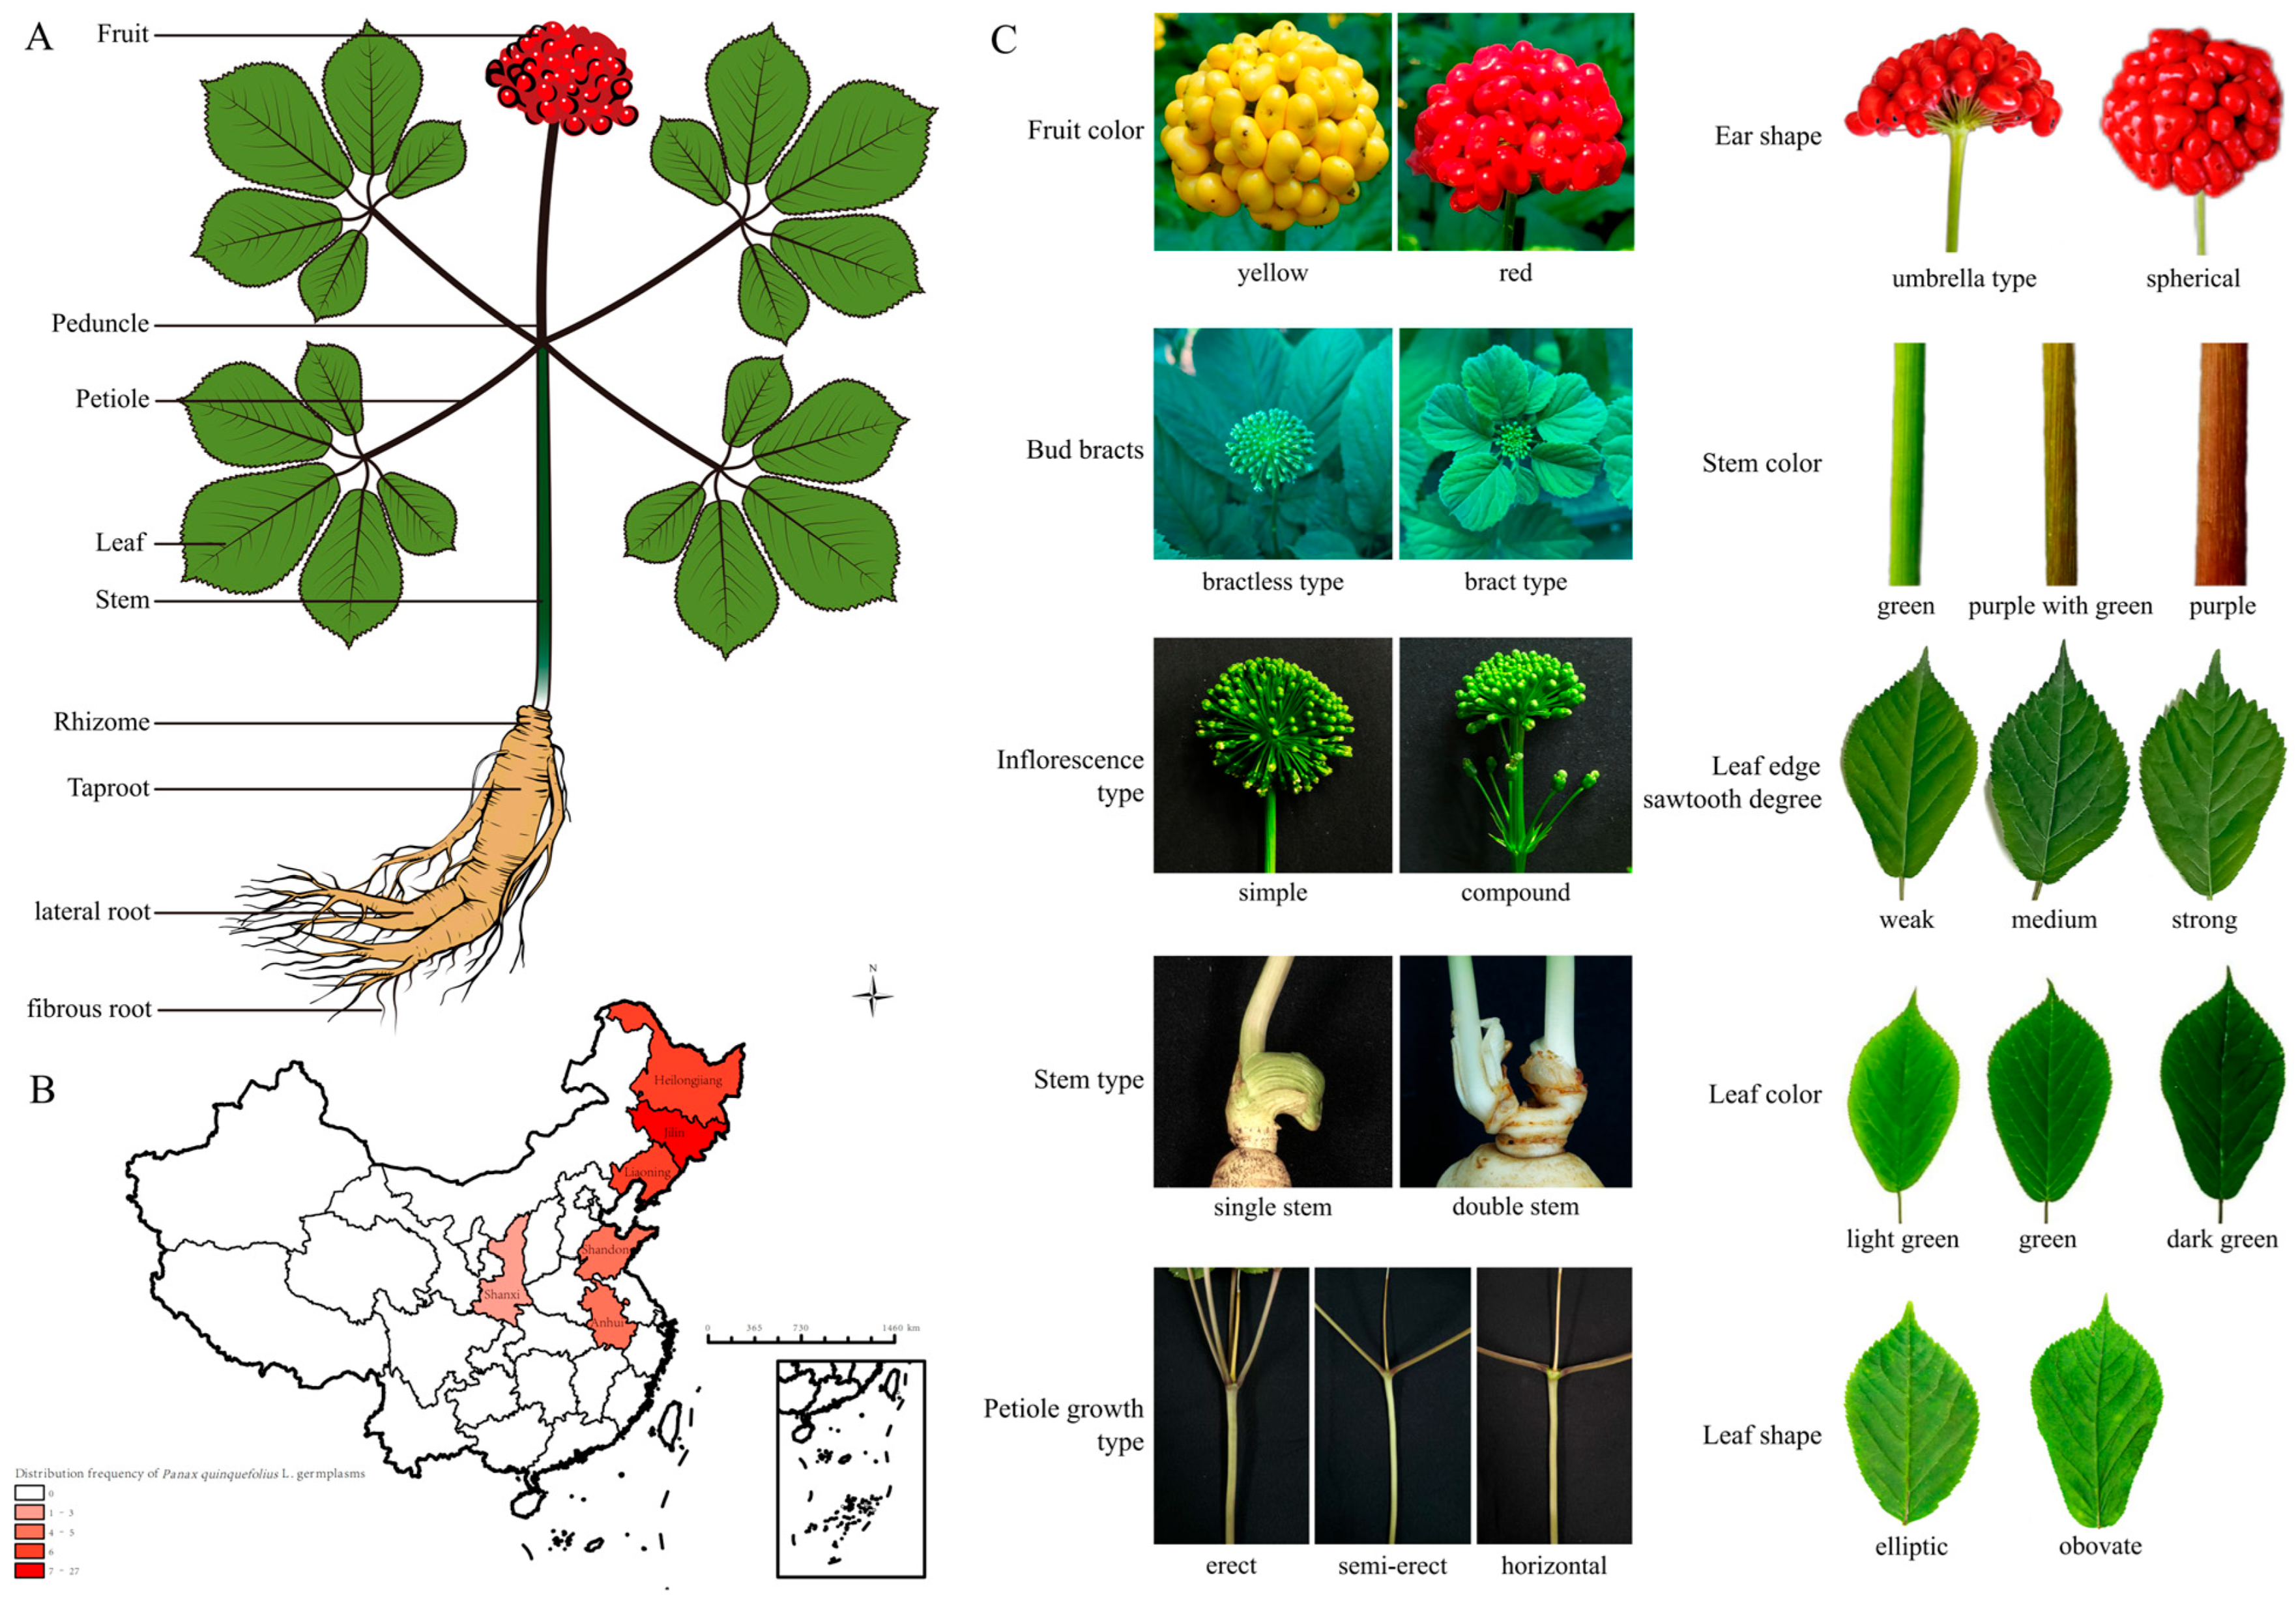
Significant morphological variation was observed in the aerial parts of P. quinquefolius from flowering to fruit ripening (Figure 1). Stem morphology was distinctively categorized into single- and double-stem types, with the latter identified in accessions WD3, JY2, SYB, and LH1. Notably, multi-stem accessions exhibited generally higher fresh root weights compared to single-stem types (Table S1), indicating superior biomass accumulation and yield potential. This observation aligns with commercial agronomic practices, where farmers artificially induce multi-stem formation to maximize production [37]. Regarding reproductive traits, accessions QY4, JA1, and DH3, characterized by compound inflorescences and spherical fruits, displayed significantly higher fruit counts. These accessions serve as valuable parental lines for hybridization with genotypes possessing high thousand-seed weight to systematically enhance seed yield. Additionally, the identification of accessions with yellow fruits and inflorescence bracts not only enhances the ornamental potential of P. quinquefolius but also provides unique materials for investigating flavonoid metabolic pathways [10]. For accessions with an upright petiole growth form, there was less leaf shading between adjacent lines in the field. Further purification of such accessions is expected to allow increased planting density.

3.1.2. Phenotypic Variability and Genetic Potential of P. quinquefolius Accessions

Agronomic traits provide a direct and accessible measure of germplasm diversity. For the 10 qualitative traits, Shannon’s diversity indices (H′) varied from 0.22 (BB and LS) to 1.05 (LESD) (Table 3), revealing a landscape where specific morphological types have become predominant while key traits maintain variability. Notably, leaf edge sawtooth degree (LESD) and stem color exhibited the highest polymorphism (H′ = 1.05 and 0.96, respectively), reflecting a rich phenotypic variation available for breeder selection. For instance, stem color ranged from green (58.85%) to purple (17.65%), offering distinct morphological markers. In contrast, traits such as bud bracts (BB) and leaf shape (LS) displayed lower diversity indices (H′ = 0.22), indicating a high degree of morphological uniformity within the population. This stability suggests that these traits have been fixed through long-term adaptation or artificial selection, serving as consistent diagnostic features for the species.
To elucidate the heritability and breeding potential of quantitative traits, comprehensive genetic parameters—including variance components (Vg, Vp, Ve), coefficients of variation (ECV, GCV, PCV), and broad-sense heritability (H2)—were systematically evaluated (Table 4). The coefficient of determination (R2) estimates ranged from 0.62 to 0.75, indicating that the statistical model accounted for a considerable proportion of the phenotypic variation, although the influence of environmental variance (Ve) was notable. Based on the classification criteria established by Nardino et al. [38], the experimental coefficient of variation (ECV) for specific root traits such as TL (25.02%) and NFR (25.10%) fell into the high range (>20%), reflecting the significant impact of micro-environmental factors on root plasticity under field conditions [39,40]. In contrast, traits like TD (12.01%) and SH (18.26%) showed moderate ECV, suggesting relatively better experimental stability. According to Drisya Ravi et al. [41], phenotypic coefficients of variation (PCV) and genotypic coefficients of variation (GCV) values are classified as low (<10%), moderate (10–20%), and high (>20%). In this study, PCV values were consistently higher than GCV across all traits, indicating the presence of environmental influence. However, as noted by Palange et al. [42], the magnitude of the difference between PCV and GCV is critical for understanding the stability of trait expression. For traits like SD and PL′, the gap between PCV and GCV was relatively narrow (e.g., PL′: PCV = 7.74%, GCV = 6.54%), suggesting that genetic factors (Vg) play a predominant role in trait expression and that these traits are less sensitive to environmental fluctuations. In contrast, traits with larger gaps (e.g., NFR) implied a greater environmental contribution [43]. Analysis revealed that most root morphological traits (RT, TL, NLR, NFR and FRW) exhibited high PCV values (>40%), highlighting abundant genetic variability among accessions and offering a wide scope for yield improvement through selection. Conversely, phenological traits (IFP and FRP) exhibited low coefficients of variation (PCV < 8%). However, this statistical stability is largely attributable to the calculation method based on total days from emergence, in which the large baseline values dilute the relative variance. Given the substantial heritability of these traits (H2 > 70%), even small numerical gains represent significant biological shifts, allowing breeders to fine-tune crop cycles for regional adaptability [44].
More broadly, to further validate the genetic potential of the population, robust estimates of broad-sense heritability (H2) are fundamental. According to Terfa and Gurmu [45], H2 estimates are classified as low (<30%), moderate (30–60%), and high (>60%). In our study, calculated H2 values ranged from 61.70% (NFR) to 74.80% (NLR), uniformly falling into the high category across all evaluated traits. This indicates that, despite environmental noise, the phenotype remains a robust indicator of the genotype within this cohort [46]. The consistently high H2 across vegetative, root architectural, and quality traits highlights a strong genetic control over these phenotypes. Nevertheless, the expression of these traits in American ginseng may still be affected by local ecological conditions and human-mediated agronomic practices, including temperature, shade intensity, soil properties, moisture availability, replant history, fertilization, disease management, and pathogen pressure. Thus, the phenotypic variation observed here should be interpreted within the context of the present standardized field environment. While the single-location nature of this trial limits the full dissection of genotype-by-environment (G × E) interactions, conducting systematic testing and validation of promising accessions identified from this population across major American ginseng production regions in China will be essential to ensure their consistent performance under diverse ecological conditions.
Collectively, the genetic parameter analysis demonstrates abundant genetic variability (high PCV/GCV in key yield traits) coupled with consistently high heritability, providing a robust foundation for phenotypic selection and subsequent genetic improvement of high-yielding American ginseng varieties.

3.2. Correlation Among Traits

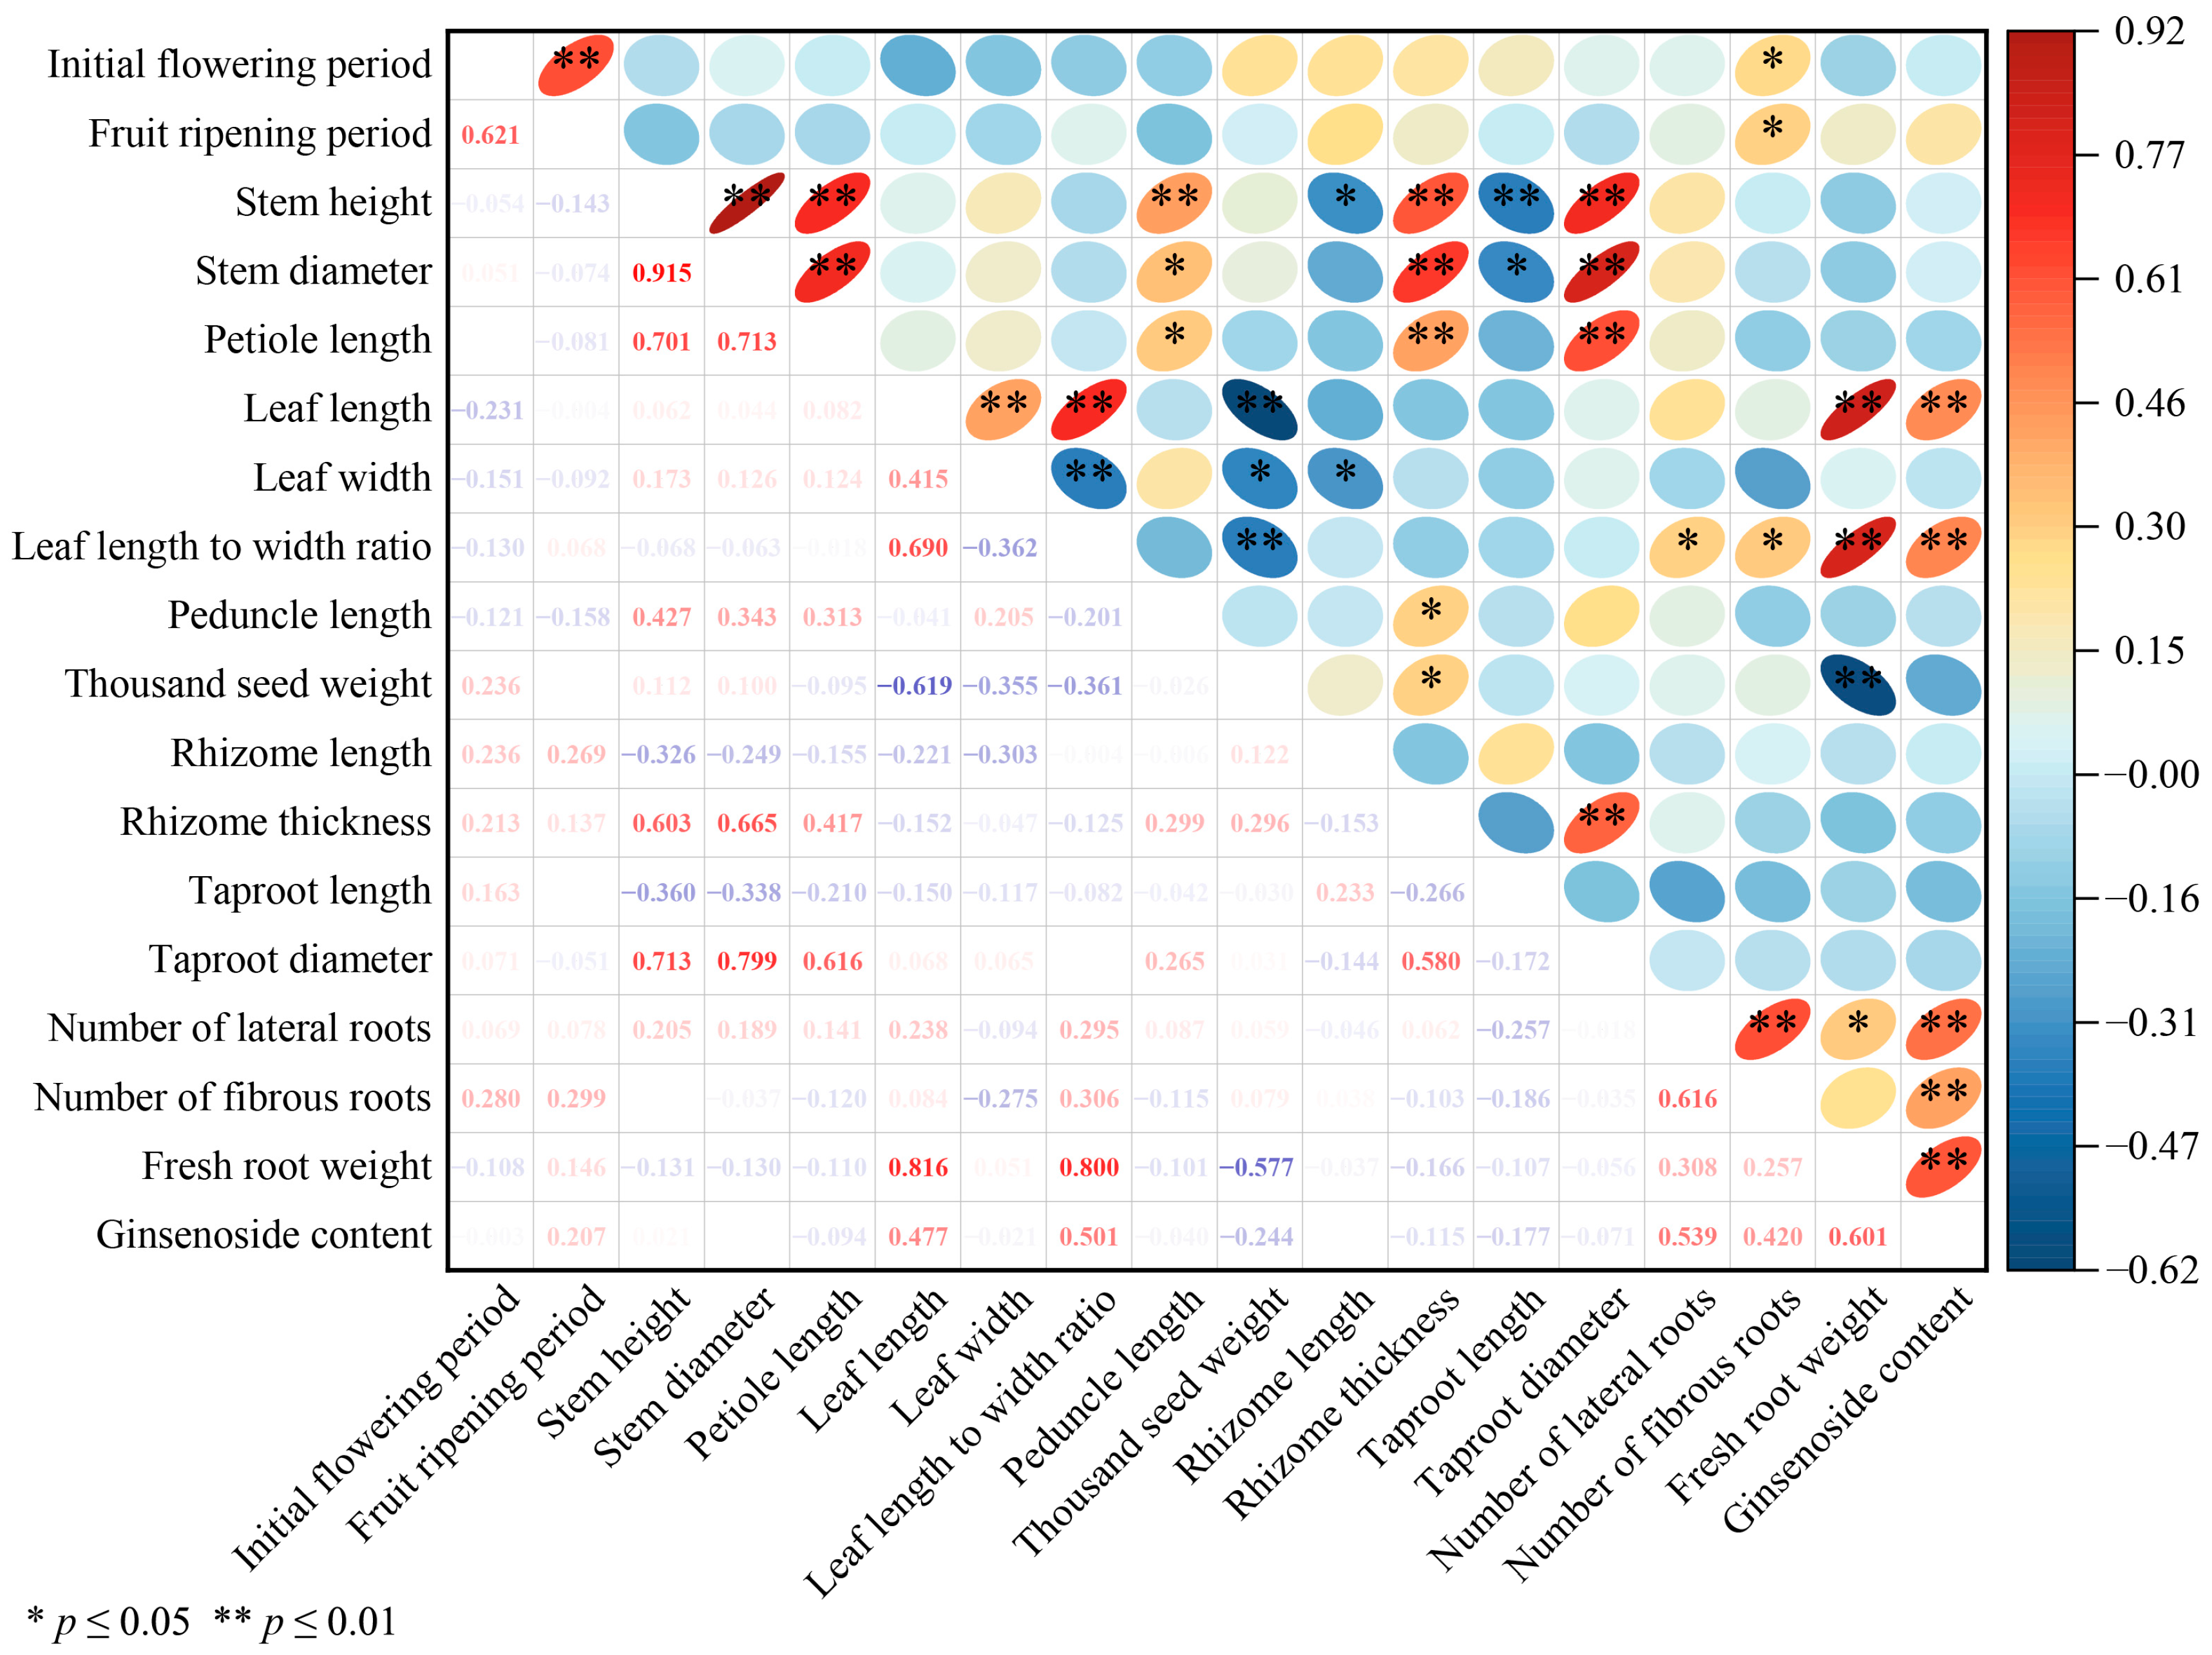
Multivariate correlation analysis of 18 quantitative traits across 51 P. quinquefolius accessions revealed distinct association patterns (Figure 2). Among 153 pairwise comparisons, 27 trait pairs exhibited highly significant associations (p ≤ 0.01), consisting of 22 positive and 5 negative correlations, while 13 pairs showed significant relationships (p ≤ 0.05; 9 positive and 4 negative). Notably, several pairs of traits demonstrated strong positive correlations, reflecting a coordinated developmental pattern among different plant organs. For instance, both SH and SD were highly significantly positively correlated with PL (r = 0.701 and 0.713, p ≤ 0.01), and both SH and SD were strongly correlated with TD (r = 0.713 and 0.799, p ≤ 0.01). This positive association reflects the allometric scaling between vegetative traits and underground biomass, a pattern consistent with findings reported by Freschet et al. [47], suggesting that stronger aboveground growth is associated with higher root biomass accumulation. Consistent with the findings of Abaya et al. [14], a particularly significant association was observed between LL and FRW (r = 0.816, p ≤ 0.01), suggesting that the size of the leaf, as a key photosynthetic organ, might be a reliable indicator of root biomass accumulation, which is a crucial trait for increasing yields in cultivation. In contrast, significant negative correlations may reflect a potential allocation relationship between vegetative growth and reproductive investment [48]. Specifically, thousand-seed weight (TSW) was negatively correlated with LL and FRW (r = −0.619 and −0.577, p ≤ 0.01), suggesting a possible negative association between reproductive investment and vegetative growth under the present experimental conditions. This finding aligns with observations in other Panax species, where excessive reproductive expenditure often constrains underground biomass accumulation [49]. Crucially, GC, a key determinant of medicinal quality, showed moderate positive correlations with vegetative traits (e.g., LL and NLR; 0.4 < r < 0.7, p ≤ 0.01). This suggests that while vigorous vegetative growth provides the photosynthate source for secondary metabolite biosynthesis, the relationship between yield and quality is complex and not strictly linear [50].
Root phenotypes and GC represent the primary agronomic targets in P. quinquefolius. The demonstrated correlations between these subterranean traits and aerial morphological features suggest that these aboveground traits may help identify accessions combining favorable root biomass and quality-related characteristics. These correlations suggest that aboveground traits may serve as useful auxiliary indicators for early-stage screening, although their predictive value should be validated across environments. Conversely, the observed negative associations may require trait-specific selection strategies, such as prioritizing either seed production or root biomass. Overall, these findings provide a phenotypic framework for understanding trait integration in P. quinquefolius, guiding the strategic utilization of germplasm for diverse agronomic and market demands.

3.3. Principal Component Analysis and Comprehensive Evaluation

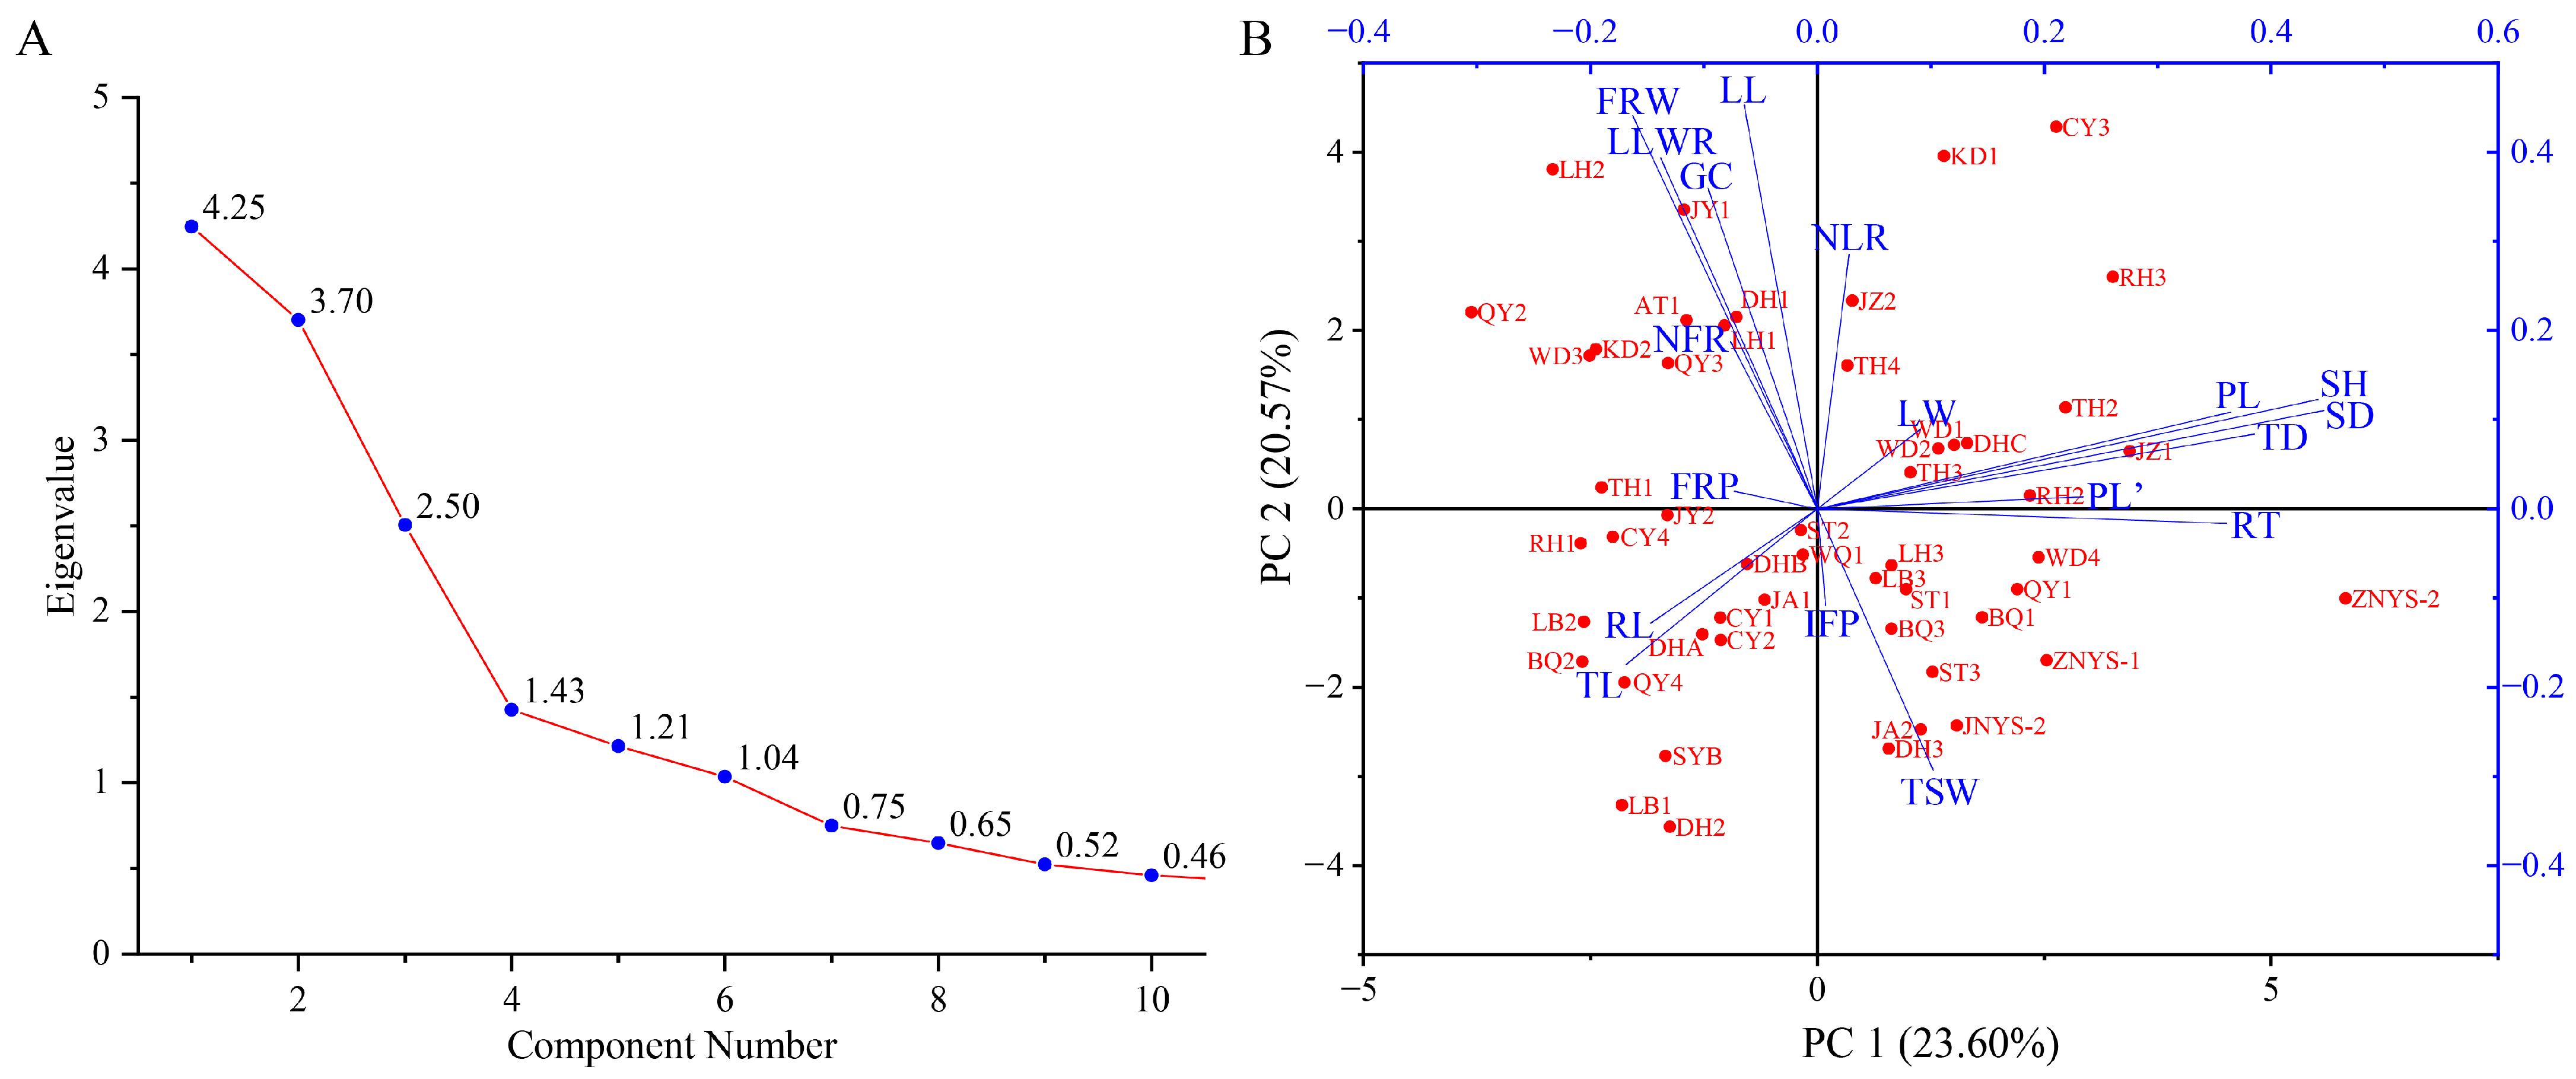
A total of six principal components (PCs) with eigenvalues greater than 1.0 were extracted, explaining a cumulative variance of 78.50% (Figure 3A and Table S2). This indicates that these six PCs effectively captured the majority of the phenotypic variation present in the original dataset. The biplot of the first two principal components visually confirmed the trait relationships and accession distribution (Figure 3B). The first principal component (PC1) explained 23.60% of the total variance, characterized by strong covariance between aerial traits (SH, SD and PL) and subterranean dimensions (RT and TD), reflecting a coordinated allometric growth pattern where robust stems and petioles support thicker roots and rhizomes. The second principal component (PC2) accounted for 20.57% of the variance, primarily representing leaf morphology (LL and LLWR), thousand-seed weight (TSW) and fresh root weight (FRW). The third principal component (PC3) explained 13.92% of the variance, highlighting the contribution of developed lateral/fibrous roots (NLR and NFR) and ginsenoside content (GC). The remaining components captured specific morphological nuances: the fourth principal component PC4 (7.92%) represented phenological timing (IFP and FRP); the fifth principal component PC5 (6.74%) focused on leaf width (LW); and the sixth principal component PC6 (5.75%) reflected taproot length (TL). Consequently, the traits dominating the first two principal components (SH, SD, PL, RT, TD, LL, LLWR, TSW, and FRW) were identified as the primary discriminatory indicators for distinguishing P. quinquefolius accessions, while traits from subsequent components (e.g., NLR, NFR, and GC) served as complementary descriptors to resolve finer phenotypic differences.
Based on the eigenvector matrix and standardized phenotypic data, a comprehensive score (F) was calculated for each accession. The scores ranged from −1.22 (SYB) to 1.67 (CY3) (Table 5). The top five accessions were CY3, KD1, DH1, LH2, and AT1, with F values of 1.67, 1.19, 0.86, 0.82, and 0.79, respectively. CY3 and KD1 showed tall stature and high yield potential, DH1 and LH2 had relatively high ginsenoside content, and AT1 exhibited well-developed lateral and fibrous roots (Table S3). These accessions may therefore serve as candidate materials for targeted breeding.

3.4. Cluster Analysis Based on Phenotypes

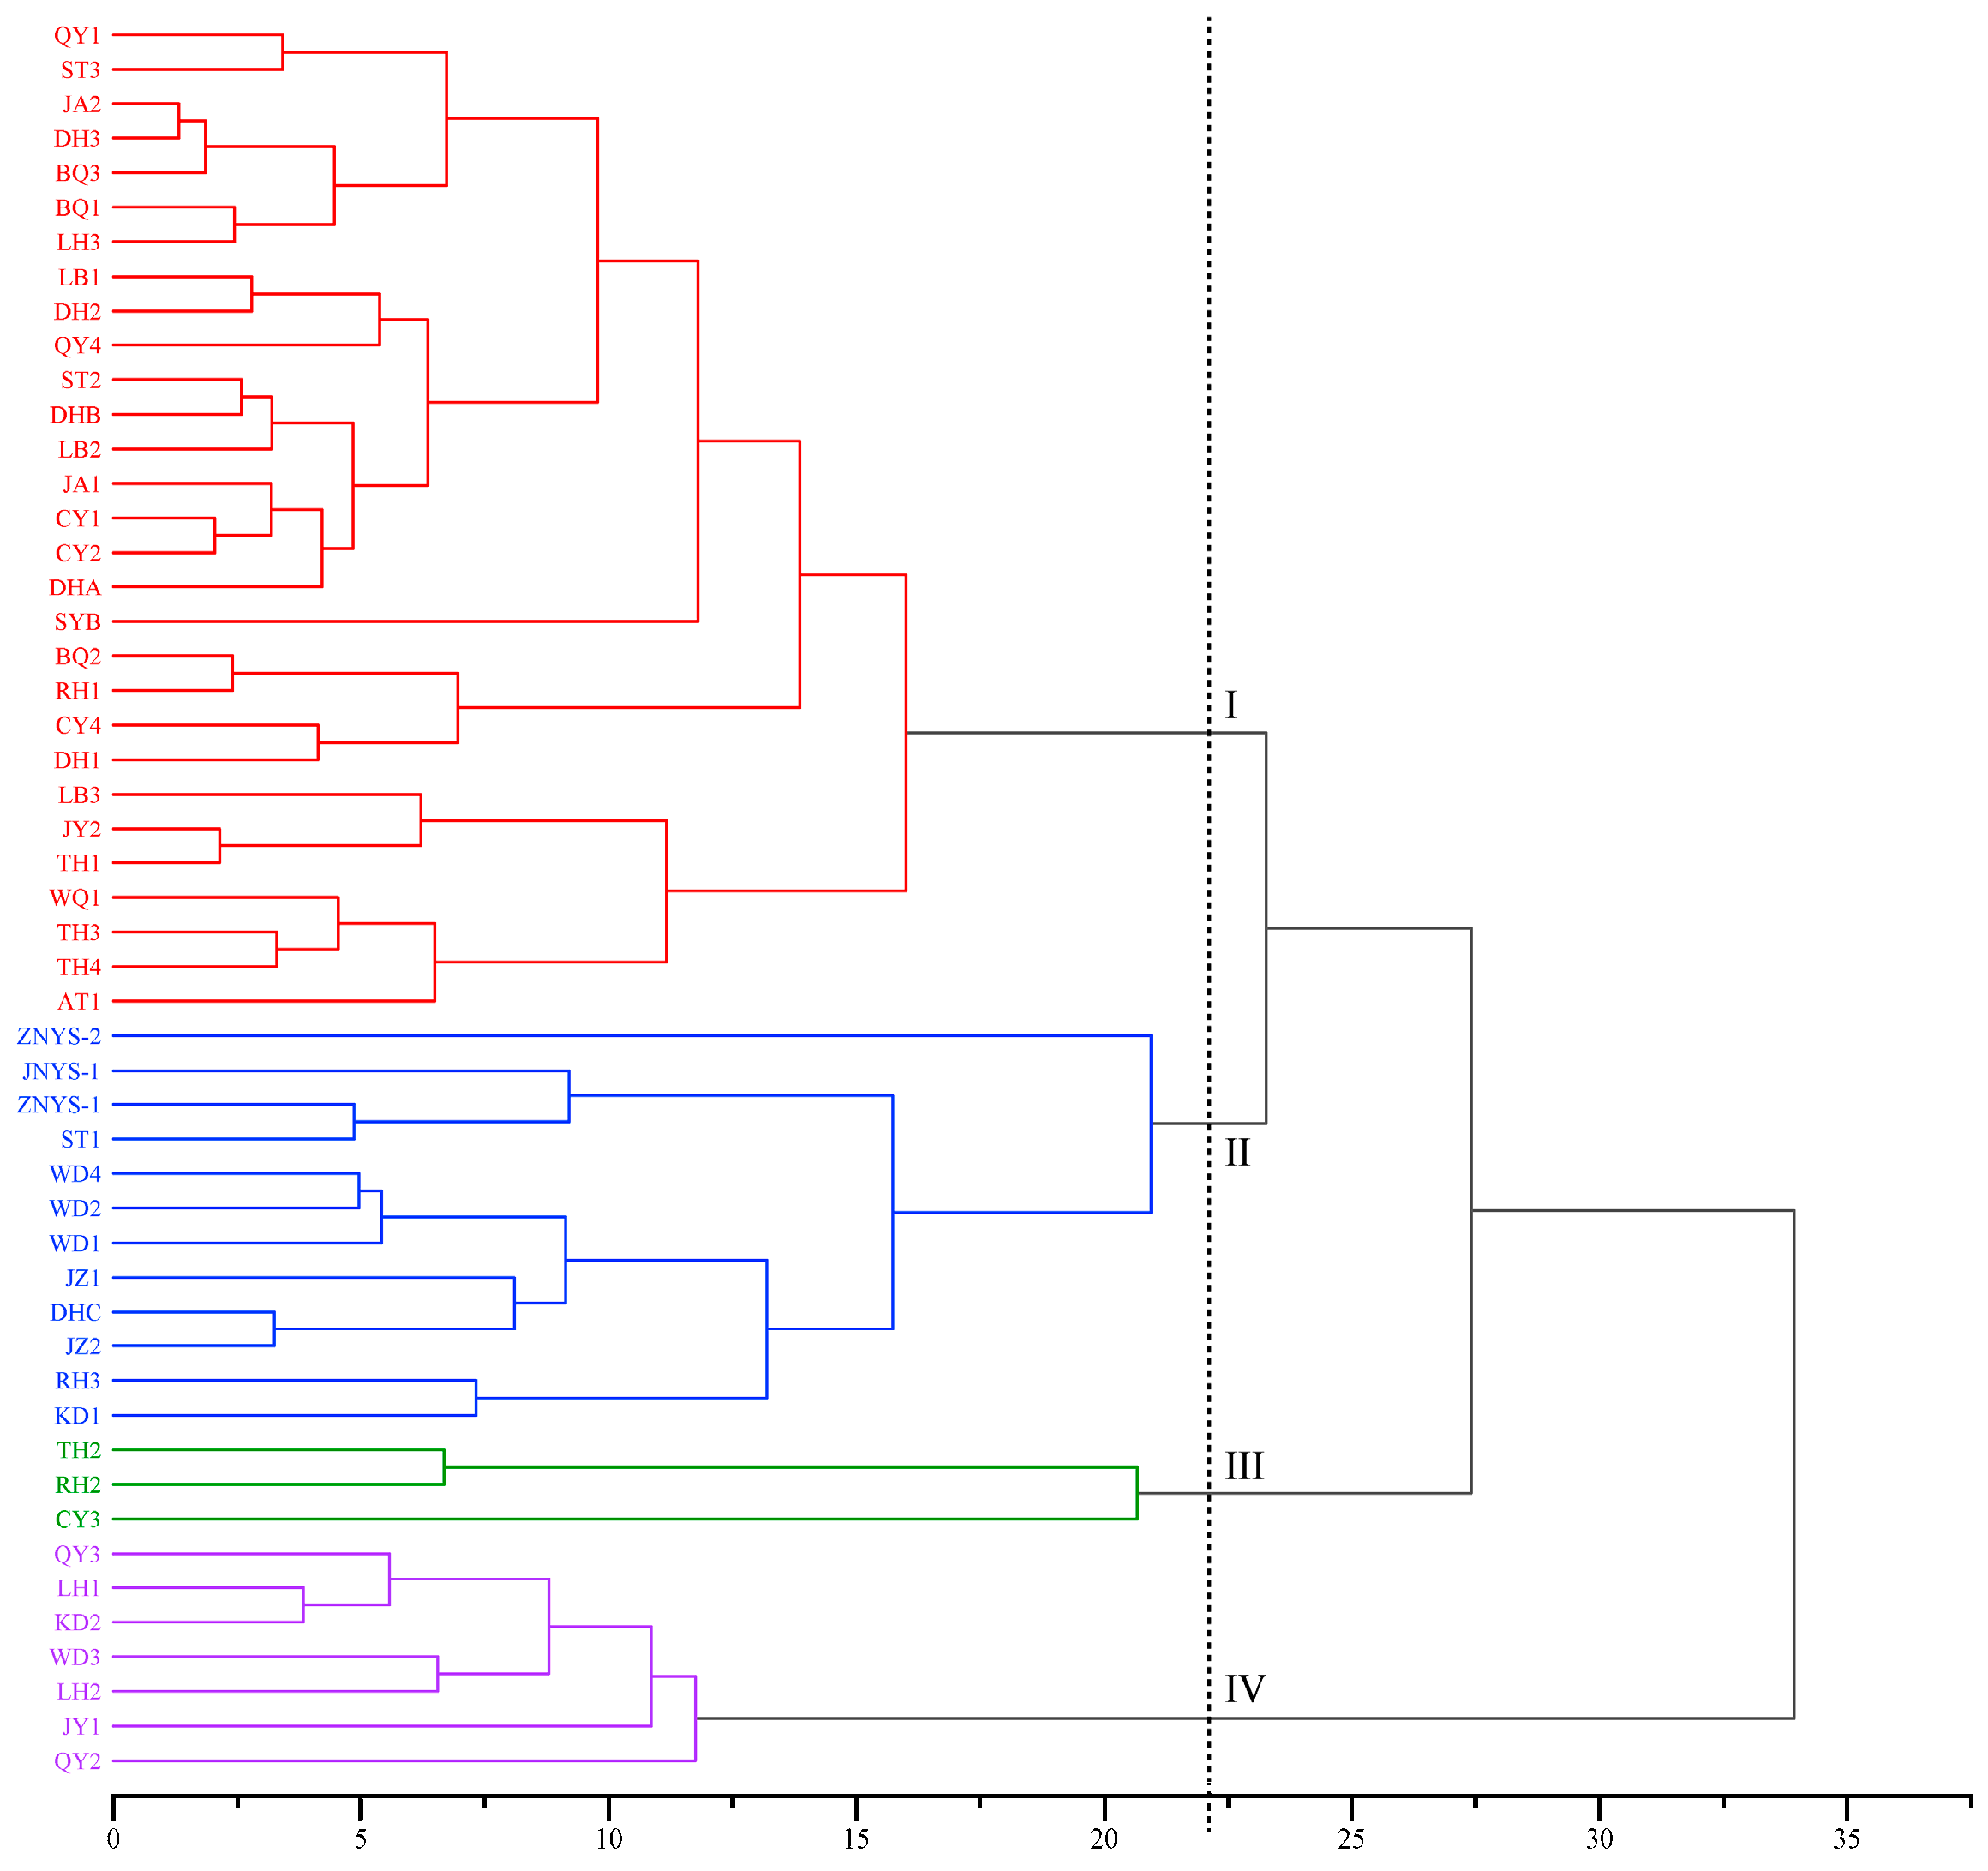
Phenotype-based clustering classified the 51 accessions into four groups (Groups I–IV), reflecting differences in major agronomic trait combinations (Figure 4). Group I, the largest cluster comprising 29 accessions (56.86%), was distinguished by delayed flowering, elevated thousand-seed weight, and elongated taproots (Table S4). However, these traits were associated with compromised overall root yield, suggesting a possible negative association between reproductive investment and root yield, consistent with findings by Zhao et al. [51]. Group II (12 accessions, 23.53%) was characterized by early phenological development, indicating its potential value for selecting early-maturing materials. In contrast, Group III (3 accessions, 5.88%) featured tall plant architecture, thick taproots, and well-developed lateral/fibrous root systems. These characteristics align closely with current market preference for premium whole-root products, suggesting their potential value for whole-root product-oriented breeding. Finally, Group IV (7 accessions, 13.73%) represented a superior agronomic cluster, characterized by large leaf area, high root yield, and elevated ginsenoside content. Consequently, accessions in this group may provide useful parental materials for breeding programs aiming to simultaneously improve yield and quality. These group-level trait profiles provide a practical reference for selecting accessions according to different breeding objectives.

3.5. Genetic Polymorphism of the SSR Markers

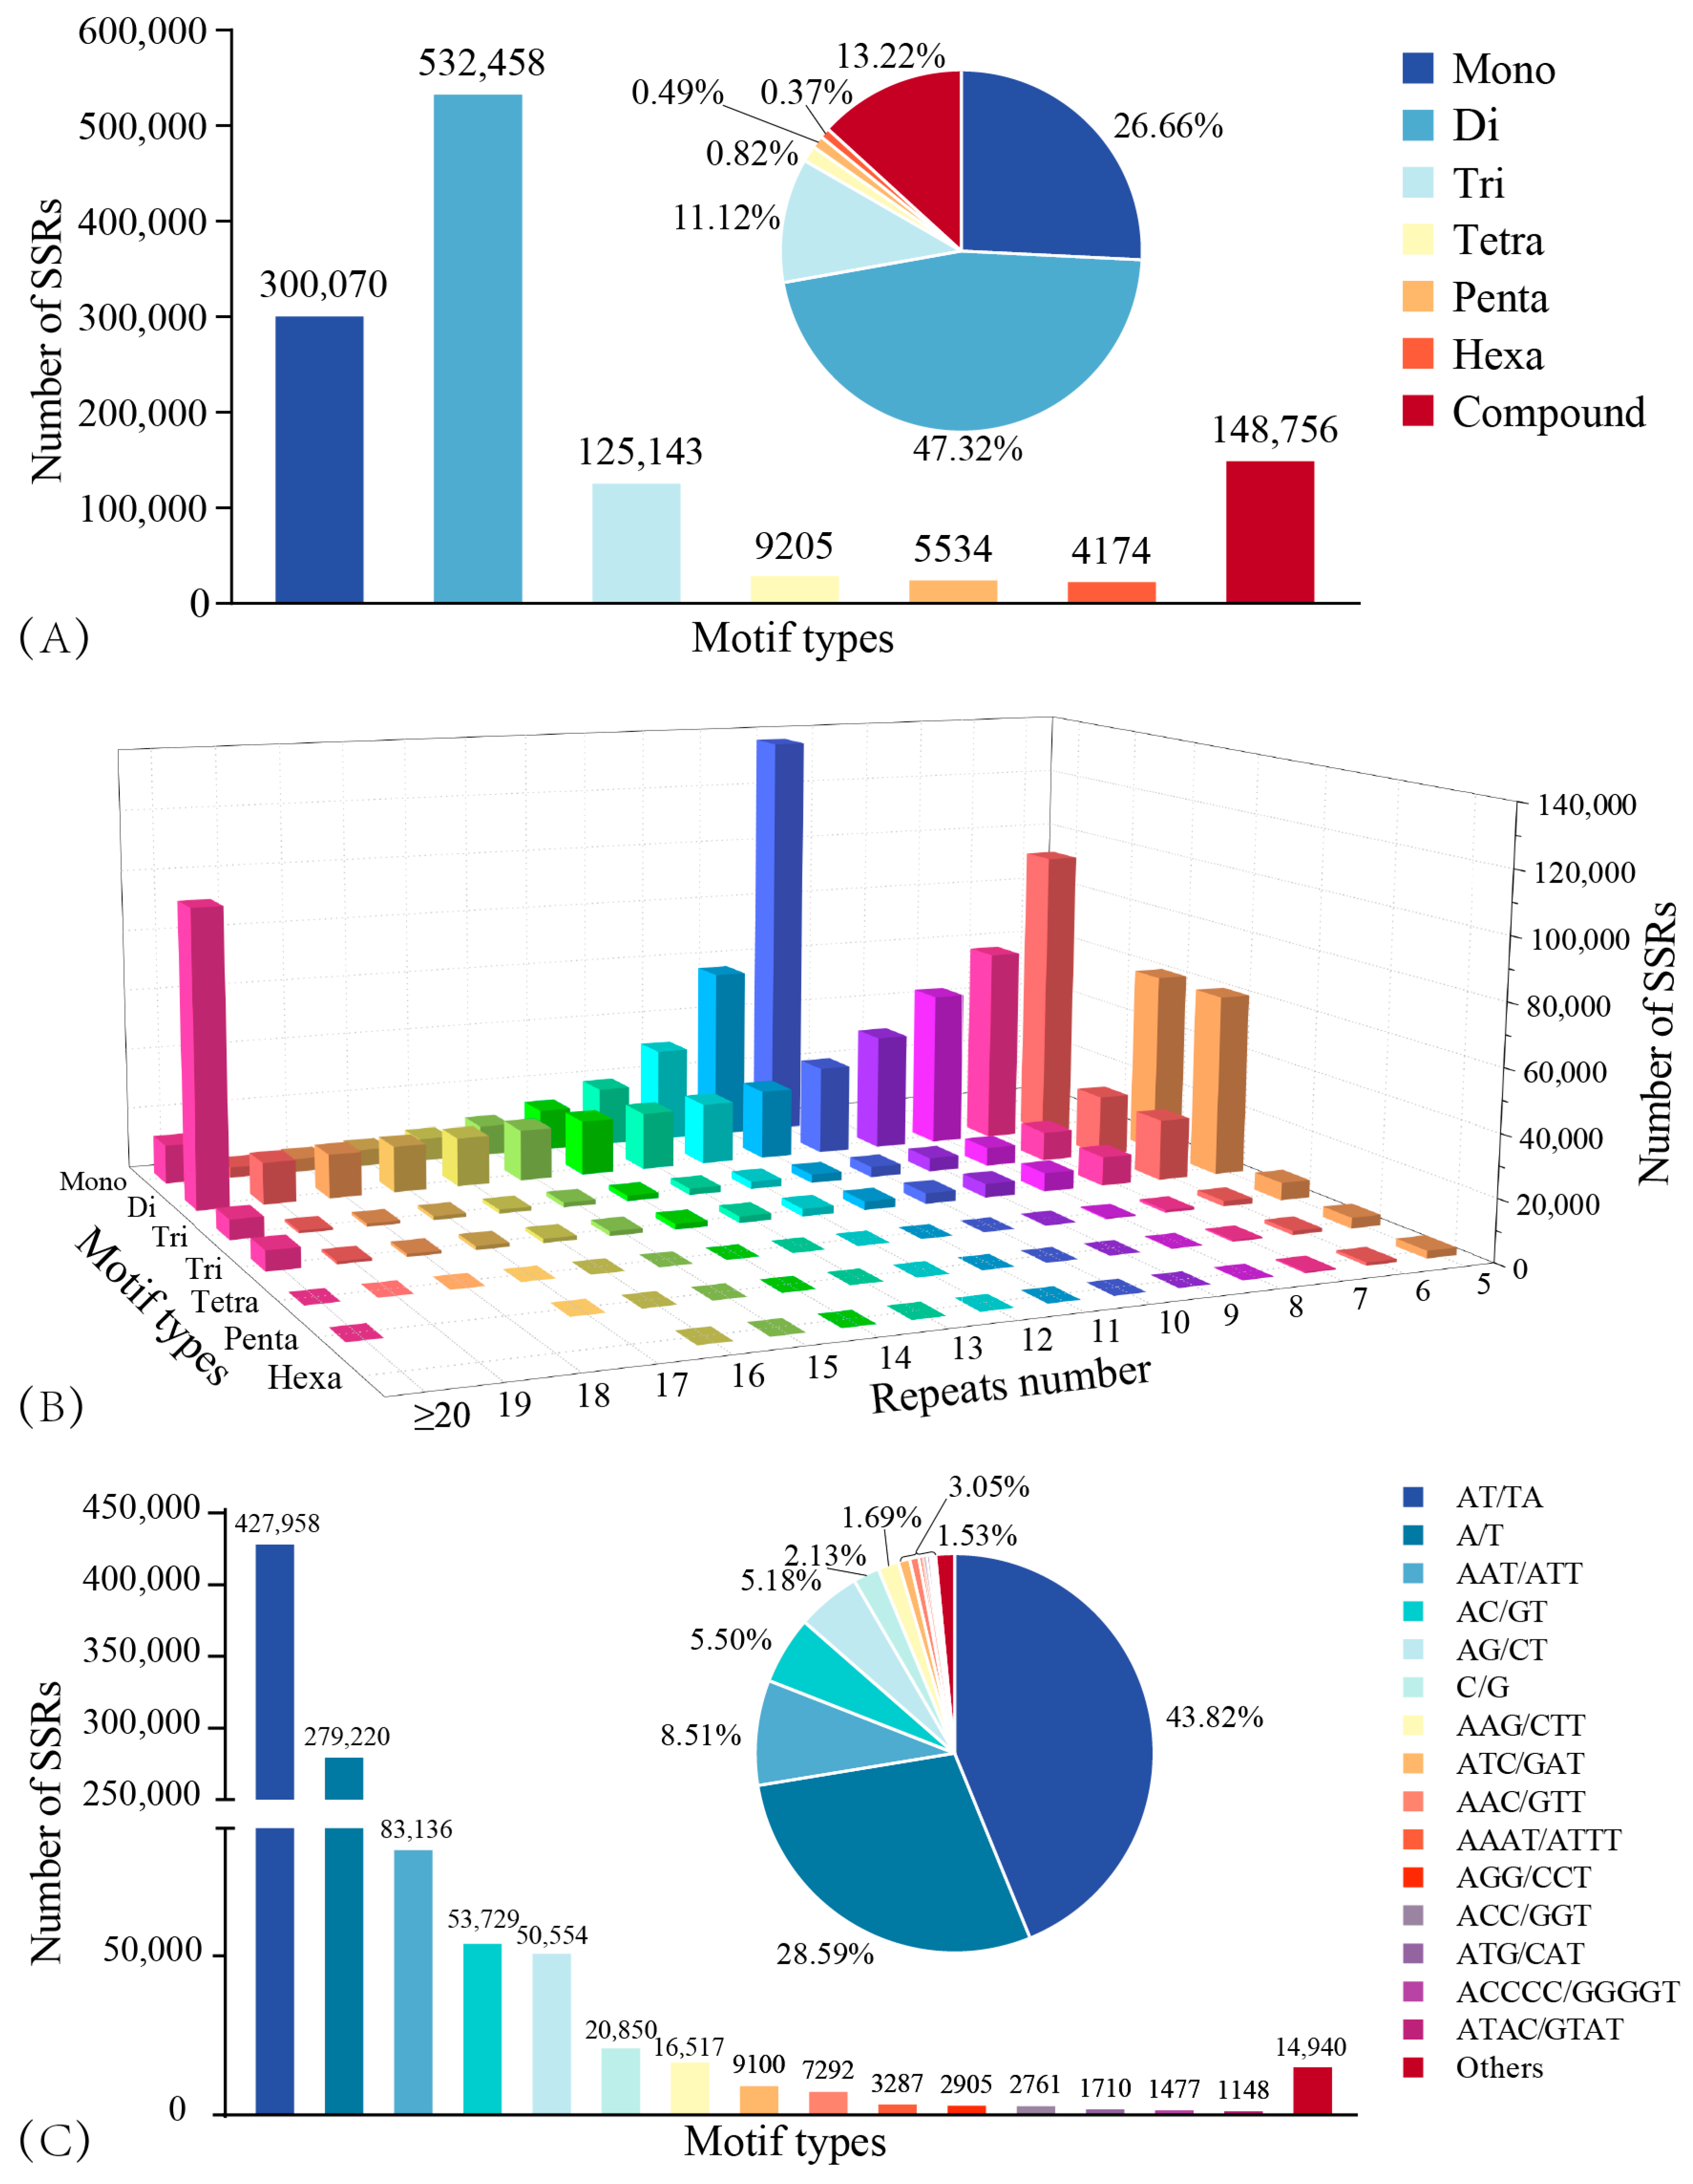
Genome-wide mining of SSRs in P. quinquefolius revealed extensive microsatellite resources for future genetic studies and marker development. Screening of approximately 3.57 Gb of genomic sequences identified 976,584 SSR loci (density: 267.14 loci/Mb), and 148,756 compound SSRs, indicating a high microsatellite density characteristic of the P. quinquefolius genome (Figure 5A). Structurally, dinucleotide repeats dominated the landscape (47.32%), followed by mononucleotide (26.66%), compound (13.22%), and tri- to hexanucleotide motifs (11.12–0.37%). Notably, motif abundance showed an inverse correlation with repeat unit length (Figure 5B), a pattern commonly observed in plant genomes [52,53]. Motif analysis identified AT/TA as the predominant type (43.82%), followed by A/T (28.59%) and AAT/ATT (8.51%) (Figure 5C), reflecting the inherent genomic AT-bias characteristic of the P. quinquefolius genome. This SSR resource provides a useful basis for developing additional polymorphic markers for future genetic analysis and breeding studies in P. quinquefolius.

3.6. Polymorphism and Genetic Diversity Analysis of SSR Markers

Genetic characterization using the 12 polymorphic SSR markers revealed substantial discriminatory power across the 51 P. quinquefolius accessions (Table 6 and Figure S1). The Na ranged from 4.00 to 16.00 (mean = 7.17), while Ne varied from 3.01 to 7.92 (mean = 5.44). Genetic diversity indices were moderate, with H averaging 0.33 (range: 0.08–0.49) and I averaging 0.48 (range: 0.11–0.68). PIC values ranged from 0.29 to 0.86, with a mean of 0.55, indicating that the selected markers were informative for distinguishing the tested accessions. However, the moderate values of H and I suggest that the detected molecular diversity was limited, which may be related to the restricted marker number and the cultivated nature of the tested materials. Given the limited number of polymorphic SSR markers, the molecular diversity estimates obtained here should be interpreted as a preliminary assessment rather than a high-resolution characterization of population structure.

3.7. Genetic Distance and Cluster Analysis

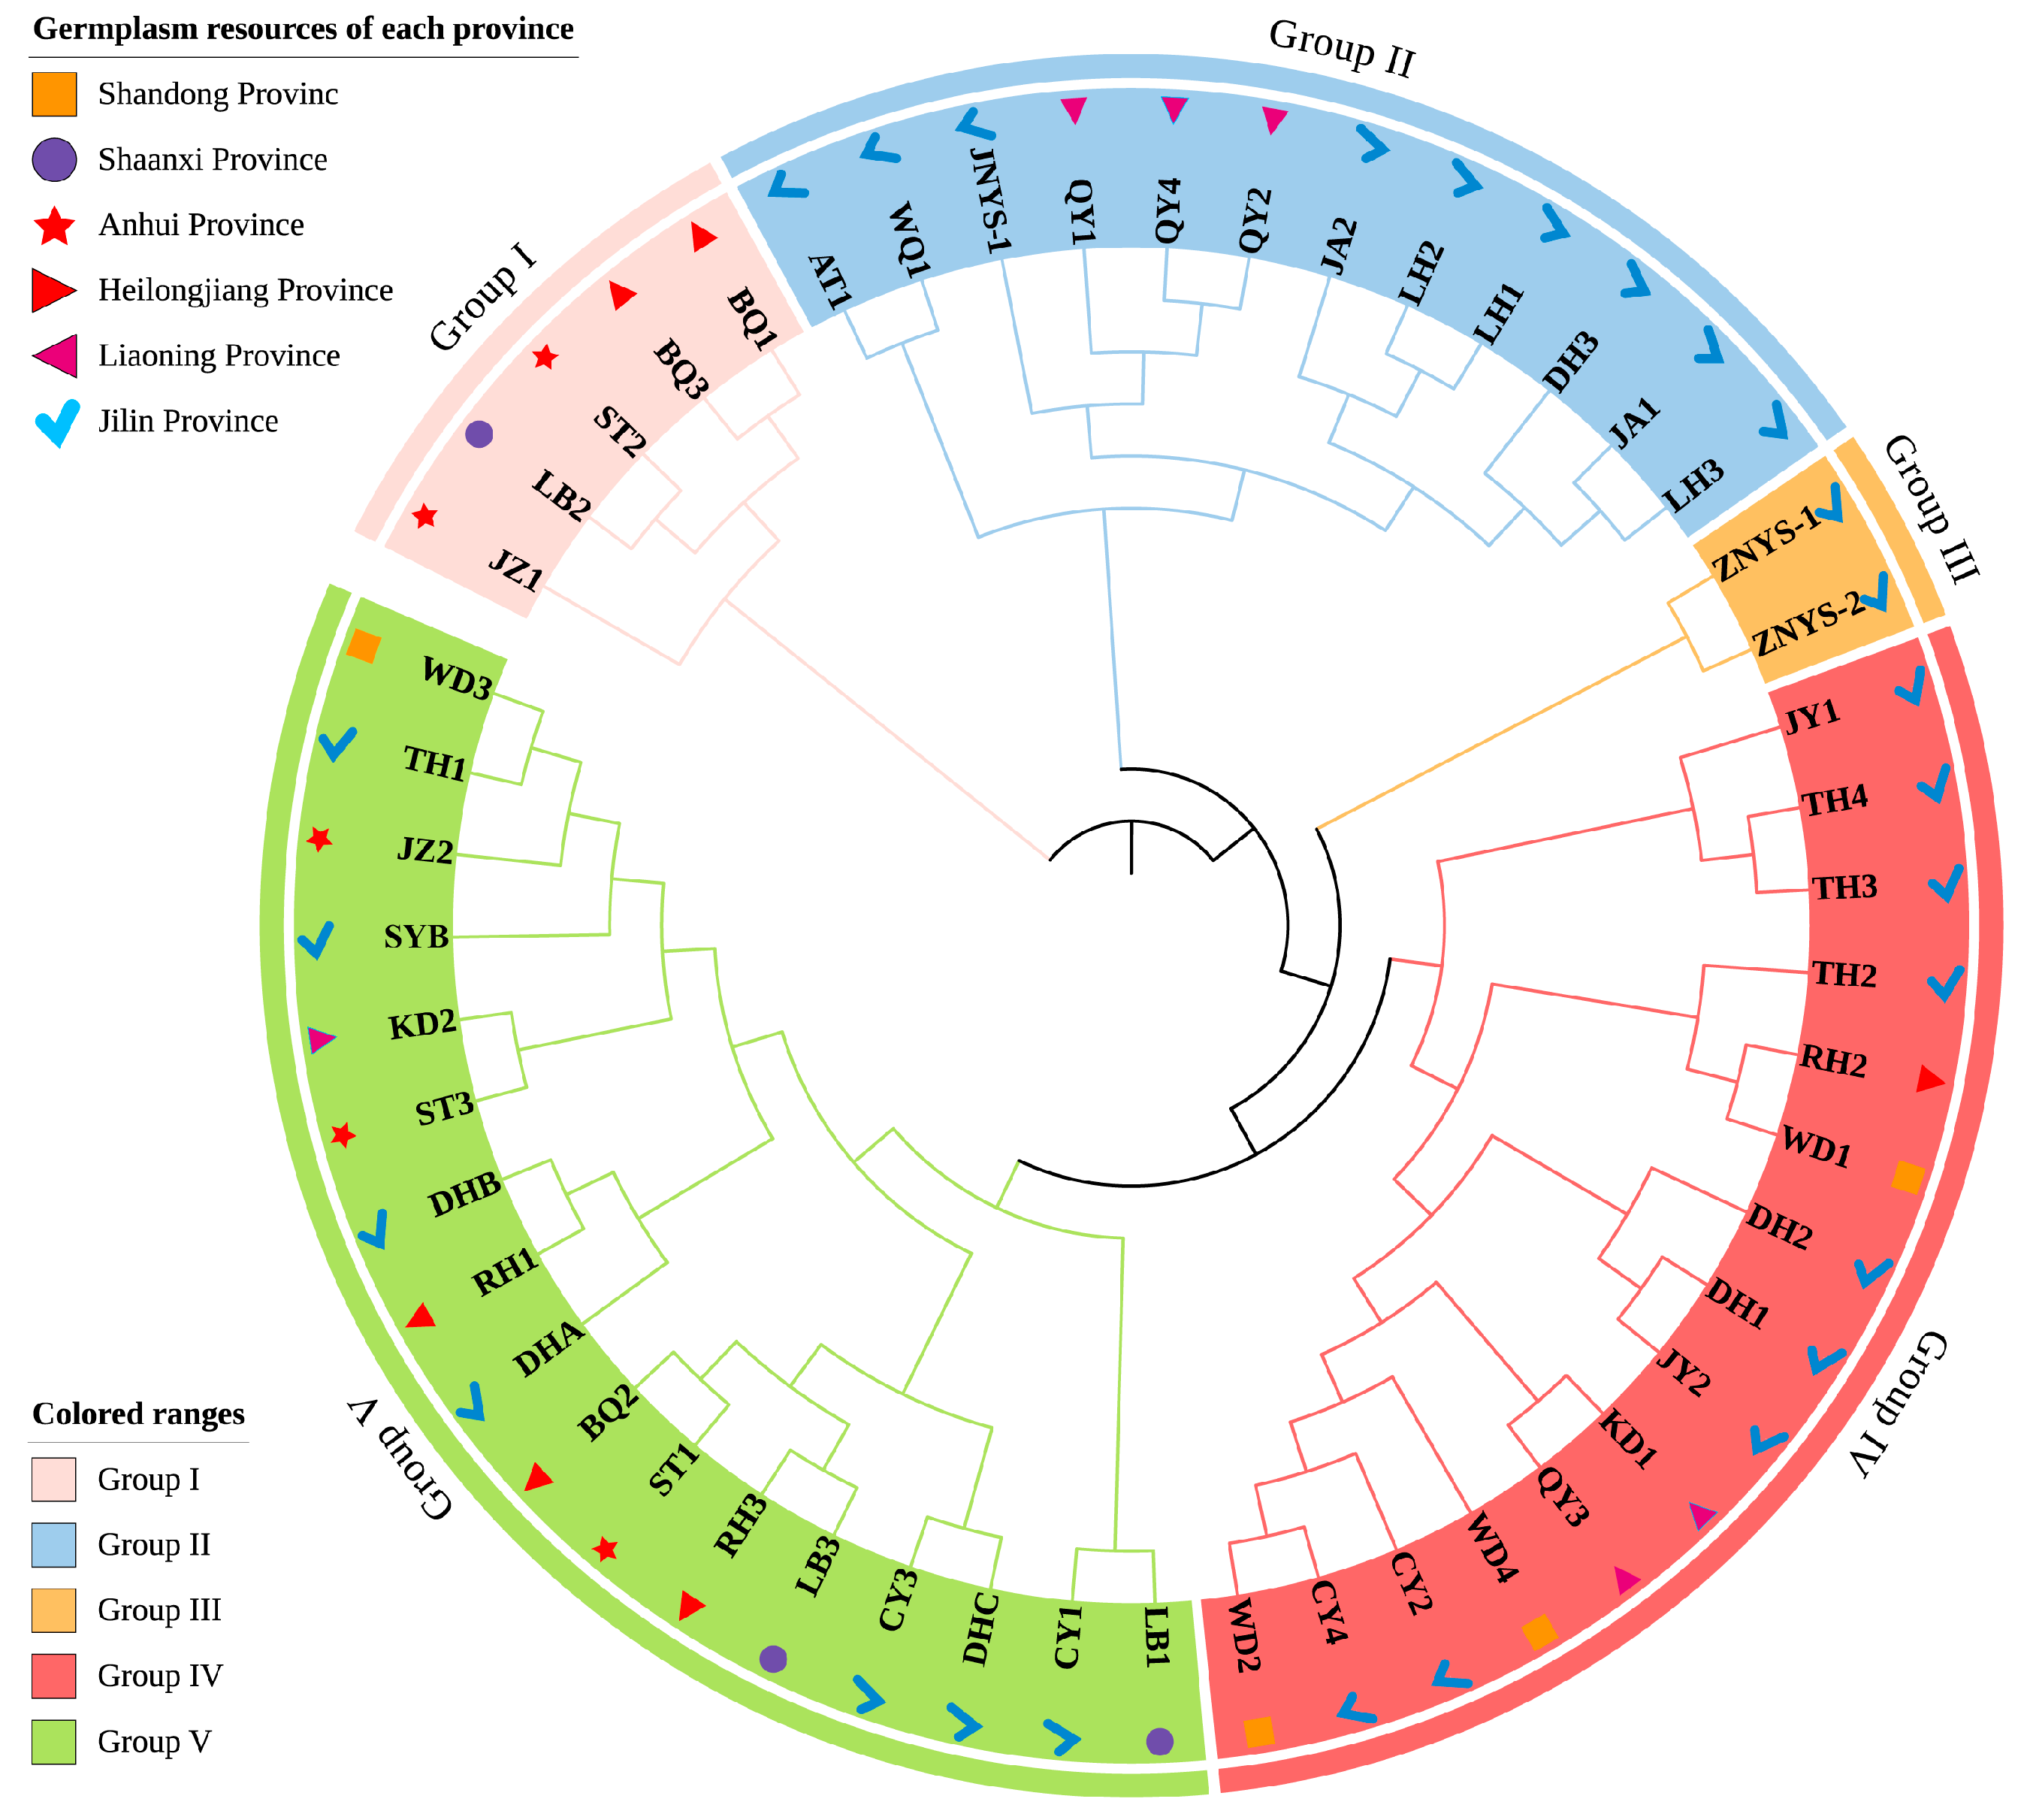
Genetic distances among the 51 P. quinquefolius accessions ranged from 0.04 to 0.49 (mean = 0.26) (Table S5), suggesting detectable genetic differentiation that may be useful for preliminary parental selection. The closest relationship (D = 0.04) was identified between TH3 and TH4, both originating from the same municipality and exhibiting highly similar phenotypes (FRW: approximately 33–35 g; GC: approximately 2.6–2.9%) (Table S3). Conversely, the greatest divergence (D = 0.49) occurred between WQ1 (Jilin) and ST2 (Anhui). These two accessions displayed distinct phenotypic complementarity: WQ1 was characterized by high ginsenoside content (3.12%) but lower root weight, whereas ST2 exhibited superior root biomass (32.07 g) but lower phytochemical content. Such genetically distant pairs with complementary traits may represent promising parental combinations for future crossing experiments. Notably, the genetic distances among the five candidate elite accessions selected by PCA (CY3, KD1, DH1, LH2, and AT1) ranged from 0.19 to 0.34. This moderate genetic divergence suggests that these accessions may provide useful parental variation for future crossing and segregation studies while maintaining favorable agronomic traits, making them suitable candidates as parents for hybridization. The UPGMA dendrogram based on SSR markers classified the population into five clusters (Groups I–V) (Figure 6). Group I contained five accessions from three provinces, while Group II (12 accessions) was dominated by accessions from Jilin and Liaoning. Notably, Group III comprised only two cultivars, ‘ZNYS-1’ and ‘ZNYS-2’, suggesting a shared pedigree or selection history. Groups IV and V were larger, mixed clusters containing accessions from diverse geographical origins.
Combining genetic distance and cluster analysis revealed a weak association between SSR-based clustering patterns and geographical origin. While localized sub-clusters existed (e.g., Group II), most groups showed extensive geographical mixing. Similar weak associations between genetic clustering and geographic origin have been reported in other long-cultivated perennial crops, probably reflecting human-mediated germplasm exchange [54,55]. For P. quinquefolius in China, this weak geographic pattern is likely associated with anthropogenic factors: frequent trans-provincial seed exchange, unregulated introductions, and cultivation-based selection over the past 40 years may have facilitated extensive gene flow and weakened natural geographical differentiation [56]. This finding has practical implications for germplasm management, indicating that geographic origin or traditional provenance labels should not be used alone as proxies for accession identity. Instead, reliable identification and utilization of American ginseng germplasm should rely on standardized molecular fingerprints, passport information, phenotypic records, and, where available, pedigree or propagation history.
Furthermore, the discordance between SSR-based (Figure 6) and phenotype-based (Figure 4) clustering suggests that phenotypic divergence was not solely determined by neutral molecular variation, but may also reflect environmental plasticity, artificial selection under cultivation, and the polygenic nature of complex traits, such as root yield and ginsenoside content [14,57,58]. Consistently, the Mantel test showed no significant correlation between phenotypic and SSR-based distances (Mantel r = 0.018, p = 0.294; Table S6), indicating that phenotypic similarity does not necessarily correspond to SSR-based genetic similarity. In addition, the limited number of putatively neutral SSR loci used in this study may not fully capture genome-wide variation associated with agronomic traits. Therefore, integrating phenotypic and SSR information may improve parental selection by identifying accessions with complementary traits and relatively divergent molecular profiles. Given the limited marker density, model-based population structure analyses, such as STRUCTURE, were not performed in this study.

3.8. Proposal of a Representative Accession Subset for Future Breeding and Conservation

To facilitate future breeding and conservation, a representative subset of 12 accessions, accounting for 23.53% of the evaluated germplasm, was proposed based on phenotypic clustering, PCA-based comprehensive evaluation, and SSR-based genetic diversity [59]. Three accessions were selected from each of the four phenotypic clusters to ensure phenotypic representativeness, with priority given to accessions showing high PCA-based performance and desirable agronomic traits. SSR cluster membership and pairwise Nei’s genetic distances were further used to reduce genetic redundancy. For instance, CY4 was excluded because of its short genetic distance from CY3, whereas JZ1 was retained to improve SSR-based genetic coverage. The final subset included DH1, AT1, JZ1, KD1, RH3, JZ2, CY3, RH2, TH2, LH2, KD2, and WD3. Among them, CY3, KD1, DH1, LH2, and AT1 represented elite accessions with superior comprehensive performance, while WD3 was retained for its distinctive double-stem phenotype. This subset covered all phenotypic clusters and different SSR-based profiles, providing a practical working panel for parental selection, germplasm management, genetic analysis, and pre-breeding studies [60,61]. Details are provided in Table S7.
Beyond its use for breeding and genetic analysis, this subset provides a practical basis for conserving valuable germplasm [59]. Because these accessions are breeding materials rather than released cultivars, their identity should be maintained through standardized field preservation in a dedicated germplasm nursery at Jilin Agricultural University, with each accession linked to passport information, phenotypic records, and SSR fingerprints [62]. Separate handling during propagation, together with duplicate field collections or backup seed stocks and periodic phenotypic and molecular verification, would help minimize admixture, reduce material loss, and preserve these accessions as reliable parental resources for future evaluation and breeding [63,64].

4. Conclusions

This study integrated phenotypic traits and SSR markers to evaluate genetic diversity among 51 selected P. quinquefolius accessions. Substantial phenotypic variation was observed across 28 agronomic traits, particularly in root-related traits such as fresh root weight, taproot diameter, and lateral root number. These traits, together with ginsenoside content, showed high broad-sense heritability, indicating their potential for effective improvement through phenotypic selection. The positive correlations between aerial vegetative traits and root biomass also provide a basis for non-destructive early-stage screening.
SSR-based analysis revealed weak geographical differentiation and limited concordance with phenotypic clustering, suggesting that long-term germplasm exchange, cultivation history, and human selection may have reshaped the genetic composition of local materials. Based on the integrated evaluation, five candidate elite accessions and a 12-accession representative subset were identified. Together with the proposed accession-level conservation strategy, these materials provide a practical basis for future breeding, germplasm management, and genetic analysis. Further multi-year and multi-location validation across major American ginseng production regions will be necessary to assess genotype-by-environment interactions and confirm the stability and adaptability of these materials under diverse ecological conditions. High-density genome-wide marker analysis will also help clarify population structure more precisely and support future marker-assisted improvement.

Supplementary Materials

The following supporting information can be downloaded at: https://www.mdpi.com/article/10.3390/agronomy16111098/s1, Figure S1: Representative polyacrylamide gel electrophoresis profiles of SSR markers amplified in the 51 P. quinquefolius accessions; Table S1: Passport data and morphological characteristics of the 51 P. quinquefolius accessions evaluated in this study; Table S2: Loadings, eigenvalues, and variance contribution rates of the first six principal components (PC1–PC6) for 18 quantitative traits in P. quinquefolius; Table S3: Mean separation of 18 quantitative agronomic traits for the 51 P. quinquefolius accessions; Table S4: Comparison of quantitative trait means (±SD) among the four phenotypic clusters (Groups I–IV) of P. quinquefolius; Table S5: Genetic distance matrix of the 51 P. quinquefolius accessions derived from SSR marker data based on Nei’s genetic distance coefficient. Table S6: Mantel test results between phenotypic and SSR-based genetic distance matrices among the 51 P. quinquefolius accessions; Table S7: Representative accession subset and selection rationale.

Author Contributions

Conceptualization, X.L., J.Z. and Y.W.; Methodology, X.L., J.Z. and Y.W.; Software, W.J., S.W., B.G., X.C. and X.L.; Validation, X.H., L.F., M.Z. and J.R.; Formal Analysis, W.J., S.W., B.G., X.C. and X.L.; Investigation, S.W., B.G., X.C., Z.Y., D.Z., Y.W. (Youcheng Wang) and C.F.; Data Curation, W.J., X.L., X.H., L.F., J.R. and M.Z.; Visualization, S.W., X.C. and B.G.; Resources, J.R., M.Z., Z.Y., D.Z., Y.W. (Youcheng Wang) and C.F.; Writing—Original Draft Preparation, W.J., X.H., L.F. and X.L.; Writing—Review & Editing, W.J., X.L., J.Z. and Y.W. (Yingping Wang); Supervision, X.L., J.Z. and Y.W. (Yingping Wang); Project Administration, X.L., J.Z. and Y.W. (Yingping Wang); Funding Acquisition, X.L., J.Z. and Y.W. (Yingping Wang). All authors have read and agreed to the published version of the manuscript.

Funding

This research was funded by the Ministry of Science and Technology of the People’s Republic of China, grant number 2021YFD1600901; the National Natural Science Foundation of China, grant number U21A20405; the Department of Science and Technology of Jilin Province, grant numbers 20220501002JC and 20230402038GH; the Jilin Agricultural University, grant number JLAUHLRG20102006; the Jilin Provincial Department of Human Resources and Social Security, grant number 201020012; and the 111 Project, Northeast Advantageous Characteristic Resources and Health Food Discipline Innovation Introduction Base, grant number D23007.

Institutional Review Board Statement

Not applicable.

Data Availability Statement

The original contributions presented in this study are included in the article/Supplementary Materials. Further inquiries can be directed to the corresponding authors.

Conflicts of Interest

Authors Zhongliang Yang and Dandan Zhang are employed by Jilin Shenwang Plant Protection Technology Co., Ltd. The authors declare no conflicts of interest.

References

  1. Hu, J.; Yang, J.; Jiang, S.; Zhang, J.; Liu, Z.; Hou, J.; Gong, X.; Wang, Y.; Wang, Z.; Li, W. Panax quinquefolium Saponins Protect against Cisplatin Evoked Intestinal Injury via ROS-Mediated Multiple Mechanisms. Phytomedicine 2021, 82, 153446. [Google Scholar] [CrossRef]
  2. Jovanovski, E.; Smircic-Duvnjak, L.; Komishon, A.; Au-Yeung, F.; Sievenpiper, J.L.; Zurbau, A.; Jenkins, A.L.; Sung, M.K.; Josse, R.; Li, D.; et al. Effect of Coadministration of Enriched Korean Red Ginseng (Panax ginseng) and American Ginseng (Panax quinquefolius L.) on Cardiometabolic Outcomes in Type-2 Diabetes: A Randomized Controlled Trial. J. Ginseng Res. 2021, 45, 546–554. [Google Scholar] [CrossRef]
  3. Szczuka, D.; Nowak, A.; Zakłos-Szyda, M.; Kochan, E.; Szymańska, G.; Motyl, I.; Blasiak, J. American Ginseng (Panax quinquefolium L.) as a Source of Bioactive Phytochemicals with Pro-Health Properties. Nutrients 2019, 11, 1041. [Google Scholar] [CrossRef]
  4. The Observatory of Economic Complexity (OEC), Ginseng Roots (HS: 121120) Product Trade, Exporters and Importers. 2026. Available online: https://oec.world/en/profile/hs/ginseng-roots (accessed on 29 March 2026).
  5. People’s Daily Online. Chinese District Turns American Ginseng into 10-Billion-Yuan Industry. 2025. Available online: https://en.people.cn/n3/2025/0909/c90000-20363922.html (accessed on 29 March 2026).
  6. McGraw, J.B.; Lubbers, A.E.; Van Der Voort, M.; Mooney, E.H.; Furedi, M.A.; Souther, S.; Turner, J.B.; Chandler, J. Ecology and Conservation of Ginseng (Panax quinquefolius) in a Changing World. Ann. N. Y. Acad. Sci. 2013, 1286, 62–91. [Google Scholar] [CrossRef]
  7. Wang, E.; Chen, C.; Li, Q. Current Obstacles for Continuous Cropping of Panax Species and Mitigation Strategies. J. Ginseng Res. 2026, 50, 100925. [Google Scholar] [CrossRef]
  8. Wang, Z.; Wang, T.; Hu, J.; Jiao, H.; Jin, Y.; Sun, J.; Nan, T.; Zhao, Y.; Liu, Y.; Huang, L.; et al. Comparisons of Wild and Cultivated American Ginseng (Panax quinquefolius L.) Genomes Provide Insights into Changes in Root Growth and Metabolism during Domestication. Plant Biotechnol. J. 2024, 22, 1963–1965. [Google Scholar] [CrossRef]
  9. Yuk, J.; McIntyre, K.L.; Fischer, C.; Hicks, J.; Colson, K.L.; Lui, E.; Brown, D.; Arnason, J.T. Distinguishing Ontario Ginseng Landraces and Ginseng Species Using NMR-Based Metabolomics. Anal. Bioanal. Chem. 2013, 405, 4499–4509. [Google Scholar] [CrossRef] [PubMed]
  10. Lei, X.J.; Zhao, J.; Rong, J.B.; Zhang, M.Y.; Jia, W.H.; Zhang, J.; Chen, X.; Hu, H.; Wu, J.; Jiang, Y.J.; et al. Telomere-to-Telomere Genome Assembly of Yellow-Fruited Allotetraploid American Ginseng (Panax quinquefolius L.) Provides Insights into Flavonoid Biosynthesis. Hortic. Res. 2025, 12, uhaf198. [Google Scholar] [CrossRef] [PubMed]
  11. Jiang, Y.; Liu, D.; Guo, S. Application of the Grey System Theory in Deciding Climatic Regions Suitable to introduce Panax quinquefolium. Int. J. Biometeorol. 1991, 35, 55–60. [Google Scholar] [CrossRef]
  12. Fu, Y.B. Understanding Crop Genetic Diversity under Modern Plant Breeding. Theor. Appl. Genet. 2015, 128, 2131–2142. [Google Scholar] [CrossRef] [PubMed]
  13. Sant’Anna, I.D.C.; Cruz, C.D.; Gouvêa, L.R.L.; Scaloppi Junior, E.J.; Freitas, R.S.D.; Gonçalves, P.D.S. Genetic Diversity Analyses of Rubber Tree Genotypes Based on UPOV Descriptors. Ind. Crops Prod. 2021, 165, 113416. [Google Scholar] [CrossRef]
  14. Abaya, A.; Zaro, G.C.; De La Mora Pena, A.; Hsiang, T.; Goodwin, P.H. Phenotypic and Genotypic Variation of Cultivated Panax quinquefolius. Plants 2024, 13, 300. [Google Scholar] [CrossRef]
  15. Bhagya, H.P.; Kalyana Babu, B.; Mathur, R.K.; Ramajayam, D.; Ravichandran, G.; Anitha, P. Oil Palm (Elaeis guineensis Jacq.) Germplasm Genome-Wide Association Analysis for the Oil Yield Traits Utilizing Microsatellite Markers. Ind. Crops Prod. 2024, 218, 118934. [Google Scholar] [CrossRef]
  16. Tlahig, S.; Mohamed, A.; Triki, T.; Yahia, Y.; Yehmed, J.; Yahia, H.; Guasmi, F.; Loumerem, M. Integrated Agro-Morphological and Molecular Characterization for Progeny Testing to Enhance Alfalfa Breeding in Arid Regions of Tunisia. J. Agric. Food Res. 2025, 20, 101793. [Google Scholar] [CrossRef]
  17. Zhou, Y.; Ye, Y.; Zhu, G.; Xu, Y.; Tan, J.; Liu, J. Diversity, Classification, and EST-SSR-based Association Analysis of Caladium Ornamental Traits. Physiol. Plant. 2023, 175, e13841. [Google Scholar] [CrossRef]
  18. Xia, P.; Huang, Y.; Zhu, J. The Complete Chloroplast Genome Sequences of 11 Panax Species: Providing Insights for Evolution and Species Identification. Ind. Crops Prod. 2025, 223, 120160. [Google Scholar] [CrossRef]
  19. Su, L.; Zhang, Y.; Yang, Y.; Qu, Y.; Cui, X.; Ge, F.; Liu, D. Development of SSR Markers on the Basis of the Panax notoginseng Transcriptome for Agronomic and Biochemical Trait Association Analyses. J. Appl. Res. Med. Aromat. Plants 2023, 34, 100475. [Google Scholar] [CrossRef]
  20. Zhang, F.; Hong, H.; Liu, X.; Wang, X.; Zhang, C.; Zhao, K.; Yuan, R.; Abdelghany, A.M.; Zhang, B.; Lamlom, S.F.; et al. Large-Scale Evaluation of Soybean Germplasm Reveals Geographic Patterns in Shade Tolerance and Identifies Elite Genotypes for Intercropping Systems. BMC Plant Biol. 2025, 25, 1092. [Google Scholar] [CrossRef] [PubMed]
  21. Khan, N.; Xing, F.; Feng, L.; Wang, Z.; Xin, M.; Xiong, S.; Wang, G.; Chen, H.; Du, W.; Li, Y. Comparative Yield, Fiber Quality and Dry Matter Production of Cotton Planted at Various Densities under Equidistant Row Arrangement. Agronomy 2020, 10, 232. [Google Scholar] [CrossRef]
  22. Leng, X.; Wang, S.; Wang, A.; Li, B.; Cheng, L.; Qiu, Y.; Liu, J.; Cui, J.; Nie, X.; Wang, W.; et al. Application of HPLC Combined with UPLC–Orbitrap-MS in Chemical Characterization, Quantitative Detection, and Species Authentication of Four Panax-Derived Products. Chromatographia 2026, 89, 211–227. [Google Scholar] [CrossRef]
  23. Wang, Z.H.; Wang, X.F.; Lu, T.; Li, M.R.; Jiang, P.; Zhao, J.; Liu, S.T.; Fu, X.Q.; Wendel, J.F.; Van De Peer, Y.; et al. Reshuffling of the Ancestral Core-Eudicot Genome Shaped Chromatin Topology and Epigenetic Modification in Panax. Nat. Commun. 2022, 13, 1902. [Google Scholar] [CrossRef]
  24. Du, L.; Zhang, C.; Liu, Q.; Zhang, X.; Yue, B. Krait: An Ultrafast Tool for Genome-Wide Survey of Microsatellites and Primer Design. Bioinformatics 2018, 34, 681–683. [Google Scholar] [CrossRef]
  25. Xu, Y.; Liu, C.; Yang, X.; Wu, K.; Gong, B. Genome-Wide Microsatellite Characterization and Marker Development in Diospyros Oleifera. Ind. Crops Prod. 2023, 203, 117182. [Google Scholar] [CrossRef]
  26. Yan, J.; Zheng, B.; Wang, S.; Xu, W.; Qian, M.; Ma, X.; Wu, H. Genetic Diversity and Fingerprinting of 231 Mango Germplasm Using Genome SSR Markers. Int. J. Mol. Sci. 2024, 25, 13625. [Google Scholar] [CrossRef]
  27. Wan, M.; Lu, W.; Gao, L.; Li, C.; Liu, H.; Zhao, C.; Ai, X. Genetic Diversity Analysis of Water Lily Germplasms Based on Morphological Traits and SSR Markers. Plants 2025, 14, 1365. [Google Scholar] [CrossRef]
  28. Singh, R.K.; Chaudhary, B.D. Biometrical Methods in Quantitative Genetic Analysis. Biometrics 1978, 34, 723. [Google Scholar] [CrossRef][Green Version]
  29. Hotelling, H. Analysis of a Complex of Statistical Variables into Principal Components. J. Educ. Psychol. 1933, 24, 417–441. [Google Scholar] [CrossRef]
  30. Tian, W.; Li, Z.; Wang, L.; Sun, S.; Wang, D.; Wang, K.; Wang, G.; Liu, Z.; Lu, X.; Feng, J.; et al. Comprehensive Evaluation of Apple Germplasm Genetic Diversity on the Basis of 26 Phenotypic Traits. Agronomy 2024, 14, 1264. [Google Scholar] [CrossRef]
  31. Yeh, F.C.; Yang, R.; Boyle, T.; Ye, Z.; Mao, J. POPGENE, the User-Friendly Shareware for Population Genetic Analysis; Molecular Biology and Biotechnology Centre, University of Alberta: Edmonton, AB, Canada, 1997. [Google Scholar]
  32. Liu, K.; Muse, S.V. PowerMarker: An Integrated Analysis Environment for Genetic Marker Analysis. Bioinformatics 2005, 21, 2128–2129. [Google Scholar] [CrossRef]
  33. Nei, M. Estimation of average heterozygosity and genetic distance from a small number of individuals. Genetics 1978, 89, 583–590. [Google Scholar] [CrossRef]
  34. Legendre, P.; Fortin, M. Comparison of the Mantel Test and Alternative Approaches for Detecting Complex Multivariate Relationships in the Spatial Analysis of Genetic Data. Mol. Ecol. Resour. 2010, 10, 831–844. [Google Scholar] [CrossRef]
  35. Tamura, K.; Stecher, G.; Kumar, S. MEGA11: Molecular Evolutionary Genetics Analysis Version 11. Mol. Biol. Evol. 2021, 38, 3022–3027. [Google Scholar] [CrossRef]
  36. Letunic, I.; Bork, P. Interactive Tree of Life (iTOL) v6: Recent Updates to the Phylogenetic Tree Display and Annotation Tool. Nucleic Acids Res. 2024, 52, W78–W82. [Google Scholar] [CrossRef]
  37. Proctor, J.T.A.; Slimmon, T.; Saxena, P.K. Modulation of Root Growth and Organogenesis in Thidiazuron-Treated Ginseng (Panax quinquefolium L.). Plant Growth Regul. 1996, 20, 201–208. [Google Scholar] [CrossRef]
  38. Nardino, M.; Silva, F.F.E.; Olivoto, T.; Barros, W.S.; Carvalho, C.G.D.; Signorini, V.S.; Mezzomo, H.C.; Casagrande, C.R. Meta-Analysis of the Experimental Coefficient of Variation in Wheat Using the Bayesian and Frequentist Approaches. Sci. Agric. 2023, 80, e20210190. [Google Scholar] [CrossRef]
  39. Yetgin, A. Exploring the Dynamic Nature of Root Plasticity and Morphology in the Face of Changing Environments. Ecol. Front. 2024, 44, 112–119. [Google Scholar] [CrossRef]
  40. Zhao, D.; De Voil, P.; Sadras, V.O.; Palta, J.A.; Rodriguez, D. The Plasticity of Root Traits and Their Effects on Crop Yield and Yield Stability. Plant Soil 2025, 513, 367–382. [Google Scholar] [CrossRef]
  41. Drisya Ravi, R.S.; Nair, B.R.; Siril, E.A. Morphological Diversity, Phenotypic and Genotypic Variance and Heritability Estimates in Moringa oleifera Lam.: A Less Used Vegetable with Substantial Nutritional Value. Genet. Resour. Crop Evol. 2021, 68, 3241–3256. [Google Scholar] [CrossRef]
  42. Palange, N.J.; Obua, T.; Sserumaga, J.P.; Wembabazi, E.; Ochwo-Ssemakula, M.; Badji, A.; Nuwamanya, E.; Dramadri, I.O.; Edema, R.; Matovu, M.; et al. Genetic Variability of Anti-Nutritional Factors among Soybean (Glycine Max.) Germplasm. Discov. Agric. 2025, 3, 63. [Google Scholar] [CrossRef]
  43. Rasheed, A.; Ilyas, M.; Khan, T.N.; Mahmood, A.; Riaz, U.; Chattha, M.B.; Al Kashgry, N.A.T.; Binothman, N.; Hassan, M.U.; Wu, Z.; et al. Study of Genetic Variability, Heritability, and Genetic Advance for Yield-Related Traits in Tomato (Solanum lycopersicon MILL.). Front. Genet. 2023, 13, 1030309. [Google Scholar] [CrossRef]
  44. Choquette, N.E.; Holland, J.B.; Weldekidan, T.; Drouault, J.; De Leon, N.; Flint-Garcia, S.; Lauter, N.; Murray, S.C.; Xu, W.; Wisser, R.J. Environment-specific Selection Alters Flowering-time Plasticity and Results in Pervasive Pleiotropic Responses in Maize. New Phytol. 2023, 238, 737–749. [Google Scholar] [CrossRef]
  45. Terfa, G.N.; Gurmu, G.N. Genetic Variability, Heritability and Genetic Advance in Linseed (Linum usitatissimum L) Genotypes for Seed Yield and Other Agronomic Traits. Oil Crop Sci. 2020, 5, 156–160. [Google Scholar] [CrossRef]
  46. Ganapati, R.K.; Rasul, M.G.; Sarker, U.; Singha, A.; Faruquee, M. Gene Action of Yield and Yield Contributing Traits of Submergence Tolerant Rice (Oryza sativa L.) in Bangladesh. Bull. Natl. Res. Cent. 2020, 44, 8. [Google Scholar] [CrossRef]
  47. Freschet, G.T.; Swart, E.M.; Cornelissen, J.H.C. Integrated Plant Phenotypic Responses to Contrasting Above- and Below-ground Resources: Key Roles of Specific Leaf Area and Root Mass Fraction. New Phytol. 2015, 206, 1247–1260. [Google Scholar] [CrossRef] [PubMed]
  48. Dorken, M.E.; Van Kleunen, M.; Stift, M. Costs of Reproduction in Flowering Plants. New Phytol. 2025, 247, 55–70. [Google Scholar] [CrossRef]
  49. Pu, R.; Cheng, Y.; Zeng, J.; Wang, H.; Li, N.; Gao, M.; Ma, J.; Cui, X. Metabolomic and Transcriptomic Analysis of Panax notoginseng Root: Mechanistic Insights into the Effects of Flower Bud Removal on Yield and Phytochemical Composition. Ind. Crops Prod. 2025, 223, 120138. [Google Scholar] [CrossRef]
  50. Schlag, E.M.; McIntosh, M.S. Ginsenoside Content and Variation among and within American Ginseng (Panax quinquefolius L.) Populations. Phytochemistry 2006, 67, 1510–1519. [Google Scholar] [CrossRef]
  51. Zhao, H.; Huang, X.; Yang, Z.; Li, F.; Ge, X. Synergistic Optimization of Crops by Combining Early Maturation with Other Agronomic Traits. Trends Plant Sci. 2023, 28, 1178–1191. [Google Scholar] [CrossRef] [PubMed]
  52. Negi, A.; Singh, K.; Jaiswal, S.; Kokkat, J.G.; Angadi, U.B.; Iquebal, M.A.; Umadevi, P.; Rai, A.; Kumar, D. Rapid Genome-Wide Location-Specific Polymorphic SSR Marker Discovery in Black Pepper by GBS Approach. Front. Plant Sci. 2022, 13, 846937. [Google Scholar] [CrossRef]
  53. Xu, J.; Wang, Y.; Wu, K.; Chen, J. Identification and Characterization of Functionally Relevant SSR Markers in Natural Dalbergia Odorifera Populations. BMC Plant Biol. 2024, 24, 315. [Google Scholar] [CrossRef]
  54. Mao, J.; Huang, D.; Wang, K.; Peng, H.; Yao, X.; Mao, Y.; Jiao, L.; Wang, H.; Long, Y.; Tan, R.; et al. Genetic Diversity and Population Structure of Tea (Camellia sinensis) Germplasm from the Xizang Plateau. Horticulturae 2025, 12, 50. [Google Scholar] [CrossRef]
  55. Duan, N.; Bai, Y.; Sun, H.; Wang, N.; Ma, Y.; Li, M.; Wang, X.; Jiao, C.; Legall, N.; Mao, L.; et al. Genome Re-Sequencing Reveals the History of Apple and Supports a Two-Stage Model for Fruit Enlargement. Nat. Commun. 2017, 8, 249. [Google Scholar] [CrossRef]
  56. Schluter, C.; Punja, Z.K. Genetic Diversity among Natural and Cultivated Field Populations and Seed Lots of American Ginseng (Panax quinquefolius L.) in Canada. Int. J. Plant Sci. 2002, 163, 427–439. [Google Scholar] [CrossRef]
  57. Holderegger, R.; Kamm, U.; Gugerli, F. Adaptive vs. Neutral Genetic Diversity: Implications for Landscape Genetics. Landsc. Ecol. 2006, 21, 797–807. [Google Scholar] [CrossRef]
  58. Morrell, P.L.; Buckler, E.S.; Ross-Ibarra, J. Crop Genomics: Advances and Applications. Nat. Rev. Genet. 2012, 13, 85–96. [Google Scholar] [CrossRef] [PubMed]
  59. Dempewolf, H.; Krishnan, S.; Guarino, L. Our Shared Global Responsibility: Safeguarding Crop Diversity for Future Generations. Proc. Natl. Acad. Sci. USA 2023, 120, e2205768119. [Google Scholar] [CrossRef]
  60. Odong, T.L.; Jansen, J.; Van Eeuwijk, F.A.; Van Hintum, T.J.L. Quality of Core Collections for Effective Utilisation of Genetic Resources Review, Discussion and Interpretation. Theor. Appl. Genet. 2013, 126, 289–305. [Google Scholar] [CrossRef]
  61. Wang, W.; Ma, H.; Qi, Y.; Ye, J.; Lu, M.; Wei, X. Scientific Evolution and Translational Horizons of Plant Core Germplasm: A Global Bibliometric Synthesis and Strategic Insights. Front. Plant Sci. 2026, 17, 1771164. [Google Scholar] [CrossRef] [PubMed]
  62. Wambugu, P.W.; Henry, R. Supporting in Situ Conservation of the Genetic Diversity of Crop Wild Relatives Using Genomic Technologies. Mol. Ecol. 2022, 31, 2207–2222. [Google Scholar] [CrossRef]
  63. FAO. Genebank Standards for Plant Genetic Resources for Food and Agriculture; Food and Agriculture Organization of the United Nations: Rome, Italy, 2014. [Google Scholar]
  64. McCouch, S.R.; Rieseberg, L.H. Harnessing Crop Diversity. Proc. Natl. Acad. Sci. USA 2023, 120, e2221410120. [Google Scholar] [CrossRef]
Figure 1. Geographical distribution and morphological diversity of the 51 P. quinquefolius accessions evaluated in this study. (A) Illustration of the overall plant morphology of P. quinquefolius, highlighting key anatomical structures. (B) Geographical distribution map showing the collection sites and frequency of the accessions across major production regions in China. The color gradient indicates the density of germplasm resources collected from each province. (C) Representative phenotypic variations observed in the 10 evaluated qualitative traits, encompassing diversity in fruit, inflorescence, stem, and leaf characteristics.
Agronomy 16 01098 g001
Figure 2. Pearson correlation matrix heatmap depicting the relationships among 18 quantitative agronomic traits in P. quinquefolius. The color scale on the right indicates the correlation coefficient values, ranging from dark blue (negative correlation) to dark red (positive correlation).
Agronomy 16 01098 g002
Figure 3. Principal component analysis (PCA) of 18 quantitative agronomic traits across 51 P. quinquefolius accessions. (A) Scree plot illustrating the eigenvalues of the extracted principal components. The first six components with eigenvalues greater than 1.0 were retained, cumulatively explaining 78.50% of the total phenotypic variance. (B) PCA biplot showing the projection of the 51 accessions (red dots) and the trait loading vectors (blue lines) along the first two principal components (PC1 and PC2). PC1 and PC2 account for 23.60% and 20.57% of the variance, respectively. The direction and length of the blue vectors indicate the contribution and correlation of each agronomic trait to the principal components.
Agronomy 16 01098 g003
Figure 4. Hierarchical clustering dendrogram of the 51 P. quinquefolius accessions constructed using UPGMA based on Euclidean distances of 18 quantitative traits. The four distinct clusters (Groups I–IV) identified are highlighted in red, blue, green, and purple branches, respectively. The scale bar represents the Euclidean distance coefficient.
Agronomy 16 01098 g004
Figure 5. Characteristics of SSR markers in P. quinquefolius genome. (A) The number and proportion of SSR markers of different motif types in the genome of P. quinquefolius. The pie chart indicated the microsatellite proportion. (B) The frequency distribution of motif types with different repetition times. (C) The number and proportion of SSR markers of each motif type. The pie chart indicated the microsatellite proportion.
Agronomy 16 01098 g005
Figure 6. UPGMA cluster analysis of 51 P. quinquefolius accessions based on SSR molecular markers. Inner ring symbols denote geographical origins (provinces), while the outer colored sectors (Groups I–V) represent the five identified genetic clusters.
Agronomy 16 01098 g006
Table 1. Detailed descriptions, coding systems, observation stage and measurement criteria for the 28 agronomic traits evaluated in P. quinquefolius accessions.
No.Trait CodeTrait NameObservation StageRecording Criteria
1ITInflorescence typeInitial flowering stageSimple = 1, compound = 2
2BBBud bractsInitial flowering stageAbsence = 1, presence = 2
3FCFruit colorFruit ripening stageYellow = 1, red = 2
4ESEar shapeFruit ripening stageUmbrella type = 1, spherical = 2
5PGTPetiole growth typeFruit ripening stageErect = 1, semi-erect = 2, horizontal = 3
6LESDLeaf edge sawtooth degreeFruit ripening stageWeak = 1, medium = 2, strong = 3
7LCLeaf colorFruit ripening stageLight green = 1, green = 2, dark green = 3
8LSLeaf shapeFruit ripening stageElliptical = 1, obovate = 2
9SCStem colorFruit ripening stageGreen = 1, purple with green = 2, purple = 3
10STStem typeFruit ripening stageSingle stem = 1, double stem = 2
11IFPInitial flowering periodInitial flowering stageThe number of days from the emergence stage to the time when 1–3 whorls of flower buds in the outer circle of the inflorescence of 25% of the plants in the plot start to bloom
12FRPFruit ripening periodFruit ripening stageThe number of days from the emergence date to the time when the fruit color of 90% of the plants in the plot turns into the mature color
13SHStem heightFruit ripening stageThe height from the base of the stem to the attachment point of the petiole, measured with steel ruler
14SDStem diameterFruit ripening stageThe diameter of the stem base, measured with digital vernier calipers
15PLPetiole lengthFruit ripening stageThe length from the base of the petiole to the attachment point of the leaf blade, measured with a steel ruler
16LLLeaf lengthFruit ripening stageThe length of the middle leaflet of the compound leaf, measured with a steel ruler
17LWLeaf widthFruit ripening stageThe width of the middle leaflet of the compound leaf, measured with a steel ruler
18LLWRLeaf length to width ratioFruit ripening stageThe ratio of leaf length to leaf width
19PL′Peduncle lengthFruit ripening stageThe length from the base of the pedicel to the attachment point of the inflorescence, measured with a steel ruler
20TSWThousand seed weightFruit ripening stageThe weight of 1000 seeds
21RLRhizome lengthPlant senescence stageThe length from the base of the rhizome to the junction with the stem, measured with digital vernier calipers
22RTRhizome thicknessPlant senescence stageThe thickness at the widest part of the rhizome, measured with digital vernier calipers
23TLTaproot lengthPlant senescence stageThe length from the base of the rhizome to the forking point of the main root, measured with a steel ruler
24TDTaproot diameterPlant senescence stageThe diameter at the widest part of the main root, measured with digital vernier calipers
25NLRNumber of lateral rootsPlant senescence stageThe number of lateral roots
26NFRNumber of fibrous rootsPlant senescence stageThe number of fibrous roots
27FRWFresh root weightPlant senescence stageThe weight of fresh roots
28GCGinsenoside contentPlant senescence stageThe sum of the contents of ginsenosides Rg1, Re, and Rb1
Note: The traits are categorized into two groups: Qualitative traits (No. 1–10), which are scored based on distinct morphological categories, and Quantitative traits (No. 11–28), which are measured biological parameters.
Table 2. Primer sequences and amplification characteristics of 12 polymorphic SSR markers developed for P. quinquefolius.
PrimersRepetitive MotifPrimer Sequence (5′–3′)Product Size (bp)Annealing Temperature (°C)
Pq29(GTA)11(CAG)5F: GGGCAAATCAAATAAAGGAG
R: GAGTGATTGCAGAGCAGGGT
15362
Pq164(AT)12F: ACCTAGAGATGGATCCCGGT
R: GATGCATGTGCGGCTAGATA
18062
Pq298(CGA)6F: TGCGCAGATACCTACTCGTG
R: TCCACGGTCTCAAATCCTTC
20660
Pq303(GCT)9F: AAAGCAGGGTGTGCTCACTT
R: AGGGAGACCGGAGCATTATT
19855
Pq346(ATC)8F: TAGGCACCCTCGACTTCTGT
R: TATTTCCGCTGTGCGTTTCT
20060
Pq455(AT)12F: AAGGGGCACTGTGTAAGAAAA
R: CCGTAGGGGAGAAAATGAAT
22662
Pq460(ATT)15F: CGTTGCTTCCCTTGCCTTTGAT
R: GCCGTGCGCCATCTTTTATTT
30562
Pq584(GAT)6F: ACCTCTGGCTGGGCTGGTCAAT
R: TCGGGGAGGAGTCGAGCTAGGG
22462
Pq601(TC)7F: GGGTACCATCGAGATGTGCT
R: GATCTCCTGTCTGCCCTACG
19562
Pq807(TG)8F: CCGGGGATTGAAGCAGGAAT
R: CACCCGGCCCACACATATAT
26156
Pq827(TA)11F: TTATCCAGGTGGAGGTATGG
R: CCACTGATGATCATTTCCTT
20856
Pq1038(AGC)7F: AAAGGAGATAGTAGATGTTATGTGGTT
R: CAAACCAGGCATCCCTAATC
18662
Table 3. Frequency distribution and genetic diversity indices (H′) of 10 qualitative morphological traits across the 51 P. quinquefolius accessions.
TraitsFrequency Distribution (%)H
123
Inflorescence type84.3115.69 0.43
Bud bracts94.125.88 0.22
Fruit color9.8090.20 0.32
Ear shape25.4974.51 0.57
Petiole growth type72.5517.659.800.76
Leaf edge sawtooth degree35.2945.1019.611.05
Leaf color11.7672.5515.690.77
Leaf shape5.8894.12 0.22
Stem color58.8523.5317.650.96
Stem type86.2713.73 0.40
Note: The numbers 1, 2, and 3 correspond to the specific phenotypic categories consistent with the recording criteria detailed in Table 1. H′: Shannon–Weaver genetic diversity index.
Table 4. Estimates of genetic parameters, variance components, and heritability for 18 quantitative agronomic traits in P. quinquefolius.
TraitsGrand MeanRangeVgVpVeR2ECV (%)GCV (%)PCV (%)H2 (%)
Initial flowering period (day)50.0441.33–55.6710.8114.914.100.734.056.577.7272.50
Fruit ripening period (day)110.29104.67–116.009.4712.783.310.741.652.793.2474.10
Stem height (cm)27.1511.94–46.5067.1191.6824.570.7318.2630.1735.2773.20
Stem diameter (mm)6.544.49–9.681.121.500.380.759.4216.1818.7474.50
Petiole length (cm)9.835.29–15.453.204.451.250.7211.3718.2221.4671.90
Leaf length (cm)12.739.06–20.347.3710.453.080.7113.7821.3225.4070.50
Leaf width (cm)7.015.15–10.501.592.180.590.7310.9517.9521.0772.80
Leaf length to width ratio1.841.35–2.630.150.220.070.6914.3820.8925.5068.90
Peduncle length (cm)38.2432.06–44.546.268.762.500.724.146.547.7471.50
Thousand seed weight (g)13.225.55–22.115.267.091.830.7410.2317.3420.1474.20
Rhizome length (mm)9.994.40–16.702.233.401.170.6610.8214.9518.4665.50
Rhizome thickness (mm)10.224.44–17.2014.8921.246.350.7024.6637.7445.1070.10
Taproot length (cm)10.094.81–17.2113.0419.416.370.6725.0235.7843.6467.20
Taproot diameter (mm)19.0611.83–32.4811.9517.195.240.7012.0118.1321.7569.50
Number of lateral roots2.500.87–4.130.801.070.270.7520.7835.8941.3874.80
Number of fibrous roots19.927.37–33.8340.2965.2925.000.6225.1031.8740.5461.70
Fresh root weight (g)26.4317.25–48.8684.24112.9228.680.7520.2734.7240.2074.60
Ginsenoside content (%)2.711.68–3.670.210.310.100.6811.6616.8920.5568.40
Note: Vg: Genotypic variance; Vp: Phenotypic variance; Ve: Environmental variance; R2: Coefficient of determination; ECV: Environmental Coefficient of Variation; GCV: Genotypic coefficient of variation; PCV: Phenotypic coefficient of variation; H2: Broad-sense heritability.
Table 5. Comprehensive evaluation and ranking of 51 P. quinquefolius accessions based on principal component scores.
AccessionPrincipal Component ValueF-ValueRanking
F1F2F3F4F5F6
CY32.634.291.44−0.300.503.151.671
KD11.393.960.350.520.75−0.741.192
DH1−0.892.150.371.111.360.240.863
LH2−2.913.81−1.611.91−0.19−0.230.824
AT1−1.442.111.380.35−0.18−0.030.795
QY2−3.812.211.62−0.180.55−2.240.676
LH1−1.022.05−0.290.531.73−0.370.647
RH33.262.60−0.460.260.48−1.120.648
JY1−1.473.36−0.51−1.410.63−0.690.639
KD2−2.441.79−0.822.800.97−0.310.6210
JZ20.382.330.20−0.500.28−0.340.6011
DHC1.650.741.360.67−1.470.420.4312
TH40.331.601.00−1.420.02−0.710.4113
TH22.731.141.26−1.70−0.470.590.4014
TH31.030.411.40−0.89−0.331.700.3815
WQ1−0.16−0.523.170.27−0.17−0.990.3716
QY12.20−0.902.570.440.500.270.3617
QY3−1.641.63−1.172.42−2.101.280.3518
JZ13.440.650.30−0.141.08−0.440.3319
ZNYS-25.82−1.010.231.672.02−0.760.1720
RH1−2.60−0.390.051.001.400.610.1321
WD3−2.511.72−1.71−1.581.130.340.0722
LB30.64−0.782.41−0.23−1.35−0.920.0323
RH22.340.150.27−0.78−1.680.95−0.0324
JY2−1.65−0.071.00−1.950.07−0.06−0.0725
BQ30.82−1.352.28−1.07−0.18−0.42−0.0926
TH1−2.380.241.11−1.59−1.77−0.39−0.1227
BQ11.82−1.220.142.65−1.29−0.43−0.1428
JA1−0.58−1.021.91−0.23−1.37−0.79−0.1429
LB1−2.16−3.322.380.800.751.96−0.2030
WD11.510.72−2.23−1.57−0.312.22−0.2031
DHB−0.77−0.62−0.660.71−1.261.53−0.2232
LB2−2.57−1.270.87−0.740.540.40−0.2233
CY4−2.25−0.36−0.720.21−1.251.16−0.2534
CY1−1.07−1.220.29−0.380.83−0.44−0.2935
LH30.82−0.63−0.751.35−1.69−0.22−0.3136
JA21.14−2.481.47−0.190.26−0.13−0.3837
ST2−0.18−0.24−1.18−0.96−0.300.23−0.3838
DHA−1.27−1.41−0.790.060.91−0.43−0.4839
BQ2−2.59−1.71−0.700.420.270.64−0.5140
ZNYS-12.53−1.70−1.562.25−0.710.03−0.5141
ST31.27−1.83−0.30−1.070.93−0.19−0.5542
DH30.79−2.690.890.500.03−1.64−0.6043
QY4−2.13−1.950.67−0.82−1.15−0.48−0.6544
JNYS-11.54−2.43−1.67−0.302.560.12−0.7045
CY2−1.06−1.48−1.320.49−0.98−1.07−0.7546
ST10.98−0.90−2.790.09−0.01−1.07−0.7847
WD42.44−0.54−3.53−1.08−0.210.34−0.8348
DH2−1.62−3.57−1.030.810.800.96−0.9349
WD21.340.68−4.11−1.56−2.22−1.87−1.0150
SYB−1.67−2.77−2.47−1.631.310.32−1.2251
Note: F1–F6: Principal component scores calculated for each accession corresponding to the six extracted components (PC1–PC6 defined in Table 5). A positive score indicates a strong expression of the traits associated with that component. F-Value: The comprehensive evaluation score, calculated as the weighted sum of the six component scores using their respective variance contribution rates as weights. Ranking: Accessions are ranked in descending order based on the F-Value. A higher ranking indicates superior overall agronomic performance.
Table 6. Genetic diversity parameters and polymorphism information content (PIC) of the 12 selected SSR markers across the 51 P. quinquefolius accessions.
PrimersNaNeHIPIC
Pq294.003.010.310.490.34
Pq1647.006.530.460.660.53
Pq2985.004.980.080.110.46
Pq3034.003.990.260.370.55
Pq34616.007.920.270.430.83
Pq4556.005.440.170.250.49
Pq4608.007.270.450.640.61
Pq5845.004.910.490.680.42
Pq6016.005.000.360.530.29
Pq80711.004.640.310.480.86
Pq8276.004.970.390.570.61
Pq10388.006.680.400.580.63
Mean7.175.440.330.480.55
Note: Na: Observed number of alleles, Ne: Effective number of alleles, H: Nei’s gene diversity index, I: Shannon’s information index, PIC: Polymorphism information content.
Disclaimer/Publisher’s Note: The statements, opinions and data contained in all publications are solely those of the individual author(s) and contributor(s) and not of MDPI and/or the editor(s). MDPI and/or the editor(s) disclaim responsibility for any injury to people or property resulting from any ideas, methods, instructions or products referred to in the content.