Article

Seasonal Soil Compaction Risk Mapping for Agricultural Management Using Earth Observation Data and Multi-Criteria Analysis in Italy


1
Department of Land, Environmental, Agriculture and Forestry, University of Padova, Viale dell’Università 16, 35020 Legnaro, Italy
2
Uptoearth GmbH, 64293 Darmstadt, Germany
*
Author to whom correspondence should be addressed.
Agronomy 2026, 16(11), 1071; https://doi.org/10.3390/agronomy16111071
Submission received: 27 April 2026 / Revised: 26 May 2026 / Accepted: 27 May 2026 / Published: 29 May 2026

Abstract

Soil compaction is a widespread yet insufficiently monitored form of agricultural land degradation, affecting approximately 25% of global soils and nearly 33% of European subsoils, with consequential reductions in soil physical functionality, crop performance, and long-term sustainability; however, approaches for national-scale compaction risk mapping remain limited. A geospatial decision support framework was developed to quantify and map susceptibility to compaction risk across Italy by integrating Earth observation products with multi-criteria decision analysis within a GIS-based Analytic Hierarchy Process. The model combined four indicators: (i) Soil Moisture Index derived from Sentinel 1 C band SAR time series (2018 to 2024), (ii) the Sentinel 2 Normalized Difference Tillage Index, (iii) clay fraction from SoilGrids 2.0, and (iv) an Intensity of Agricultural Practice Index derived from national census statistics. The approach was applied to 74,156 km2 of bare soil surfaces across all 20 regions to generate 100 m seasonal and multi-year mean risk maps. Extreme risk (high plus very high) exhibited a bimodal seasonal behavior, occupying 53.6% in winter and 55.5% in autumn, while declining to 24.8% in spring and 26.5% in summer; Southern Italy showed the largest seasonal amplitude (40.7%), and Friuli Venezia Giulia persisted as a hotspot exceeding 50% in all seasons. Comparison with the independent bulk density observations yielded 31.24% accuracy, largely constrained by the temporal mismatch between dynamic processes and static reference data, which represents a constraint of this research. The framework provides an initial screening tool for mapping susceptibility to soil compaction aligned with the EU Soil Strategy 2023 to 2030, supporting targeted interventions by prioritizing spring (March to May) as a low-risk remediation window; however, local conditions must be checked because cultivated crop types are highly diverse, and cropping cycles vary significantly from one species to another.

1. Introduction

Soil compaction is a pervasive form of physical soil degradation that constrains agricultural productivity and threatens the long-term functioning of intensively managed agroecosystems. The process is initiated when external mechanical stresses reorganize soil aggregates into denser packing states, thereby reducing the volume and connectivity of structural pores that regulate aeration, infiltration, and root penetration [1,2]. This alteration of soil architecture produces a coupled set of cause-and-effect responses, including increased bulk density and penetration resistance alongside decreased total and macroporosity, which collectively limit gas exchange, restrict water movement, and impair nutrient supply to crops [3,4,5]. As mechanized operations become more frequent and loads increase, the probability of traffic-induced compaction rises, and yield declines observed in historically fertile regions have been repeatedly associated with cumulative compaction pressures originating from contemporary management systems [6,7,8].
The magnitude of the problem is reflected in continental to global assessments, indicating that approximately 25% of the world’s soils are severely compacted [9], with the most pronounced impacts reported in highly mechanized agricultural regions of Europe and the Americas [10]. Within Europe, estimates have converged on large affected areas and critical subsoil constraints: early evaluations suggested that about 33 million hectares were impacted by compaction-related degradation [11], and subsequent analyses reported that around 25% of subsoils at 0.25 to 0.7 m depth exhibit critically high relative normalized density [12]. EUSO reporting further highlights that nearly one-third of subsoils are highly susceptible and roughly one-fifth are moderately vulnerable [13,14]. Notwithstanding this evidence base, robust spatially explicit monitoring remains limited, primarily because compaction exhibits strong spatiotemporal variability and is not readily captured through sparse field sampling or static indicator layers [14].
Compaction susceptibility arises from interacting natural and anthropogenic controls whose relative importance varies by soil type, climate, and management intensity. Inherent susceptibility is strongly governed by soil water status, texture, initial packing density, and mineralogical composition, with clay fraction exerting particularly influential control on both deformation behavior and recovery trajectories [15]. Clay-rich soils often exhibit elevated plasticity and low hydraulic conductivity, which increases the probability that traffic applied under moist conditions will induce persistent structural collapse [16]. Anthropogenic pressure has intensified as machinery size and axle loads have increased, and repeated passes during field operations progressively compress soil and reduce pore continuity, especially when operations coincide with high water contents [12,17,18]. However, divergent hypotheses persist regarding the net mitigation potential of alternative management systems, because conventional tillage can simultaneously alleviate shallow compaction while promoting subsoil densification, whereas reduced tillage and controlled traffic may reduce disturbance yet can be insufficient to offset high wheel loads under adverse moisture regimes [6].
Methodological development has therefore focused on predicting where, when, and to what degree soils are likely to compact under field traffic. Early assessments relied on expert-driven indices parameterized with soil texture, packing density, and moisture deficit proxies [19], whereas mechanistic approaches such as SOCOMO and SoilFlex evaluated compaction risk by comparing soil strength metrics with wheel loads and tire inflation pressures to produce maps at regional to continental scales [20,21,22]. Probabilistic frameworks, including Bayesian Belief Networks and Monte Carlo-based geostatistical simulations, have been introduced to represent uncertainty explicitly through the integration of soil databases, hydraulic parameters, and expert knowledge [23,24]. More recent dynamic models, such as SaSCiA, have coupled weather forcing, crop growth, and traffic intensity information to generate high-resolution spatiotemporal risk estimates [25,26]. A persistent limitation across these approaches is that national-scale implementation is often constrained by its dependence on static assumptions, sparse measurements, or input data, while also lacking sufficient temporal frequency to represent short-term moisture-driven shifts in soil bearing capacity.
Traditional field sampling for soil health monitoring is very time- and resource-consuming, making it inappropriate for large-scale dynamic studies. Integrating Earth Observation (EO)-based Remote Sensing and GIS techniques addresses this limitation by providing a synoptic, repeatable methodology to monitor surface conditions. Recent syntheses have documented expanding use of thermal and radar observations for soil degradation monitoring [27,28]. C-band Synthetic Aperture Radar data from Sentinel-1 are sensitive to moisture-induced changes in soil dielectric properties that modify radar backscatter, enabling operational mapping of near-surface moisture variability across agricultural landscapes [29,30]. Sentinel-2 multispectral imagery further supports the characterization of crop residue cover through shortwave infrared reflectance behavior, summarized using indices such as the Normalized Difference Tillage Index. These indices can be integrated and combined with static soil attributes, such as the clay fraction, and agricultural management intensity indicators in GIS using the Analytic Hierarchy Process, a widely used method for environmental suitability and hazard assessments [31]. This reproducible methodology identifies seasonal compaction hotspots to enable precision traffic planning, targeted remediation, and alignment with mandatory EU Soil Strategy monitoring initiatives [32].

2. Materials and Methods

2.1. Study Area and Spatial Framework

The study area comprises agricultural land in Italy where repeated field traffic and soil disturbance associated with plowing, harrowing, and seedbed preparation constitute the dominant anthropogenic drivers of soil compaction, and where spatial variability in texture and seasonal wetness is expected to strongly modulate deformation susceptibility and its persistence. To ensure that the analysis targeted surfaces most directly exposed to machinery-induced stress, the spatial domain was restricted to bare agricultural soils, thereby minimizing spectral and biophysical interference from standing vegetation and enabling consistent derivation of Earth observation indicators relevant to compaction risk.
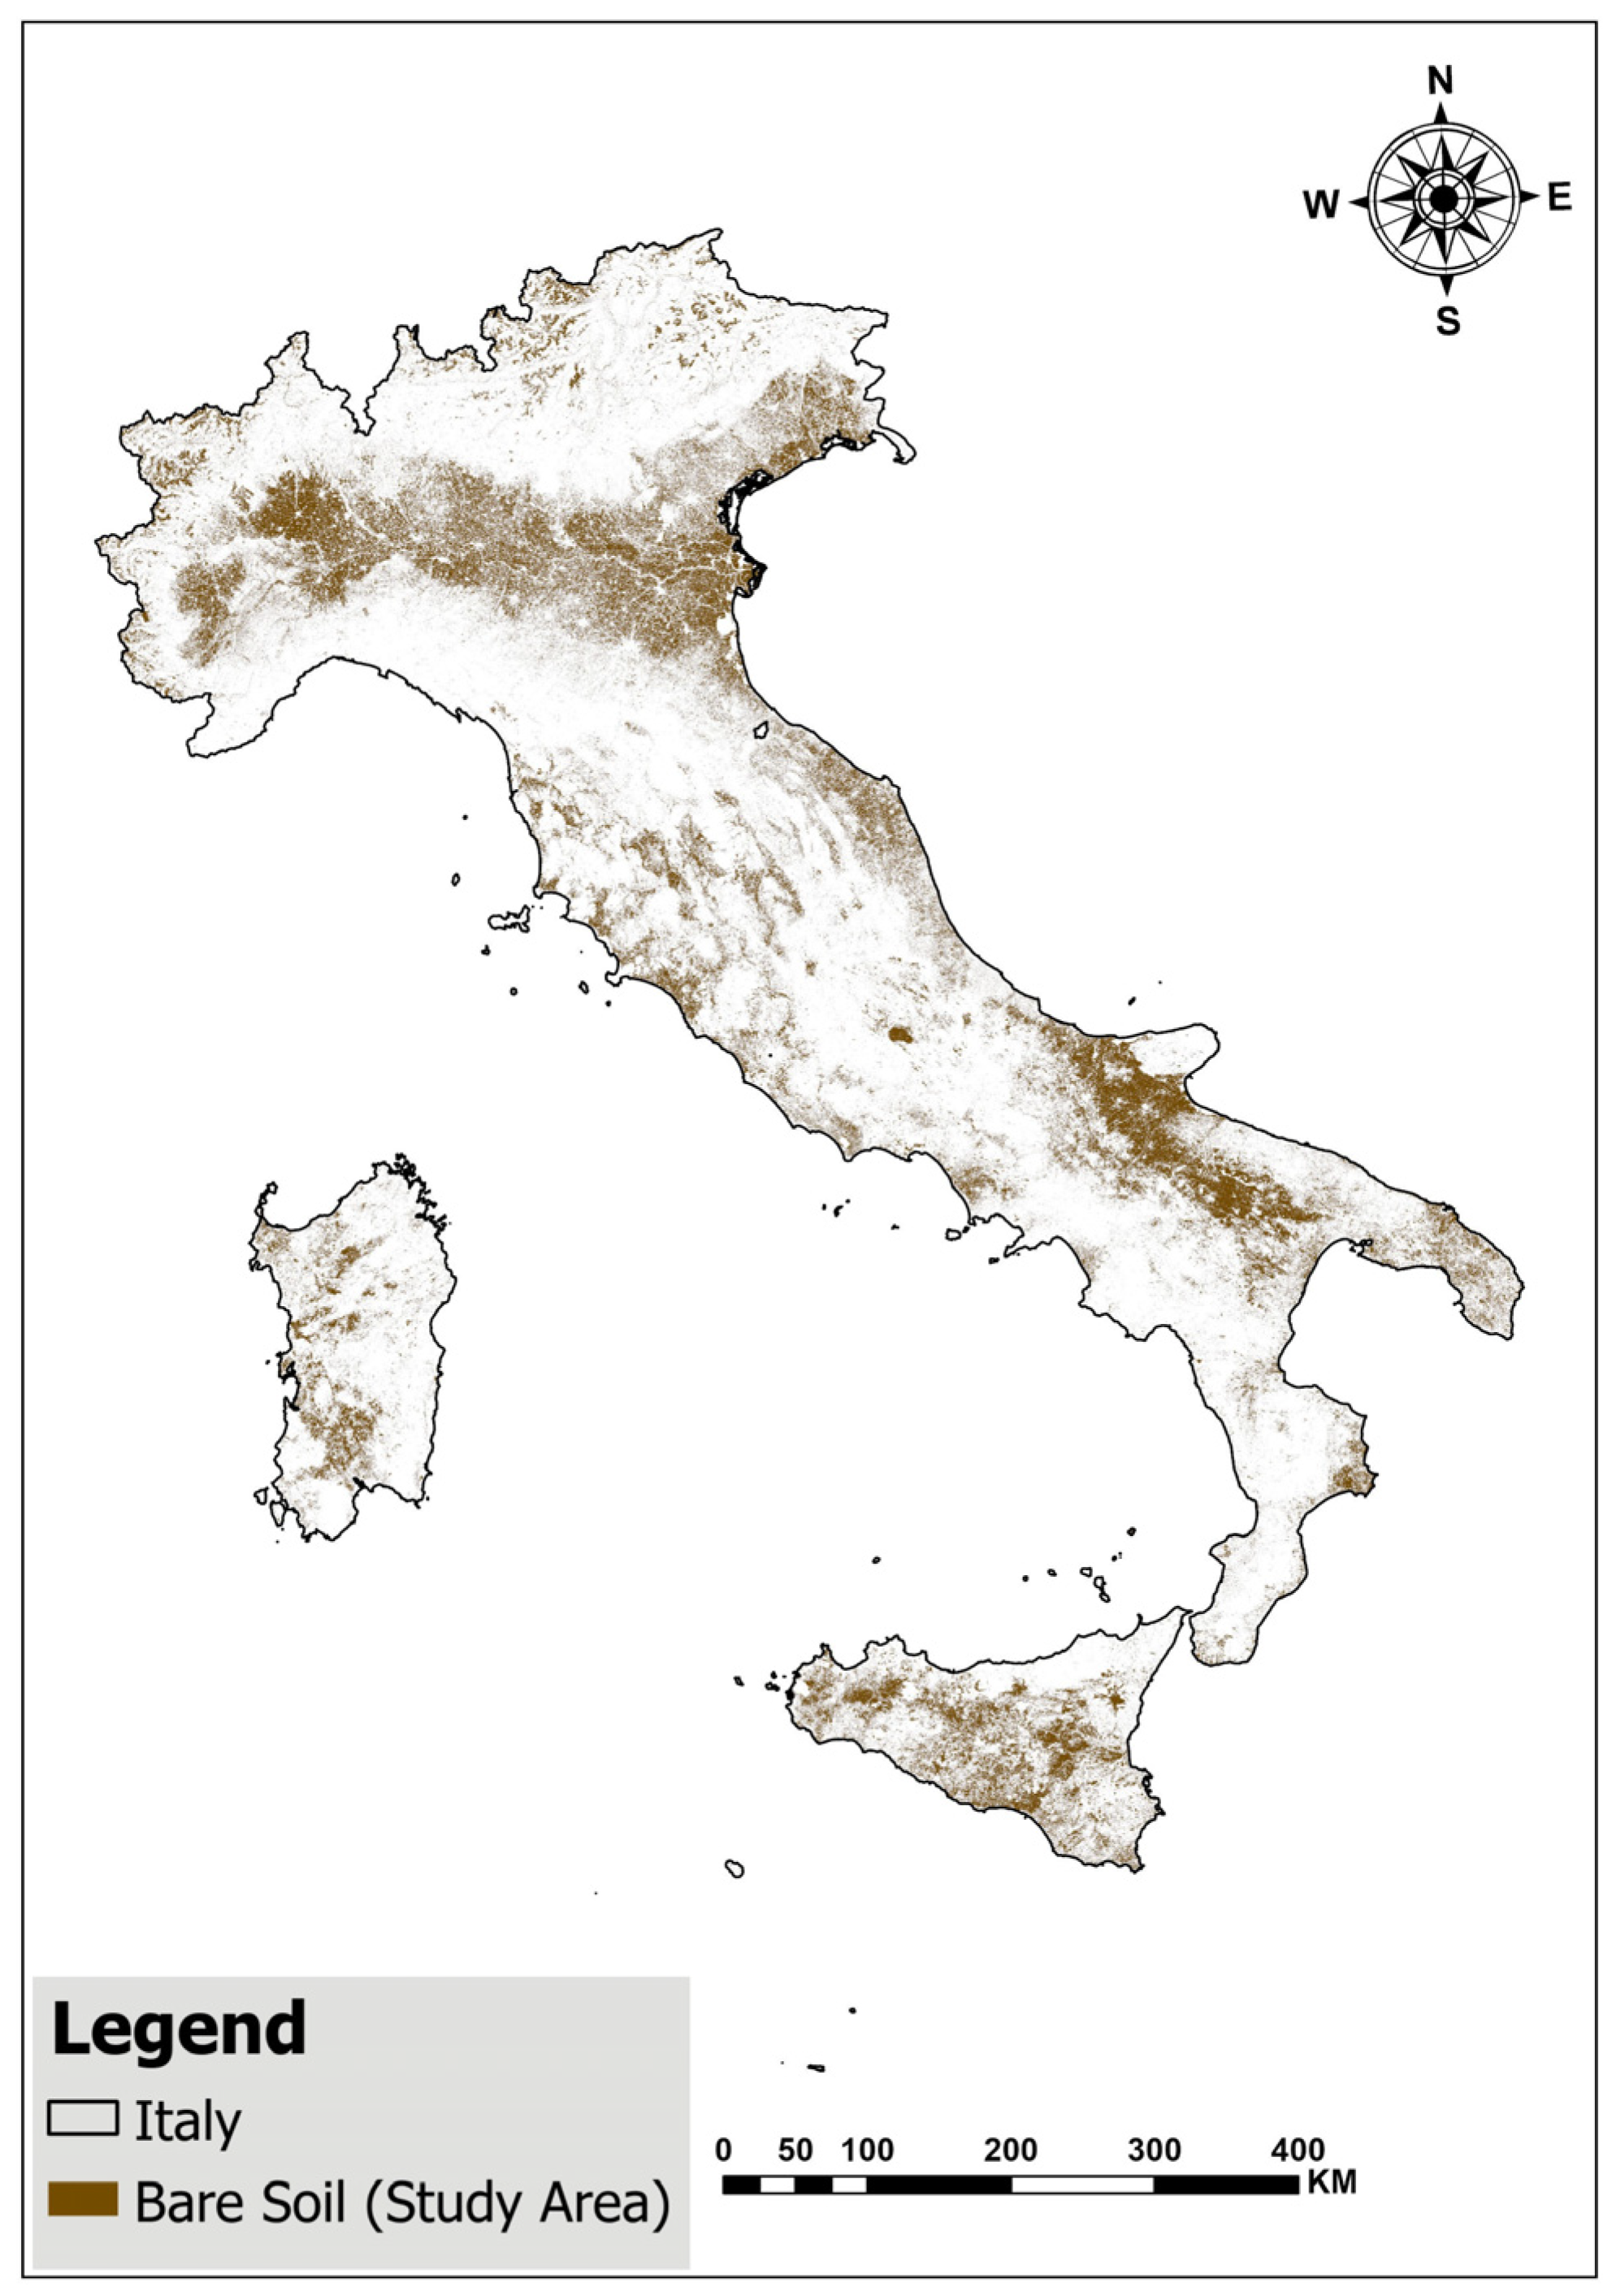
Bare soil extent was delineated using the SoilSuite for Europe bare surface mask [33], a 5-year composite derived from Sentinel-2 multispectral imagery (2018 to 2022) at 20 m spatial resolution. In this product, bare soil pixels are identified through per-pixel screening based on combined Normalized Difference Vegetation Index and Normalized Burn Ratio behavior across all available Sentinel 2 observations, with a minimum occurrence threshold of three detections to reduce noise and transient misclassification. The resulting study domain covered 74,156.62 km2 distributed across all 20 Italian NUTS2 administrative regions (Figure 1), corresponding to approximately 24.6% of the national land surface (301,340 km2). This spatial coverage enables national-scale comparison of compaction risk patterns while retaining sensitivity to regional differences in climate, soil properties, and agricultural intensity.
Geographically, the domain spans the full latitudinal extent of the peninsula from approximately 45° N in the Alpine arc to 36° N in southern Sicily and extends longitudinally from about 8° E along the Tyrrhenian margin to 18° E along the Adriatic Ionian sector. This 9° latitudinal gradient intersects multiple Köppen–Geiger climate classes, including Cfb and Cfa conditions in northern Italy, widespread Csa hot-summer Mediterranean conditions across central and southern regions, and localized BSh hot semi-arid environments in parts of the southeast. Such climatic heterogeneity is agronomically and mechanically relevant because seasonal rainfall and evaporative demand control near-surface water content, and therefore govern soil bearing capacity, stress transmission, and the probability that trafficking occurs under plastic conditions that promote irreversible pore collapse.

Regional Distribution and Coverage Patterns

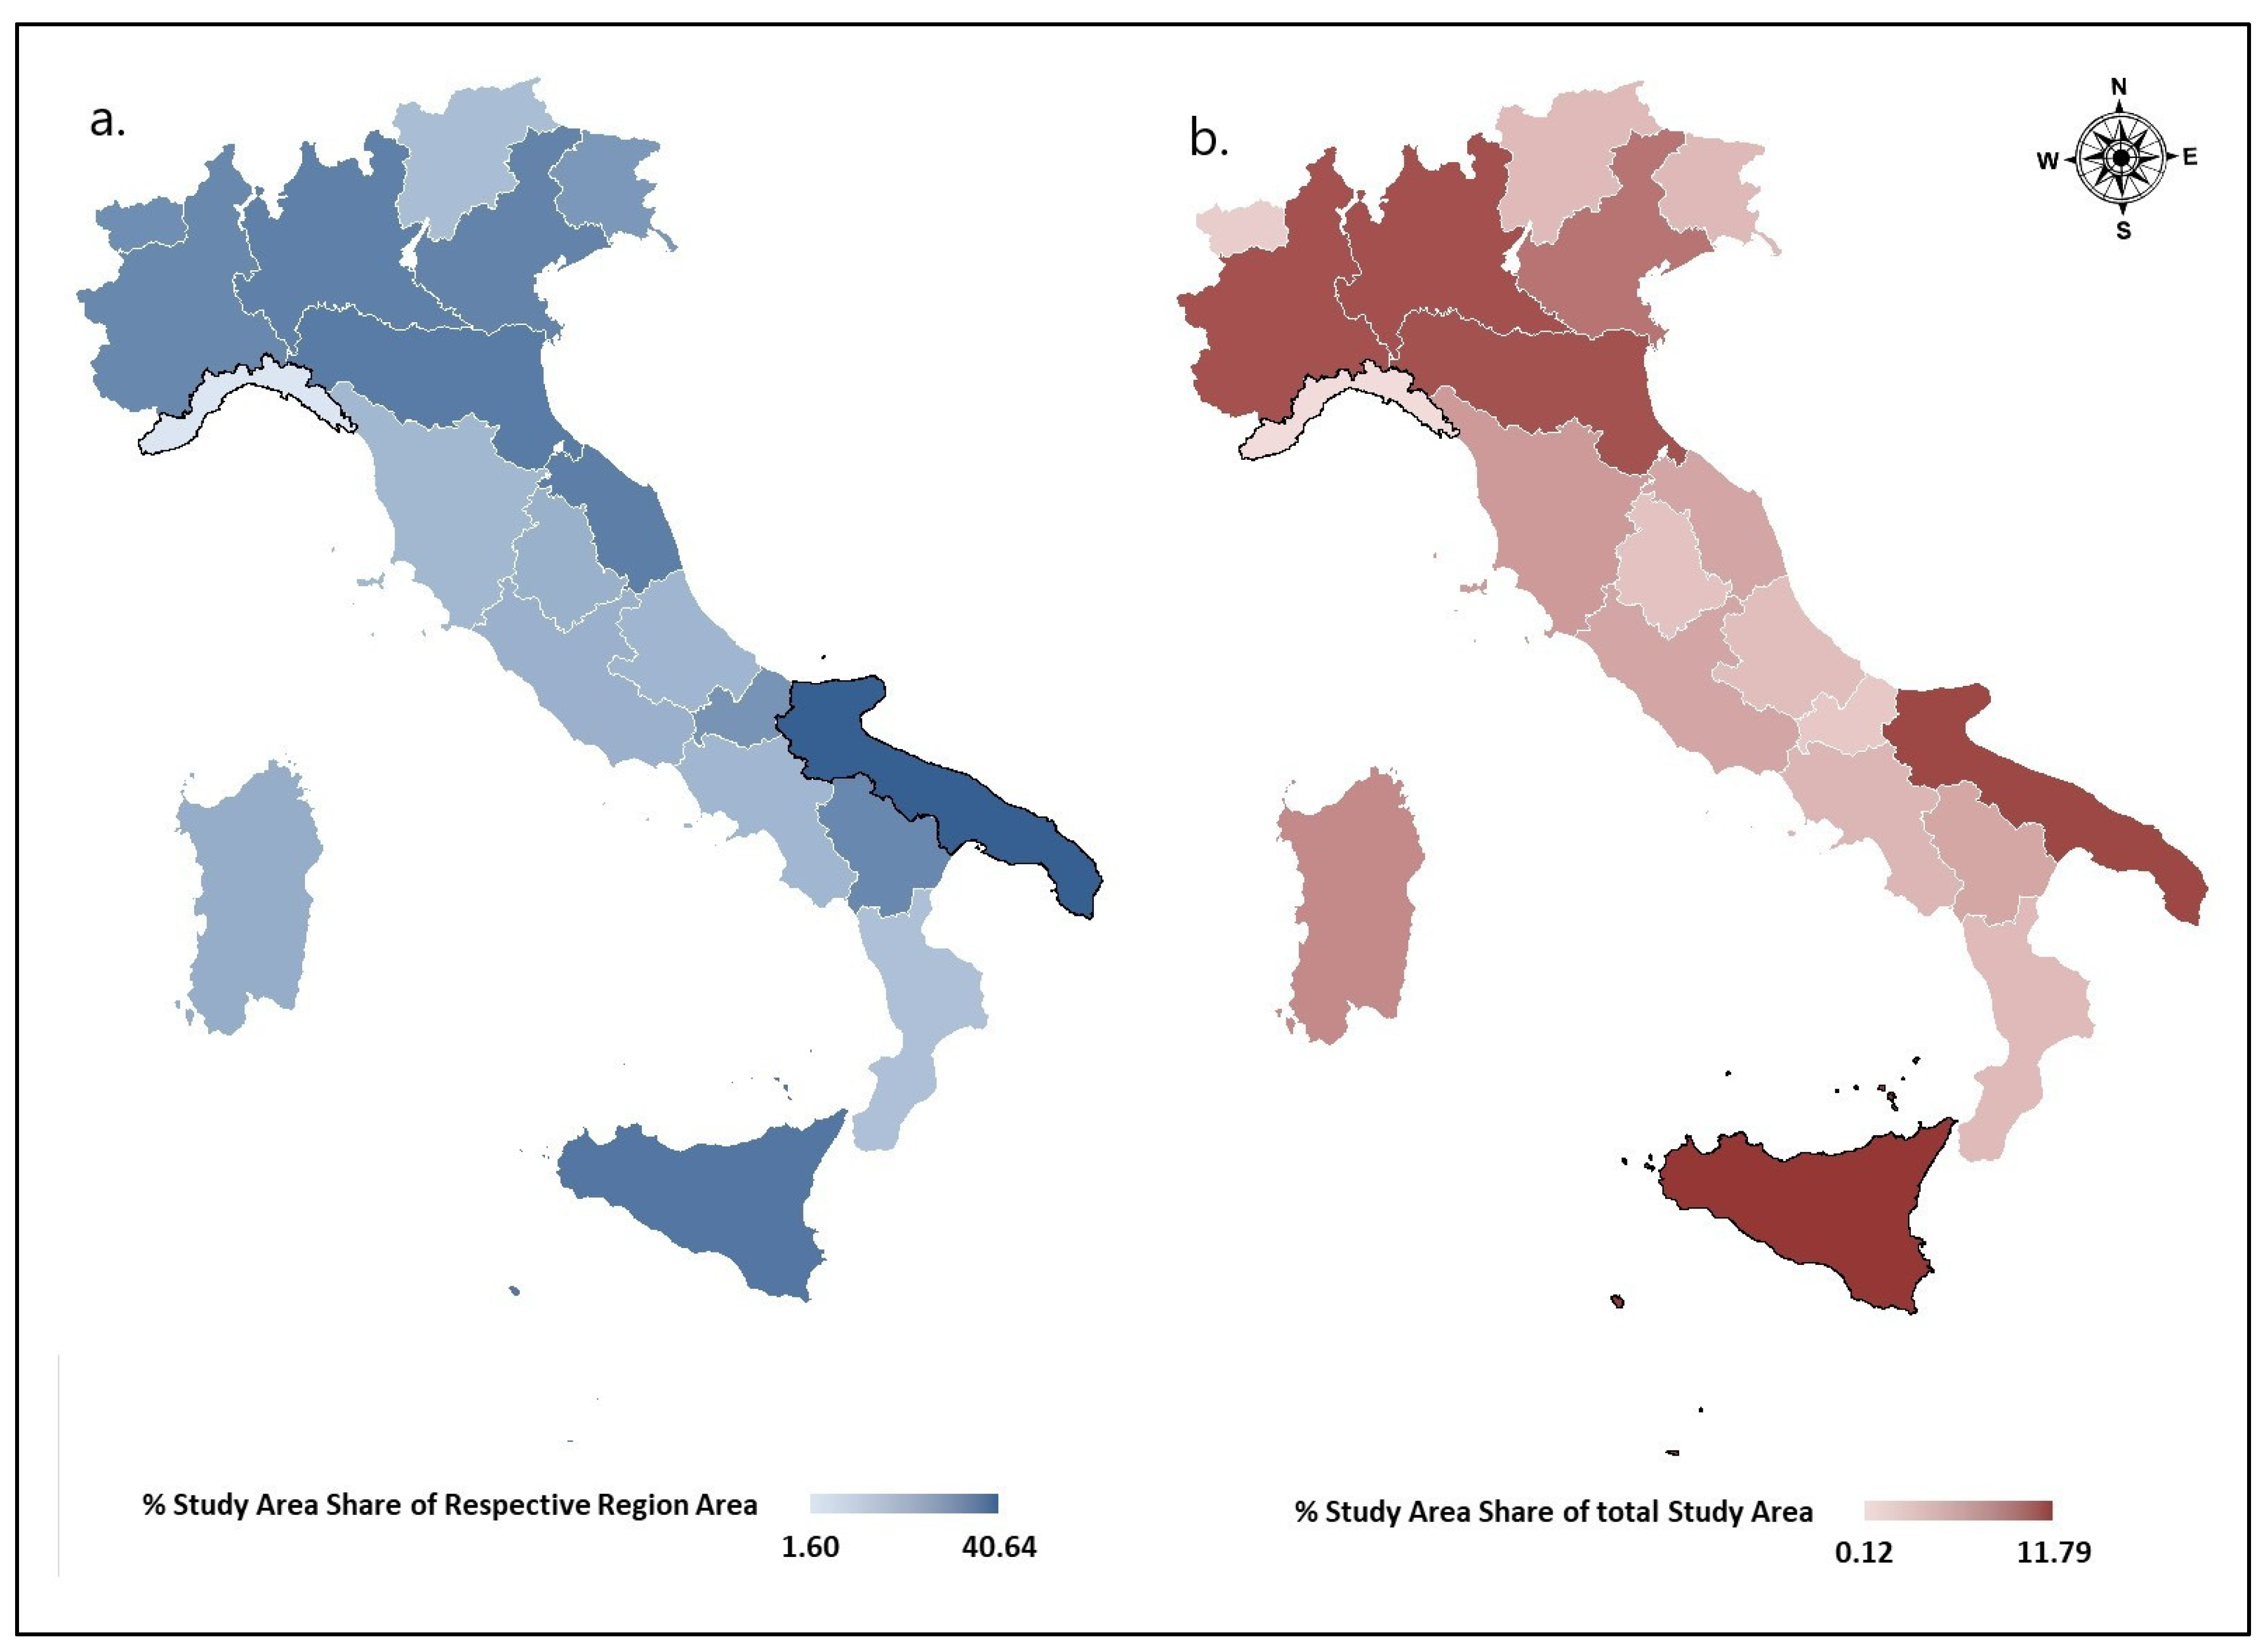
The spatial allocation of agricultural bare soil surfaces exhibits marked heterogeneity across Italian regions, reflecting the interplay of physiographic constraints, climatic suitability, and historical land-use intensification (Figure 2). Regional proportional coverage, defined as the percentage of each region’s total area under annual cropland, is reported in Table S1. It ranges from 1.6% in Liguria (constrained by topographic ruggedness and limited lowland areas) to 40.6% in Apulia (characterized by extensive flat-to-rolling agricultural plains), with a national mean of 24.6% (Figure 2a). Northern Italy contributes the largest share, with particularly high coverage in Emilia-Romagna (32.6% regional coverage), Lombardy (31.2% regional coverage), and Piedmont (29.1% regional coverage). The study area varied by region, ranging from 0.12% of the total study area in Liguria to 11.79% in Sicily (Figure 2b). Northern Italy contributed the largest extent (43.9% of the total study area), while Southern Italy, Central Italy, and the Islands accounted for 23.7%, 14.7%, and 17.7% of the total study area.

2.2. Data Source and Processing

In this study, we synthesized four key indicators (Table 1) of compaction susceptibility: (i) SMI from Sentinel-1 SAR; (ii) NDTI from Sentinel-2 optical data; (iii) soil clay fraction from the International Soil Reference and Information Center [34]; and (iv) Intensity of Agricultural Practice (IOAP) derived from the 2020 Istituto Nazionale di Statistica (ISTAT) national agriculture census data following a customized procedure based on the methodology of Bonato [35].
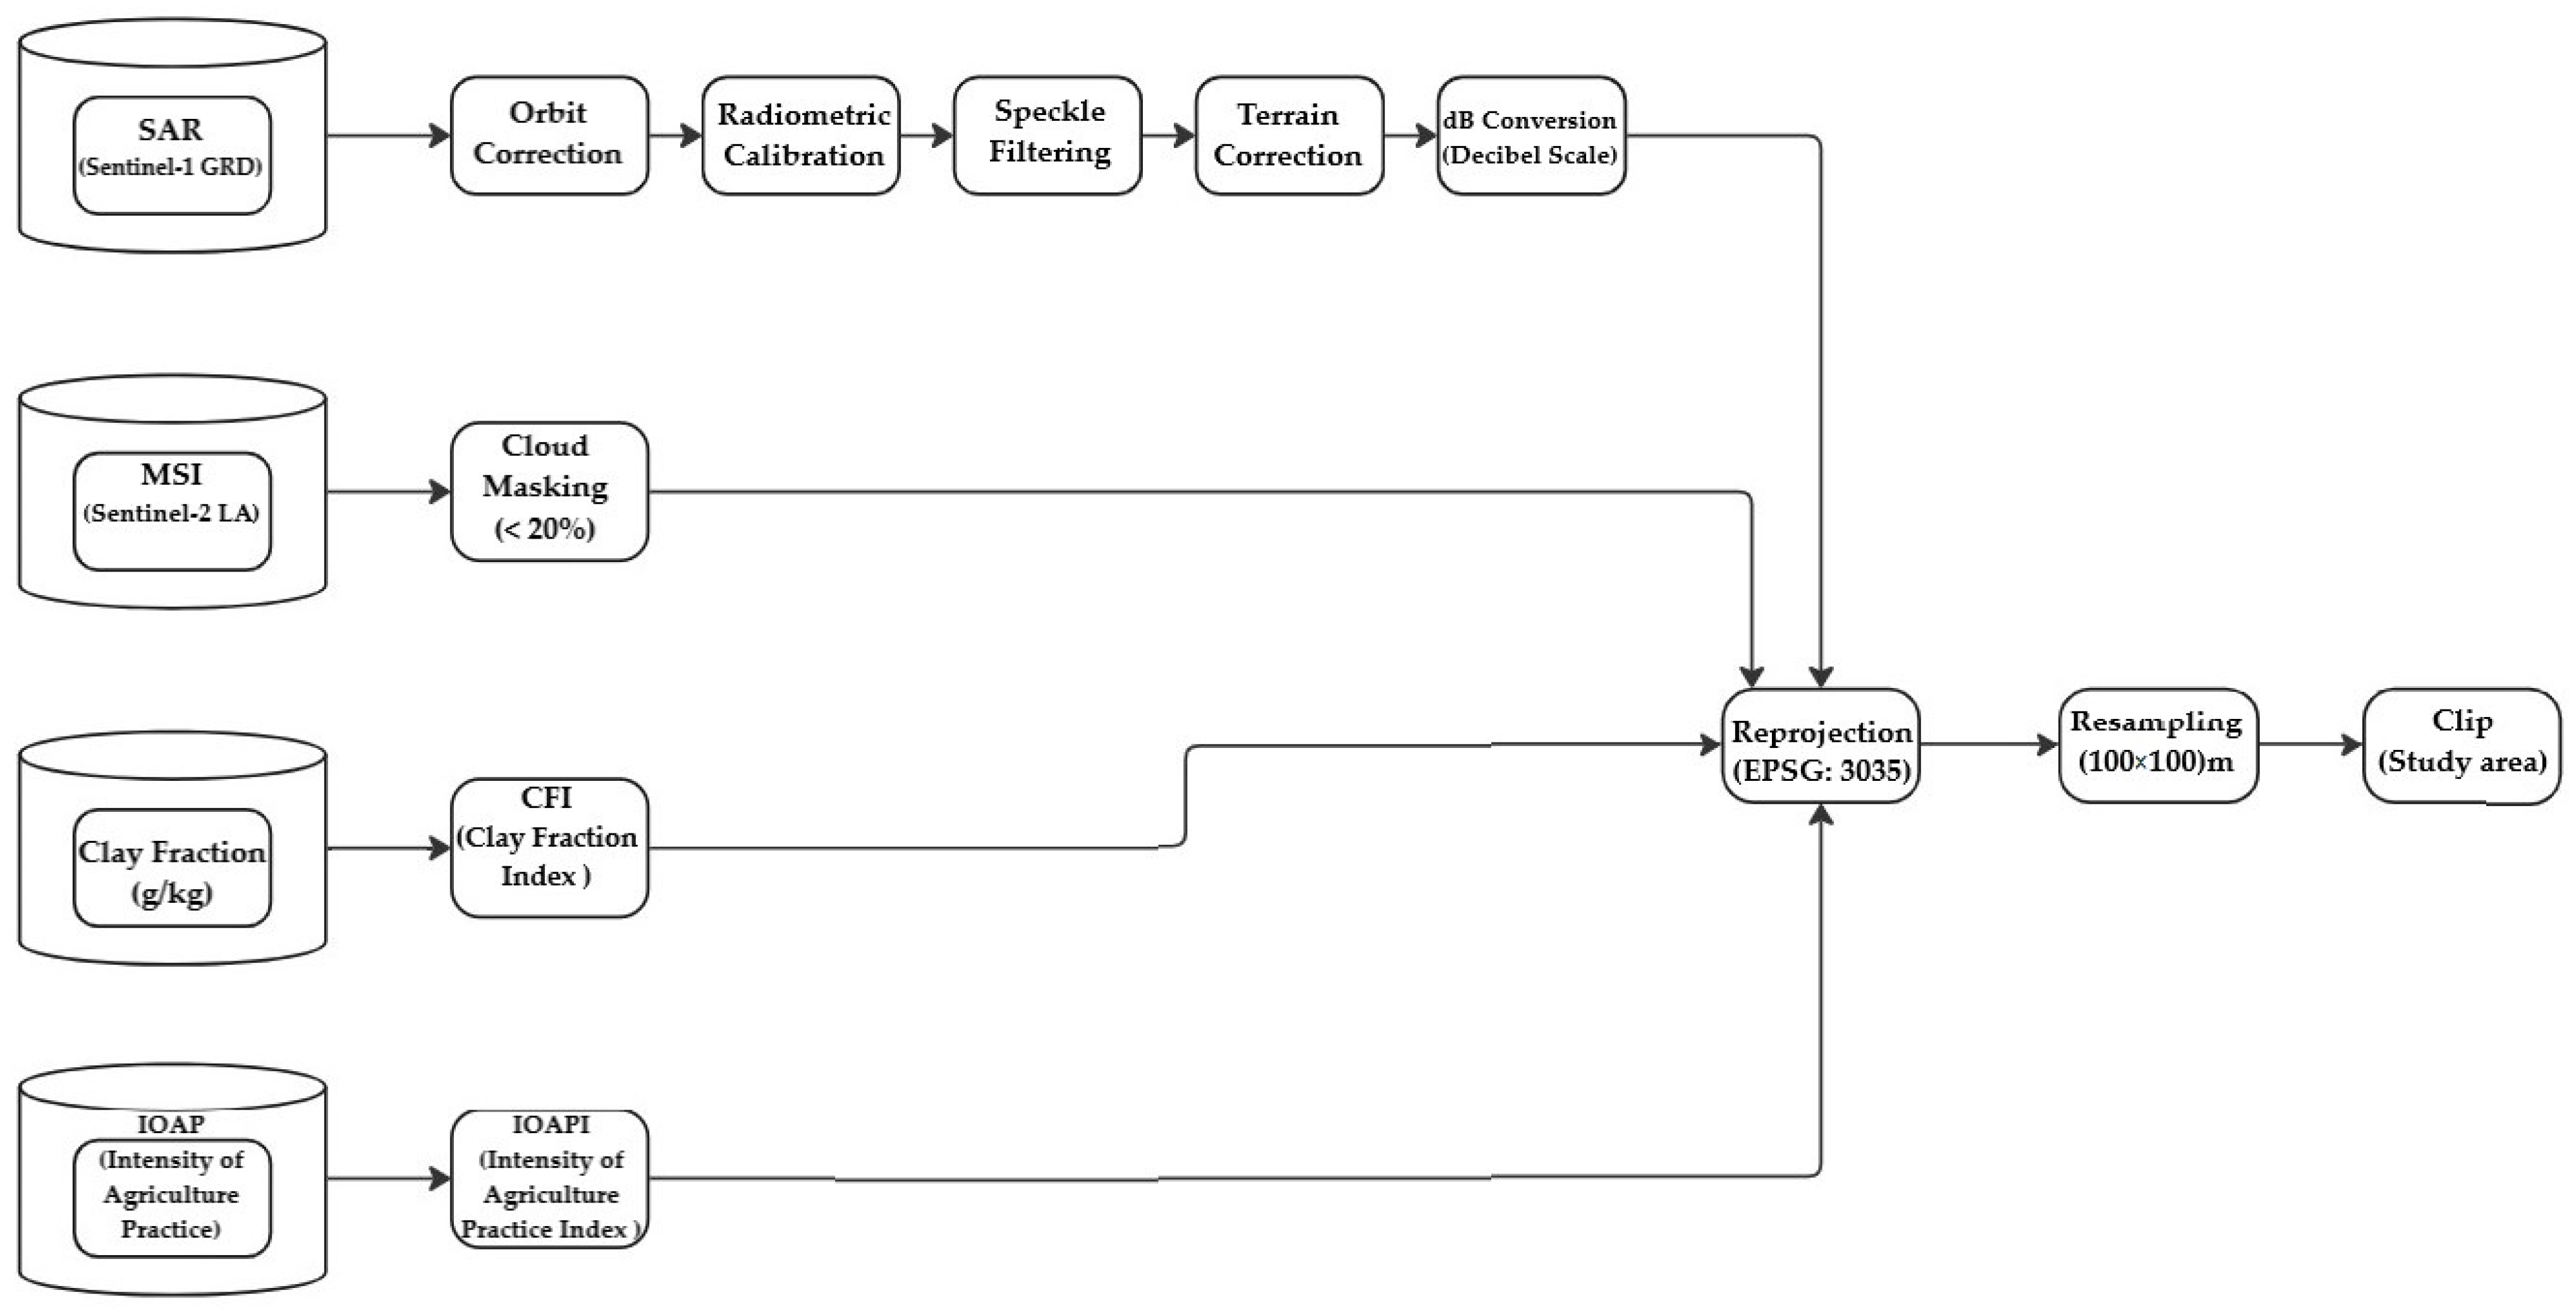
Processing involved tailored steps for each dataset: Sentinel-1 underwent orbit correction, radiometric calibration, speckle filtering, terrain correction, and backscatter value to dB conversion using Google Earth Engine (GEE) [36]; Sentinel-2 LA atmospherically corrected product was cloud-masked, and used to calculate NDTI; clay fraction data and IOAP data were first normalized to get respective indices (CFI and IOAPI) and then reprojected to ETRS89/LAEA (EPSG:3035), resampled to 100 m resolution, and clipped to study area (ROI) ArcGIS Pro 3.6.1 as shown in Figure 3.

2.3. Compaction Triggering Factors and Their Extraction

2.3.1. Clay Fraction Index (CFI)

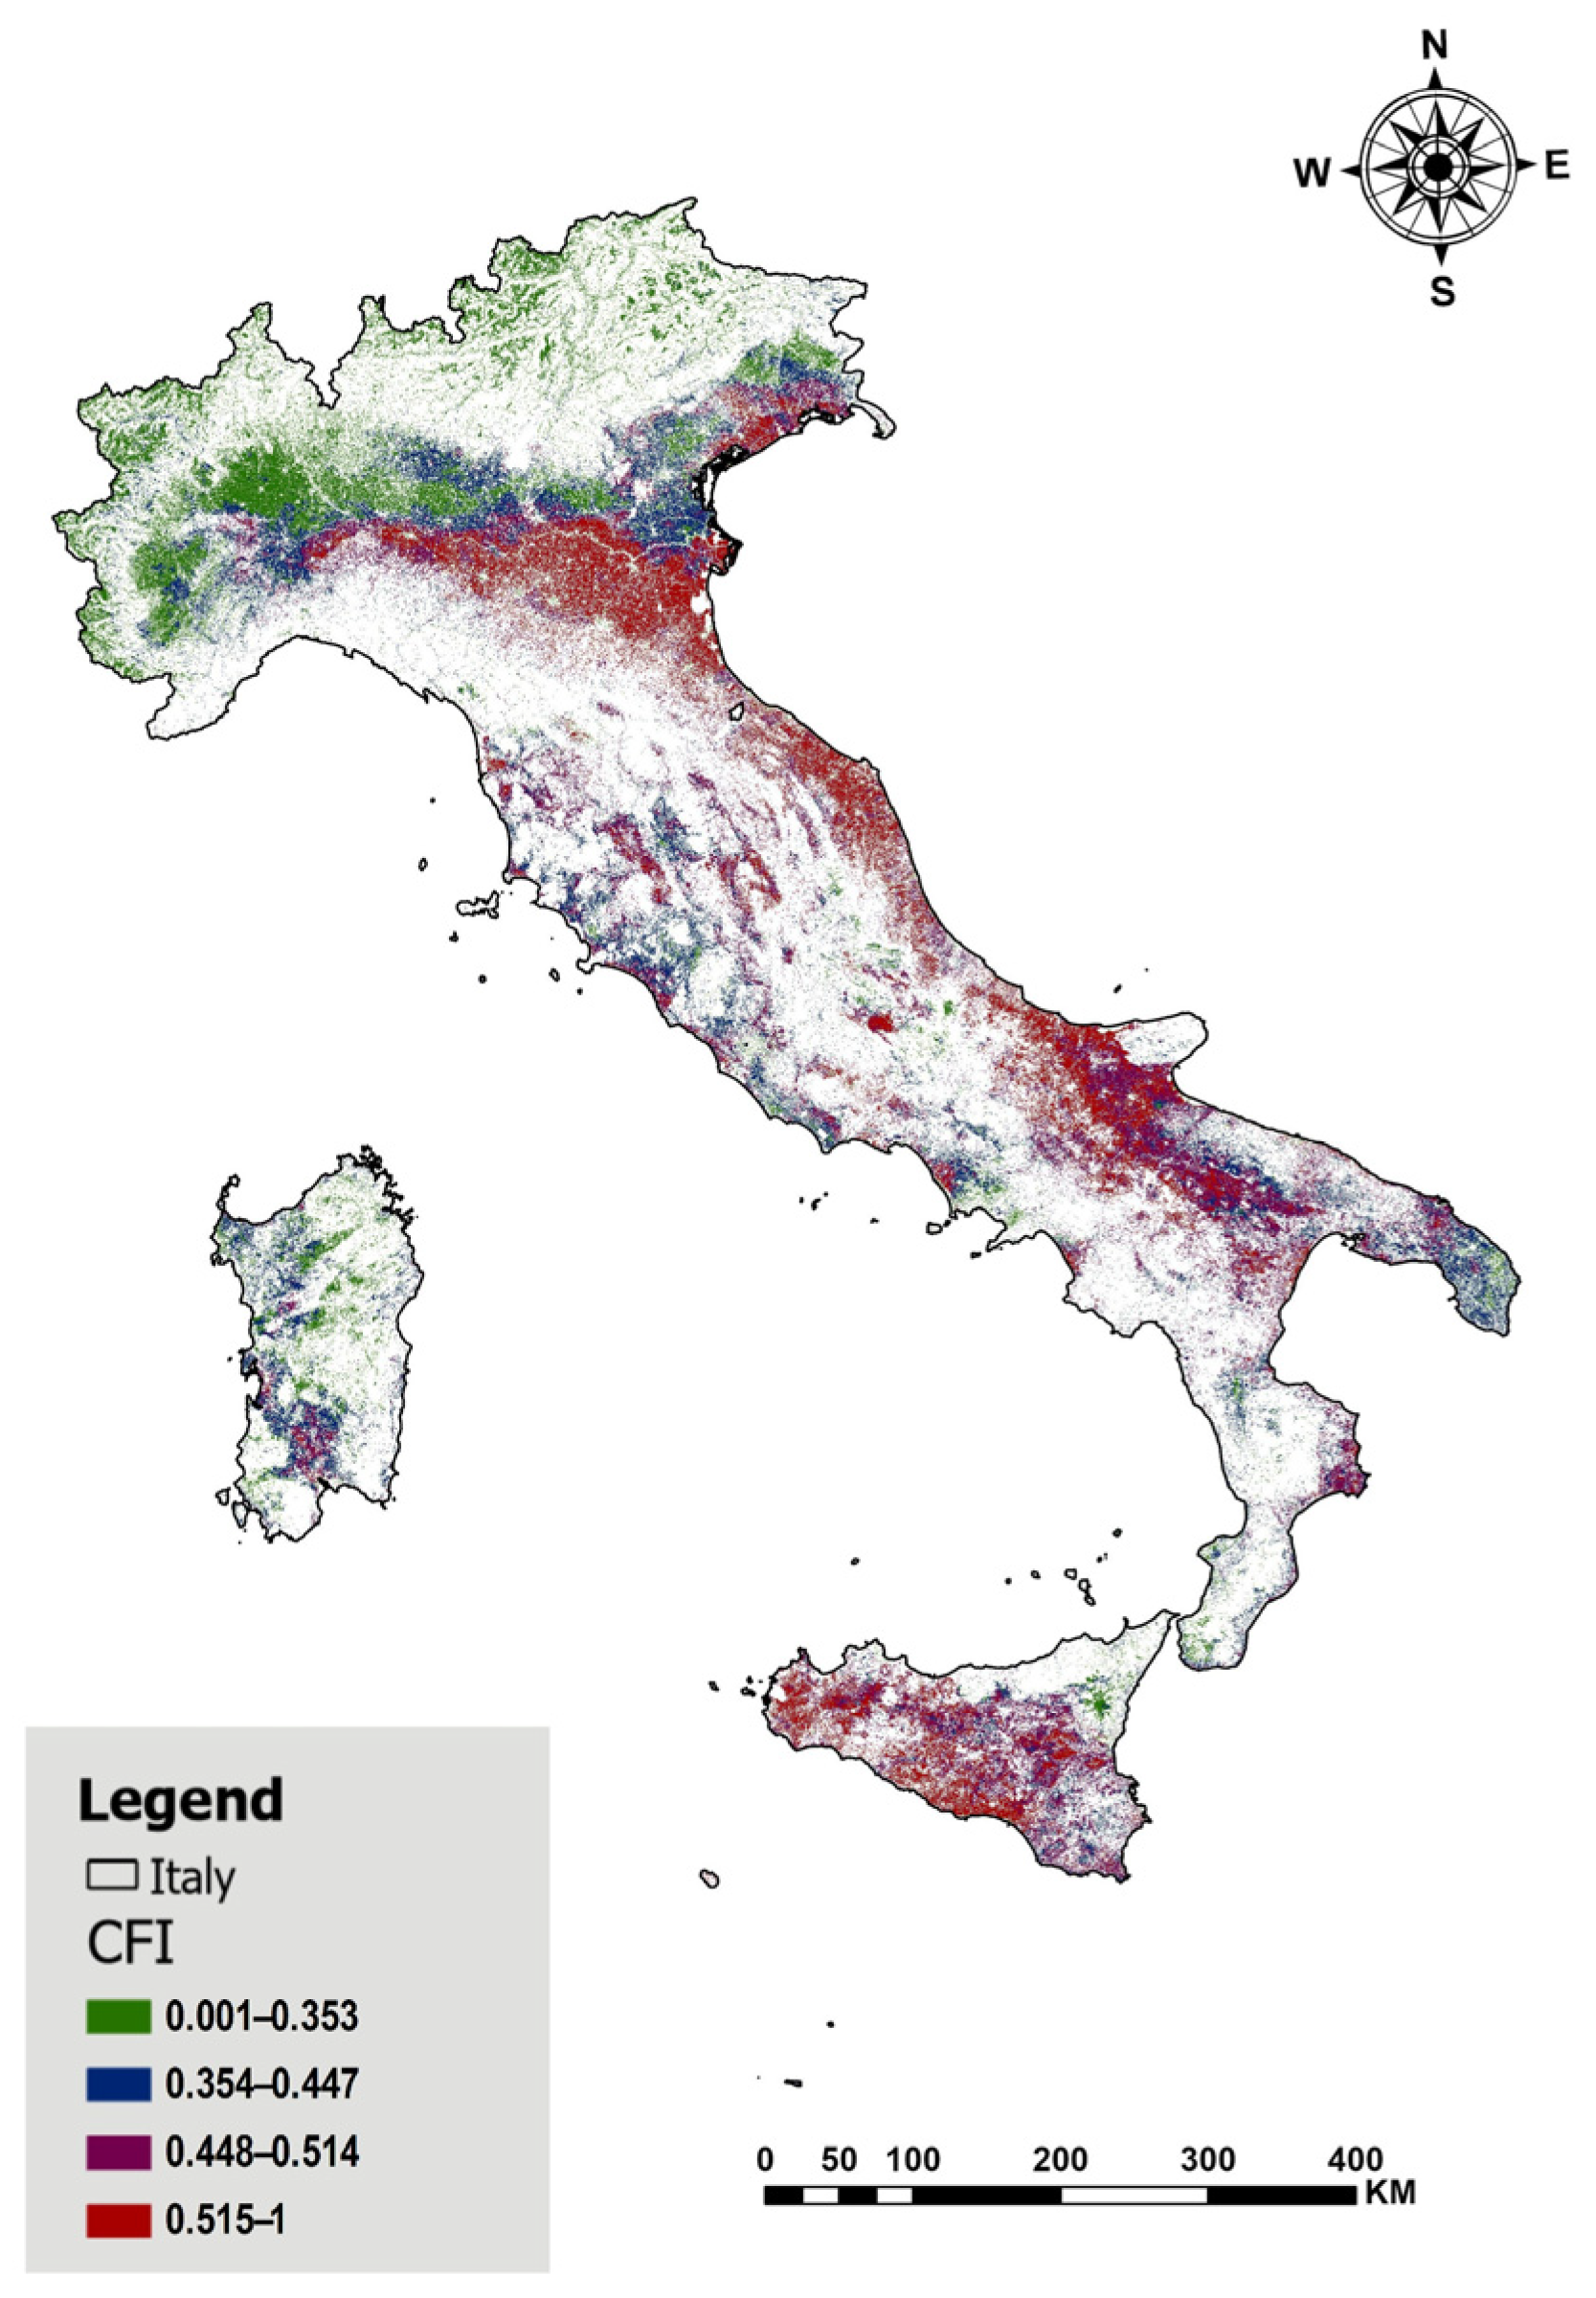
Soils with high clay content exhibit greater susceptibility to compaction due to their tendency to form dense, hard layers under elevated surface pressures, which significantly alter soil structure and functionality [8]. Clay (<2 μm particle size), a static soil property with minimal temporal variability, is a critical metric for characterizing inherent soil properties; however, it can pose a limitation if used for highly precise temporal compaction mapping. It plays a pivotal role in modeling soil physical vulnerability, assessing agricultural trafficability, and optimizing mechanized operation planning, as higher clay content increases compaction risk by reducing inter-aggregate pore spaces and elevating mechanical resistance. In this study, we used the SoilGrids 2.0 (ISRIC) clay fraction (0–2 µm) at 250 m for the 0–5 cm depth, which is produced globally by training Quantile Regression Forests on ~240 k standardized soil profiles with >400 environmental covariates; texture was modeled compositionally via additive log-ratio (ALR) [34]. For this study, the clay layer for the study area was clipped and resampled using bilinear interpolation to a finer 100 m spatial resolution using ArcGIS Pro 3.6.1 software (Esri, Redlands, CA, USA) to ensure spatial consistency among the other datasets. The clipped layer was then normalized using Equation (4) to obtain the clay fraction index (CFI), which was later reclassified into four classes based on the quantile classification scheme in the ArcGIS Pro 3.6.1 software, as shown in Figure 4.

2.3.2. Soil Moisture Index (SMI)

Soil properties, including water content, texture, and bulk density, significantly influence soil compaction [15]. Wet soil conditions significantly increase susceptibility to compaction [17,18]. To assess soil moisture dynamics, this study employed SMI derived from the Normalized Change Detection method (TU Wien Method), which correlates temporal changes in backscatter (σ0) to soil moisture variations by normalizing between extreme dry and wet reference points [37,38]. This change detection approach, as outlined by Balenzano et al. [37], leverages a dense time series of SAR data to link variations in backscattering signals between consecutive observations to changes in soil moisture. However, C-band radar cannot perfectly decouple the overlapping dielectric effects of soil moisture from these physical surface-roughness fluctuations, and localized backscatter anomalies can occur. Consequently, sudden spikes in backscatter may reflect a recent plowing event or dense crop canopy rather than a true increase in compaction risk. This backscatter variability introduces inherent noise into the multi-criteria model.
Soil moisture dynamics were evaluated using Sentinel-1 SAR imagery processed within the GEE platform, covering the period from January 2018 to December 2024. Sentinel-1 Ground Range Detected (GRD) images in Interferometric Wide (IW) swath mode were filtered to include only VV polarization, which is highly sensitive to surface moisture variations. To account for orbit-specific differences in SAR backscatter, the dataset was separated into ascending (evening) and descending (morning) orbits [39]. Seasonal composites (Winter, Summer, Spring, and Autumn) were generated for each orbit by averaging available scenes within each interval, thereby reducing speckle noise and ensuring temporal consistency. These composites were converted from decibel (dB) to linear (σ0) scale and subjected to a 30 m focal mean filter to further mitigate speckle effects. Land cover filtering, using the Dynamic World V1 dataset, excluded urban (label = 6) and water (label = 0) areas, focusing the analysis on natural and agricultural landscapes.
The SMI was calculated using min-max normalization applied to the speckle-filtered backscatter data, following the formula given in Equation (1).
S M I = σ 0 σ m i n 0 σ m a x 0 σ m i n 0
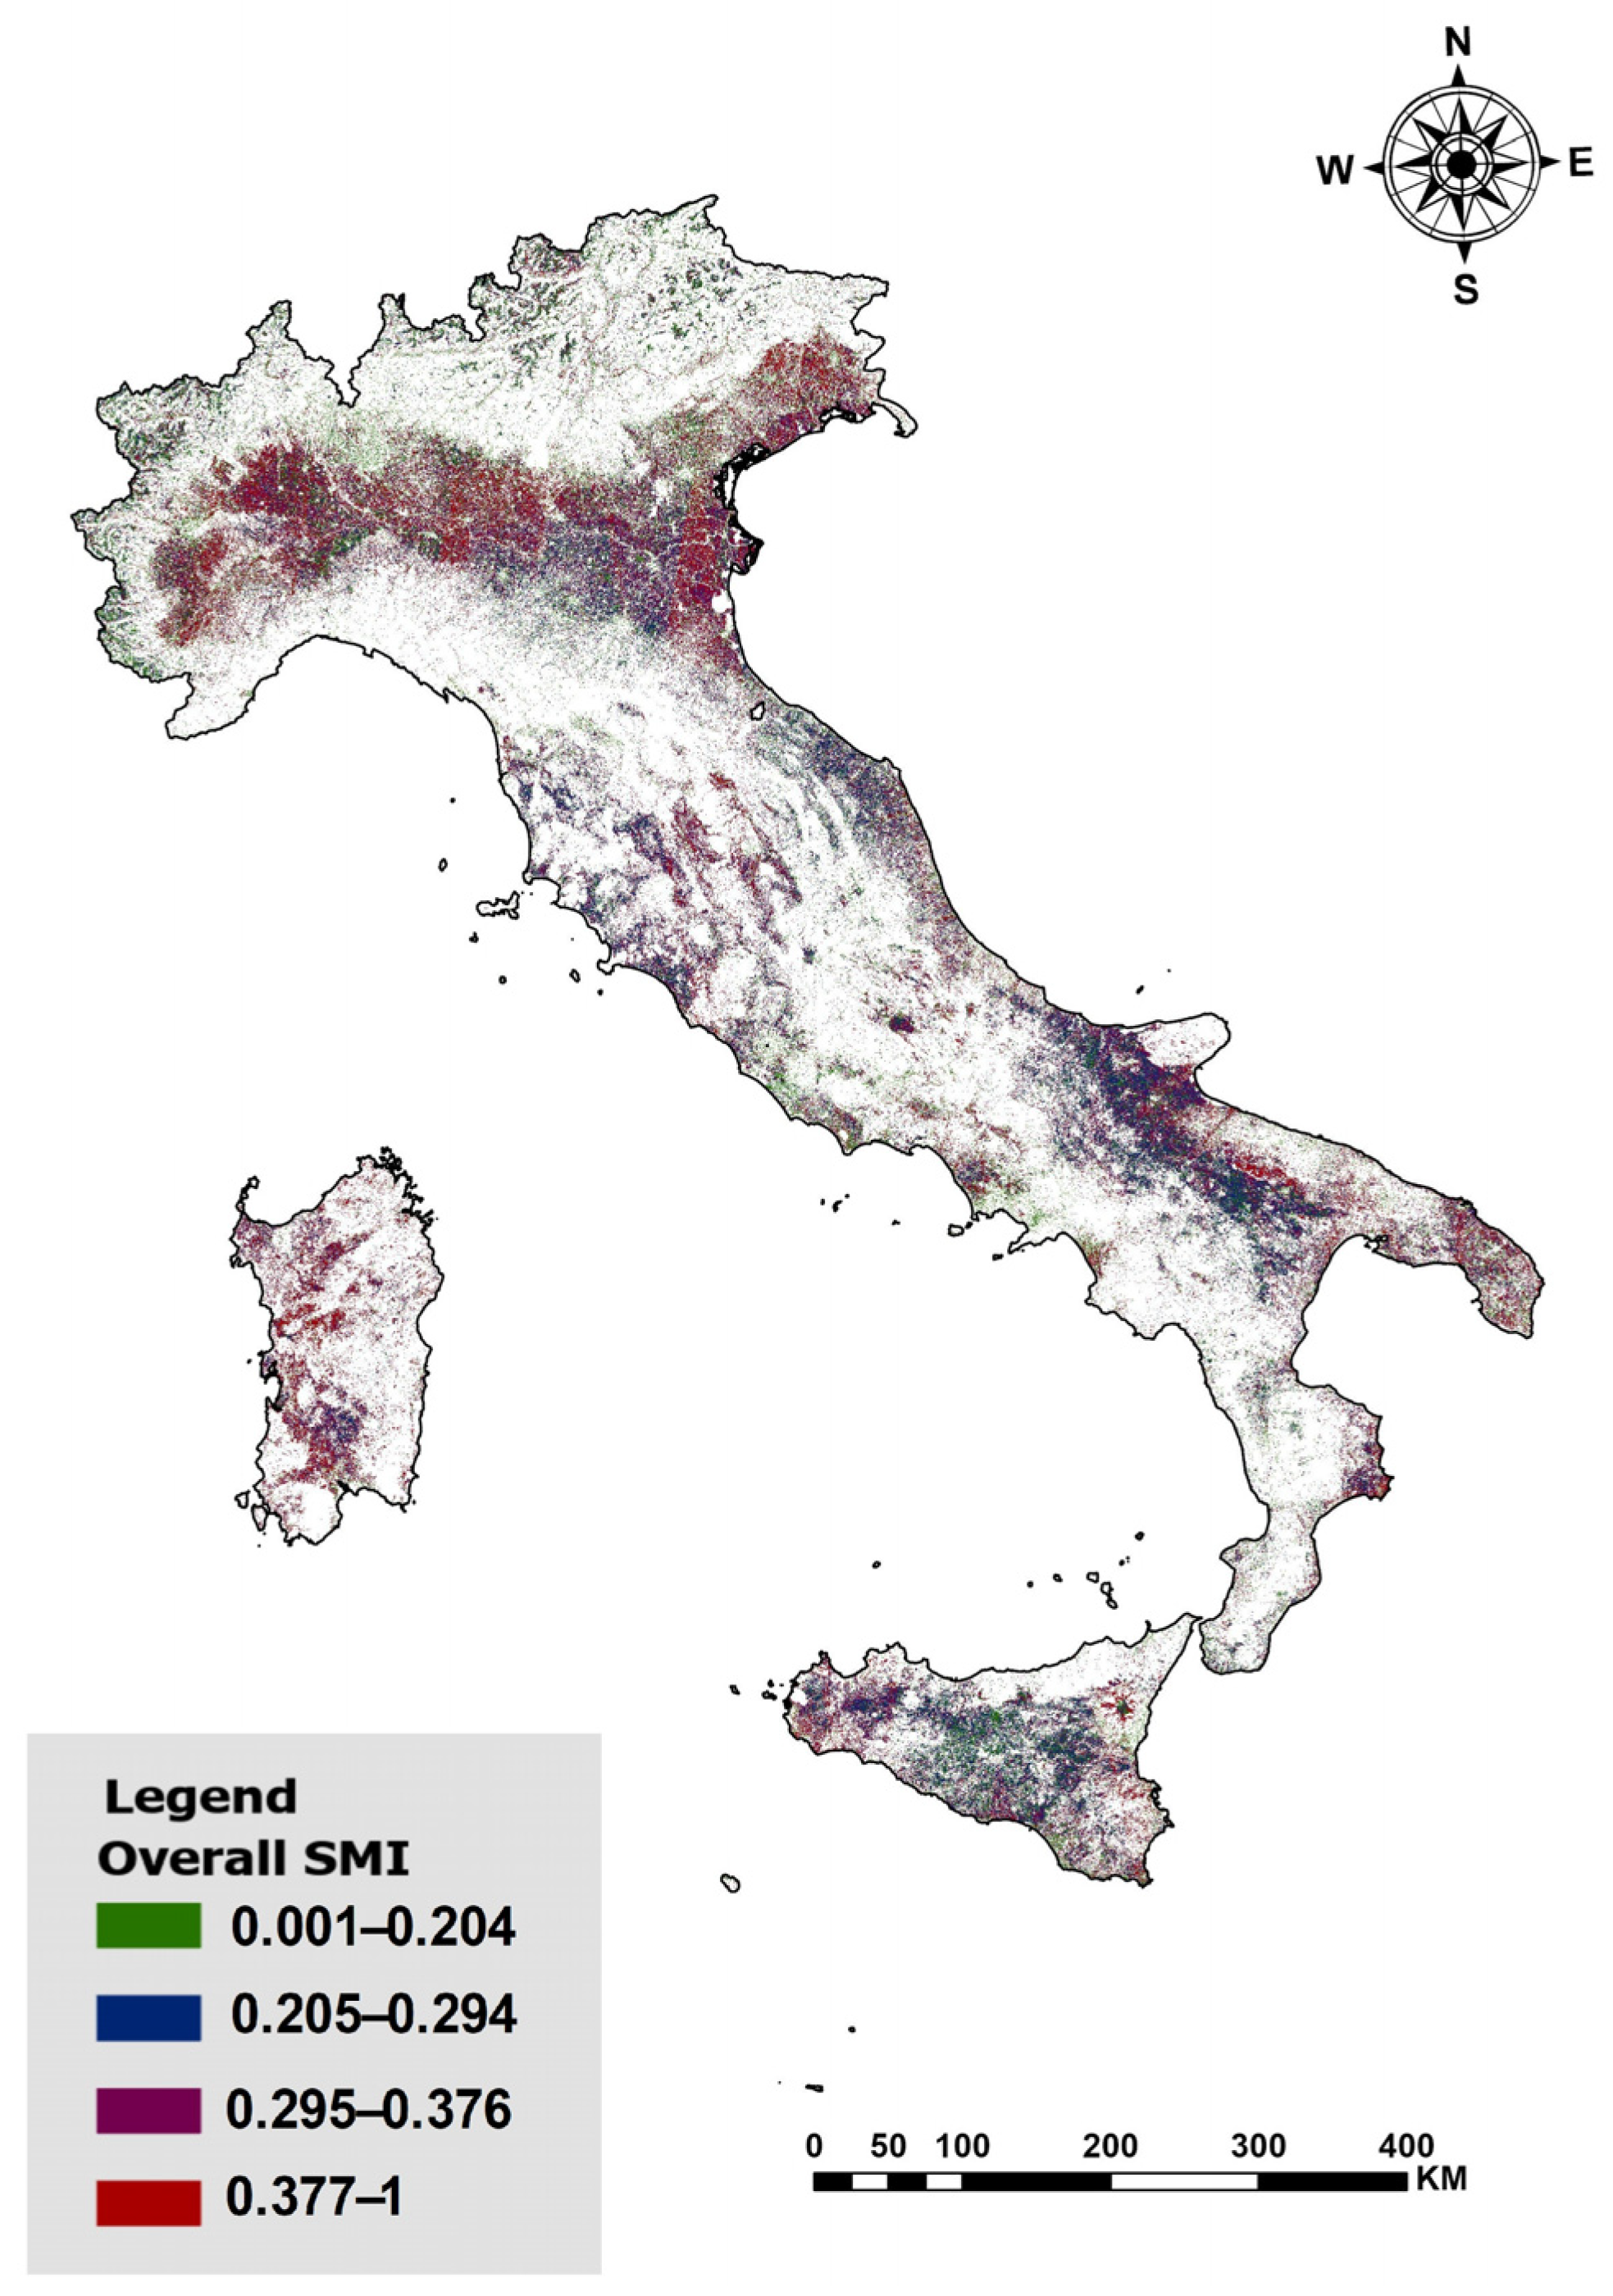
where σ 0 denotes the linear-scale backscatter value, and σ m i n 0 , σ m a x 0 represent the minimum and maximum backscatter values observed during the entire study period. This operation scaled the SAR signal into a 0–1 range, where values closer to 1 correspond to higher relative surface moisture content. The single SMI mean and the seasonal mean for the study period (2018–2024) were calculated. The resulting SMI composites were then clipped to the study area boundary and were resampled to a 100 m spatial resolution using ArcGIS Pro 3.6.1 software to ensure compatibility with the study’s analytical requirements. The clipped layer was later reclassified into four classes based on the quantile classification scheme in the ArcGIS Pro 3.6.1 software, as shown in Figure 5.
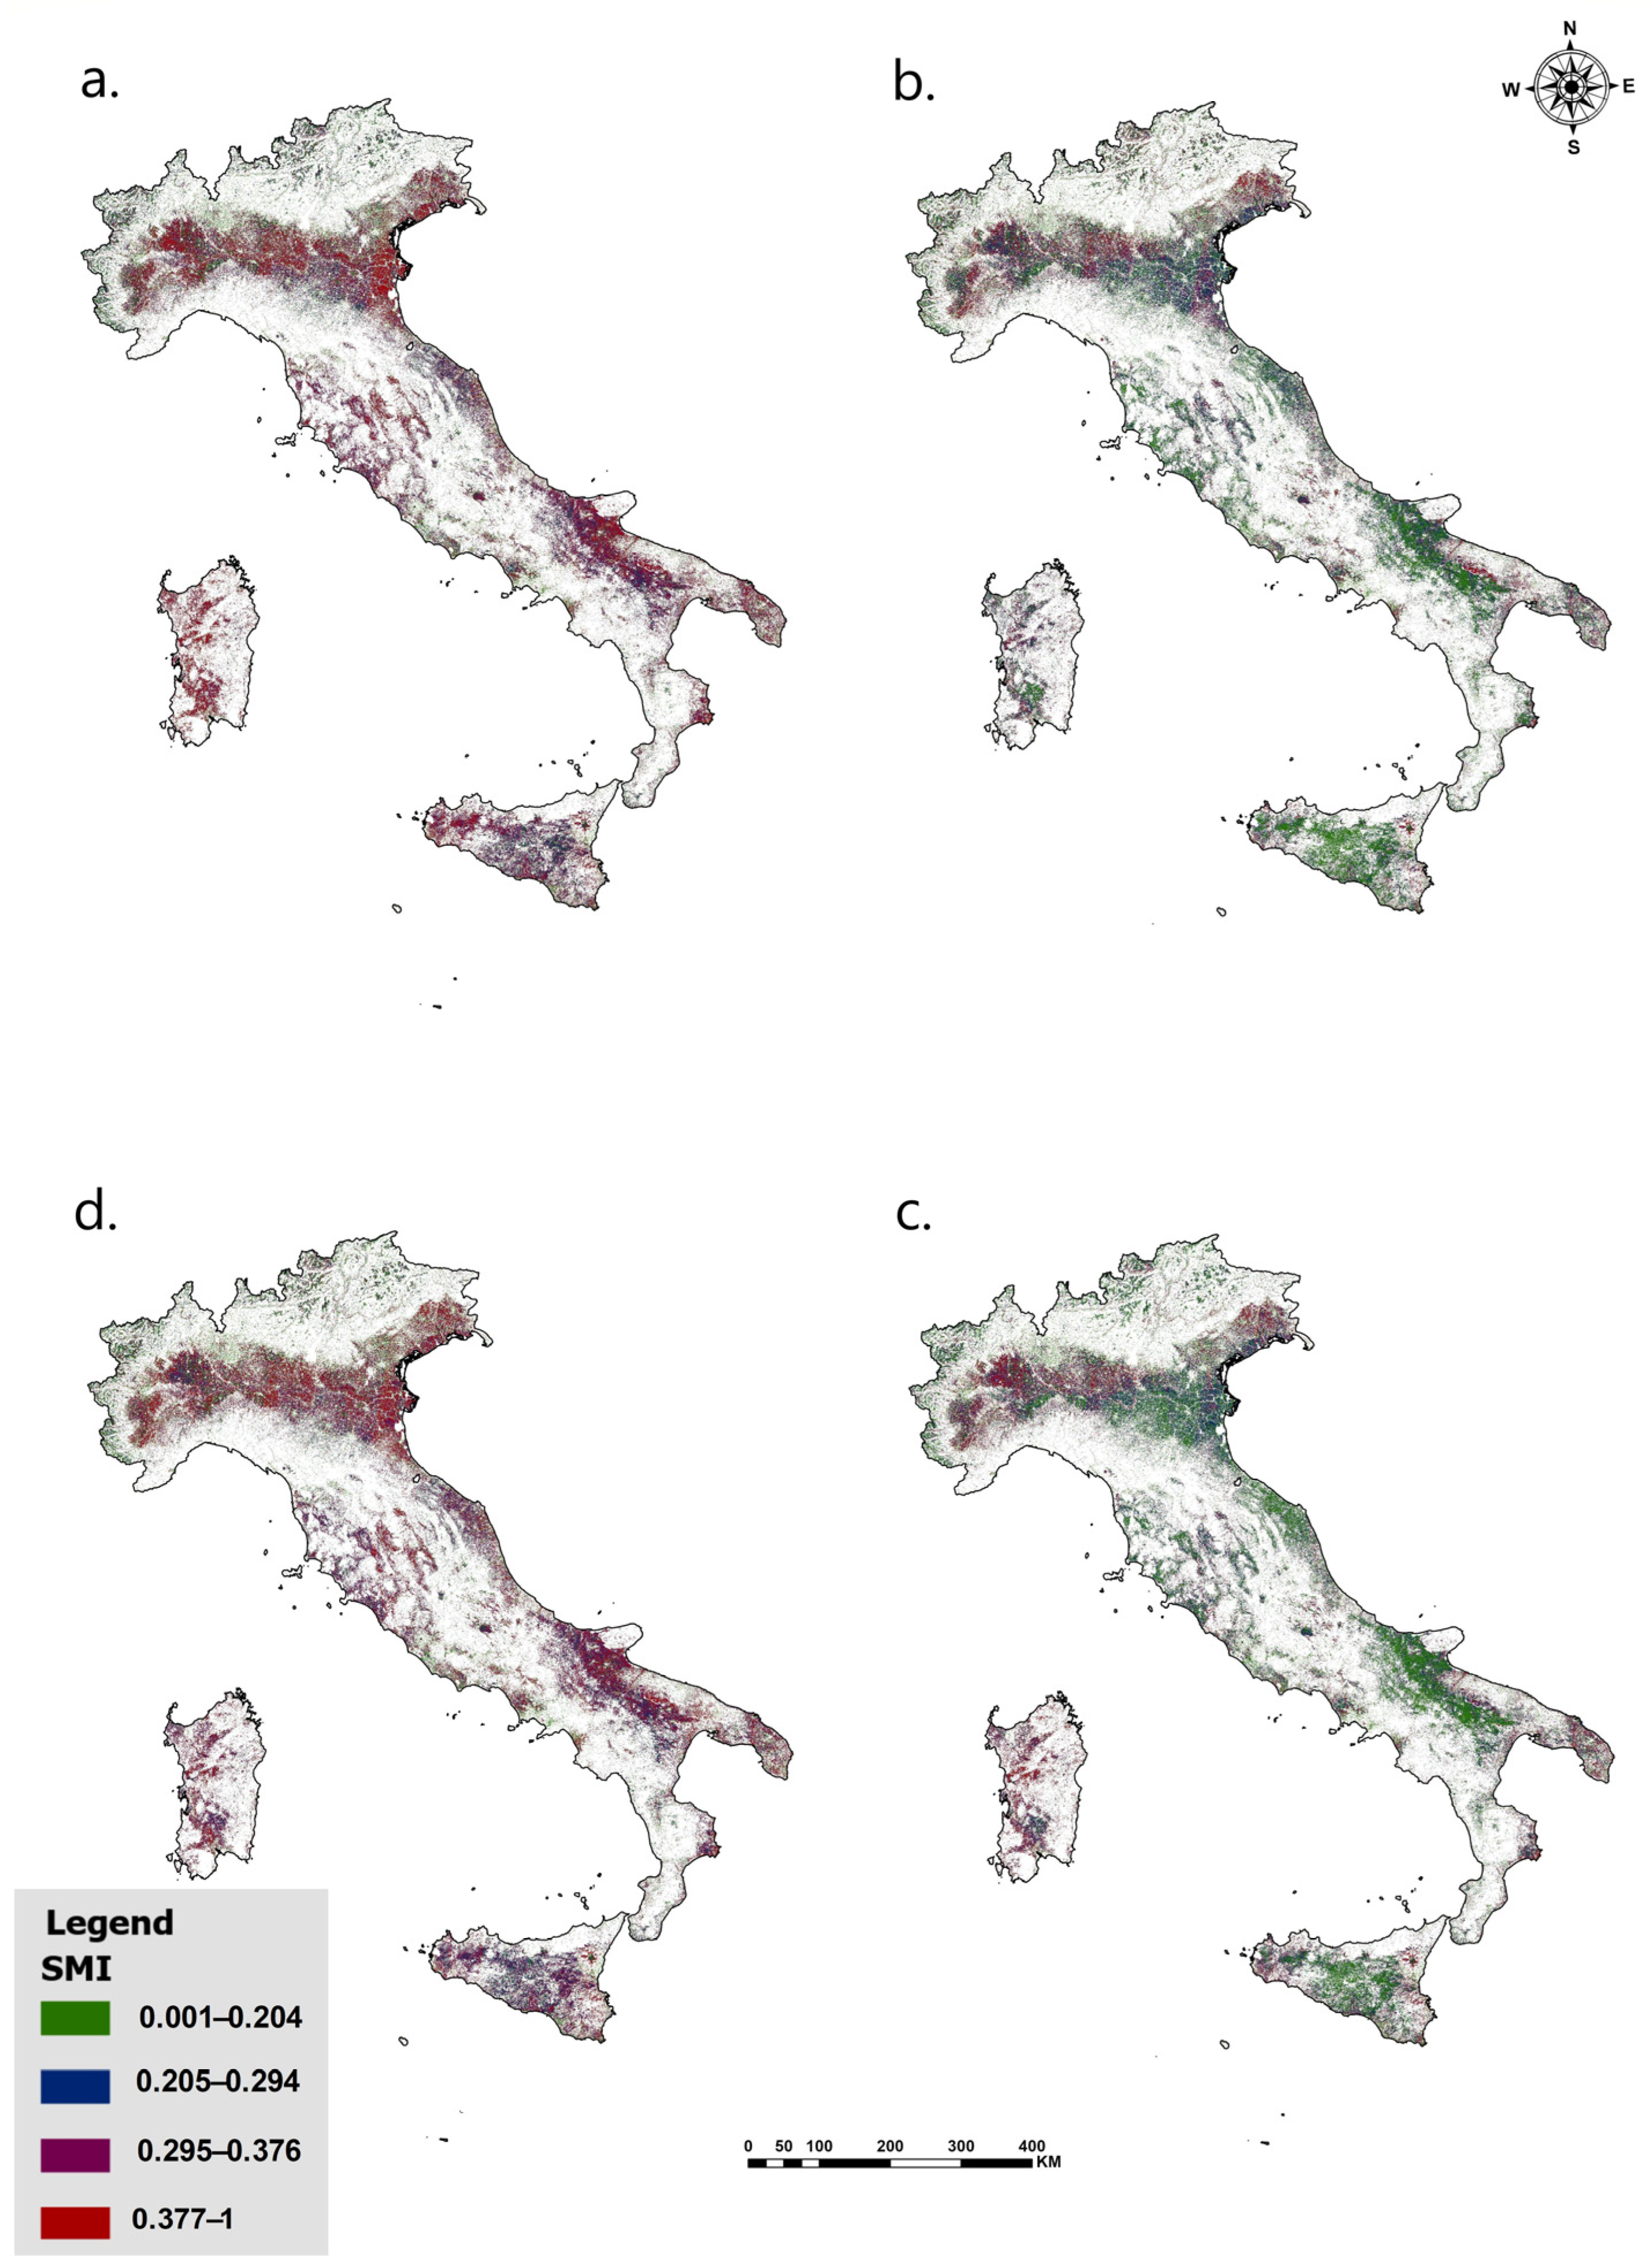
The multiyear mean SMI composite was used to derive the compaction risk model, which was then benchmarked against the bulk density layer. In addition to this, the mean seasonal mean SMI composite for the study area was calculated to achieve our objective of mapping compaction at a seasonal scale, as shown in Figure 6.

2.3.3. Normalized Difference Tillage Index (NDTI)

The NDTI is a vital remote sensing tool for evaluating soil compaction risk by measuring surface crop residue cover, a key factor influencing soil structure vulnerability. As demonstrated by Quemada and Daughtry et al. [40], NDTI effectively quantifies crop residue cover under varying moisture conditions, serving as a reliable proxy for tillage intensity.
Higher NDTI values indicate greater residue cover, typical of conservation tillage practices (e.g., no-till), which reduce compaction risk by minimizing machinery-induced soil disturbance, enhancing aggregate stability, and improving water infiltration [41,42,43]. Conversely, lower NDTI values reflect intensive tillage with minimal residue cover, leaving soils exposed and susceptible to compaction from raindrop impact, surface sealing, and equipment traffic, particularly under moist conditions [43,44,45]. Thus, NDTI facilitates large-scale spatial monitoring of compaction risk zones, making it a valuable component for soil compaction mapping. Out of different sets of satellite data, in this study, Sentinel-2 data have been used for the calculation of NDTI, following the methodology outlined by Quemada and Daughtry et al. [40]. NDTI is calculated using the formula given in Equation (2).
N D T I = B a n d   11 B a n d   12 B a n d   11 + B a n d   12
where Band 11 and Band 12 represent reflectance in Sentinel-2’s short-wave infrared bands at 1610 nm and 2190 nm, respectively.
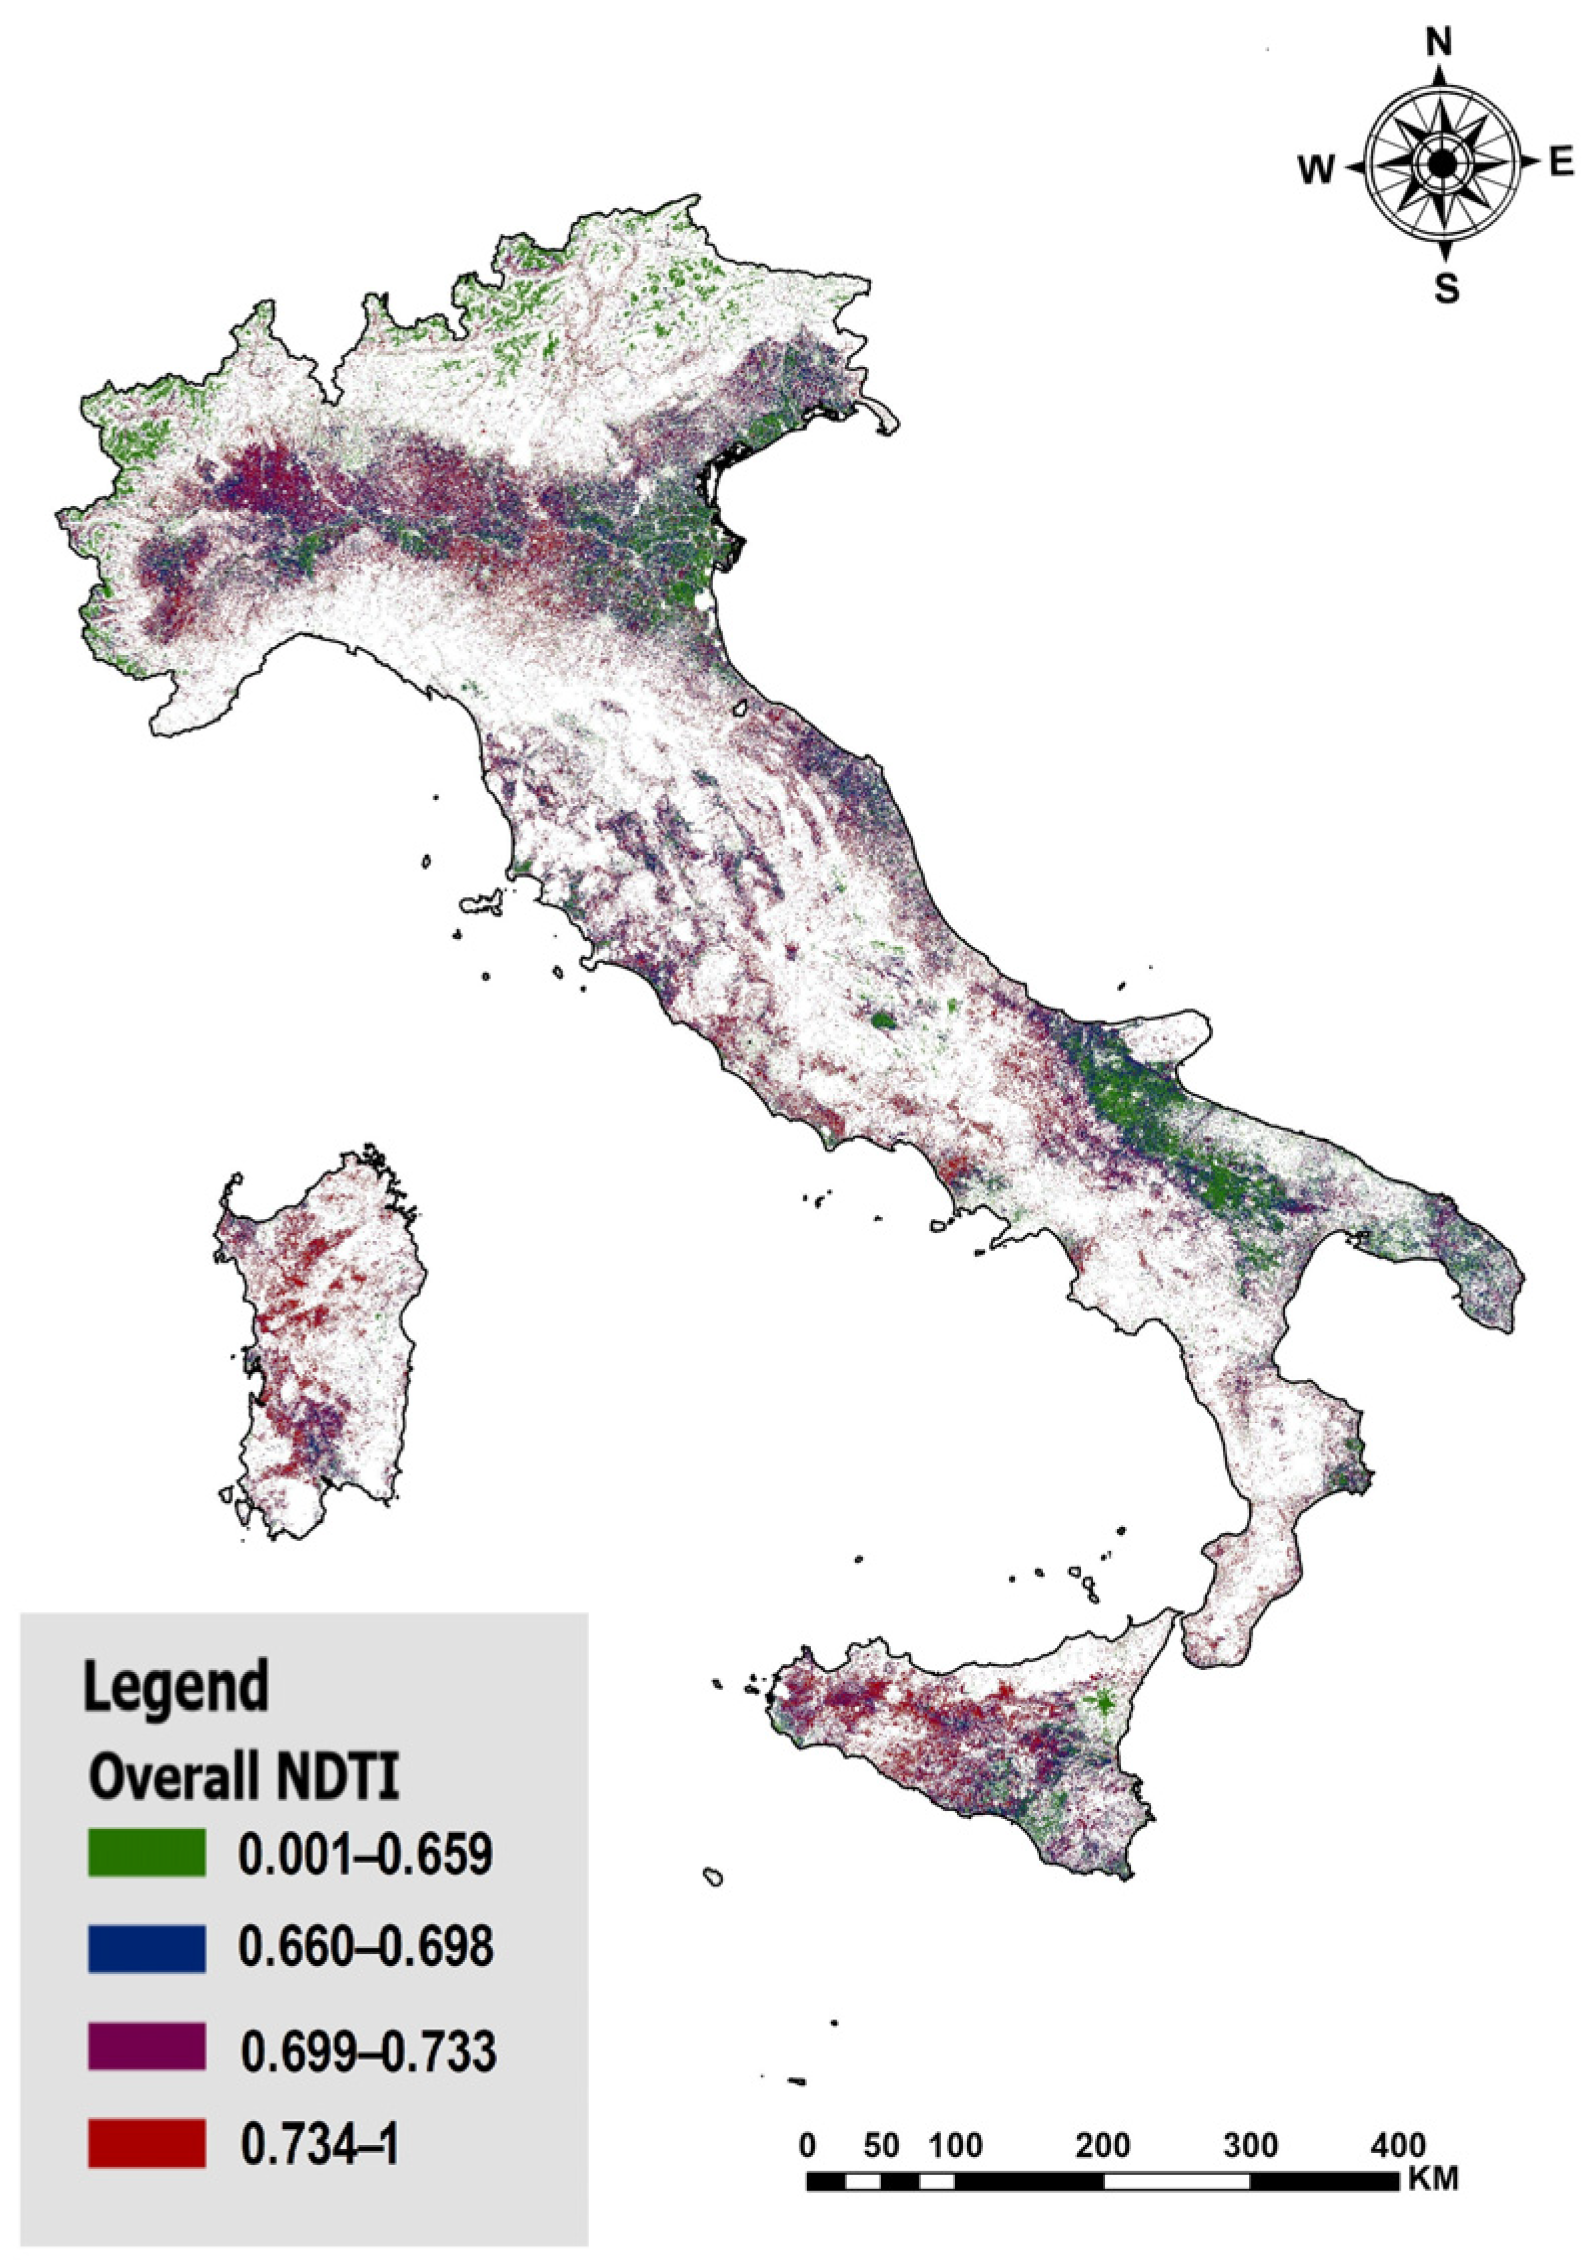
The single NDTI mean and seasonal mean for the study period (2018–2024) were calculated and normalized using feature scaling. The resulting NDTI composites were then clipped to the study area boundary and were resampled to a 100 m spatial resolution using ArcGIS Pro 3.6.1 software to ensure compatibility with the study’s analytical requirements. The clipped layer was later reclassified into four classes based on the quantile classification scheme in the ArcGIS Pro 3.6.1 software, as shown in Figure 7.
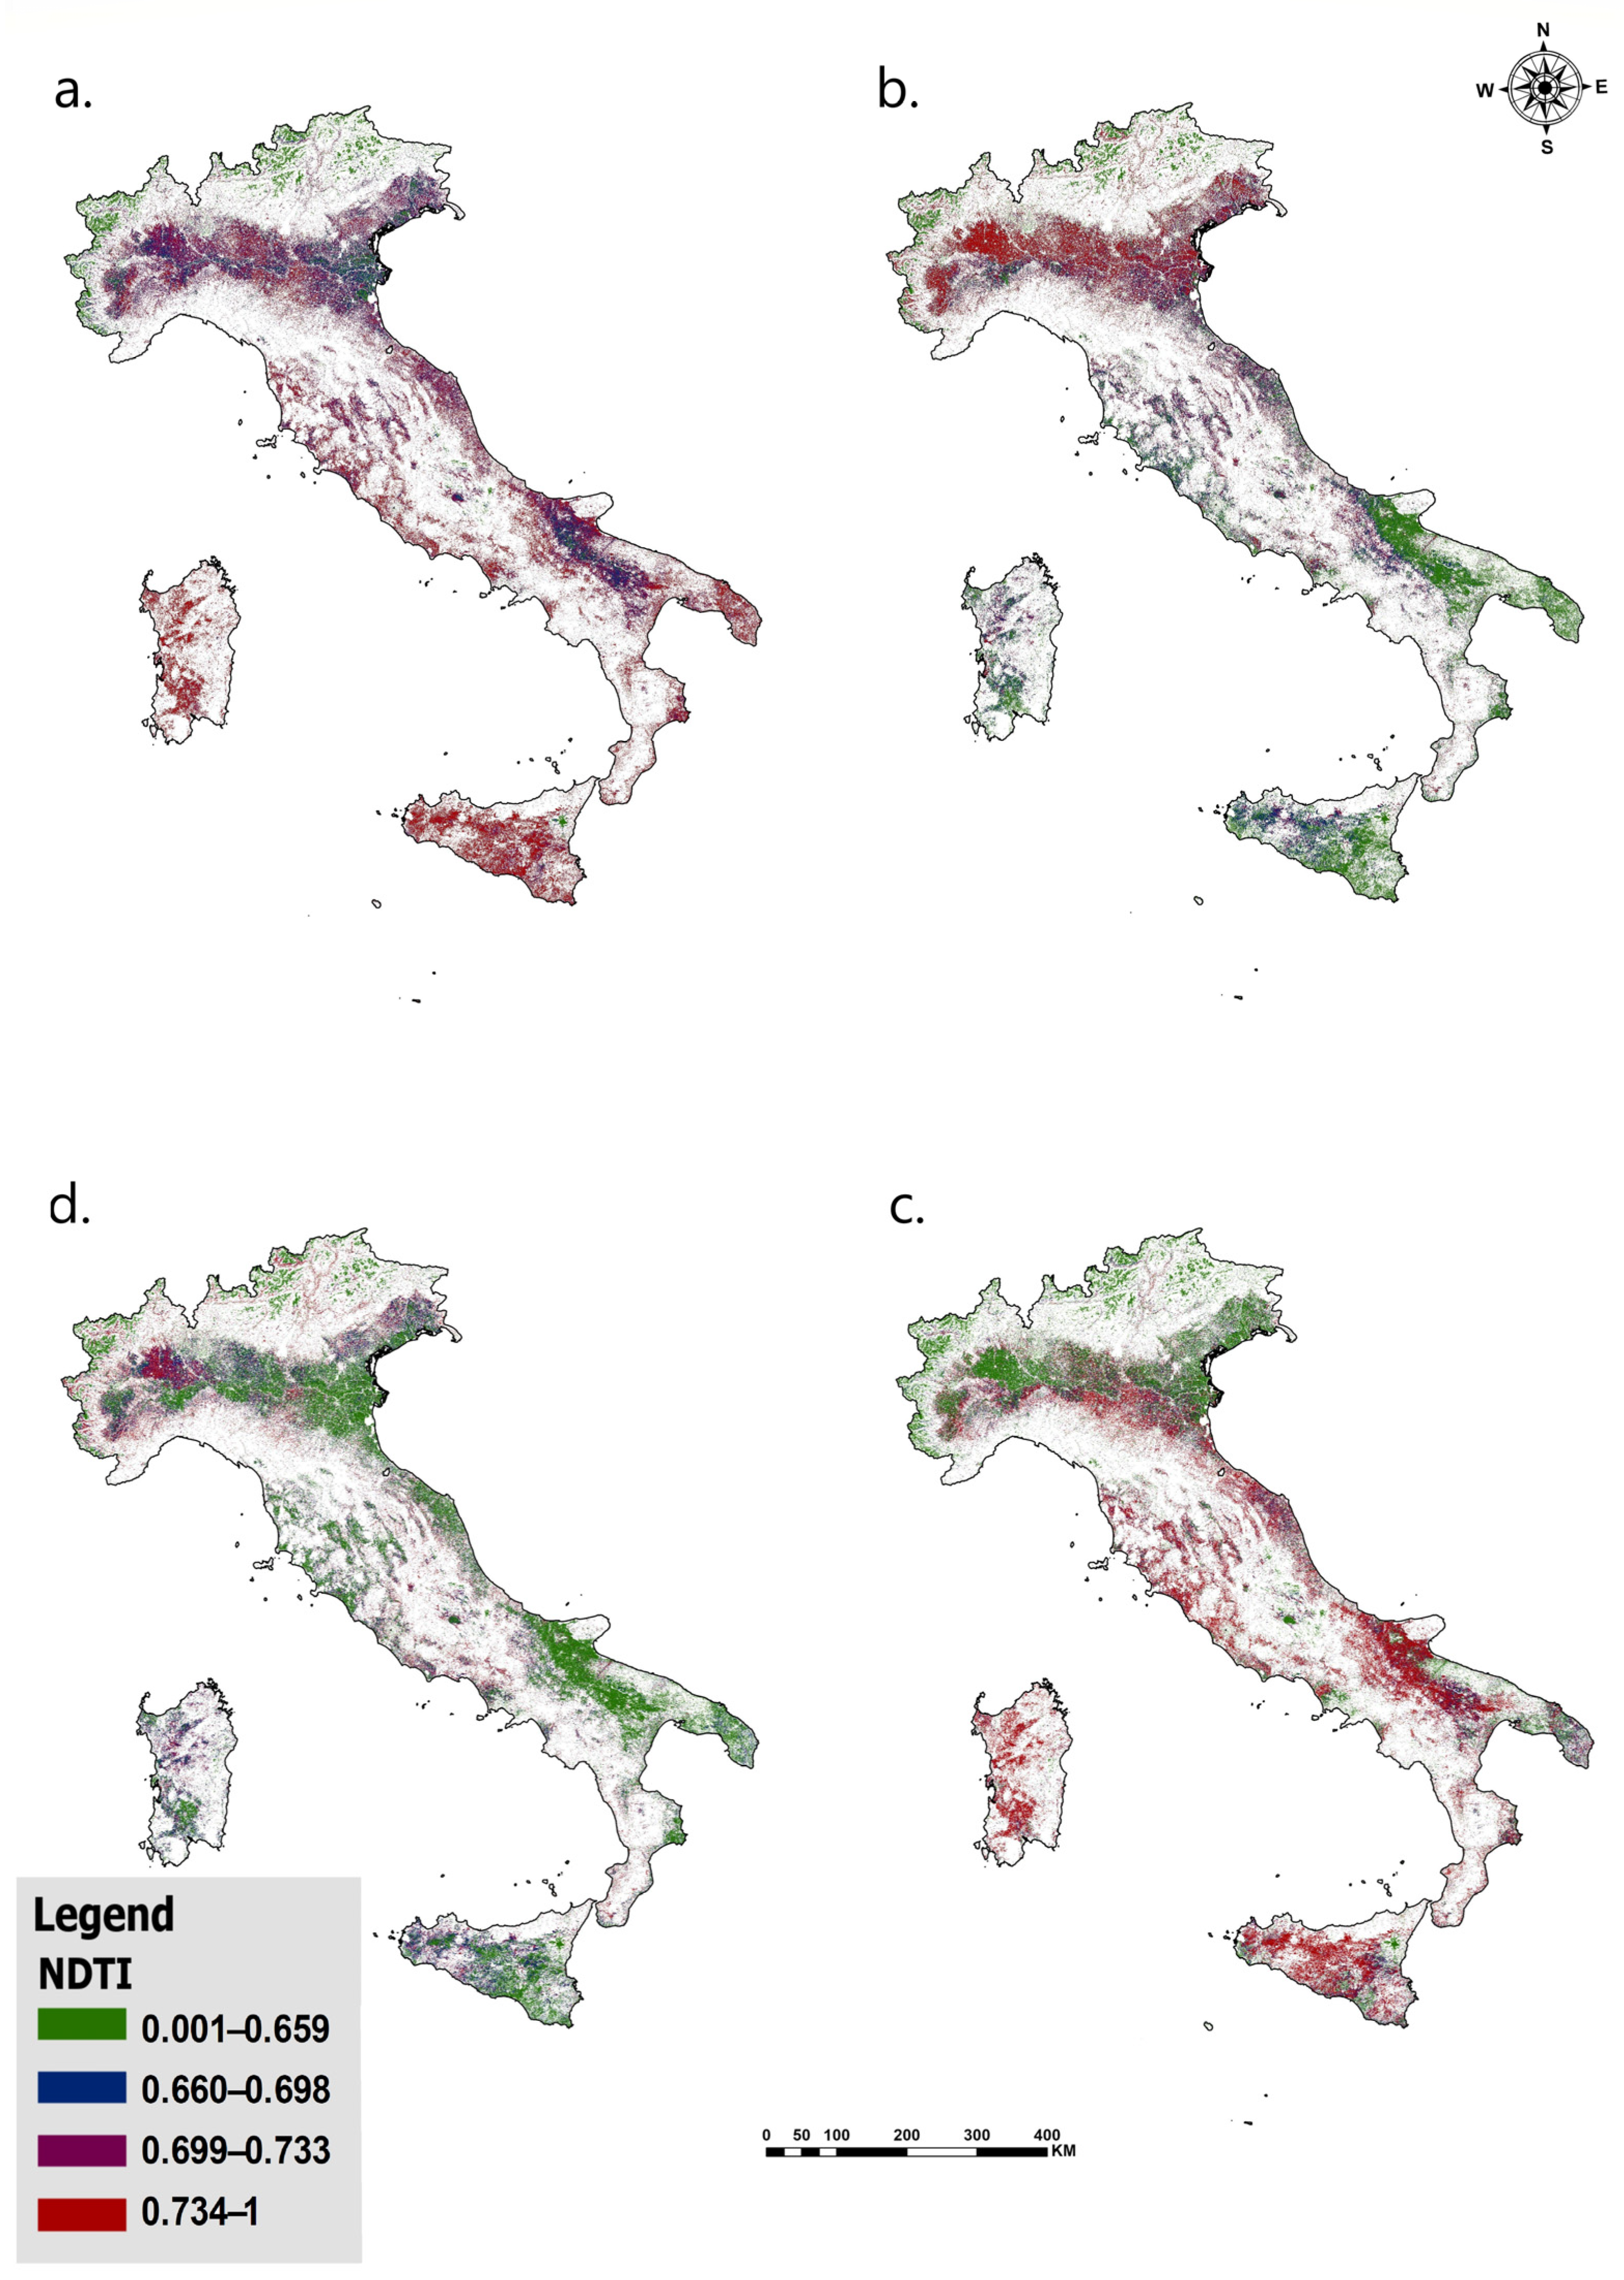
The multiyear mean NDTI composite was used to derive the compaction risk model, which was then benchmarked against the bulk density layer. In addition to this, the mean seasonal NDTI composite for the study area was calculated to achieve our objective of mapping compaction at a seasonal scale, as shown in Figure 8.

2.3.4. Intensity of Agricultural Practice Index (IOAPI)

Agricultural-intensity indicators, such as high livestock stocking rates, large irrigation inputs, and frequent cropping cycles, have been empirically linked to elevated soil compaction. For example, grazing studies consistently show that heavy livestock trampling “increases soil strength and bulk density” while reducing pore space [46]. In irrigated systems, excessive water application likewise exacerbates compaction. For example, Liu et al. [47] report that full (heavy) irrigation caused stronger post-tillage re-compaction than deficit irrigation, whereas reduced irrigation actually lowered deep-soil bulk density through enhanced wetting-drying cycles. Intensive cropping practices produce similar effects: repeated heavy machinery traffic in continuous or short-rotation systems generates hardened layers with higher bulk density [47]. In contrast, diversified rotations and cover crops tend to improve structure; for instance, alternating deep- and shallow-rooted crops significantly increased porosity and reduced soil bulk density relative to a simple monoculture [48]. These findings suggest that management intensity indices (stocking density, irrigation amount, cropping intensity) serve as useful proxies and drivers of the mechanical loading that underpins compaction risk in agroecosystems [46,47]. Hence, the Intensity of Agricultural Practice Index (IOAPI) can be an important trigger factor for inducing soil compaction. To calculate IOAPI, Bonato [35] used a methodology based on the statistical data that is related to the agricultural practices, using three agricultural indicators from the 2010 ISTAT Agricultural Census to represent farming intensity:
i.
the percentage of arable land under crop rotation (X1)
ii.
the volume of irrigation water used per hectare of Utilized Agricultural Area (UAA) (X2)
iii.
the number of livestock units per hectare of UAA (LSU/ha) (X3)
In this study, we used 2020 ISTAT Agricultural Census data, in which data on the volume of irrigation water were not available. Hence, we created a customized index by replacing the volume of irrigation water used per hectare of Utilized Agricultural Area (UAA) with the irrigable area of UAA (X2Rev). Although the volume of irrigation water used per hectare of UAA represents a direct indicator of irrigation pressure within a given region, the ratio between irrigable area and total UAA also provides indirect insights into the IOAPI. For deriving IOAPI, we first removed outliers using a standard three-sigma/Interquartile Range (IQR) thresholding method from each of the three input factors, then aggregated values to the municipal level and computed the mean IOAPI per municipality using Equation (3).
I O A P I = X 1 + X 2 R e v + X 3 3
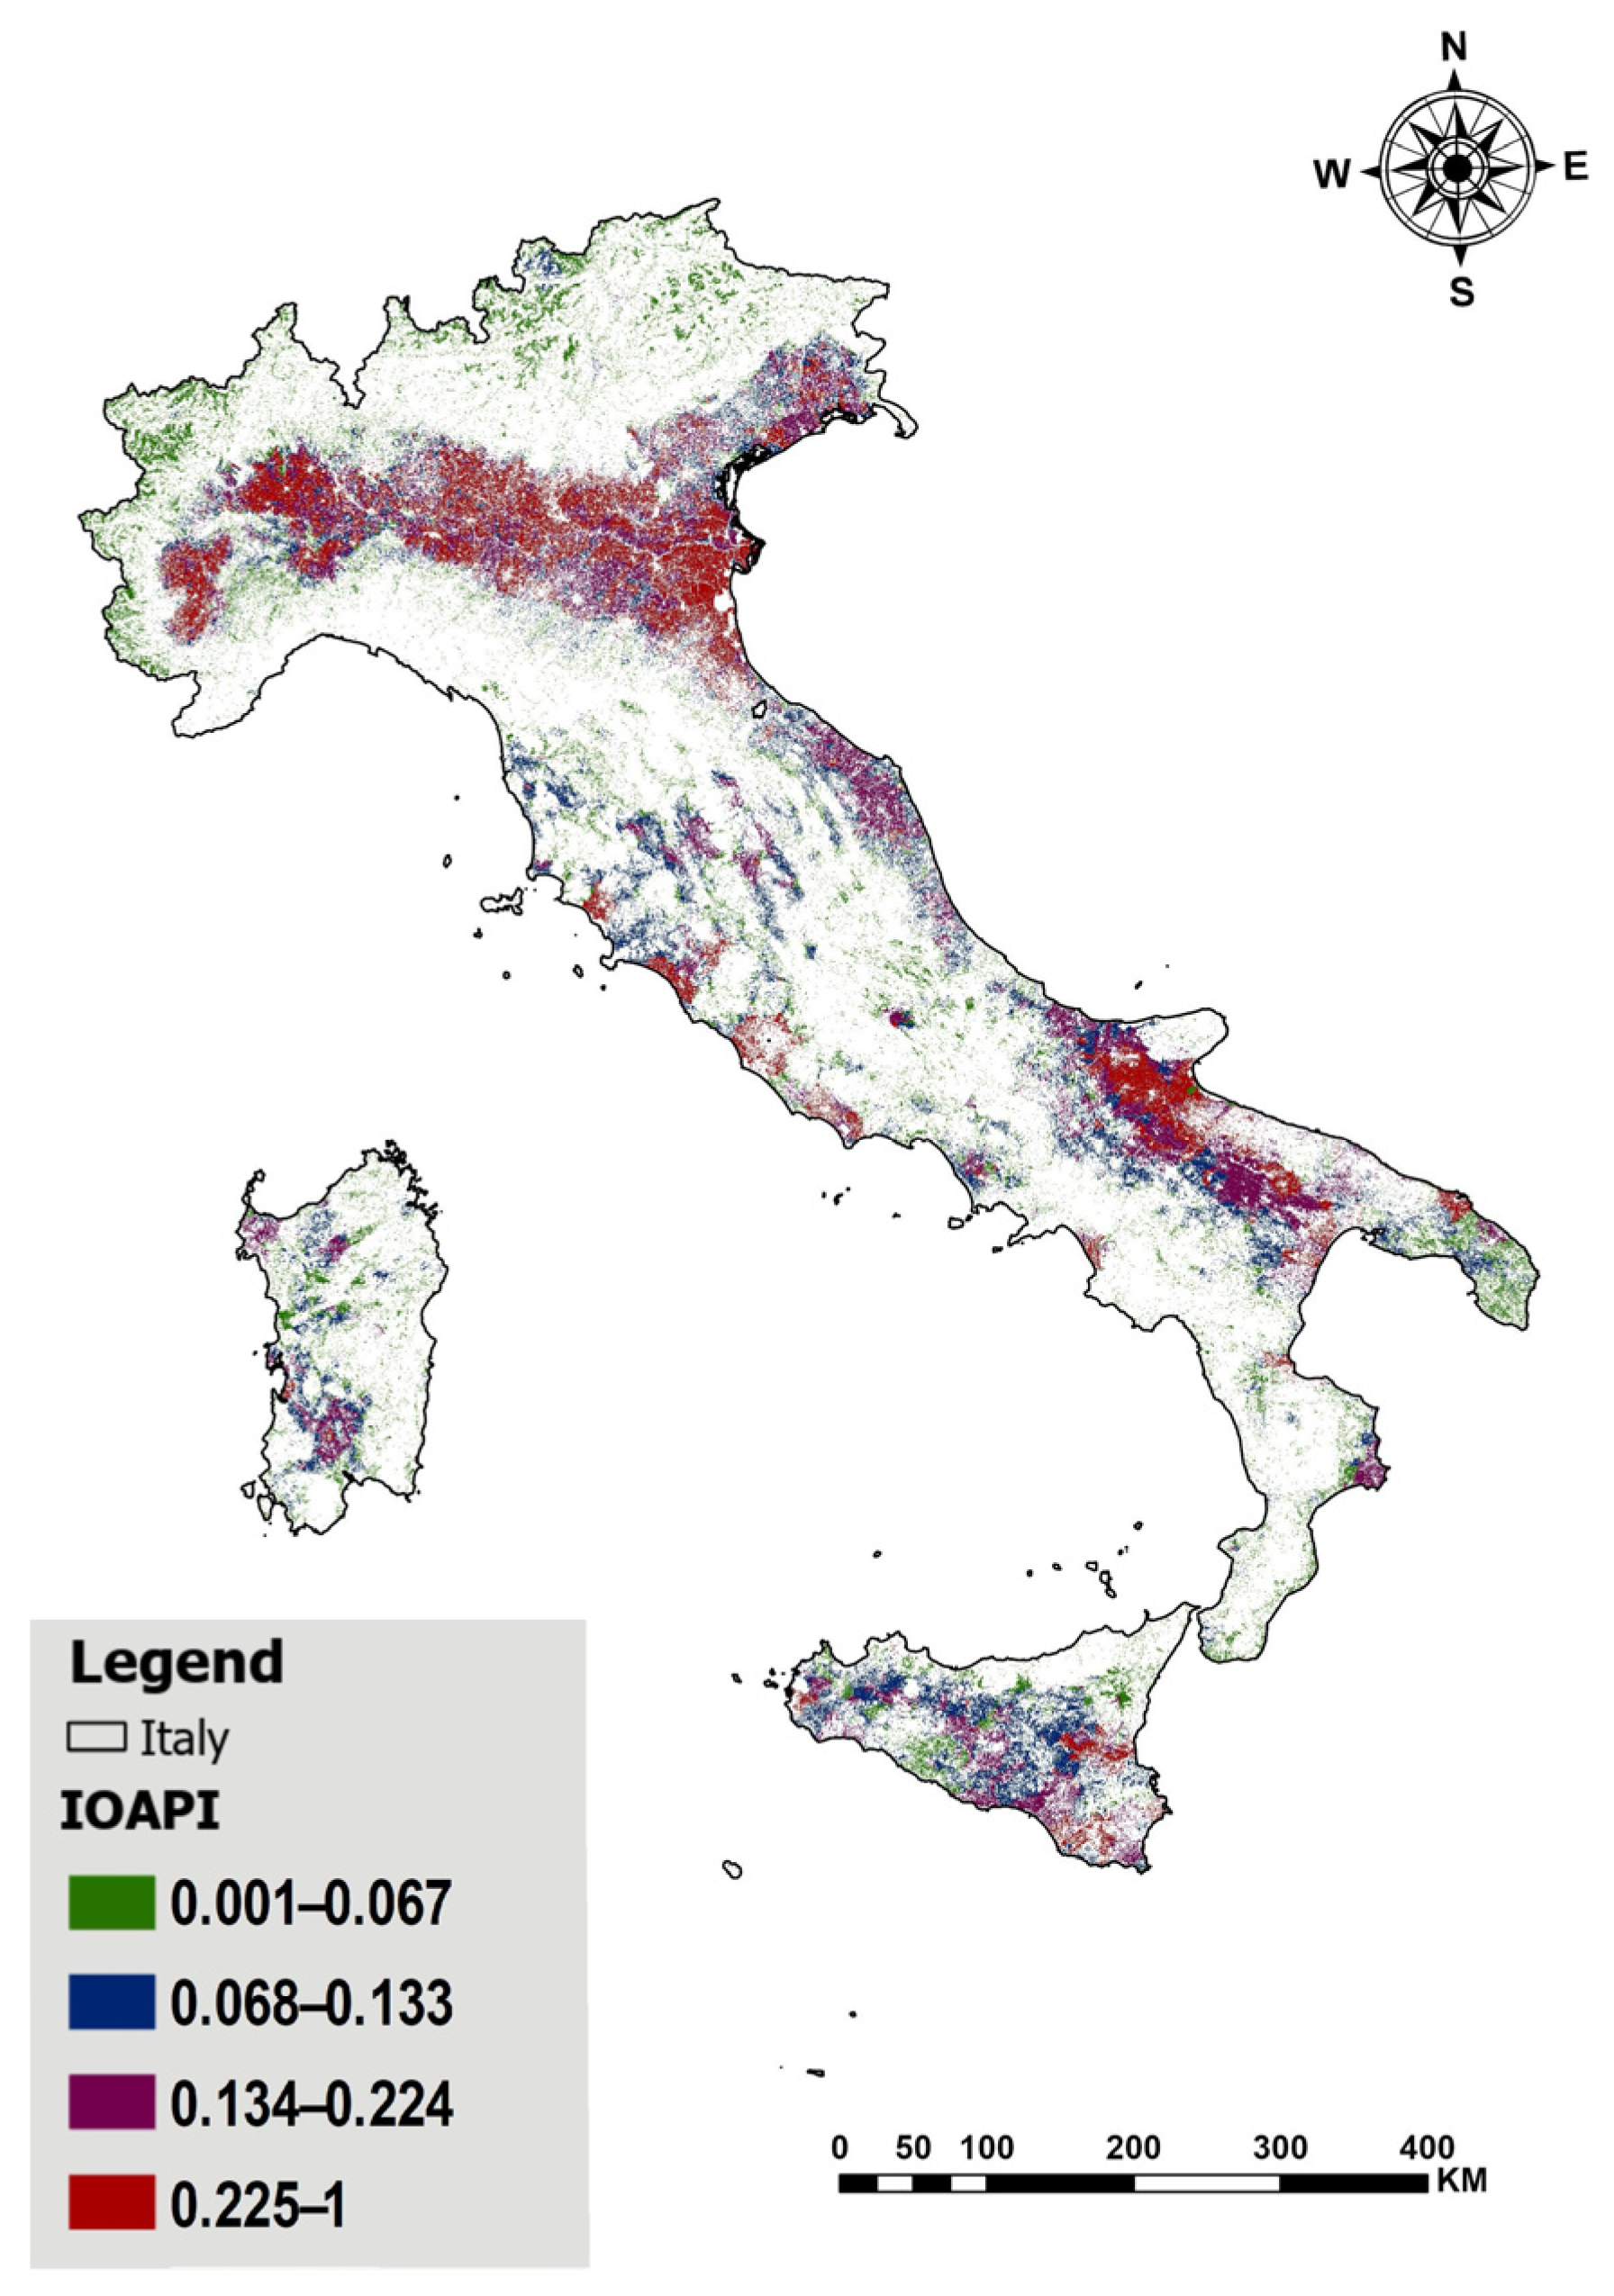
To ensure comparability across indicators with differing units and distributions, we applied min-max normalization (Equation (4)) to rescale to the [0, 1] range (0 = lowest intensity; 1 = highest). The min-max normalization approach was preferred because it preserves the original data distribution and relative spacing between values. The normalized IOAPI surface was then resampled to 100 m spatial resolution and reclassified into four classes using a quantile scheme in ArcGIS Pro 3.6.1, as shown in Figure 9.
M i n M a x   N o r m = X X m i n X m a x X m i n
where X, Xmin, and Xmax are the respective variable, the minimum, and the maximum values of the respective variable category.
The IOAPI exhibits spatial heterogeneity across the territory, successfully capturing regional variations in farming intensity. As shown in Figure 9, the index varies significantly from one macro-region to another, based on topography and land use. For example, IOAPI scores are prominently higher in highly mechanized, flat agricultural zones such as Veneto. Conversely, scores drop sharply in mountainous terrains such as northern Lombardy, where geographic constraints naturally limit intensive field traffic and heavy machinery deployment [49].

2.4. Compaction Risk Modeling

In this study, compaction risk is defined as a relative susceptibility index representing the combined influence of environmental and management-related factors on the likelihood of compaction occurrence. The compaction risk map was prepared by overlaying the compaction triggering factors and their classes. Before being overlayed, the compaction-triggering factors and their classes should be assigned based on their relative importance, primarily based on the expert knowledge and the relevant literature on compaction drivers. The Analytic Hierarchy Process (AHP) approach, introduced by Saaty [50], was used to assign the weights of compaction-triggering factors. For that, a pairwise comparison was conducted using Saaty’s scale [31] in Microsoft® Excel® for Microsoft 365 MSO (Version 2604), as shown in Table 2, and a pairwise comparison matrix was obtained after assigning appropriate relative intensity of importance scores to the compaction-triggering factors (Table 3).
To evaluate the internal consistency of the pairwise comparison matrix, the Consistency Ratio (CR) was calculated following [51] using the ArcGIS plugin developed by Ashfaq [52]. The obtained CR value (0.07) was below the acceptable threshold of 0.1, indicating a satisfactory level of consistency in the expert-based judgments.
The classes of compaction-triggering factors were assigned using a simple numerical rating. Each class was assigned a weight on a scale from 0 to 9, indicating their respective levels of importance, as shown in Table 4. A higher weight signifies a higher susceptibility to compaction, while a lower weight indicates lower vulnerability to such events.
Once all layers were reclassified and each assigned a rank, a model was developed to overlay this data according to defined weights in order to produce a compaction-prone risk map. Using the Spatial Analyst (Raster Weighted Overlay) tool in ArcGIS Pro 3.6.1 model builder, using Equation (5).
P C R Z = 27   C F I + 53   S M I + 7   N D T I + 13   I O A P I
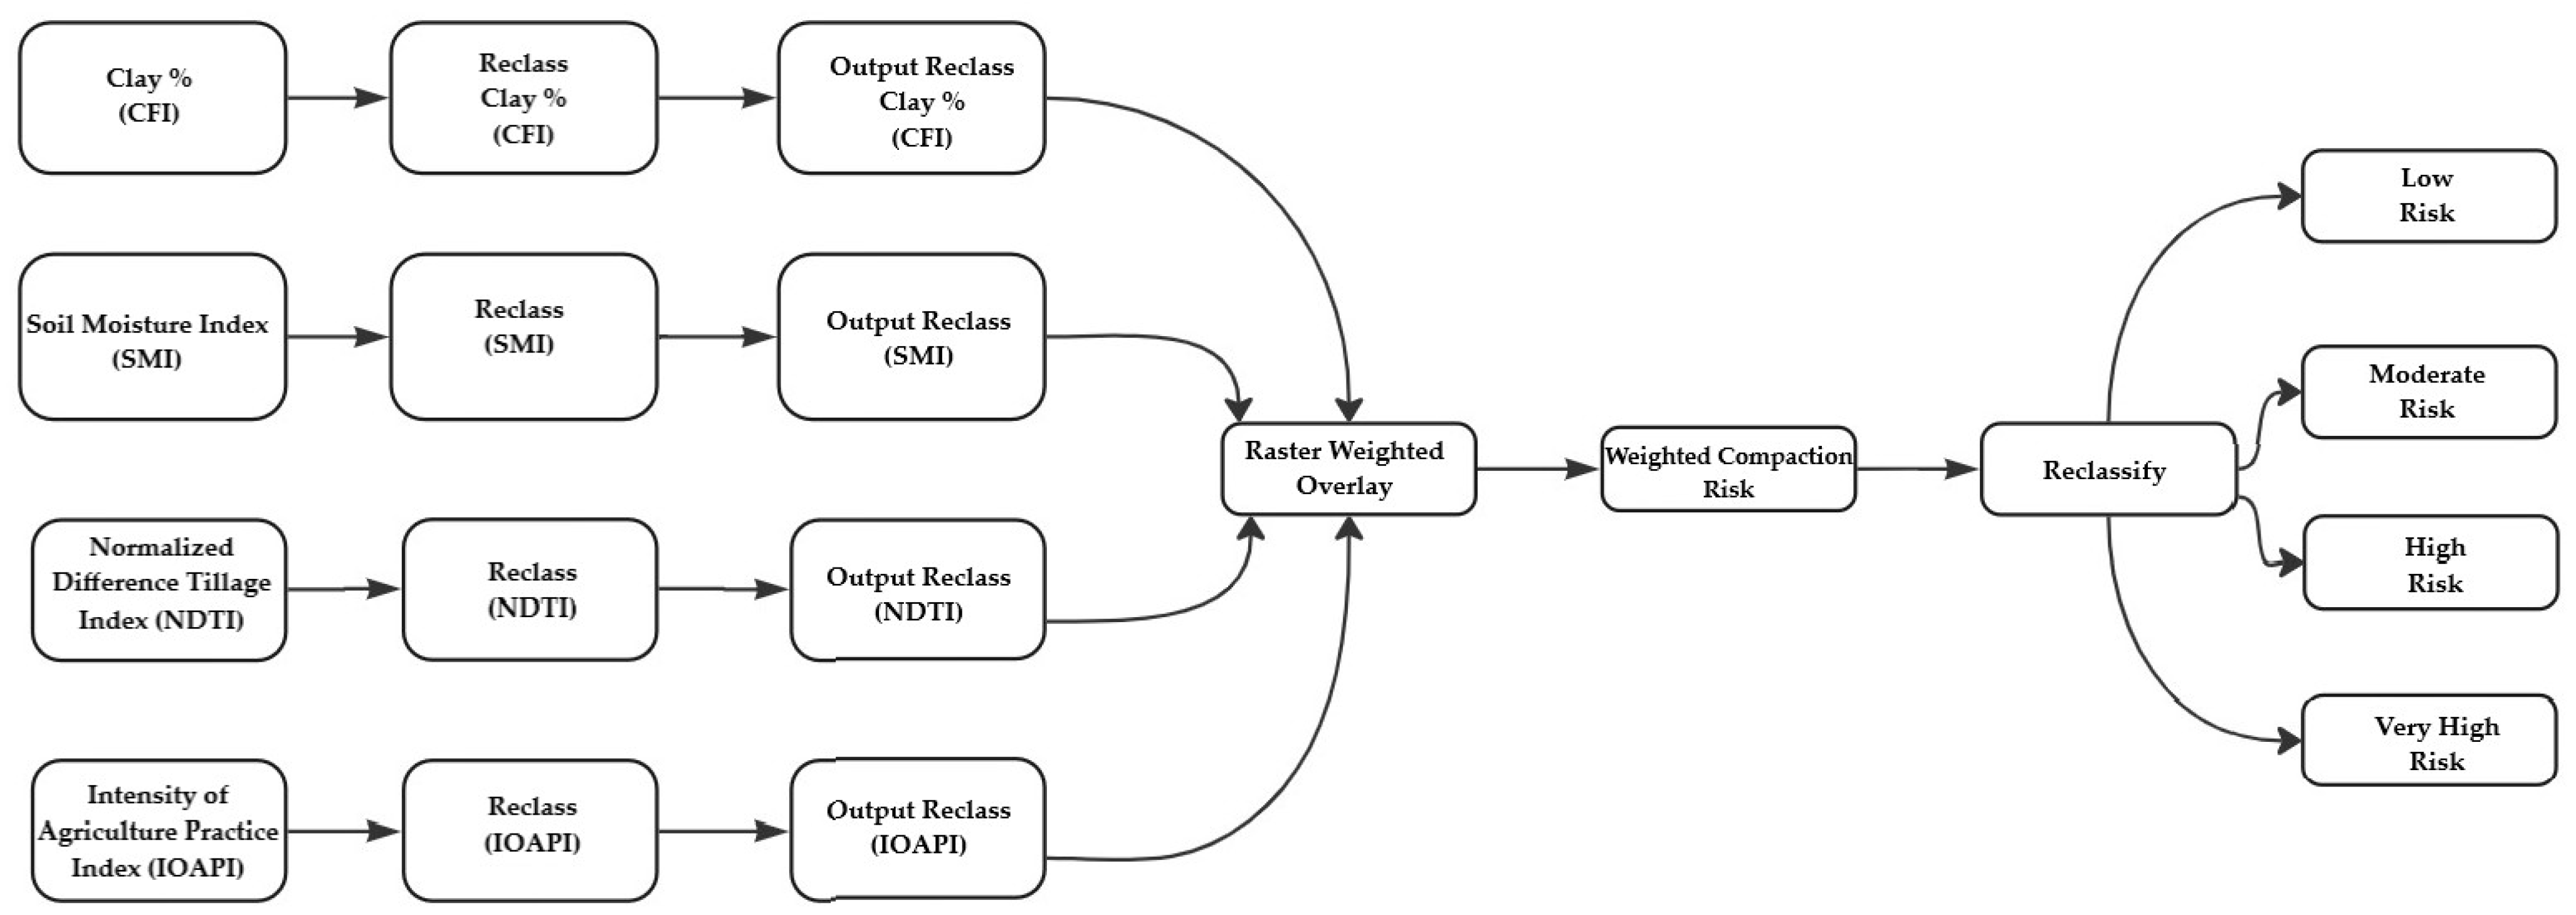
where PCRZ is the Potential Compaction Risk Zone, the CFI indicates Clay Fraction Index variable, the SMI indicates Soil Moisture Index variable, the NDTI indicates Normalized Difference Tillage Index variable, and the IOAPI indicates Intensity of Agriculture Practices Index variable, each with four classes. Finally, a PCRZ map was produced based on these analyses using ArcGIS Pro 3.6.1 software. The model used for the preparation of the Potential Compaction Risk Zone (PCRZ) into four risk classes, as shown in Figure 10. The high and very high-risk classes were reaggregated into a single risk class called extreme risk for further analysis.

2.5. Sensitivity Analysis and Accuracy Assessment

To evaluate the robustness of the weighting scheme, we performed a Monte Carlo sensitivity analysis [53] by perturbing each AHP weight using the ArcGIS plugin developed by Ashfaq [52]. Each criterion weight was iteratively perturbed across 5000 simulations, with the remaining criteria weights proportionally adjusted to maintain a strict sum of one.
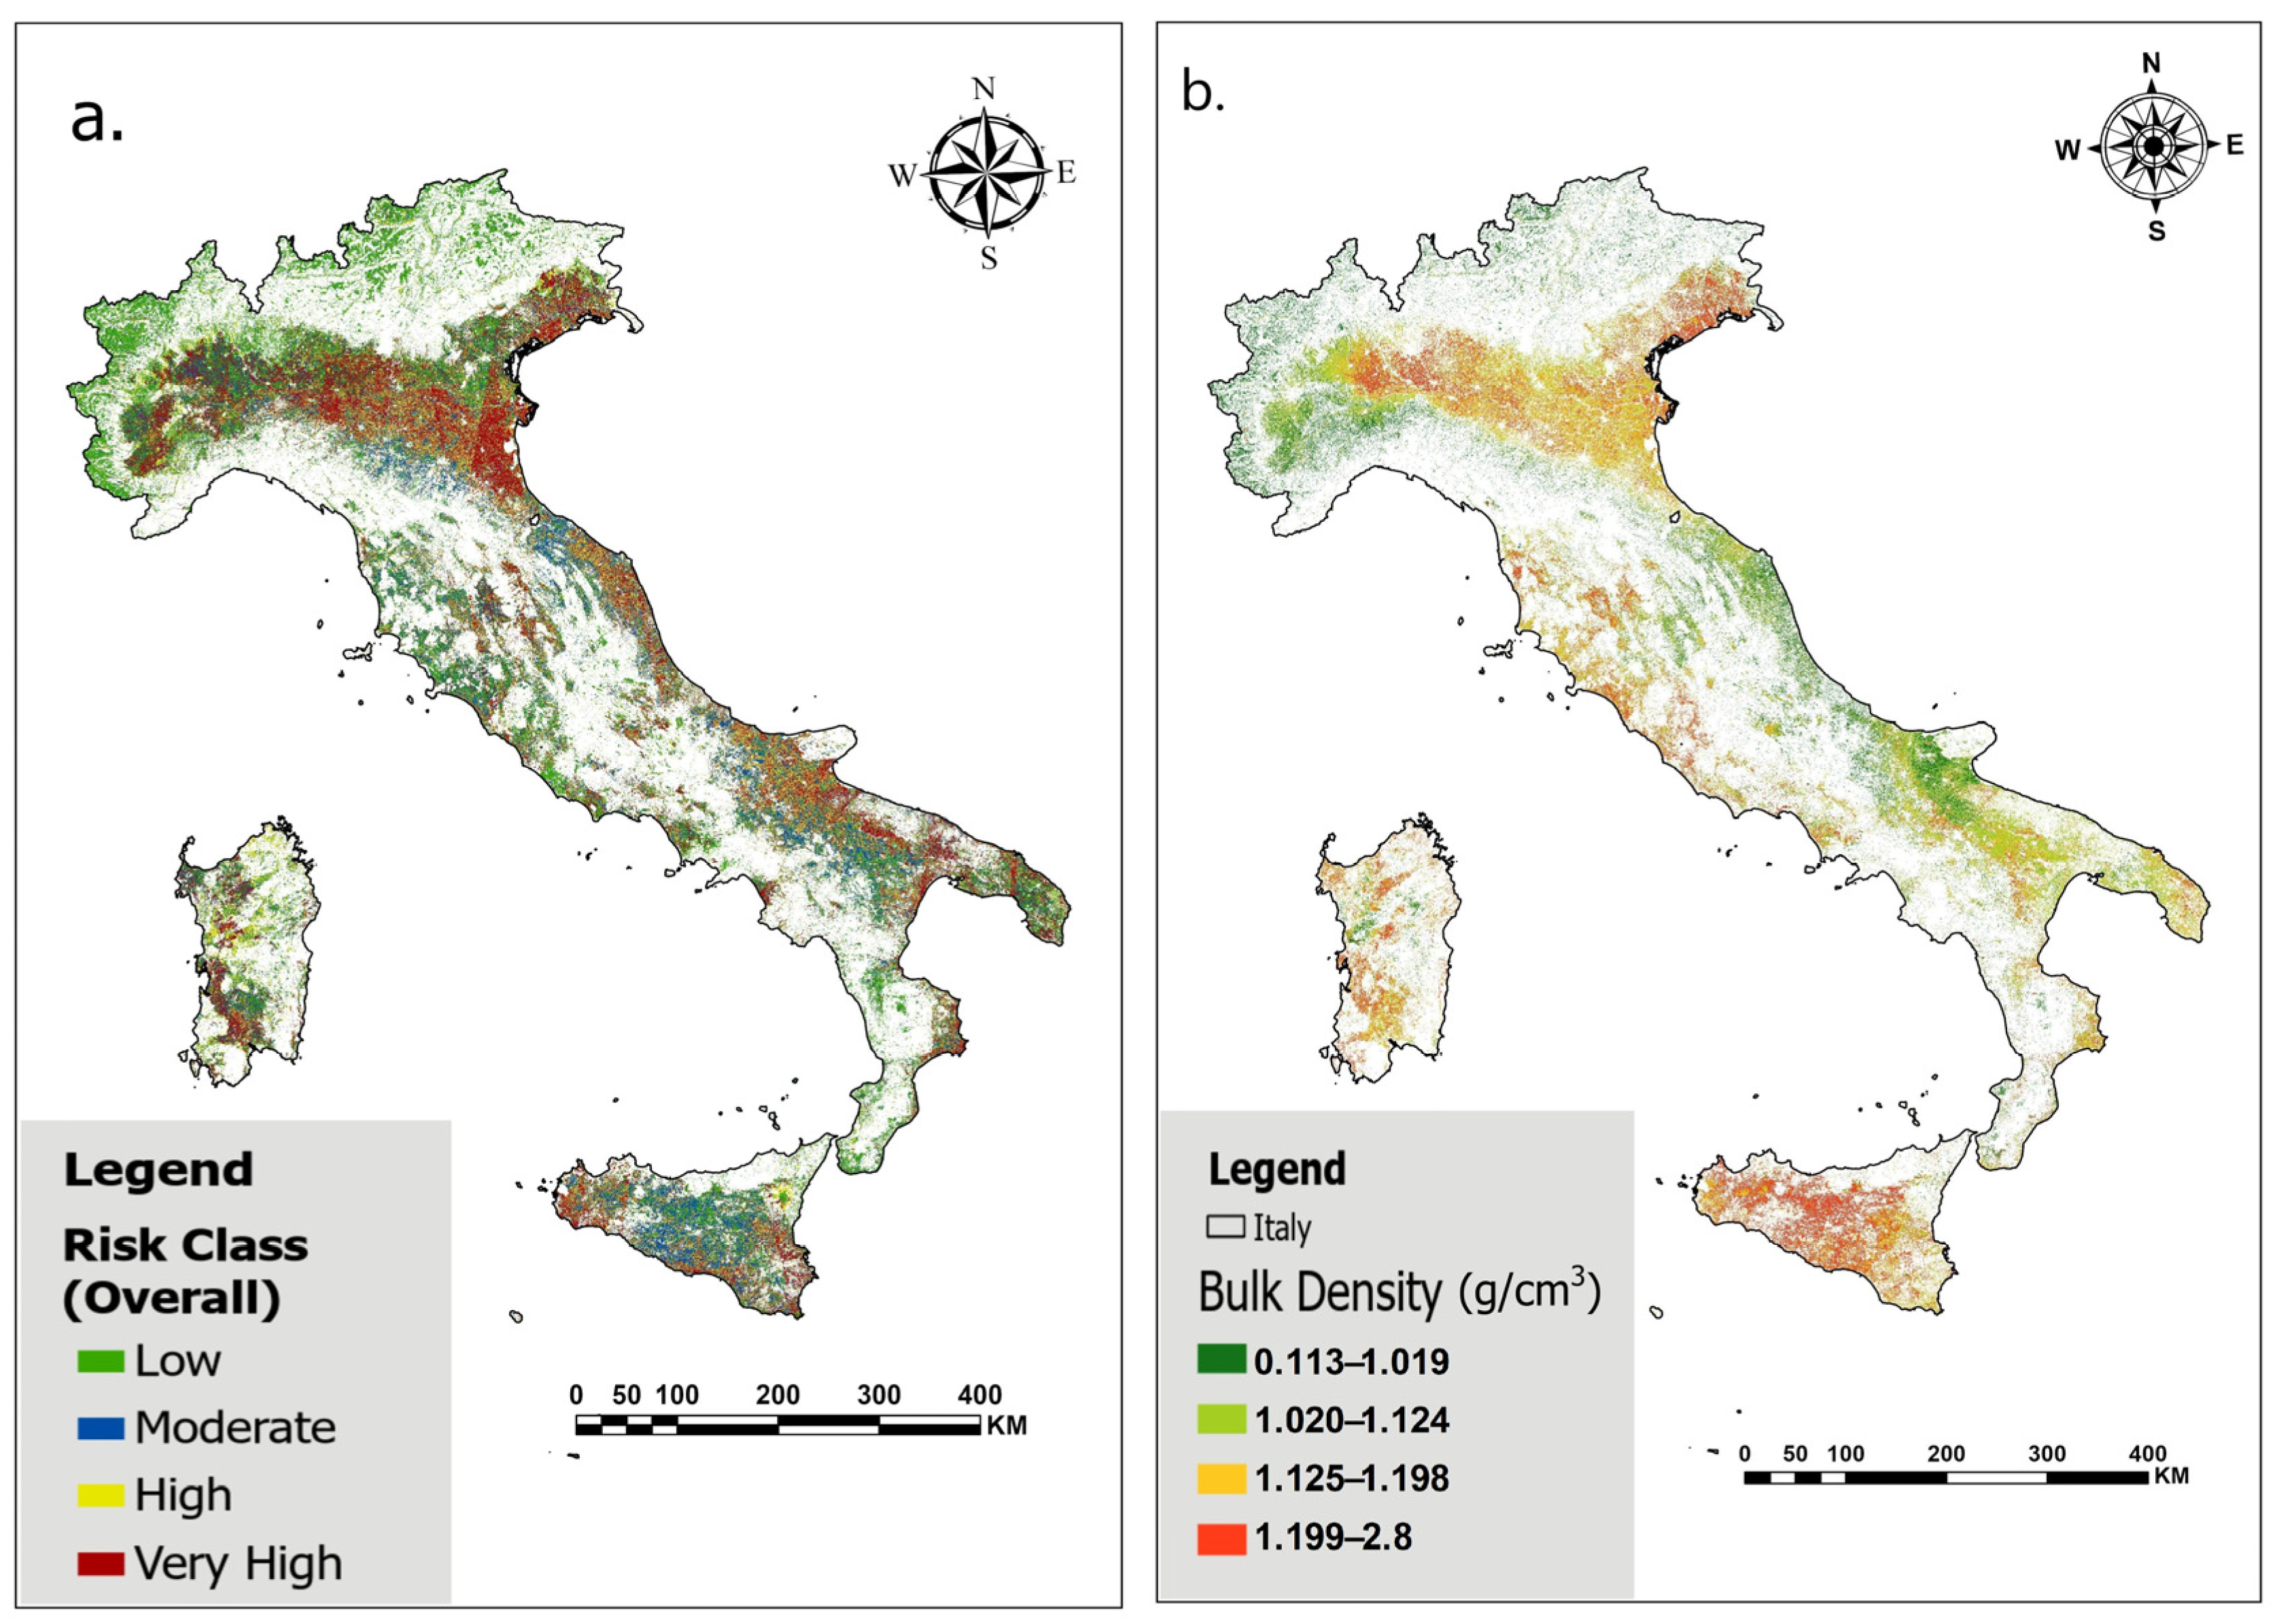
To provide an indirect evaluation of the proposed compaction risk framework, the mean multiyear compaction-risk map was compared against the European bulk-density (BD) layer at 100 m spatial resolution produced by Panagos [54]. Bulk density was used as a static proxy of soil physical condition [54,55], acknowledging that it does not directly represent temporally dynamic compaction risk. The BD raster was first clipped to the study area, reprojected to ETRS89/LAEA (EPSG:3035) to match our project coordinate system, and aligned to the analysis grid to ensure pixel-level correspondence with the model output. To enable comparison, the BD layer was then classified into four risk classes, in ascending order of magnitude to match the four classes of our multiyear compaction map. The two classified raster files were cross-tabulated to produce the confusion matrix, from which we reported overall accuracy as well as users’ and producers’ accuracies for each class. This comparison was meant as an evaluation of spatial correspondence between the modeled risk pattern and an independent, static soil-property proxy. However, bulk density reflects the cumulative outcome of past soil processes and management history, while the proposed framework estimates relative compaction susceptibility based on dynamic and seasonal drivers.

3. Results

3.1. Soil Compaction Risk Patterns Across Italy

3.1.1. National Scale Seasonal Risk Dynamics

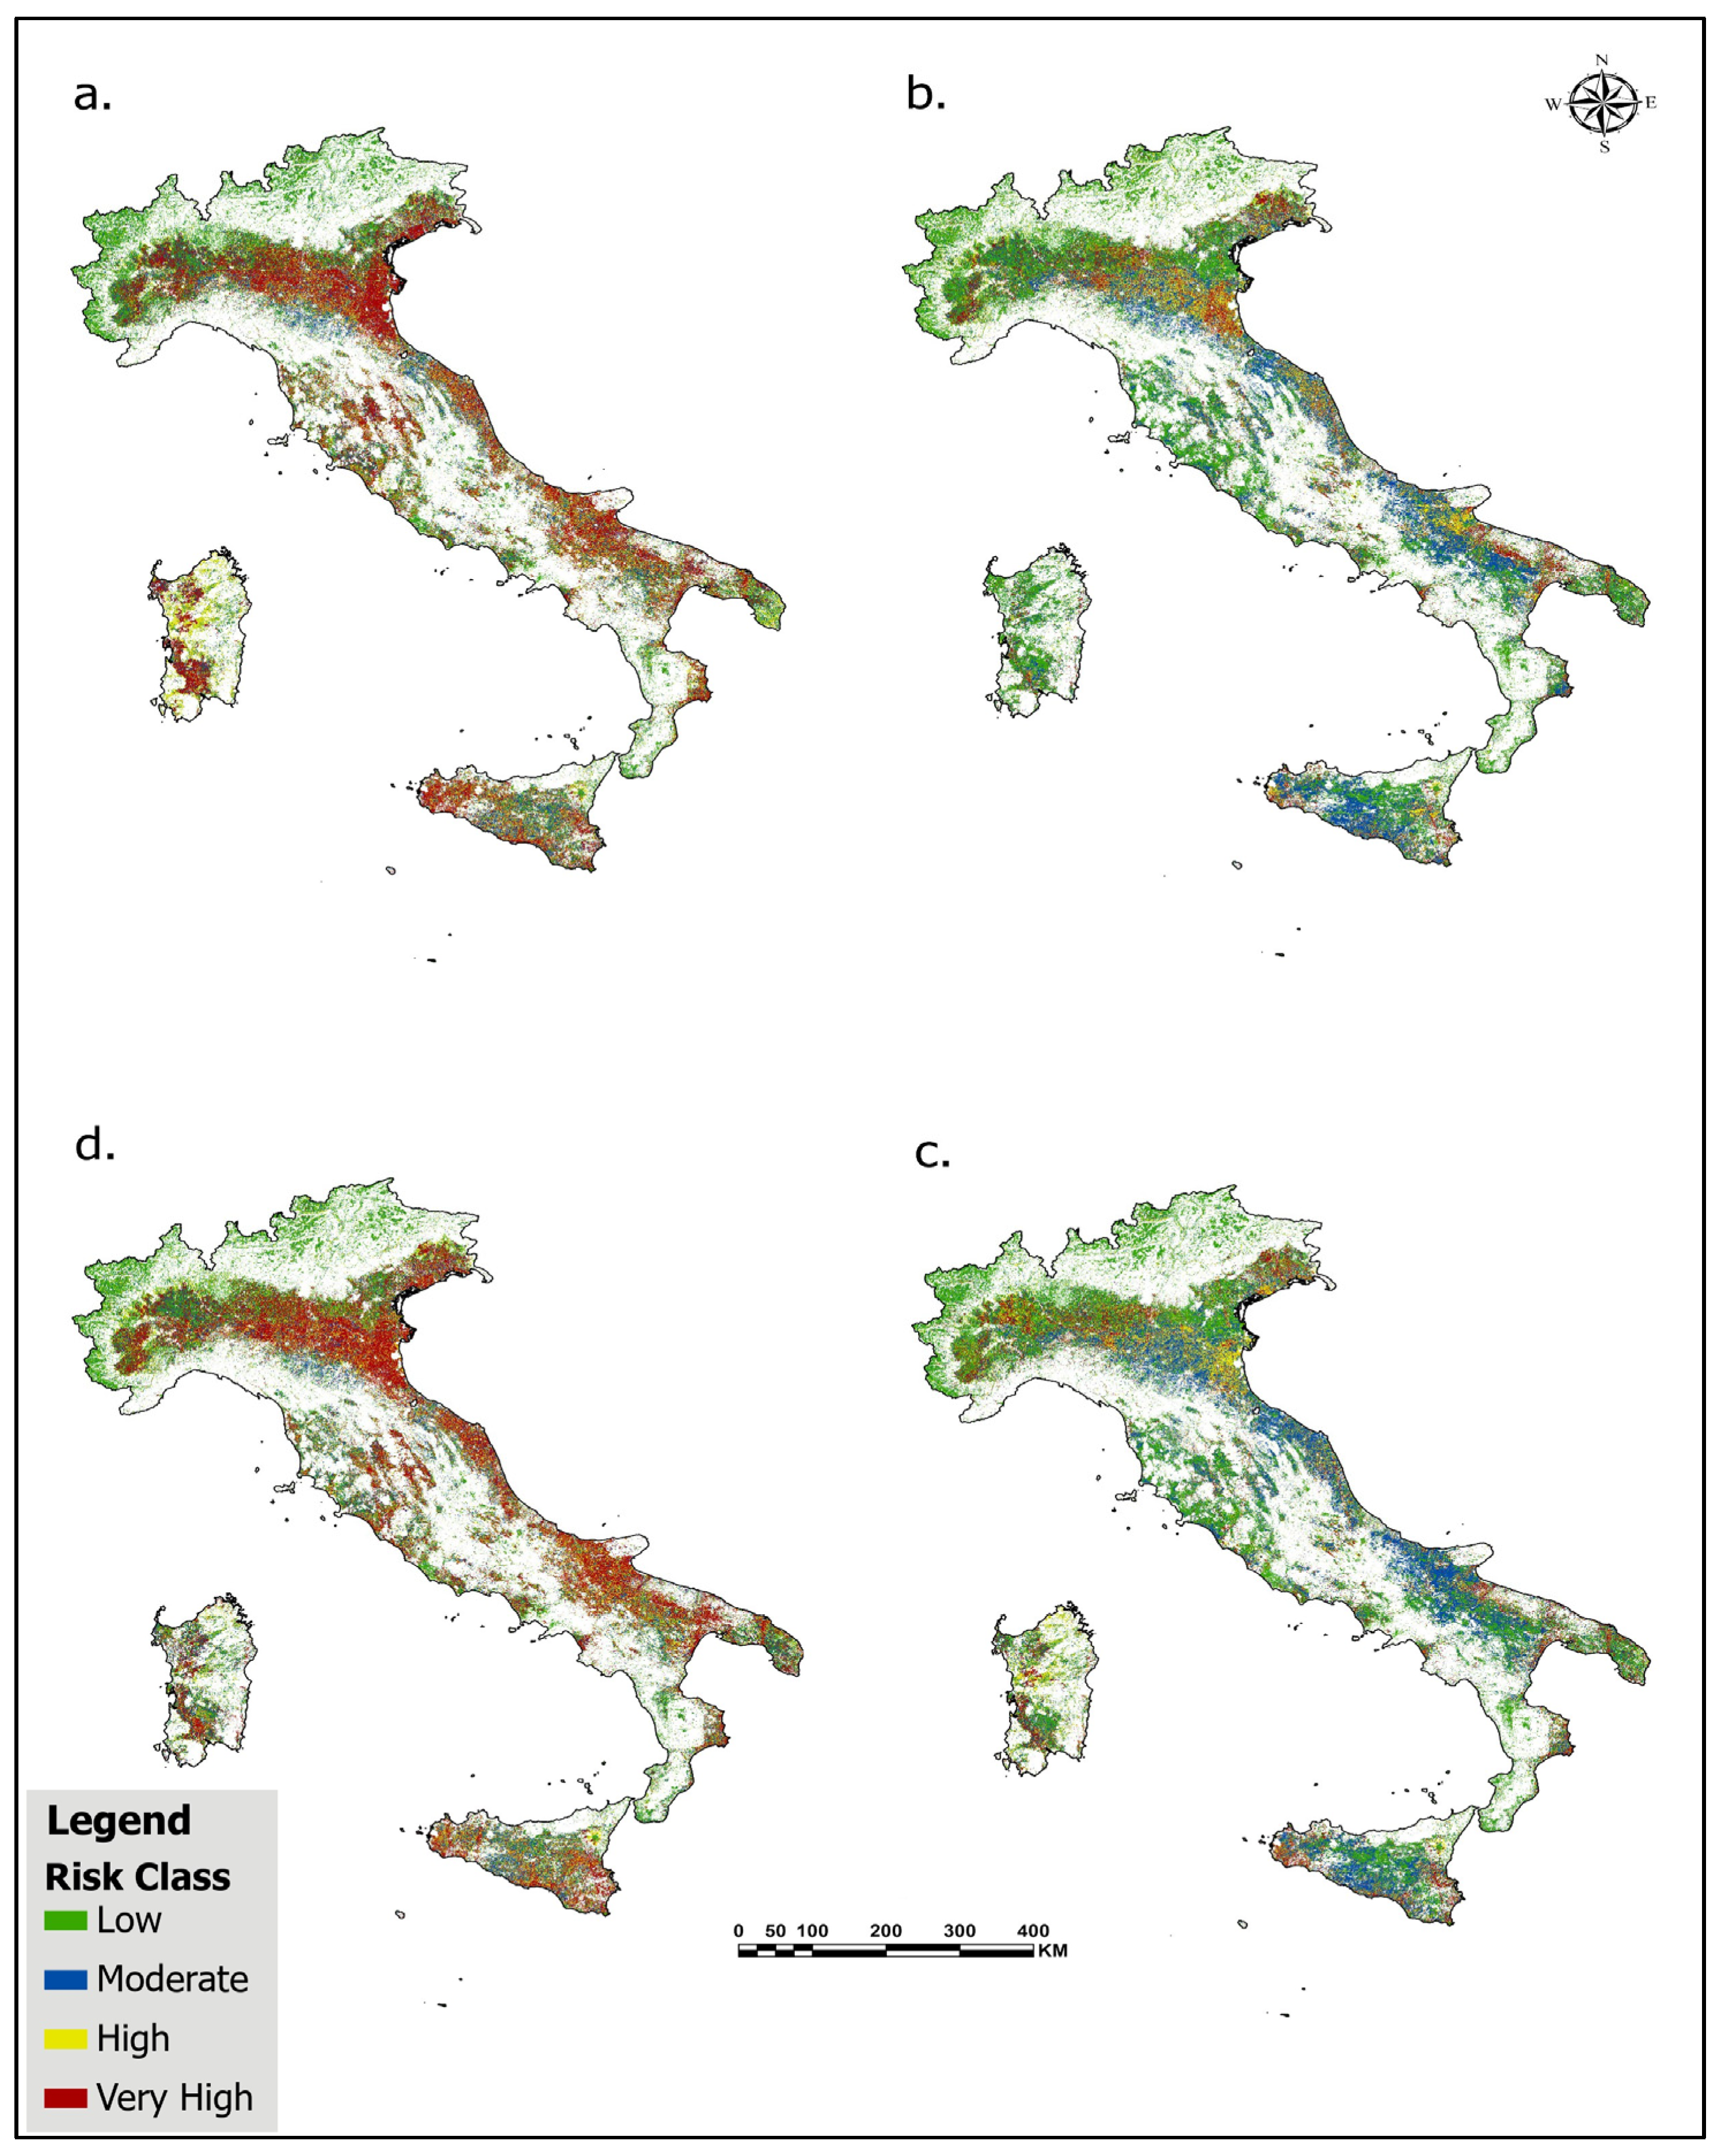
The seasonal analysis of soil compaction risk across Italy reveals a pronounced bimodal annual pattern characterized by high extreme-risk (High + Very High) conditions during winter (53.6%) and autumn (55.5%), contrasting with substantially reduced risk levels in spring (24.8%) and summer (26.5%) (Figure 11). This oscillation represents, roughly, a twofold reduction in extreme risk between winter and spring, followed by roughly a twofold increase from summer to autumn, indicating strong seasonal forcing of compaction susceptibility.
Winter conditions (December–February) exhibit the most heterogeneous risk distribution (Figure 11a), very-high risk dominating (38.1% national average) but substantial contributions from moderate (21.9%) and high (20.2%) risk classes. Spring (March–May) represents the period of minimum compaction hazard, with low-risk areas expanding to 34.6% of the territory and very high risk contracting to just 11.3% (Figure 11c). This transition reflects soil moisture normalization and reduced traffic intensity following winter field operations. While Summer (June–August) maintains low extreme-risk levels (26.5%) despite increased evapotranspiration, likely due to reduced agricultural traffic during the peak growing season. However, the moderate-risk class expands to 35%, suggesting widespread suboptimal conditions (Figure 11b). Autumn (September–November) exhibits the most critical risk profile, with very high risk reaching 38.6%, the highest seasonal value, and extreme risk (55.5%) comparable to winter levels (Figure 11d). This autumn peak coincides with harvest operations and early-season rainfall on soils compacted during summer drought.

3.1.2. Macro-Regional Differentiation and Seasonal Amplitude

Macro-regional analysis revealed distinct seasonal signatures (Table 5). The Southern regions (including Abruzzo, Molise, Campania, Apulia, Basilicata, Calabria) exhibited the highest seasonal amplitude, with extreme risk ranging from 20.6% in spring to 65.8% in autumn (a range 45.2%). This Mediterranean amplification pattern results from intense summer drought followed by autumn rainfall on contracted soils, creating critical compaction windows during harvest operations [6,56]. Center regions (Tuscany, Umbria, Marche, Lazio) showed comparable volatility (range: 44.5%), transitioning from 62.6% extreme risk in winter to 18.1% in spring. The Islands (Sicily, Sardinia) demonstrated unique behavior with winter-dominated risk (63.8% extreme risk) that rapidly attenuated to 18.4% by summer, reflecting maritime climate moderation and distinct agricultural calendars. Northern regions (Piedmont, Lombardy, Veneto, Trentino, Alto Adige, Friuli-Venezia Giulia, Emilia-Romagna, Liguria, Aosta Valley) exhibited the lowest seasonal amplitude, maintaining more stable risk profiles year-round (29.4–44.9% extreme risk range. The macro-regional comparison identified autumn as the critical convergence period: all macro-regions except the Islands reached their annual maximum extreme risk during this season, with values ranging from 44.9% (North) to 65.8% (South). Conversely, spring represented the universal low-risk window, though absolute values differed substantially (North: 29.4%, Islands: 24.8%, South: 20.6%, Center: 18.1%).

3.1.3. Regional Hotspots and Persistent Risk Areas

The persistent high-risk category (>30% extreme risk in 3+ seasons) included nine regions: Emilia-Romagna, Friuli-Venezia Giulia, Lombardy, Veneto (4/4 seasons), Piedmont, Marche, Abruzzo, Apulia, and Sardinia (Table 6). Regional-scale analysis identified Friuli-Venezia Giulia as the persistent national hotspot, maintaining extreme risk (High + Very High) >50% across all seasons (annual average: 55.8%), with winter and autumn peaks exceeding 50% (Table 6). Emilia-Romagna, with an average extreme risk of 66.8%, distinguished by having the highest single-season extreme risk recorded (85.0% in autumn), as shown in Table 6.
Safe-haven regions maintaining > 30% low-risk area across all seasons were restricted to the Alpine northwest: Aosta Valley (77.8%), Trentino Alto Adige (75.3%), Calabria (40.8%), and Liguria (58.8%), as shown in Table 7. These regions benefit from topographic protection (hilly/mountain), diverse land cover, and limited intensive agriculture [49]. Lombardy and Piedmont showed intermediate stability with moderate seasonal variation, reflecting the Po Valley’s intensive agriculture tempered by irrigation infrastructure.

3.1.4. Seasonal Transitions and Volatility Patterns

The transitions and volatility patterns in extreme risk are reported in Table 8. The winter-to-spring transition (February–March) represented the most dramatic risk reduction nationally, with extreme risk declining by 28.8 percentage points (from 53.6% to 24.8%). This transition is spatially heterogeneous: Molise experienced the largest reduction (−55.4 pp), followed by Umbria (−50.7 pp) and Basilicata (−48.8 pp). Central regions have the highest average of −43.2 pp reductions, while northern regions exhibit the smallest transitions (North: −12 pp average).
The summer-to-autumn transition (August-September) showed the steepest risk increase (+29.01 pp nationally), with Molise (+54.5 pp), Basilicata (+47.7 pp), and Umbria (+46 pp) leading the transition. Seasonal volatility analysis (coefficient of variation in extreme risk) identified Basilicata (75.6%) and Tuscany (CV = 75.5%) as the most volatile regions, transitioning between extreme risk states seasonally. Conversely, Liguria (CV = 8.6%) and Friuli-Venezia Giulia (11.3%) demonstrated remarkable stability, maintaining consistent risk profiles despite seasonal forcing.

3.1.5. Very High-Risk Persistence and Critical Periods

Analysis of the very high risk (VH) class (>30% of regional area) revealed winter-autumn persistence in eleven regions: Emilia-Romagna, Friuli-Venezia Giulia, Lombardy, Piedmont, Veneto, Marche, Umbria, Abruzzo, Campania, Molise, and Apulia. Emilia-Romagna exhibited the strongest VH persistence, with winter (58%) and autumn (65%) peaks separated by near-complete suppression in spring (8.1%) and summer (22%). This binary risk regime, switching between critical and minimal VH conditions, has profound management implications, suggesting that targeted intervention during low-risk windows could prevent progression to critical states.
The geographic concentration of VH risk shifted seasonally: winter VH hotspots clustered in the northern Po Valley (Emilia-Romagna, Veneto) and central Apennines (Umbria, Abruzzo), while autumn VH risk expanded southward to include Apulia (53.5%), Molise (48.2%), and Marche (49.7%). This southward VH migration reflects the delayed autumn rainfall and harvest timing in Mediterranean regions compared to continental northern systems.

3.1.6. Spatial Risk Configuration and Management Implications

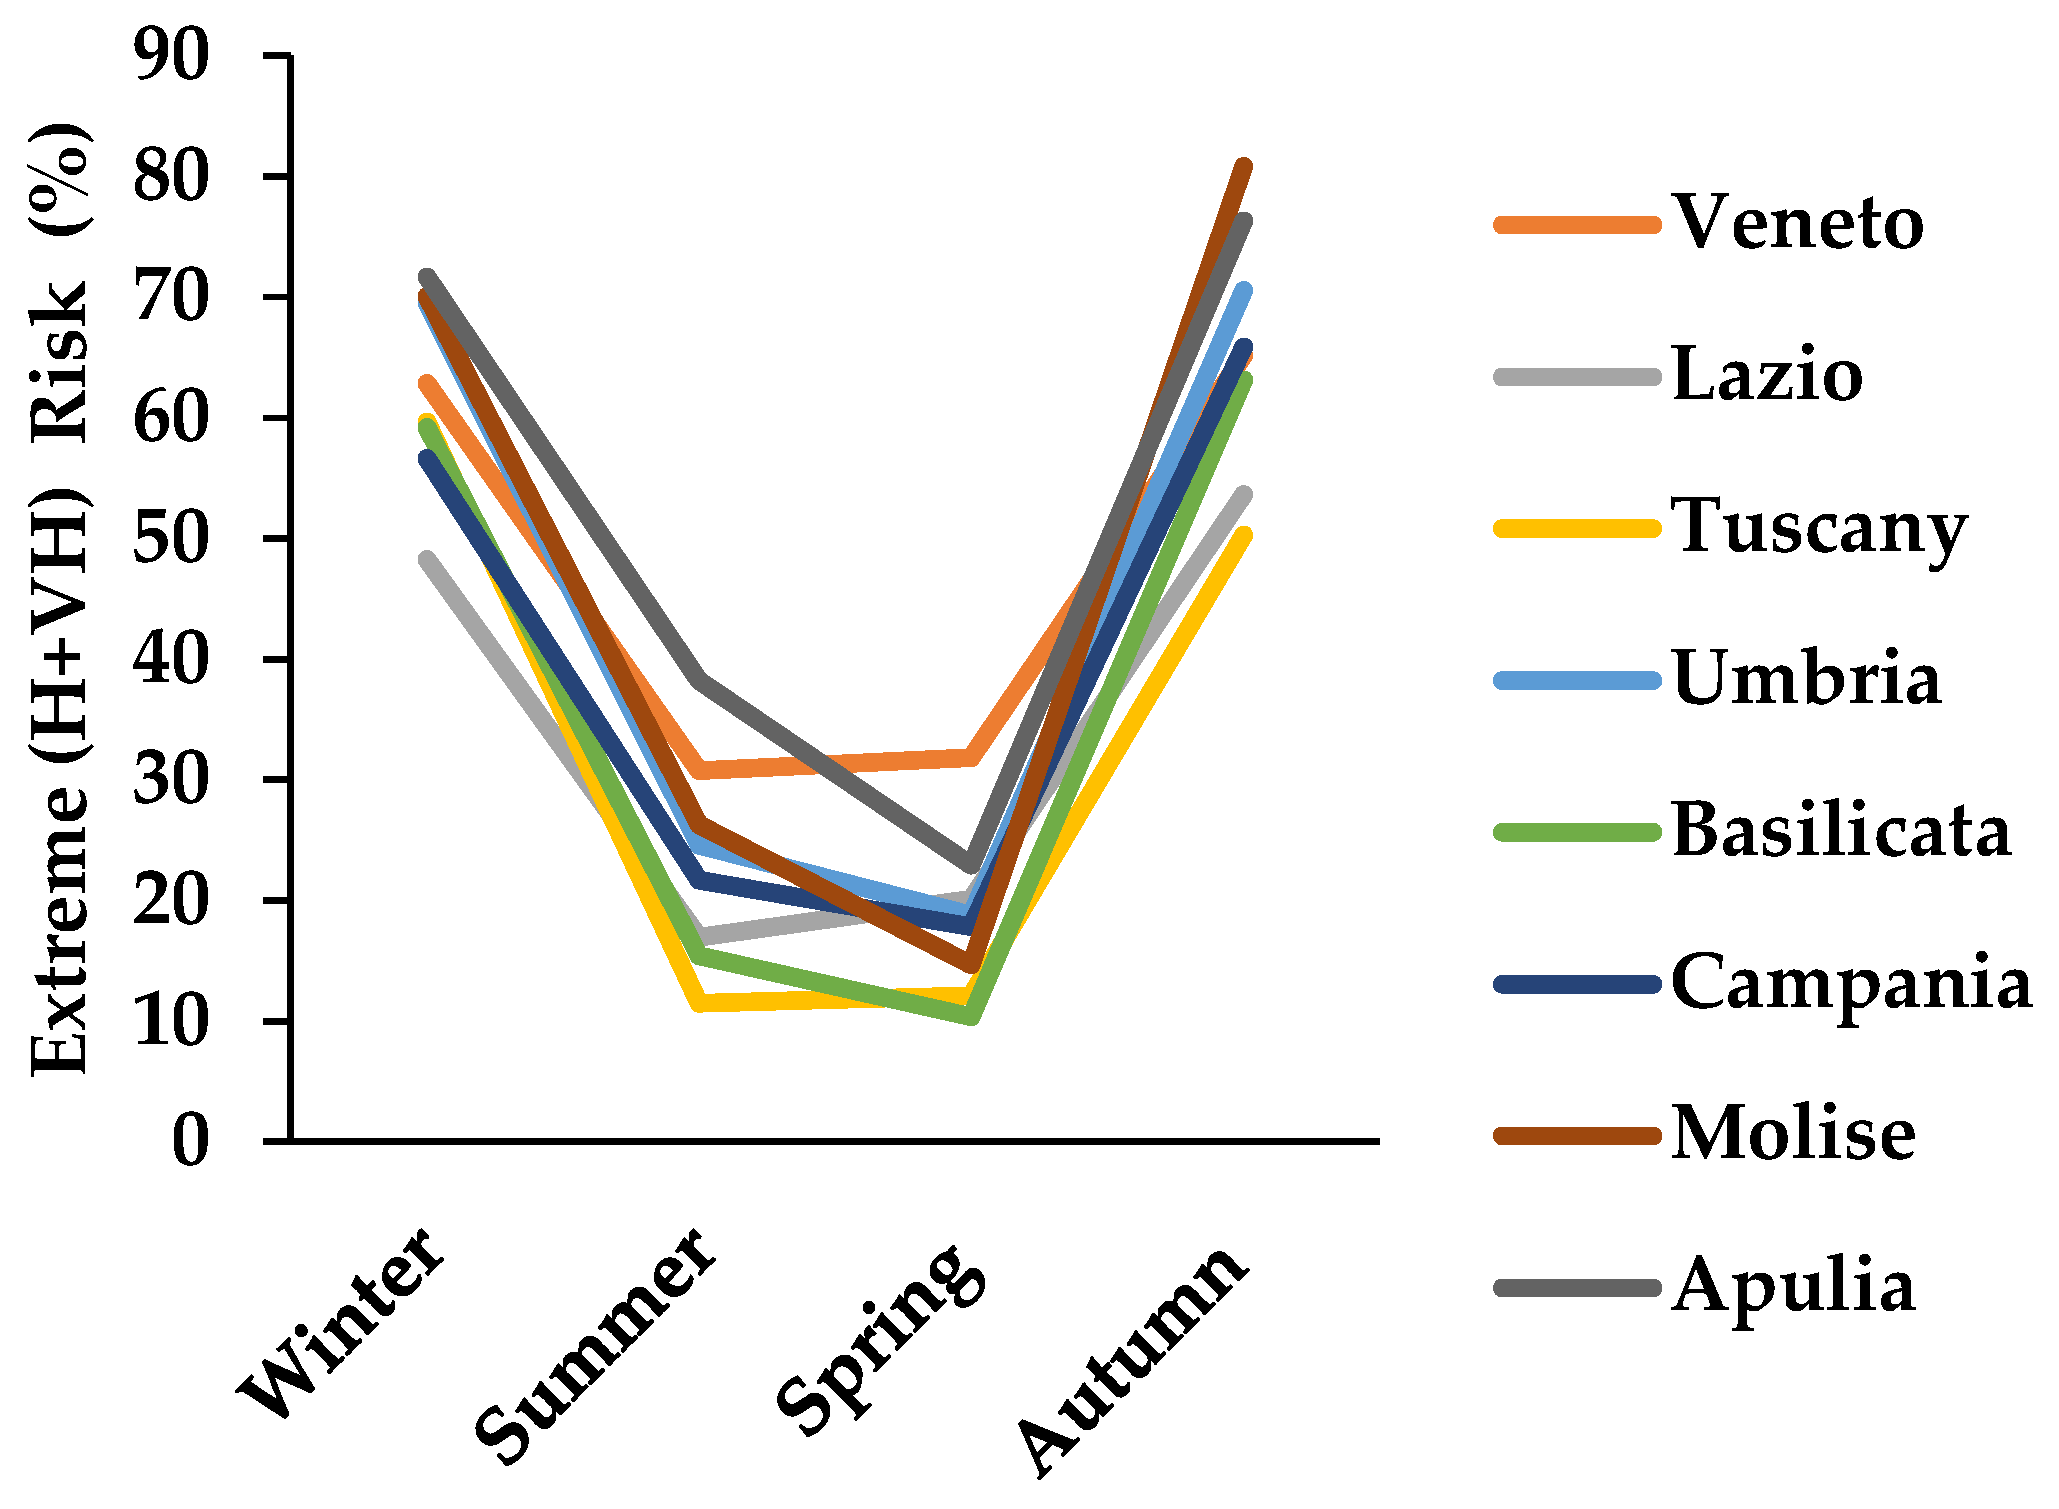
The seasonal risk analysis revealed three distinct spatial risk configurations: a persistent high-risk configuration, a bimodal critical configuration, and a stable moderate configuration. Nine regions were included in the persistent high-risk configuration (Friuli-Venezia Giulia, Emilia-Romagna, Lombardy, Piedmont, Veneto, Abruzzo, Apulia, and Sardinia). Among these, Emilia-Romagna and Friuli-Venezia Giulia had extreme risk (High + Very High) > 50% across all seasons, with annual averages of 66.8% and 55.8%, respectively. Hence, Friuli-Venezia Giulia, along with the other regions in this configuration with extreme risk > 30% in at least three seasons, requires more attention. The eight regions exhibited bimodal risk configuration patterns (winter + autumn peaks) with winter-autumn peaks (Figure 12). These regions support seasonal adaptive management, where intensive operations can be scheduled during spring-summer windows (while avoiding critical winter-autumn periods).
A stable moderate configuration represents the configuration with <30% extreme risk in at least three seasons. Liguria, Trentino-South Tyrol, and Aosta Valley, and Trentino-South Tyrol were included in this configuration, and all of them offer year-round operational safety (4/4 seasons < 30% risk). Hence, these configurations suggest that management strategies should be temporally and spatially targeted. The spring low-risk window (March–May) offers a national opportunity period for remediation, with 70% of Italy experiencing <30% extreme risk; however, local conditions must be checked before relying solely on macro-scale conclusions because cultivated crop types are highly diverse, and cropping cycles vary significantly from one species to another [57]. Conversely, the autumn convergence period (September–November) requires priority monitoring across all macro-regions, with 85% of the territory experiencing >30% extreme risk.

3.2. Accuracy Assessment of Compaction Risk Classification

To evaluate the robustness of the AHP weighting scheme, we performed a Monte Carlo sensitivity analysis [53] by perturbing each AHP weight using the ArcGIS plugin developed by Ashfaq [52]. The Monte Carlo sensitivity analysis revealed lower sensitivity to AHP weights, especially for compaction triggering factors (CFI, NDTI, and IOAPI), which were very robust, with less than 3% ranking out of 5000 simulations for each. At the same time, the SMI is moderately sensitive (18.8%) out of 5000 simulations.
For the assessment of the compaction risk classification, we used the BD layer as the reference layer produced by Pangos et al. [54], as the reference layer, and the mean multiyear compaction-risk map as the predicted classification class produced based on our GIS-AHP model, as shown in Figure 13.
The agreement assessment of the multi-year mean (2018–2024) soil compaction risk map against the reference bulk density proxy layer revealed an overall agreement of 31.24%, indicating that approximately 31% of pixels were correctly classified into their respective risk categories (Table 9). The relatively low level of agreement observed in this study reflects the inherent challenge of evaluating a dynamic process against temporally misaligned reference data. Compaction risk is inherently dynamic, influenced by changing factors such as soil moisture, timing of tillage operations, and seasonal patterns of machinery use. In contrast, the bulk density data used for reference offer only static, one-time measurements without timestamps or information about seasonal conditions. To address this mismatch, reference data should be collected in sync with the model’s predicted risk periods, ideally over multiple growing seasons and linked to specific field management practices through georeferencing. In addition to better reference data, enhancing the model, such as adjusting AHP weightings based on actual field compaction measurements and testing sensitivity across diverse soil and climate conditions, would improve both its precision and applicability.

4. Discussion

4.1. Integration of Earth Observation Data Within Multi-Criteria Decision Frameworks

The pairwise comparison matrix and subsequent weighting scheme (Table 3) assigned the highest importance to Soil Moisture Index, reflecting the well-established understanding that soil water content at the time of machinery traffic is the dominant controlling factor in compaction susceptibility. This finding aligns with the experimental work of Visconti [58], who demonstrated that soil trafficability, particularly using heavy machinery, led to significant increases in bulk density when operations were performed under higher soil moisture conditions. It was previously proved that soil moisture conditions, especially when combined with heavy machinery traffic, can alter the structural behavior of soil aggregates, leading to increased penetration resistance [59]. The developed GIS-AHP framework represents a significant methodological advancement in an initial screening for national-scale susceptibility to soil compaction risk assessment through the systematic fusion of Sentinel-derived indicators. The adoption of the AHP methodology for weight determination, while introducing an element of expert judgment subjectivity, provides a transparent and reproducible framework for factor prioritization. As demonstrated in analogous geospatial applications for land degradation assessment and erosion susceptibility mapping, AHP-based weighting enables systematic incorporation of domain knowledge while maintaining methodological consistency [60,61]. The consistency ratio achieved in this study suggests acceptable internal consistency of the pairwise comparisons, though we acknowledge that alternative weighting schemes derived through statistical optimization or machine learning approaches might yield different risk distributions [62]. Although alternative weighting schemes derived through statistical optimization or machine learning approaches might yield different risk distributions, these approaches were not used in the present study as statistical optimization techniques require large volumes of spatially representative ground-truth data, a condition rarely met in soil compaction research where field observations are inherently sparse and costly [18,54]. Machine learning models, despite their predictive power, operate as black-box systems where it is difficult to understand the ongoing internal process required for a decision-support tool [62]. The AHP framework, by contrast, explicitly encodes domain expertise, ensures full traceability of factor weights, and remains robust where data availability, methodological transparency, and policy relevance must be simultaneously balanced.
The relative dominance of soil moisture in the weighting scheme suggests that moderate variations in secondary factors (e.g., NDTI or IOAPI) are unlikely to substantially alter the overall spatial patterns of compaction risk, which are primarily driven by moisture dynamics.

4.2. Policy and Management Implications

The monitoring requirements outlined in the EU Soil Strategy 2023–2030 and the proposed Soil Monitoring Directive [32], which clearly identify soil compaction and texture as required indicators for soil health assessment, are directly addressed by the methodological approach developed here. A proof-of-concept for functional soil health monitoring systems that can support regulatory compliance and reporting obligations is provided by the framework’s reliance on publicly available Copernicus Sentinel data, which guarantees scalability and reproducibility across European member states.
Spring, having the highest share of the low-risk window (Figure 11c), provides a strategic opportunity period for remediation activities, offering practical guidance for precision agriculture implementation. This temporal targeting aligns with conservation agriculture principles that emphasize traffic limitation during critical moisture periods while enabling necessary field operations during favorable soil conditions. The autumn convergence period, conversely, emerges as a priority monitoring interval that requires enhanced surveillance across all macro-regions, given the near-universal elevation of extreme-risk conditions during this season. Hence, the seasonal volatility in moisture and tillage states across regions such as Molise and Basilicata highlights the need for flexible, region-specific agricultural interventions to reduce the risk of compaction.
The extreme seasonal risk volatility documented in southern macro-regions such as Molise and Basilicata is driven by a highly dynamic biophysical interplay between SMI and NDTI. Specifically, during the critical winter-to-spring transition, the Soil Moisture Index (SMI) exhibits a sharp decrease, while the Normalized Difference Tillage Index (NDTI) increases significantly, as clearly evidenced in Figure 6a,c, and Figure 8a,c, respectively.
The regional differentiation in risk patterns suggests that uniform national policies regarding soil compaction management may be suboptimal compared to regionally adaptive approaches that account for distinct seasonal signatures. The persistent high-risk configuration identified in Emilia-Romagna, Friuli-Venezia Giulia, and similar regions where the IOAPI and rainfall are comparatively high may warrant targeted incentive programs for controlled traffic farming or permanent raised-bed systems, whereas bimodal regions might benefit from seasonal extension services that optimize timing of field operations.

4.3. Model Evaluation Constraints and Model Uncertainties

The overall agreement of 31.24% achieved against the bulk density reference layer, while modest in absolute terms, must be interpreted within the context of fundamental methodological constraints inherent in evaluating dynamic compaction risk against static soil property measurements. The observed overall agreement should not be interpreted as a conventional predictive failure, but rather as a reflection of the inherent difficulty of evaluating a temporally dynamic susceptibility framework against a static reference proxy. Validating a dynamic, seasonal risk model against historical, point-based bulk density datasets presents inherent methodological constraints. While bulk density reflects a static, legacy state [63] rather than real-time structural fluxes, it represented the only available ground-truth dataset for large-scale validation in this region; as a result, full class-by-class correspondence between the two layers is not expected. To respect this limitation, this framework is presented not as a real-time operational tool, but as an initial screening tool for soil compaction susceptibility risk.
This limitation highlights a broader challenge in soil compaction research: suitable validation datasets that are both spatially extensive and temporally synchronized with modeled risk conditions remain scarce. A more rigorous assessment strategy would require repeated in situ measurements collected during known high-risk periods, ideally combined with georeferenced information on field traffic, soil moisture conditions, and tillage operations. Therefore, the present comparison should be regarded as an indirect consistency check rather than a definitive evaluation of the model’s short-term predictive capacity. This challenge is analogous to the uncertainties documented in land degradation vulnerability assessments, where static soil property-based pedotransfer functions fail to capture temporal variability, leading to high uncertainty when applied over extended periods [63].
Compaction risk, as conceptualized in this framework, represents the probability of compaction occurrence under specific moisture and management conditions, whereas bulk density measurements reflect the cumulative legacy of historical compaction events integrated over decadal timescales.
Compared with existing approaches for spatial soil compaction risk assessment, the proposed GIS-AHP framework offers notable advantages in terms of scalability, data accessibility, and operational simplicity. Process-based models such as the SaSCiA model [26] compute dynamic daily compaction risk maps by integrating detailed machinery loads, soil moisture, and crop type data, an approach that requires extensive input datasets that are rarely available at very large scales. The uncertainty propagation inherent in GIS-MCDA frameworks has been systematically investigated in comparable applications, demonstrating that criterion weights derived through expert judgment introduce subjectivity that can substantially impact model outcomes [62]. Monte Carlo simulation approaches applied to AHP-based landslide susceptibility mapping have demonstrated that weight uncertainties can significantly influence classification reliability, with the integration of sensitivity analysis substantially improving result robustness [62]. In the future, classification accuracy might be enhanced through the incorporation of additional conditioning factors not included in the present parameterization. Despite these limitations, the proposed framework demonstrates the potential of integrating Earth observation data with multi-criteria analysis for large-scale soil compaction risk screening, while highlighting the need for improved, temporally explicit validation datasets.

5. Conclusions

National-scale soil compaction monitoring remains limited despite its relevance for sustaining soil physical functioning and crop productivity amid increasing mechanization and climate-driven variability in trafficability. This study addresses that gap by proposing a geospatial framework that integrates Earth observation indicators with multi-criteria decision analysis to delineate compaction risk in a transparent, reproducible manner. The work demonstrates a systematic incorporation of Sentinel 1 soil moisture indices and Sentinel 2 tillage proxies within a GIS-AHP modeling architecture and, when applied to Italian agricultural lands, reveals a consistent bimodal seasonal behavior with risk maxima during autumn and winter and a marked macro-regional differentiation in amplitude and timing. Persistent hotspots requiring continuous mitigation are identified, with Friuli Venezia Giulia exhibiting sustained high risk, whereas other regions display seasonal windows that can be exploited to reduce structural damage through optimized scheduling of field operations. In particular, March to May represents a practical remediation period because 70% of the national territory experiences low extreme risk; however, local conditions must be checked before relying solely on macro-scale conclusions because cultivated crop types are highly diverse, cropping cycles vary significantly from one species to another, while the autumn convergence phase indicates a need for intensified surveillance and precautionary traffic management across all macro regions. Validation against independent bulk density observations yields an overall accuracy of 31.24%, a result that is largely explained by the temporal mismatch between dynamic compaction processes and static reference measurements, which motivates temporally coordinated monitoring designs aligned with peak-risk conditions. Overall, the identified spatially explicit and seasonally varying risk configurations provide actionable guidance for precision traffic planning and targeted remediation, thereby supporting evidence-based soil stewardship and improved resilience of agroecosystems.

Supplementary Materials

The following supporting information can be downloaded at: https://www.mdpi.com/article/10.3390/agronomy16111071/s1, Table S1: Study area.

Author Contributions

Conceptualization, D.K.Y., A.C., F.I. and F.M.; methodology, D.K.Y. and A.C.; software, D.K.Y.; validation, A.C. and F.M.; formal analysis, D.K.Y. and A.C.; investigation, D.K.Y., F.M., F.I. and A.C.; data curation, D.K.Y. and A.C.; writing—original draft preparation, D.K.Y. and A.C.; writing—review and editing, D.K.Y., F.M., F.I. and A.C.; visualization, D.K.Y. and A.C.; supervision, A.C.; funding acquisition, F.M. All authors have read and agreed to the published version of the manuscript.

Funding

This study was carried out within the Agritech National Research Center and received funding from the European Union Next-GenerationEU (PIANO NAZIONALE DI RIPRESA E RESILIENZA (PNRR)—MISSIONE 4 COMPONENTE 2, INVESTIMENTO 3.3—D.M. 117 02/03/2023). The activities of Alessia Cogato and Francesco Marinello have been supported by Complemento di sviluppo Rurale per il Veneto 2023–2027. Intervento SRG01—Programma n.5836485 INNOBIOVIT. Autorità di gestione regionale: Regione del Veneto—Direzione AdG FEASR Bonifica e Irrigazione. This manuscript reflects only the authors’ views and opinions; neither the European Union nor the European Commission can be considered responsible for them.

Data Availability Statement

The original contributions presented in this study are included in the article. Further inquiries can be directed to the corresponding author.

Acknowledgments

During the preparation of this manuscript, the authors used ChatGPT (GPT-5.2, 2026), an AI assistant developed by OpenAI, for its support in language editing and technical consultation. All analyses, methods, and results presented in this study were conceived, designed, and performed by the authors without the use of AI tools. The authors have reviewed and edited the output and take full responsibility for the content of this publication.

Conflicts of Interest

Author Filippo Iodice was employed by the Uptoearth GmbH. The remaining authors declare that the research was conducted in the absence of any commercial or financial relationships that could be construed as a potential conflict of interest.

References

  1. Houšková, B.; Montanarella, L. The natural susceptibility of European soils to compaction. In Threats to Soil Quality in Europe; European Commission Joint Research Centre Institute for Environment and Sustainability: Luxmbourg, 2008; Available online: https://esdac.jrc.ec.europa.eu/ESDB_Archive/eusoils_docs/other/eur23438.pdf (accessed on 24 March 2026).
  2. Shaheb, M.R.; Venkatesh, R.; Shearer, S.A. A Review on the Effect of Soil Compaction and its Management for Sustainable Crop Production. J. Biosyst. Eng. 2021, 46, 417–439. [Google Scholar] [CrossRef]
  3. Zhang, W.-P.; Surigaoge, S.; Yang, H.; Yu, R.-P.; Wu, J.-P.; Xing, Y.; Chen, Y. Diversified cropping systems with complementary root growth strategies improve crop adaptation to and remediation of hostile soils. Plant Soil 2024, 502, 7–30. [Google Scholar] [CrossRef]
  4. Alaoui, A.; Rogger, M.; Peth, S.; Blöschl, G. Does soil compaction increase floods? A review. J. Hydrol. 2018, 557, 631–642. [Google Scholar] [CrossRef]
  5. Chyba, J.; Kroulík, M.; Krištof, K.; Misiewicz, P.A. The influence of agricultural traffic on soil infiltration rates. Agron. Res. 2017, 15, 664–673. [Google Scholar]
  6. Batey, T. Soil compaction and soil management—A review. Soil Use Manag. 2009, 25, 335–345. [Google Scholar] [CrossRef]
  7. Shah, A.N.; Tanveer, M.; Shahzad, B.; Yang, G.; Fahad, S.; Ali, S.; Bukhari, M.A.; Tung, S.A.; Hafeez, A. Soil compaction effects on soil health and cropproductivity: An overview. Environ. Sci. Pollut. Res. 2017, 24, 10056–10067. [Google Scholar] [CrossRef]
  8. European Environment Agency; Arias-Navarro, C.; Baritz, R.; Jones, A. (Eds.) The State of Soils in Europe; Publications Office of the European Union: Luxembourg, 2024. [Google Scholar] [CrossRef]
  9. Keller, T.; Sandin, M.; Colombi, T.; Horn, R.; Or, D. Historical increase in agricultural machinery weights enhanced soil stress levels and adversely affected soil functioning. Soil Tillage Res. 2019, 194, 104293. [Google Scholar] [CrossRef]
  10. Yang, P.; Dong, W.; Heinen, M.; Qin, W.; Oenema, O. Soil Compaction Prevention, Amelioration and Alleviation Measures Are Effective in Mechanized and Smallholder Agriculture: A Meta-Analysis. Land 2022, 11, 645. [Google Scholar] [CrossRef]
  11. Birkás, M.; Jug, D.; Stingli, A.; Kalmár, T.; Szemők, A. Soil Compaction Alleviation as a Solution in the Climate Stress Mitigation. J. Agric. Mach. Sci. 2009, 5, 409–414. [Google Scholar]
  12. Schjønning, P.; van den Akker, J.J.H.; Keller, T.; Greve, M.H.; Lamandé, M.; Simojoki, A.; Stettler, M.; Arvidsson, J.; Breuning-Madsen, H. Driver-Pressure-State-Impact-Response (DPSIR) Analysis and Risk Assessment for Soil Compaction-A European Perspective. Adv. Agron. 2015, 133, 183–237. [Google Scholar] [CrossRef]
  13. Schjønning, P.; Lamandé, M.; Munkholm, L.J.; Lyngvig, H.S.; Nielsen, J.A. Soil precompression stress, penetration resistance and crop yields in relation to differently-trafficked, temperate-region sandy loam soils. Soil Tillage Res. 2016, 163, 298–308. [Google Scholar] [CrossRef]
  14. Agency, E.E. Soil Monitoring in Europe—Indicators and Thresholds for Soil Quality Assessments; Publications Office of the European Union: Luxembourg, 2023. [Google Scholar] [CrossRef]
  15. Gürsoy, S. Soil Compaction Due to Increased Machinery Intensity in Agricultural Production: Its Main Causes, Effects and Management. In Technology in Agriculture; IntechOpen: London, UK, 2021. [Google Scholar] [CrossRef]
  16. UMN Extension. Soil Compaction|UMN Extension. Available online: https://extension.umn.edu/soil-management-and-health/soil-compaction (accessed on 29 May 2025).
  17. Greenwood, K.L.; McKenzie, B.M. Grazing effects on soil physical properties and the consequences for pastures: A review. Aust. J. Exp. Agric. 2001, 41, 1231–1250. [Google Scholar] [CrossRef]
  18. Hamza, M.A.; Anderson, W.K. Soil compaction in cropping systems: A review of the nature, causes and possible solutions. Soil Tillage Res. 2005, 82, 121–145. [Google Scholar] [CrossRef]
  19. Jones, R.J.A.; Spoor, G.; Thomasson, A.J. Vulnerability of subsoils in Europe to compaction: A preliminary analysis. Soil Tillage Res. 2003, 73, 131–143. [Google Scholar] [CrossRef]
  20. Van Den Akker, J.J.H. SOCOMO: A soil compaction model to calculate soil stresses and the subsoil carrying capacity. Soil Tillage Res. 2004, 79, 113–127. [Google Scholar] [CrossRef]
  21. Keller, T.; Défossez, P.; Weisskopf, P.; Arvidsson, J.; Richard, G. SoilFlex: A model for prediction of soil stresses and soil compaction due to agricultural field traffic including a synthesis of analytical approaches. Soil Tillage Res. 2007, 93, 391–411. [Google Scholar] [CrossRef]
  22. Lamandé, M.; Greve, M.H.; Schjønning, P. Risk assessment of soil compaction in Europe—Rubber tracks or wheels on machinery. Catena 2018, 167, 353–362. [Google Scholar] [CrossRef]
  23. Troldborg, M.; Aalders, I.; Towers, W.; Hallett, P.D.; McKenzie, B.M.; Bengough, A.G.; Lilly, A.; Ball, B.C.; Hough, R.L. Application of Bayesian Belief Networks to quantify and map areas at risk to soil threats: Using soil compaction as an example. Soil Tillage Res. 2013, 132, 56–68. [Google Scholar] [CrossRef]
  24. D’Or, D.; Destain, M.F. Risk Assessment of Soil Compaction in the Walloon Region in Belgium. Math. Geosci. 2015, 48, 89–103. [Google Scholar] [CrossRef]
  25. Kuhwald, M.; Kuhwald, K.; Duttmann, R. Spatio-Temporal High-Resolution Subsoil Compaction Risk Assessment for a 5-Years Crop Rotation at Regional Scale. Front. Environ. Sci. 2022, 10, 823030. [Google Scholar] [CrossRef]
  26. Kuhwald, M.; Dörnhöfer, K.; Oppelt, N.; Duttmann, R. Spatially Explicit Soil Compaction Risk Assessment of Arable Soils at Regional Scale: The SaSCiA-Model. Sustainability 2018, 10, 1618. [Google Scholar] [CrossRef]
  27. Abdulraheem, M.I.; Zhang, W.; Li, S.; Moshayedi, A.J.; Farooque, A.A.; Hu, J. Advancement of Remote Sensing for Soil Measurements and Applications: A Comprehensive Review. Sustainability 2023, 15, 15444. [Google Scholar] [CrossRef]
  28. Adão, F.; Pádua, L.; Sousa, J.J. Evaluating Soil Degradation in Agricultural Soil with Ground-Penetrating Radar: A Systematic Review of Applications and Challenges. Agriculture 2025, 15, 852. [Google Scholar] [CrossRef]
  29. Murugan, D.; Bhogapurapu, N.; Roy, J.; Bhattacharya, A.; Pankajakshan, P. Sentinel-1 Data Sensitivity for Soil Moisture Estimation and Its Application for In-Season Monitoring of Small Land Holding Farmer Plots. In IGARSS 2023—2023 IEEE International Geoscience and Remote Sensing Symposium; IEEE: Piscataway, NJ, USA, 2023; pp. 2906–2909. [Google Scholar] [CrossRef]
  30. Bulut, Ü.; Mohammadi, B.; Duan, Z. Estimation of surface soil moisture from Sentinel-1 synthetic aperture radar imagery using machine learning method. Remote Sens. Appl. 2024, 36, 101369. [Google Scholar] [CrossRef]
  31. Saaty, T.L. Decision making with the analytic hierarchy process. Int. J. Serv. Sci. 2008, 1, 83–98. [Google Scholar] [CrossRef]
  32. Soil Monitoring Directive EU. Directive (EU) 2025/2360 of the European Parliament and of the Council. 2025. Available online: https://eur-lex.europa.eu/eli/dir/2025/2360/oj/eng (accessed on 24 March 2026).
  33. Heiden, U.; d’Angelo, P.; Karlshöfer, P.; Kühl, K. SoilSuite for Europe; German Aerospace Center: Cologne, Germany, 2025. [Google Scholar] [CrossRef]
  34. Poggio, L.; de Sousa, L.M.; Batjes, N.H.; Heuvelink, G.; Kempen, B.; Ribeiro, E.; Rossiter, D.G. SoilGrids 2.0: Producing soil information for the globe with quantified spatial uncertainty. Soil 2021, 7, 217–240. [Google Scholar] [CrossRef]
  35. Bonato, M.; Cian, F.; Giupponi, C. Combining LULC data and agricultural statistics for A better identification and mapping of High nature value farmland: A case study in the veneto Plain, Italy. Land Use Policy 2019, 83, 488–504. [Google Scholar] [CrossRef]
  36. Mullissa, A.; Vollrath, A.; Odongo-Braun, C.; Slagter, B.; Balling, J.; Gou, Y.; Gorelick, N.; Reiche, J. Sentinel-1 SAR Backscatter Analysis Ready Data Preparation in Google Earth Engine. Remote Sens. 2021, 13, 1954. [Google Scholar] [CrossRef]
  37. Balenzano, A.; Mattia, F.; Satalino, G.; Davidson, M.W.J. Dense Temporal Series of C- and L-band SAR Data for Soil Moisture Retrieval Over Agricultural Crops. IEEE J. Sel. Top. Appl. Earth Obs. Remote Sens. 2011, 4, 439–450. [Google Scholar] [CrossRef]
  38. Brunelli, B.; De Giglio, M.; Magnani, E.; Dubbini, M. Surface soil moisture estimate from Sentinel-1 and Sentinel-2 data in agricultural fields in areas of high vulnerability to climate variations: The Marche region (Italy) case study. Environ. Dev. Sustain. 2024, 26, 24083–24105. [Google Scholar] [CrossRef]
  39. Mahdavi, S.; Amani, M.; Maghsoudi, Y. The effects of orbit type on synthetic aperture RADAR (SAR) backscatter. Remote Sens. Lett. 2019, 10, 120–128. [Google Scholar] [CrossRef]
  40. Quemada, M.; Daughtry, C.S.T. Spectral Indices to Improve Crop Residue Cover Estimation under Varying Moisture Conditions. Remote Sens. 2016, 8, 660. [Google Scholar] [CrossRef]
  41. Jain, K.; John, R.; Torbick, N.; Kolluru, V.; Saraf, S.; Chandel, A.; Henebry, G.M. Monitoring the Spatial Distribution of Cover Crops and Tillage Practices Using Machine Learning and Environmental Drivers across Eastern South Dakota. Environ. Manag. 2024, 74, 742. [Google Scholar] [CrossRef] [PubMed]
  42. Xiang, X.; Du, J.; Jacinthe, P.-A.; Zhao, B.; Zhou, H.; Liu, H.; Song, K. Integration of tillage indices and textural features of Sentinel-2A multispectral images for maize residue cover estimation. Soil Tillage Res. 2022, 221, 105405. [Google Scholar] [CrossRef]
  43. Beeson, P.C.; Daughtry, C.S.T.; Wallander, S.A. Estimates of Conservation Tillage Practices Using Landsat Archive. Remote Sens. 2020, 12, 2665. [Google Scholar] [CrossRef]
  44. Zheng, B.; Campbell, J.B.; Serbin, G.; Galbraith, J.M. Remote sensing of crop residue and tillage practices: Present capabilities and future prospects. Soil Tillage Res. 2014, 138, 26–34. [Google Scholar] [CrossRef]
  45. Dong, Y.; Xuan, F.; Huang, X.; Li, Z.; Su, W.; Huang, J.; Li, X.; Tao, W.; Liu, H.; Chen, J. A 30-m annual corn residue coverage dataset from 2013 to 2021 in Northeast China. Sci. Data 2024, 11, 216. [Google Scholar] [CrossRef]
  46. Bell, L.W.; Kirkegaard, J.A.; Swan, A.; Hunt, J.R.; Huth, N.I.; Fettell, N.A. Impacts of soil damage by grazing livestock on crop productivity. Soil Tillage Res. 2011, 113, 19–29. [Google Scholar] [CrossRef]
  47. Liu, X.; Feike, T.; Shao, L.; Sun, H.; Chen, S.; Zhang, X. Effects of different irrigation regimes on soil compaction in a winter wheat–summer maize cropping system in the North China Plain. Catena 2016, 137, 70–76. [Google Scholar] [CrossRef]
  48. Yang, X.; Xiong, J.; Du, T.; Ju, X.; Gan, Y.; Li, S.; Xia, L.; Shen, Y.; Pacenka, S.; Steenhuis, T.S.; et al. Diversifying crop rotation increases food production, reduces net greenhouse gas emissions and improves soil health. Nat. Commun. 2024, 15, 198. [Google Scholar] [CrossRef]
  49. Cogato, A.; Pezzuolo, A.; Sørensen, C.G.; De Bei, R.; Sozzi, M.; Marinello, F. A GIS-Based Multicriteria Index to Evaluate the Mechanisability Potential of Italian Vineyard Area. Land 2020, 9, 469. [Google Scholar] [CrossRef]
  50. Saaty, T. The Analytic Hierarchy Process. 1980. Available online: https://www.academia.edu/download/51627807/saaty.pdf (accessed on 13 May 2026).
  51. Saaty, T.L. Decision-making with the AHP: Why is the principal eigenvector necessary. Eur. J. Oper. Res. 2003, 145, 85–91. [Google Scholar] [CrossRef]
  52. Ashfaq, T. AHP/FAHP Spatial Analyzer for ArcGIS Pro (Version 1.0.0) [Computer Software]. 2026, GIthub: Version 1.0.0. Available online: https://github.com/tcantbenormal/Ahp-Fahp-Analyzer-Add-in-For-ArcGIS-Pro (accessed on 13 May 2026).
  53. Duque, L.F.; O’Connell, E.; O’Donnell, G. A Monte Carlo simulation and sensitivity analysis framework demonstrating the advantages of probabilistic forecasting over deterministic forecasting in terms of flood warning reliability. J. Hydrol. 2023, 619, 129340. [Google Scholar] [CrossRef]
  54. Panagos, P.; De Rosa, D.; Liakos, L.; Labouyrie, M.; Borrelli, P.; Ballabio, C. Soil bulk density assessment in Europe. Agric. Ecosyst. Environ. 2024, 364, 108907. [Google Scholar] [CrossRef]
  55. Håkansson, I.; Lipiec, J. A review of the usefulness of relative bulk density values in studies of soil structure and compaction. Soil Tillage Res. 2000, 53, 71–85. [Google Scholar] [CrossRef]
  56. Lionello, P. The Climate of the Mediterranean Region: From the Past to the Future. 2012. Available online: https://books.google.com/books?hl=en&lr=&id=paKNr0-wdToC&oi=fnd&pg=PP1&dq=Lionello,+P.+(Ed.)+(2012).+The+Climate+of+the+Mediterranean+Region:+From+the+Past+to+the+Future.+&ots=njGCJSKi4C&sig=lM1dKO4Dl4W_HAz_4rx_po4HzMo (accessed on 23 March 2026).
  57. Azar, R.; Villa, P.; Stroppiana, D.; Crema, A.; Boschetti, M.; Brivio, P.A. Assessing in-season crop classification performance using satellite data: A test case in Northern Italy. Eur. J. Remote Sens. 2016, 49, 361–380. [Google Scholar] [CrossRef]
  58. Visconti, A. Risk Assessment of Soil Compaction by Mean of Terranimo Tool. 2025. Available online: https://thesis.unipd.it/handle/20.500.12608/10041 (accessed on 23 March 2026).
  59. Lamandé, M.; Schjønning, P. Transmission of vertical stress in a real soil profile. Part III: Effect of soil water content. Soil Tillage Res. 2011, 114, 78–85. [Google Scholar] [CrossRef]
  60. Mushtaq, F.; Farooq, M.; Tirkey, A.S.; Sheikh, B.A. Analytic Hierarchy Process (AHP) Based Soil Erosion Susceptibility Mapping in Northwestern Himalayas: A Case Study of Central Kashmir Province. Conservation 2023, 3, 32–52. [Google Scholar] [CrossRef]
  61. Kucuker, D.M.; Giraldo, D.C. Assessment of soil erosion risk using an integrated approach of GIS and Analytic Hierarchy Process (AHP) in Erzurum, Turkiye. Ecol. Inform. 2022, 71, 101788. [Google Scholar] [CrossRef]
  62. Feizizadeh, B.; Blaschke, T. An uncertainty and sensitivity analysis approach for GIS-based multicriteria landslide susceptibility mapping. Int. J. Geogr. Inf. Sci. 2014, 28, 610–638. [Google Scholar] [CrossRef]
  63. Ousaha, S.; Shao, Z.; Afzal, Z. Reducing Temporal Uncertainty in Soil Bulk Density Estimation Using Remote Sensing and Machine Learning Approaches. Preprint 2025. [Google Scholar] [CrossRef]
Figure 1. Study area map, a bare soil surface composite map (SoilSuite for Europe).
Agronomy 16 01071 g001
Figure 2. Percentage study area share of (a) respective Italian region area (b) total study area across Italy.
Agronomy 16 01071 g002
Figure 3. Processing pipeline.
Agronomy 16 01071 g003
Figure 4. Clay fraction index (CFI) map of the study area.
Agronomy 16 01071 g004
Figure 5. Multiyear mean Soil Moisture Index (SMI) composite map for the study period (2018–2024).
Agronomy 16 01071 g005
Figure 6. Mean seasonal Soil Moisture Index (SMI) map of (a) Winter, (b) Summer, (c) Spring, and (d) Autumn for the study period (2018–2024).
Agronomy 16 01071 g006
Figure 7. Multiyear mean Normalized Difference Tillage Index (NDTI) composite map for the study period (2018–2024).
Agronomy 16 01071 g007
Figure 8. Mean seasonal Normalized Difference Tillage Index (NDTI) map of (a) Winter, (b) Summer, (c) Spring, and (d) Autumn for the study period (2018–2024).
Agronomy 16 01071 g008
Figure 9. Intensity of Agriculture Practice Index (IOAPI) based on 2020 ISTAT census.
Agronomy 16 01071 g009
Figure 10. Flow chart of Compaction Risk Model.
Agronomy 16 01071 g010
Figure 11. Mean Seasonal Compaction Risk Map of (a) Winter, (b) Summer, (c) Spring, and (d) Autumn for the Study Period.
Agronomy 16 01071 g011
Figure 12. Bimodal risk configuration.
Agronomy 16 01071 g012
Figure 13. Map of (a) Multiyear mean compaction zone, (b) Bulk density for the study area for accuracy assessment.
Agronomy 16 01071 g013
Table 1. List of data used in the study.
DataSource
Sentinel-1 SAR
(C-band, IW mode, GRD): VV polarized σ0 backscatter time series,
2018–2024
Copernicus
Programme, EU
Sentinel-2 MSI
(Level-2A surface reflectance):
spectral bands B11 (SWIR1, 20 m) and B12 (SWIR2, 20 m),
2018–2024
Copernicus Programme, EU
Clay fraction
(g/kg) at 250 m resolution
2021
SoilGrids (ISRIC)
[34]
Intensity of Agricultural Practice (IOAP)
2020
Derived based on the work from
Bonato et al. [35]
Table 2. The Saaty scale [31] for the generation of a pairwise comparison matrix.
Intensity of ImportanceDefinition
1Equal importance
2Equal to moderate importance
3Moderate importance
4Moderate to strong importance
5Strong importance
6Strong to very strong importance
7Very strong importance
8Very to extremely strong
9Extreme importance
Table 3. Pairwise comparison matrix.
Compaction Triggering FactorsCFISMINDTIIOAPIWeightsFinal Ranking (%)
Clay Fraction Index (CFI)10.33531.0927
Soil Moisture Index (SMI)31552.1353
Normalized Difference Tillage Index (NDTI)0.200.2010.330.047
Intensity of Agriculture Practice Index (IOAPI)0.330.20310.5113
Table 4. Variables in Potential Compaction Risk Zone modeling, their weights, and rank.
FactorsClassesWeight of ClassesRank of Factors
Clay Fraction Index
(CFI)
0.001–0.353127
0.354–0.4472
0.448–0.5145
0.515–17
Soil Moisture Index
(SMI)
0.001–0.204153
0.205–0.2942
0.295–0.3764
0.377–17
Normalized Difference
Tillage Index
(NDTI)
0.001–0.65957
0.660–0.6983
0.699–0.7333
0.734–11
Intensity of Agriculture
Practices Index
(IOAPI)
0.001–0.067113
0.068–0.1332
0.134–0.2244
0.225–16
Table 5. Seasonal soil compaction risk distribution by macro-region (% of regional area).
Macro-RegionSeasonL—Low Risk (%)M—Moderate Risk (%)H—High Risk (%)VH—Very High Risk (%)Extreme Risk (H + VH) (%)
NorthWinter40.817.812.828.641.4
Spring47.922.716.413.029.4
Summer47.422.017.513.030.5
Autumn40.214.914.930.044.9
CenterWinter14.124.624.237.161.3
Spring37.744.212.35.718.1
Summer36.640.315.97.223.0
Autumn14.223.222.240.462.6
SouthWinter13.325.326.634.861.4
Spring30.748.712.28.420.6
Summer27.246.716.79.426.1
Autumn13.221.026.239.665.8
IslandsWinter11.924.328.735.063.8
Spring31.236.317.914.632.5
Summer44.437.210.57.918.4
Autumn18.029.323.828.952.8
Table 6. Seasonal soil compaction extreme risk distribution by region (% of regional area).
RegionWinter (%)Summer (%)Spring (%)Autumn (%)Average (%)
Emilia-Romagna78.158.845.485.066.8
Friuli-Venezia Giulia54.951.352.164.955.8
Lombardy50.931.734.654.643.0
Piedmont39.522.032.840.933.8
Veneto62.930.831.865.247.6
Marche67.7639.1421.2575.9551.03
Abruzzo59.5838.2529.6766.8648.59
Apulia71.6738.2322.9576.3152.29
Sardinia69.3616.3540.3345.9142.99
Table 7. Seasonal soil compaction low-risk distribution by region (% of regional area).
RegionWinter (%)Summer (%)Spring (%)Autumn (%)Average (%)
Liguria57.863.355.158.958.8
Lombardy31.043.940.929.536.3
Piedmont40.056.749.541.446.9
Trentino-South Tyrol75.469.383.073.475.3
Aosta Valley74.975.384.776.277.8
Calabria29.655.544.933.240.8
Table 8. Transitions and volatility patterns in extreme risk.
MarcoregionRegionWinter
(% Area)
Summer
(% Area)
Spring
(% Area)
Autumn
(% Area)
Average
(% Area)
Diff (Sp-Wi)
(% Area)
Diff
(Aut-Su)
(% Area)
COV
(%)
NorthEmilia-Romagna78.0858.8245.4285.0466.8−32.726.227.1
Friuli-Venezia Giulia54.9251.2752.0764.9455.8−2.913.711.3
Liguria25.7021.9426.9624.5024.81.32.68.6
Lombardy50.8631.7234.6454.6243.0−16.222.926.7
Piedmont39.4722.0432.7640.8533.8−6.718.825.4
Trentino Alto Adige9.7616.276.6313.1411.4−3.1−3.136.4
Aosta Valley9.8711.594.9211.109.4−4.9−0.532.6
Veneto62.8530.7631.8365.1647.6−31.034.439.7
Average−12.014.4
CentralLazio48.2716.9720.1053.6334.7−28.236.754.4
Marche67.7639.1421.2575.9551.0−46.536.849.7
Tuscany59.6311.4912.1050.2933.4−47.538.875.5
Umbria69.4924.5918.8070.5745.9−50.746.061.1
Average−43.239.6
SouthAbruzzo59.5838.2529.6766.8648.6−29.928.636.0
Basilicata59.1915.4210.3563.1237.0−48.847.775.6
Calabria51.3116.5628.1341.8434.5−23.225.344.3
Campania56.6221.7217.8465.8740.5−38.844.260.0
Molise70.0626.3014.7080.8448.0−55.454.567.5
Apulia71.6738.2322.9576.3152.3−48.738.149.5
Average−40.839.7
IslandSicily58.2220.5424.5959.6140.7−33.639.151.7
Sardinia69.3616.3540.3345.9143.0−29.029.650.6
Average53.6326.5024.8055.51Average−31.334.341.7
Diff (Sp-Wi) −28.83
Diff (Aut-Su) 29.01
Table 9. Confusion matrix for the compaction risk accuracy assessment.
ReferenceC1 (Low)C2
(Moderate)
C3
(High)
C4
(Very High)
User’s Accuracy
Predicted
C1 (Low)2424142527.59
C2 (Moderate)2343344130.50
C3 (High)1426322433.33
C4 (Very High)1818343533.33
Producer’s Accuracy30.3838.7428.0728.00OA: 31.24
Disclaimer/Publisher’s Note: The statements, opinions and data contained in all publications are solely those of the individual author(s) and contributor(s) and not of MDPI and/or the editor(s). MDPI and/or the editor(s) disclaim responsibility for any injury to people or property resulting from any ideas, methods, instructions or products referred to in the content.