1. Introduction
Tomato is an economically significant crop cultivated extensively worldwide, and its growth, development, yield, and quality are critically dependent on an optimal nutrient supply [
1]. Among various essential nutrients, N, P and K serve as primary macronutrients, playing indispensable roles in plant physiology [
2]. Nitrogen is a fundamental building block of proteins and a vital constituent for chlorophyll synthesis, making it one of the most critical elements governing crop yield and quality. Phosphorus, a core component of numerous intracellular compounds, is pivotal for essential physiological processes such as energy transfer, photosynthesis, and respiration [
3]. Potassium enhances the photosynthetic rate and promotes yield accumulation; an adequate K supply is instrumental in improving overall crop quality. Consequently, the implementation of a rational potassium fertilization strategy is of profound significance for optimizing both crop yield and quality [
4].
However, in practical agricultural production, improper fertilization strategies frequently induce nutritional stress in crops [
5]. This vulnerability is particularly acute during the tomato seedling stage, when plants are highly susceptible to nutrient imbalances. Once deficiency symptoms emerge, they directly and adversely impact subsequent growth and development. Consequently, achieving rapid and accurate identification of nutritional status during this early stage holds profound practical significance and economic value for guiding precision fertilization.
Currently, several traditional techniques can be used to detect nutrient deficiencies, such as visual analysis, soil analysis, and plant tissue analysis. Among these, plant tissue analysis is the most accurate technique [
6]. However, this method is inherently destructive, requires toxic reagents, and involves extensive sample preparation. Therefore, there is a need for a rapid, affordable, non-destructive, and environmentally friendly technique for routine nutrient stress detection [
7].
The application of near-infrared spectroscopy in nutritional analysis has garnered increasing attention [
8,
9,
10]. The absorption bands utilized in this technology are primarily attributed to the overtone and combination vibrations of C-H, N-H, and O-H bonds. Because these chemical bonds are ubiquitous in organic compounds, NIR spectroscopy facilitates both the qualitative and quantitative analysis of plant nutrients [
11]. For instance, nitrogen, a vital constituent of plant chlorophyll and proteins, can be effectively detected via NIR spectroscopy by capturing the specific spectral signatures associated with the C-H bonds in chlorophyll and the N-H bonds in proteins [
12].
Near-infrared spectroscopy is an analytical technique that acquires and evaluates the spectral signatures of materials within the near-infrared region (700–2500 nm). In the agricultural sector, it is extensively employed to assess diverse traits and characteristics of plant leaves, stems, and fruits [
13]. NIR spectra encapsulate a wealth of plant physiological information while requiring relatively minimal sample preparation and small sample sizes. Consequently, this technology offers distinct advantages, including rapidity, non-destructiveness, and high accuracy in the determination of target constituents [
14].
Driven by advances in machine learning, deep learning, and sophisticated optimization algorithms, artificial intelligence has demonstrated transformative potential across diverse agricultural domains. These applications range from macro-level market intelligence, such as time-series forecasting of crop prices [
15], to high-fidelity visual analysis through generative diffusion models for agricultural imaging [
16]. Furthermore, the integration of advanced optimization techniques (e.g., Gray Wolf Optimization) with deep learning architectures and transfer learning has significantly enhanced the diagnostic accuracy for complex crop diseases [
17,
18,
19]. While these AI-driven methodologies have matured in broad computer vision and forecasting tasks, their application in the precise, non-destructive qualitative identification of multi-class nutrient stress via spectral data remains a critical frontier.
To construct robust regression models, spectral data are typically preprocessed to mitigate the interference of non-chemical factors, including instrumental noise, light scattering, and baseline drift. For instance, Yu et al. [
20] employed various preprocessing techniques—such as the FD, SD, MSC, and their combinations—to predict the total nitrogen content in Korla fragrant pear leaves using NIR spectroscopy. Their findings indicated that the combination of SNV and SD preprocessing, coupled with a Radial Basis Function Neural Network (RBFNN), yielded the optimal predictive performance, achieving a coefficient of determination (R
2) of 0.8547. Acosta et al. [
21] utilized a PLS-R model to predict multiple macro- and micronutrients. They applied five preprocessing methods: mean centering, SG, SNV, FD, and SD. The coefficients of determination (R
2) for their models ranged from 0.31 to 0.69, with the values for P, K, and B reaching approximately 0.60, 0.63, and 0.69, respectively.
Furthermore, a full Vis-NIR spectrum typically comprises hundreds to thousands of wavelength variables, which inevitably contain a substantial amount of uninformative and redundant data. To enhance computational efficiency and predictive accuracy, feature wavelength selection algorithms are frequently employed to extract the most representative spectral information [
22]. Following the study by Liu et al. [
23] on predicting rice protein content using near-infrared spectroscopy, 35 key wavelength variables were selected through the SPA. The predictive accuracy of the constructed model improved by approximately 7.4% compared with the full-spectrum model. In a study by Zhang C et al. [
24] on the soluble protein content of rapeseed leaves, the PLS model established using the full spectrum achieved a prediction correlation coefficient (r
p) of 0.9441. After selecting 15 characteristic wavelengths using the SPA, the constructed SPA-PLS model improved the r
p to 0.9554, demonstrating enhanced model accuracy and stability.
The primary objective of this study was to address a significant limitation in existing research: while nutrient stress symptoms are often clearly visible in mature plants, the spectral signatures of N, P, and K deficiencies in tomato seedlings are typically subtle and highly overlapping. Standard flat machine learning models often struggle to handle such complex 10-class categorization at this early developmental stage, as they must identify a global decision boundary across categories with extremely high spectral similarity, often leading to poor convergence and feature interference. To overcome these challenges, this study developed a rapid detection model based on Vis-NIR spectroscopy, specifically designed for fine-grained identification during the seedling stage. The adoption of a hierarchical strategy in this study is specifically motivated by its ability to decompose this high-dimensional, complex problem into a sequence of manageable sub-tasks. To achieve this, various spectral preprocessing methods were systematically evaluated, and two feature wavelength selection algorithms—SPA and Random Frog—were employed to reduce data dimensionality. Finally, by integrating these techniques with four machine learning classifiers (RF, SVM, PLS, and XGBoost), a three-step hierarchical classification strategy was constructed to disentangle the overlapping spectral features and determine the optimal composite model. Ultimately, this research aims to provide a robust scientific foundation for early-stage precision nutritional monitoring and management in tomato cultivation.
2. Materials and Methods
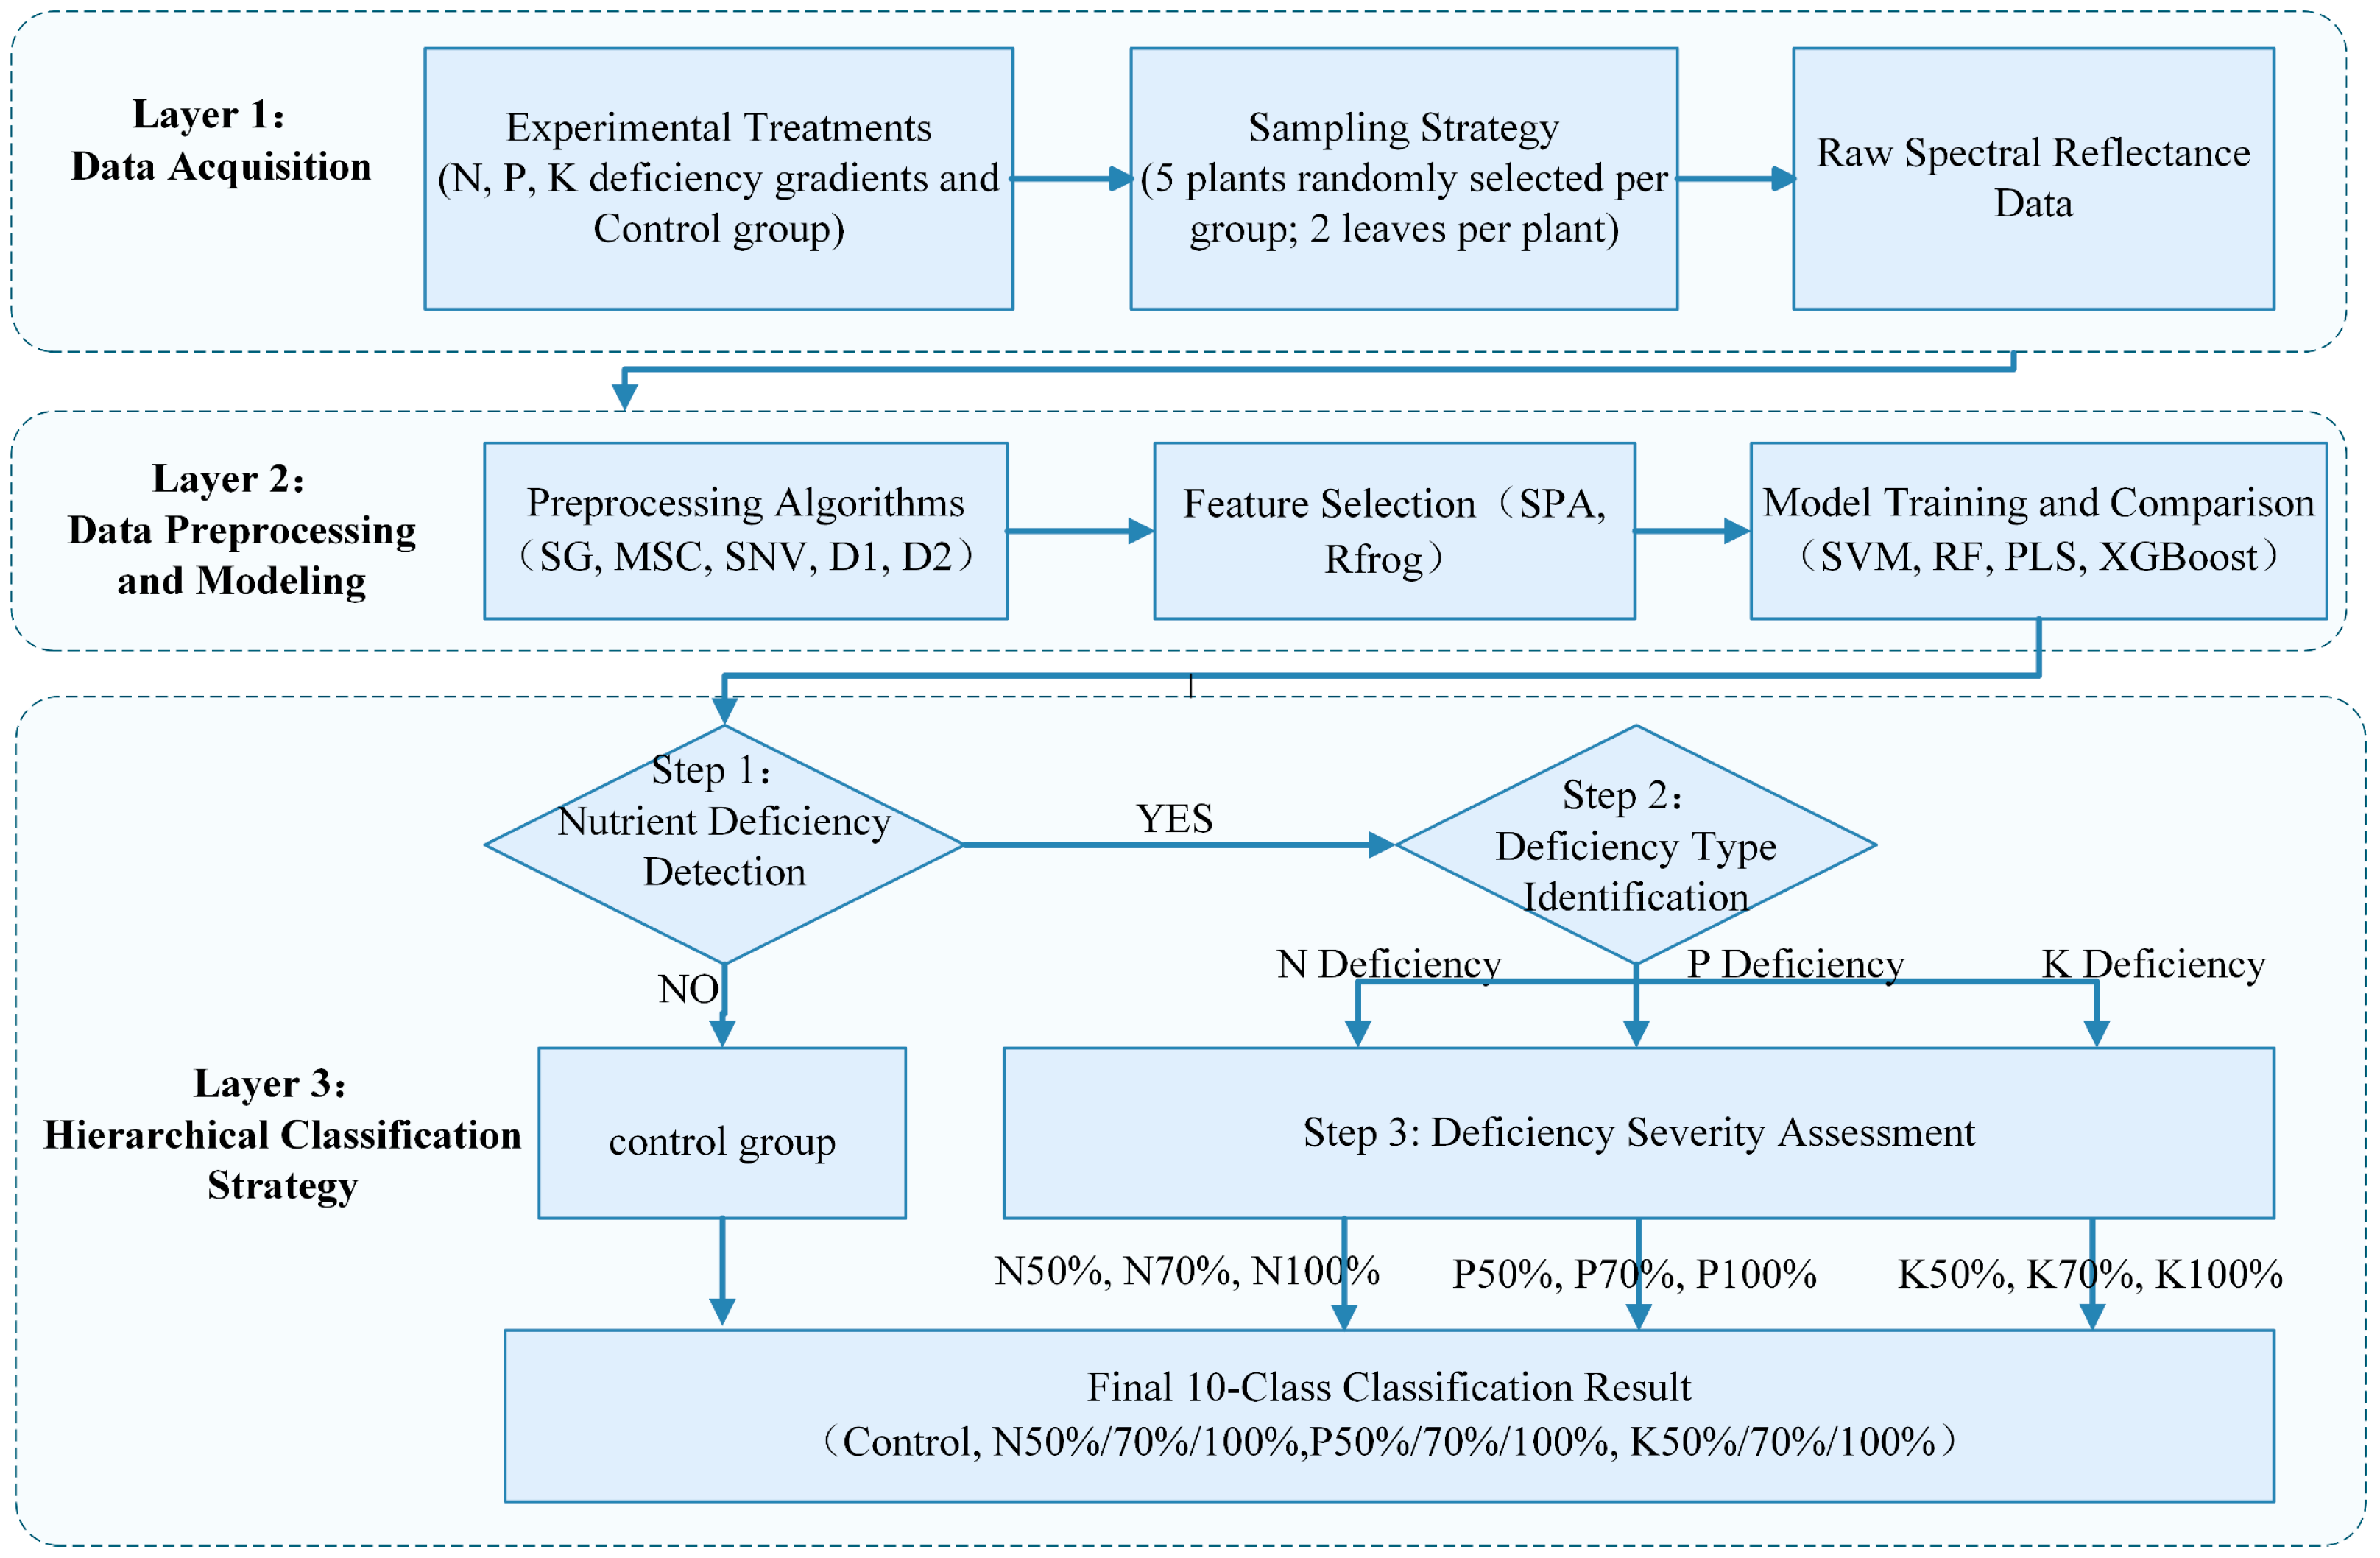
To systematically identify the specific types and severity levels of nutritional stress in tomato seedlings, a comprehensive technical framework was established in this study. The overall experimental workflow is illustrated in
Figure 1.
Initially, tomato seedlings were cultivated under varying gradients of N, P, and K stress using specially formulated nutrient solutions. Following this cultivation period, NIR spectral data were acquired from the functional leaves using a spectrometer. The raw spectra were subsequently subjected to denoising preprocessing techniques, and feature wavelength selection algorithms were applied to reduce data dimensionality. Building upon this foundation, a three-step hierarchical classification strategy was implemented to construct identification models using four machine learning algorithms: SVM, RF, PLS and XGBoost. The optimal model for identifying nutritional stress was ultimately identified through a comprehensive performance evaluation. A detailed elaboration of each methodological step is provided in the subsequent sections.
2.1. Experimental Materials
A total of 436 tomato seedlings (cv. ‘Zhongza No. 9’) at 20 days after sowing were selected as experimental materials. Upon transplanting, all seedlings were initially cultured in a standard Hoagland nutrient solution. Subsequently, the experiment was divided into four primary groups: a full-nutrient control group and nutritional stress treatment groups. The stress treatments consisted of N, P and K deficiencies, with each element subjected to three deficiency gradients: 50%, 70%, and 100%. The nutrient solutions utilized for the gradient treatments were prepared based on the standard Hoagland formulation. The specific modifications in macronutrient concentrations for each stress gradient are detailed in
Table 1, whereas the concentrations of the invariant nutrients are provided in
Table 2. Micronutrients were supplied according to the universal recipe. To ensure the reliability and comparability of the experimental results, an equal number of seedlings was assigned to each treatment group, all of which were maintained under uniform cultivation management practices.
In this study, the spectral acquisition process spanned a continuous 29-day period, during which a total of 2900 functional leaves from the tomato seedlings were initially sampled. After removing anomalous data (outliers) generated during the measurement process, a final dataset comprising 2814 valid spectra was retained for subsequent analysis. The detailed distribution of these spectral samples is summarized in
Table 3. During the measurement process, the spectrometer probe was positioned perpendicularly against the adaxial surface of each leaf. Two independent spectral scans were conducted on the symmetrical mesophyll regions situated on either side of the midrib. The average of these two scans was calculated and designated as the raw spectral data for the respective leaf, resulting in a final dataset of 2814 raw spectra. Subsequently, all raw spectral data were subjected to preprocessing and feature wavelength selection. Specifically, 50 distinct feature wavelengths were extracted using the Random Frog algorithm and SPA, respectively.
Group 1 served as the full-nutrient control. Groups 2–4 corresponded to 50%, 70%, and 100% N deficiencies, respectively; Groups 5–7 corresponded to 50%, 70%, and 100% P deficiencies, respectively; and Groups 8–10 corresponded to 50%, 70%, and 100% K deficiencies, respectively. To maintain ionic equilibrium across the treatments, calcium chloride (CaCl2) and potassium chloride (KCl) were utilized as substitute salts to compensate for the reduction in non-target elements.
2.2. Experimental Equipment
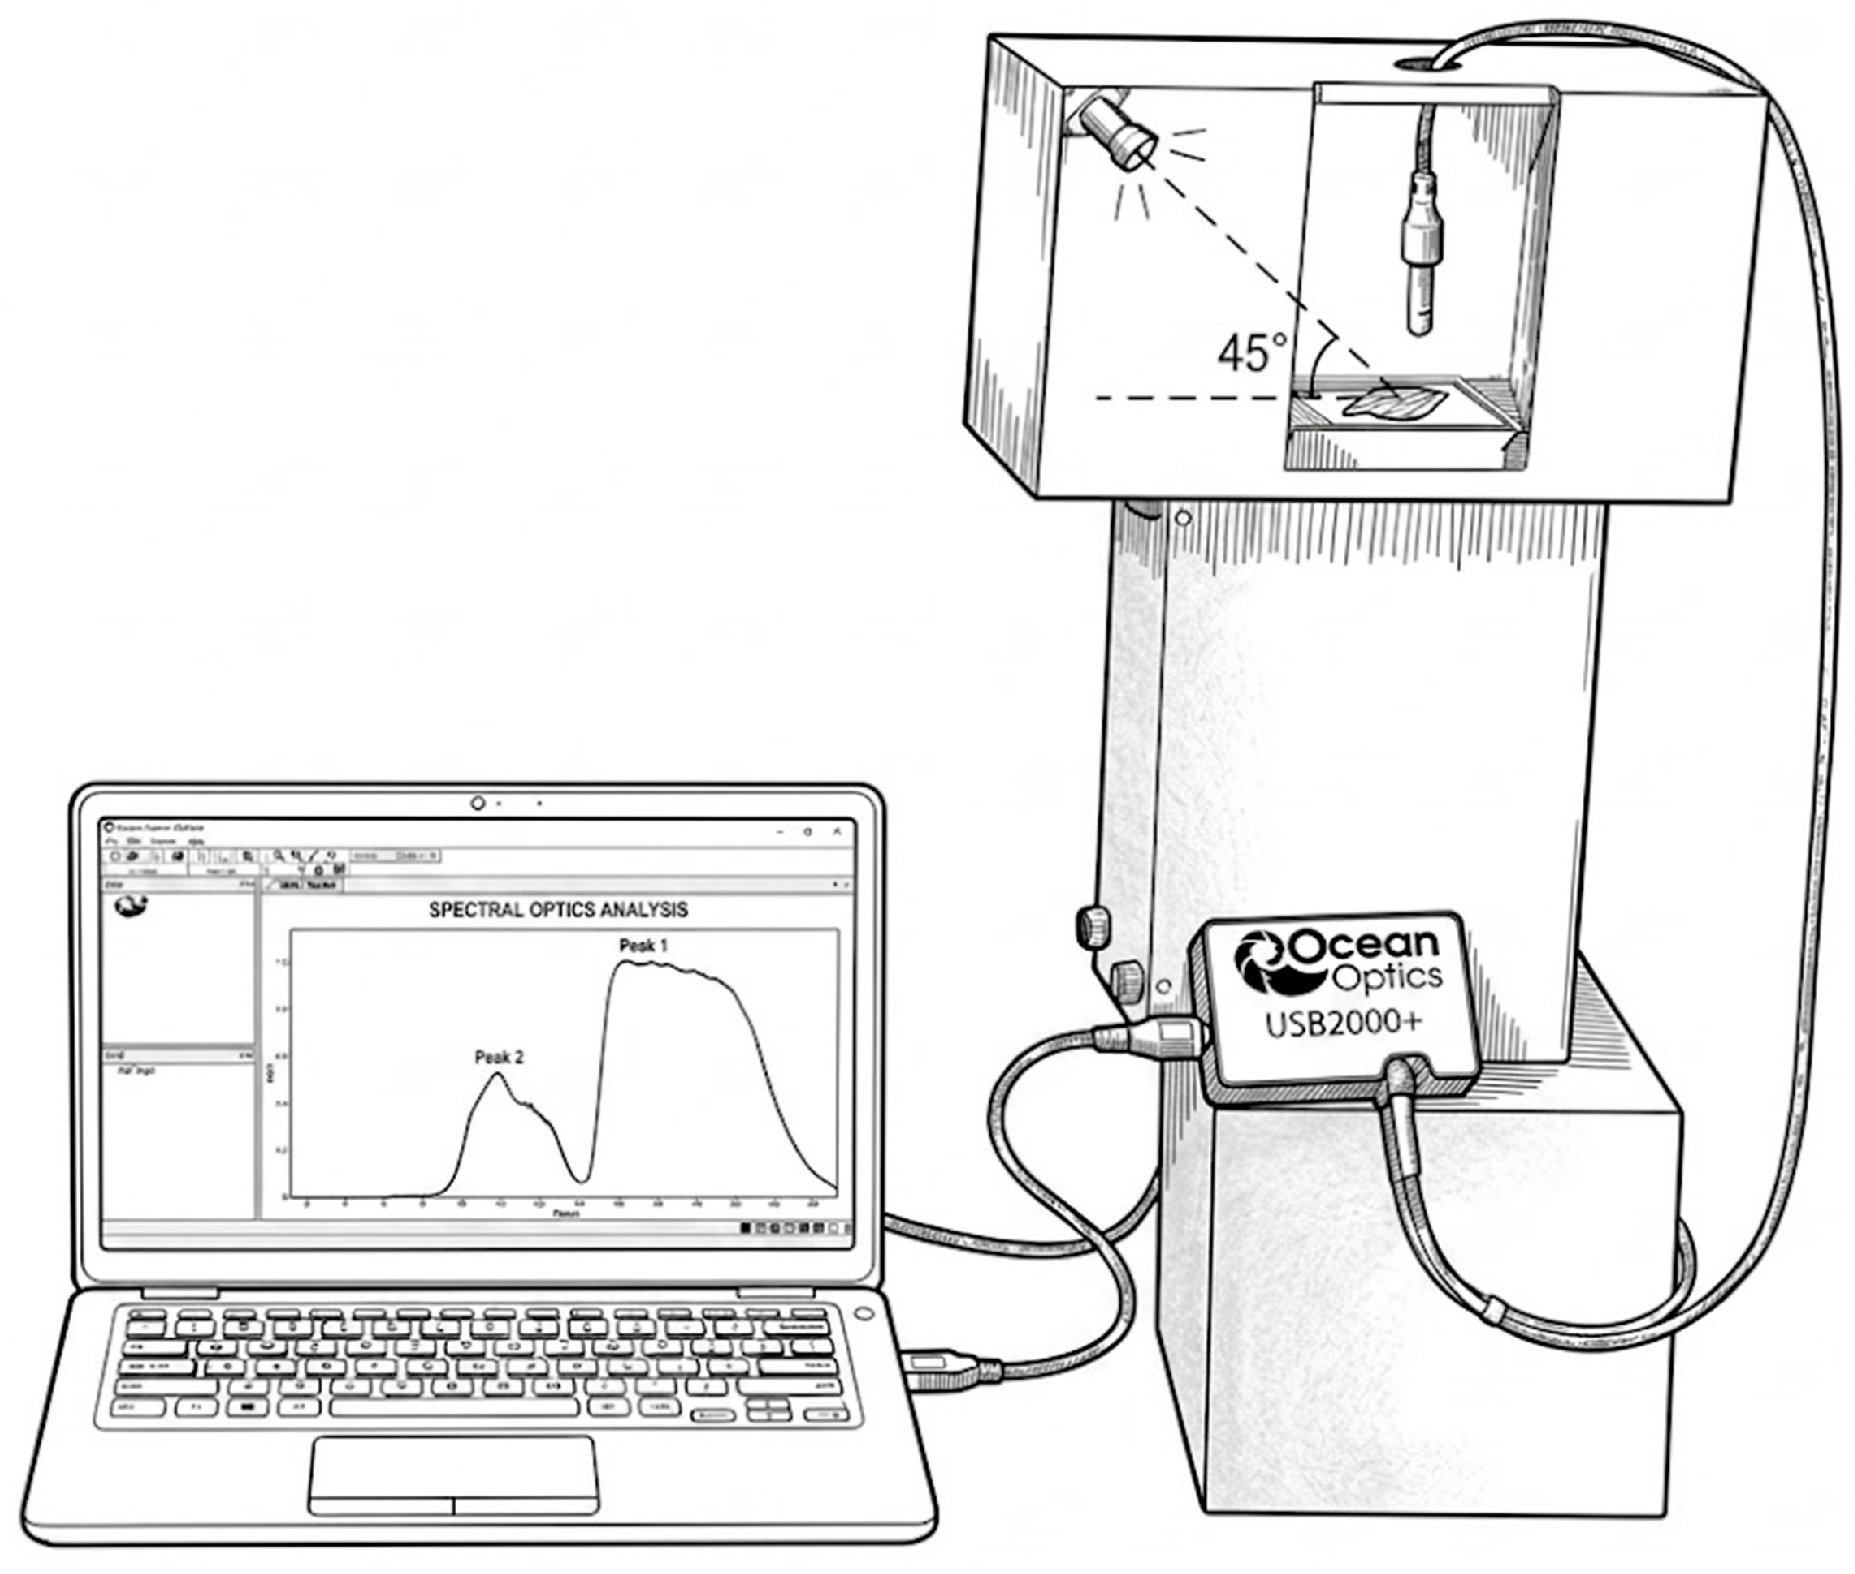
Spectral data were acquired using a USB2000+ spectrometer (Ocean Optics Inc., Orlando, FL, USA). The instrument operates over a wavelength range of 340–1032 nm, encompassing both the visible and NIR spectral regions. The spectral acquisition system consisted of a light source, a lens, an optical fiber, a dark chamber, and spectral analysis software. During the measurement process, the light source was maintained at a stable intensity to strictly eliminate any interference from external ambient light. The complete configuration of this spectral acquisition system for the tomato seedlings is illustrated in
Figure 2. Data acquisition and management were executed using Spectra Suite software (version 2.0), which facilitated the real-time graphical visualization, file naming, and storage of the spectral data. The software enabled continuous monitoring of both graphical and numerical spectral outputs, allowing for the dynamic adjustment of acquisition parameters according to specific experimental conditions. All spectral data obtained in this study were measured in reflectance mode. These reflectance spectra effectively capture the absorption and scattering characteristics of incident light interacting with both the superficial and internal tissue structures of the tomato seedling leaves.
To rigorously eliminate the influence of ambient light on the experimental data, fresh detached leaves of tomato seedlings were collected for spectral scanning in this study. Furthermore, to minimize the interference on spectral reflectance caused by stress-induced electrical signal transduction and metabolic degradation following mechanical excision, only a limited number of leaves were selectively harvested from each seedling, ensuring no detrimental impact on the subsequent overall health and growth of the plants. Detached leaves were immediately placed in a temperature- and humidity-controlled insulated container to maintain physiological activity, and spectral acquisition was completed rapidly within a very short time. This strict preservation procedure ensured that the measured spectra closely reflected the true physiological and optical characteristics of the leaves as they were on the plant.
To ensure accurate reflectance spectra acquisition without probe interference in the incident light path, a classic off-axis illumination design was adopted. Specifically, a halogen lamp was mounted at a 45° angle within the dark enclosure to provide oblique illumination onto the tomato leaf, with a collimating probe positioned vertically 2 cm above the sample. This combination of oblique illumination and perpendicular detection physically prevents probe shadowing and effectively suppresses strong specular reflection from the leaf surface. Furthermore, an intermediate box between the stand and the dark chamber houses the halogen lamp’s electrical controls and serves as an elevated platform to hold the leaf at the optimal measurement height. The light signals reflected from the leaf were focused by a collimating lens and subsequently transmitted via an optical fiber to a USB2000+ spectrometer. The spectrometer was interfaced with a computer through a USB connection, and the acquired reflectance spectra were then displayed on the SPECSUITE spectral analysis software.
To mitigate the impact of heat generated by the halogen lamp during illumination on the accuracy of the acquired data, several control measures were implemented in this study. The duration of each spectral acquisition was strictly limited to under 2 s; this brief exposure effectively prevented heat accumulation around the leaf. Furthermore, the halogen lamp was positioned at a designated distance from the leaf and illuminated the sample at an oblique angle. These configurations ensured leaf temperature stability during the measurement, thereby maintaining its natural physiological and metabolic state. The interior of the dark chamber was coated with black pigment to minimize the amount of light reflected back onto the tomato seedling leaf samples, thereby preventing any compromise to data accuracy. To ensure data consistency and reproducibility, two spectral measurements were acquired for each leaf. Furthermore, the measurement spots were strictly selected to avoid the midrib, which effectively reduced the interference of the vein structure on the transmission and reflectance characteristics of the optical signals.
2.3. Data Acquisition
Initially, prior to measuring each leaf sample, white and dark calibrations of the spectrometer were performed. Each tomato leaf was positioned on the support within the dark chamber, with the smooth adaxial surface facing upward and the lens oriented perpendicularly to the leaf. After closing the chamber door and activating the light source, the emitted light illuminated the leaf surface at a 45° angle, and the reflected light was collected by the lens and transmitted through the optical fiber to the spectrometer, resulting in a recorded light intensity
. The corresponding reflectance spectrum was then displayed in the visualization window of the Spectra Suite software. The reflectance
at a specific wavelength
λ for the leaf sample was determined according to Equation (1).
where
is the spectral light intensity of the leaf sample at wavelength
λ;
is the dark current spectral intensity within the dark chamber at wavelength
λ; and
is the reference spectral intensity without a sample at wavelength
λ.
Subsequently, an equal number of leaf samples was randomly selected from each treatment group for measurement. Two reflectance spectra were acquired for each leaf, with the acquisition sites strictly avoiding the midrib to mitigate the potential interference of leaf veins on light transmission and absorption characteristics. During the acquisition process, the leaves were maintained in a flat position at a consistent focal distance from the lens to ensure the consistency and reproducibility of the data.
The spectral data for each leaf were saved using the Spectra Suite software and exported in .txt format. To maintain a systematic database, files were named according to a standardized convention: date-element-concentration gradient.
Finally, the spectral data acquisition commenced two days after the tomato seedlings were transplanted and treated with the nutrient solutions. Subsequently, measurements were performed every 24 h until the plants reached the flowering stage. Each sampling session strictly followed the protocol outlined in Steps 1–3 to ensure the consistency of data acquisition conditions and operational procedures.
2.4. Experimental Methods
2.4.1. Preprocessing Methods
Vis-NIR spectral data are inherently susceptible to interference from the instrument’s signal-to-noise ratio, baseline drift, light scattering, and other confounding factors, which can compromise final modeling accuracy. Therefore, spectral preprocessing is essential prior to modeling to enhance the signal-to-noise ratio (SNR). In this study, five commonly utilized preprocessing techniques were compared: SNV, MSC, SG, FD and SD [
25]. Each method was independently applied to the full-wavelength spectral data and evaluated through the same feature wavelength selection and modeling pipeline to assess its specific impact on the discrimination performance of nutrient deficiency types.
For SG, a window length of 11 and a second-order polynomial were applied to reduce spectral noise while preserving the original spectral characteristics. FD and SD spectra were calculated using the numerical gradient method implemented in NumPy.
2.4.2. Feature Wavelength Selection
In Vis-NIR spectral analysis, raw data typically comprise hundreds to thousands of wavelength variables characterized by high collinearity and redundancy. When coupled with a limited sample size, these factors often lead to overfitting during the modeling process, thereby compromising model stability and predictive performance. Consequently, performing feature wavelength selection prior to modeling is essential. This step not only significantly reduces data dimensionality but also highlights spectral information closely associated with the chemical or physiological characteristics of the samples, ultimately enhancing the accuracy and generalization capability of the resulting models.
In this study, two distinct feature wavelength selection methods were employed: the Random Frog algorithm and the Successive Projections Algorithm.
Random Frog is a feature selection method based on Monte Carlo sampling. Its core principle involves iterative sampling within the variable space via a random walk process, coupled with a variable selection probability to evaluate the importance of each wavelength [
26]. After a specified number of iterations, wavelengths with higher selection frequencies are considered to contribute more significantly to the model. This method offers advantages such as high computational efficiency and strong robustness, making it particularly suitable for processing high-dimensional spectral data where the number of variables far exceeds the number of samples. Assuming the total number of variables is
p, let
S(
t) denote the subset of variables selected during the t-th iteration. For the j-th wavelength variable, the selection probability
is defined as:
where
represents the selection probability of the j-th wavelength variable, and T denotes the total number of iterations.
I is an indicator function, which takes a value of 1 if
j in
and 0 otherwise. Ultimately, wavelengths with a higher selection probability are identified as the characteristic wavelengths.
Successive Projections Algorithm is a feature selection method based on vector projection. Its primary mechanism involves the stepwise selection of wavelength variables that maximize the reduction in multicollinearity, thereby mitigating interference from redundant information in the spectral data [
27]. This method emphasizes the independence between variables, typically resulting in a concise subset of wavelengths that possess high representativeness and interpretability.
Assume that the original spectral matrix is
, where n represents the number of samples and
p denotes the number of wavelengths. At the k-th step of variable selection, the SPA selects variables based on the vector projection formula (Equation (3)):
where
represents the variable vector corresponding to the j-th candidate wavelength;
denotes the m-th previously selected variable vector; and
represents the residual vector of
after removing its correlation with the selected variables.
In this study, the Random Frog algorithm and the SPA were employed to select characteristic wavelengths from spectral data processed by different preprocessing methods. The selected variables were subsequently used for model development and comparative evaluation of classification performance. By comparing the differences and overlapping wavelength regions identified by the two methods, the spectral intervals associated with nutrient deficiencies can be further analyzed. Moreover, the applicability and effectiveness of different feature selection algorithms in identifying nutrient stress in tomato seedlings can be systematically evaluated.
2.4.3. Modeling Methods
In this study, four commonly used and representative classification models were selected, including SVM, RF, PLS and XGBoost. To accommodate the specific characteristics of nutrient stress identification in tomato seedlings, a three-step hierarchical classification strategy was adopted for all models. First, a binary classification model was established to distinguish between healthy plants and those under nutrient stress. Second, the stressed samples were further classified into three categories according to nutrient deficiency type (N, P, or K). Finally, within each deficiency category, a tertiary classification model was constructed to identify the severity level of stress. This stepwise classification approach progressively refines the prediction results, ultimately achieving ten-class discrimination, including the control group and the three nutrient elements at different deficiency levels.
SVM is a highly reliable supervised learning algorithm. The selection of its parameters mainly involves the penalty parameter (
C) and the kernel parameter (
γ) [
28]. In this study, the radial basis function (RBF) was adopted as the kernel function. A grid search strategy combined with five-fold cross-validation was employed to optimize the parameters
C and
γ in order to achieve optimal classification performance. Specifically, the search range for
C was set to [0.1, 1, 10, 100], while the search range for
γ included scale, auto, 0.01, and 0.001.
RF is a machine learning algorithm based on decision trees and is widely used for both classification and regression tasks [
29]. It employs the bootstrap sampling method to generate multiple subsets from the training data, and a decision tree is trained on each subset. During node splitting, a random subset of features is selected to enhance model diversity. The final classification result is obtained through majority voting among all trees, which effectively reduces the risk of overfitting associated with a single decision tree while improving the overall generalization performance of the model.
In this study, five-fold cross-validation combined with grid search was applied to optimize the model parameters. The optimized parameters included n_estimators, max_depth, min_samples_split and min_samples_leaf. The parameter combination yielding the best performance was ultimately selected for model construction.
PLS is a statistical learning method based on latent variable projection, capable of achieving stable modeling even in scenarios characterized by high multicollinearity among independent variables and where the number of variables far exceeds the number of samples. Its core principle involves extracting a set of latent variables that maximize the covariance between the independent variable matrix and the response variables, thereby unifying dimensionality reduction with the modeling process. The critical optimization parameter is the optimal number of principal components (n_components).
XGBoost is an ensemble learning method based on Gradient Boosted Decision Trees (GBDT). In classification tasks, XGBoost utilizes Classification and Regression Trees (CART) as base learners and iteratively optimizes the loss function [
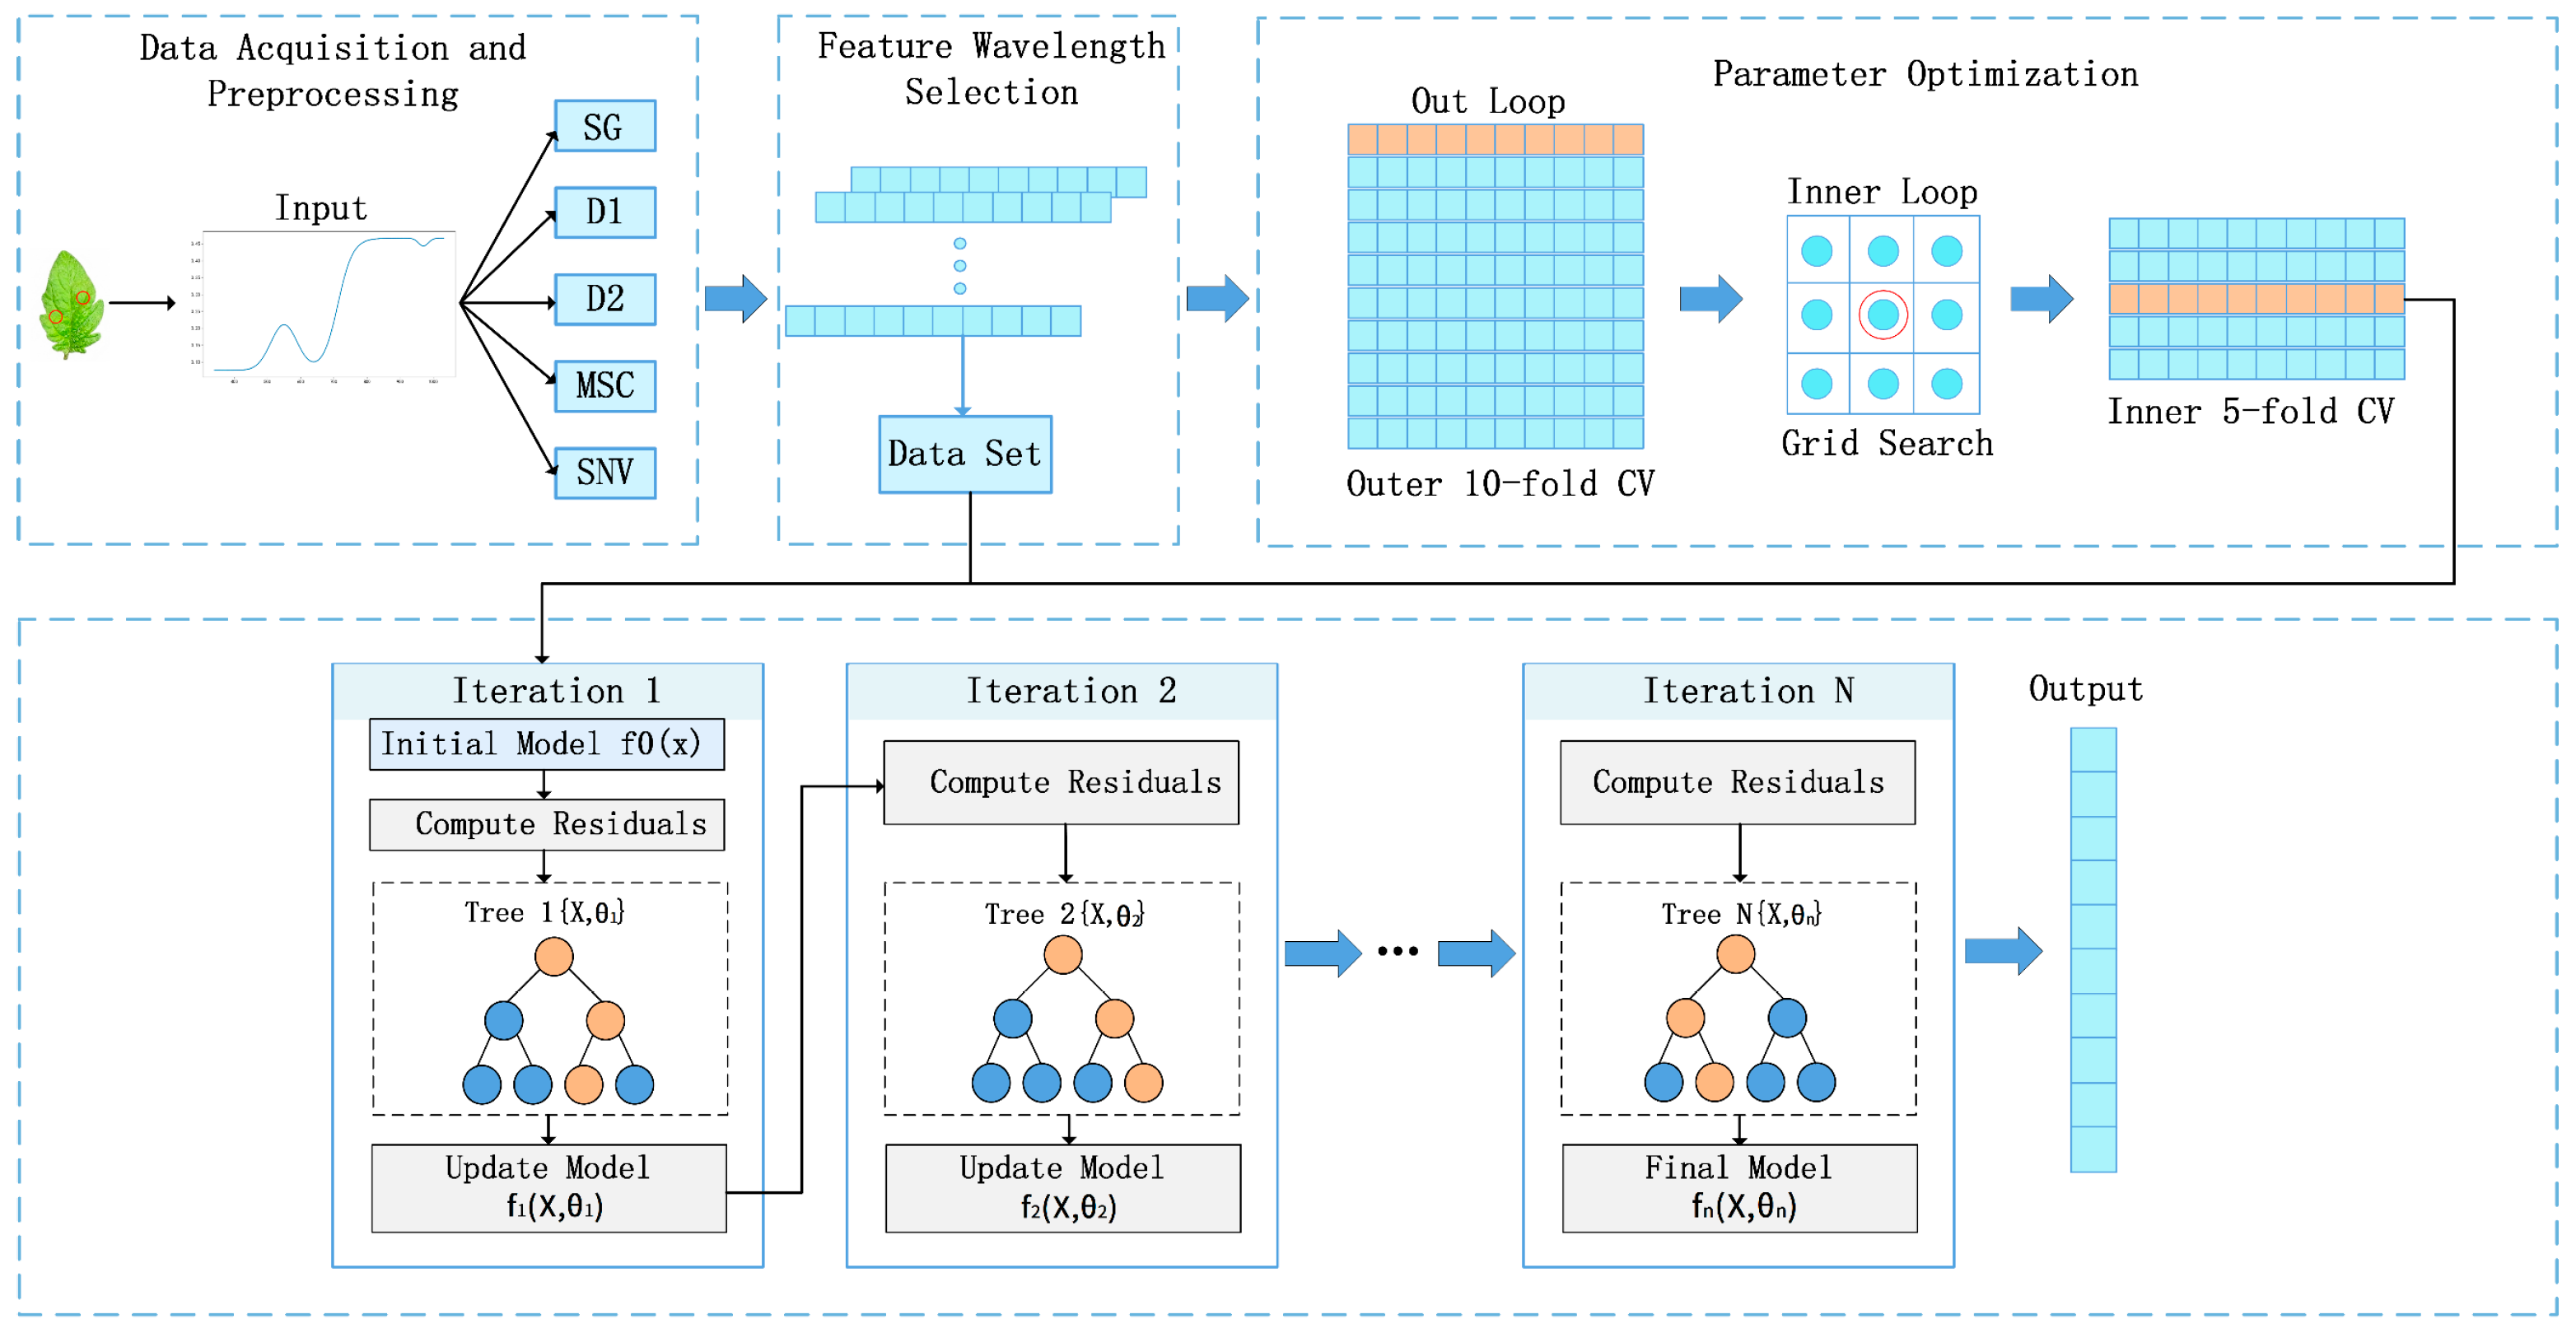
30]. In this study, model parameters were optimized using five-fold cross-validation and grid search; the specific model construction and parameter tuning workflow is illustrated in
Figure 3. The optimized parameters included n_estimators, max_depth, learning_rate, subsample, and colsample_bytree. The optimal parameter combinations selected for each stage of the task after optimization for the four aforementioned models are summarized in
Table 4.
2.4.4. Model Evaluation
To rigorously evaluate the model’s generalization capability while ensuring sample independence, the dataset partitioning was conducted at the individual plant level. Specifically, all spectral samples collected from the same tomato seedling were assigned exclusively to either the development set or the independent test set. Based on this strategy, the entire dataset (n = 2814) was partitioned into a development set (80%, n = 2251) and an independent test set (20%, n = 563) using stratified sampling according to nutrient stress categories. The development set was utilized for model optimization and hyperparameter tuning. Specifically, a 10-fold nested cross-validation strategy was implemented to maximize data utilization and mitigate the risk of overfitting during the model selection process. This framework comprises two layers: in the outer loop (performance evaluation), the entire dataset was partitioned into 10 mutually exclusive subsets via stratified sampling to maintain consistent class distributions, with each subset serving sequentially as an independent test set to ensure universal sample coverage. Within each outer iteration, an inner loop (hyperparameter optimization) was conducted on the training data using a 5-fold cross-validation combined with a grid search. During this stage, the parameter space was exhaustively searched to determine the optimal hyperparameter combination, using the Macro-F1 score as the primary optimization metric. All feature selection and model training procedures were performed strictly within the training folds of the cross-validation process. Finally, the optimized model was evaluated on the independent test set, which remained strictly unseen during the training phase, thereby providing an unbiased evaluation of the model’s performance in practical applications.
This study employed a two-step optimization strategy involving spectral preprocessing and feature wavelength selection to identify the most robust model for identifying nutrient deficiencies in tomato seedlings. Initially, models were developed using the full-spectrum range to evaluate and determine the optimal preprocessing technique. Subsequently, based on this optimal method, a comparative analysis was conducted across various combinations of feature selection algorithms and modeling frameworks to further enhance identification accuracy.
All models in this study were implemented using Python (version 3.9.12) within the PyCharm Integrated Development Environment (version 2024.1).
2.4.5. Evaluation Metrics and Statistical Analysis
To evaluate the models’ generalization capability regarding different types and degrees of nutrient stress in tomato seedlings, accuracy, F1-score, recall, and precision were selected as evaluation metrics. To mitigate the randomness potentially arising from a single independent test set split, a Bootstrap-based statistical significance test was employed. Specifically, 1000 iterations of resampling with replacement were performed on the prediction results of each model on the independent test set to calculate the 95% confidence intervals (CIs) for classification accuracy. Generally, a narrower CI width indicates less performance fluctuation across varying data distributions, thereby reflecting stronger generalization capability and robustness.
3. Results
3.1. Spectral Characteristics
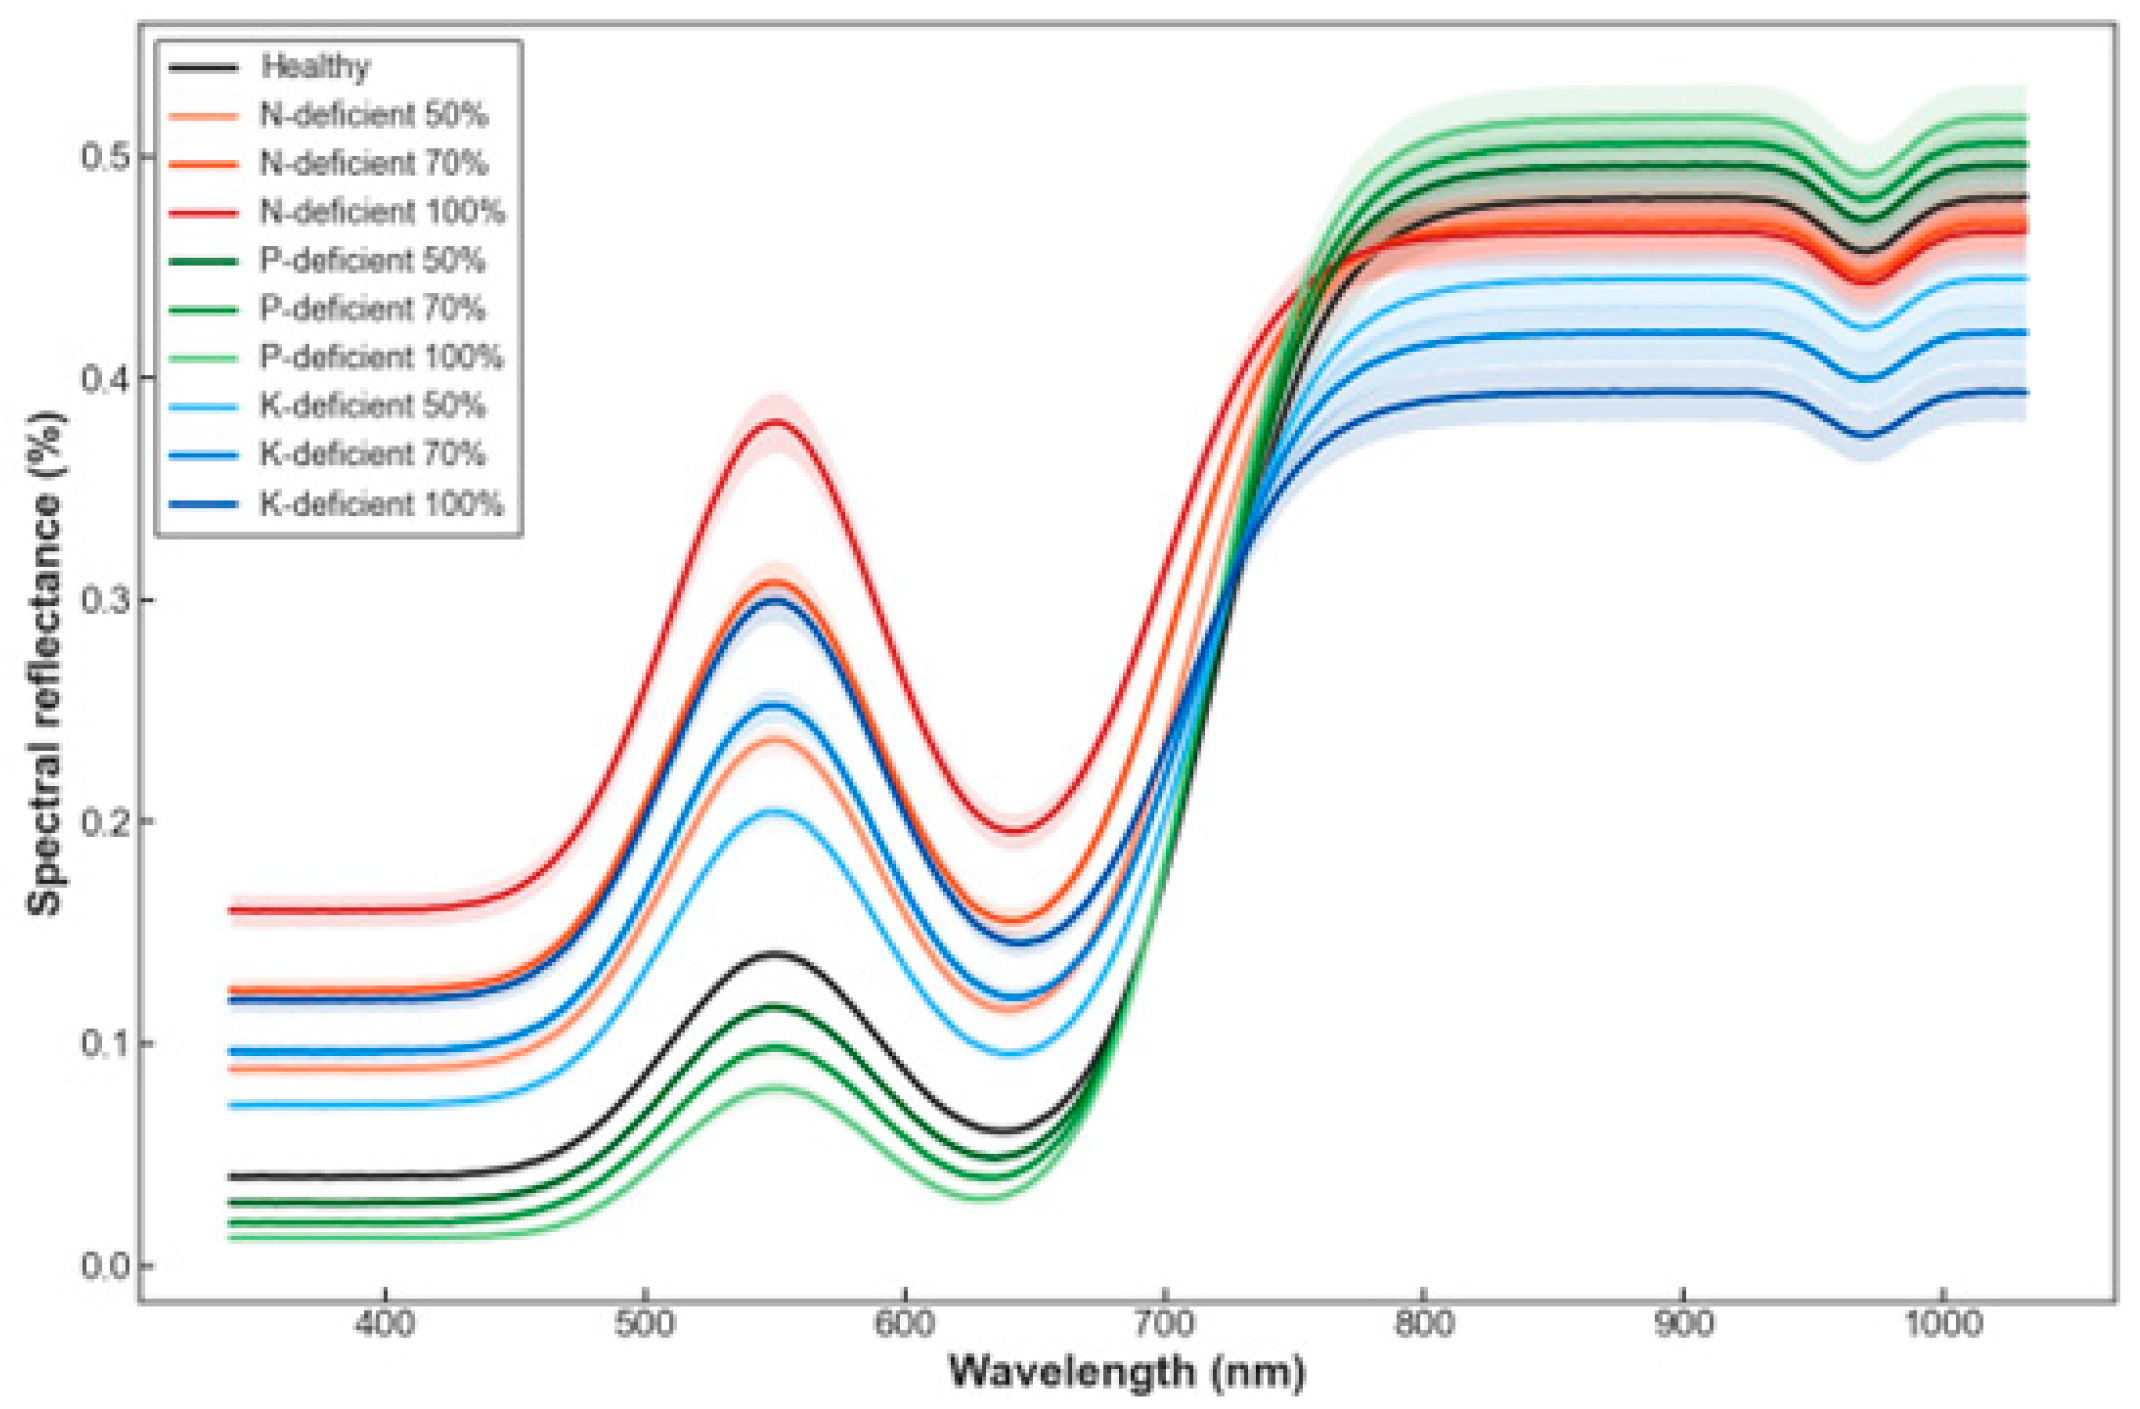
As shown in
Figure 4, deficiencies of different nutrient elements and varying concentration gradients exerted significant effects on the spectral reflectance curves of tomato leaves. Under the same element deficiency, spectral reflectance exhibited a clear gradient trend with increasing deficiency levels. At the same concentration gradient, deficiencies of different elements also resulted in distinct spectral responses. For example, under the 70% concentration condition, the spectral curves of nitrogen-, phosphorus-, and potassium-deficient treatments displayed different peak characteristics and reflectance levels in both the visible (400–700 nm) and near-infrared (700–1000 nm) regions, demonstrating element-specific spectral responses.
Both N and K deficiencies were associated with increased green reflectance near 550 nm. Previous studies have reported that nutrient stress may influence chlorophyll metabolism, photosynthetic activity, and leaf optical properties, which could contribute to changes in reflectance within this wavelength region. Therefore, the elevated reflectance observed near 550 nm in this study may be related to alterations in pigment content and leaf physiological status under nutrient deficiency conditions.
Moreover, P-deficient seedlings showed significantly higher reflectance in the red-edge region (710–730 nm). Because P is essential for ATP synthesis and energy transfer, its lack limits metabolic capacity and is associated with accelerated chlorophyll degradation. This pigment loss typically weakens absorption in the adjacent red band, which aligns with the drastic increase in red-edge reflectance observed in the P-deficient samples.
These results indicate that deficiencies of different nutrients leave distinguishable spectral signatures in tomato leaves.
Overall, whether through variation in concentration gradients or comparison among different nutrient deficiencies, the spectral reflectance curves effectively discriminated the nutritional stress status of tomato plants. This provides reliable evidence supporting the application of spectral techniques for tomato nutrient identification and demonstrates the feasibility of rapid detection of nutritional stress based on leaf spectral characteristics.
3.2. Vis-NIR Spectral Preprocessing
A total of 2814 spectral data points were collected and utilized for modeling in this study. To capture the spectral responses across different stress conditions, the dataset consisted of four main categories: a Healthy Control group (281 samples), N deficiency (832 samples), P deficiency (851 samples), and K deficiency (850 samples). Within each nutrient deficiency category, three stress gradients (50%, 70%, and 100% of the standard concentration) were implemented, and the samples were generally evenly distributed across these 10 fine-grained subclasses.
The spectral reflectance curves encapsulate the unique optical signatures of samples under varying nutrient stresses. However, during the acquisition of NIR spectra, environmental variables often introduce unwanted noise. Therefore, raw data preprocessing is essential to enhance the signal-to-noise ratio.
In this study, SG was employed to suppress high-frequency noise through polynomial fitting within a sliding window, effectively preserving the original morphological features while ensuring a smooth and continuous reflectance profile. Derivative transformations were utilized to amplify subtle spectral details and accentuate absorption peaks, although their tendency to magnify high-frequency noise was carefully monitored. To address physical interferences, SNV was applied to standardize each spectrum, thereby eliminating scattering effects caused by sample grain structure and illumination variations. Additionally, MSC was implemented to mitigate multiple scattering and baseline shifts via linear calibration against the mean spectrum. These combined techniques ensured that the reflectance characteristics at key identification bands remained distinct and comparable across all samples.
To identify the most effective denoising technique, a comparative modeling analysis will be conducted using both the raw spectral bands and those subjected to various preprocessing methods. By evaluating the performance of these predictive models, we aim to determine the optimal preprocessing strategy that yields the highest identification accuracy for subsequent analysis.
3.3. Evaluation of Full-Spectrum Vis-NIR Models
In the full-spectrum Vis-NIR analysis, four machine learning algorithms—SVM, RF, PLS and XGBoost—were employed to develop 20 distinct classification models by integrating different preprocessing techniques through cross-validation. The performance metrics of these models are summarized in
Table 5. As indicated in
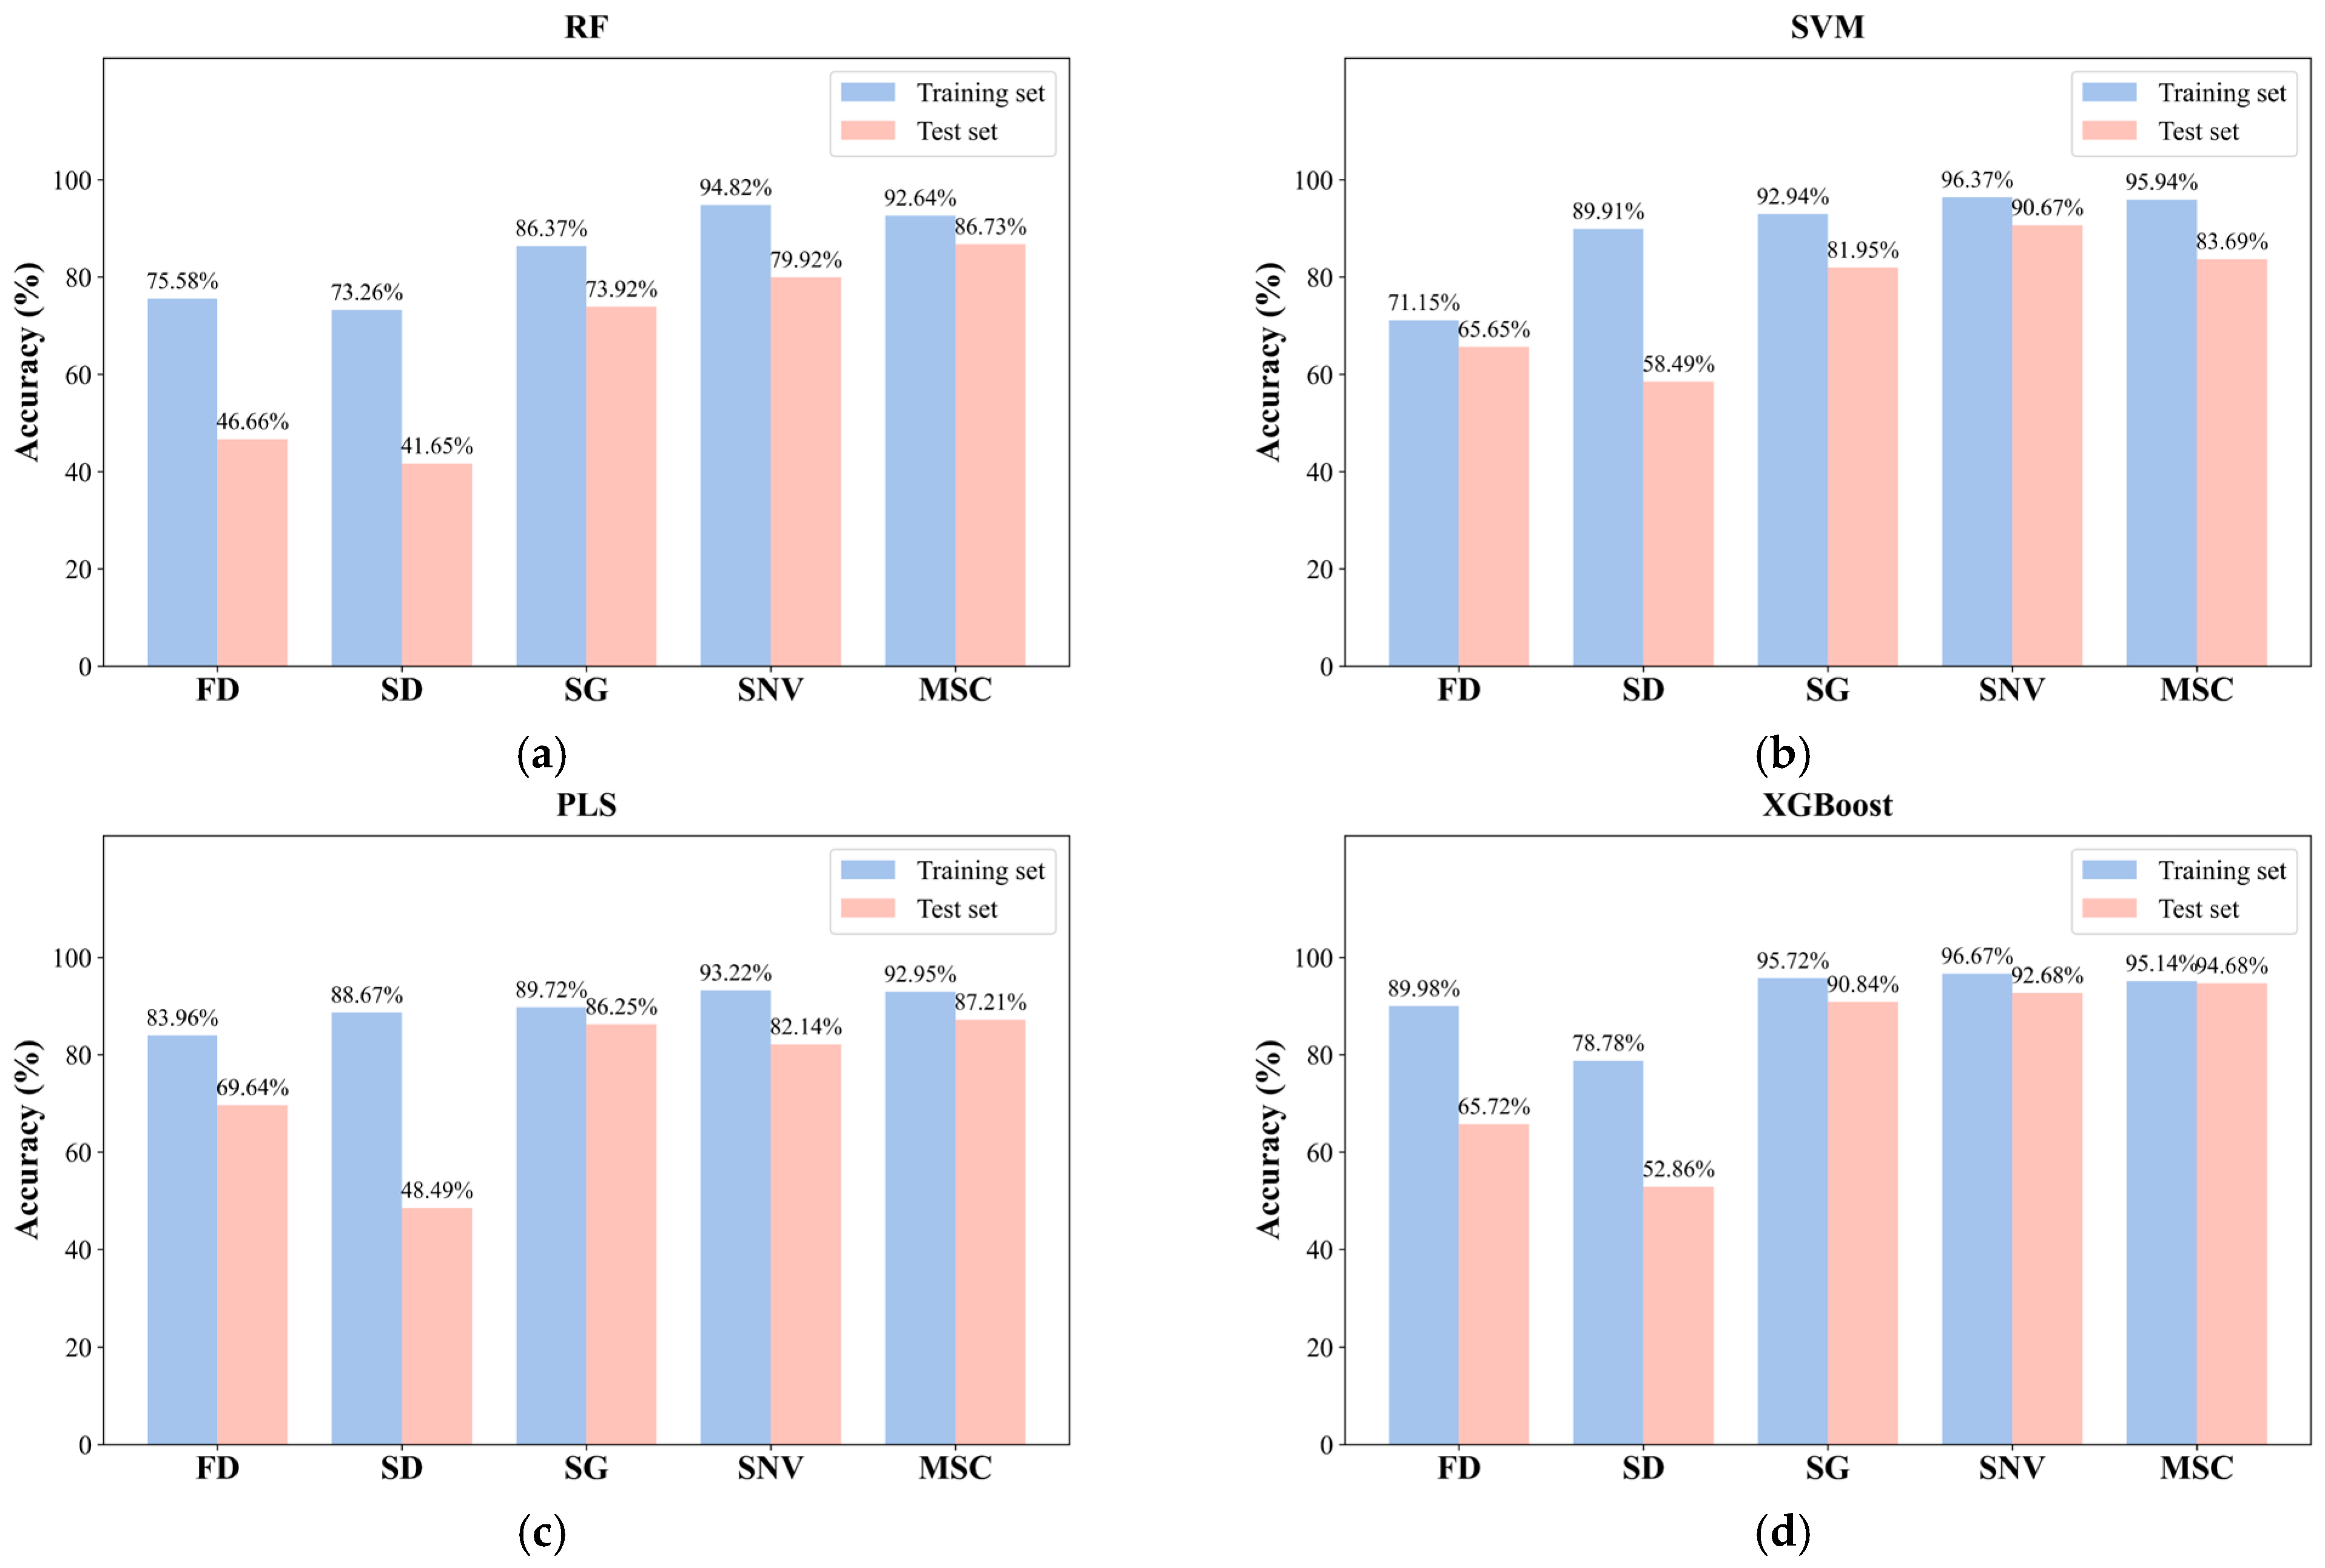
Table 5, spectra preprocessed with SNV and MSC consistently exhibited superior discriminatory performance across all modeling frameworks. These results suggest that mitigating scattering effects and baseline shifts is critical for enhancing the predictive accuracy and robustness of full-spectrum identification models. As shown in
Figure 5, the FD and SD preprocessing methods exhibited limited performance in discriminating nutrient stress types, particularly showing substantial confusion between nitrogen and potassium deficiencies, which consequently reduced the overall classification effectiveness. Moreover, the large discrepancy in accuracy between the training and testing sets suggests the presence of overfitting, indicating that the models failed to generalize effectively to unseen data.
In summary, SNV effectively minimized spectral distortions caused by leaf structural heterogeneity and scattering effects through per-sample normalization. Meanwhile, MSC mitigated baseline shifts and multiple scattering interference via linear regression-based calibration. Both techniques demonstrated a clear advantage in suppressing non-chemical interference and accentuating spectral variations linked to internal leaf chemistry. Consequently, SNV and MSC were selected as the standardized preprocessing protocols for subsequent analysis. To further enhance identification performance, the following phase of this study will integrate feature wavelength selection algorithms to reduce data redundancy and dimensionality, aiming to develop more accurate and robust models for nutrient stress identification.
3.4. Feature Wavelength Selection Results
The Vis-NIR spectrometer utilized in this study captured data across 2048 spectral channels; however, not all wavelengths contribute equally to the identification of nutrient deficiencies in tomato seedlings. To reduce the high dimensionality of the spectral data, eliminate redundant information, and enhance the accuracy and robustness of the predictive models, it is essential to perform feature wavelength selection. In this study, two distinct algorithms—RFrog and SPA—were implemented to identify the most informative variables from the spectra preprocessed by MSC and SNV.
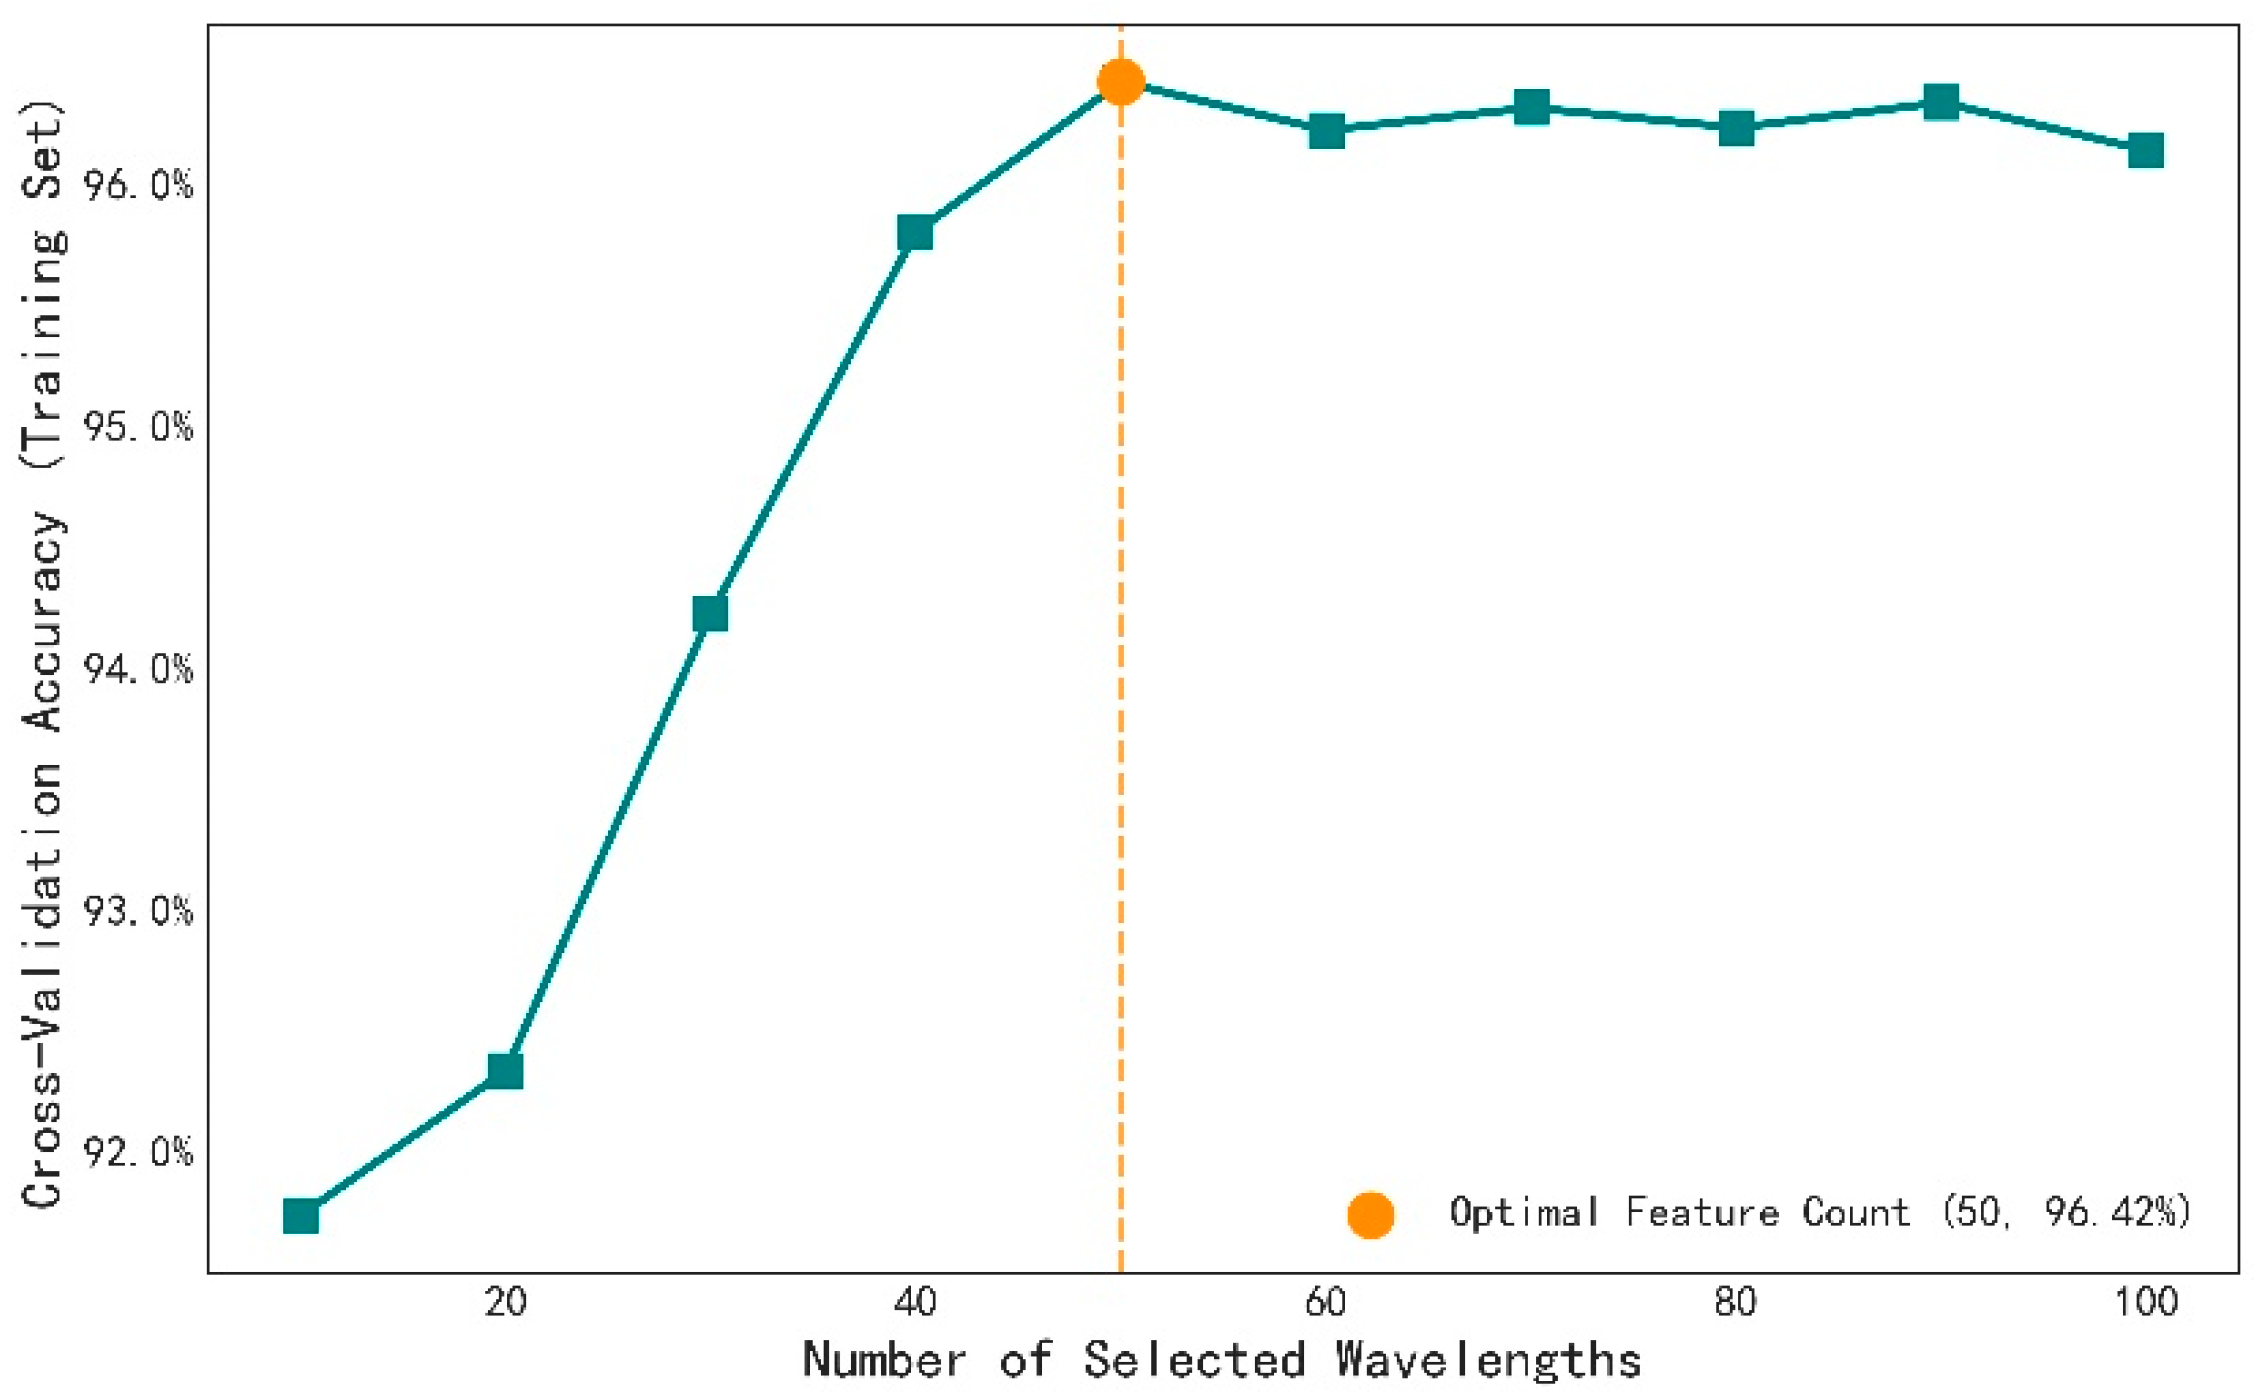
Figure 6 illustrates the influence of the number of SPA-selected characteristic wavelengths on the model’s classification performance, evaluated using the XGBoost classifier via 5-fold cross-validation on the training set. As shown in the figure, the cross-validation accuracy exhibits a rapid initial increase followed by a clear plateau as the number of input features increases. When the number of features reaches 50, the model achieves its peak accuracy of 96.42%. Beyond this threshold, further increasing the feature dimensionality yields no significant performance gains and instead leads to slight fluctuations. This suggests that 50 characteristic wavelengths are sufficient to capture the essential spectral signatures for identifying nutrient stresses, effectively reducing data redundancy while balancing model complexity and generalization capability. Furthermore, to ensure a strictly fair, one-to-one comparative evaluation of the feature extraction capabilities between SPA and RFrog, this identical dimensionality constraint (50 features) was strictly applied to both algorithms.
The RFrog algorithm was configured with 1000 iterations and an initial subset size of 50. PLS was used as the internal evaluator, and a 0.1 acceptance probability was set for inferior subsets to avoid local optima. Features were ranked by their selection probability, and the top 50 variables were retained.
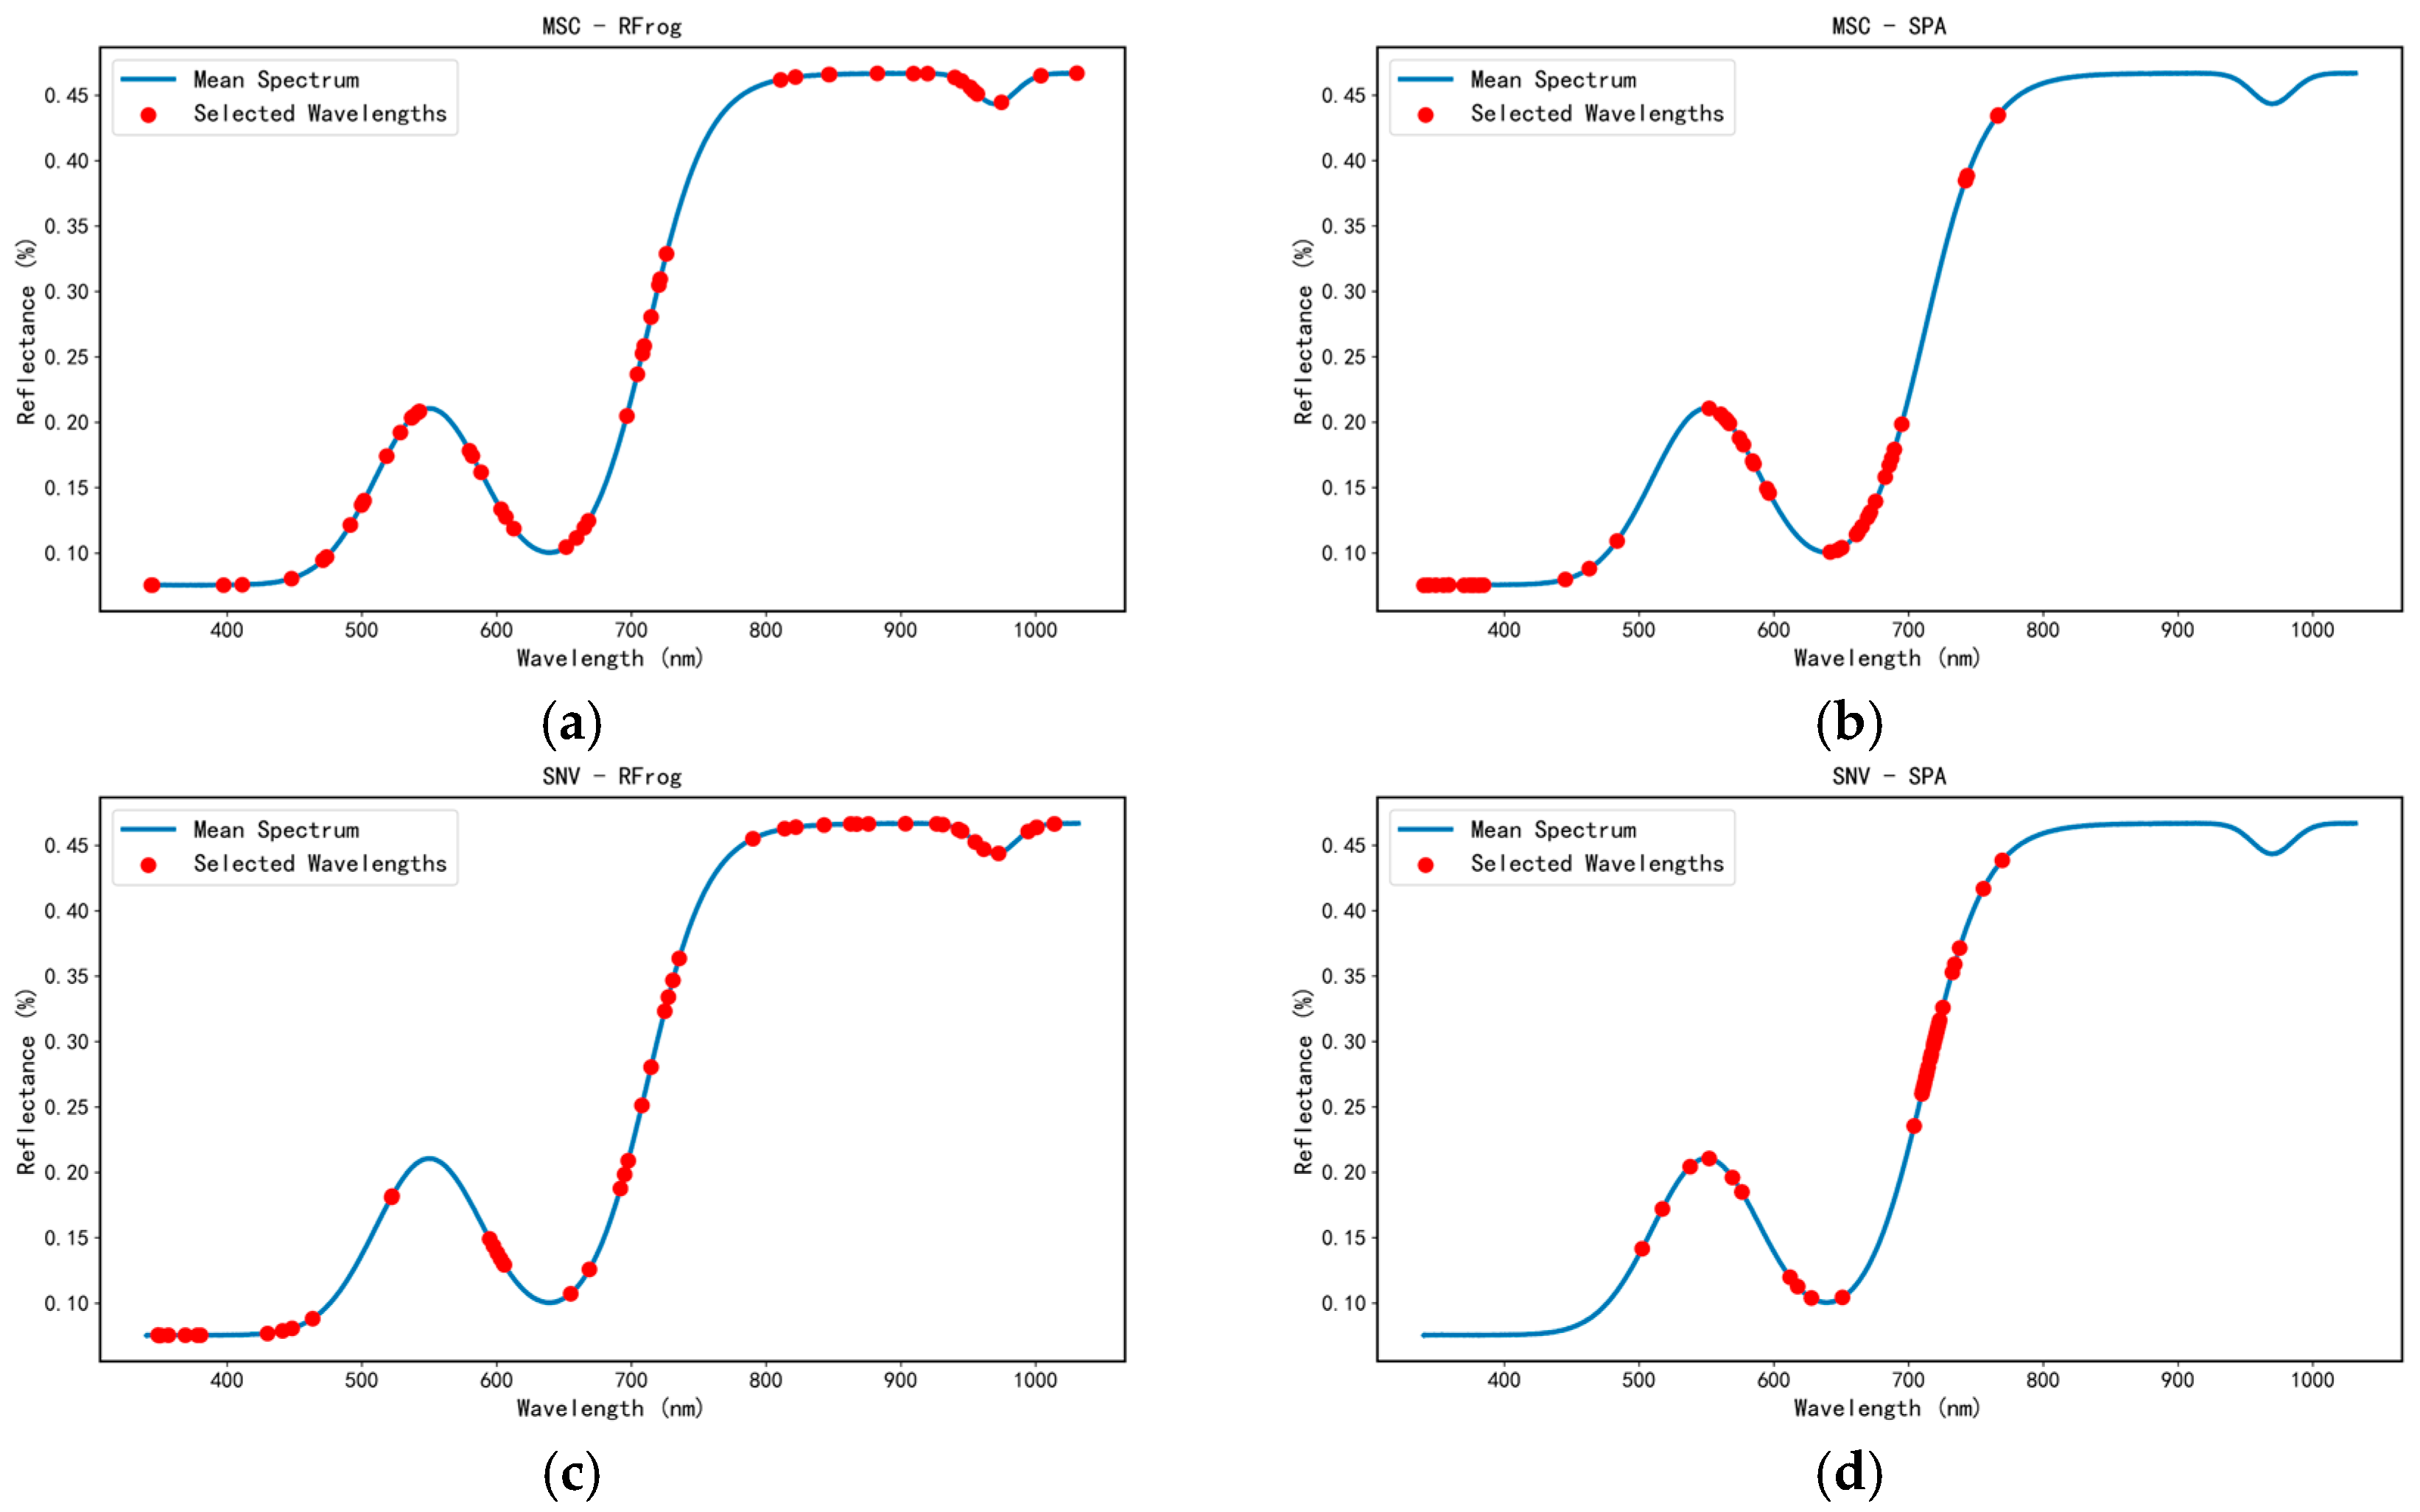
As shown in
Figure 7, the characteristic wavelengths extracted by SPA exhibited strong local clustering. In the SNV-SPA combination, a large number of selected wavelengths were highly concentrated around 710–730 nm. This region corresponds to the critical red-edge region of the plant spectrum. The “blue shift” or “red shift” of the red-edge position is widely recognized as a sensitive indicator of plant health status, chlorophyll concentration, and nutrient stress [
31]. When tomato seedlings are deficient in N, P, or K, chlorophyll synthesis is directly inhibited, resulting in leaf chlorosis or structural alterations, which in turn cause pronounced reflectance variations within this wavelength range.
In the MSC-SPA combination, the selected wavelengths were mainly distributed within 350–400 nm and 550–680 nm (visible region), corresponding to the strong absorption bands of chlorophylls and carotenoids [
32]. By minimizing collinearity among selected variables, the SPA algorithm effectively captured the most significant spectral features associated with pigment alterations and cellular structural changes induced by nutrient deficiencies.
In contrast to SPA, the RFrog algorithm performs global optimization based on probabilistic sampling, leading to a broader and more dispersed distribution of selected wavelengths across the entire scanned spectrum. In addition to covering the visible and red-edge regions, RFrog extracted numerous key wavelengths in the near-infrared region (e.g., 875.93 nm, 956.6 nm, and 1000.89 nm). The near-infrared spectrum primarily reflects overtone and combination vibrations of hydrogen-containing functional groups (such as C–H, O–H, and N–H). Nitrogen is a core component of plant proteins and nucleic acids (associated with N–H bonds), while deficiencies of P and K can severely disrupt the cellulose framework of the cell wall and affect leaf water metabolism (associated with C–H and O–H bonds), thereby producing detectable spectral variations in the NIR region.
Significant differences in characteristic wavelength distributions arise from the distinct variable selection mechanisms of the utilized algorithms. Based on random walk and probability sampling, the RFrog algorithm evaluates variable importance through repeated random sampling. Consequently, it tends to select multiple potentially contributing wavelengths across the entire spectrum. These selected features include visible bands related to chlorophyll absorption, as well as near-infrared spectral information reflecting leaf water content, cell structure, and organic chemical bond vibrations. In contrast, SPA selected fewer characteristic wavelengths in the near-infrared region due to its variable selection mechanism. SPA strictly minimizes multicollinearity. Because Vis-NIR features comprise broad, highly overlapping overtone bands with severe collinearity, SPA inherently removes redundant variables after selecting highly representative wavelengths in the visible or red-edge regions, resulting in a highly clustered selection pattern. Therefore, the wide range of characteristic wavelengths detected by different algorithms reflects a comprehensive spectral response to tomato nutrient stress across multiple physiological levels, including leaf pigments, cell structure, and water status.
3.5. Model Evaluation Based on Selected Feature Wavelengths
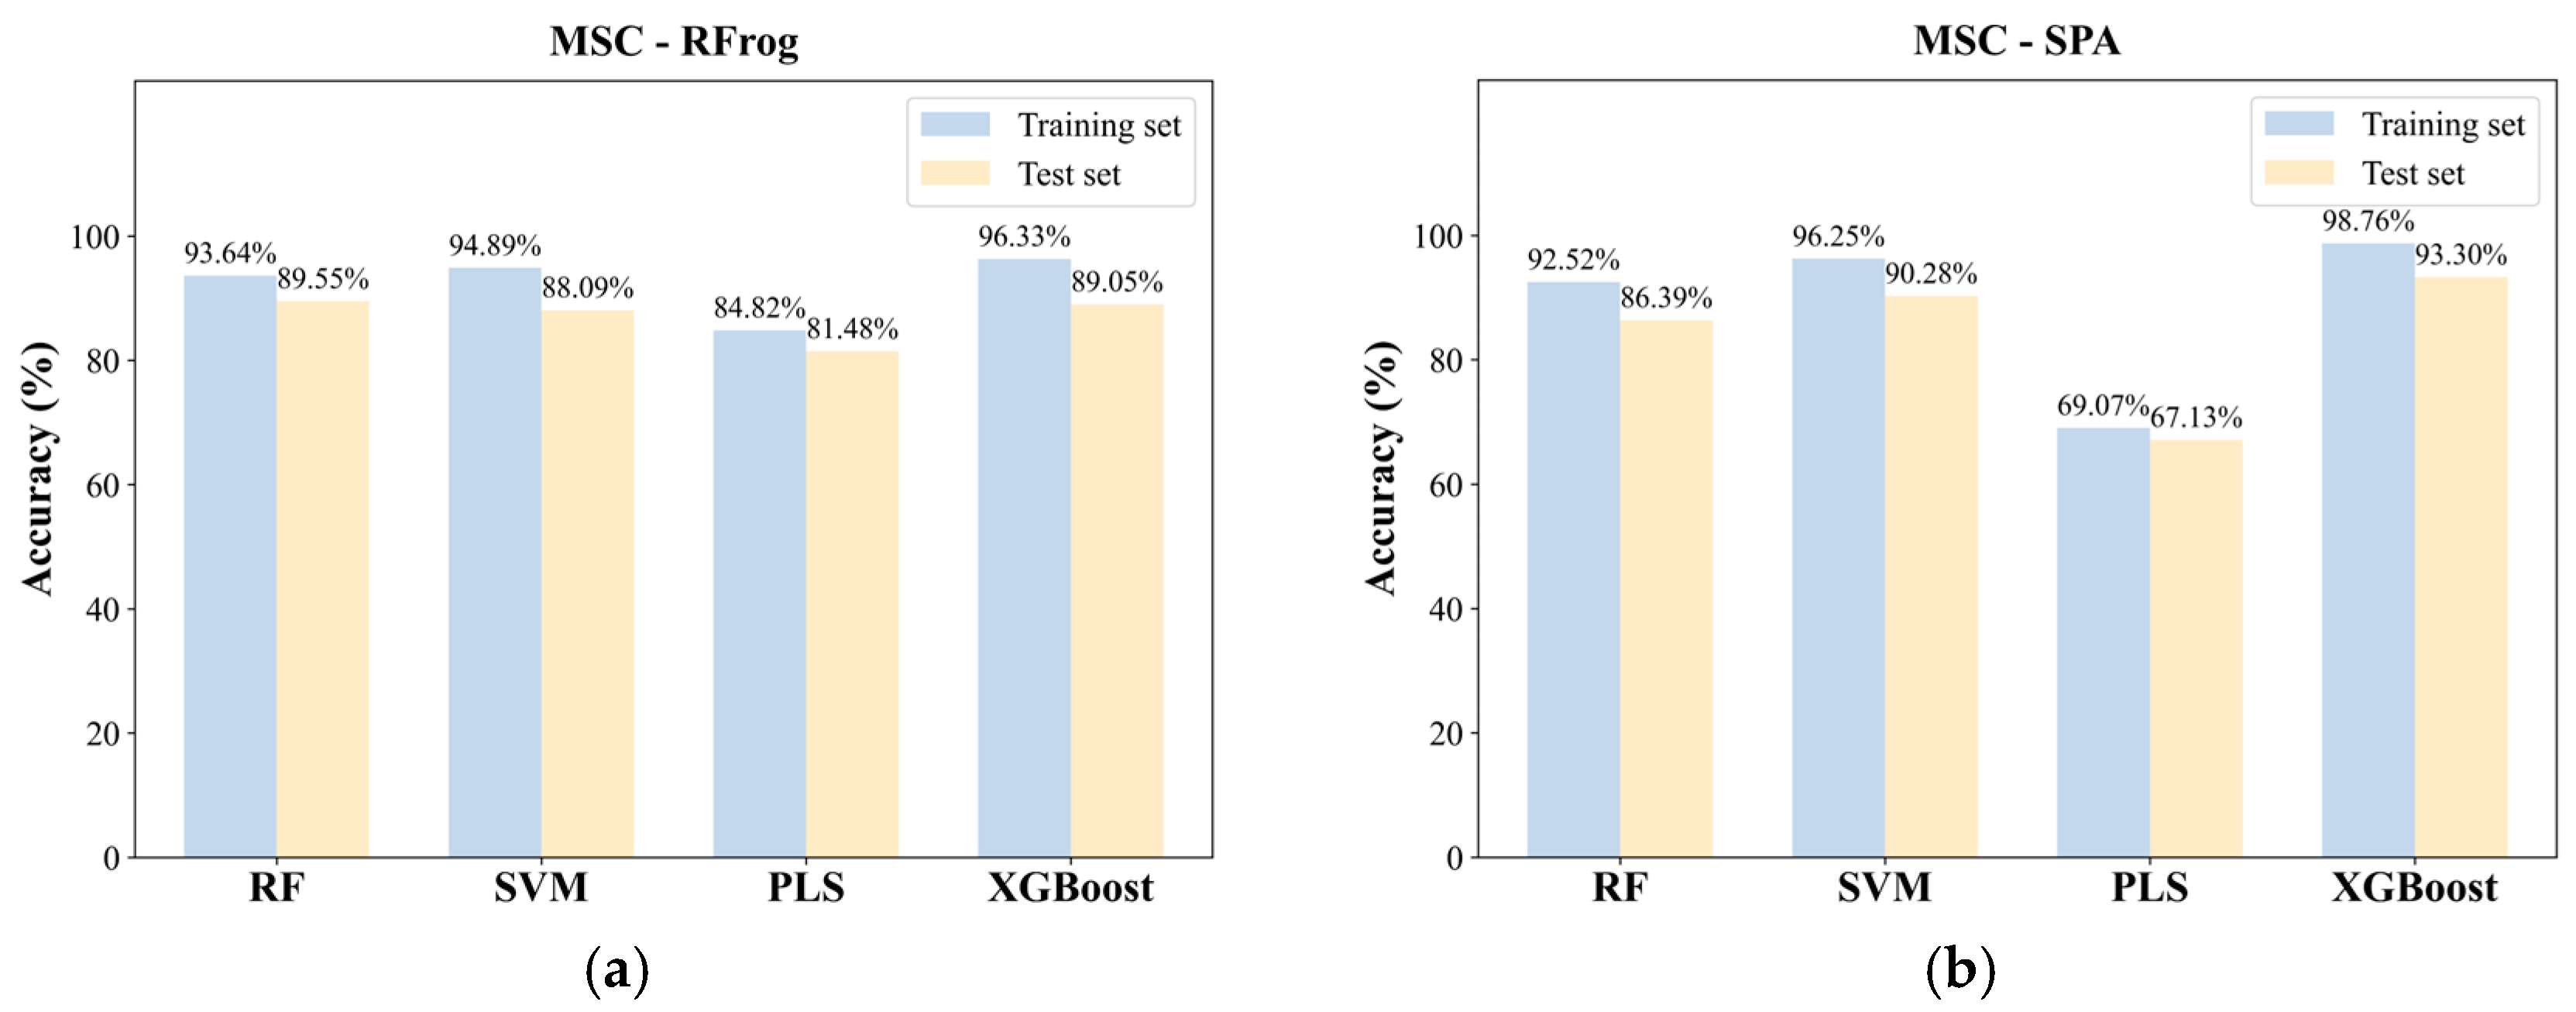
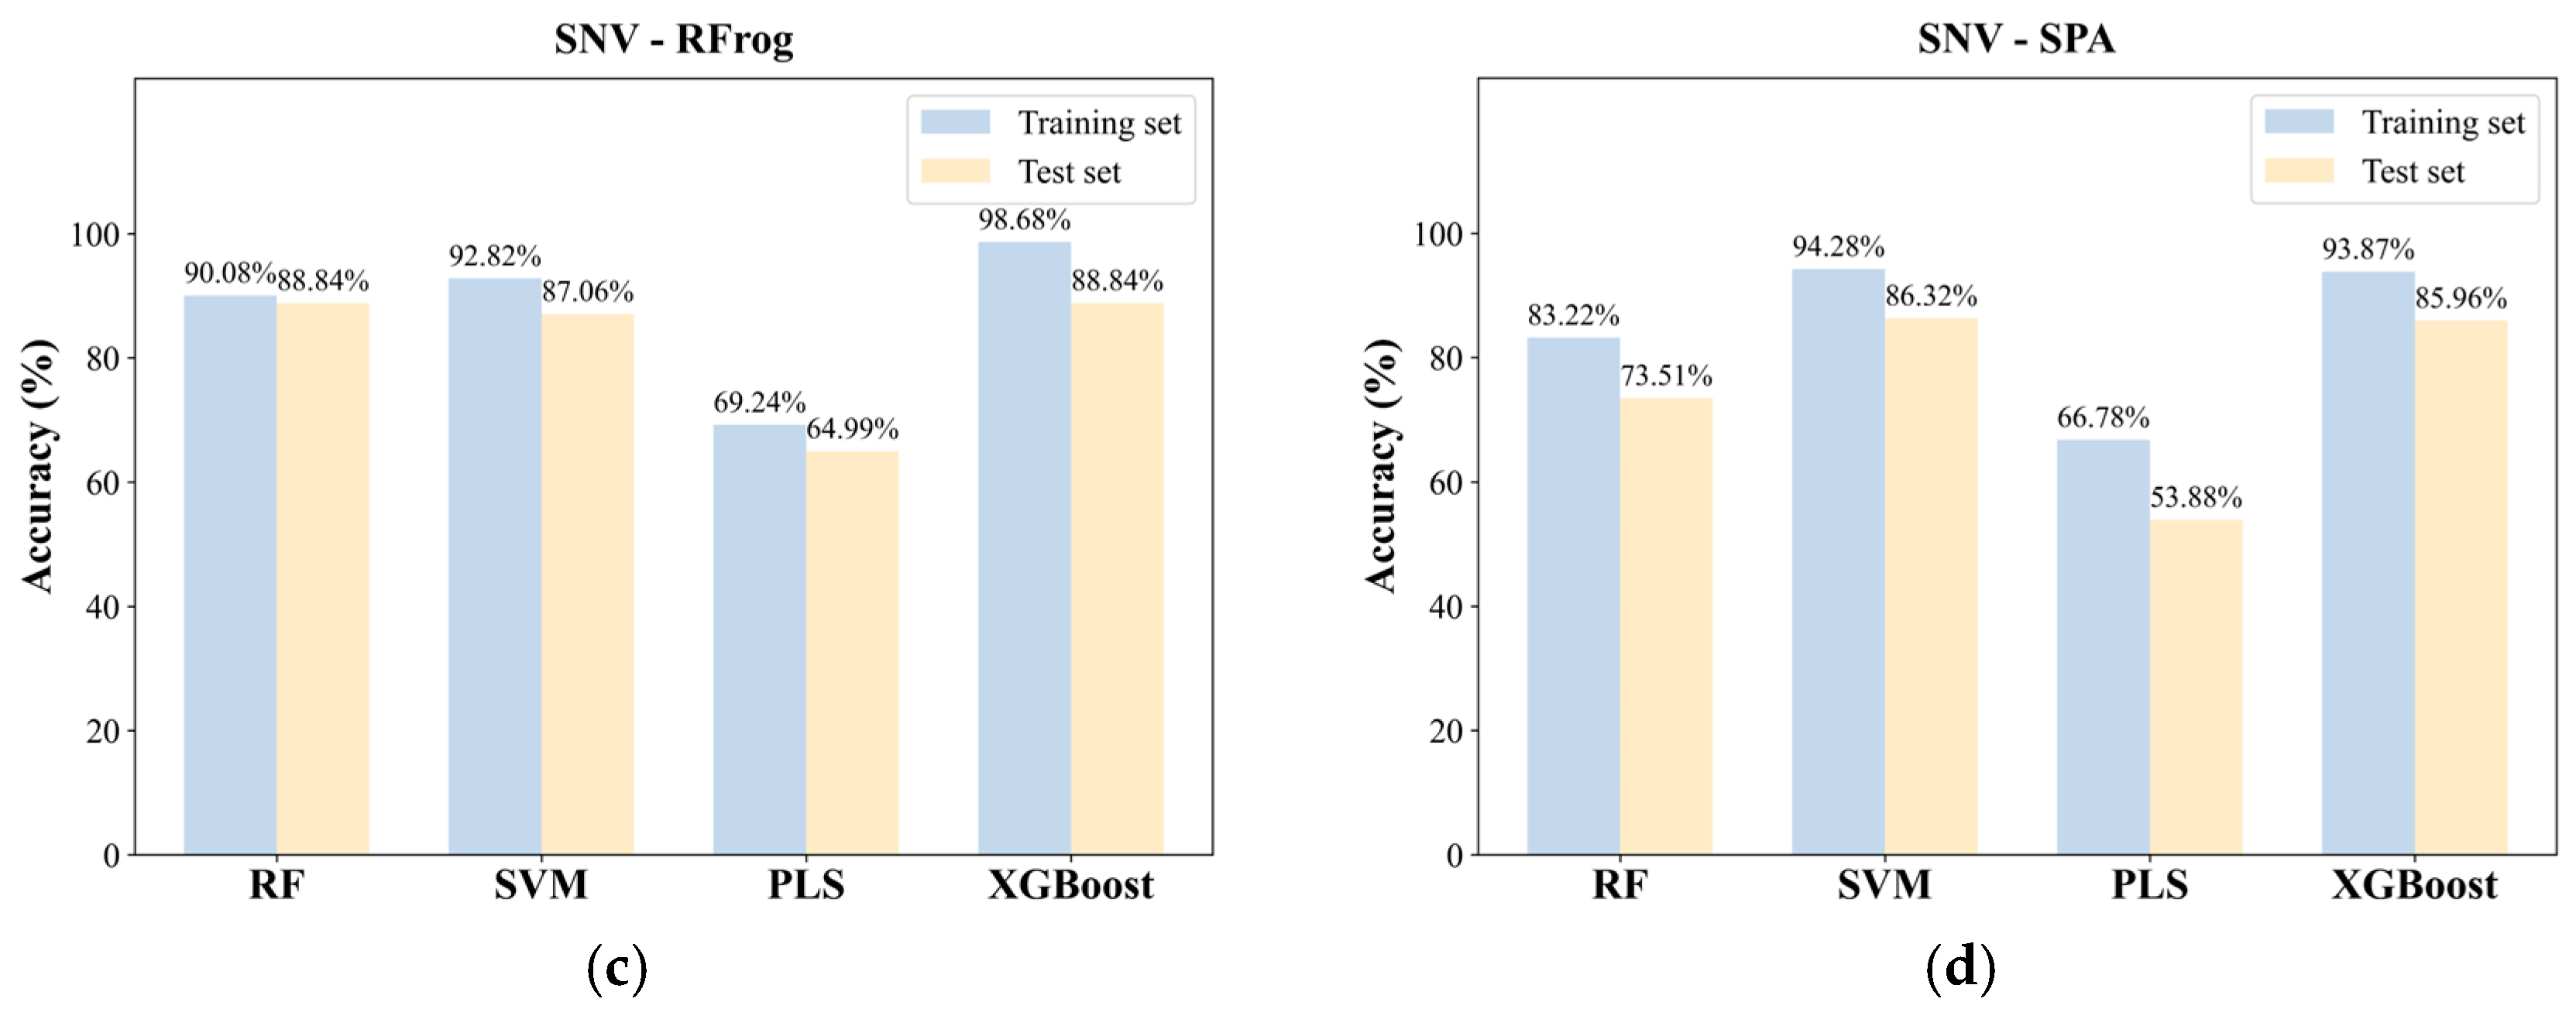
After feature wavelength selection, this study further evaluated the classification performance of each model and compared the results with those obtained using full-spectrum data. The classification performances of four models—SVM, RF, PLS and XGBoost—under two preprocessing methods (SNV and MSC) combined with two feature wavelength selection methods are presented in
Figure 8.
Compared with the full-spectrum models, those utilizing feature wavelength selection generally exhibited higher classification accuracies, indicating that appropriate feature selection can effectively eliminate redundant variables and enhance the model’s sensitivity to key spectral regions. Specifically, the MSC-XGBoost model saw its cross-validation accuracy increase significantly from 81.82% (full-spectrum) to 93.30% after SPA feature selection. Similarly, the SNV-XGBoost model’s accuracy rose from 73.07% to 85.96%, and the MSC-SVM model improved from 78.34% to 90.28% following the same procedure. These results demonstrate that feature wavelength selection effectively bolsters the model’s ability to characterize essential spectral features by mitigating redundant information and noise interference, thereby significantly optimizing discriminatory performance.
Despite the extensive use of conventional vegetation indices (e.g., NDVI, PRI, and OSAVI) to evaluate plant growth and physiological status, their suitability for the fine-grained classification of specific nutrient deficiencies in tomato seedlings requires further investigation. In this study, we calculated these indices—both individually and in combination—using MSC- and SNV-pre-processed spectra. These indices served as input features for an XGBoost-based hierarchical classification model, following the same architecture as our proposed method. The corresponding experimental results are summarized in
Table 6.
As shown in
Table 6, individual traditional indices performed poorly in identifying the 10 categories of single nutrient stress, yielding cross-validation accuracies of only 27–55%. Even when combining the three indices under the optimal MSC pre-processing condition, the model’s highest recognition accuracy reached only 75.73%, which remains significantly lower than that of the SPA-based characteristic wavelength extraction method (93.30%). The primary reason for this performance discrepancy is that leaves suffering from different types of nutrient deficiencies macroscopically exhibit similar chlorosis or reflectance alterations. This phenomenon of “overlapping symptomatology” easily leads to information redundancy and insufficient discriminative capability in traditional indices constructed from limited wavebands. In contrast, by extracting key characteristic wavelengths across the entire spectral range, the proposed method leverages abundant spectral information to more effectively capture the spectral responses associated with changes in leaf physiological status and internal structure. Therefore, for fine-grained, multi-class nutritional status recognition tasks, the method based on full-spectrum feature extraction demonstrates superior classification performance and broader applicability.
3.6. Comparison Between Hierarchical Framework and Flat Classification
To further validate the necessity and superiority of the proposed hierarchical architecture, a standard flat classification model was implemented as a benchmark. In this flat approach, a single multi-class XGBoost model was trained using the same 50 SPA-selected characteristic wavelengths to directly categorize all 10 nutrient stress classes simultaneously.
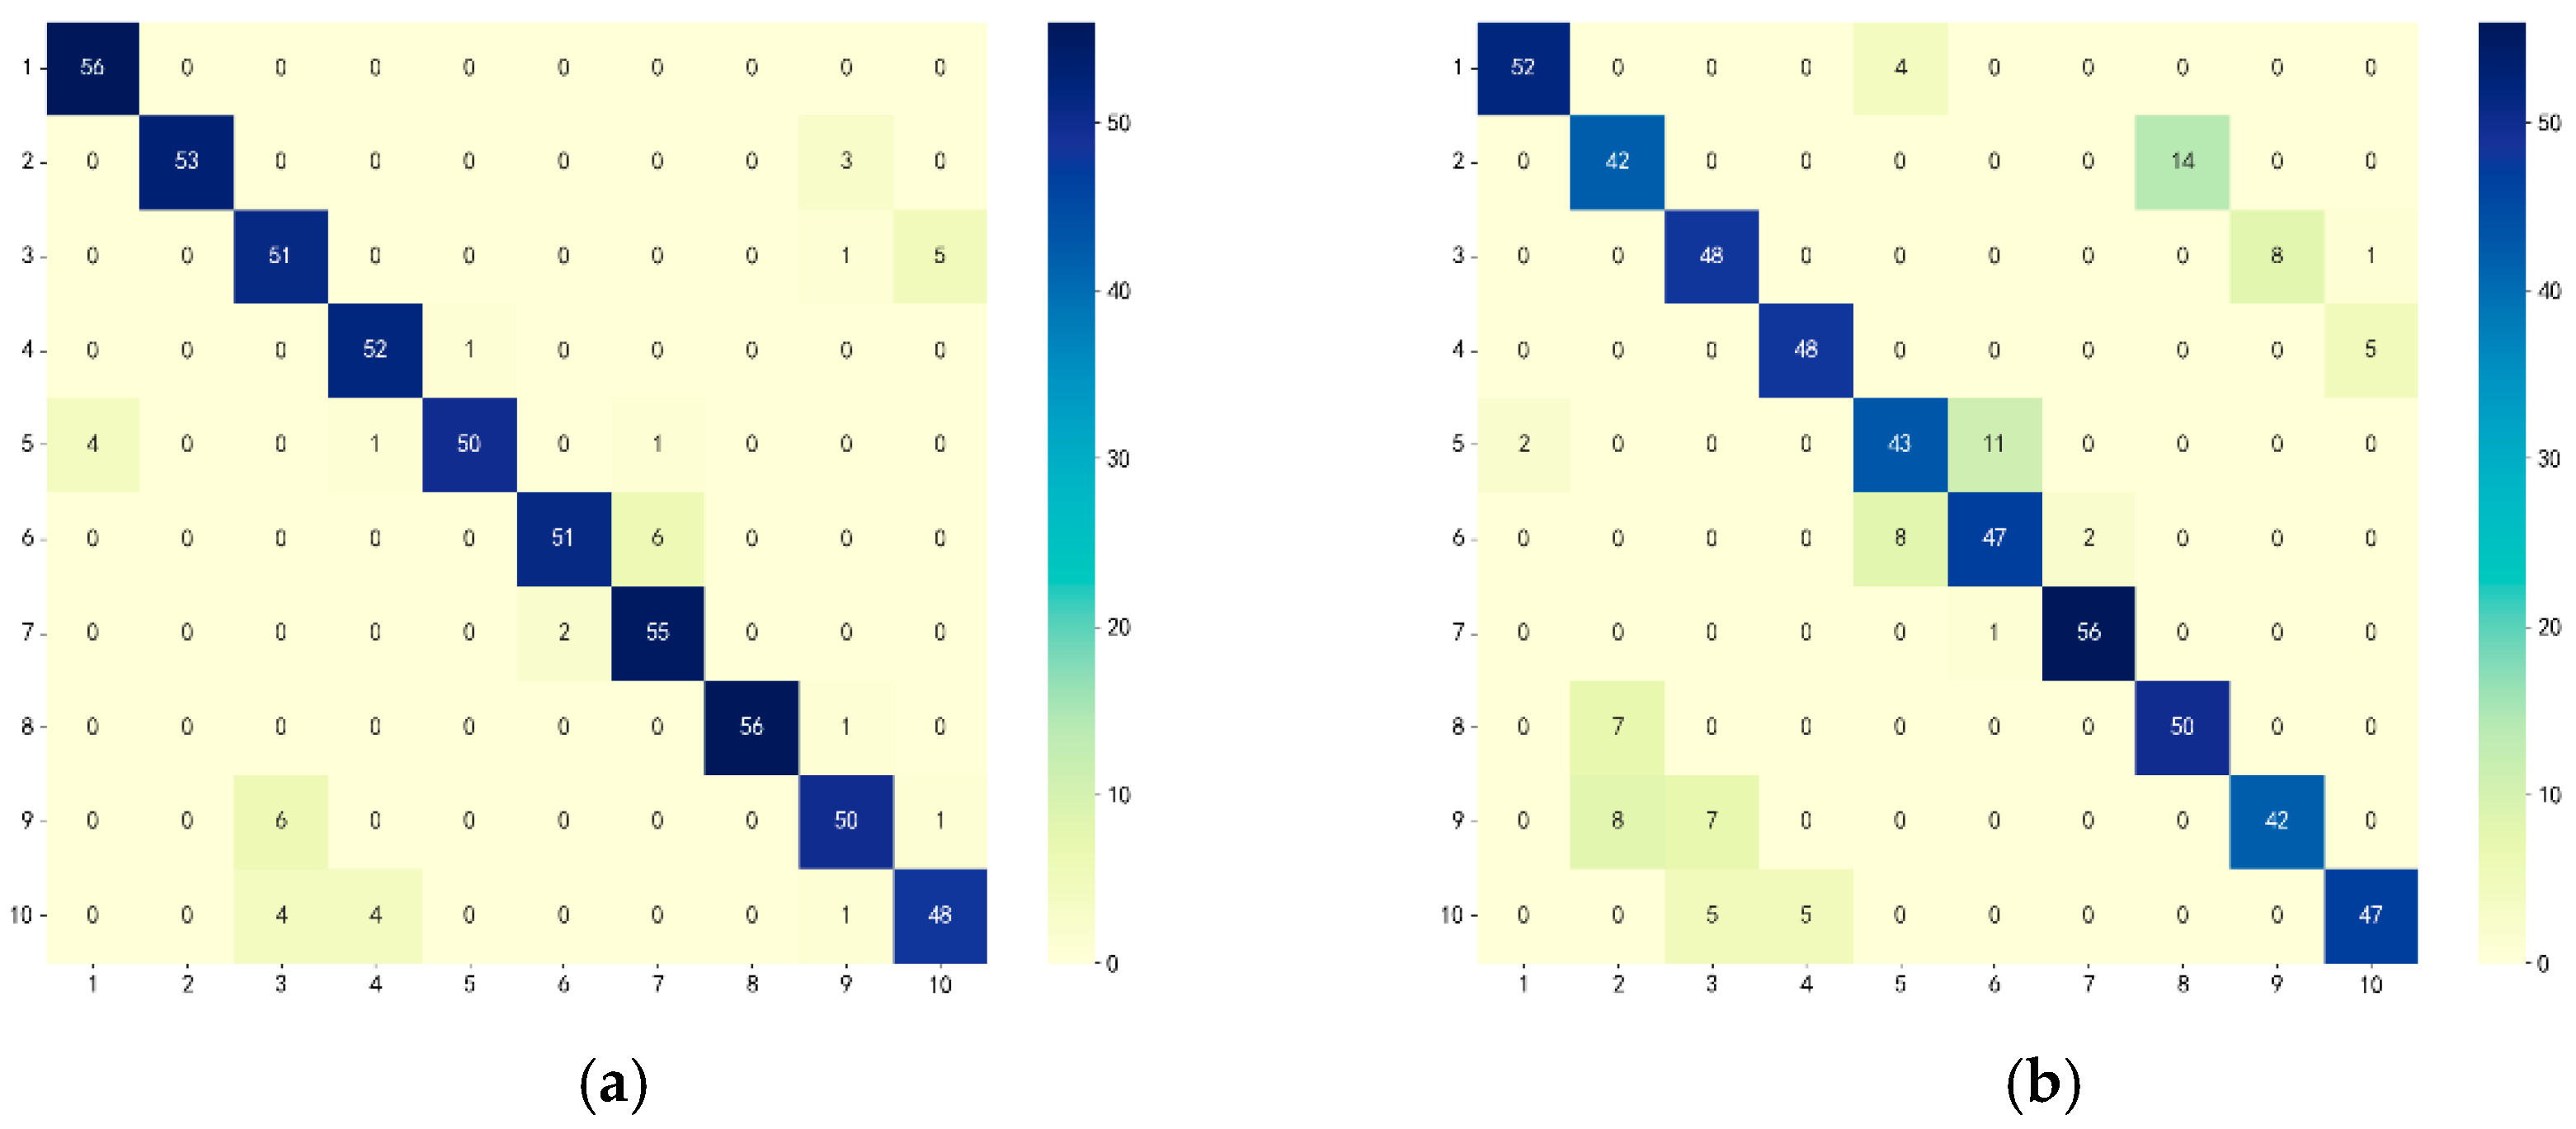
Figure 9 illustrates the performance comparison between the proposed hierarchical framework and the standard flat model on the independent test set.
As shown in
Figure 9a, the proposed hierarchical framework exhibited stronger diagonal dominance, indicating that most samples were correctly classified. In contrast, the flat classification model in
Figure 9b showed more off-diagonal distributions, suggesting increased confusion among nutrient stress categories.
Specifically, the flat classification strategy exhibited obvious confusion between adjacent deficiency levels within the same nutrient type, such as N50–N100, P50–P70, and K50–K70. By comparison, the hierarchical framework effectively reduced these misclassifications by first separating nutrient types and subsequently identifying stress severity within each category.
Furthermore, most remaining errors in the hierarchical framework occurred between neighboring deficiency gradients of the same nutrient element rather than between different nutrient types. This result is biologically reasonable because adjacent stress levels often produce similar physiological and spectral characteristics.
Overall, the results demonstrate that the proposed hierarchical classification framework provides better discrimination capability and lower inter-class confusion than conventional flat multi-class classification.
3.7. Statistical Evaluation and Model Robustness Analysis Based on Bootstrapping
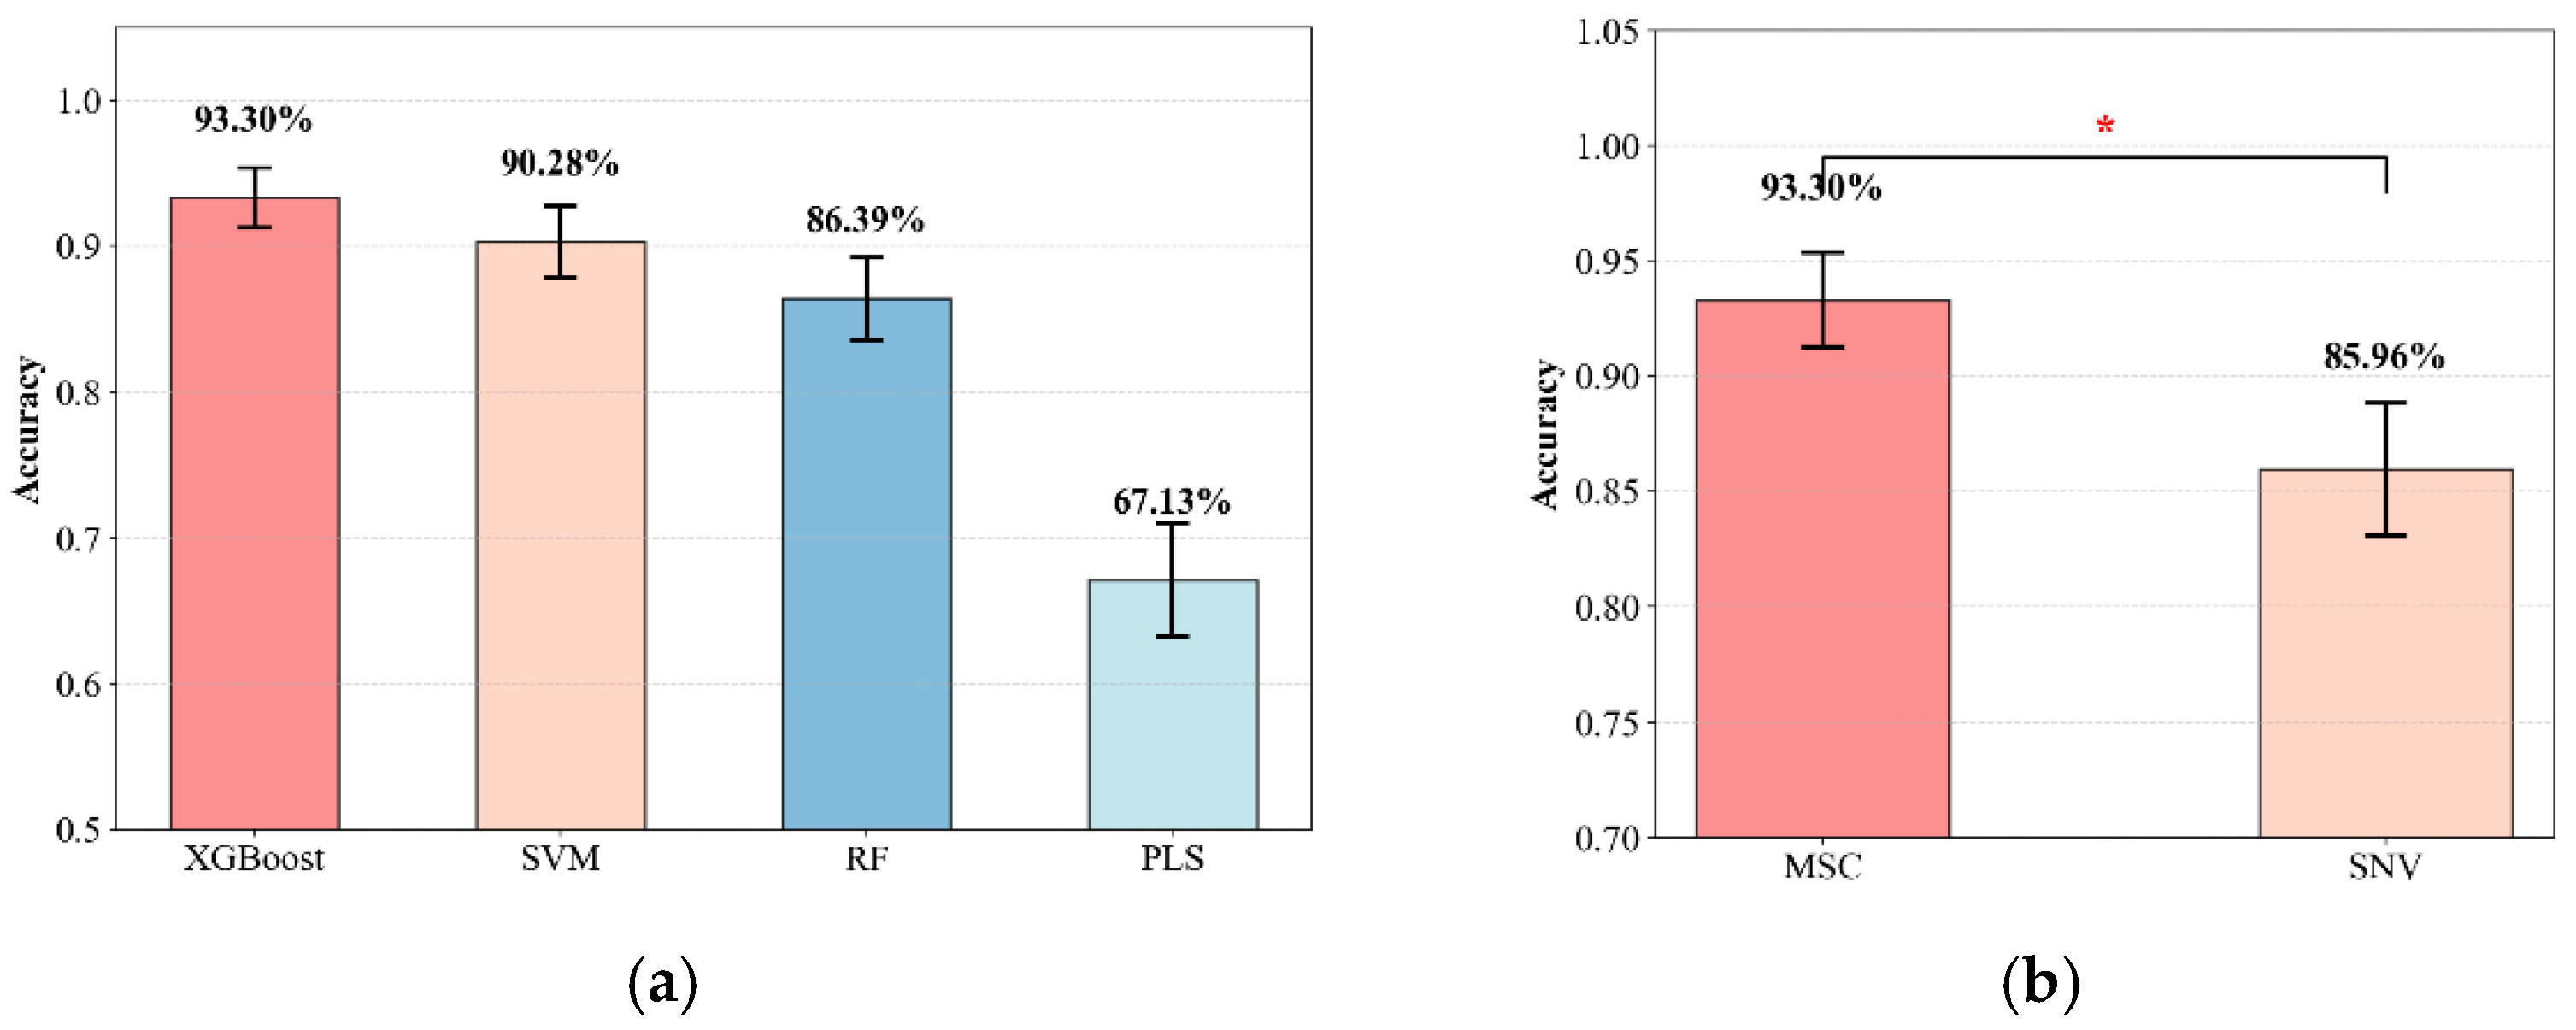
To further assess the stability and statistical reliability of the models, a bootstrap resampling strategy was applied to the independent test set. Specifically, 1000 iterations of sampling with replacement were conducted to estimate the 95% confidence intervals (CIs) of classification accuracy.
As shown in
Figure 10a, the proposed hierarchical XGBoost model achieved the best performance, with an accuracy of 92.74% and a relatively narrow 95% confidence interval of [0.9024, 0.9436]. The narrow CI indicates that the model maintains good stability and consistent performance under different sampling conditions. In comparison, the SVM model achieved an accuracy of 88.52% with a 95% CI of [0.8583, 0.9073], while the RF model yielded an accuracy of 83.79% with a CI of [0.8056, 0.8622]. The PLS-DA model exhibited the lowest performance, with an accuracy of 64.28% and a relatively wide confidence interval of [0.6125, 0.6901], indicating limited classification capability and poor robustness. These results demonstrate that the proposed hierarchical strategy outperforms conventional machine learning models in terms of both accuracy and stability. Furthermore, the impact of different preprocessing methods on model performance is illustrated in
Figure 10b. The MSC preprocessing method achieved the best results, with an accuracy of 92.74% and a tight confidence interval of [0.9024, 0.9436]. In contrast, the SNV preprocessing method resulted in a lower accuracy of 83.36%, with a wider confidence interval of [0.8209, 0.8583], indicating reduced stability. To rigorously confirm the superiority of MSC, a McNemar’s test was conducted, yielding a
p-value of less than 0.05 (
p < 0.05). This statistically significant difference is denoted by the asterisk (*) in
Figure 10b. Overall, the combination of MSC preprocessing, feature wavelength selection, and hierarchical XGBoost modeling not only achieves superior classification accuracy but also demonstrates enhanced stability and reliability.
4. Discussion
This study investigated the technical feasibility of classifying spectral responses associated with N, P, and K nutrient stress treatments in tomato seedlings using Vis-NIR spectral reflectance. Leaf reflectance was measured with a near-infrared spectrometer covering the wavelength range of 340–1032 nm. By applying different preprocessing and feature selection methods, comparative analyses were conducted to establish and evaluate classification models for distinguishing nutrient stress treatment groups and their corresponding stress levels in tomato seedling leaves.
In this study, nutrient supply was considered as the sole experimental variable. Therefore, the developed models can only qualitatively describe the nutritional stress status of tomato seedlings and are not capable of providing precise or quantitatively measurable references for the degree of nutrient stress.
In terms of spectral response characteristics, significant reflectance variations were observed in the visible region (400–700 nm) and the red-edge region (approximately 710–730 nm) in this study. This aligns closely with existing literature. Mahajan et al. [
33] indicated that hyperspectral reflectance in the visible and red-edge regions is highly sensitive to changes in plant chlorophyll content and nutrient stress. The elevated reflectance near 550 nm and the alterations in the red-edge region observed in our research primarily stem from decreased chlorophyll content and inhibited photosynthesis.
In terms of feature extraction, the SPA method effectively isolated critical wavelengths and removed redundancy from the full-spectrum data. Under SNV and MSC pre-processing, the SPA-selected wavelengths clustered mainly in the visible and red-edge regions, closely aligning with recent literature. For example, studies on greenhouse tomato nutrition have confirmed that sensitive bands linked to plant nutrients and photosynthetic pigments are largely found in these regions, as they directly capture the dynamics of chlorophyll absorption [
34]. Additionally, our feature selection-based models outperformed full-band modeling approaches. By filtering characteristic wavelengths through SPA, the multicollinearity within the models was significantly reduced.
The superior performance of the MSC-SPA-XGBoost framework may be attributed to the complementary advantages of each component. MSC reduced spectral scattering effects and improved spectral consistency, while SPA removed redundant wavelengths and reduced multicollinearity in the spectral data. In addition, XGBoost provided nonlinear classification capability for distinguishing subtle spectral differences among different nutrient stress treatment groups. Therefore, the combination of these methods improved both feature quality and classification performance.
Regarding model performance, the proposed MSC-SPA-XGBoost model attained a classification accuracy of 92.74% on the independent test set, exhibiting a distinct superiority over traditional vegetation indices (e.g., NDVI, PRI, and OSAVI). Notably, this independent test result is highly consistent with the average accuracy obtained during the 10-fold cross-validation phase (93.30%). This minimal discrepancy between the cross-validation and independent test results indicates good statistical consistency and suggests that the model is not severely overfitted to the training data under the current dataset. Although N and K deficiencies may exhibit partially similar visual symptoms and physiological responses, the confusion matrix analysis showed only limited misclassification between these categories. This suggests that the proposed hierarchical framework was still able to capture subtle discriminative spectral differences between different nutrient stresses. As noted by Xue et al. [
35], while conventional indices perform well in estimating vegetation coverage and chlorophyll, they frequently suffer from information saturation and poor discriminability under complex stress scenarios. Consistent with this, our findings show that single indices achieve low recognition accuracy for the 10 stress classes. Even the integration of multiple indices significantly underperforms compared to characteristic wavelength extraction. Fundamentally, the macroscopic phenotypic similarity among different nutrient deficiencies renders indices derived from restricted bands incapable of resolving overlapping symptoms. Conversely, by combining full-spectrum data with targeted feature selection, our approach captures a more holistic physiological profile of the leaves, yielding effective discriminative capability for the current classification task.
Furthermore, Qi et al. [
36] demonstrated the potential of NIR spectroscopy for nutrient-related spectral analysis in agricultural systems. Building upon this, our research applied SPA to effectively distinguish highly overlapping spectral responses among different nutrient stress treatment groups in tomato seedlings. Similarly, Zhu et al. [
37] and Dong et al. [
38] proved the efficacy of combining NIR spectra with feature selection and machine learning for rapid non-destructive detection. Compared to standard classification models that often face bottlenecks with high-dimensional spectral data, our hierarchical XGBoost strategy, refined by MSC and SPA, achieved a remarkably high accuracy of 92.74%. This structure practically serves as an ‘early termination’ mechanism that prevents unnecessary downstream computations, significantly saving computational costs. This highlights the effective performance for nutrient stress treatment classification under controlled greenhouse conditions.
5. Conclusions
This study primarily focused on a qualitative hierarchical classification framework rather than direct quantitative regression modeling. This strategic scoping was guided by two primary factors. First, from the perspective of experimental design, the dataset was constructed to capture early-stage discrete stress treatment groups (i.e., identifying specific deficiency types) to support rapid corrective actions in precision fertilization, which prioritized a categorical decision-making approach. Consequently, the continuous concentration gradients across a broader, more uniform distribution required for robust non-linear deep regression were naturally constrained by the categorical treatment setup. Second, NIR spectroscopy is heavily driven by chemical bonds (such as C-H, N-H, and O-H), making direct quantitative estimation of macromolecules or specific ions complex under multi-nutrient stress conditions where spectral bands overlap intricately. However, transitioning from this qualitative classification to a high-precision quantitative estimation model represents a promising future direction. Therefore, future research will expand the experimental design to include broader and more continuous nutrient gradients and further explore regression-based modeling strategies for quantitative estimation of tomato nutrient status.
The controlled environment was essential to mitigate external noise and build robust links between spectral signatures and nutritional stress. Moving forward, this technique can be adapted for on-site greenhouse monitoring via handheld spectrometers fitted with leaf clips. These instruments allow for direct, non-destructive scanning of intact leaves, enabling rapid assessment of nutrient stress treatment responses in tomato seedlings.
Although the current models demonstrated good performance in classifying single nutrient stress treatment conditions—successfully capturing subtle spectral differences even between highly similar stresses such as N and K—it must be acknowledged that this high accuracy was achieved under controlled laboratory conditions. Such environments inherently exclude practical field noises, particularly dynamic lighting variations, which can significantly alter spectral data quality. Crops in practical cultivation environments are often subjected to complex conditions involving multiple nutrient deficiencies simultaneously. In addition, this study was conducted using a single tomato cultivar at a specific growth stage, and the spectral responses to nutrient stress may vary among different cultivars and developmental phases due to genetic and physiological differences. Deficiencies of different nutrients may produce overlapping or interactive spectral response characteristics, which could interfere with identification accuracy. Therefore, future research will focus on validating the proposed framework at a field scale, investigating the response mechanisms and feature extraction strategies of near-infrared spectroscopy under multi-element deficiency conditions, while also validating across multiple tomato cultivars and diverse growth stages to improve its robustness and generalizability in practical agricultural applications.