Article

Agroforestry-Based Nature Actions for Climate Change Mitigation Through Soil Carbon Storage in Zamora Chinchipe


1
Facultad de Ciencias Exactas y Naturales, Universidad Técnica Particular de Loja, Loja 110107, Ecuador
2
Alumni-Carrera de Biología, Universidad Técnica Particular de Loja, Loja 110107, Ecuador
3
Programa de las Naciones Unidas para el Desarrollo (United Nations Development Programme), PROAmazonía-Pago Por Resultados REDD+, Quito 170135, Ecuador
4
Ministerio de Ambiente, Agua y Transición Ecológica, Quito 170525, Ecuador
5
Ministerio de Agricultura y Ganadería, Quito 170516, Ecuador
*
Author to whom correspondence should be addressed.
Agronomy 2026, 16(10), 967; https://doi.org/10.3390/agronomy16100967
Submission received: 5 April 2026 / Revised: 6 May 2026 / Accepted: 11 May 2026 / Published: 13 May 2026
(This article belongs to the Section Farming Sustainability)

Abstract

Agroforestry systems are a sustainable strategy for climate change mitigation by enhancing carbon sequestration in agricultural soils, particularly in regions like Zamora Chinchipe, where they improve soil resilience and productivity in deforested landscapes. This study evaluated soil carbon storage under different land-use systems—forest, cacao monoculture, cacao-based agroforestry, and coffee-based agroforestry—as a climate change mitigation strategy. Data were collected from cacao and coffee producers regarding crop management practices on their farms. Soil samples were collected at a depth of 20 cm and analyzed for bulk density (BD), pH, soil organic matter (SOM), and carbon stocks. Land-use systems showed that coffee-based agroforestry stored 101.22 Mg ha−1 of carbon and cacao-based agroforestry 71.55 Mg ha−1, both exceeding values observed in cacao monoculture and even forest systems. These results suggest that cacao and coffee agroforestry systems have a greater capacity for carbon sequestration compared to monoculture systems. However, the contribution of forests should not be underestimated, as these findings are based only on the surface soil layer, which limits a comprehensive assessment of the full carbon storage potential of forest ecosystems in Zamora Chinchipe. Agroforestry systems emerge as viable and sustainable alternatives for soil carbon storage, as they integrate trees and crops, promoting long-term carbon sequestration in soils.

1. Introduction

Climate change mitigation is one of the major global challenges and requires the implementation of effective, integrated, and sustainable strategies aimed at reducing greenhouse gas (GHG) emissions and enhancing carbon sequestration in terrestrial ecosystems [1]. In this context, agroforestry systems have become a viable and widely recognized land-use option for carbon capture and storage in both aboveground biomass and agricultural soils, particularly in tropical and subtropical regions such as Zamora Chinchipe Province, located in the southern Ecuadorian [2].
The integration of trees with crops and, in some cases, livestock components within a single management system not only enhances agricultural productivity but also strengthens ecosystem services related to climate change mitigation. These services include carbon sequestration, reduced emissions associated with land-use change, and improved land-use efficiency [3,4]. However, the adoption of agroforestry systems continues to face significant constraints, including limited technical capacity, restricted market access, weak community organization, and insufficient institutional support, which may compromise their long-term sustainability and effectiveness [5]. These challenges are particularly pronounced in Amazonian rural landscapes such as Zamora Chinchipe, where productive systems are strongly shaped by local biophysical and socioeconomic conditions.
From a biophysical perspective, agroforestry systems exhibit a high capacity to store carbon in both aboveground biomass and soils, positioning them as important CO2 sinks [6]. In particular, intensive silvopastoral systems have been shown to significantly increase carbon sequestration in soils and woody vegetation, while simultaneously reducing greenhouse gas (GHG) emissions and improving land-use efficiency [7]. In Amazonian regions such as Zamora Chinchipe, the presence of trees and shrubs within productive systems further enhances soil moisture conservation, temperature regulation, and forage quality, thereby reducing seasonal variability in agricultural and livestock production and increasing resilience to extreme climatic events [8].
Within the agroforestry sector of the province, perennial crops such as cacao and coffee play a key role in food security and local livelihoods, while also functioning as significant carbon sinks. Cacao-based systems have been reported to store between 17 and 19 Mg C ha−1 in aboveground biomass, depending on plantation age, tree density, and environmental conditions [9]. Similarly, shaded coffee systems show a high capacity for carbon capture and storage in both aboveground biomass and soils, with reported values ranging from 20 to 60 Mg C ha−1 when considering the biomass of shade trees and the coffee shrub layer. Soil carbon stocks in these systems may vary widely according to edaphoclimatic conditions and management practices, with reported values ranging from 33 to 64 Mg C ha−1 [10,11].
Despite the growing body of evidence highlighting the carbon sequestration potential of agroforestry systems, quantitative estimates of soil carbon stocks under cacao and coffee cultivation remain unavailable for Zamora Chinchipe Province. Existing studies in the region have primarily focused on páramo ecosystems, livestock systems, and forest environments, with limited attention to soil carbon dynamics in agricultural systems [12,13]. At the national level, information from the Ecuadorian Amazon is also scarce. For instance [14], Tinoco-Jaramillo et al. reported soil carbon stocks of 35.66 Mg ha−1 after five years of evaluation in the northern Amazon region. In contrast, the study by [15], conducted in provinces such as Orellana, Sucumbíos, and Pastaza, focused on soil physicochemical properties without directly assessing carbon stocks. Overall, these gaps highlight the limited availability of quantitative data on soil carbon storage in agroforestry systems in southern Ecuador, underscoring the need for site-specific studies in cacao and coffee systems under the edaphoclimatic conditions of Zamora Chinchipe.
Furthermore, information on the intensity of greenhouse gas (GHG) emissions associated with these production systems is virtually nonexistent [16]), despite the rapid expansion of cacao and coffee cultivation in the Andean–Amazonian transition zone. Taken together, this critical knowledge gap constrains a comprehensive assess-scale [17]. In this context, agroforestry systems are recognized as a key land-use strategy for enhancing carbon storage in both soils and biomass within agricultural landscapes affected by deforestation and land-use change. These systems promote the continuous incorporation of organic residues, reduce soil erosion, and improve soil physical, chemical, and biological properties, thereby facilitating the stabilization of soil organic carbon [18,19].
Accordingly, the objective of this study was to quantify soil organic carbon stocks across different agricultural land-use systems in Zamora Chinchipe and to evaluate their potential contribution to climate change mitigation. In addition, the study aimed to assess the greenhouse gas (GHG) emission intensity per unit of product in cacao (Theobroma cacao) and coffee (Coffea arabica) production systems. We hypothesized that: (i) soil organic carbon stocks vary significantly among land-use systems, with higher values expected in systems such as agroforestry and forests, and lower values in simplified systems such as monocultures, and (ii) crop type (cacao vs. coffee) significantly influences greenhouse gas emission intensity per unit of product. This study provides relevant insights into the role of agroforestry systems in enhancing soil carbon stocks and reducing greenhouse gas emissions, particularly in tropical regions such as Zamora Chinchipe.

2. Materials and Methods

2.1. Study Area

The study was conducted in Zamora Chinchipe Province, located in the southern Amazon region of Ecuador. The province is characterized by high biodiversity and extensive tropical forest cover, as well as by a pronounced altitudinal gradient and marked climatic and ecological heterogeneity [20]. In the study sites, elevation ranges between 800 and 2000 m a.s.l., corresponding to a transitional zone between tropical humid foothill forests and montane cloud forests. The region exhibits mean annual temperatures ranging from approximately 21 to 25 °C in valley areas and lower slopes, with decreasing values at higher elevations [21]. Annual precipitation is high and spatially variable; several regional studies and climatic records report mean annual rainfall between 2000 and 2500 mm year−1 across large areas of southern Ecuador and the adjacent eastern Andean foothills near Zamora Chinchipe [21].
The study area presents a mosaic of land-use types dominated by agricultural and extractive activities. Agriculture and livestock production constitute the main land-use practices at the local scale. Extensive cattle ranching occupies large parcels and grazing areas, driving forest cover conversion and alterations in landscape structure [12]. In contrast, cacao and coffee cultivation occurs under a range of management systems, from monocultures to diversified agroforestry systems [14]. In addition, the region is affected by mining activities, primarily small- and large-scale metallic mineral extraction [22].

2.2. Field Phase and Soil Sample Collection

Farm selection was conducted through engagement with local leaders and representatives of producer associations, including ACRIM, APECAP (coffee), and ASOPROMAS (cacao). Producer participation was voluntary, and priority was given to farmers interested in assessing soil conditions on their farms.
Sampling was carried out across diverse agroproductive systems distributed in several cantons of Zamora Chinchipe, using a stratified sampling design across four land-use systems with unequal sample sizes in which different land-use types were considered as analytical strata. Cacao- and coffee-based systems were included, accounting for the heterogeneity of land cover and land use within each production unit (Table 1).
In cacao farms, a total of 75 production units were evaluated (59 under monoculture and 16 under agroforestry systems), located primarily in the canton of Chinchipe. Two management types were distinguished: (i) agroforestry systems with shade-grown cacao and (ii) cacao monocultures without arboreal cover. Some farms contained forest remnants; however, others combined monoculture areas with plots under agroforestry systems.
Cacao farms (n = 59) located in Chinchipe, Yazatza, Zamora, exhibited an average planting density of approximately 1110 plants ha−1 (3 × 3 m spacing); however, depending on species associations within agroforestry systems, planting density may be considerably lower [14]. The use of synthetic fertilizers was limited or absent, as most farms held organic certification. The area allocated to cacao cultivation ranged from 0.5 to 5 ha. Plantation age generally ranged between 4 and 6 years, reflecting recent establishment trends in the province, although a smaller proportion of stands exceeded 20 years and were considered traditional or ancestral plantations.
In contrast, coffee farms (n = 30) located in Palanda canton were predominantly managed under agroforestry systems, combining coffee crops with shade trees and, in some cases, remnant forest patches. These forest fragments within farms are usually smaller, have been exposed to previous disturbances, and may exhibit alterations in species composition, as well as edge effects [26]. No coffee monoculture systems were identified in the evaluated areas.
The main coffee species cultivated was Coffea arabica L., including the varieties Catimor and Caturra [23]. Plantation age ranged from 2 to 9 years, with an average of approximately 4 years. Planting density averaged around 2500 plants ha−1 (2 × 2 m spacing), although some variability was observed among farms. Farm management was primarily based on organic fertilization practices, in accordance with certification requirements, while only a small proportion of farms reported the use of external inputs. Organic certification initiatives aim to improve the positioning of coffee and cacao, respectively, in specialized markets, where certification is often relevant due to the reduced use of external inputs such as synthetic fertilizers and agrochemicals, thus decreasing the associated emissions intensity in the supply chain [27].
A total of 25 farms with forest cover were also sampled. Not all production units contained forest remnants; however, in those where they persist, a high diversity of tree species was observed. This floristic composition reflects the structural and functional complexity of the forest remnants present in the study area. For each land-use type within each farm, a composite soil sample was collected from multiple subsamples randomly distributed within the corresponding sampling unit, at a depth of 0–20 cm using a soil sampling cylinder [16]. It is important to note that restricting sampling to the 0–20 cm layer may underestimate total soil carbon stocks, particularly in systems such as forests where a substantial proportion of carbon is stored in deeper soil horizons.
A total of 8 to 10 subsamples were collected per sampling and subsequently homogenized to generate a representative composite sample of the site. In addition, composite soil samples were collected for the estimation of soil organic carbon stocks; these samples were previously homogenized and prepared for laboratory analysis. All soil samples collected in the field were air-dried and subsequently sieved using a 2 mm mesh to remove coarse fragments and homogenize the material for physicochemical analyses.
The total area of each farm was determined using a Global Positioning System (GPS), Garmin, USA by recording the perimeter vertices of the productive units during field visits. Based on this information, a stratified sampling design was applied according to land-use type. Within each farm and for each identified stratum, one composite soil sample was collected, consisting of several subsamples randomly distributed within the corresponding sampling unit, in order to adequately represent the spatial variability of the soil.

2.3. Laboratory Analysis

Soil samples were processed at the Soil Laboratory of the Universidad Técnica Particular de Loja (UTPL) for the corresponding analyses. Soil bulk density was determined using the gravimetric method and calculated as the ratio between oven-dry soil mass and the total volume of the undisturbed sample (mass/volume). Soil pH was measured in a soil water suspension using a 1:2.5 ratio.
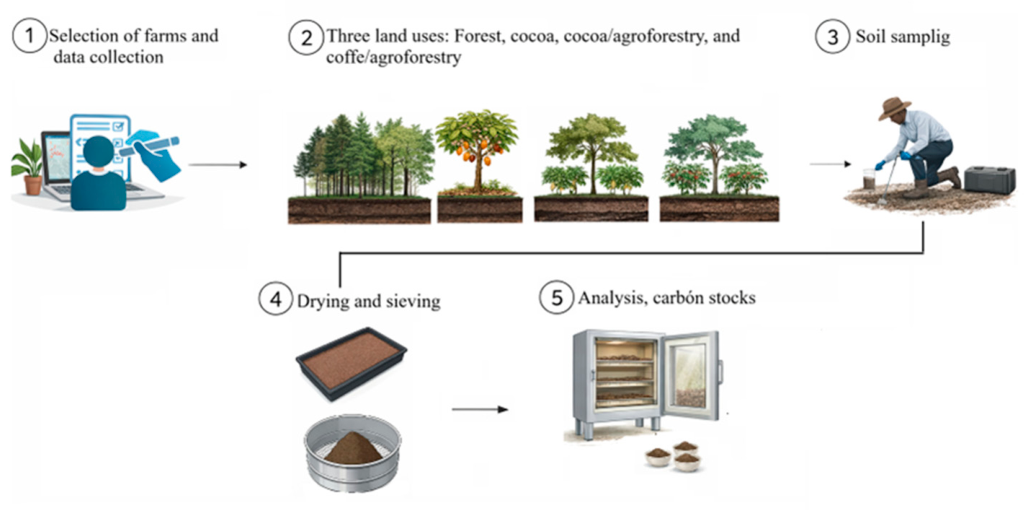
Soil organic matter content was determined using the calcination or loss-on-ignition method [28]. Soil organic carbon content was estimated from the organic matter content, assuming a conversion factor of 58% [29]. Soil carbon stocks were calculated based on carbon concentration, bulk density, and sampling depth (20 cm) (Figure 1), using the corresponding equation proposed by [30,31]. This calculation allowed carbon stocks to be expressed in units of mass per unit area (Mg ha−1), applying the appropriate conversion factor. The following formula was used:
S O C   M g   C   p e r   h a = %   C 100 × B D × D   10,000   m 2 h a
where
  • SOC = Soil carbon stock (Mg C ha−1);
  • C = Soil carbon content (%);
  • BD = Bulk density (Mg m−3);
  • D = Soil depth (cm);
  • m = meters;
  • ha = hectare;
  • Mg = megagrams (metric tons).
Figure 1. Diagrammatic representation of the methodological stages developed in the research conducted on the study farms in Zamora Chinchipe Province, Ecuador. The diagram sequentially summarizes the main steps of the study, including site selection, field sampling, laboratory analyses, and data processing and analysis.
Agronomy 16 00967 g001

2.4. Determination of Emission Intensity

To determine emission intensity per unit of product in agroforestry coffee systems and cacao systems (monoculture and agroforestry), primary data were collected from productive farms belonging to the ASOPROMAS and ACRIM associations, located in Zamora Chinchipe Province, during 2023, totaling 161 respondents. Data were collected at the farm level, considering production units dedicated to cacao and coffee cultivation. No differentiation was made between agroforestry systems, as in several cases the same farm simultaneously included areas under monoculture and agroforestry management. In this context, data were integrated and jointly analyzed at the farm scale. Data collection was conducted through structured surveys and field visits aimed at characterizing management practices, input use, annual production, and the biophysical conditions of the farms.
A farm-scale methodology was applied for estimating greenhouse gas (GHG) emissions, integrating site-specific information on agricultural management practices [32]. This methodology integrates emission factors specifically developed for tropical agricultural systems and is based on the guidelines of the Intergovernmental Panel on Climate Change (IPCC). It enables the estimation of greenhouse gas (GHG) emissions at the farm level, including those associated with the use of agricultural inputs, and defines a farm-gate system boundary, excluding post-harvest stages such as transport, processing, and commercialization.
In addition, the methodology accounts for carbon removals associated with biomass and soil pools, which are particularly relevant in agroforestry systems.
GHG total = ( E i × E F i )
where
Ei: activity or input (e.g., amount of fertilizer applied, residues incorporated, energy use).
EFi: corresponding emission factor (kg CO2-eq unit−1).
Emission intensity was calculated as the ratio between net GHG emissions (expressed in CO2 equivalents) and the quantity of product obtained [33,34].
E I = GHG net Y
where
EI = Emission intensity (kg CO2-eq kg−1 of product);
GHG_“net” = net emissions (kg CO2-eq ha−1);
Y = crop yield (kg ha−1).
The methodology was adapted by the United Nations Development Program (UNDP) for application in coffee and cocoa production systems (Table 2).

2.5. Data Analysis

Descriptive statistics were used to analyze total farm area and forest-covered area, employing percentages to describe the distribution and proportion of different land-use types within the study units. Data normality was assessed using the Kolmogorov–Smirnov test. Subsequently, an analysis of variance (ANOVA) was applied to evaluate the presence of significant differences among land-use systems (cacao, agroforestry system, and forest). When significant differences were detected, Tukey’s post hoc test was used to identify pairwise differences among systems (p < 0.05).
In addition, Student’s t-test was applied to compare CO2 emission intensity per unit of product between cacao and coffee crops, considering a significance level of p < 0.05. Pearson correlation analyses were performed to evaluate the relationships between variables, using a significance level of p < 0.05. All statistical analyses were conducted using SPSS software, version 29.0 for Windows.

3. Results

The cacao and coffee producing farms analyzed are predominantly small-scale production units. Among cacao farms, 20.58% have a total area of less than 1 ha, while none exceed 5 ha. In contrast, 8.00% of coffee farms have a total area smaller than 1 ha, and only 2.50% exceed 5 ha, confirming a high degree of fragmentation of the productive landscape.
With respect to this forest cover within farms, the results indicate that 41.93% of coffee farms and 73.52% of cacao farms lack forested areas entirely, suggesting a limited provision of ecosystem services associated with forest cover. Likewise, 5.88% of cacao farms and 54.82% of coffee farms maintain less than 5 ha of forest, indicating reduced forest presence in most production units. In contrast, only 11.76% of cacao farms and 5.64% of coffee farms exhibit forest areas ranging between 5 and 10 ha. None of the cocoa farms and only 7.25% of the coffee farms conserve more than 10 ha of forest, demonstrating that production units with substantial forest cover represent a minor fraction of the total assessed (Table 3).
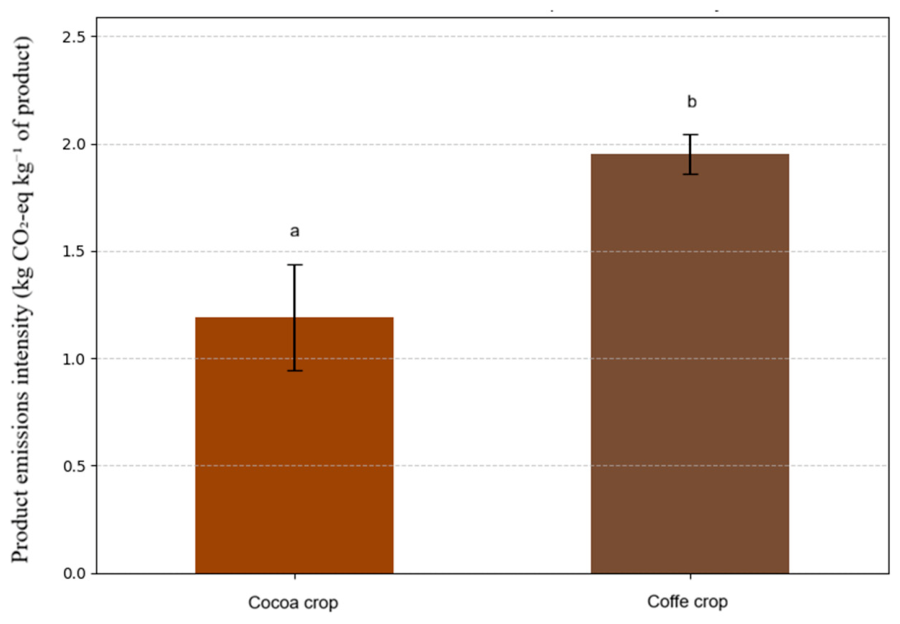
The emission intensity per unit of product in cacao and coffee cultivation showed a markedly skewed distribution across the evaluated production units. In the case of cacao, 52.94% of the farms recorded values below 1, a proportion considerably higher than that observed for coffee farms, where only 16.93% fell within this range.
The largest proportion of coffee farms was concentrated in the 1–5 interval, which included 82.25% of the production units; in contrast, this same range encompassed only 20.68% of cacao farms. Conversely, only 5.88% of cacao farms and 0.80% of coffee farms exhibited values greater than 5, constituting a minority group characterized by high emission intensity, potentially associated with less environmentally efficient production practices (Figure 2).
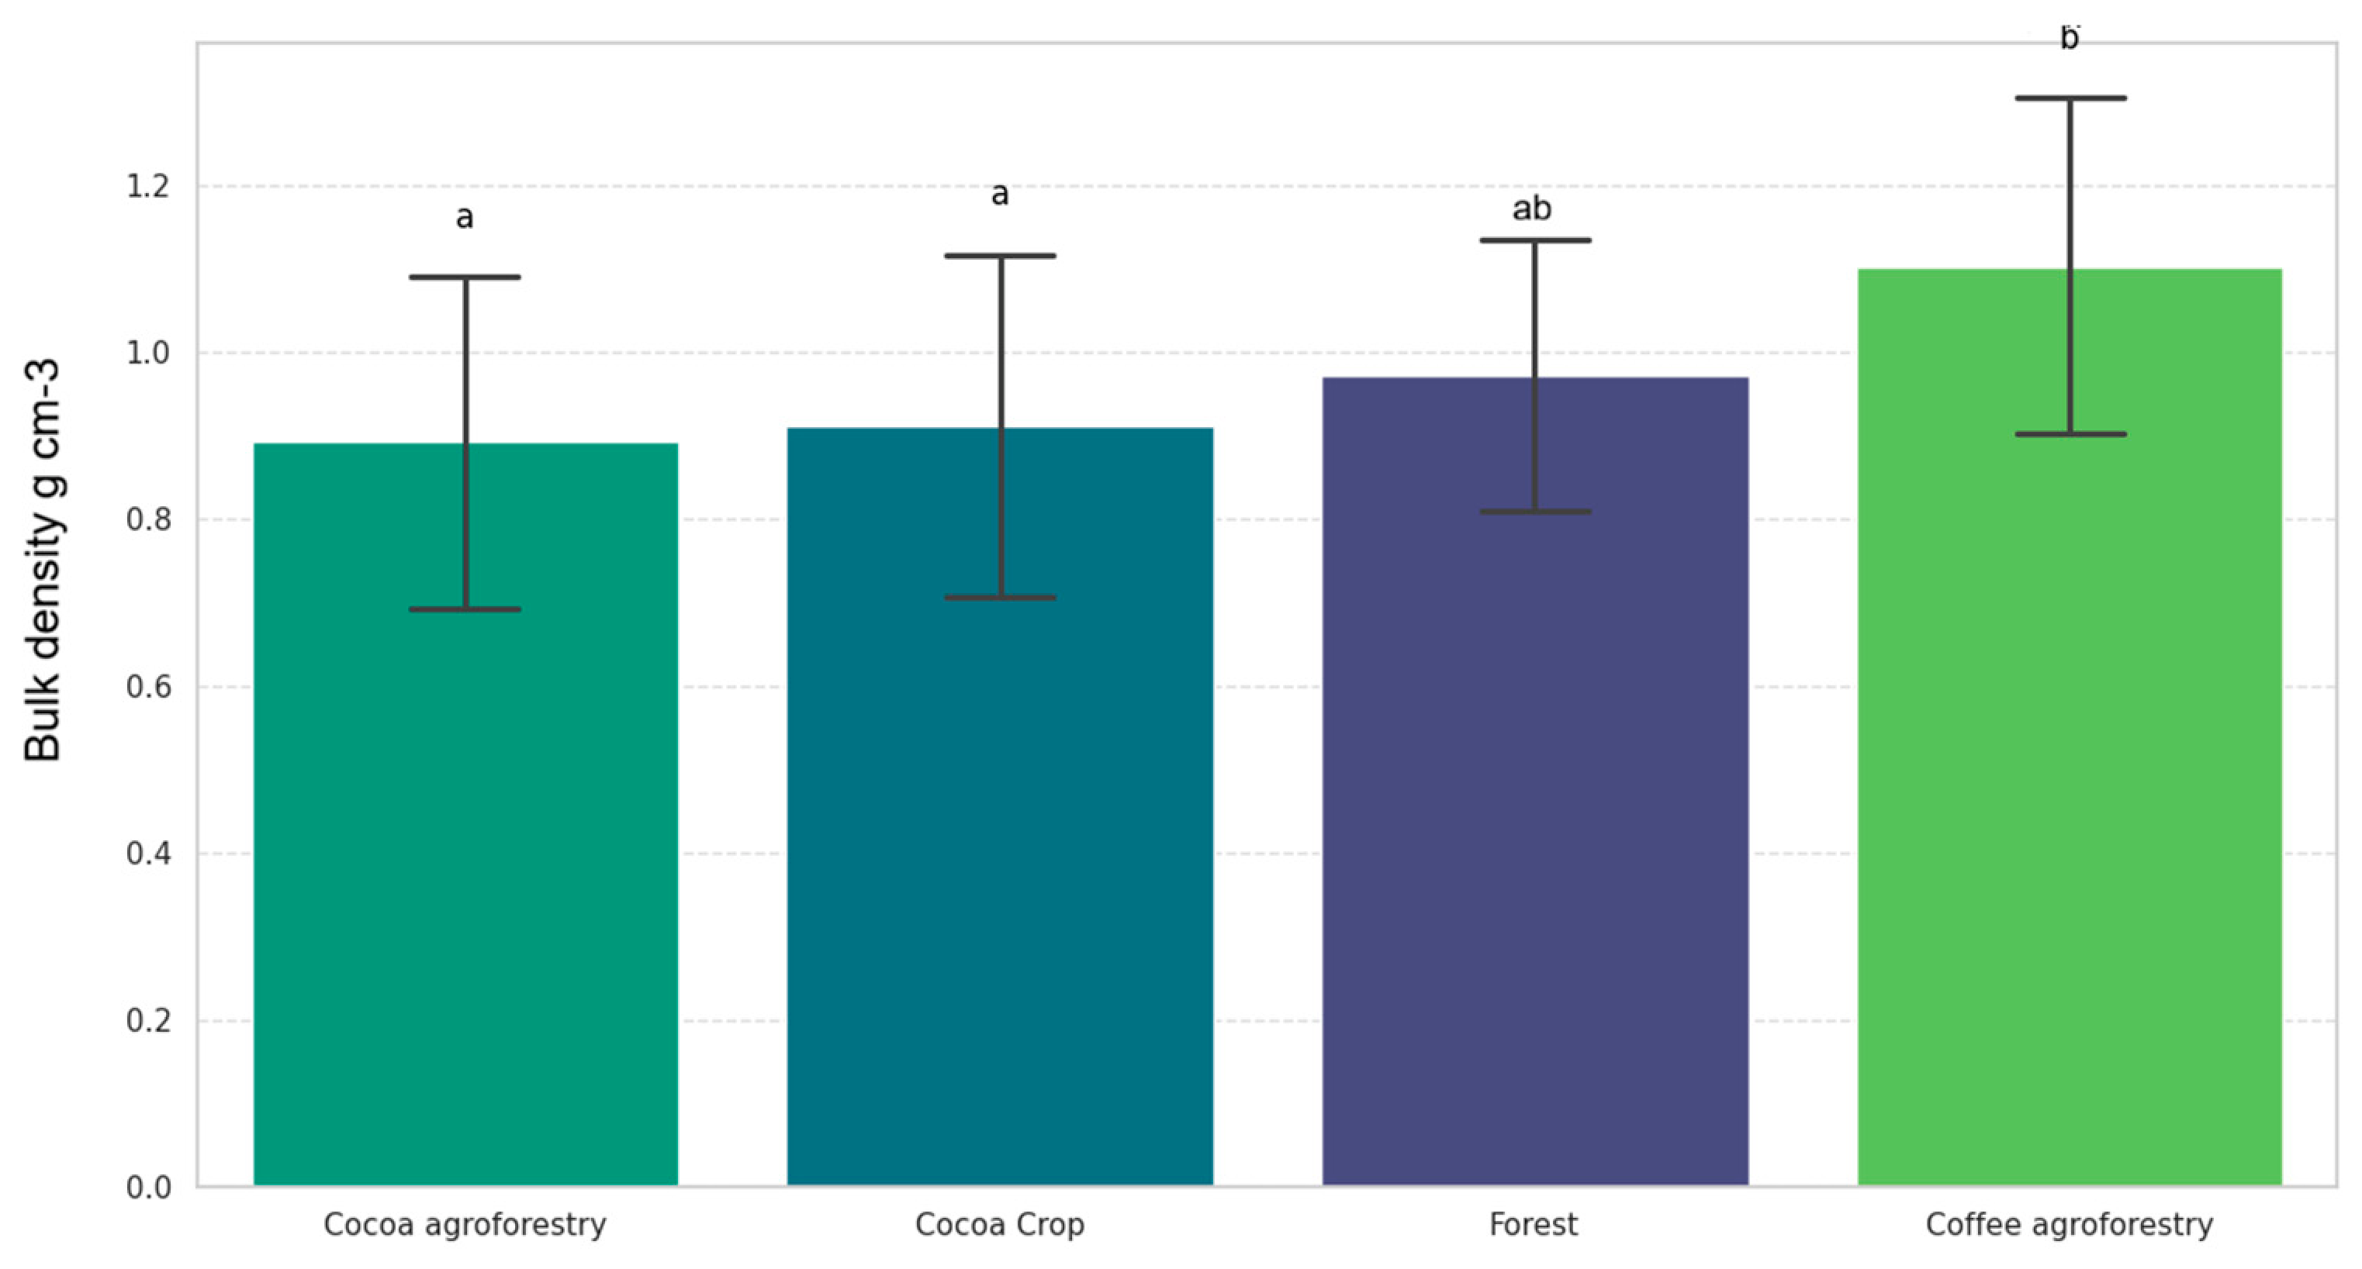
In Figure 3, soil bulk density across the different systems is presented. No statistically significant differences were observed between the cacao monoculture and cacao agroforestry systems (p = 0.984), nor between cacao agroforestry and forest (p = 0.574). However, statistically significant differences were detected between coffee agroforestry and cacao agroforestry (p = 0.001), as well as between coffee agroforestry and cacao monoculture (p = 0.04). The effect size was moderate (ηp2 = 0.146).
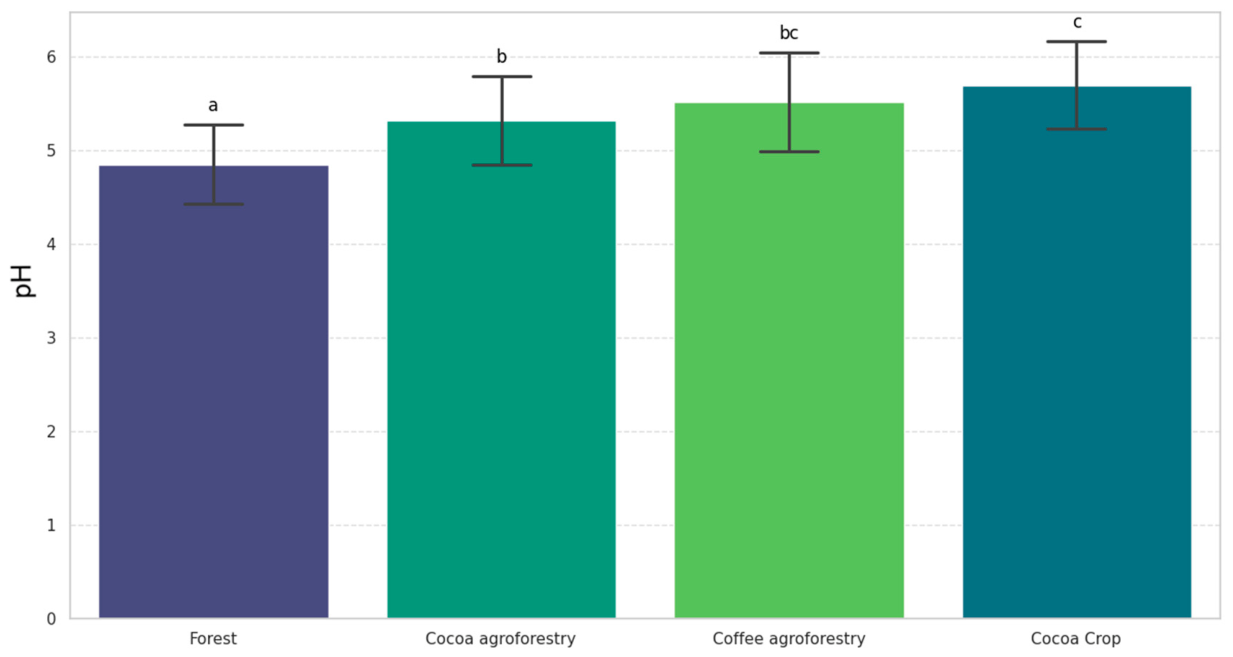
Soil pH differed significantly between the forest system and cacao agroforestry, coffee agroforestry, and cacao monoculture (p = 0.012; p = 0.001; p = 0.001; ηp2 = 0.315). In contrast, no significant differences were observed between cacao agroforestry and coffee agroforestry systems (p = 0.533), both of which exhibited lower acidity (Figure 4). Finally, the cacao monoculture system showed the highest pH values (i.e., lowest acidity) and did not differ significantly from the coffee agroforestry system (p = 0.356).
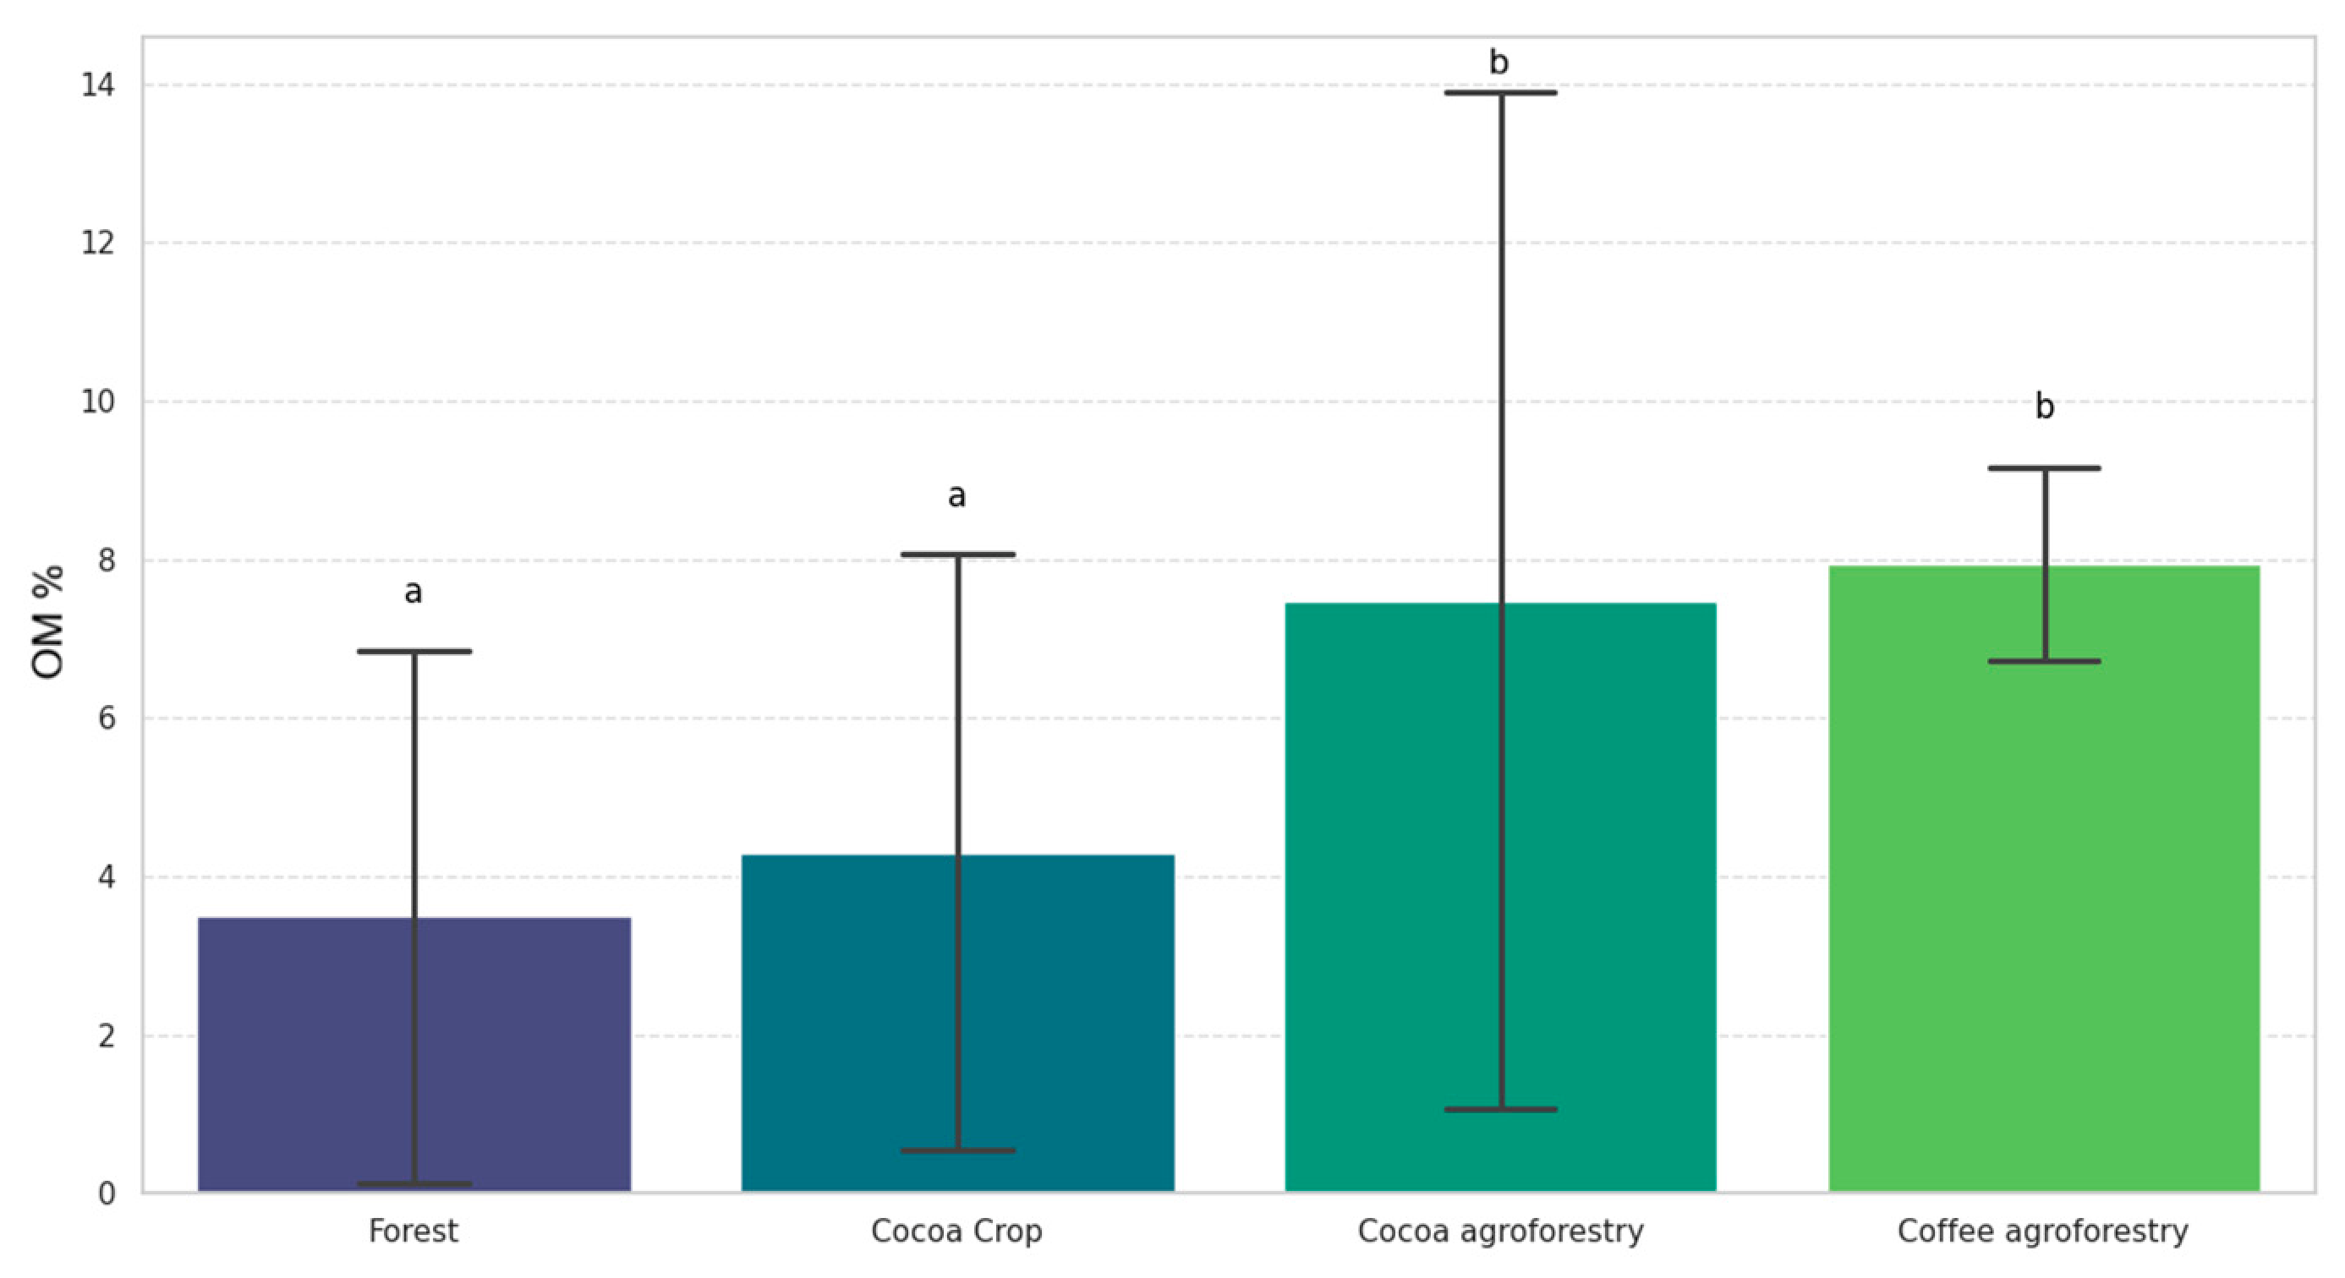
Soil organic matter (SOM) content was higher in the cacao agroforestry and coffee agroforestry systems, with no statistically significant differences between them (p = 0.796). However, both systems differed significantly from the forest and cacao monoculture systems (p = 0.001 in both cases; ηp2 = 0.195). No significant differences were observed between the forest and cacao monoculture systems (p = 0.796) (Figure 5).
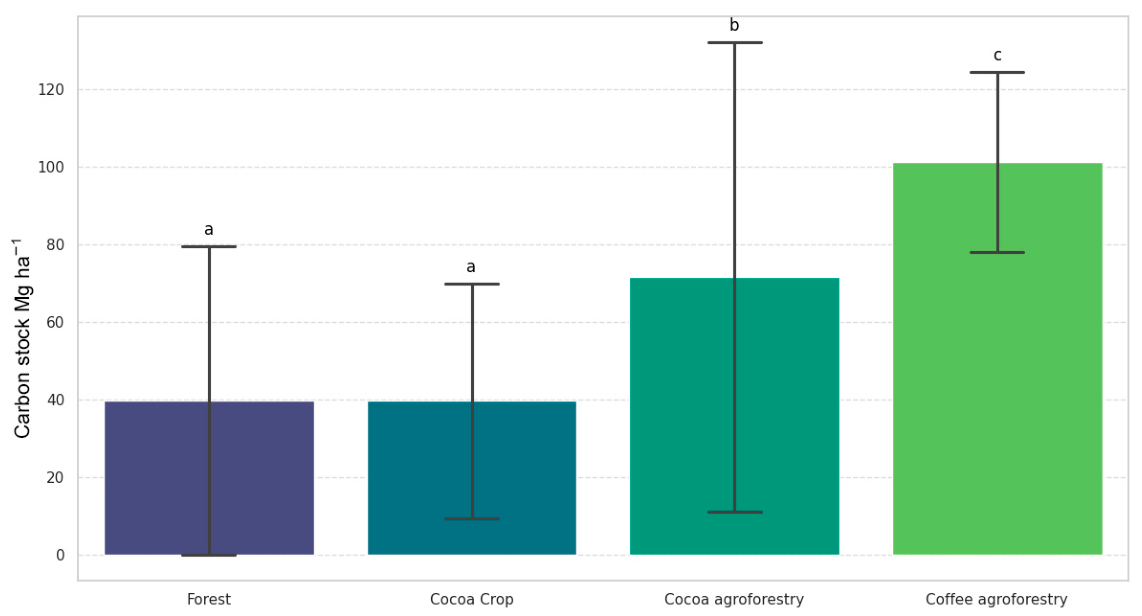
In relation to carbon stocks, the coffee agroforestry system exhibited the highest values, showing statistically significant differences compared to the other land-use systems (forest: p = 0.001; cacao monoculture: p = 0.001; cacao agroforestry: p = 0.041; ηp2 = 0.350). Additionally, cacao agroforestry differed significantly from cacao monoculture (p = 0.011) and from forest (p = 0.001). Finally, no statistically significant differences were observed between the cacao monoculture and forest systems (p = 1.00) (Figure 6).
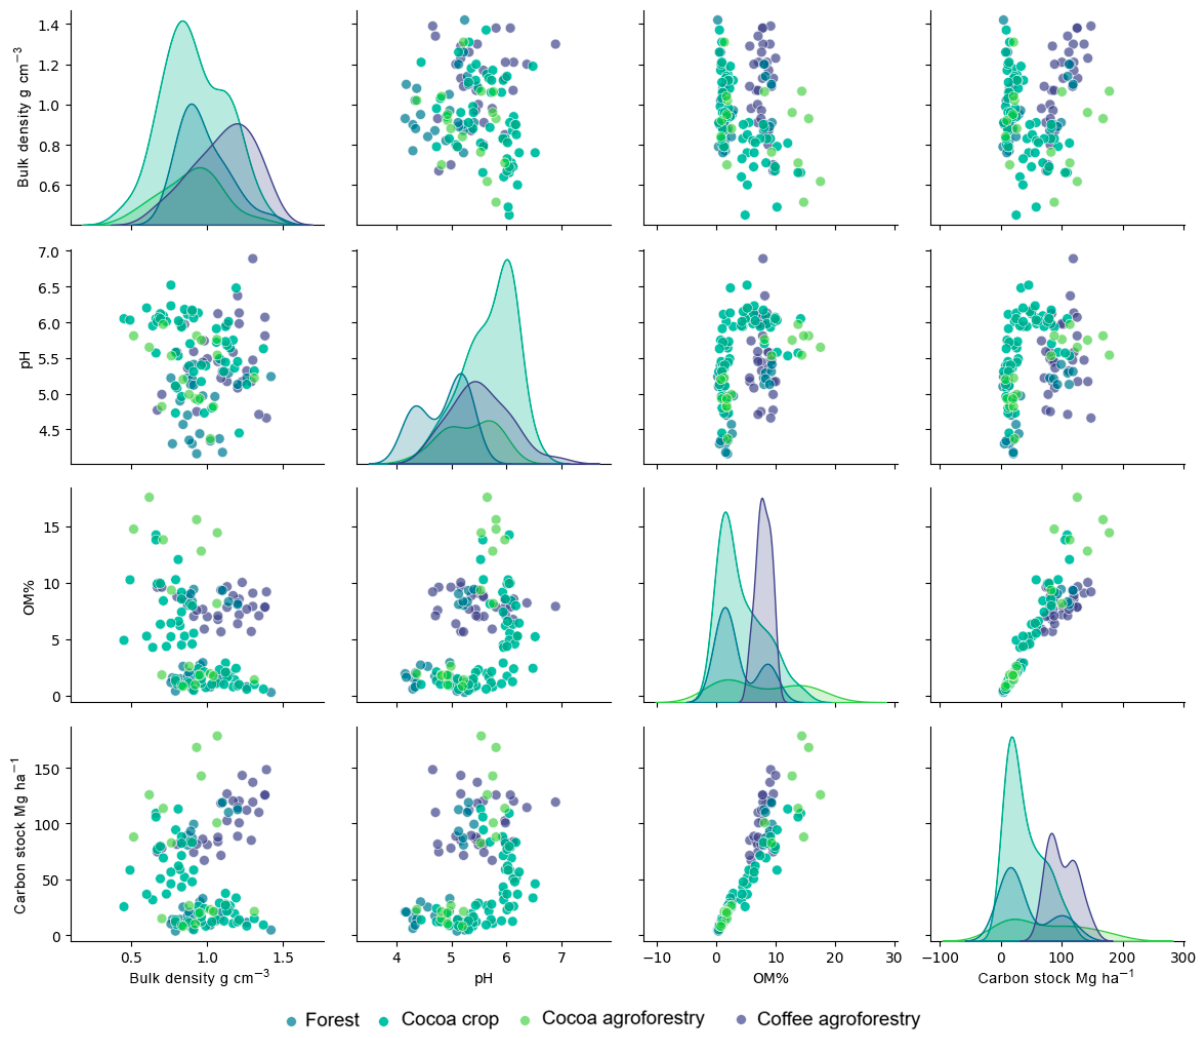
With respect to Pearson correlations, soil bulk density showed weak negative correlations with pH (r = −0.370, p = 0.001), soil organic matter (SOM) (r = −0.364, p = 0.001), and carbon stocks (r = −0.349, p = 0.001). Similarly, pH was weakly negatively correlated with bulk density (r = −0.370, p = 0.001) and weakly positively correlated with SOM (r = 0.393, p = 0.001) and carbon stocks (r = 0.334, p = 0.001). SOM exhibited a weak negative correlation with bulk density (r = −0.364, p = 0.001) and a strong positive correlation with carbon stocks (r = 0.911, p = 0.001). Finally, carbon stocks showed a moderate negative correlation with bulk density (r = −0.449, p = 0.001), a weak positive correlation with pH (r = 0.334, p = 0.001), and a strong positive correlation with SOM (r = 0.911, p = 0.001) (Figure 7).

4. Discussion

4.1. Soil Properties and Carbon Stocks in Agroforestry Systems

Bulk density is a key indicator of soil structure and overall soil quality, as it directly influences soil porosity and carbon storage capacity. In this sense, the lower bulk density values observed in forest, cacao, and cacao-based agroforestry systems suggest more favorable physical conditions that facilitate soil aeration and root development. According to [35], the presence of tree vegetation in these systems promotes the development of more stable and structurally well-aggregated soils, enhancing carbon protection against decomposition and losses. This effect is largely associated with root biomass inputs; in cocoa systems, the total estimated root biomass (including coarse, medium, and fine roots) ranges from 5.7 to 7.2 Mg ha−1 [36].
With respect to soil pH, all evaluated systems exhibited acidic conditions, which are characteristic of Amazonian soils and are associated with intense weathering processes and base leaching [37]. However, cacao monoculture showed relatively higher pH values, indicating lower acidity compared to the other land-use systems. This pattern may be related to specific management practices, such as reduced organic matter inputs due to lower litterfall and increased soil disturbance, which can influence soil acidity dynamics.
These results differ from those reported by [12] for the same region, which found higher pH values in silvopastoral systems compared to pastures and forests. Similarly, Reference [38] reported lower pH values in forest soils compared to soils under traditional “chacra” agricultural systems primarily practiced by Amazonian Indigenous communities, including crops such as coffee and cacao, which is consistent with the findings of the present study, where forest soils exhibited the highest acidity.
In forest soils, the higher acidity is primarily associated with litter decomposition, a process that generates low-molecular-weight organic acids. These compounds increase the concentration of exchangeable H+ and Al3+, promote the leaching of base cations (Ca2+, Mg2+, K+), particularly in the surface layer (0–20 cm), and may enhance the mobility of certain trace metals such as Cd [39,40]. In contrast, cacao monoculture systems in the study area exhibited higher pH values, reflecting active soil management practices. Farmers commonly apply amendments such as lime and dolomite to increase soil pH and reduce Cd availability, aiming to comply with increasingly stringent European Union regulations on maximum Cd content in cocoa products [41]. In relation to soil carbon stocks and soil organic matter content, cacao-based and coffee-based agroforestry systems exhibited higher values compared to forest and cacao monoculture systems. This pattern can be attributed to the functional integration of trees and crops, which increases biomass inputs to the system and promotes the sustained accumulation of carbon in the soil. Reference [3] emphasizes that agroforestry systems play a relevant role in climate change mitigation due to their capacity to sequester carbon both in aboveground biomass and in soils, associated with greater litter production, fine root turnover, and pruning residues processes that were evident in the systems evaluated in this study.
Similarly, as reported in [6] points out that agroforestry systems can store substantial amounts of carbon over medium and long time scales, consolidating their role as effective carbon sinks. Specific studies report values comparable to those observed in the present research. For instance, According to [42] found that shaded cacao “chacra” systems stored approximately 66.73 Mg C ha−1, whereas cacao monoculture systems showed values close to 64.76 Mg C ha−1. In the case of coffee, the authors in [43] reported that systems integrating fruit and non-fruit trees stored between 49 and 71 Mg C ha−1, exceeding carbon stocks in coffee systems without trees, which averaged around 50 Mg C ha−1.
Beyond their carbon storage capacity, shaded cacao and coffee systems with diversified tree components also contribute to mitigating climate variability and stabilizing crop yields [44]. This effect was evident in the study sites, where agroforestry systems exhibited greater carbon sequestration and production diversification, thereby enhancing productive resilience under adverse climatic conditions.
In the study area, cacao systems managed under agroforestry practices represent a productive alternative with high potential to maintain and enhance soil carbon stocks. In addition, the adoption of organic certification schemes facilitates access to specialized markets that value environmentally and socially responsible practices. In this context, local producers benefit from certification programs such as KIWA BCS, which strengthen the commercialization of cacao and coffee, mainly through producer associations, either as raw beans or processed products.
These initiatives within the cacao and coffee value chains generate economic incentives by improving access to higher-value markets, while simultaneously promoting sustainable practices that enhance the environmental and economic resilience of smallholder farmers in rural areas. Several studies identify such standards as key elements for fostering environmental sustainability and economic viability in cacao and coffee production systems, contributing simultaneously to ecosystem conservation and sustainable soil management [45,46]. In this context, the integration of cacao and coffee into agroforestry systems is consolidated as a management strategy that improves microclimatic conditions, promotes soil health, and supports agricultural productivity, thereby linking environmental benefits with opportunities for sustainable rural development [47].
Although forest systems did not exhibit the highest soil carbon stocks in the present study, which was limited to the 0–20 cm depth, this result should be interpreted with caution. The higher values observed in agroforestry systems at this depth likely reflect greater organic matter inputs and faster nutrient cycling in surface horizons, driven by continuous litter deposition and management practices. However, a growing body of evidence indicates that forest ecosystems store a substantial proportion of their soil organic carbon in deeper layers, which are not captured by shallow sampling. For instance, According to [48] vertical distribution of soil organic carbon demonstrated that a significant fraction of soil carbon is located below 30 cm, while [49] land-use change effects on SOC stocks reported that forests maintain higher carbon stocks in subsoil layers (20–100 cm) compared to agricultural systems. Similarly, as reported in [50] deep soil carbon stabilization highlighted the importance of deeper soil horizons as stable, long-term carbon reservoirs.
Therefore, while agroforestry systems may enhance carbon accumulation in topsoil layers, forests likely play a dominant role in total soil carbon storage when deeper profiles are considered.
Reference [42] reported total carbon stocks of up to 334.2 Mg C ha−1 in primary forests of Napo, considering aboveground biomass, roots, necromass, and soil carbon. These values far exceed the soil carbon stocks observed in this study for both forest (39.73 Mg C ha−1) and cacao monoculture systems (39.73 Mg C ha−1), but are higher than those recorded in cacao-based agroforestry (71.55 Mg C ha−1) and coffee-based agroforestry systems (101.22 Mg C ha−1). It is important to note that the higher values observed in agroforestry systems in the present study refer exclusively to soil carbon stocks (0–20 cm), whereas total ecosystem carbon including aboveground biomass is expected to be substantially higher in forest systems. These results highlight the importance of agroforestry systems as a complementary strategy for conservation and climate change mitigation in productive Amazonian landscapes compared to monoculture.

4.2. Gas Emission Intensity by Product

The results obtained in this study indicate that the greenhouse gas (GHG) emission intensity in cacao farms was 1.26 kg CO2 eq kg−1 of product, which is lower than the average value of 1.47 kg CO2 eq kg−1 reported by [9] for cacao systems in Côte d’Ivoire under representative production practices, where deforestation and residue management constitute relevant sources of emissions. This comparison highlights the high variability of the carbon footprint associated with cacao production systems, which is closely dependent on the agroecological context, input-use intensity, and farm-level management practices.
The scientific literature reports wide ranges in emission estimates associated with cacao production, with values ranging from approximately 0.32 to more than 9 kg CO2 eq kg−1 when downstream processing stages or input-intensive scenarios are included. This heterogeneity underscores the importance of clearly defining system boundaries, functional units, and methodological approaches in carbon footprint assessments in order to ensure the comparability of results [9].
For coffee, the average value of 1.95 kg CO2 eq kg−1 of product estimated in the present study falls within the ranges reported in the literature; however, direct comparisons with other studies depend on the scope of the analysis and the stages of the production chain considered. Recent reviews indicate that the carbon footprint associated exclusively with the cultivation phase can vary widely, from approximately 0.15 to more than 14 kg CO2 eq kg−1 of green coffee, depending on factors such as the use of nitrogen fertilizers, transport, processing, land-use change, and agricultural management practices [51].
The statistically significant differences observed between coffee and cacao production systems can be largely attributed to differences in their agronomic management. Coffee systems exhibit a higher management intensity, as reflected by a labor requirement of approximately 88 person-days ha−1, compared to ~39 person-days ha−1 reported for cacao cultivation in the Ecuadorian Amazon [27]. In the study area, survey data indicate that organic fertilizers are predominantly applied in both systems; however, the higher labor demand in coffee is mainly associated with harvesting activities, which are more frequent and selective. This reflects the greater operational intensity of coffee systems.
According to [52], the increased labor demand in coffee production is closely linked to more intensive management practices, including greater weed control, pest and disease management, fertilization requirements, and selective harvesting. Consequently, these systems tend to rely more heavily on external inputs and field operations, contributing to higher greenhouse gas (GHG) emissions per unit area and, therefore, to greater emissions intensity.
In addition, these differences are influenced by the inclusion or exclusion of emissions derived from land-use change, storage, and post-harvest phases in carbon footprint analyses. Previous studies have reported relatively low emission values in coffee systems under organic management or reduced-input practices (≈0.12–0.67 kg CO2 eq kg−1 of coffee cherry), whereas conventional systems with a high reliance on synthetic fertilization exhibit considerably higher emission intensities [53].
From a climate change mitigation perspective, these results reinforce that the climate efficiency of perennial crops depends not only on emission intensity per unit of product, but also on the adoption of agroecological practices. Reductions in the carbon footprint of coffee and cacao systems can be achieved through the optimization of nitrogen fertilizer use, the implementation of agroforestry systems with a higher carbon sequestration capacity, and improvements in residue management and on-farm energy use. These strategies are consistent with recommendations derived from Life Cycle Assessment (LCA) studies and GHG accounting models applied to tropical agricultural systems [9].
In this context, the conservation of forest areas within farms not only helps to maintain existing carbon stocks in soils and vegetation, but also constitutes a key strategy to avoid emissions associated with deforestation and soil degradation. Accordingly, the integration of agroforestry systems emerges as a sustainable management alternative that supports climate change mitigation and the long-term provision of ecosystem services in tropical productive landscapes [54].
Although the results obtained indicated that forests exhibited lower soil organic carbon stocks compared to agroforestry systems, this finding should be interpreted with caution due to methodological limitations of the study. In particular, carbon estimation was restricted to a depth of 0–20 cm, which may lead to an underestimation of carbon stored in forest ecosystems, where a substantial proportion of carbon is located in deeper soil horizons. In this sense, several studies have shown that forests tend to accumulate carbon more stably and at greater depths within the soil profile. Therefore, future research should consider assessments at greater soil depths (e.g., up to 50 or 100 cm) in order to obtain more comprehensive and comparable estimates of soil carbon stocks.

5. Conclusions

Agroforestry systems based on cacao and coffee demonstrated a greater capacity for soil carbon sequestration compared to forest areas and monoculture systems. This highlights the potential of agroforestry as a sustainable land-use strategy for climate change mitigation through enhanced carbon capture and storage. Moreover, these systems exhibited higher soil organic matter contents, which are closely associated with increased carbon stabilization and improved soil functioning. Carbon storage and greenhouse gas emission intensity per unit of product varied according to crop type, emphasizing the need for crop-specific management strategies to optimize soil carbon sequestration and enhance the environmental performance of agricultural systems. Additionally, soil properties such as pH, and organic matter content were strongly influenced by land cover and management practices, reflecting the key role of vegetation structure and management intensity in regulating soil quality across agroforestry, and monoculture systems.

Author Contributions

L.J. and R.D. analyzed part of the results in the laboratory and wrote the article. R.C., N.F., and J.L. planned and supervised the experimental process and wrote the manuscript. D.C.-M. analyzed and interpreted data and reviewed the article. J.R. and J.M. carried out data collection, contributed to and reviewed the article. All authors have read and agreed to the published version of the manuscript.

Funding

This research was funded by Universidad Técnica Particular de Loja.

Data Availability Statement

The datasets generated and/or analyzed during the current study are available from the corresponding author upon reasonable request. The data include soil physicochemical properties (e.g., soil organic matter, pH, bulk density, and soil organic carbon), as well as estimates of greenhouse gas (GHG) emission intensity associated with crop management practices. Access to the data is subject to reasonable request and approval, in accordance with confidentiality agreements with participating farmers and institutional data-sharing policies.

Acknowledgments

We would like to express our gratitude to the farmers of Zamora Chinchipe for granting access to their farms and supporting the development of this research. During the preparation of this manuscript, the authors used ChatGPT-5.5 for text editing purposes, including improvements in grammar, structure, spelling, and punctuation. The authors carefully reviewed and revised the generated content and assume full responsibility for the final version of the publication.

Conflicts of Interest

The authors declare no conflicts of interest.

References

  1. Ludeña, C.E.; Wilk, D. Ecuador: Mitigación y adaptación al cambio climático. Nota técnica no. Idb-tn-619. 2013. Available online: https://publications.iadb.org/es/ecuador-mitigacion-y-adaptacion-al-cambio-climatico (accessed on 15 January 2026).
  2. Valdés Sáenz, M.A.; Díaz Valdés, K.; Rodríguez Guerra, Y.; Hernández Ramos, H. Sistemas agroforestales en la Región Amazónica Ecuatoriana. Cienc. Lat. Rev. Científica Multidiscip. 2024, 8, 8587–8613. [Google Scholar] [CrossRef]
  3. Montagnini, F.; Somarriba, E.; Murgueitio, E.; Fassola, H.; Eibl, B. Sistemas Agroforestales. Funciones Productivas, Socioeconómicas y Ambientales; Serie técnica. Informe técnico 402; CATIE: Turrialba, Costa Rica; Editorial CIPAV: Cali, Colombia, 2015; 454p. [Google Scholar]
  4. Nair, P.K.R.; Kumar, B.M.; Nair, V.D. Carbon sequestration in agroforestry systems. Adv. Agron. 2010, 108, 237–307. [Google Scholar] [CrossRef]
  5. Soto-Pinto, L.; Jiménez-Ferrer, G. Contradicciones socioambientales en los procesos de mitigación, asociados al ciclo del carbono en sistemas agroforestales. Madera y Bosques 2018, 24, e2401887. [Google Scholar] [CrossRef]
  6. Zavala, W.; Merino, E.; Peláez, P. Influence of three agroforestry systems of cocoa cultivation on carbon capture and storage. Sci. Agropecu. 2018, 9, 493–501. [Google Scholar] [CrossRef]
  7. Murgueitio, R.; Chará, J.; Barahona, R.; Cuartas, C.; Naranjo, J. Los sistemas silvopastoriles intensivos (SSPI) herramienta de mitigación y adaptación al cambio climático. Trop. Subtrop. Agroecosystems 2014, 17, 501–507. Available online: http://www.redalyc.org/articulo.oa?id=93935728001 (accessed on 2 March 2026). [CrossRef]
  8. Burbano Orjuela, H. El carbono orgánico del suelo y su papel frente al cambio climático. Rev. De Cienc. Agrícolas 2018, 35, 82. [Google Scholar] [CrossRef]
  9. Vervuurt, W.; Slingerland, M.A.; Pronk, A.A.; Van Bussel, L.G.J. Modelling greenhouse gas emissions of cacao production in the Republic of Côte d’Ivoire. Agrofor. Syst. 2022, 96, 417–434. [Google Scholar] [CrossRef]
  10. Somarriba, E.; Cerda, R.; Orozco, L.; Cifuentes, M.; Dávila, H.; Espin, T.; Mavisoy, H.; Ávila, G.; Alvarado, E.; Poveda, V.; et al. Carbon stocks and cocoa yields in agroforestry systems of Central America. Agric. Ecosyst. Environ. 2013, 173, 46–57. [Google Scholar] [CrossRef]
  11. Soto-Pinto, L.; Anzueto, M.; Mendoza, J.; Jiménez-Ferrer, G.; de Jong, B. Carbon sequestration through agroforestry in indigenous communities of Chiapas, Mexico. Agrofor. Syst. 2010, 78, 39–51. [Google Scholar] [CrossRef]
  12. Jiménez, L.; Capa-Mora, D.; Fierro, N.; Lasso, J.; Roa, J.; Bermeo, J.; Merino, J.; Carrera, R. Uncovering the Potential of Carbon Stocks and Nutrients in Livestock Systems in Zamora Chinchipe. Appl. Environ. Soil Sci. 2025, 8821033. [Google Scholar] [CrossRef]
  13. Jadán, O.; Quizhpe, W.; Pacheco, E.; Aguirre, Z.; González, M.; Ponce, E.; Peña, D. Riqueza florística y carbono almacenado en tres pisos altitudinales de bosques amazónicos, Zamora Chinchipe, Ecuador. Bosques Latid. Cero 2017, 7, 1–16. [Google Scholar]
  14. Tinoco-Jaramillo, L.; Vargas-Tierras, Y.; Habibi, N.; Caicedo, C.; Chanaluisa, A.; Paredes-Arcos, F.; Viera, W.; Almeida, M.; Vásquez-Castillo, W. Agroforestry systems of cocoa (Theobroma cacao L.) in the Ecuadorian Amazon. Forests 2024, 15, 195. [Google Scholar] [CrossRef]
  15. Vizuete-Montero, M.O.; Figueroa-Saavedra, H.F.; Barbaru-Grajales, A.D.; Zapata-Mayorga, H.A.; Herrera-Ocaña, H.R.; Moya, W. Physio-edaphoclimatic factors show optimal soil suitability for three tropical crops in the Ecuadorian Amazon. Sci. Agric. 2023, 81, e20220214. [Google Scholar]
  16. Jiménez, L.; Capa-Mora, D.; Fierro, N.; Lasso, J.; Roa, J.; Bermeo, J.; Merino, J.; Carrera, R. Livestock and Climate Change: How Do Livestock Practices Impact Greenhouse Gas Emissions in Holders Fields in Zamora Chinchipe? Environments 2025, 12, 443. [Google Scholar] [CrossRef]
  17. Camacho-López, C.O.C.; Carrión-Paqui, N.S.C.; Jaramillo-Villa, A.F.J. Análisis multitemporal de la deforestación y cambio de la cobertura del suelo en Zamora Chinchipe. Polo Del Conoc. Rev. Científico-Prof. 2021, 6, 1228–1241. [Google Scholar]
  18. Casanova-Lugo, F.; Petit-Aldana, J.; Solorio-Sánchez, J. Los sistemas agroforestales como alternativa a la captura de carbono en el trópico mexicano. Rev. Chapingo Ser. Cienc. For. Y Del Ambiente 2011, XVII, 133–143. [Google Scholar] [CrossRef]
  19. Oke, D.O.; Odebiyi, K.A. Traditional cocoa-based agroforestry and forest species conservation in Ondo State, Nigeria. Agric. Ecosyst. Environ. 2007, 122, 305–311. [Google Scholar] [CrossRef]
  20. Hualpa, G.; Carrión-Paladines, V.; Jiménez, W.; Capa-Mora, D.; Quichimbo, P.; Fierro, N.; Jiménez, L. Farmers’ Indigenous Knowledge of Soil Management in an Altitudinal Gradient in Southern Ecuador. Sustainability 2025, 17, 4983. [Google Scholar] [CrossRef]
  21. Prat, C. The Soils of Ecuador; Espinosa, J., Moreno, J., Bernal, G., Eds.; Springer International Publishing: Madison, WI, USA, 2018; Volume 1. [Google Scholar] [CrossRef]
  22. Delgado Fernández, E.; León Peralta, M.; Cantos Guamán, C.; Guzmán Juárez, M. Effect of mining activity on biodiversity in a sector of the Paquisha parish, province of Zamora Chinchipe-Ecuador. La Granja Rev. De Cienc. De La Vida 2023, 38, 106–123. [Google Scholar]
  23. Celi-Delgado, L.; Aguirre-Mendoza, Z. Caracterización de los sistemas agroforestales tradicionales de la parroquia Zumba, cantón Chinchipe, Ecuador. Cienc. Lat. Rev. Científica Multidiscip. 2022, 6, 814–837. [Google Scholar]
  24. Muñoz-Chamba, L.; Saritama, S. Especies forestales potenciales como componentes agroforestales en fincas de Coffea arabica L., en dos pisos altitudinales del cantón Palanda. Cedamaz 2025, 15, 1–7. [Google Scholar] [CrossRef]
  25. Jiménez, L.; Gusmán, J.; Capa-Mora, D.; Quichimbo, P.; Mezquida, E.T.; Benito, M.; Rubio, A. Riqueza y diversidad vegetal en un bosque siempreverde piemontano en los Andes del sur del Ecuador. Bosques Latid. Cero 2017, 7, 17–29. [Google Scholar]
  26. Tapia-Armijos, M.F.; Homeier, J.; Espinosa, C.I.; Leuschner, C.; De La Cruz, M. Deforestation and forest fragmentation in South Ecuador since the 1970s–losing a hotspot of biodiversity. PLoS ONE 2015, 10, e0133701. [Google Scholar] [CrossRef]
  27. Viteri Salazar, O.; Ramos Martín, J. Organizational structure and commercialization of coffee and cocoa in the northern amazon region of Ecuador. Rev. NERA 2017, 35, 266–287. [Google Scholar] [CrossRef]
  28. Konen, M.E.; Jacobs, P.M.; Burras, C.L.; Talaga, B.J.; Mason, J.A. Equations for Predicting Soil Organic Carbon Using Loss-on-Ignition for north central US soils. Soil Sci. Soc. Am. J. 2002, 66, 1878–1881. [Google Scholar] [CrossRef]
  29. Mann, L.K. Changes in soil carbon storage after cultivation. Soil Sci. 1986, 142, 279–288. [Google Scholar] [CrossRef]
  30. Lemenih, M.; Itanna, F. Soil carbon stocks and turnovers in various vegetation types and arable lands along an elevation gradient in southern Ethiopia. Geoderma 2004, 123, 177–188. [Google Scholar] [CrossRef]
  31. Hamido, S.A.; Ghalehgolabbehbahani, A.; Smith, A. Soil Carbon Dynamics, Sequestration Potential, and Physical Characteristics Under Grazing Management in Regenerative Organic Agroecosystems. Agronomy 2025, 15, 2426. [Google Scholar] [CrossRef]
  32. Hillier, J.; Walter, C.; Malin, D.; García-Suarez, T.; Mila-i-Canals, L.; Smith, P. A farm-focused calculator for emissions from crop and livestock production. Environ. Model. Softw. 2011, 26, 1070–1078. [Google Scholar] [CrossRef]
  33. Mrówczyńska-Kamińska, A.; Bajan, B.; Pawłowski, K.P.; Genstwa, N.; Zmyślona, J. Greenhouse gas emissions intensity of food production systems and its determinants. PLoS ONE 2021, 16, e0250995. [Google Scholar] [CrossRef]
  34. Tubiello, F.N.; Salvatore, M.; Rossi, S.; Ferrara, A.; Fitton, N.; Smith, P. The FAOSTAT database of greenhouse gas emissions from agriculture. Environ. Res. Lett. 2013, 8, 015009. [Google Scholar] [CrossRef]
  35. Ordóñez, J.A.B.; Masera, O. Captura de carbono ante el cambio climático. Madera y Bosques 2016, 7, 3–12. [Google Scholar] [CrossRef]
  36. Moser, G.; Leuschner, C.; Hertel, D.; Hölscher, D.; Köhler, M.; Leitner, D.; Michalzik, B.; Prihastanti, E.; Tjitrosemito, S.; Schwendenmann, L. Response of cocoa trees (Theobroma cacao) to a 13-month desiccation period in Sulawesi, Indonesia. Agrofor. Syst. 2010, 79, 171–187. [Google Scholar] [CrossRef]
  37. Jiménez, L.; Jiménez, W.; González, L.; Quichimbo, P.; Fierro, N.; Capa-Mora, D. Rescuing local knowledge with regards to soil management and fertility in the Amazon Region of Ecuador. Environ. Dev. 2024, 50, 100984. [Google Scholar] [CrossRef]
  38. Bravo-Medina, C.; Goyes-Vera, F.; Arteaga-Crespo, Y.; García-Quintana, Y.; Changoluisa, D. A soil quality index for seven productive landscapes in the Andean-Amazonian foothills of Ecuador. Land Degrad. Dev. 2021, 32, 2226–2241. [Google Scholar] [CrossRef]
  39. Huang, J.; Mo, J.; Zhang, W.; Lu, X. Research on acidification in forest soil driven by atmospheric nitrogen deposition. Acta Ecol. Sin. 2014, 34, 302–310. [Google Scholar] [CrossRef]
  40. Zhang, Y.; Zhou, J.; Lei, Z.; Ren, H.; Chen, H. Effect of acid production from forest litter on the availability of heavy metals in soil. Forests 2024, 15, 2097. [Google Scholar] [CrossRef]
  41. Argüello, D.; Chavez, E.; Gutierrez, E.; Pittomvils, M.; Dekeyrel, J.; Blommaert, H.; Smolders, E. Soil amendments to reduce cadmium in cacao (Theobroma cacao L.): A comprehensive field study in Ecuador. Chemosphere 2023, 324, 138318. [Google Scholar] [CrossRef] [PubMed]
  42. Jadán, O.; Torres Navarrete, S.B.; Günter, S. Influencia del uso de la tierra sobre almacenamiento de carbono en sistemas productivos y bosque primario en Napo, Reserva de Biosfera Sumaco, Ecuador. Revista Amazónica. Cienc. Y Tecnol. 2012, 1, 173–185. [Google Scholar] [CrossRef]
  43. Tumwebaze, S.B.; Byakagaba, P. Soil organic carbon stocks under coffee agroforestry systems and coffee monoculture in Uganda. Agric. Ecosyst. Environ. 2016, 216, 188–193. [Google Scholar] [CrossRef]
  44. Patil, S.; Rudragouda, C.S.; Govindappa, M.; Roobakkumar, A.; Machenahalli, S.; Jingade, P.; Nadaf, S.A.; Mote, K.; Uma, M.S.; Tintumol, K.; et al. Mitigating climate risks in coffee production through agroforestry: Global evidence from a systematic review and meta-analysis. Front. Clim. 2025, 7, 1699037. [Google Scholar] [CrossRef]
  45. Abebe, G.; Awoke, A. Sustainable ecosystem services in the coffee value chain. Discov. Sustain. 2025, 6, 1258. [Google Scholar] [CrossRef]
  46. Pino, S.; Macías, J. Beneficio económico de la comercialización asociativa de cacao arriba con certificación orgánica. Compend. Cuad. De Econ. y Adm. 2024, 11, 58–71. [Google Scholar] [CrossRef]
  47. Awazi, N.P. Climate change mitigation and adaptation in Cameroon through cocoa and coffee-based agroforestry systems. Discov. For. 2025, 1, 8. [Google Scholar] [CrossRef]
  48. Jobbágy, E.G.; Jackson, R.B. The vertical distribution of soil organic carbon and its relation to climate and vegetation. Ecol. Appl. 2000, 10, 423–436. [Google Scholar] [CrossRef]
  49. Don, A.; Schumacher, J.; Freibauer, A. Impact of tropical land-use change on soil organic carbon stocks—A meta-Analysis. Glob. Change Biol. 2011, 17, 1658–1670. [Google Scholar] [CrossRef]
  50. Rumpel, C.; Kögel-Knabner, I. Deep soil organic matter—A key but poorly understood component of terrestrial C cycle. Plant Soil 2011, 338, 143–158. [Google Scholar] [CrossRef]
  51. Chéron-Bessou, C.; Acosta-Alba, I.; Boissy, J.; Payen, S.; Rigal, C.; Setiawan, A.A.R.; Sevenster, M.; Tran, T.; Azapagic, A. Unravelling life cycle impacts of coffee: Why do results differ so much among studies? Sustain. Prod. Consum. 2024, 47, 251–266. [Google Scholar] [CrossRef]
  52. Ha, D.T.; Shively, G. Coffee vs. cacao: A case study from the Vietnamese central highlands. J. Nat. Resour. Life Sci. Educ. 2005, 34, 107–111. [Google Scholar] [CrossRef]
  53. Noponen, M.; Edwards-Jones, G.; Haggar, J.P.; Soto, G.; Attarzadeh, N.; Healey, J.R. Greenhouse gas emissions in coffee grown with differing input levels under conventional and organic management. Agric. Ecosyst. Environ. 2012, 151, 6–15. [Google Scholar] [CrossRef]
  54. Lal, R. Forest soils and carbon sequestration. For. Ecol. Manag. 2005, 220, 242–258. [Google Scholar] [CrossRef]
Figure 2. Greenhouse gas (GHG) emission intensity per unit of product in agroforestry cacao and coffee systems on farms in Zamora Chinchipe Province, Ecuador. Bars represent the mean emission intensity, expressed as kilograms of CO2 equivalent per kilogram of product (kg CO2 eq kg−1 product). Upper bars indicate the standard error of the mean. Different letters above the bars denote statistically significant differences between crops, according to the applied statistical test (p < 0.05).
Agronomy 16 00967 g002
Figure 3. Soil bulk density under different vegetation covers in Zamora Chinchipe Province, Ecuador. Bars represent the mean soil bulk density, expressed in grams per cubic centimeter (g cm−3). Upper bars indicate the standard error of the mean. Different letters above the bars denote statistically significant differences among vegetation covers according to the applied statistical test (p < 0.05).
Agronomy 16 00967 g003
Figure 4. Soil pH under different vegetation covers. The columns represent the mean soil pH. The bars above indicate the standard error of the mean. Different letters above the columns indicate statistically significant differences between vegetation covers, according to the applied statistical test (p < 0.05).
Agronomy 16 00967 g004
Figure 5. Soil organic matter content under different vegetation covers. The columns represent the mean soil organic matter content, expressed as a percentage (%). The bars above indicate the standard error of the mean. Different letters above the columns indicate statistically significant differences between vegetation covers, according to the applied statistical test (p < 0.05).
Agronomy 16 00967 g005
Figure 6. Soil carbon (C) stocks under different vegetation covers. Columns represent the mean soil carbon stocks across the different vegetation systems. Upper bars indicate the standard error of the mean. Different letters above the columns denote statistically significant differences among vegetation covers, according to the statistical test applied (p < 0.05).
Agronomy 16 00967 g006
Figure 7. Pearson correlations of the analyzed variables.
Agronomy 16 00967 g007
Table 1. Tree species associated with coffee and cacao agroforestry systems and forest species in Zamora Chinchipe.
SystemScientific NameGrowth HabitReference
Cacao agroforestry
(n = 16)
Inga insignis Kunth
Erythrina poeppigiana
Terminalia amazonia
Cordia alliodora (Ruiz & Pav.)
Trees, shrubs[14]
Citrus sinensis
Citrus × limonia
Psidium guajava
Fruit trees
Coffee agroforestry
(n = 30)
Cordia alliodora (Ruiz & Pav.)
Inga insignis Kunth
Erythrina edulis Micheli
Cedrela montana Moritz ex Turcz
Clusia sp.
Trees, shrubs[23,24]
Citrus × limonia Osbeck.Fruit trees[23,24]
Musa paradisiaca
Ipomoea batatas
Colocasia esculenta
Musa acuminata
Arracacia xanthorrhiza
Ananas comosus
Herbaceous species[23,24]
ForestGrias peruviana
Iriartea deltoidea
Bathysa sp.
Ladenbergia oblongifolia
Psychotria brachiate Sw.
Tetrorchidium andinum Mull. Arg.
Palicourea sp.
Weinmannia sorbifolia Kunth
Alchornea glandulosa Poepp.
Nectandra lineatifolia (Ruiz & Pav.) Mez
Trees, shrubs[23,25]
Table 2. Survey administered to the producers of the farms selected for the study.
FeatureRecorded Variables
General informationRegistration date, association, producer, ID number, farm, area (ha), province, canton, parish, sector.
Production (kg year−1)Production of cocoa and coffee fruits (initial product, qq year−1) and dry parchment coffee (qq year−1).
Crop managementInputs, materials, tools, equipment and machinery used in fertilization, pruning, phytosanitary control, harvesting, selection and drying.
Tree componentIdentification of 4 dominant species per hectare (number of plants, DBH and height).
Waste managementType of waste and method of disposal: reuse, collection, composting, anaerobic digestion, uncontrolled incineration, open-air decomposition, burial or scrap metal.
Inputs produced on the farmCompost, biol, humus and beneficial microorganisms (kg or liters year−1).
TransportType of transport used for supplies, materials, equipment and harvested product.
Energy consumptionUse of electrical equipment and fuels (natural gas, LPG, diesel and gasoline) per process/equipment.
Table 3. Emission intensity, product, and area of the farms under study in Zamora Chinchipe.
CacaoCoffee
ParameterMeanStandard ErrorMeanStandard Error
Farm area (ha)10.094.341.06
Forest area (ha)6.342.416.34 *2.41
Product emissions intensity
(kg CO2eq/kg product)
1.260.311.950.09
* This corresponds to the average value of the farms that had forest cover, since not all the farms in the study had forest.
Disclaimer/Publisher’s Note: The statements, opinions and data contained in all publications are solely those of the individual author(s) and contributor(s) and not of MDPI and/or the editor(s). MDPI and/or the editor(s) disclaim responsibility for any injury to people or property resulting from any ideas, methods, instructions or products referred to in the content.