Article

Leguminous Cover Crops Promote Microbial Community Diversity in the Rhizosphere Soil of Tea Plants: Insights from 16S rRNA Microbiome Analysis

1
State Key Laboratory of Agricultural and Forestry Biosecurity, Department of Entomology, College of Plant Protection, Nanjing Agricultural University, Nanjing 210095, China
2
College of Horticulture, Nanjing Agricultural University, Nanjing 210095, China
3
State Key Laboratory for Biology of Plant Disease and Insect Pests, Institute of Plant Protection, Chinese Academy of Agricultural Sciences, Beijing 100193, China
*
Author to whom correspondence should be addressed.
Agronomy 2025, 15(9), 2217; https://doi.org/10.3390/agronomy15092217
Submission received: 27 August 2025 / Revised: 14 September 2025 / Accepted: 18 September 2025 / Published: 19 September 2025
(This article belongs to the Section Innovative Cropping Systems)

Abstract

The integration of leguminous cover cropping systems (LCR), particularly soybean (LC-S) and cowpea (LC-C), into tea agroecosystem provides a sustainable strategy to enhance soil ecosystem services by promoting beneficial soil microbial communities through the modulation of the rhizosphere microbiome in the tea rhizosphere soil. This study employs 16S rRNA gene sequencing to assess how these leguminous cover crops, when incorporated as green manure within the tea row spaces, influence the microbial community diversity in the rhizosphere soil of tea plants. Compared to conventional monoculture tea plantations (CK), the introduction of LC-S and LC-C significantly reshape the microbial communities in the tea rhizosphere soil. They promote the abundance of copiotrophic and specialized taxa such as Proteobacteria, Actinobacteria, and Mycobacterium, which are crucial for nutrient cycling and organic matter decomposition. Additionally, LC-S and LC-C enrich beneficial microbes including Chloroflexi, Bradyrhizobium, Acidothermus, and Cyanobacteria, supporting processes like nitrogen fixation and pathogen suppression. The metagenomic analysis confirms that leguminous cover crops consistently increase bacterial diversity and enrich beneficial phyla vital for soil nutrient dynamics, organic matter breakdown, and environmental stress resilience. Furthermore, microbial genera linked to nitrogen mobilization and complex organic matter degradation are promoted, underpinning the synthesis of nitrogenous compounds (such as theanine, amino acids), polyphenolic secondary metabolites (like flavonoids), and volatile organic compounds essential for tea quality. Functional pathway analyses revealed that LC-S enhances degradation pathways involved in carbohydrate and aromatic compound metabolism, augmenting precursors for key bioactive constituents such as theanine and catechins. Conversely, LC-C favors glycan biosynthesis and degradation pathways, likely improving root–microbe interactions and micronutrient uptake, both critical for polyphenol biosynthesis. Collectively, these microbiome-driven changes improve tea’s sensory qualities, including flavor, aroma, and antioxidant capacity, by enriching bioactive compounds. This microbiome-mediated agro-ecological approach offers a sustainable alternative to conventional monoculture, enhancing soil functionality, ecological resilience, and the economic viability of tea production systems.

1. Introduction

Tea (Camellia sinensis (L.) O. Kuntze) is a perennial, broadleaf industrial beverage crop with a long lifespan, extensively cultivated across tropical and subtropical climates of Asia, Africa, and Latin America. Its importance is primarily attributed to bioactive constituents, including catechins, amino acids, and caffeine that critically influence taste, quality, and aroma [1,2]. The rhizosphere region represents a microbial hotspot that profoundly affects plant physiology and development [3]. In this region, the diverse microbial communities provide essential ecosystem services for enhancing nutrient bioavailability, phytopathogen suppression, and the potential to modulate tea quality [4,5]. Moreover, rhizosphere microbiota facilitate key biogeochemical processes, such as carbon fixation by phototrophic and chemoautotrophic microbes, along with the cycling of nitrogen through processes such as fixation, nitrification, denitrification, and mineralization, thereby serving a vital function in carbon, nitrogen, phosphorus, and sulfur cycles [6,7].
Contemporary agricultural practices characterized by intensive nitrogen fertilization and substantial use of synthetic chemicals often lead to a decrease in soil biota diversity, which results in diminished long-term soil fertility and exacerbated soil acidification [8,9]. Tea plantation ecosystems, vital as carbon sinks, are threatened by prolonged monoculture, which reduces soil pH, tea amino acids, and phenolic compounds [10], but alter shoot quality [11]. Long-term studies reveal trade-offs between yield and soil bacterial diversity, with organic practices influencing soil microbes [12]. To balance the trade-offs, agro-ecological approaches such as intercropping, green manuring, and cover cropping are being encouraged to limit chemical inputs, improve soil quality, and sustain tea quality. Among these techniques, planting leguminous cover crops between tea rows is recognized as a particularly efficient strategy within the tea agroecosystem, contributing substantially to soil fertility and ecosystem stability [13]. Cover cropping with leguminous crops, such as soybean and milkvetch within the spaces of tea plantation rows offers a sustainable alternative in boosting the rhizospheric interaction among the soil microbial communities by fixing atmospheric nitrogen, mitigating dependence on synthetic nitrogen fertilizers, and ameliorating soil acidity [14,15].
Beneficial soil bacterial genera, like Bacillus, Pseudomonas, and Paenibacillus, enhance the growth of tea plants by synthesizing phytohormones and suppressing pathogens [16,17]. Prominent phyla, like Proteobacteria and Acidobacteria are, are instrumental in nitrogen fixation and the breakdown of organic matter, which in turn bolsters soil ecosystem services [18,19]. Intercropping tea with leguminous crops alters the rhizosphere community by increasing the abundance of plant growth-promoting bacteria (PGPB) such as Allorhizobium, Bradyrhizobium, and Burkholderia, as well as enriching genera like Sphingomonas and Mycolicibacterium, thereby improving nitrogen availability, suppressing soil-borne pathogens, and facilitating nutrient absorption [14,15,20]. Moreover, intercropping tea with leguminous crops such as soybean, Kudzu, and Laredo soybean, enhances soil enzyme activity, organic carbon content, and microbial balance (amplifying oligotrophic/copiotrophic taxa), which in turn promotes aromatic amino acid synthesis and tea flavor development via root–microbe metabolite interactions [21,22,23]. Therefore, we hypothesize that leguminous cover crops incorporated as green manure within tea row spaces will stabilize the tea agroecosystem by fostering nutrient metabolism, microbial interactions, and sustainable soil health, ultimately enhancing tea quality and productivity. Over a two-year period, a field investigation was conducted to assess the synergistic influence of two prominent leguminous green manure cover crops, specifically soybean (S) and cowpea (C), on the composition and diversity of soil microbial communities in the rhizosphere soil of tea plants. High throughput 16S rRNA gene sequencing was employed to characterize and compare the microbial assemblages associated with the incorporation of leguminous cover crops as compared to the conventional monoculture tea plantation (CK). Moreover, the study systematically investigated key metabolic pathways involved in synthesis of key tea functional foliar nutritional and bioactive compounds and its interaction with rhizosphere microbial diversity as modulated by the introduction of leguminous green manure cover crops.

2. Materials and Methods

2.1. Study Site and Plant Material

This study was conducted at the Zhongshanlin Tea Experimental Base Station (32°02′59.9964″ N, 118°46′00.0120″ E), with an elevation of 200 m in the Nanjing Zhongshanlin Scenic Area, Jiangsu Province of China. The site featured a >15 year established plantation of Camellia sinensis cv. “Nanjing Yuhua” tea. According to China Meteorological Data Service Center, https://data.cma.cn/en (accessed on 17 September 2025), regional climate averages during the experimental duration (i.e., 2022–2023) included the following: 16 °C mean annual temperature, 1106 mm annual precipitation, 224-day frost-free period, and relative humidity averaged 68%. Moreover, the topsoil layers (0–20 cm depth) in tea gardens are distinguished by a sandy loam texture and pH values that are strongly acidic, specifically between 4.0 and 5.5. These soils typically contain moderate-to-high organic matter content (1.5–3.5%), exhibit moderate nitrogen availability, show a lack of available phosphorus, and possess moderate levels of available potassium.

2.2. Experimental Design and Treatments

Twenty-seven tea rows (1.50 m row spacing × 0.50 m plant spacing) were selected for experimentation. In June 2022 and 2023, two treatments of leguminous cover cropping (LCR) were established: (i) soybean (LC-S): Glycine max cv. Lamar sown between tea rows and (ii) Cowpea (LC-C): Vigna unguiculata cv. Suxia No.1 sown between tea rows. The green manure cover crops, i.e., soybean and cowpea were planted between the spaces of tea plantation rows at 0.20 m row spacing × 0.30 m plant spacing adjacent to tea plants. Seeds of soybean and cowpea were obtained from the National Soybean Improvement Center (NSIC), Nanjing Agricultural University, China. Nine tea rows without leguminous cover crops were maintained under monoculture and served as the control (CK) treatment.
In advance of establishing the leguminous green manure intercrops, the tea plants were subjected to light pruning, with particular attention given to the removal of side branches. Subsequently, all pruned branches were carefully cleared from the tea rows to maintain field hygiene. The tea crop under study corresponded to the summer tea phenological cycle, cultivated from July to September. Early maturing soybean seeds (cv. Lamar~120 days) were sown in the spaces of tea rows and completed different stages of lifecycle (germination, vegetative growth, flowering, pod development, and maturity). Similarly, early maturing determinate cowpea seeds (cv. Suxia No.1 ~90 days) were sown in the spaces of tea rows and completed different stages of lifecycle as mentioned in the case of soybean. Seeds of both legume covers, soybean and cowpea, were sown in June, and after the maturity stages were attained, they were incorporated as a green manure in the tea rows at the end of September. Moreover, the legume covers were planted at tea spaces rows by maintaining specific row-to-row and plant-to-plant distances so that cover crops will not compete with the main crop of tea plant for resources. The cowpea variety selected exhibits a bushy growth habit and follows a determinate life cycle, preventing vine development that could interfere with tea plant growth.

2.3. Plot Layout

The experimental design included three replicates per treatment (i.e., LC-S, LC-C, and CK). And there were nine randomized complete block design plots (6 m length and 4 m width for each plot), each plot containing two tea rows and two adjacent rows of leguminous intercrop (i.e., soybean or cowpea) for the LCR treatments, and no intercropping with either leguminous cover crops for the CK treatments. The cover crops were sown within the spaces of tea rows in June 2022 and grown till the maturity stages, then removed and left for the decomposition in the inter-row spaces. The procedure was repeated in 2023 following the same agronomic and cultural practices. Periodic manual weeding once a month was performed so that the weed does not compete for the resources with the legume intercrops and tea plants. No tillage, chemical fertilizers, or pesticides were applied during this study. Figure 1 illustrates the field layout.

2.4. Soil Microbial Community

On October 30 of 2023, after two successive years (2022–2023) of leguminous cover cropping, tea rhizosphere soil samples within the space of tea rows (i.e., monoculture tea rows, soybean and cowpea cover cropped tea row) were obtained from tea plantations by extracting intact root-zone cores (20 cm2 surface area × 30 cm depth) from three randomly selected locations or points in each plot. Rhizosphere soil was separated from the roots through a 10 min manual agitation in 1 L of sterile 0.9% NaCl solution as per the procedure mentioned by [24]. The samples were promptly placed in polyethylene bags to avoid drying out and were stored at 4 °C. The rhizosphere soil samples were immediately sent to Shanghai Paissano Gene Cloud Biotechnology Co., Ltd., located at Building 2, Juke Biotech Park, No. 218 Yindu Road, Xuhui District, Shanghai, China, for 16S rRNA gene sequencing (Shanghai Paissano Gene Cloud Biotechnology Co., Ltd., Shanghai, China) for 16S rRNA gene sequencing. Bacterial communities were analyzed through 454 pyrosequencing according to the procedure mentioned by [25,26]. Total genomic DNA was extracted from 0.25 g samples of homogenized soil utilizing the FastDNA SPIN Kit (MP Biomedicals). The concentrations of DNA were measured fluorometrically (PicoGreen dsDNA Assay) and standardized to 3.5 ng/μL.
The V5-V7 hypervariable regions were amplified through duplicate 50-μL PCR reactions (each conducted in triplicate technical replicates) employing primers 799F/1193R and KAPA HiFi HotStart ReadyMix under standard cycling conditions: an initial denaturation at 95 °C for 3 min; followed by 30 amplification cycles of 95 °C for 30 s, 55 °C for 30 s, and 72 °C for 45 s; and a final extension at 72 °C for 5 min. Subsequently, the pooled PCR products were purified using AMPure XP beads, quantified, and adjusted to equimolar concentrations.

2.4.1. DNA Sequencing and Data Processing

The Illumina sequencing data were processed and analyzed using established bioinformatics workflows. Raw sequences were de-multiplexed via sample-specific barcodes, followed by trimming of adapter and primer sequences. Quality control measures included filtering low-quality reads and re-sequencing compromised samples to ensure data robustness. Sequences were error-corrected and denoised using the QIIME2 DADA2 pipeline to generate amplicon sequence variants (ASVs), while V-search software clustered reads into operational taxonomic units (OTUs) at 97% similarity. Taxonomic classification was performed by aligning representative OTU/ASV sequences against the SILVA reference database (version 132) available at https://www.arb-silva.de/ (accessed on 17 September 2025).

2.4.2. Taxonomic and Diversity Analyses

ASVs/OTUs were taxonomically classified using reference databases (SILVA, Greengenes) to characterize tea rhizosphere soil microbial composition across various hierarchical levels (domain to species).
To evaluate the diversity of microbial communities within the rhizospheric soil region of tea, the ecological indices of alpha diversity were utilized; Chao1 index, Observed ASVs, Shannon diversity index, Simpson diversity index, Faith’s PD, Pielou’s evenness, and Good’s coverage index. All these indices were computed using QIIME2 (v2019.4) [27]. Unrarefied ASV tables underwent depth-controlled rarefaction via the alpha-rarefaction command, with parameters set to minimum depth = 10; maximum depth = 95% of the shallowest sample’s sequence count; 10 depth intervals; and 10 iterations per depth. Final values represent averages at the maximum rarefaction depth. Results were visualized using the ggplot2 package (version 4.3.2, Vienna, Austria). Moreover, the beta-diversity analysis was conducted via nonmetric multidimensional scaling (NMDS) based on Bray–Curtis dissimilarity, complemented by PERMANOVA (vegan R package) to assess significant differences in community structure across samples. Differential abundance of taxa between groups was evaluated using STAMP (v2.13).
ASV/OTU richness was assessed as a function of sampling depth, ensuring sequencing sufficiency. Rank Abundance Curves (RAC) were generated at Log2-transformed abundances illustrating dominance patterns of high- vs. low-abundance taxa. Species accumulation curves were utilized to evaluate the completeness of sampling by graphing the total number of observed species (ASVs/OTUs) against the cumulative number of samples collected. These curves provided an assessment of sampling adequacy: an upward-trending curve indicated that further samples were required to fully characterize community diversity, whereas a plateau suggested that most taxa had been identified. To create the curve, we employed the specaccum function from the vegan package in R. This function was applied directly to the ASV/OTU abundance matrix (with samples represented as rows and taxa as columns). It calculated the expected number of species that would accumulate with the incremental addition of samples. The resulting specaccum object was subsequently plotted using R’s standard plot function. This visualization illustrated the relationship between sampling effort and species richness, facilitating the evaluation of whether the curve reached an asymptote.
In order to characterize the structure of microbial communities, rank abundance curves were developed for each sample or group. ASVs/OTUs were systematically arranged in descending order according to their abundance, with each receiving a sequential rank position along the horizontal axis (where rank 1 denoted the most abundant taxon). The corresponding abundance value for each ranked ASV/OTU was optionally transformed (using Log2, Log10, percentage conversion, or left untransformed) and subsequently plotted on the vertical axis. These transformed abundance values were then connected by lines to create the characteristic curve. This visualization was generated programmatically in R through the use of sorting and plotting functions. The resulting curve illustrated the distribution of abundance within the community, revealing characteristics such as the presence of dominant high-abundance taxa, the prevalence of rare taxa, and the overall evenness of species distribution, which could be inferred from the curve’s shape and steepness.
Rarefaction curves were constructed in QIIME2 (v2019.4) to evaluate the adequacy of sampling and to compare alpha diversity among samples at standardized sequencing depths. In line with ecological principles [28,29], the analysis iteratively subsampled the sequence library of each sample (without replacement) at incrementally increasing depths, reaching up to 95% of the original read count. At each depth level, the average number of observed ASVs was calculated over 10 replicate subsamples. This curve visualizes the asymptotic relationship between sequencing effort and richness (ASV accumulation), enabling comparisons of diversity across samples at consistent sequencing depths and confirming whether community richness was sufficiently captured.

2.4.3. Visualization and Community Structure

Microbial community composition across samples was visualized using stacked bar charts. Following singleton removal from the feature table, relative abundances were analyzed according to phylum through species taxonomic levels. Results were presented as compositional bar plots generated in QIIME2 (version 2019.4, Arizona, USA). Phylum, genus, and species level heat maps were generated using the top 20 genera (by average abundance), with hierarchical clustering based on correlation matrices.
Following the framework outlined by [30], taxonomic trees were assembled. Hierarchical community composition was visualized via packed-circle diagrams (phyla [outer] to species [inner]), scaled to relative abundance. Abundance data were integrated as pie charts at ASV/OTU nodes, with specific taxonomic levels highlighted through color coding. The analyses were carried out in R, using the ggraph and ggplot2 packages.
Interactive hierarchical diagrams (domain to species) were constructed, with fan sizes scaled to relative abundances. Complementary taxonomic exploration was performed using Krona [31] for interactive community composition analysis.

2.4.4. Functional and Metabolic Pathway Analysis

Bacterial metabolic functions were inferred from 16S rRNA gene sequencing data, with differential metabolic pathways and their taxonomic contributors identified. Clean reads were assembled into contigs (minimum length: 500 bp) using MegaHit [32]. Open reading frames (ORFs) were predicted from contigs using Prodigal [33] and clustered into non-redundant gene sets via CD-HIT (parameters: 95% identity, 90% coverage; [34]), retaining the longest sequence per cluster as representative. Functional annotation was performed by aligning representative genes against the Kyoto Encyclopedia of Genes and Genomes (KEGG) database using BLASTX. Pathway assignments were derived from KEGG ontology (KO) annotations, enabling functional profiling of tea rhizosphere soil samples.
Functional dissimilarity between tea rhizosphere soil samples was assessed using Bray–Curtis-based principal coordinates analysis (PCoA) for KEGG, COG, and MetaCyc pathways. Differentially enriched pathways (detected in ≥30% of samples per group) were visualized using color-coded bar plots (CK: blue; S: red; C: green) to highlight group-specific metabolic signatures.

2.5. Data Analysis

Species biomarkers were assessed (LDA score > 2, Wilcoxon p < 0.05) via cladograms and one-against-all comparisons, prioritizing group-specific taxa. And orthogonal signal correction partitioned variance into predictive (inter-group) and orthogonal (intra-group) components, which were validated using VIP scores. Moreover, The Bray–Curtis dissimilarity matrices were computed and visualized via PCoA, NMDS, and hierarchical clustering analysis. Bray–Curtis distance matrices at phylum, genus, and species levels were assessed to investigate sample similarity. In addition, 95% confidence ellipses (for groups with n ≥ 4) validated cluster separation in ordination plots. PERMANOVA tests were generated and evaluated for investigating the tested group differences (CK vs. LC-S/LC-C) using permutation-based multivariate ANOVA. Moreover, Wilcoxon rank-sum Tests were analyzed to ensure biomarker robustness (minimum n = 3 per group).

3. Results

3.1. OTU/ASV Sequences of Microbes in the Collected Rhizosphere Soil Samples

To elucidate the evolutionary relationships among OTUs, a multiple sequence alignment was performed using MUSCLE (v3.8.31), which produced phylogenetically informative sequence comparisons. A consistent sequencing depth was achieved with 974,940 raw input reads across all rhizosphere soil samples collected from the rows of monoculture tea plantation (CK) and leguminous cover-cropped tea plantations (LC-S and LC-C). After quality filtering, denoising, merging, and removing chimeric and singleton reads, 497,662 high-confidence OUTs were obtained for downstream diversity and taxonomic analyses. The bioinformatics pipeline demonstrated robust processing with average retention rates of 49.88% for CK, 51.52% for LC-S, and 51.75% for LC-C (Table S1). The rhizospheric region soil samples obtained from the rows of leguminous cover-cropped tea plantations (LC-S and LC-C) exhibited higher clean read counts compared to that from the rows of monoculture tea plantation (CK), highlighting the enhanced microbial diversity associated with cover cropping practices integrated with legume cover crops in the tea agroecosystem (Supplementary Table S1).

3.2. Species Composition

3.2.1. Species Taxonomic Annotation

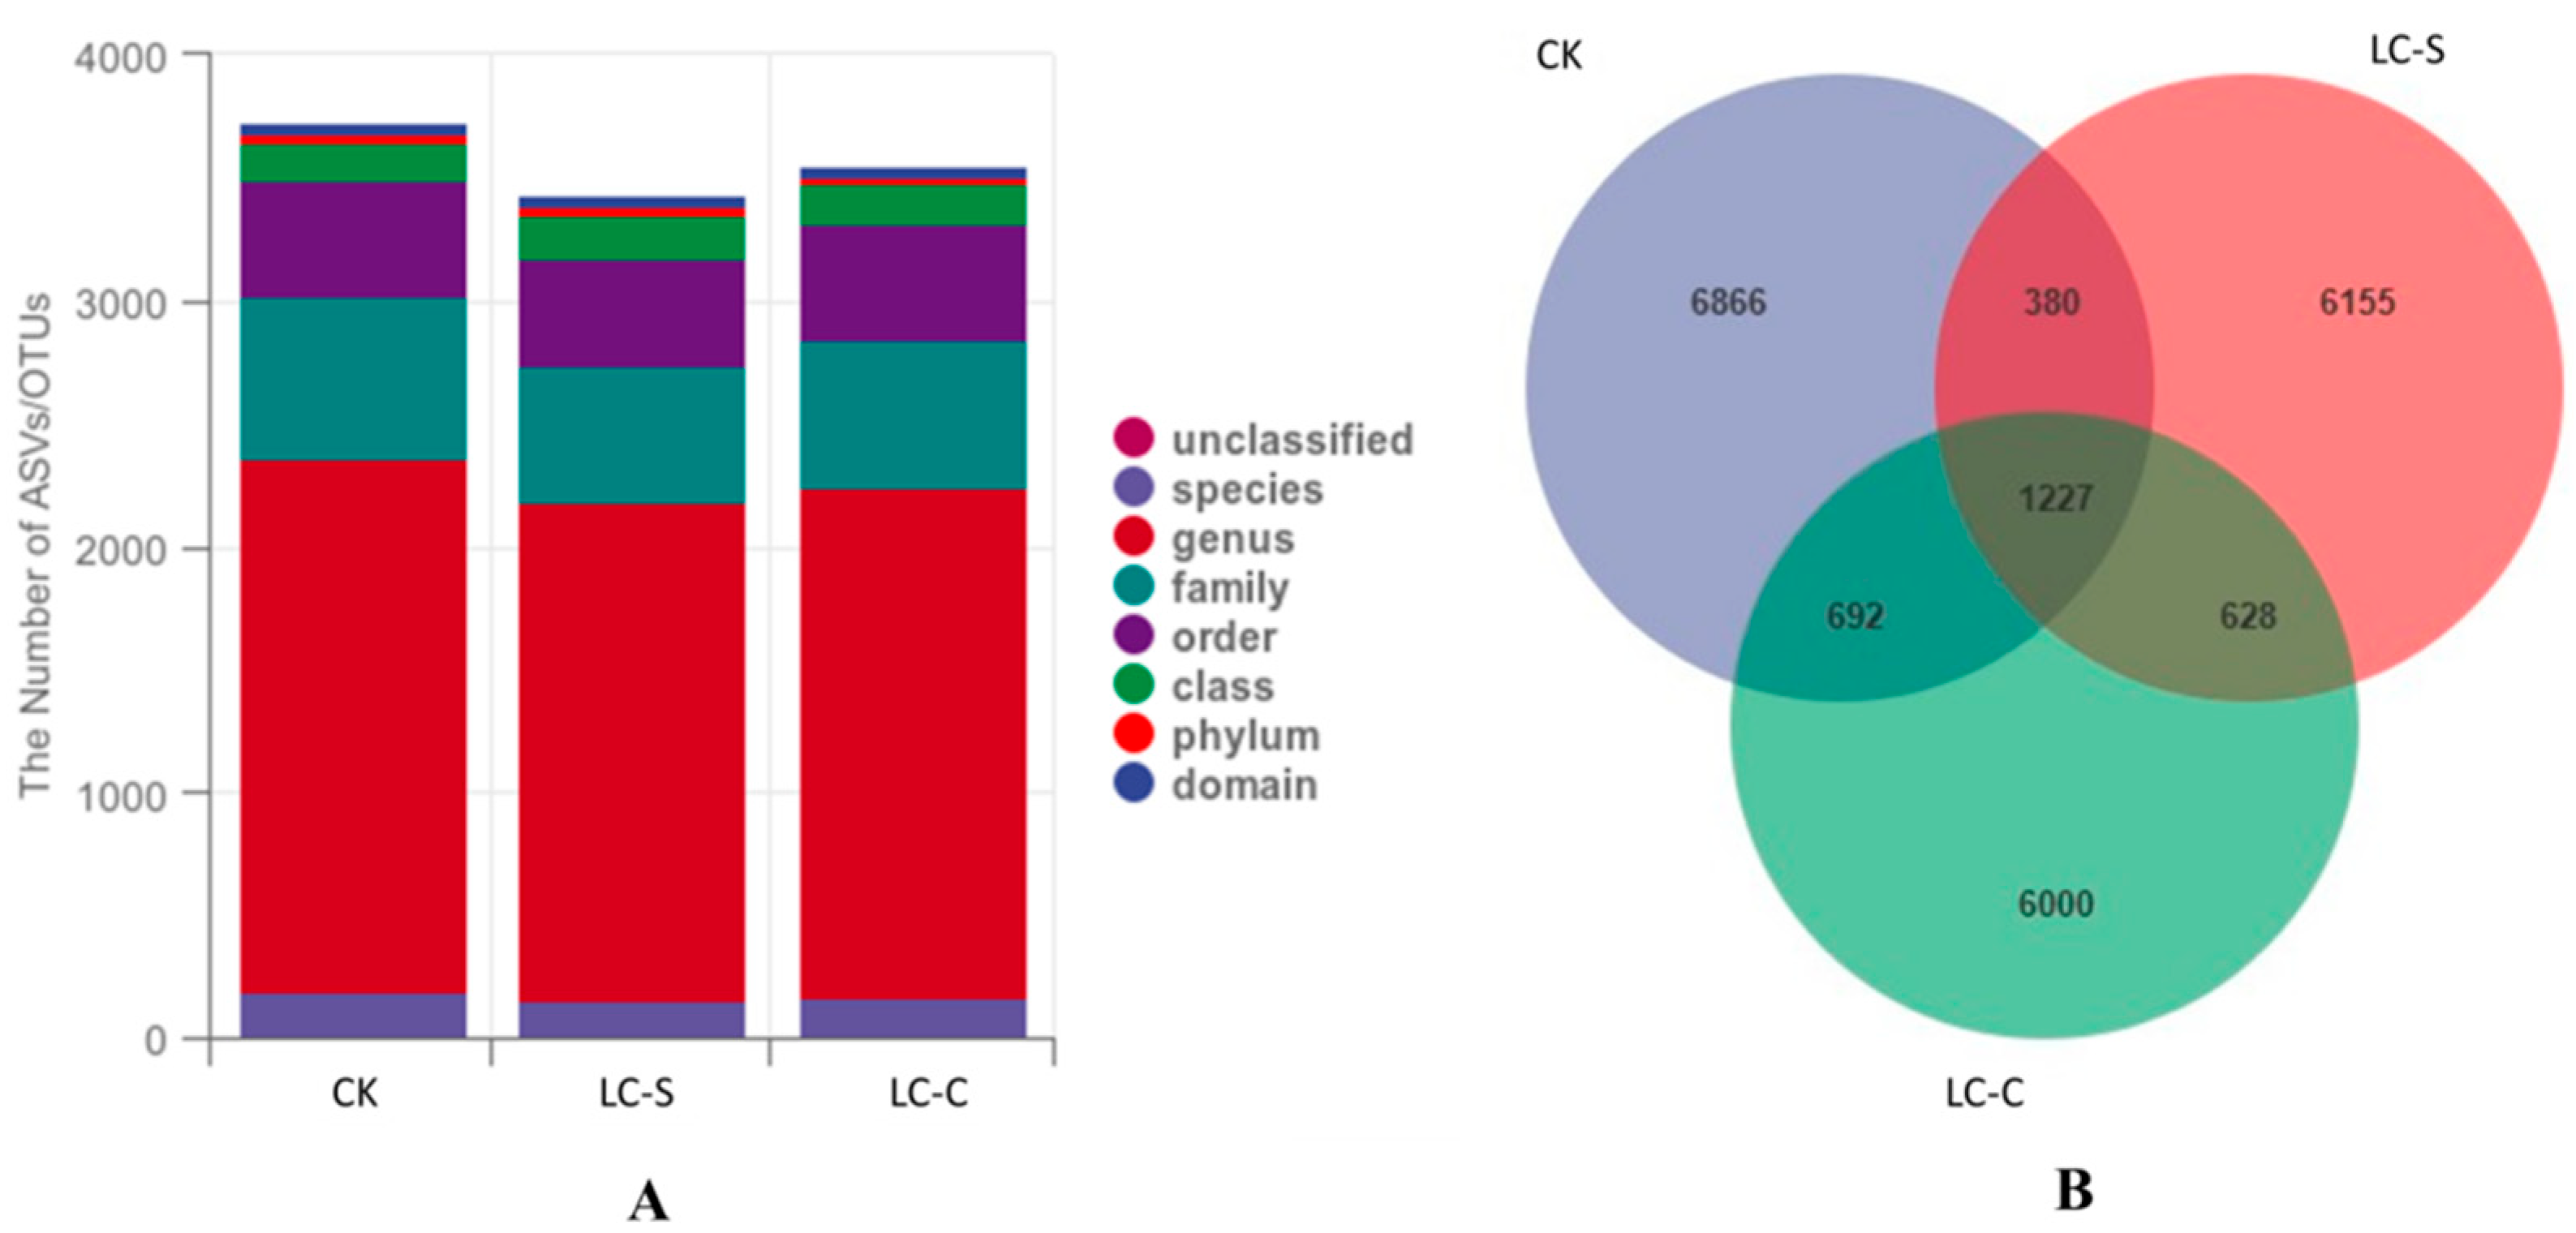
The taxonomic species annotation, represented by ASVs/OTUs counts of the rhizosphere microbial communities, was analyzed across the treatments of monoculture tea plantation (CK) and leguminous cover-cropped tea plantations (LC-S and LC-C) (Figure 2A). The number of ASVs/OTUs was expressed as the mean number of taxa within sample groups, with relative abundances presented as percentages. For the control of CK, the taxonomic hierarchy demonstrated relative abundances of domain (42; 1%), phylum (31.67; 1%), class (162.33; 4%), order (469.67; 13%), family (658.67; 18%), genus (2167; 58%), species (191.33; 5%), and unclassified bacteria (0.33%). For the LC-S treatment, the composition slightly shifted, with relative abundances of domain (52.33; 2%), phylum (32.33; 1%), class (181; 5%), order (430.33; 13%), family (561; 16%), genus (2023; 59%), species (157; 5%), and no unclassified taxa (0%). Similarly, for the LC-C treatment, the distribution included domain (38; 1%), phylum (30.33; 1%), class (162.33; 5%), order (472; 13%), family (608; 17%), genus (2067.33; 58%), species (169.33; 5%), and unclassified bacteria (0.67%).
Among the treatments, LC-S exhibited marginally higher domain-level diversity (2%) compared to CK and LC-C (1%), while LC-C demonstrated the highest genus-level abundance (2067.33). Unclassified taxa remained negligible (<1%) across all treatments. These findings highlight the subtle yet distinct shifts in microbial community composition associated with leguminous cover-cropping in tea agroecosystems.
The Venn diagram (Figure 2B) revealed distinct microbial community structures between the monoculture tea (CK) and legume cover crop systems (LC-S and LC-C). The control CK exhibited the lowest proportion of unique taxa (14.4% of total ASVs), while LC-S harbored the highest uniqueness (80.5%). Notably, LC-S and LC-C shared substantial overlap (71.8% of total ASVs), indicating high similarity between legume treatments. In contrast, the control, CK, shared minimal ASVs with LC-S (4.5%) and LC-C (8.1%), highlighting its dissimilarity from legume-modified communities. Only 7.4% of ASVs were conserved across all three treatments, underscoring the strong treatment-specific selection of microbiota (Figure 2B).
Moreover, LC-S displayed marginally higher unique diversity than LC-C. Minimal overlap between the treatments of CK and LC-S/C (380 with LC-S; 692 with LC-C) aligned with hierarchical clustering and heat map results. High overlap between LC-S and LC-C (6125 shared ASV/OTUs) was observed and the large ASV/OTU pools in LC-S/C (vs. CK) were prominent (Figure 2B).

3.2.2. Taxonomic Unit Counts

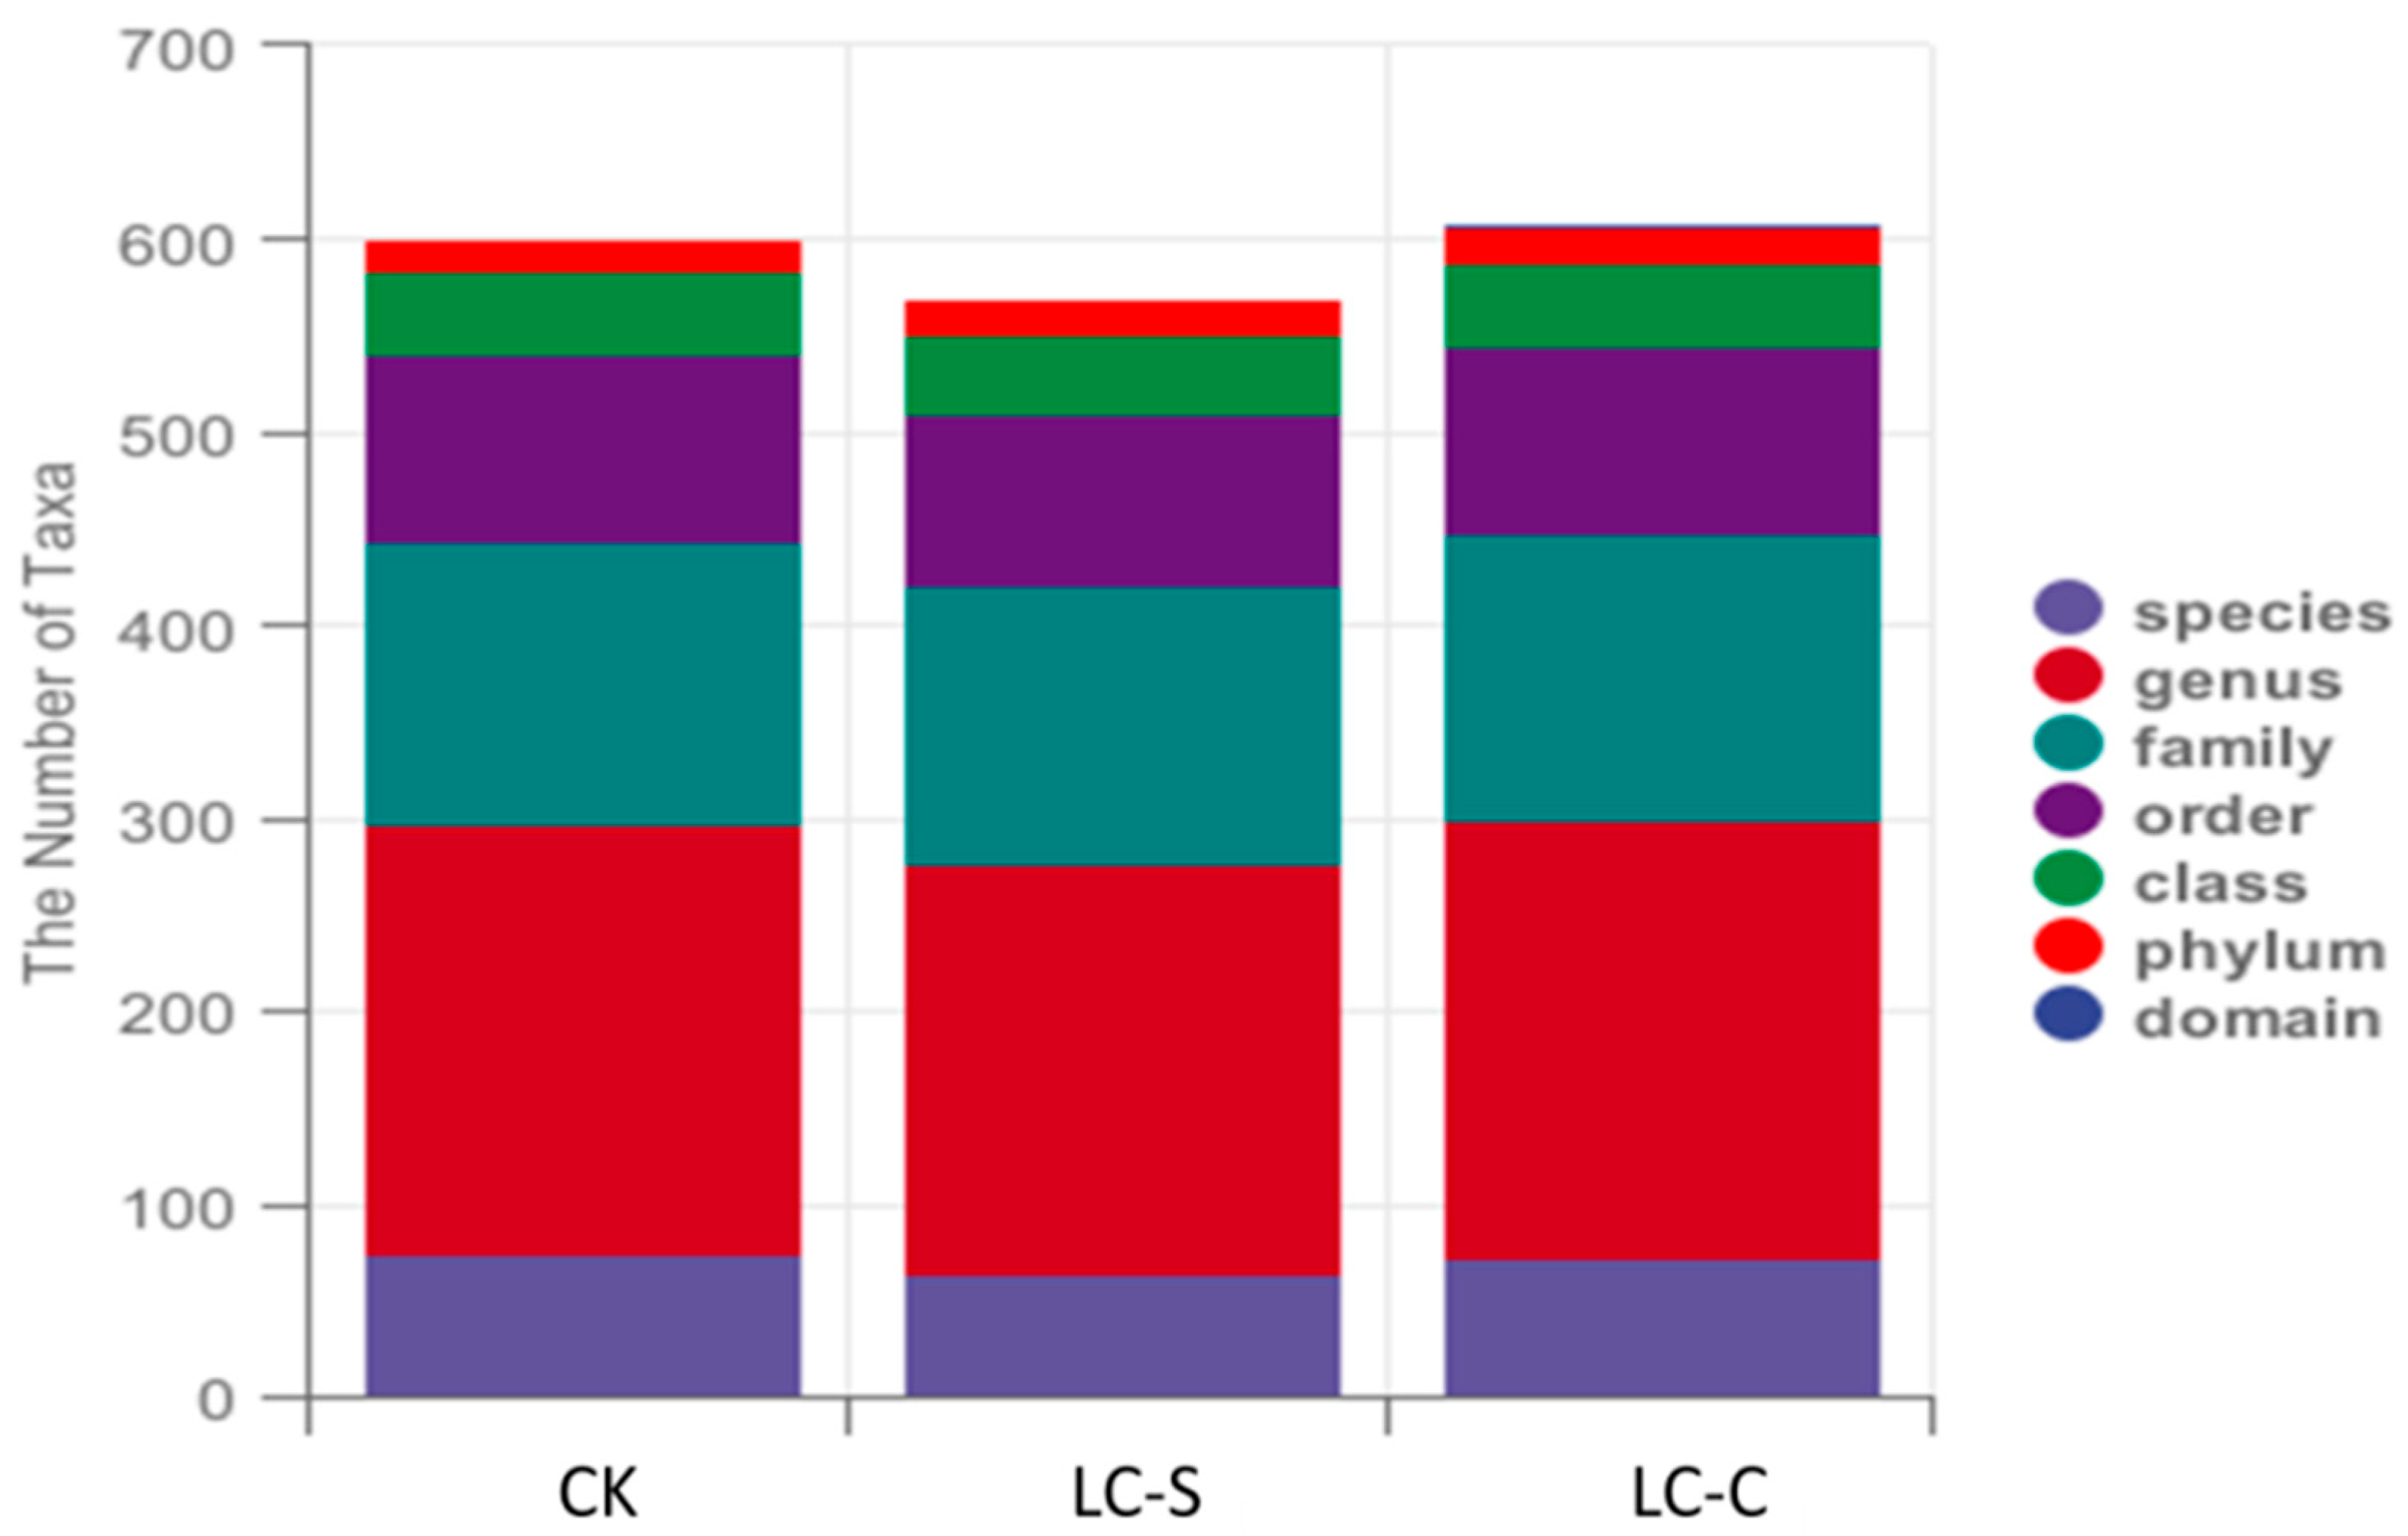
For the control CK, the taxonomic composition was characterized by the following relative abundances of domain (1; 0%), phylum (16.67; 3%), class (44; 7%), order (97; 16%), family (146; 24%), genus (223.33; 37%), and species (73.67; 12%) (Figure 3). For the LC-S treatment, the taxonomic distribution included domain (1; 0%), phylum (19; 3%), class (40; 7%), order (90; 16%), family (143.33; 25%), genus (213.33; 37%), and species (63.67; 11%) (Figure 3). Likewise, the taxonomic structure of the LC-C treatment comprised domain (1; 0%), phylum (18.67; 3%), class (44.33; 7%), order (96.33; 16%), family (148.67; 24%), genus (227; 37%), and species (72.33; 12%) (Figure 3).
Phylum, class, order, and genus levels exhibited consistent proportional contributions across all treatments by 3%, 7%, 16%, and 37%, respectively (Figure 3). Domain-level diversity was negligible (0%) in all groups, while species-level abundance varied slightly (11–12%; Figure 3).
The taxonomic composition of soil bacterial communities in the treatments of CK, LC-S, and LC-C was analyzed by assessing the relative abundance of the top 10 bacterial phyla and genera (Figure 4). Across all treatments, the dominant phyla included Actinobacteria, Proteobacteria, Acidobacteria, Chloroflexi, Planctomycetes, Firmicutes, Gemmatimonadetes, WPS-2, Bacteroidetes, and Nitrospirae (Figure 4A), while the predominant genera comprised Acidothermus, Conexibacter, Mycobacterium, Crossiella, JG30-KF-AS9, Bryobacter, Subgroup 2, WPS-2, Acidibacter, and IMCC26256 (Figure 4B). In the rhizosphere soil of CK, Actinobacteria represented the most abundant phylum (53.56%), followed by Proteobacteria (22.86%), Acidobacteria (10.49%), Chloroflexi 6.10%), and Gemmatimonadetes (1.55%) (Figure 4A), and Acidothermus was the predominant genus (19.20%), followed by Mycobacterium (6.14%) and Conexibacter (4.71%) (Figure 4B).
Leguminous cover cropping altered the composition of bacterial phyla and genera in the rhizosphere soil. At the phylum level, Actinobacteria represented the dominant taxon with numerically higher proportions in LC-S (55.74%) and LC-C (58.92%) versus CK (55.38%). Conversely, Acidobacteria exhibited lower relative abundance in LC-S (7.18%) and LC-C (5.66%) compared to CK (7.50%). Chloroflexi increased to 7.81% in LC-S versus CK (7.33%), while Proteobacteria constituted 21.95% in LC-C compared to CK (2.40%).
At genus level, there were higher proportion of Crossiella (6.62% vs. 5.01%) and Conexibacter (7.53% vs. 6.40%) in LC-S compared to CK, whereas LC-C demonstrated higher Acidothermus (20.15% vs. 18.32%) and reduced Subgroup_2 (0.76% vs. 2.40%) compared with CK (Figure 4B). Moreover, those non-dominant genera collectively represented 57.72% of all soil microbes in CK, 52.54% in LC-S, and 54.35% in LC-C (Figure 4B), while those non-top 10 phyla comprised <1% of all soil microbes across treatments (CK: 0.64%; LC-S: 0.77%; LC-C: 0.88%) (Figure 4A).

3.2.3. Krona Species Composition Map

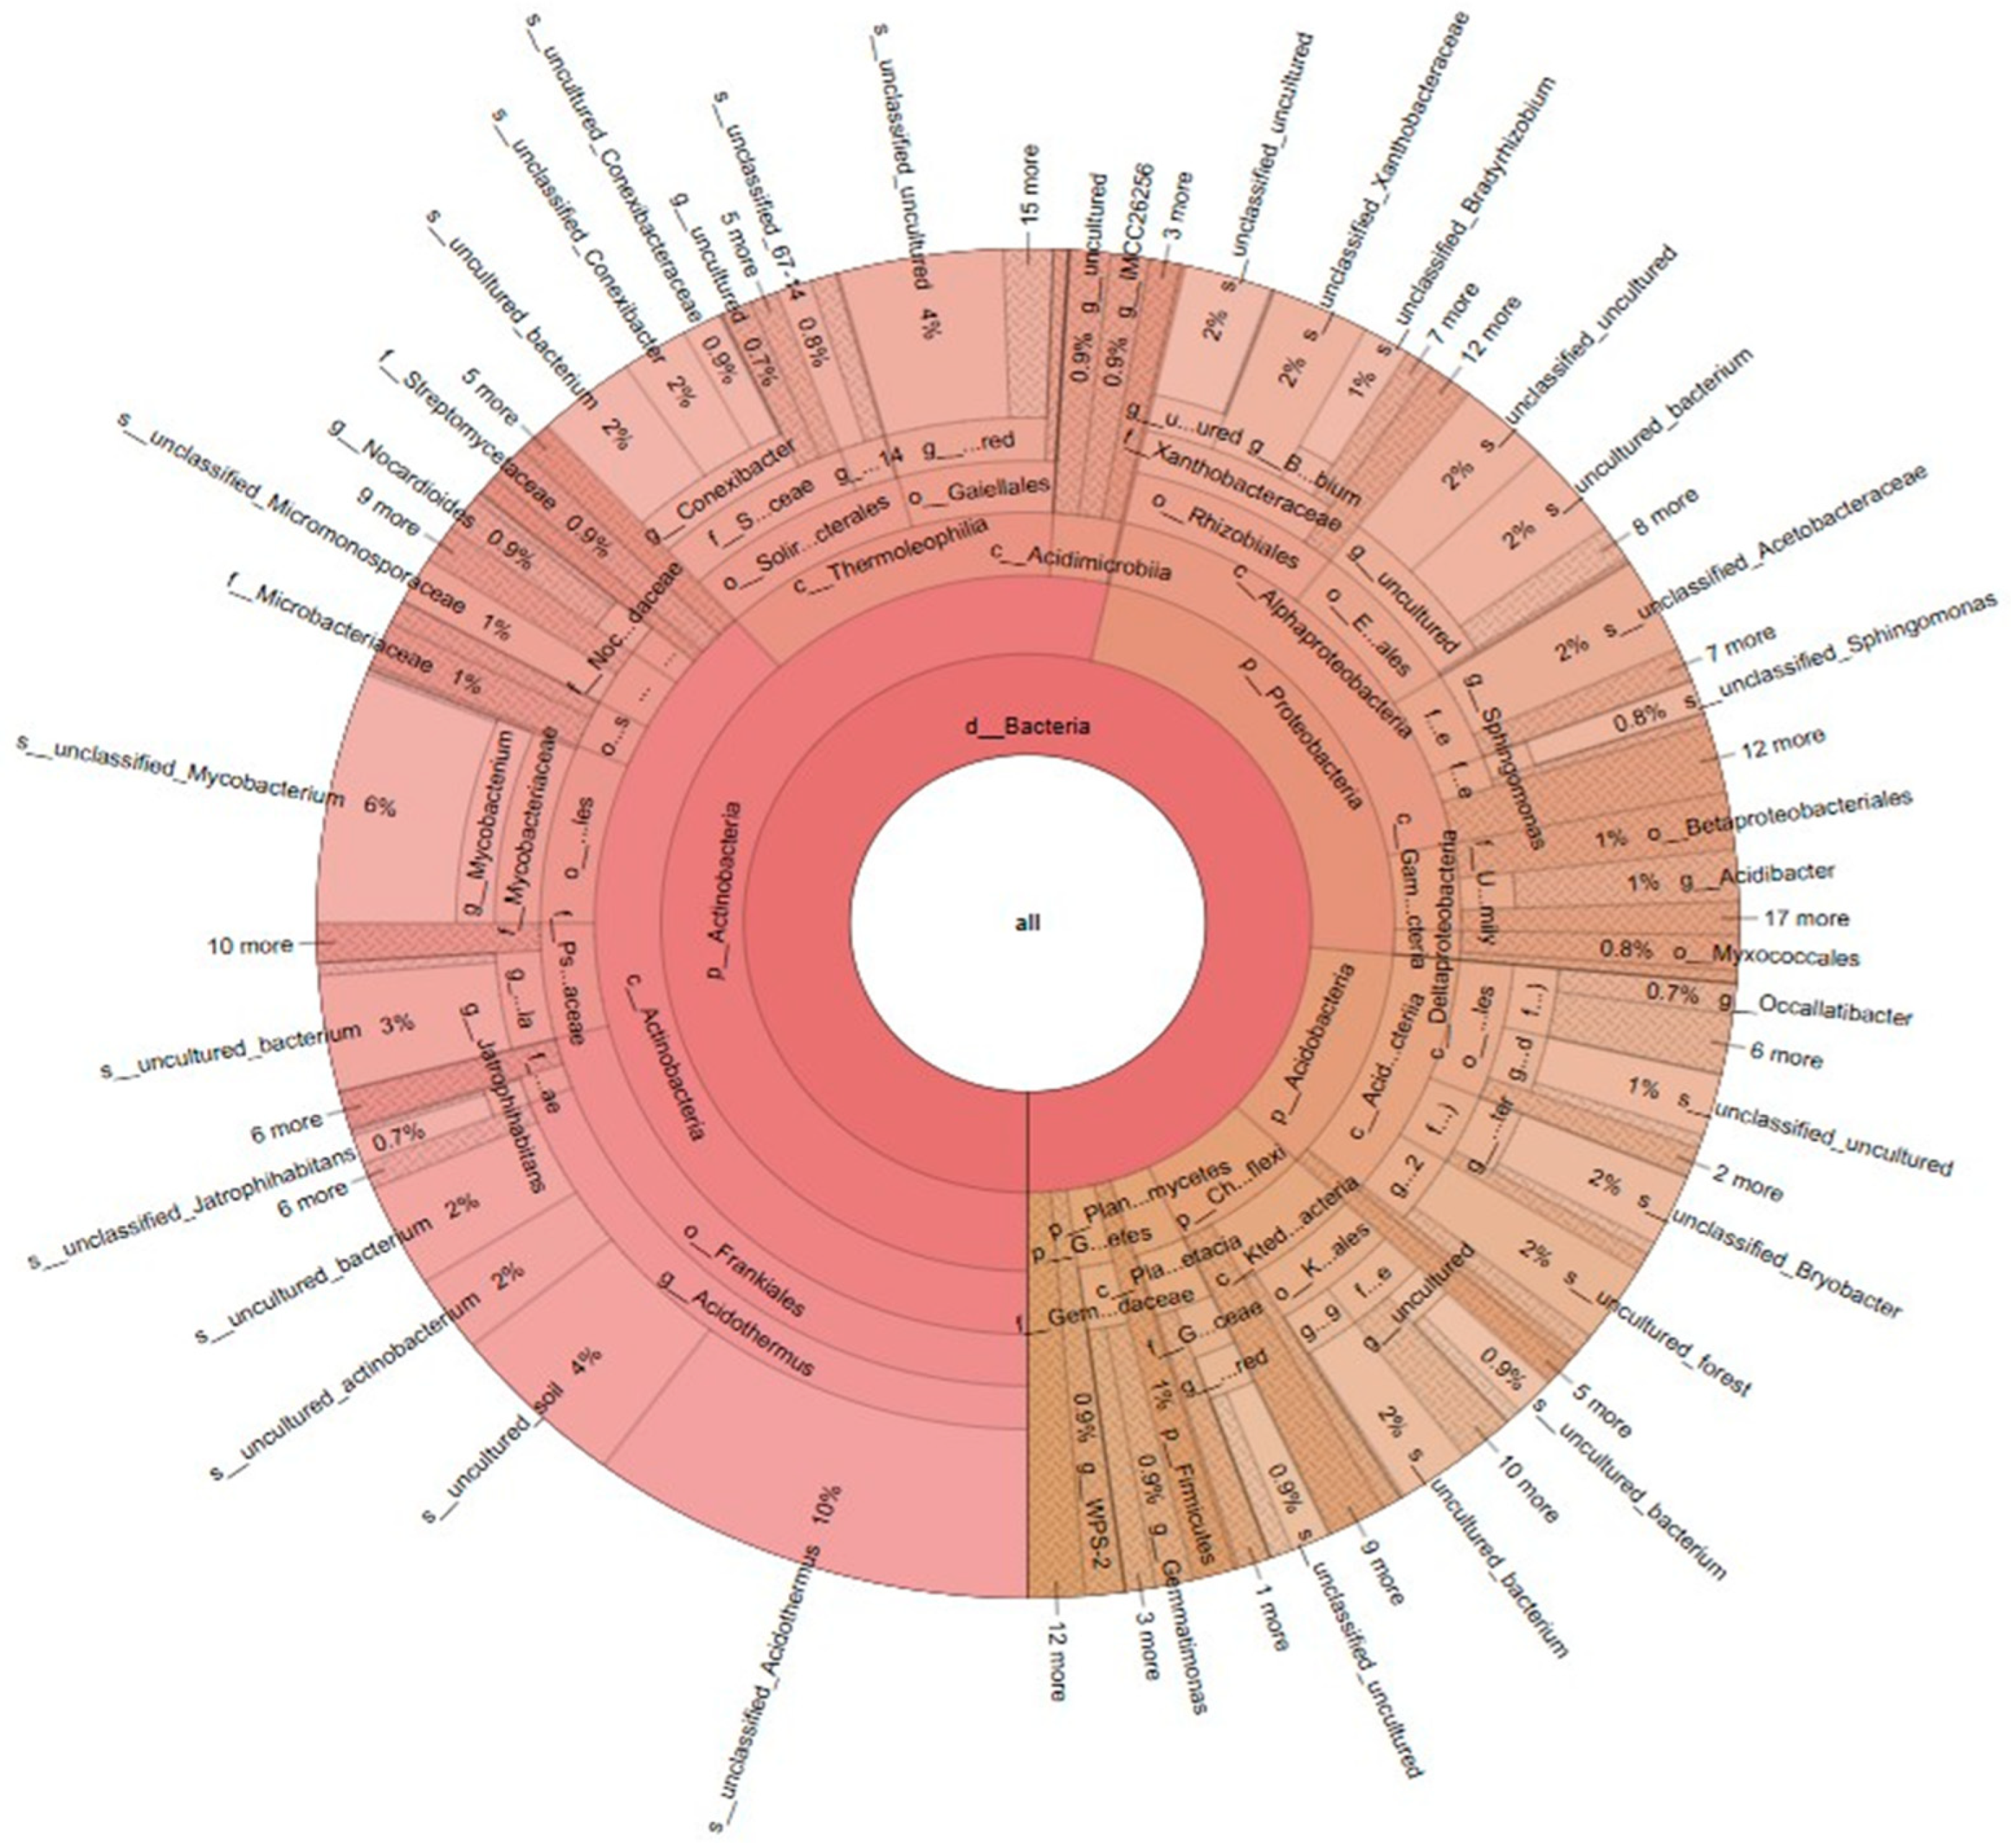
The soil bacterial community composition and relative abundance across taxonomic hierarchies were evaluated using the Krona species composition map, where circle diagrams visually represent hierarchical classifications from domain to species, with fan sizes corresponding to relative abundance values. The relative abundance of soil bacterial communities constituting taxonomical hierarchies across the three treatments of CK, LC-S, and LC-C was evaluated in Figure 5. At the phylum level, Actinobacteria predominated (56%), followed by Proteobacteria (22%), Acidobacteria (8%), Chloroflexi (7%), Planctomycetes (2%); and Firmicutes, Gemmatimonadetes, and WPS-2 (each 1%) dominated all the treatments. Taxonomic resolution at the class-level revealed Actinobacteria (39%), Alphaproteobacteria (17%), Thermoleophilia (14%), Acidobacteriia (7%), Ktedonobacteria (5%), Acidimicrobiia (3%), Planctomycetacia (2%), and Bacilli, Gemmatimonadetes, and WPS-2 (each 1%) in all the treatments.
The order-level analysis identified Frankiales (22%), Solirubrobacteriales (9%), and Pseudonocardiales, Corynebacteriales and Rhizobiales (each 6%) as predominant, with Galellales, Elsterales and Ktedonobacterales, respectively, contributing 5%, while Acidobacteriales and Acetobacterales, respectively, constituted 4% in all the treatments. At the family-level, Acidothermaceae (19%) and Solirubrobacteraceae (8%) were most abundant, followed by Mycobacteriaceae (6%), Xanthobacteraceae (5%), Acetobacteraceae (4%), and Ktedonobacteraceae (3%) in all the treatments.
The genus-level dominance was observed for Acidothermus (19%), Mycobacterium (6%), Conexibacter (6%), Crossiella (5%), Bryobacter (2%), JG30-KF-AS9 (2%), Subgroup 2 (1%), and WPS-2 (1%) across all the treatments. Minor yet notable genera included Bradyrhizobium (0.7%), Beijerinckiaceae (0.5%), Gemmatimonas (0.6%), and Isopharaceae (0.7%) across all the treatments. These findings illustrate a consistent hierarchical structure across taxonomic levels, with Actinobacteria and Proteobacteria emerging as key phyla, and Acidothermus representing the most abundant genus across all the treatments.

3.3. Alpha Diversity Analysis

3.3.1. Species Accumulation Curve

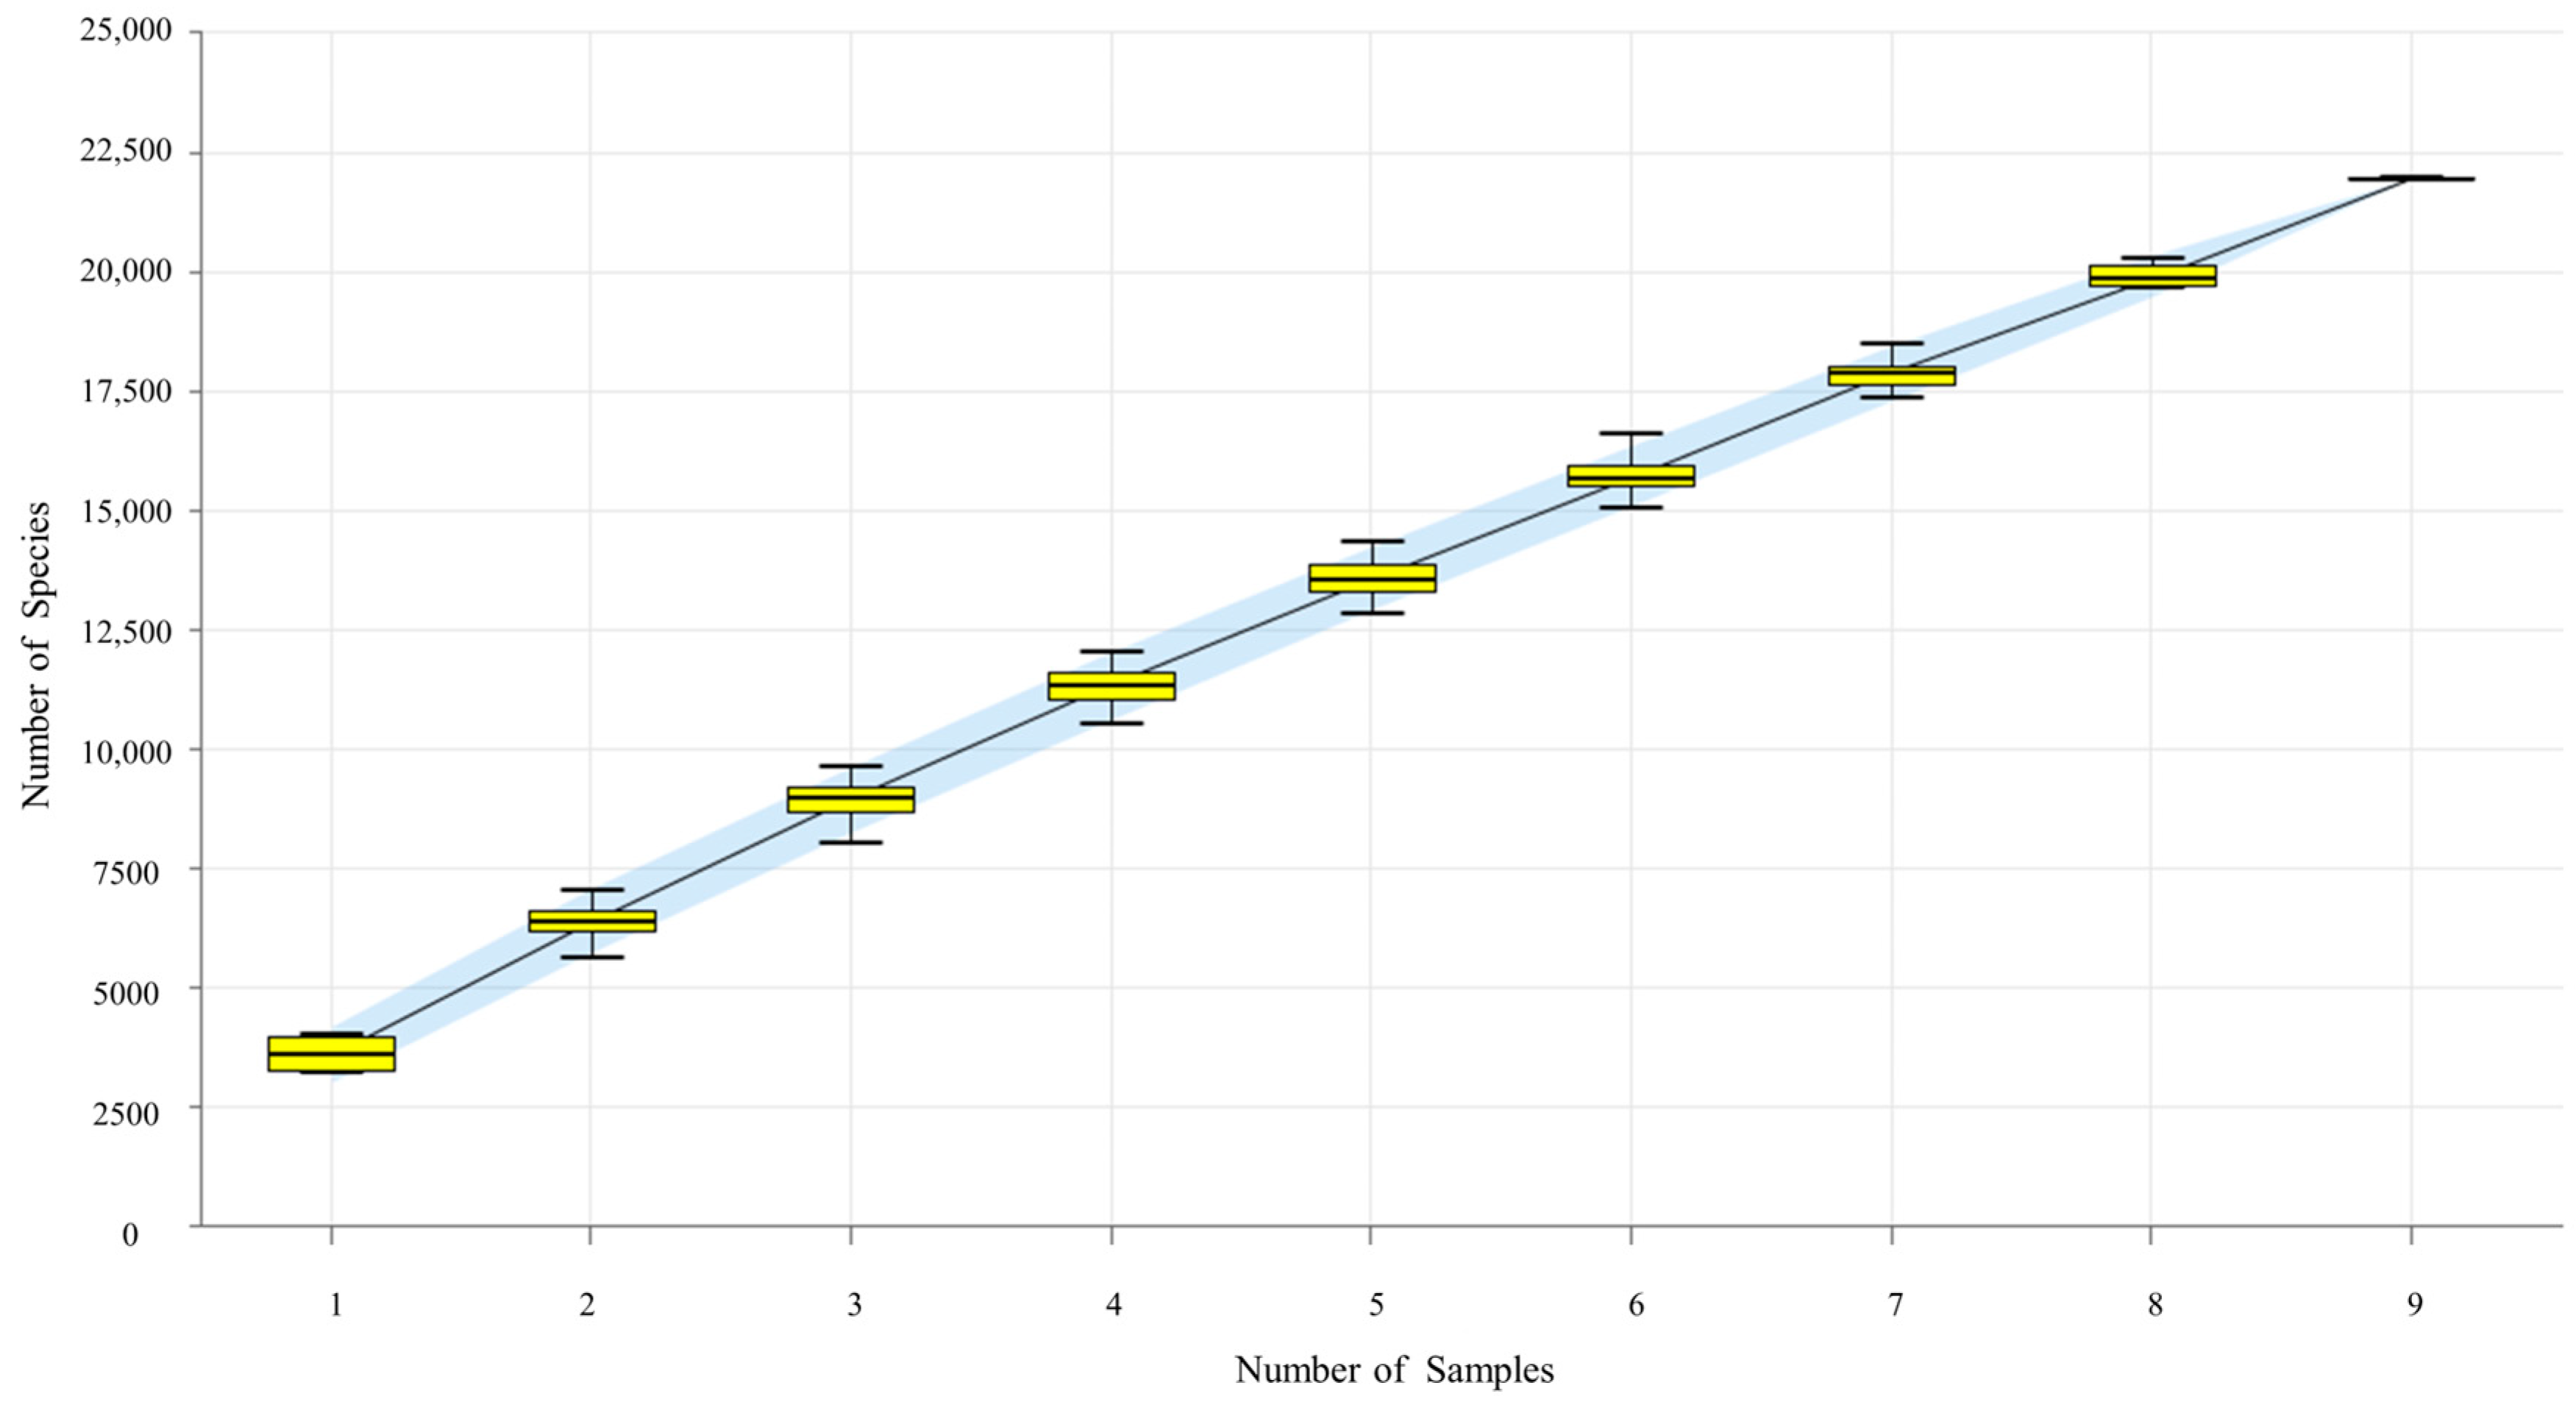
The species accumulation curve evaluated sampling adequacy by plotting cumulative ASV/OTU richness against the number of tea rhizosphere soil samples. The plateauing trend (as inferred from the axis labels) implied adequate sampling across treatments. Thus, observed differences in diversity indices between CK and LC-S/LC-C were robust (Figure 6).

3.3.2. Rarefaction Curves

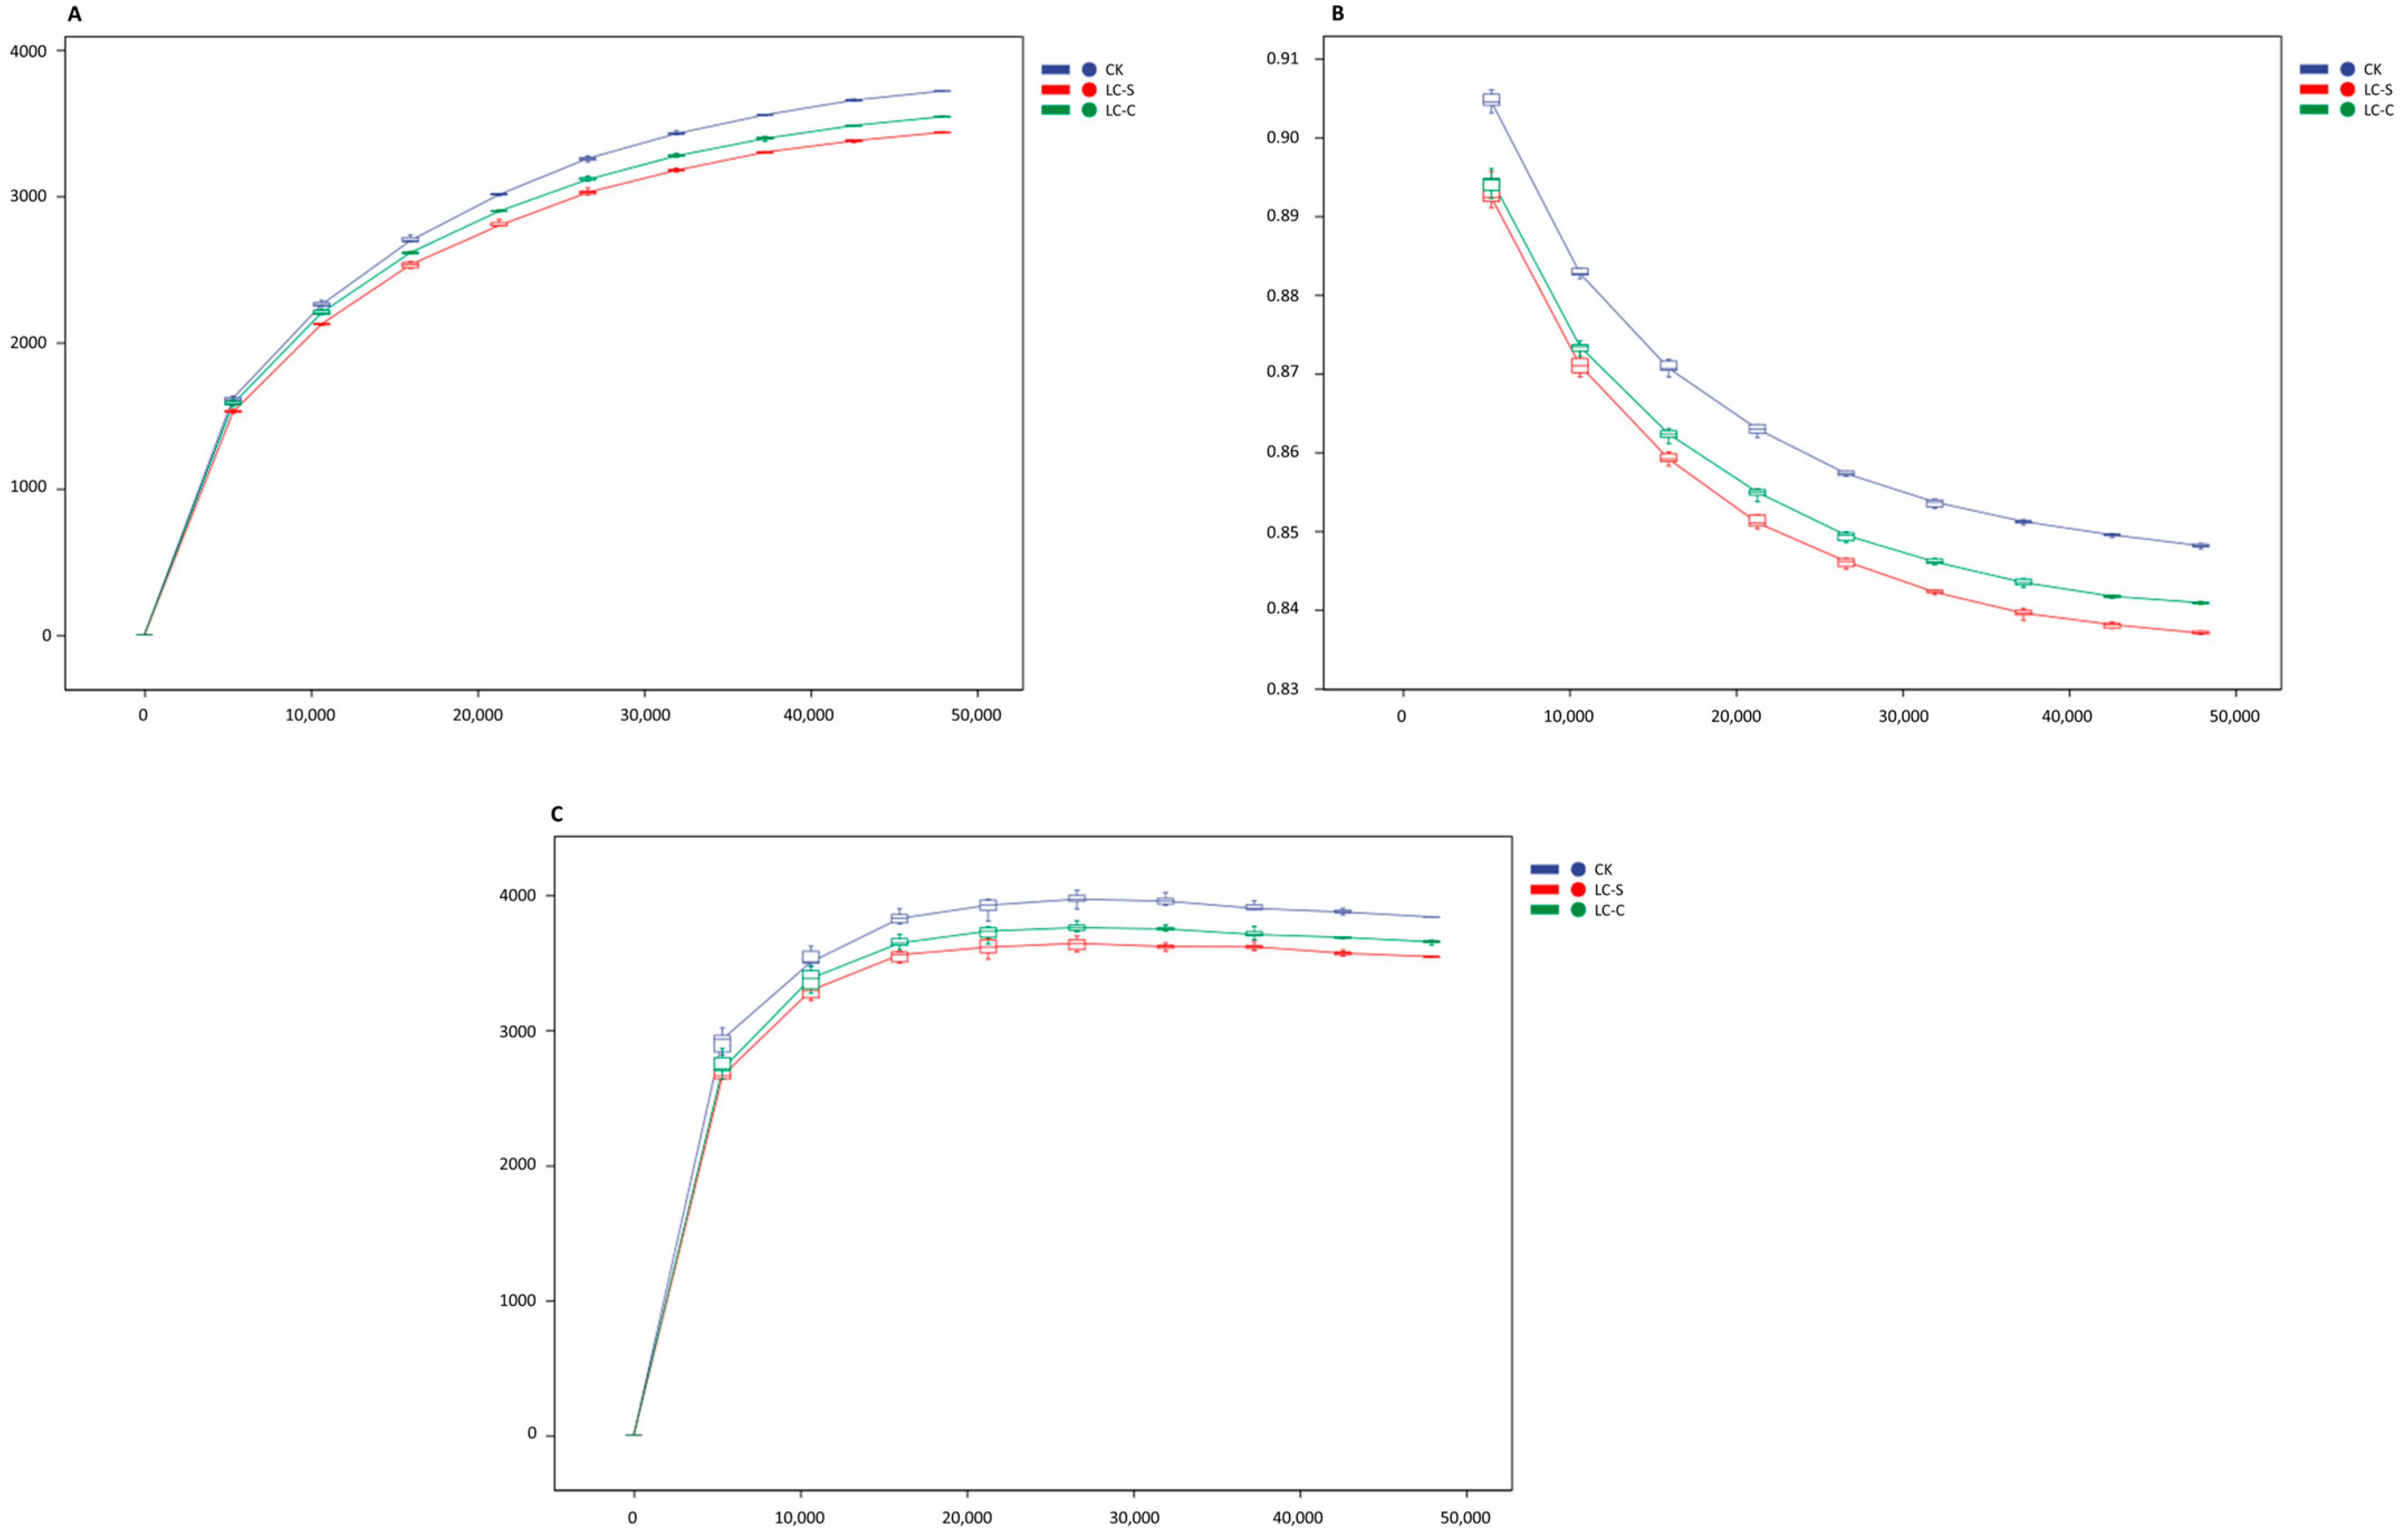
Rarefaction curves exhibited clear asymptotes, confirming adequate sequencing depth for robust downstream analyses (Figure 7). The alpha diversity indexes curves, including observed species (Figure 7A), Pielou’s evenness (Figure 7B), and Chao1 index (Figure 7C), plateaued at ~30,000–50,000 sequencing depth, indicating adequate sequencing effort to capture diversity trends across soil bacterial communities prevalent in CK, LC-S, and LC-C. The treatments of LC-S and LC-C both consistently outperformed the control of CK in species richness (i.e., observed species and Chao1 index; Figure 7A,C) and Pielou’s evenness (Figure 7B). The rarefaction curves indicated that leguminous cover cropping with soybean (LC-S) and cowpea (LC-C) enhanced soil bacterial diversity metrics compared to the control of monoculture tea plantations (CK). In contrast, the alphabox plots did not exhibit significant differences between the treatments of CK and LC-S/LC-C (Supplementary Figure S1).
For the observed species, LC-S and LC-C exhibited higher median values compared to the control of CK, with curves rising more steeply and/or plateauing at higher sequencing depths (Figure 7A). This demonstrated greater species richness of bacterial communities in the rhizosphere soil of legume cover-cropped tea plantations. The interquartile ranges (IQRs) of LC-S/LC-C did not overlap with the control, CK, at higher depths (40,000–50,000) (Figure 7A).
For Pielou’s evenness, LC-S and LC-C demonstrated higher evenness values (closer to 1.0) than the control of CK (Figure 7B), illustrating more equitable species abundance distributions in the rhizospheric tea soil of legume cover-cropped tea plantations. The medians of LC-S/LC-C were consistently above that of CK with minimal IQR overlap, reflecting statistically robust differences in community evenness (Figure 7B).
For the Chao1 index, LC-S and LC-C exhibited higher median values compared to the control of CK (Figure 7C), with curves rising more steeply and/or plateauing at higher sequencing depths. This clearly illustrated greater species richness of bacterial communities in the rhizospheric tea soil of legume cover-cropped tea plantations. The interquartile ranges (IQRs) of LC-S/LC-C did not overlap with that of CK at higher depths (e.g., 40,000–50,000), indicating distinct richness levels (Figure 7C).

3.4. Beta Diversity Analysis

3.4.1. Hierarchical Cluster Analysis

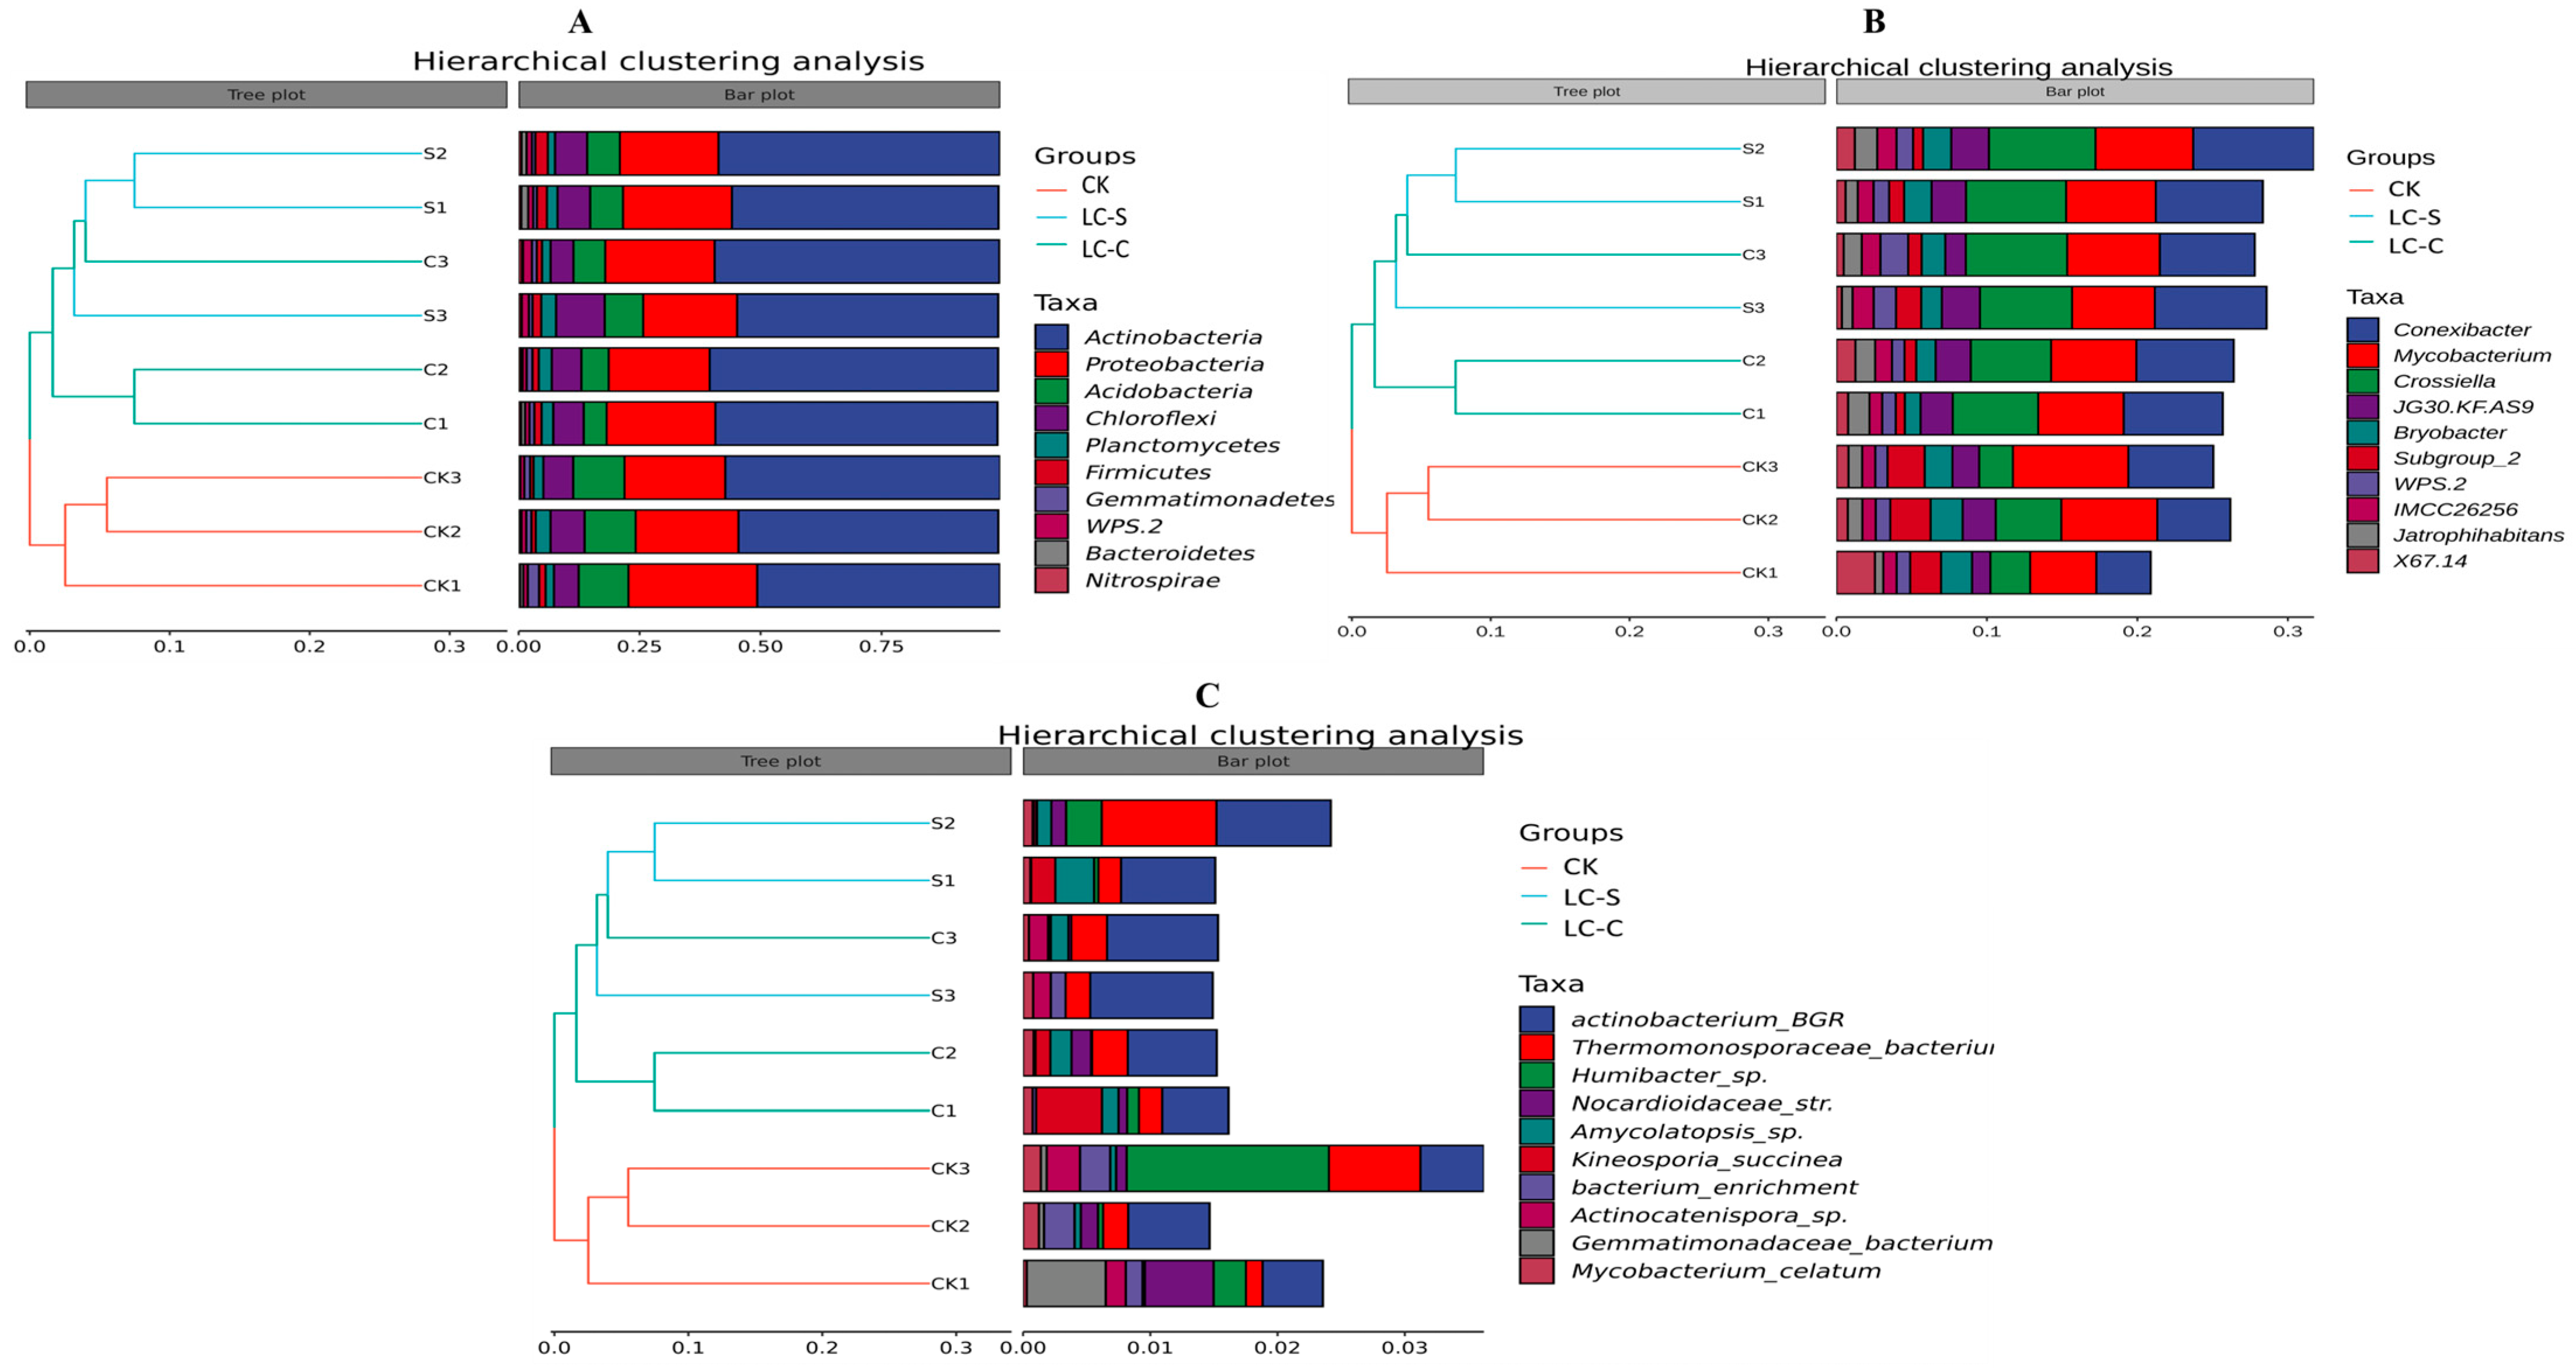
Hierarchical cluster analysis displayed the similarity between tea rhizosphere soil samples and analyzed the clustering effect by the branch length of the cluster tree. The hierarchical clustering analysis of bacterial communities in the rhizospheric soil regions of monoculture tea plantation (CK) and leguminous cover-cropped tea plantations with soybean (LC-S) and cowpea (LC-C) was evaluated at the levels of phylum (Figure 8A), genus (Figure 8B), and species (Figure 8C). The analyzed results revealed the distinct patterns in bacterial community structure among the treatments of CK, LC- S, and LC-C (Figure 8).
The phylum-level clustering pattern demonstrated clear separation of the microbial community in tea rhizosphere soil of CK from those of LC-S and LC-C (Figure 8A). The bacterial communities of CK clustered together, while those of the treatments of LC-S and LC-C formed a distinct group, and the soil microbial communities prevalent in LC-S and LC-C overlapped among each other, thereby indicating similar phylum-level responses to leguminous cover cropping with soybean and cowpea. Actinobacteria and Proteobacteria dominated across all treatments, while Chloroflexi and Acidobacteria were more abundant in CK (Figure 8A). The Bray–Curtis distance values exhibited higher dissimilarity (0.0–0.75) at genus/species levels, emphasizing phylum-level divergence. And leguminous cover cropping significantly shifted the phylum-level community structure, favoring Proteobacteria over Acidobacteria.
The genus-level clustering pattern across genera demonstrated partial separation (i.e., S1/S2 cluster together, while CK1/CK2 form a sub-cluster) of the microbial community among the treatments of CK, LC-S, and LC-C (Figure 8B). LC-C exhibited intermediate positioning, overlapping with both the controls of CK and LC-S. Mycobacterium and Conexibacter were prevalent across all treatments. Crossiella was enriched in LC-S and LC-C (Figure 8B). The Bray–Curtis distance values exhibited slightly higher dissimilarity (0.0–0.3) at species-level clustering (Figure 8B).
The species-level hierarchical clustering analysis revealed a notable absence of distinct clustering patterns within three treatments of CK, LC-S, and LC-C (Figure 8C). Specifically, the bacterial species in tea rhizosphere soil samples from the control of CK (i.e., CK1, CK2, CK3) did not segregate into cohesive clusters but instead exhibited intermixing with those from LC-S and LC-C, as exemplified by the proximity of CK3 versus C1 and S3 (Figure 8C). This pronounced overlap indicated limited species-level differentiation between the control of CK and LC-S/LC-C. The dominant bacterial species, including Actinobacterium_BGR, Thermononosporaceae_bacterium, and Humibacter_sp., were consistently detected across all treatments, and the low Bray–Curtis dissimilarity values (ranging from 0.0 to 0.3) further corroborated the high compositional similarity in species assemblages (Figure 8C).
Based on the above results at different levels, it was presumed that the effects of leguminous cover cropping with soybean and cowpea on the beta diversity of bacterial communities in tea rhizospheric soil region were most evident at broader taxonomic levels (phylum), diminishing at finer resolutions (genus/species). So, legume cover cropping can induce hierarchical restructuring of soil bacterial communities with the strongest effects at the phylum level.

3.4.2. PCoA and NMDS Analysis

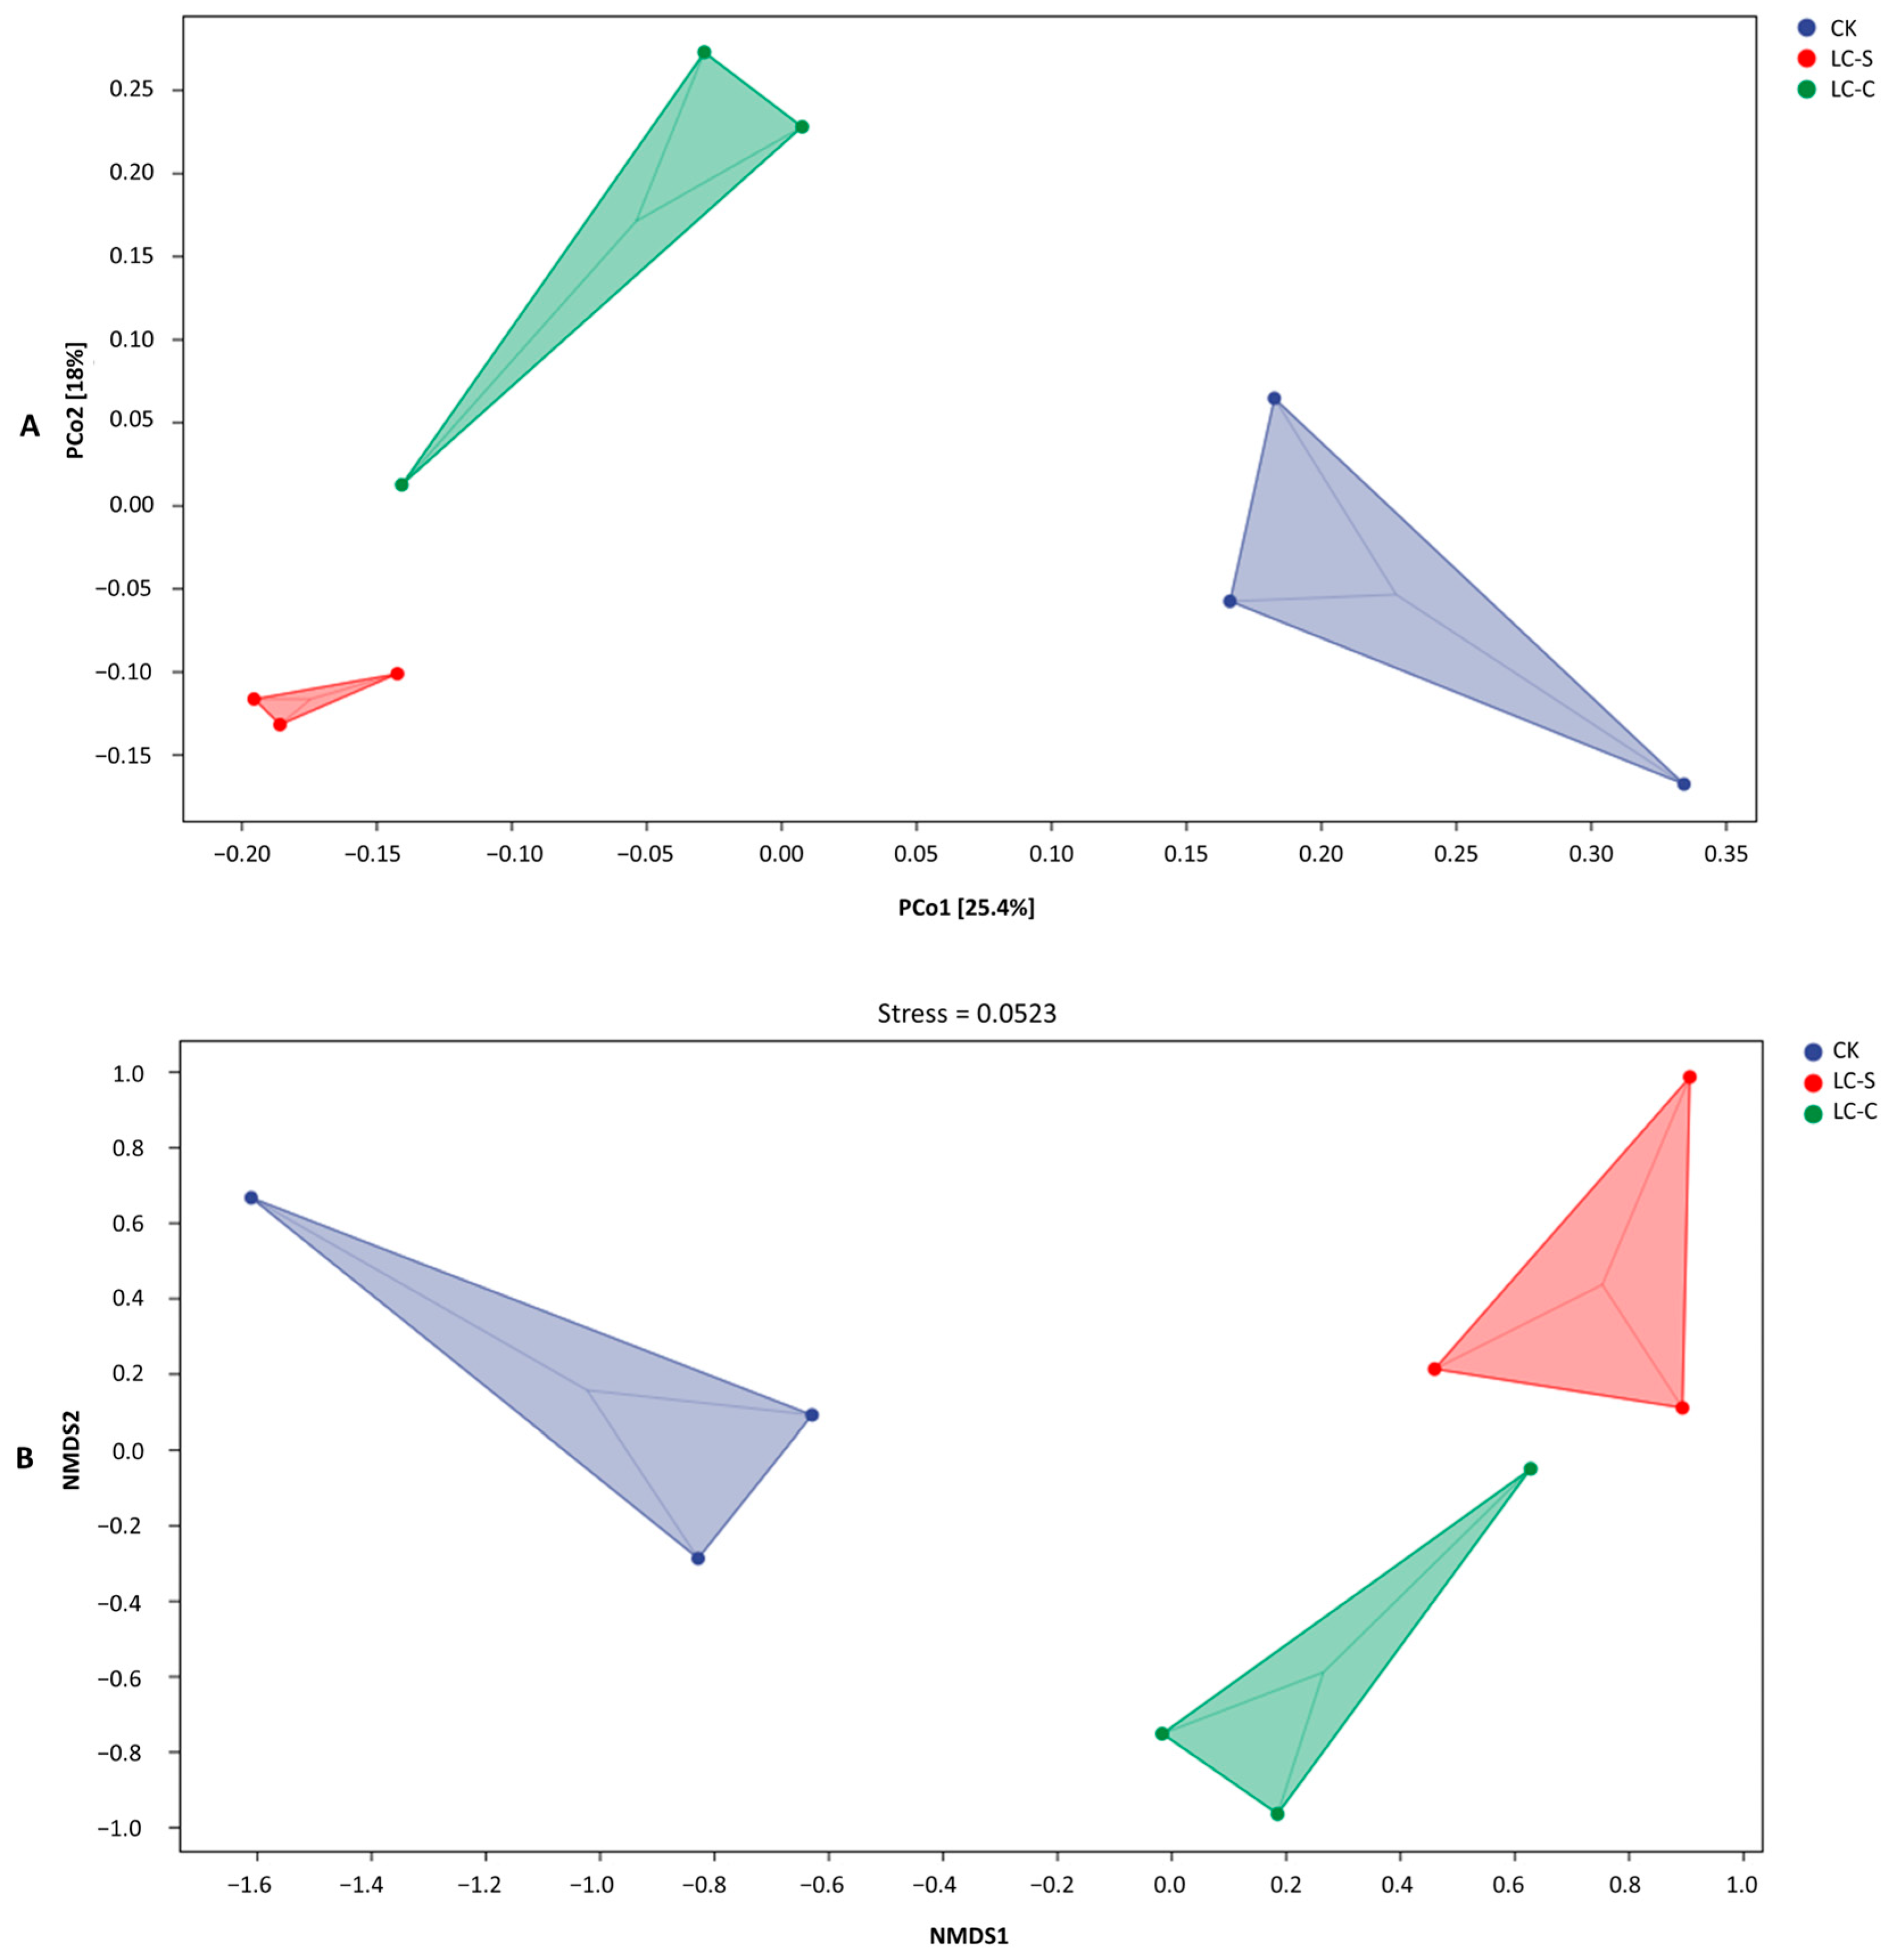
PCoA and NMDS visualizations, supported by the PERMANOVA test, confirmed significant differences (p < 0.05) in tea rhizosphere soil microbial community diversity among the treatments of CK, LC-S, and LC-C (Figure 9). LC-S and LC-C significantly altered the bacterial community diversity compared to the control of CK, and the non-overlapping 95% confidence ellipses illustrated significant clustering between LC-S/LC-C and CK.
PCo1 (25.4%) and PCo2 (18%) cumulatively explained approximately 43.4% of the total variance among clusters of CK, LC-S, and LC-C, showing clear separation (Figure 9A). LC-S and LC-C clustered closer to each other as compared to the control of CK. Moreover, the NMDS analysis exhibited a stress value of 0.0523, far below the reliability threshold (<0.2), ensuring high confidence in the ordination representing the primary axes of dominant taxa (Figure 9B). Thus, PCoA and NMDS both revealed that leguminous cover cropping with soybean and cowpea favored distinct bacterial taxa, reducing similarity to the microbial communities in the rhizosphere soil of monoculture tea (CK).

3.4.3. Cluster Heat Map Analysis

To further compare the differences in species composition of bacterial communities in tea rhizosphere soil of the treatments of CK, LC-S, and LC-C LC-S, cluster heat maps were evaluated in Figure 10. The abundance data of the top 20 genera in terms of average abundance was utilized to draw the cluster heat map. The cluster heat maps, representing the compositions of phyla (Figure 10A), genus (Figure 10B), and species (Figure 10C), provided insights into the compositional and functional dynamics of bacterial communities in the tea rhizosphere soil of leguminous cover cropping with soybean (LC-S) and cowpea (LC-C) versus the control of CK.
The phylum-level cluster heat maps (PCHM) demonstrated clear separation of bacterial community composition for the control of CK from LC-S and LC-C (Figure 10A). Actinobacteria and Proteobacteria were dominant across all treatments, with a higher abundance of Proteobacteria in LC-S and LC-C treatments (Figure 10A). Acidobacteria and Chloroflexi were enriched in the control of CK, and Bacteroidetes and Gemmatimonadetes were more abundant in LC-S and LC-C treatments. The color gradient (−1.15 to 1.15) displayed distinct phylum-level divergence of microbial community composition in the rhizospheric soil of monoculture tea plantation and leguminous cover-cropped tea plantations.
The genus-level cluster heat map (GCHM) revealed moderate differentiation in bacterial community composition among the treatments of CK, LC-S, and LC-C (Figure 10B). Mycobacterium and Sphingomonas were more abundant in the control of CK, while Bradyrhizobium was more abundant in LC-S and LC-C treatments, respectively (Figure 10B).
The species-level cluster heat map (SCHM) demonstrated minimal differentiation in bacterial community composition among the treatments of CK, LC-S, and LC-C, with minimal variation in relative abundance (color scale: −1.15 to 1.15), and these three treatments had the same dominant species of Acidobacterium_BGR, Thermononosporaceae; just Mycobacterium_celatum had marginally higher abundance in the control of (Figure 10C) CK. High overlap in species composition across three treatments corroborated beta hierarchical clustering results, indicating limited species-level differentiation in bacterial community composition among the treatments of CK, LC-S, and LC-C.
So, the heat map analyses demonstrated that legume cover cropping (LC-S/C) restructures soil bacterial communities most prominently at broader taxonomic levels (phylum and genus). Phylum demonstrated the strongest treatment differentiation, while genus exhibited moderate separation. Concomitantly, species demonstrated minimal differentiation, dominated by ubiquitous taxa of soil bacterial microbiome assemblage across the tea rhizospheric soil region.

3.4.4. PCA and OPLS-DA Analysis

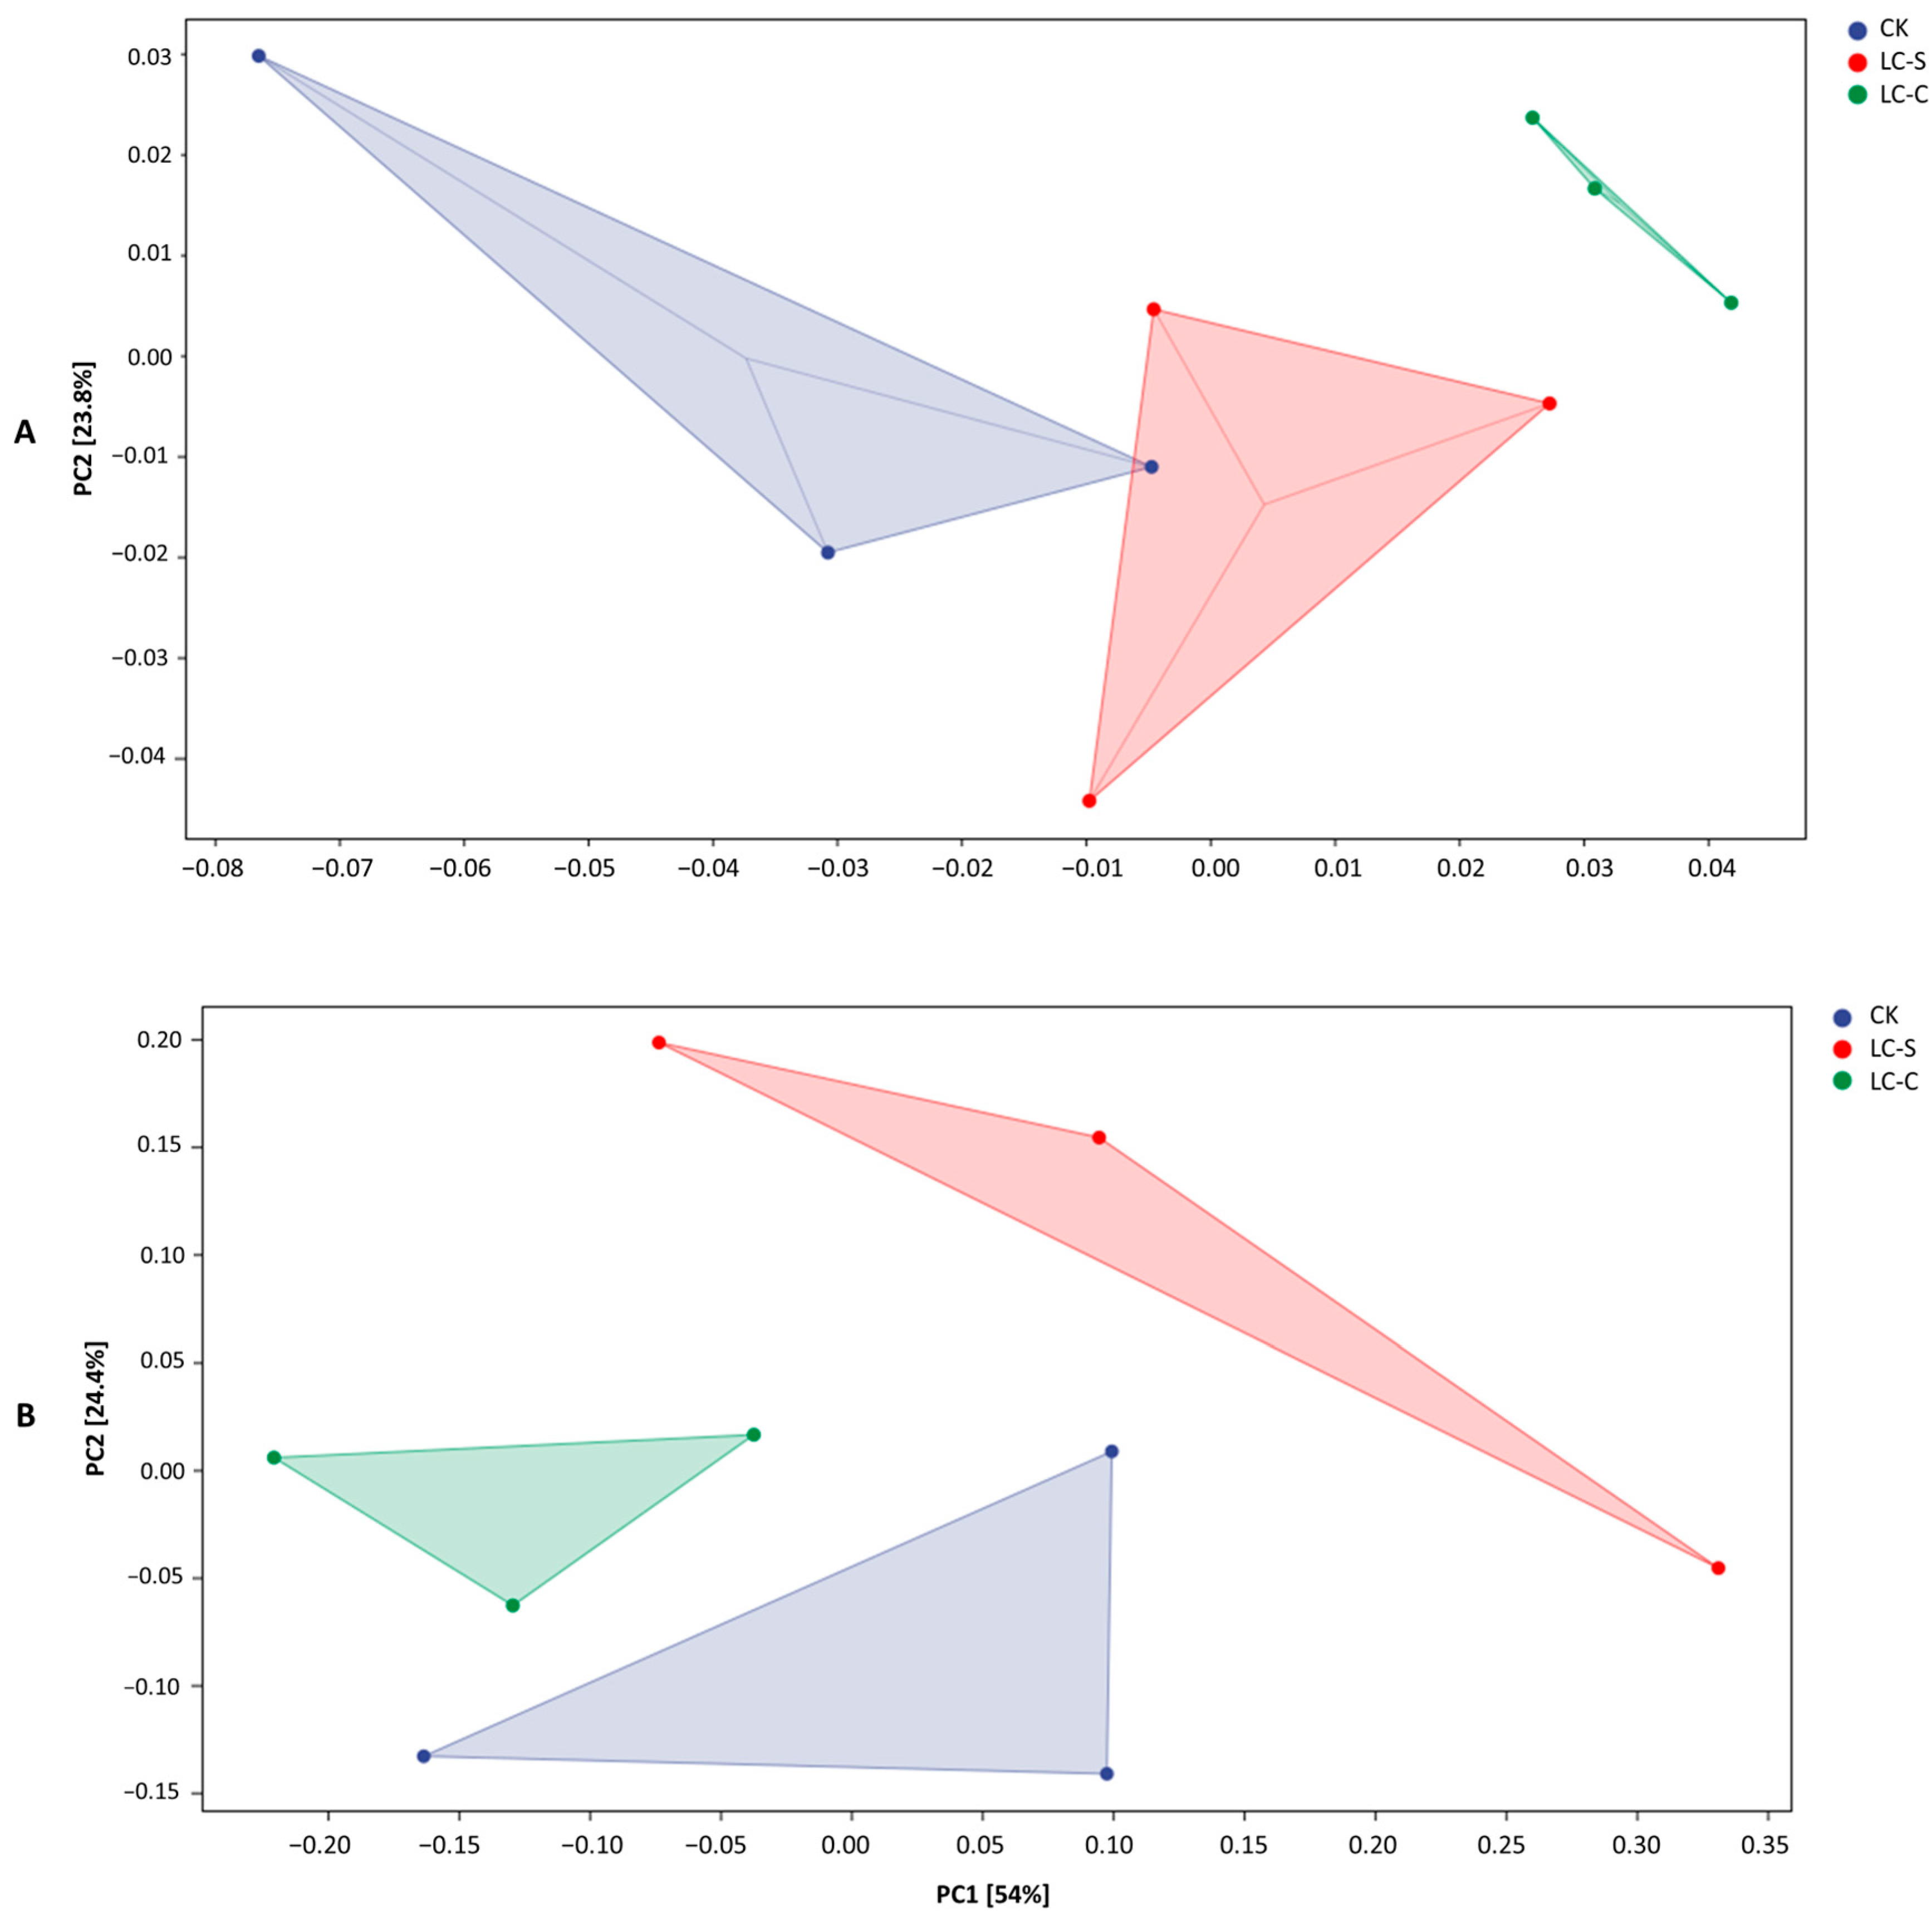
The Principal Component Analyses (PCA) at phylum levels revealed distinct patterns in tea rhizosphere soil microbial community structure among the treatments of CK, LC-S, and LC-C, and it exhibited a cumulative variance of 85.6% (PCI1: 61.8% and PCI2:23.8%) (Figure 11A). The non-overlapping 95% confidence ellipses demonstrated significant differences among CK, LC-S, and LC-C (p < 0.05), and LC-S and LC-C represented similar phylum-level communities relative to CK as revealed by PCA analysis (Figure 11A).
The Orthogonal Projections to Latent Structures Discriminant Analysis (OPLS-DA) of tea rhizosphere soil microbial communities demonstrated distinct compositional differences among CK, LC-S, and LC-C (Figure 11B). Phylum-level OPLS-DA exhibited a PCI1 variance of 24.4% and a PCI2 variance of 54%, and non-overlapping 95% confidence ellipses suggested significant differences among CK, LC-S, and LC-C (p < 0.05; Figure 11B).
Phylum-level OPLS-DA aligned with PCoA/NMDS (Figure 9) and PCA results, ensuring significant differences across tea rhizosphere microbial community structures among CK, LC-S, and LC-C as seen in (Figure 11).

3.4.5. LEfSe Cladogram

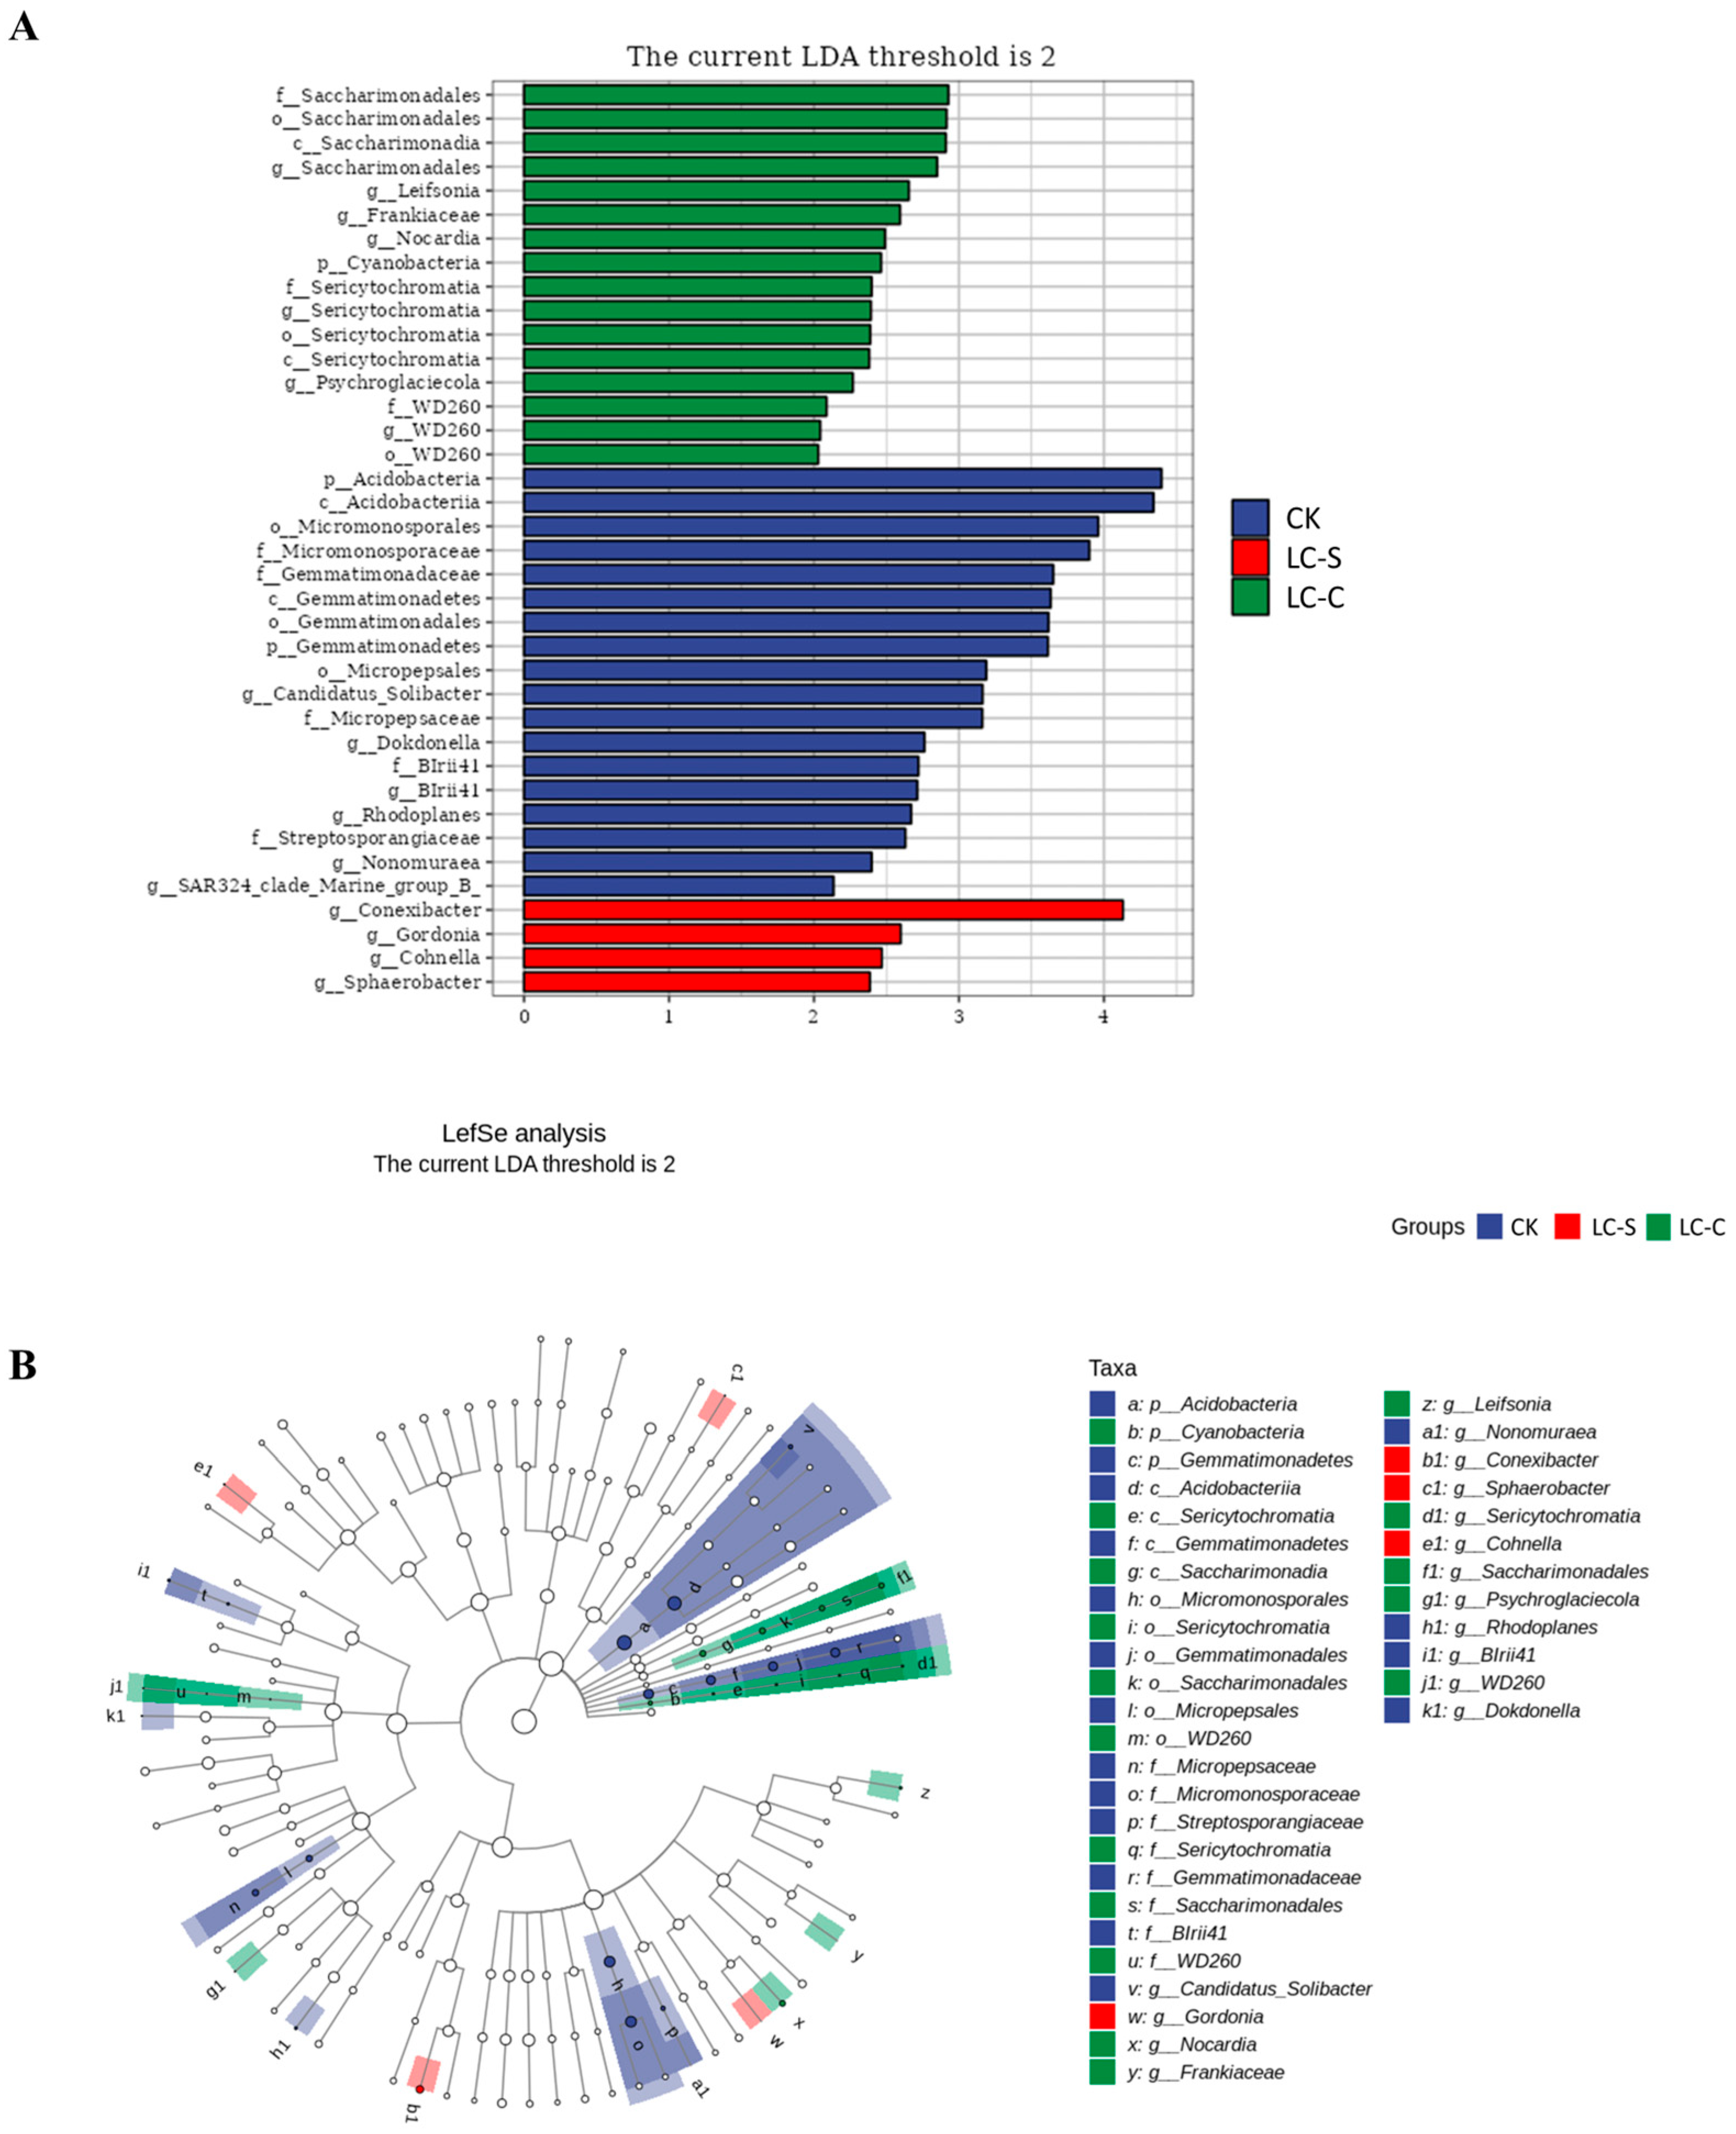
The Linear Discriminant Analysis Effect Size (LEfSe) cladogram exhibited distinct taxonomic biomarkers characterizing soil bacterial communities in the treatments of CK, LC-S, and LC-C at a significance threshold of LDA score > 2 and Wilcoxon p < 0.05 (Figure 12). Biomarkers were retained based on biological relevance, validated via Wilcoxon rank-sum tests with a minimum sample size of 3, ensuring robust differentiation of median abundance between groups. One-against-all comparisons prioritized treatment-specific taxa over minor variations, emphasizing biomarkers uniquely enriched in individual groups.
In the control CK, the dominant microbial biomarkers were identified across multiple taxonomic hierarchies, with significant representation observed within the phylum Acidobacteria and the class Acidobacteria. Additionally, taxa affiliated with the order Micromonosporales and their corresponding families Micromonosporaceae, as well as the family Gemmatimonadaceae, were notably enriched. And the microbial communities of CK further included the class Gemmatimonadetes, the order Gemmatimonadales, and the phylum Gemmatimonadetes, alongside taxa from the order Micropepsales and its family Micropepsaceae. The genus Candidatus and Solibacter, and the family BIrii41 (including its genus-level counterpart) were also prominent. Other distinguishing taxa comprised the genus Dokdonella and Rhodoplanes, and the family Streptosporangiaceae, including the genus Nonomuraea. Additionally, the genus SAR324_clade_Marine_group_B was identified as a specific biomarker for the control, CK. These findings collectively highlight a distinct taxonomic profile of tea rhizosphere soil microbial bacterial communities linked to monoculture and legume cover-cropped tea rhizosphere soil regions, characterized by the prevalence of Acidobacterial, Gemmatimonadete, and Actinobacterial lineages.
LC-S and LC-C exhibited distinct biomarker profiles compared with the control CK; they shared the genera biomarkers of Saccharimonadales, Leifsonia, Frankiaceae, Nocardia, Sericytochromatia, Psychroglaciecola, WD260, Conexibacter, and Gordonia. And LC-C further enriched the phylum Cyanobacteria and taxa linked to the order Saccharimonadales (e.g., the class—Saccharimonadia, the family—Saccharimonadaceae, and the genus—Saccharimonadales) and the order Sericytochromatia (the class—Sericytochromatia, the family—Sericytochromatia). Unique biomarkers in LC-C also encompassed the family WD260 and the order WD260, while LC-S was distinguished by the genera of Cohnella, Sphaerobacter, Conexibacter, and Gordonia.

3.4.6. Metagenome Sequence Analysis

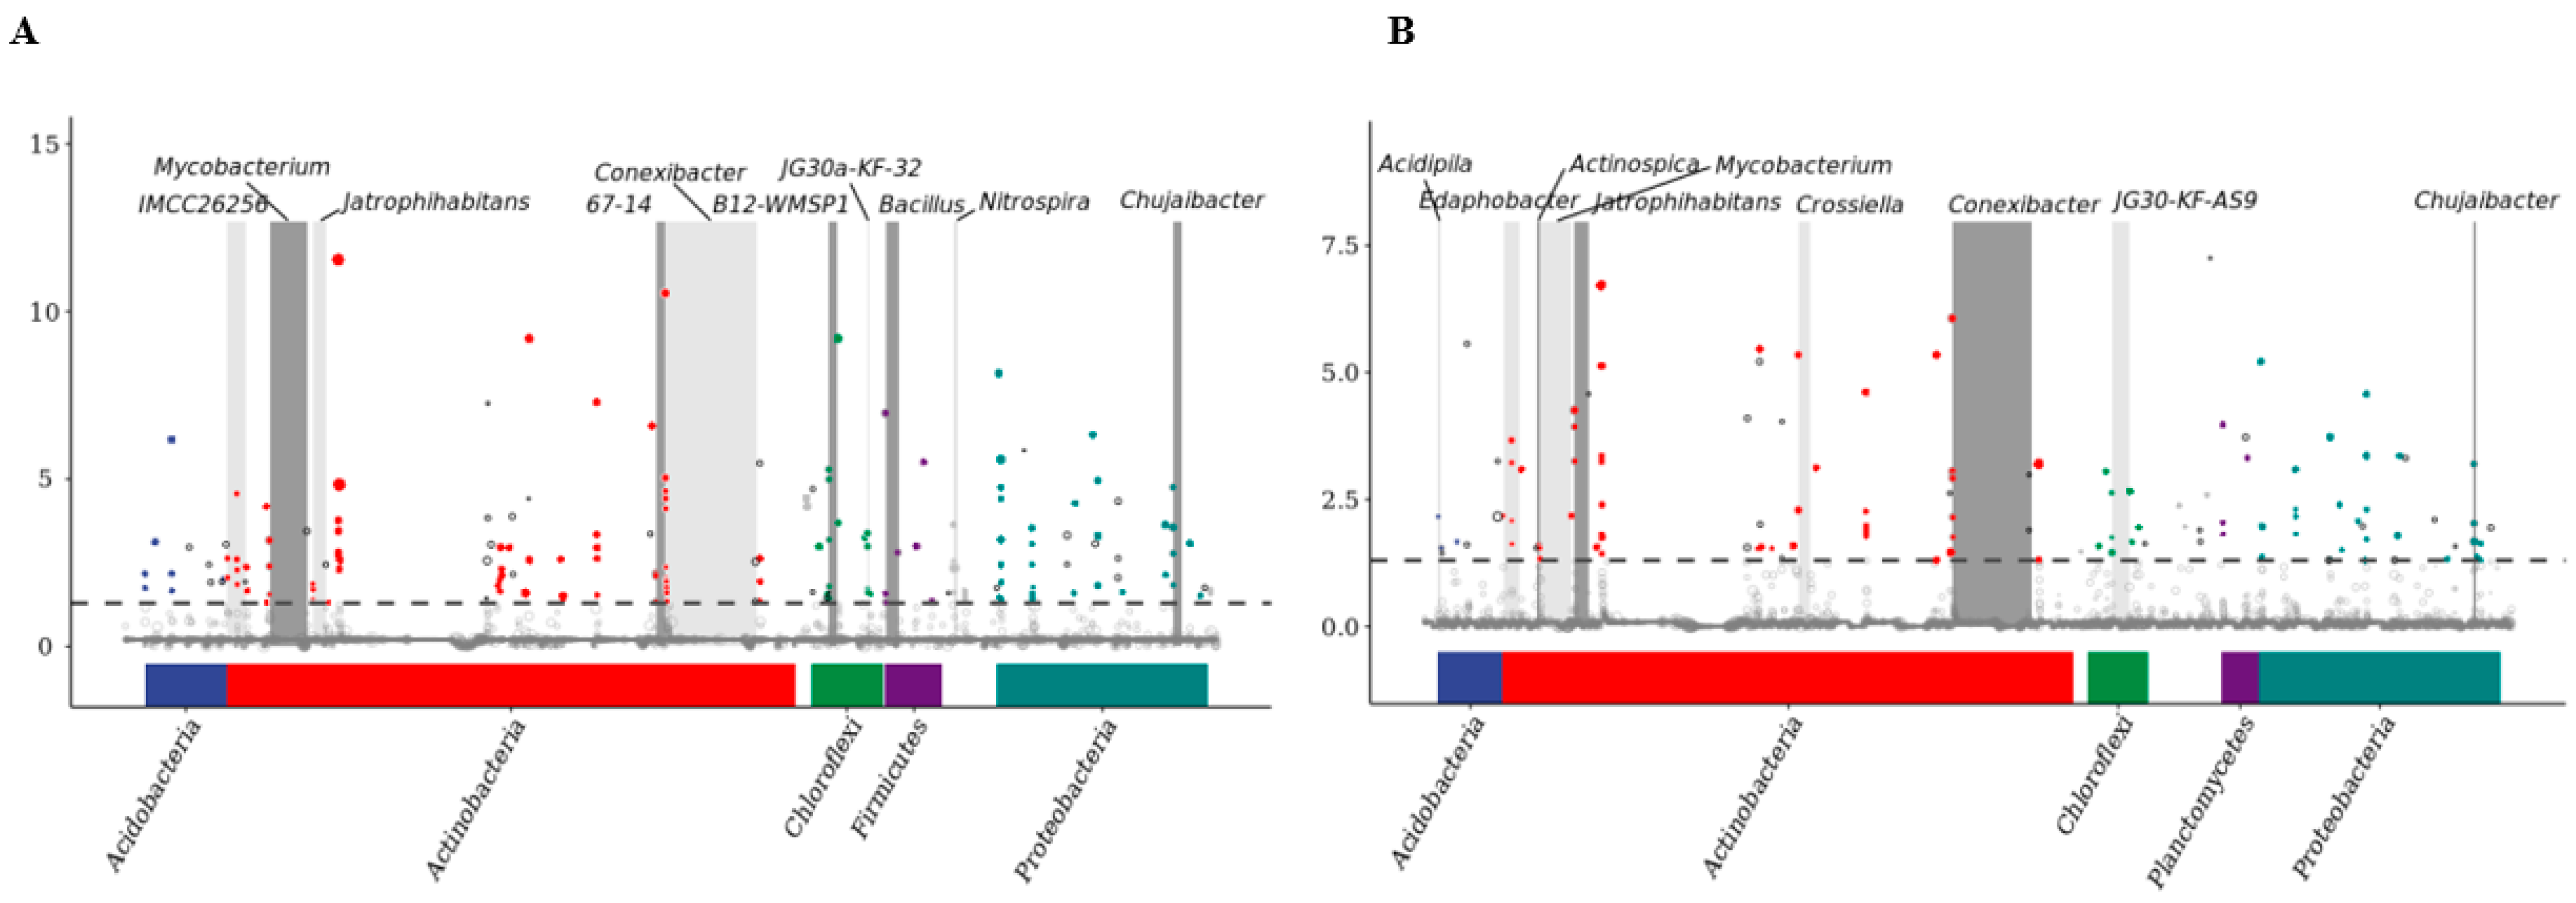
Metagenome sequence analyses identified distinct microbial taxa enriched among the treatments of CK, LC-S, and LC-C (Figure 13). Actinobacteria, Proteobacteria, Acidobacteria, and Chloroflexi emerged as dominant phyla of microbial communities observed in both treatments of LC-S and LC-C, while Mycobacterium, Conexibacter, Chujaibacter, and Jatrophihabitans were dominant genera of microbial communities common to both treatments of LC-S and LC-C (Figure 13A,B).
Tea rhizosphere soil microbial bacterial communities were significantly enriched in LC-S compared to the control of CK, as demonstrated by the metagenome sequence analysis (Figure 13A). Taxa demonstrating pronounced enrichment in LC-S comprised Mycobacterium, Conexibacter, JG30a-KF-32, Bacillus, Nitrospira, Chujaibacter, Actinobacteria, and Proteobacteria. Notably, Conexibacter (previously identified as a biomarker in LC-S and LC-C via LEfSe; seen in Figure 12) exhibited high relative abundance (Figure 13A). The dominant phyla included Actinobacteria, Proteobacteria, Acidobacteria, Chloroflexi, and Firmicutes, and the genera exhibiting enrichment alongside high relative abundance encompassed Mycobacterium, IMCC2656, 67-14, B12-WMSP1, JG30a-KF-32, Jatrophihabitans, Conexibacter, Bacillus, Nitrospira, and Chujaibacter in LC-S.
Concomitantly, tea rhizosphere soil microbial communities exhibited significant enrichment in LC-C relative to the control of CK (Figure 13B). LC-C exhibited marked enrichment of genera such as Acidipila, Edaphobacter, Actinospica, Jatrophihabitans, Mycobacterium, Crossiella, Conexibacter, JG30-KF-AS9, and Chujaibacter, and the dominant phyla included Actinobacteria, Proteobacteria, Acidobacteria, Chloroflexi, and Planctomycetes (Figure 13B). Moreover, LC-S demonstrated a greater relative abundance of phylum-wide microbial bacterial communities compared with LC-C, and Firmicutes emerged as a phylum exclusively enriched in LC-S, whereas Planctomycetes were uniquely enriched in LC-C (Figure 13A,B).

3.5. Metabolic Pathway Statistics

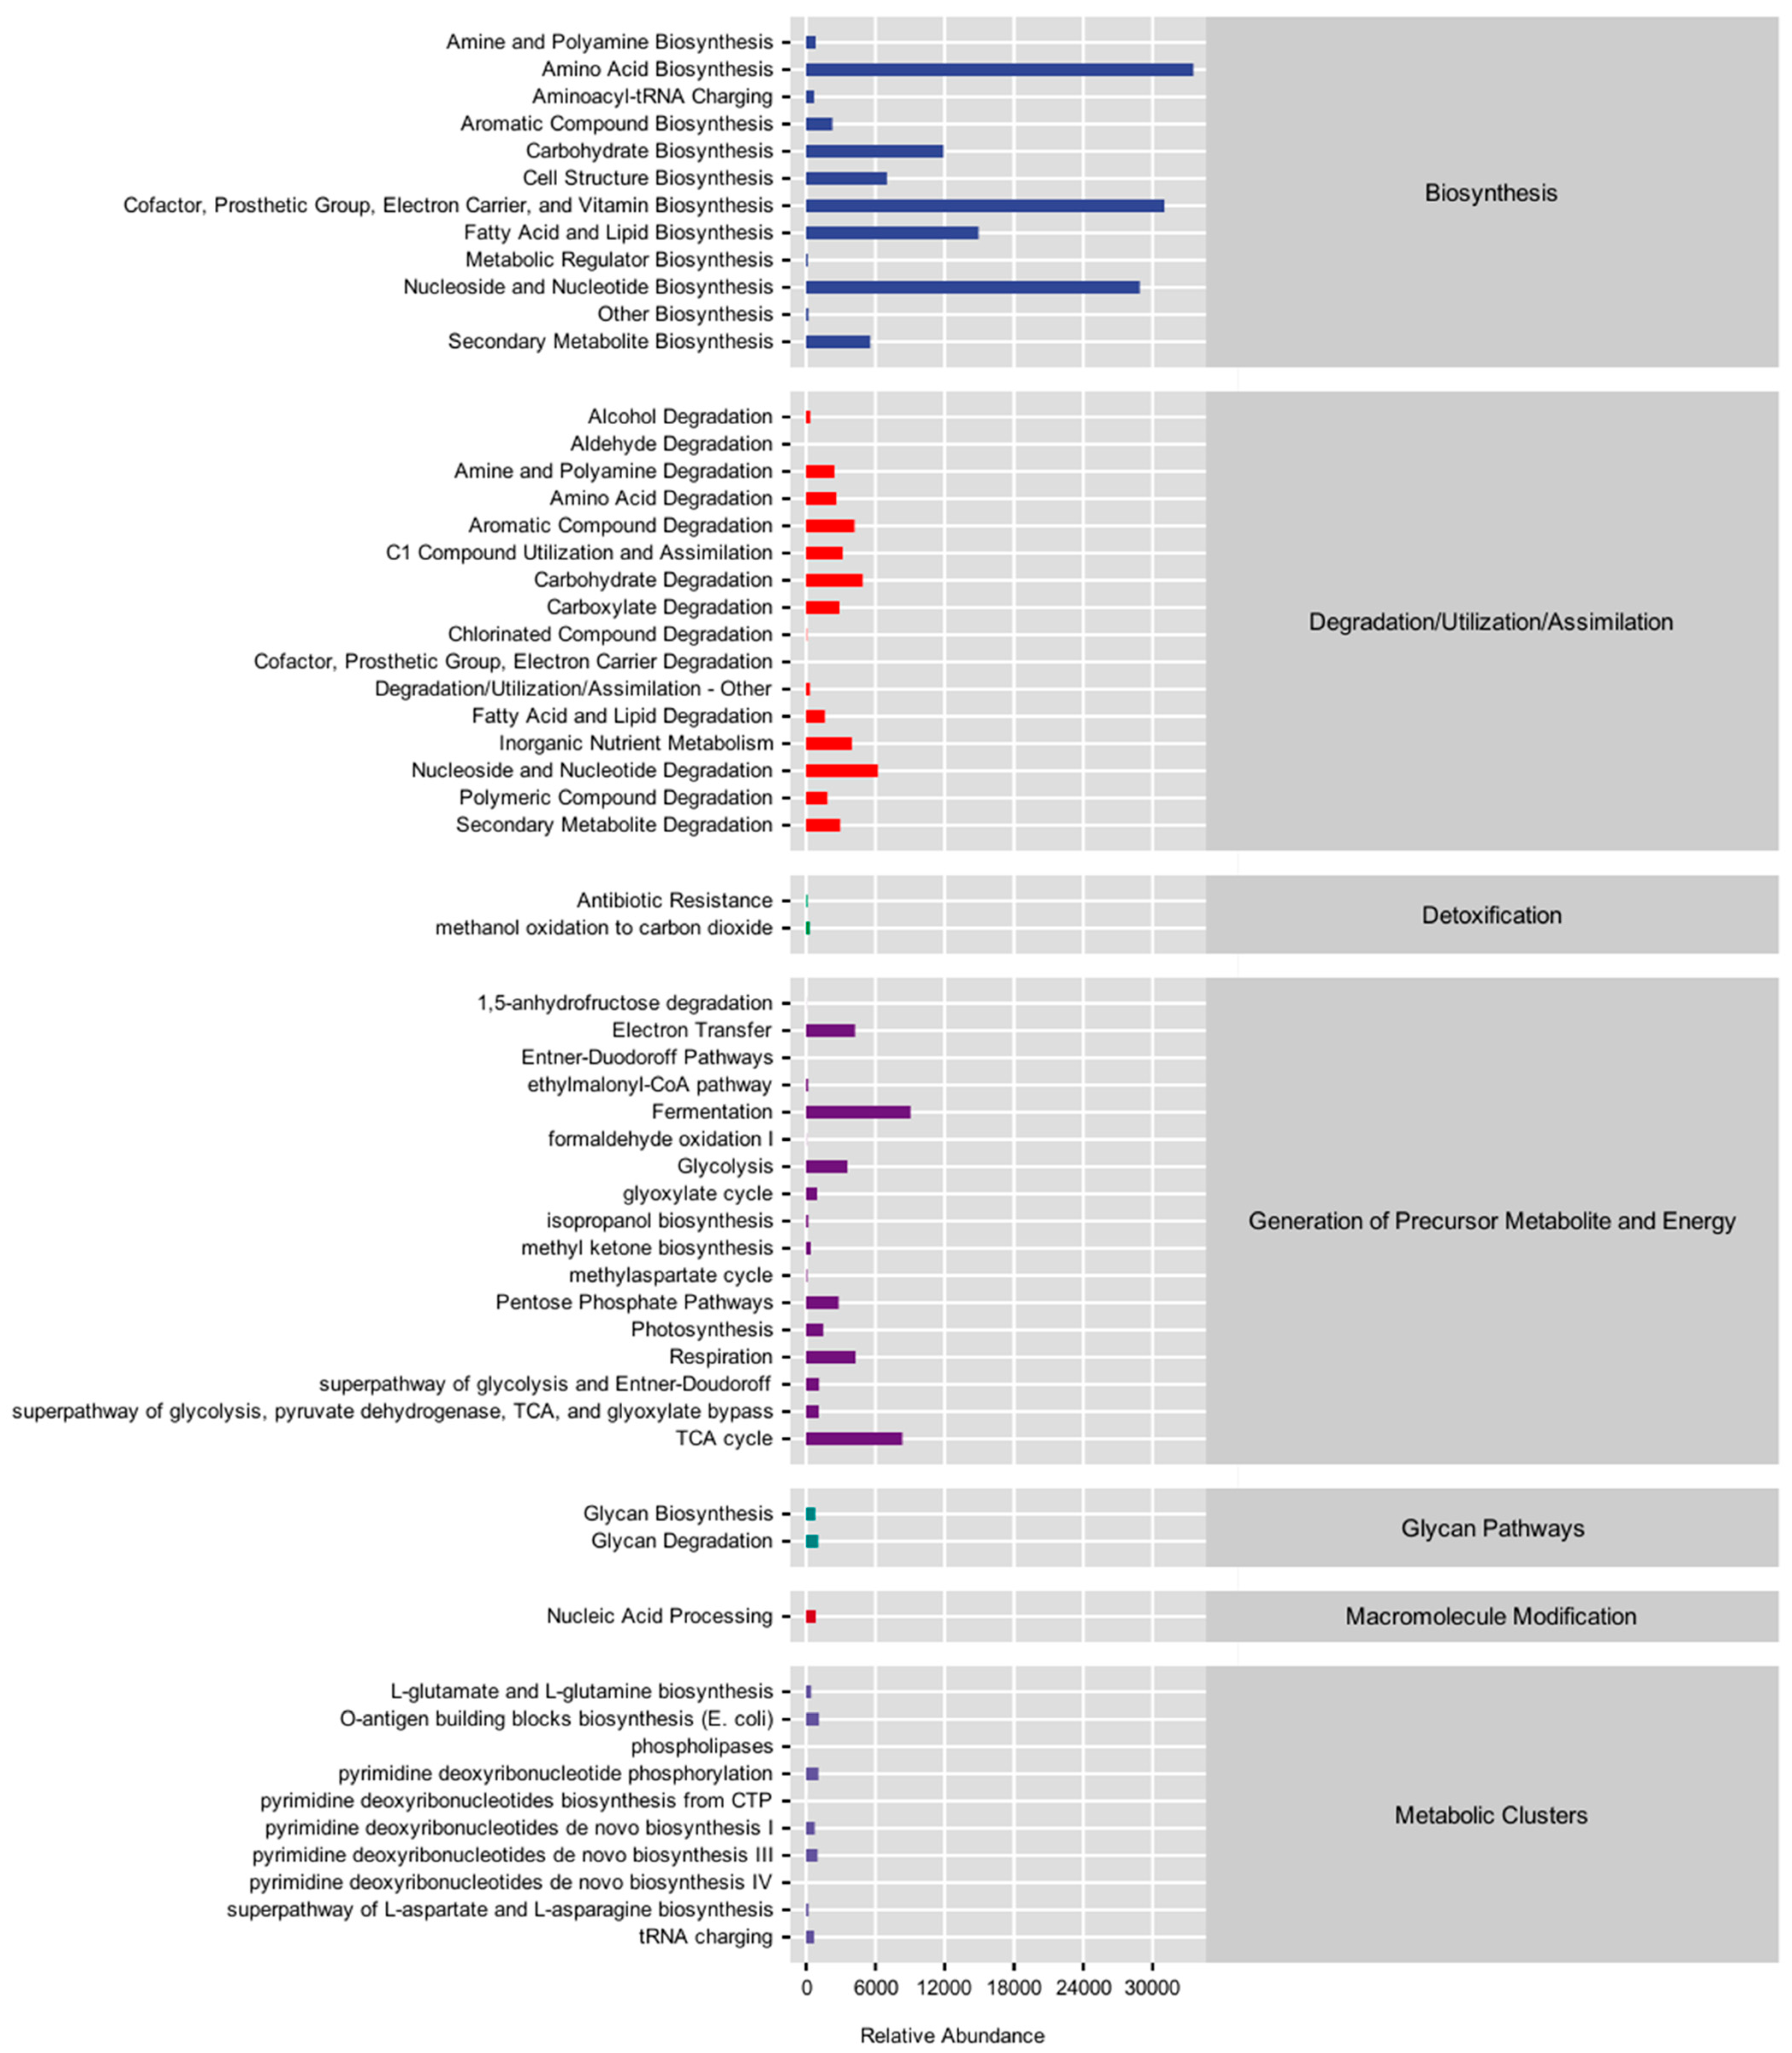
A comparative analysis of metabolic pathway abundances of bacterial communities in the rhizospheric tea soil of monoculture tea plantation (CK) and leguminous cover-cropped tea plantations with soybean (LC-S) and cowpea (C) revealed distinct shifts in pathway abundances among the treatments of CK, LC-S, and LC-C, which were demonstrated by the combined databases of KEGG, MetaCyc, and COG (Figure 14). The tea soil rhizosphere bacterial communities in CK exhibited elevated abundances across multiple biosynthetic pathways, including amine and polyamine synthesis; amino acid production; aminoacyl-tRNA charging; aromatic compound formation; carbohydrate synthesis; cellular structure biosynthesis; cofactor; prosthetic group; electron carrier; vitamin biosynthesis; fatty acid and lipid synthesis; metabolic regulator biosynthesis; as well as nucleoside and nucleotide biosynthesis and secondary metabolite biosynthetic pathways, reflecting a metabolic emphasis on resource conservation and structural biomolecule production. Compared with the CK control, LC-S demonstrated increased activity in degradation, utilization, and assimilation pathways, related to the degradation, utilization, and assimilation of various compounds, including alcohol degradation; amine and polyamine catabolism; amino acid breakdown; aromatic compound degradation; C1 compound utilization and assimilation; carbohydrate decomposition; carboxylate degradation; fatty acid and lipid degradation; inorganic nutrient metabolism; nucleoside and nucleotide degradation; polymeric compound degradation; and secondary metabolite degradation. Moreover, LC-S demonstrated minimal representation in macromolecule modification pathways like nucleic acid processing. Moreover, LC-C displayed distinct metabolic partitioning, with minimal representation in detoxification pathways (antibiotic resistance, methanol oxidation to carbon dioxide) but elevated abundances in glycan-related pathways, including glycan biosynthesis and glycan degradation. These differential patterns highlighted higher microbial functional potential of LC-S and LC-C as compared to the control of CK, which favors biosynthesis pathways, whereas leguminous cover cropping promotes degradation or substrate-specific metabolic adaptations.
Based on the observed metabolic pathway abundances, LC-S and LC-C both demonstrated distinct functional advantages over the control of CK. The elevated degradation, utilization, and assimilation pathways (e.g., carbohydrate degradation, C1 compound assimilation, and polymeric compound degradation) in LC-S and the heightened activity in glycan biosynthesis/degradation in LC-C were evident from the combined metabolic pathways analyses of KEGG, MetaCyc, and COG (Figure 14).

3.6. Metabolic Pathway Difference Analysis

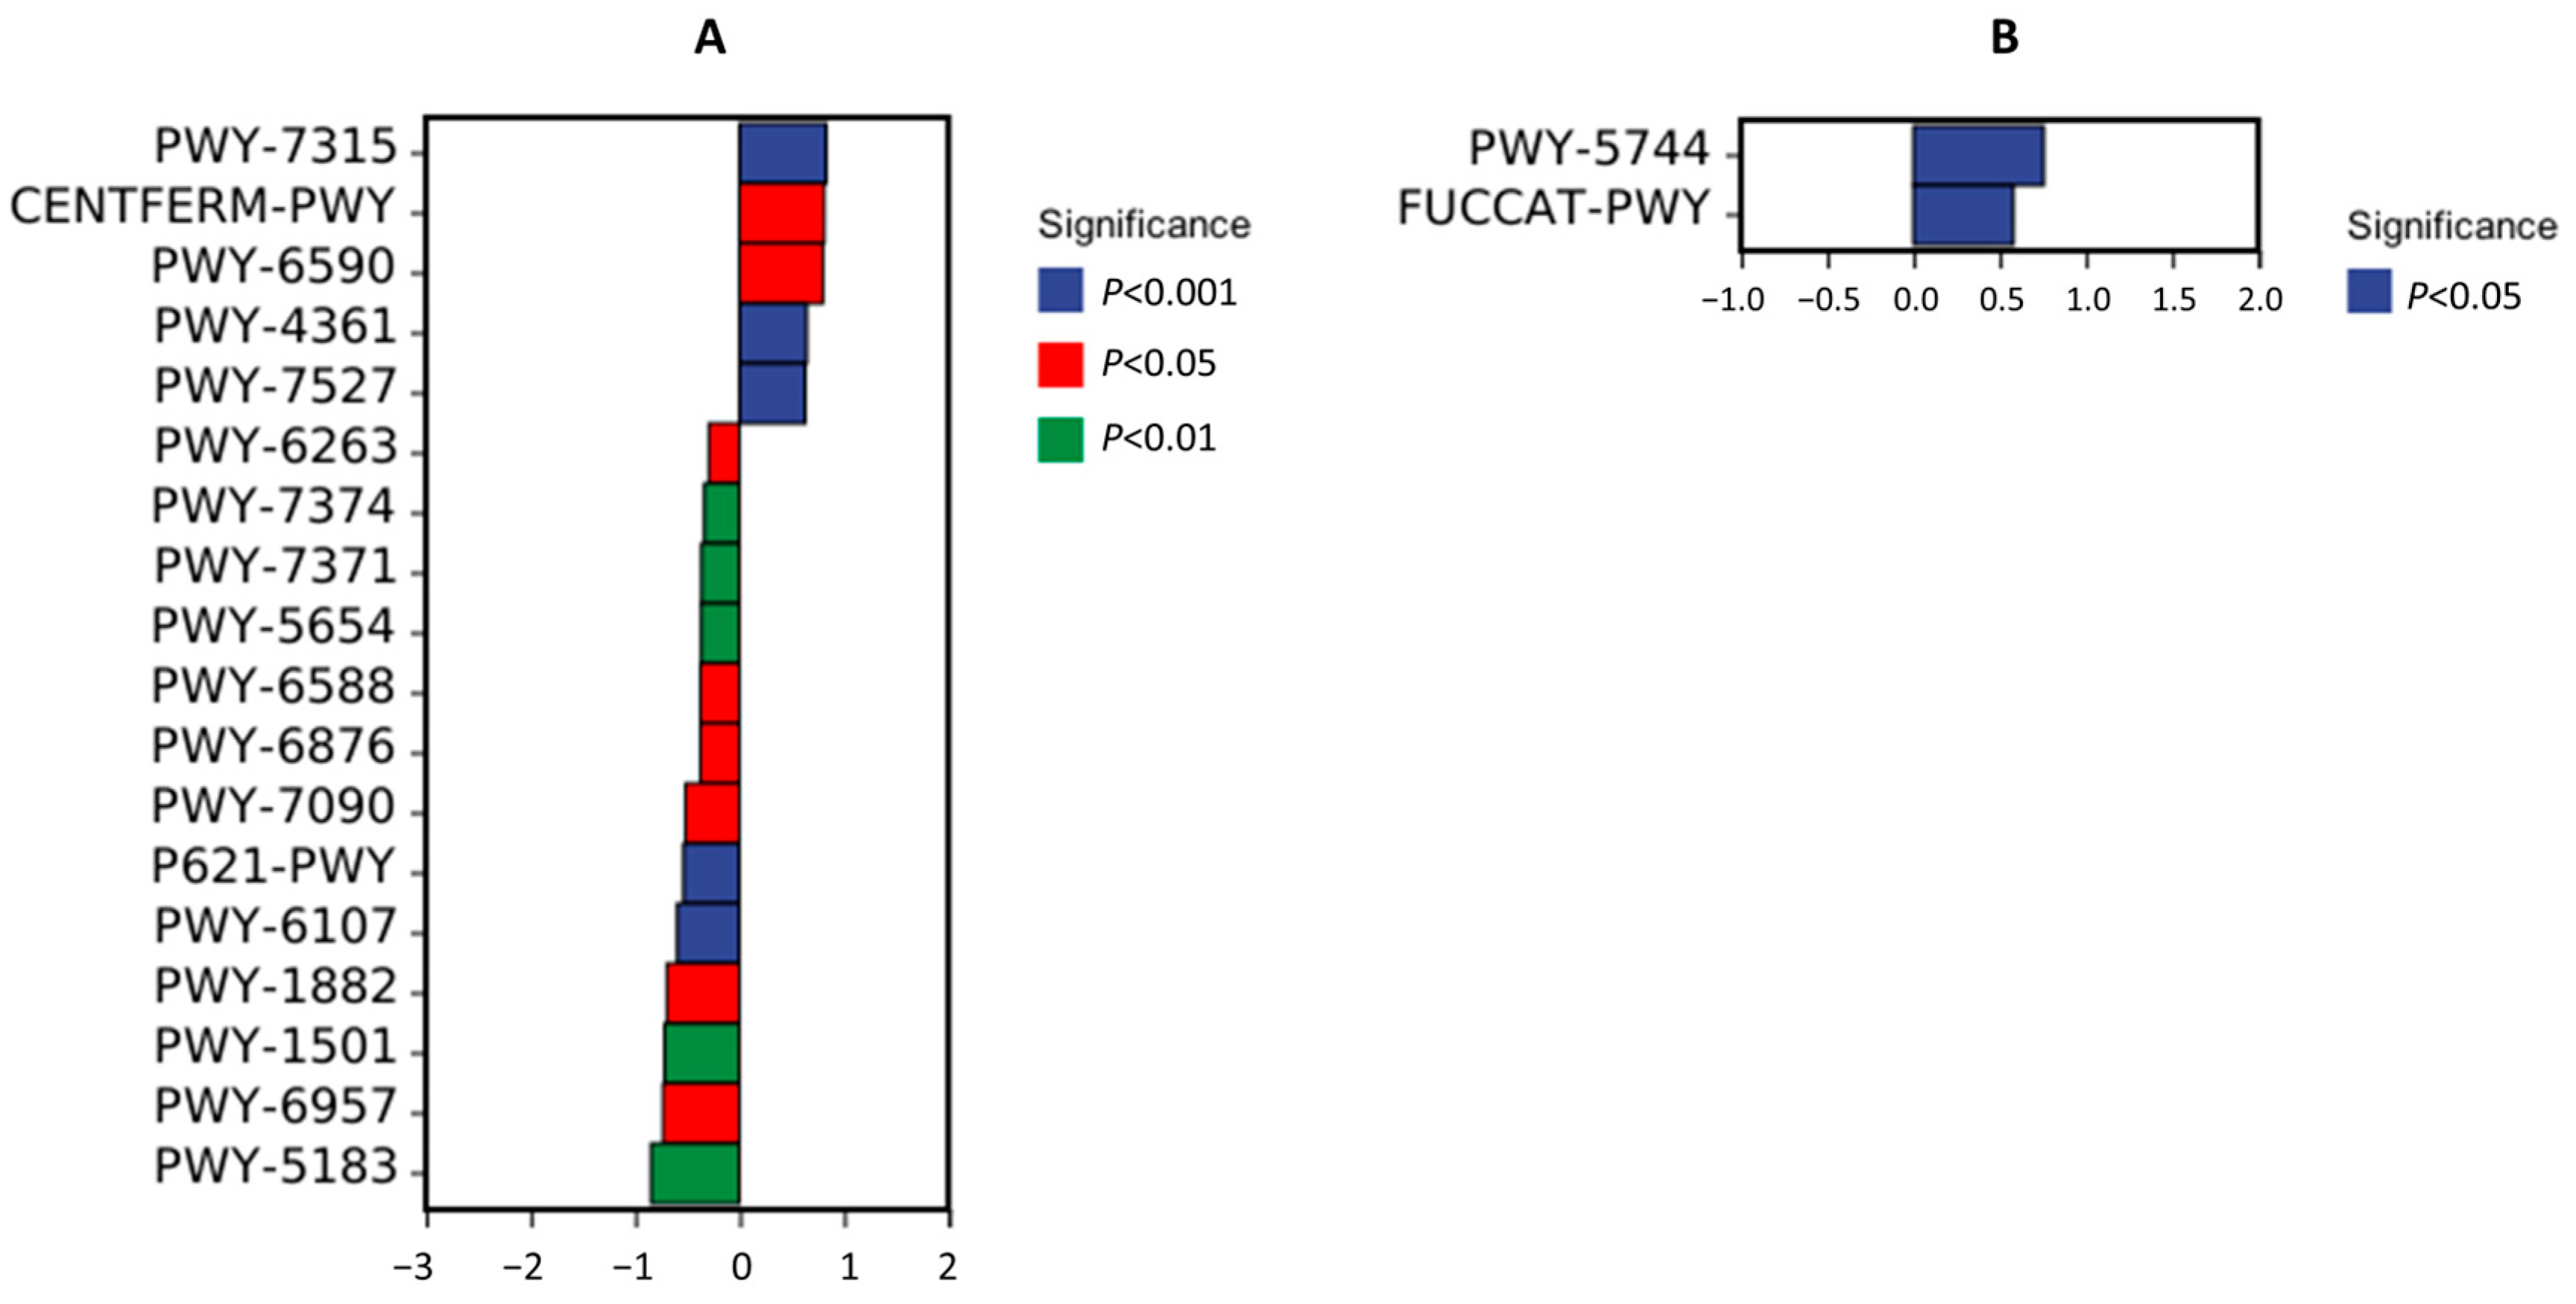
The metabolic pathway difference analyses of bacterial communities in the tea rhizospheric soil of monoculture tea plantation (CK) were compared with LC-S and LC-C, respectively (Figure 15). Compared with the control of CK, 16 pathways (including PWY-7315, CENTFERM-PWY, PWY-6590, PWY-4361, PWY-7527, PWY-6263, PWY-7374, PWY-7371, PWY-5654, PWY-6588, PWY-6876, PWY-7090, P621-PWY, PWY-6107, PWY-1882, PWY-1501, PWY-6957, PWY-5183) were significantly altered in LC-S indicated by positive logFC values (Figure 15A), while CENTFERM-PWY, PWY-6263, and PWY-5654 demonstrated varied significance (p < 0.001 to p < 0.05; Figure 15A). Concomitantly, PWY-5744 and FUCCAT-PWY pathways significantly altered between LC-C and CK (p < 0.05; Figure 15B).

4. Discussion

Microbial community diversity of rhizosphere soil has been explored across a wide range of environments, including various cereal crops, vegetables, grasslands, forest ecosystem, and permafrost regions including tea cultivation systems. Rhizosphere soil microbial communities and their exceptional functions in nutrient recycling, plant growth promotion, and pathogen resistance all contribute to the enhanced soil ecosystem services. Saccharimonadales, which belong to the phylum Pastescibacteria, are gaining recognition for their role in the cycling of soil nutrients, especially in relation to nitrogen and phosphorus dynamics. These bacteria have been identified as potential bio-indicators of elevated phosphorus availability and have demonstrated synergistic interactions with genes involved in nitrogen cycling [3,35]. Importantly, Saccharimonadales can boost alkaline phosphatase activity in the rhizosphere, indicating a crucial function in soil phosphorus cycling, even though they are relatively scarce in the microbial community [36]. Additionally, they are regarded as typical denitrifying bacteria, contributing critically to nitrogen transformations within soil ecosystems [37]. Leifsonia, another key rhizobacterium, is recognized for its plant growth-promoting capabilities and its resilience to heavy metal stress, with strains that range from beneficial to pathogenic [38,39]. Frankiaceae, a family within the Actinobacteria, are characterized by their symbiotic capability to induce the formation of nitrogen-fixing root nodules on the roots of woody dicotyledonous plants, thus enhancing soil fertility via biological nitrogen fixation [40,41]. These bacteria not only enhance the soil nutrient availability but also possess the ability to degrade a variety of anthropogenic pollutants and withstand high salinity, rendering them significant for ecological restoration. Nocardia species, another category of Actinomycetes, are distinguished by their metabolic flexibility, which includes the breakdown of complex organic compounds and pesticides, as well as their function as plant growth enhancers in tea soils [42,43]. These bacteria generate enzymes and antifungal substances that safeguard plants against pathogens and demonstrate resilience to various environmental stresses [44]. Moreover, additional taxa such as Sericytochromatia, Psychroglaciecola, WD260, Conexibacter, Spaherobacteria, Gordonia, and Cohnella contribute to soil health and plant productivity through a range of ecological functions, including carbon metabolism, nutrient cycling, pollutant degradation, and environmental restoration [45,46,47].
Tea rhizospheres host diverse bacterial communities dominated by Acidobacteria, Proteobacteria, Actinobacteria, Chloroflexi, Bacteroidetes, and Gemmatimonadetes, which drive vital soil ecosystem services encompassing the facilitation of nutrient dynamics, breakdown of organic matter, and stress resilience [48,49]. Acidobacteria, as oligotrophs, thrive in nutrient-limited soils, degrading recalcitrant organic matter and correlating positively with soil organic carbon [50,51]. Proteobacteria, including copiotrophic genera like Bradyrhizobium and Pseudomonas, mediate nitrogen fixation, phosphorus solubilization, and symbiotic interactions [18,51]. Actinobacteria produces bioactive metabolites that enhance plant stress tolerance, while Bacteroidetes and Chloroflexi play a significant role in nitrogen and phosphorus cycling [52,53]. Functional specialists such as Mycolicibacterium (PAH degradation) and Sphingomonadaceae (Xenobiotic breakdown) further underscore the ecological adaptability of these communities [54,55]. Our study vividly demonstrated that leguminous cover crops LC-S and LC-C exhibited distinct yet overlapping biomarker profiles, sharing genera such as Saccharimonadales, Leifsonia, Frankiaceae, Nocardia, Sericytochromatia, Psychroglaciecola, WD260, Conexibacter, and Gordonia in the tea rhizospheric soil. Notably, in our study, LC-S was characterized by the enrichment of Cohnella, Sphaerobacter, Conexibacter, and Gordonia, while LC-C demonstrated further enrichment of the phylum Cyanobacteria and taxa associated with the order Saccharimonadales. The microbial taxa associated with nutrient cycling and plant growth enhancers, including Saccharimonadales, Leifsonia, Frankiaceae, and Nocardia, are common biomarkers in both legume covers, i.e., soybean (LC-S) and cowpea (LC-C) systems, reflecting their shared roles in enhancing soil fertility and ecosystem function. However, LC-S shows a distinct enrichment of genera like Cohnella and Sphaerobacter, while LC-C is characterized by a greater abundance of Cyanobacteria and additional Saccharimonadales taxa, indicating subtle differences in microbial community composition driven by the specific legume cover crop.
Furthermore, the genus Chujaibacter has been identified as a key functional bacterial group that fosters synergistic interactions within the rhizosphere, optimizing microbial community dynamics to maintain soil micro-ecological homeostasis. Its abundance notably increases under green manure treatments such as Vicia vilosa (hairy vetch), aligning with global trends where copiotrophic bacteria proliferate in nutrient-rich environments, thereby promoting plant growth and nutrient cycling. In tea plantations, Chujaibacter is a dominant genus involved in regulating the circadian rhythms of soil microbial communities, highlighting its ecological significance in maintaining soil functional integrity [56]. Similarly, the genus Jatrophihabitans—belonging to the phylum Actinobacteria and found in the rhizosphere of plants such as Cynanchum wilfordii, sugarcane, and banana—contributes to plant-beneficial functions including cytokinin biosynthesis, auxin response, and siderophore production. This genus also plays a role in modulating soil bacterial communities, sometimes influencing pathological outcomes in banana, and has been implicated in the synergistic remediation of atrazine-contaminated soils when combined with legume cover crops like hairy vetch [57,58,59]. Aligned with these prior findings, our study also demonstrated that the leguminous cover crops soybean (LC-S) and cowpea (LC-C) enriched crucial genera Chujaibacter and Jatrophihabitans in the tea rhizosphere soil, which further enhances the microbial diversity by maintaining the tea plant growth and nutrient cycling, and by acting as a shield against phytopathogens. Other bacterial taxa contribute significantly to soil nutrient cycling and disease suppression in tea plantation ecosystems. The uncultured Ktedonobacterales, JG30a-KF-32, which is part of the Chloroflexi phylum, thrives in oligotrophic soils and possesses the ability to fix atmospheric nitrogen, with high abundance reported in ancient tea plantation rhizospheres in China [60,61]. Firmicutes are among the most abundant bacteria in tea rhizospheres intercropped with walnut, where their enrichment correlates with decreased prevalence of diseases, notably bacterial wilt in tomato [62,63,64]. Mycobacteria, diverse actinobacteria known for biodegradation of pollutants, are present in tea rhizospheres amended with green manure like soybean, although their abundance tends to decline with increasing plantation age [65,66]. Bacillus species, particularly Bacillus subtilis, are recognized plant growth promoters whose populations increase in tea gardens with legume cover crops such as soybean. These bacteria also serve as biocontrol agents, inducing resistance against diseases like tea blister blight [67,68]. Additionally, Nitrospira, key ammonia-oxidizing bacteria, serve acritical function in nitrification within tea soils and respond positively to organic amendments, though they are sensitive to excessive long-term nitrogen fertilization [57,69]. The bacterial group B12-WMSP1 has also been found to be abundant in soybean-incorporated rhizosphere soils, further underscoring the influence of legume cover crops on shaping beneficial microbial communities [70]. Likewise, in our study, both leguminous cover crops (LCRs), i.e., soybean (LC-S) and cowpea (LC-C), enhanced the prevalence of these pivotal microbial populations in the tea rhizosphere soil including Ktedonobacterales, JG30a-KF-32 belonging to phylum chloroflexi, Firmicutes, Mycobacteria, Bacillus, and Nitrospira. The enrichment of these diverse soil microbes around tea rhizosphere soil mediated by legume cover crops is of paramount importance for mineral nutrition maintenance, nitrification, and phytoprotection of tea plants.
In this study, leguminous cover cropping with soybean (LC-S) and cowpea (LC-C) reshaped tea rhizosphere soil microbial composition as compared to the control, i.e., monoculture tea plantations (CK), favoring copiotrophic taxa. Acidobacteria, Proteobacteria, and Actinobacteria emerged as dominant phyla within the soil of tea rhizosphere region of LC-S and LC-C, consistent with prior studies [14,48]. Proteobacteria dominated the tea rhizosphere soil of LC-S and LC-C, aligning with their role in symbiotic nitrogen fixation [71], while Acidobacteria’s dominance reflected their oligotrophic adaptation to organic carbon turnover [22]. Actinobacteria, enriched in LC-S and LC-C, further highlight their association with bioactive metabolite production and stress resilience [52]. Metagenome sequencing revealed LC-S preferentially enriched Mycobacterium, Conexibacter, JG30a-KF-32, and Jatrophihabitans, whereas LC-C elevated Acidipila, Edaphobacter, Actinospica, and Crossiella. These shifts driven by root exudate-mediated pH and carbon dynamics [20,72] are due to the functional guild enrichment (e.g., Sphingomonadaceae, Rhodanobacteraceae) and oligotroph reduction (e.g., Sphingobacteriia) under nitrogen-rich regimes [14]. The taxonomic analysis identified Actinobacteria as the predominant phylum in all treatments of CK, LC-S, and LC-C, emphasizing its essential function in the ecosystems of tea plantation soils. Importantly, LC-S and LC-C both affected the relative abundance of Actinobacterial subgroups like Thermoleophilia and Acidothermus, facilitating enhanced taxonomic resolution at more detailed levels. These results are consistent with earlier research that underscores the resilience and ecological significance of Actinobacteria in acidic, nutrient-variable soils [73,74]. These variations suggest that while both green manure legume covers, soybean (S) and cowpea (C), support key beneficial microbes, their unique microbial signatures may differentially influence nutrient cycling and the symbiotic relationships between plants and soil microorganisms in the tea ecosystem.
Metabolic pathway analyses revealed that LC-S significantly up-regulated diverse degradation, utilization, and assimilation pathways, including those involved in carbohydrate and aromatic compound metabolism (e.g., PWY-7315, CENTFERM-PWY), reflecting a robust microbial capacity for substrate breakdown and energy production. In contrast, LC-C was characterized by enhanced glycan biosynthesis and degradation pathways (e.g., PWY-5744, FUCCAT-PWY), with PWY-5744 facilitating glyoxylate assimilation—a key intermediate in the Tricarboxylic acid (TCA) cycle—and FUCCAT-PWY promoting L-fucose degradation. These distinct metabolic profiles align with previous findings that legume cover cropping activates substrate-specific microbial adaptations in monoculture tea gardens, with LC-S favoring degradation and assimilation processes, while LC-C emphasizes glycan-related functions [20,67,75]. Both treatments exhibited elevated nitrogenase and glycoside hydrolase activities, optimizing nitrogen assimilation into amino acids such as theanine and enhancing sulfur-containing volatiles, thereby improving tea quality [22,76,77]. Metagenomic sequencing identified Actinobacteria, Proteobacteria, Acidobacteria, and Chloroflexi as dominant phyla across both LC-S and LC-C, with genera such as Mycobacterium, Conexibacter, Chujaibacter, and Jatrophihabitans prevalent in both treatments. LC-S showed pronounced enrichment of taxa including Mycobacterium, Bacillus, Nitrospira, and Firmicutes—a phylum uniquely enriched in this treatment—while LC-C was distinguished by the enrichment of Acidipila, Planctomycetes, and other genera, highlighting distinct microbial community compositions and functional potentials. These differences underscore how legume cover crops differentially shape rhizosphere microbial assemblages, with LC-S promoting broad substrate degradation and nutrient cycling, and LC-C enhancing glycan metabolism, both surpassing the biosynthetic focus observed in monoculture controls. In sum, these results highlight the importance of legume intercropping in fostering specialized microbial consortia that contribute to soil health, nutrient dynamics, and crop productivity in tea agroecosystems. The incorporation of leguminous green manure cover crops, notably soybean (LC-S) and cowpea (LC-C), into tea agroecosystems has proven to be a beneficial agro-ecological strategy, particularly in shaping rhizosphere microbial communities and enhancing metabolic functions, ultimately improving tea quality.
Metagenomic sequencing revealed that LC-S and LC-C significantly altered the rhizosphere microbiome compared to the control of CK, with consistent enrichment of key microbial phyla such as Actinobacteria, Proteobacteria, Acidobacteria, and Chloroflexi. These groups are essential for the breakdown of organic matter and the recycling of nutrients, both of which are intricately linked to the biosynthesis of bioactive compounds in tea [78,79]. A notable finding is the elevated presence of genera like Mycobacterium, Conexibacter, and Chujaibacter—beneficial soil microbes which can degrade complex organic substrates and mobilize nitrogen, a crucial nutrient for biosynthesis of amino acids and secondary metabolites such as theanine, catechins, and flavonoids [80]. Theanine, in particular, contributes significantly to the umami taste of tea and is synthesized from glutamic acid and ethylamine, both of which depend on active nitrogen cycling and microbial assimilation processes [81]. These microbial functions are further amplified under the integration of leguminous cover cropping systems (LCR) in tea agroecosystems, as evidenced by the increased abundance of secondary metabolic pathways associated with the breakdown of aromatic compounds, carbohydrates, and amino acids in the LC-S treatment. These degradation processes are essential for generating precursors such as phenolic acids and monosaccharides that are directly engaged in the synthesis of polyphenolic secondary metabolites, including flavonoids and catechins, through the phenylpropanoid and shikimate pathways [82,83]. Enhanced activity in these microbial pathways therefore provides a biochemical advantage for tea plants by improving the supply of necessary substrates for the production of bioactive compounds in tea. These compounds, including carbohydrates, phenolic compounds, catechins, theanine, and caffeine, enrich the astringency and sensory profiles of tea. Moreover, microbial transformation of aromatic compounds in the rhizosphere supports the formation of volatile organic compounds (VOCs), which are key to tea aroma development [84,85]. In the integration of legume cover cropping systems, although the focus was less on degradation pathways, increased microbial activity in glycan biosynthesis and degradation suggests potential modulation of root exudates and microbe–root interactions, which can influence micronutrient uptake. Nutrients such as iron (Fe) and manganese (Mn), often co-regulated with microbial activity, are critical cofactors in enzymatic reactions facilitating the synthesis of polyphenolic compounds in tea leaves [86,87].
In our two-year field study incorporating leguminous green manure cover crops, soybean (LC-S) demonstrated a more significant effect on enhancing the diversity of microbial communities in the tea rhizosphere soil compared to cowpea (LC-C). However, regarding tea quality, the combined application of both leguminous green manures synergistically enhanced the accumulation of polyphenolic bioactive compounds and nitrogen-containing quality metabolites such as theanine and free amino acids. Individually, soybean primarily promoted aromatic metabolites, including carbohydrates, while cowpea favored the enrichment of polyphenolic compounds like flavonoids. This restructuring of the rhizosphere microbial communities and the associated functional enhancements under legume cover cropping create a dynamic soil environment that supports the biosynthesis of key quality-related metabolites, ultimately improving the sensory and nutritional attributes of tea. Therefore, integrating both legume species offers a balanced strategy for commercial tea production, aligning immediate quality improvements with long-term agronomic sustainability and environmental resilience.

5. Conclusions

The incorporation of leguminous cover crops, particularly soybean (LC-S) and cowpea (LC-C), into tea agroecosystems constitutes a promising ecological approach to enhance soil ecosystem services with the enhanced beneficial microbial communities through the modulation of rhizosphere soil microbiome. The legume cover crops influence the tea rhizosphere soil and significantly restructure rhizosphere microbial communities, favoring copiotrophic and functionally specialized taxa such as Proteobacteria, Actinobacteria, and Mycobacterium, which are beneficial microbial communities instrumental in the processes of nutrient cycling, breakdown of organic matter, and secondary metabolite transformation. Moreover, beneficial soil microbial taxa, including Chloroflexi, Crossiela, Conexibacter, Acidothermus, Bradyrhizobium, Leifsonia, Nocardia, Psychroglaciecola, Gordonia, Cyanobacteria, Chujaibacter, and Jatrophihabitans, have been enriched in tea rhizosphere soil after the incorporation of leguminous cover crops, i.e., soybean (S) and cowpea (C), in the tea plantation rows. Firmicutes have been exclusively enriched under the influence of soybean as a legume cover crop, and Planctomycetes have been exclusively enriched under cowpea cover crop in the tea rhizosphere soil. These enriched beneficial taxa enhanced the soil ecosystem services of tea rhizopsheric soil region aided by the leguminous green manure covers, soybean (S) and cowpea (C), with nitrogen-fixing root nodules, which helps in the breakdown of complex organic matter, plant growth promotion, phytoremediation, and nitrification, and protects the tea agroecosystem from the bacterial disease.
16S rRNA metagenomic and metabolic pathway analyses reveal that the leguminous cover crops especially with soybean (LC-S) up-regulate degradation and assimilation pathways essential for generating precursors of key tea quality compounds, including amino acids like theanine, polyphenols, catechins, and aromatic volatiles. Meanwhile, the impact of the leguminous cover crops with cowpea (LC-C) on glycan metabolism and microbe–root interactions underscore the role in enhancing micronutrient uptake and rhizosphere communication. These microbial and functional shifts driven by legume root exudation and nitrogen enrichment contribute to improved biosynthesis of bioactive and sensory-enhancing compounds in tea. Ultimately, leguminous green manure cover crops incorporated in the tea row spaces not only improve tea rhizosphere soil ecological functions but also advance the biochemical quality and market value of tea, offering a sustainable approach to intensifying production in monoculture-dominated tea cultivating systems. These microbial-mediated shifts enhance tea quality through refined flavor profiles and amino acid content, highlighting the agro-ecological value of leguminous green manure cover crops in commercially sustainable tea cultivation.

Supplementary Materials

The following supporting information can be downloaded at: https://www.mdpi.com/article/10.3390/agronomy15092217/s1, Figure S1: Alphabox plots of bacterial communities in the rhizosphere soil of monoculture tea plantation (CK) and leguminous cover-cropped tea plantations with soybean and cowpea (i.e., LC-S and LC-C) (Note: S—Soybean; C—Cowpea; LC-S—Soybean Glycine max cv. Lamar sown between tea rows; LC-C—Cowpea Vigna unguiculata cv. Suxia No.1 sown between tea rows); Table S1: Result statistics of sequencing data from monoculture (CK1, CK2, and CK3) and leguminous cover-cropped tea rhizosphere soil samples (LC-S1, LC-S2, LC-S3, and LC-C1, LC-C2, and LC-C3).

Author Contributions

Conceptualization, S.S.P. and F.C.; methodology, S.S.P., C.W. and Z.A.; formal data analysis, S.S.P. and Z.A.; investigation, all; resources, F.C., X.J. and C.W.; writing—original draft, S.S.P.; writing—review and editing, S.S.P., F.C. and X.J.; visualization, S.S.P. and F.C.; funding acquisition, F.C. All authors have read and agreed to the published version of the manuscript.

Funding

This research was funded by the National Key Research and Development Program of China (2023YFD1400800) and the projects under the China Agriculture Research System of MOF and MARA (CARS-22).

Data Availability Statement

The original contributions presented in the studies are included in the article; further inquiries can be directed to the corresponding author.

Conflicts of Interest

The authors declare no conflicts of interest.

References

  1. Krahe, J.C.; Krahe, M.A.; Roach, P.D. Development of an Objective Measure of Quality and Commercial Value of Japanese-Styled Green Tea (Camellia L. sinensis): The Quality Index Tool. J. Food Sci. Technol. 2018, 55, 2926–2934. [Google Scholar] [CrossRef]
  2. Pokharel, S.S.; Shen, F.; Parajulee, M.N.; Wang, Y.; Chen, F. Effects of Elevated Atmospheric CO2 Concentration on Tea Quality and Insect Pests’ Occurrences: A Review. Glob. Ecol. Conserv. 2021, 27, e01553. [Google Scholar] [CrossRef]
  3. Sun, L.; Wang, Y.; Ma, D.; Wang, L.; Zhang, X.; Ding, Y.; Fan, K.; Xu, Z.; Yuan, C.; Jia, H.; et al. Differential Responses of the Rhizosphere Microbiome Structure and Soil Metabolites in Tea (Camellia sinensis) Upon Application of Cow Manure. BMC Microbiol. 2022, 22, 55. [Google Scholar] [CrossRef]
  4. Badri, D.V.; Chaparro, J.M.; Zhang, R.; Shen, Q.; Vivanco, J.M. Application of Natural Blends of Phytochemicals Derived from the Root Exudates of Arabidopsis to the Soil Reveal That Phenolic-Related Compounds Predominantly Modulate the Soil Microbiome. J. Biol. Chem. 2013, 288, 4502–4512. [Google Scholar] [CrossRef] [PubMed]
  5. Xiong, Y.; Shao, S.; Li, D.; Liu, H.; Xie, W.; Huang, W.; Li, J.; Nie, C.; Zhang, J.; Hong, Y.; et al. Exploring the Impact of Tea (Camellia sinensis (L.) O. Ktze.)/Trachelospermum jasminoides (Lindl.) Lem. Intercropping on Soil Health and Microbial Communities. Agronomy 2024, 14, 1261. [Google Scholar] [CrossRef]
  6. Scholes, M.C.; Scholes, R.J. Dust Unto Dust. Science 2013, 342, 565–566. [Google Scholar] [CrossRef]
  7. Basu, S.; Kumar, G.; Chhabra, S.; Prasad, R. Chapter 13—Role of Soil Microbes in Biogeochemical Cycle for Enhancing Soil Fertility. In New and Future Developments in Microbial Biotechnology and Bioengineering; Verma, J.P., Macdonald, C.A., Gupta, V.K., Podile, A.R., Eds.; Elsevier: Amsterdam, The Netherlands, 2021; pp. 149–157. ISBN 978-0-444-64325-4. [Google Scholar]
  8. Debreczeni, K.; Kismányoky, T. Acidification of Soils in Long-Term Field Experiments. Commun. Soil Sci. Plant Anal. 2005, 36, 321–329. [Google Scholar] [CrossRef]
  9. Fierer, N.; Ladau, J.; Clemente, J.C.; Leff, J.W.; Owens, S.M.; Pollard, K.S.; Knight, R.; Gilbert, J.A.; McCulley, R.L. Reconstructing the Microbial Diversity and Function of Pre-Agricultural Tallgrass Prairie Soils in the United States. Science 2013, 342, 621–624. [Google Scholar] [CrossRef] [PubMed]
  10. Zhang, X.; Zhang, Q.; Liang, B.; Li, J. Changes in the Abundance and Structure of Bacterial Communities in the Greenhouse Tomato Cultivation System Under Long-Term Fertilization Treatments. Appl. Soil Ecol. 2017, 121, 82–89. [Google Scholar] [CrossRef]
  11. Qiao, C.; Xu, B.; Han, Y.; Wang, J.; Wang, X.; Liu, L.; Liu, W.; Wan, S.; Tan, H.; Liu, Y.; et al. Synthetic Nitrogen Fertilizers Alter the Soil Chemistry, Production and Quality of Tea. A Meta-Analysis. Agron. Sustain. Dev. 2018, 38, 10. [Google Scholar] [CrossRef]
  12. Ji, L.; Wu, Z.; You, Z.; Yi, X.; Ni, K.; Guo, S.; Ruan, J. Effects of Organic Substitution for Synthetic N Fertilizer on Soil Bacterial Diversity and Community Composition: A 10-Year Field Trial in a Tea Plantation. Agric. Ecosyst. Environ. 2018, 268, 124–132. [Google Scholar] [CrossRef]
  13. Pokharel, S.S.; Yu, H.; Fang, W.; Parajulee, M.N.; Chen, F. Intercropping Cover Crops for a Vital Ecosystem Service: A Review of the Biocontrol of Insect Pests in Tea Agroecosystems. Plants 2023, 12, 2361. [Google Scholar] [CrossRef]
  14. Shen, F.-T.; Lin, S.-H. Priming Effects of Cover Cropping on Bacterial Community in a Tea Plantation. Sustainability 2021, 13, 4345. [Google Scholar] [CrossRef]
  15. Sun, L.; Dong, X.; Wang, Y.; Maker, G.; Agarwal, M.; Ding, Z. Tea-Soybean Intercropping Improves Tea Quality and Nutrition Uptake by Inducing Changes of Rhizosphere Bacterial Communities. Microorganisms 2022, 10, 2149. [Google Scholar] [CrossRef] [PubMed]
  16. Chakraborty, B.; Chakraborty, U.; De, U.; Chakraborty, A. Biological Control of Sclerotial Blight of Tea Using Arbuscular Mycorrhizal Fungus and Plant Growth Promoting Rhizobacterium. J. Tea Sci. 2012, 8, 27–35. [Google Scholar]
  17. Morang, P.; Dutta, B. Growth Promotion and Bi-Control Approaches of Brown Root Rot Disease of Tea by Pseudomonas Aeruginosa (PM 105). J. Plant Pathol. Microbiol. 2012, 5, 1–4. [Google Scholar] [CrossRef]
  18. Caballero-Mellado, J.; Onofre-Lemus, J.; Estrada-de Los Santos, P.; Martínez-Aguilar, L. The Tomato Rhizosphere, an Environment Rich in Nitrogen-Fixing Burkholderia Species with Capabilities of Interest for Agriculture and Bioremediation. Appl. Environ. Microbiol. 2007, 73, 5308–5319. [Google Scholar] [CrossRef]
  19. Guo, M.; Gong, Z.; Miao, R.; Jia, C.; Rookes, J.; Cahill, D.; Zhuang, J. Enhanced Polycyclic Aromatic Hydrocarbons Degradation in Rhizosphere Soil Planted with Tall Fescue: Bacterial Community and Functional Gene Expression Mechanisms. Chemosphere 2018, 212, 15–23. [Google Scholar] [CrossRef]
  20. Duan, Y.; Wang, T.; Lei, X.; Cao, Y.; Liu, L.; Zou, Z.; Ma, Y.; Zhu, X.; Fang, W. Leguminous Green Manure Intercropping Changes the Soil Microbial Community and Increases Soil Nutrients and Key Quality Components of Tea Leaves. Hortic. Res. 2024, 11, uhae018. [Google Scholar] [CrossRef]
  21. Fagervold, S.K.; Rohée, C.; Rodrigues, A.M.S.; Stien, D.; Lebaron, P. Efficient Degradation of the Organic UV Filter Benzophenone-3 by Sphingomonas Wittichii Strain BP14P Isolated from WWTP Sludge. Sci. Total Environ. 2021, 758, 143674. [Google Scholar] [CrossRef]
  22. Ma, Q.; Song, L.; Niu, Z.; Qiu, Z.; Sun, H.; Ren, Z.; Wu, H.; Wang, Y.; Mei, H.; Li, X.; et al. Pea-Tea Intercropping Improves Tea Quality through Regulating Amino Acid Metabolism and Flavonoid Biosynthesis. Foods 2022, 11, 3746. [Google Scholar] [CrossRef]
  23. Cuartero, J.; Pascual, J.A.; Vivo, J.-M.; Özbolat, O.; Sánchez-Navarro, V.; Egea-Cortines, M.; Zornoza, R.; Mena, M.M.; Garcia, E.; Ros, M. A First-Year Melon/Cowpea Intercropping System Improves Soil Nutrients and Changes the Soil Microbial Community. Agric. Ecosyst. Environ. 2022, 328, 107856. [Google Scholar] [CrossRef]
  24. Barillot, C.D.C.; Sarde, C.-O.; Bert, V.; Tarnaud, E.; Cochet, N. A Standardized Method for the Sampling of Rhizosphere and Rhizoplan Soil Bacteria Associated to a Herbaceous Root System. Ann. Microbiol. 2013, 63, 471–476. [Google Scholar] [CrossRef]
  25. Bulgarelli, D.; Schlaeppi, K.; Spaepen, S.; Ver Loren van Themaat, E.; Schulze-Lefert, P. Structure and Functions of the Bacterial Microbiota of Plants. Annu. Rev. Plant Biol. 2013, 64, 807–838. [Google Scholar] [CrossRef]
  26. Bai, Y.; Müller, D.B.; Srinivas, G.; Garrido-Oter, R.; Potthoff, E.; Rott, M.; Dombrowski, N.; Münch, P.C.; Spaepen, S.; Remus-Emsermann, M.; et al. Functional Overlap of the Arabidopsis Leaf and Root Microbiota. Nature 2015, 528, 364–369. [Google Scholar] [CrossRef] [PubMed]
  27. Caporaso, J.G.; Kuczynski, J.; Stombaugh, J.; Bittinger, K.; Bushman, F.D.; Costello, E.K.; Fierer, N.; Peña, A.G.; Goodrich, J.K.; Gordon, J.I.; et al. QIIME Allows Analysis of High-Throughput Community Sequencing Data. Nat. Methods 2010, 7, 335–336. [Google Scholar] [CrossRef]
  28. Heck, K.L.; van Belle, G.; Simberloff, D. Explicit Calculation of the Rarefaction Diversity Measurement and the Determination of Sufficient Sample Size. Ecology 1975, 56, 1459–1461. [Google Scholar] [CrossRef]
  29. Kemp, P.F.; Aller, J.Y. Bacterial Diversity in Aquatic and Other Environments: What 16s Rdna Libraries Can Tell Us. FEMS Microbiol. Ecol. 2004, 47, 161–177. [Google Scholar] [CrossRef]
  30. Carrion, B.; Onorati, T.; Díaz, P.; Triga, V. A Taxonomy Generation Tool for Semantic Visual Analysis of Large Corpus of Documents. Multimed. Tools Appl. 2019, 78, 32919–32937. [Google Scholar] [CrossRef]
  31. Ondov, B.D.; Bergman, N.H.; Phillippy, A.M. Interactive Metagenomic Visualization in a Web Browser. BMC Bioinform. 2011, 12, 385. [Google Scholar] [CrossRef] [PubMed]
  32. Li, D.; Liu, C.-M.; Luo, R.; Sadakane, K.; Lam, T.-W. MEGAHIT: An Ultra-Fast Single-Node Solution for Large and Complex Metagenomics Assembly via Succinct De Bruijn Graph. Bioinformatics 2015, 31, 1674–1676. [Google Scholar] [CrossRef]
  33. Hyatt, D.; Chen, G.-L.; LoCascio, P.F.; Land, M.L.; Larimer, F.W.; Hauser, L.J. Prodigal: Prokaryotic Gene Recognition and Translation Initiation Site Identification. BMC Bioinform. 2010, 11, 119. [Google Scholar] [CrossRef]
  34. Fu, L.; Niu, B.; Zhu, Z.; Wu, S.; Li, W. CD-HIT: Accelerated for Clustering the Next-Generation Sequencing Data. Bioinform. Oxf. Engl. 2012, 28, 3150–3152. [Google Scholar] [CrossRef]
  35. Wang, G.; Jin, Z.; Wang, X.; George, T.S.; Feng, G.; Zhang, L. Simulated Root Exudates Stimulate the Abundance of Saccharimonadales to Improve the Alkaline Phosphatase Activity in Maize Rhizosphere. Appl. Soil Ecol. 2022, 170, 104274. [Google Scholar] [CrossRef]
  36. Lei, Z.; Ding, Y.; Xu, W.; Zhang, Y. Microbial Community Structure in Rice Rhizosheaths Under Drought Stress. J. Plant Ecol. 2023, 16, 1–14. [Google Scholar] [CrossRef]
  37. Shi, L.; Zhang, P.; He, Y.; Zeng, F.; Xu, J.; He, L. Enantioselective Effects of Cyflumetofen on Microbial Community and Related Nitrogen Cycle Gene Function in Acid-Soil. Sci. Total Environ. 2021, 771, 144831. [Google Scholar] [CrossRef] [PubMed]
  38. Egidi, E.; Wood, J.L.; Fox, E.M.; Liu, W.; Franks, A.E. Draft Genome Sequence of Leifsonia sp. Strain NCR5, a Rhizobacterium Isolated from Cadmium-Contaminated Soil. Genome Announc. 2017, 5, e00520-17. [Google Scholar] [CrossRef]
  39. Nordstedt, N.P.; Roman-Reyna, V.; Jacobs, J.M.; Jones, M.L. Comparative Genomic Understanding of Gram-Positive Plant Growth-Promoting Leifsonia. Phytobiomes J. 2021, 5, 263–274. [Google Scholar] [CrossRef]
  40. Normand, P.; Lapierre, P.; Tisa, L.S.; Gogarten, J.P.; Alloisio, N.; Bagnarol, E.; Bassi, C.A.; Berry, A.M.; Bickhart, D.M.; Choisne, N.; et al. Genome Characteristics of Facultatively Symbiotic Frankia sp. Strains Reflect Host Range and Host Plant Biogeography. Genome Res. 2007, 17, 7–15. [Google Scholar] [CrossRef]
  41. Thompson, R.M.; George, D.; del Carmen Montero-Calasanz, M. Actinorhizal Plants and Frankiaceae: The Overlooked Future of Phytoremediation. Environ. Microbiol. Rep. 2024, 16, e70033. [Google Scholar] [CrossRef]
  42. Fuentes, M.S.; Benimeli, C.S.; Cuozzo, S.A.; Amoroso, M.J. Isolation of Pesticide-Degrading Actinomycetes from a Contaminated Site: Bacterial Growth, Removal and Dechlorination of Organochlorine Pesticides. Int. Biodeterior. Biodegrad. 2010, 64, 434–441. [Google Scholar] [CrossRef]
  43. Das, R.; Bharadwaj, P.; Thakur, D. Insights into the Functional Role of Actinomycetia in Promoting Plant Growth and Biocontrol in Tea (Camellia sinensis) Plants. Arch. Microbiol. 2024, 206, 65. [Google Scholar] [CrossRef] [PubMed]
  44. Bennur, T.; Kumar, A.R.; Zinjarde, S.; Javdekar, V. Nocardiopsis Species: Incidence, Ecological Roles and Adaptations. Microbiol. Res. 2015, 174, 33–47. [Google Scholar] [CrossRef]
  45. Drzyzga, O. The Strengths and Weaknesses of Gordonia: A Review of an Emerging Genus with Increasing Biotechnological Potential. Crit. Rev. Microbiol. 2012, 38, 300–316. [Google Scholar] [CrossRef] [PubMed]
  46. Jien, S.H.; Kuo, Y.L.; Liao, C.S.; Wu, Y.T.; Igalavithana, A.D.; Tsang, D.C.W.; Ok, Y.S. Effects of Field Scale in Situ Biochar Incorporation on Soil Environment in a Tropical Highly Weathered Soil. Environ. Pollut. 2021, 272, 116009. [Google Scholar] [CrossRef]
  47. Wu, S.; Wang, W.; Zhu, W.; Chen, W.; Xu, W.; Sui, M.; Jiang, G.; Xiao, J.; Ning, Y.; Ma, C.; et al. Microbial Community Succession in the Fermentation of Qingzhuan Tea at Various Temperatures and Their Correlations with the Quality Formation. Int. J. Food Microbiol. 2022, 382, 109937. [Google Scholar] [CrossRef] [PubMed]
  48. Fu, Z.; Zhou, L.; Chen, P.; Du, Q.; Pang, T.; Song, C.; Wang, X.; Liu, W.; Yang, W.; Yong, T. Effects of Maize-Soybean Relay Intercropping on Crop Nutrient Uptake and Soil Bacterial Community. J. Integr. Agric. 2019, 18, 2006–2018. [Google Scholar] [CrossRef]
  49. Zhong, Y.; Liang, L.; Ruineng, X.U.; Hanyu, X.U.; Sun, L.; Liao, H. Intercropping Tea Plantations with Soybean and Rapeseed Enhances Nitrogen Fixation Through Shifts in Soil Microbial Communities. Front. Agric. Sci. Eng. 2022, 9, 344–355. [Google Scholar] [CrossRef]
  50. Esperschütz, J.; Gattinger, A.; Mäder, P.; Schloter, M.; Fließbach, A. Response of Soil Microbial Biomass and Community Structures to Conventional and Organic Farming Systems Under Identical Crop Rotations. FEMS Microbiol. Ecol. 2007, 61, 26–37. [Google Scholar] [CrossRef]
  51. Fierer, N.; Lauber, C.L.; Ramirez, K.S.; Zaneveld, J.; Bradford, M.A.; Knight, R. Comparative Metagenomic, Phylogenetic and Physiological Analyses of Soil Microbial Communities Across Nitrogen Gradients. ISME J. 2012, 6, 1007–1017. [Google Scholar] [CrossRef]
  52. Kielak, A.M.; Cipriano, M.A.P.; Kuramae, E.E. Acidobacteria Strains from Subdivision 1 Act as Plant Growth-Promoting Bacteria. Arch. Microbiol. 2016, 198, 987–993. [Google Scholar] [CrossRef] [PubMed]
  53. Lidbury, I.D.E.A.; Borsetto, C.; Murphy, A.R.J.; Bottrill, A.; Jones, A.M.E.; Bending, G.D.; Hammond, J.P.; Chen, Y.; Wellington, E.M.H.; Scanlan, D.J. Niche-Adaptation in Plant-Associated Bacteroidetes Favours Specialisation in Organic Phosphorus Mineralisation. ISME J. 2021, 15, 1040–1055. [Google Scholar] [CrossRef] [PubMed]
  54. Stolz, A. Degradative Plasmids from Sphingomonads. FEMS Microbiol. Lett. 2014, 350, 9–19. [Google Scholar] [CrossRef]
  55. Golubev, S.N.; Muratova, A.Y.; Panchenko, L.V.; Shchyogolev, S.Y.; Turkovskaya, O.V. Mycolicibacterium Sp. Strain Pam1, an Alfalfa Rhizosphere Dweller, Catabolizes Pahs and Promotes Partner-Plant Growth. Microbiol. Res. 2021, 253, 126885. [Google Scholar] [CrossRef] [PubMed]
  56. Liu, M.; Wang, J.; Li, Z.; Li, X.; Korpelainen, H.; Li, C. Circadian Rhythms of Microbial Communities and Their Role in Regulating Nitrogen and Phosphorus Cycling in the Rhizosphere of Tea Plants. Hortic. Res. 2025, 12, uhae267. [Google Scholar] [CrossRef]
  57. Yang, S.; Xiao, J.; Liang, T.; He, W.; Tan, H. Response of Soil Biological Properties and Bacterial Diversity to Different Levels of Nitrogen Application in Sugarcane Fields. AMB Expr. 2021, 11, 172. [Google Scholar] [CrossRef]
  58. Suh, M.K.; Kim, J.-S.; Eom, M.K.; Kim, H.S.; Do, H.E.; Shin, Y.K.; Lee, J.-S. Jatrophihabitans Cynanchi sp. nov., Isolated from Rhizosphere Soil of Cynanchum Wilfordii. Antonie Van Leeuwenhoek 2024, 117, 19. [Google Scholar] [CrossRef]
  59. Hu, F.; An, J.; Su, A.; Wang, B.; Ding, Z.; Yan, X.; Wei, S.; Xu, M.; Zhang, H. Green Manure Plant and Exogenous Degrading Bacteria Synergistically Promote Atrazine Removal by Enriching Indigenous Rhizosphere Degraders. J. Environ. Sci. 2025, 159, 694–704. [Google Scholar] [CrossRef]
  60. Arunrat, N.; Uttarotai, T.; Kongsurakan, P.; Sereenonchai, S.; Hatano, R. Bacterial Community Structure in Soils with Fire-Deposited Charcoal Under Rotational Shifting Cultivation of Upland Rice in Northern Thailand. Ecol. Evol. 2025, 15, e70851. [Google Scholar] [CrossRef]
  61. Li, J.; Huang, W.; Lin, X.; Khan, D.; Zhao, H.; Sun, B.; Liu, S.; Zheng, P. Study on Soil Nutrients and Microbial Community Diversity in Ancient Tea Plantations of China. Agronomy 2025, 15, 1608. [Google Scholar] [CrossRef]
  62. Zhao, J.; Wu, X.; Nie, C.; Wu, T.; Dai, W.; Liu, H.; Yang, R. Analysis of Unculturable Bacterial Communities in Tea Orchard Soils Based on Nested Pcr-Dgge. World J. Microbiol. Biotechnol. 2012, 28, 1967–1979. [Google Scholar] [CrossRef] [PubMed]
  63. Lee, S.-M.; Kong, H.G.; Song, G.C.; Ryu, C.-M. Disruption of Firmicutes and Actinobacteria Abundance in Tomato Rhizosphere Causes the Incidence of Bacterial Wilt Disease. ISME J. 2021, 15, 330–347. [Google Scholar] [CrossRef] [PubMed]
  64. Bai, Y.-C.; Li, B.-X.; Xu, C.-Y.; Raza, M.; Wang, Q.; Wang, Q.-Z.; Fu, Y.-N.; Hu, J.-Y.; Imoulan, A.; Hussain, M.; et al. Intercropping Walnut and Tea: Effects on Soil Nutrients, Enzyme Activity, and Microbial Communities. Front. Microbiol. 2022, 13, 852342. [Google Scholar] [CrossRef]
  65. Walsh, C.M.; Gebert, M.J.; Delgado-Baquerizo, M.; Maestre, F.T.; Fierer, N. A Global Survey of Mycobacterial Diversity in Soil. Appl. Environ. Microbiol. 2019, 85. [Google Scholar] [CrossRef]
  66. Kui, L.; Xiang, G.; Wang, Y.; Wang, Z.; Li, G.; Li, D.; Yan, J.; Ye, S.; Wang, C.; Yang, L.; et al. Large-Scale Characterization of the Soil Microbiome in Ancient Tea Plantations Using High-Throughput 16S rRNA and Internal Transcribed Spacer Amplicon Sequencing. Front. Microbiol. 2021, 12, 745225. [Google Scholar] [CrossRef]
  67. Huang, Z.; Cui, C.; Cao, Y.; Dai, J.; Cheng, X.; Hua, S.; Wang, W.; Duan, Y.; Petropoulos, E.; Wang, H.; et al. Tea Plant-Legume Intercropping Simultaneously Improves Soil Fertility and Tea Quality by Changing Bacillus Species Composition. Hortic. Res. 2022, 9, uhac046. [Google Scholar] [CrossRef]
  68. Do, Q.T. The Endophytic Bacterium Bacillus subtilis R8 as a Prospective Biocontrol Agent for Managing Tea Blister Blight and Enhancing Tea Yield. BioControl 2025, 70, 379–390. [Google Scholar] [CrossRef]
  69. Wen, X.; Wu, D.; Chen, D.; Xu, P.; Tang, Y. Abundance, Diversity, and Community Composition of Comammox nitrospira in Tea (Camellia sinensis) Plantation Soils. J. Soil Sci. Plant Nutr. 2024, 24, 7901–7918. [Google Scholar] [CrossRef]
  70. Wen, Z.; Yang, M.; Lu, G.; Han, M.; Song, Y.; Sun, Y.; Tu, Q.; Yin, T.; Niu, K.; Sun, S.; et al. Microbial Alliances: Unveiling the Effects of a Bacterial and Fungal Cross-Kingdom SynCom on Bacterial Dynamics, Rhizosphere Metabolites, and Soybean Resilience in Acidic Soils. J. Agric. Food Chem. 2025, 73, 18013–18031. [Google Scholar] [CrossRef]
  71. Rahav, E.; Giannetto, M.J.; Bar-Zeev, E. Contribution of Mono and Polysaccharides to Heterotrophic N2 Fixation at the Eastern Mediterranean Coastline. Sci. Rep. 2016, 6, 27858. [Google Scholar] [CrossRef]
  72. Liu, C.; Jiang, M.; Yuan, M.M.; Wang, E.; Bai, Y.; Crowther, T.W.; Zhou, J.; Ma, Z.; Zhang, L.; Wang, Y.; et al. Root Microbiota Confers Rice Resistance to Aluminium Toxicity and Phosphorus Deficiency in Acidic Soils. Nat. Food 2023, 4, 912–924. [Google Scholar] [CrossRef]
  73. Singh, R.; Dubey, A.K. Diversity and Applications of Endophytic Actinobacteria of Plants in Special and Other Ecological Niches. Front. Microbiol. 2018, 9, 1767. [Google Scholar] [CrossRef]
  74. Qin, S.; Li, W.-J.; Klenk, H.-P.; Hozzein, W.N.; Ahmed, I. Editorial: Actinobacteria in Special and Extreme Habitats: Diversity, Function Roles and Environmental Adaptations, Second Edition. Front. Microbiol. 2019, 10, 944. [Google Scholar] [CrossRef] [PubMed]
  75. Duan, Y.; Shang, X.; Liu, G.; Zou, Z.; Zhu, X.; Ma, Y.; Li, F.; Fang, W. The Effects of Tea Plants-Soybean Intercropping on the Secondary Metabolites of Tea Plants by Metabolomics Analysis. BMC Plant Biol. 2021, 21, 482. [Google Scholar] [CrossRef]
  76. Kalam, S.; Basu, A.; Ahmad, I.; Sayyed, R.Z.; El-Enshasy, H.A.; Dailin, D.J.; Suriani, N.L. Recent Understanding of Soil Acidobacteria and Their Ecological Significance: A Critical Review. Front. Microbiol. 2020, 11, 580024. [Google Scholar] [CrossRef]
  77. Laichao, S.; Zhanhai, N.; Shiliang, C.; Shilei, Z.; Ziyuan, Q.; Yu, W.; Xuewen, H.; Zhaotang, D.; Qingping, M. Effects of Pea-Tea Intercropping on Rhizosphere Soil Microbial Communities. Plant Soil 2025, 506, 125–135. [Google Scholar] [CrossRef]
  78. Wang, S.; Tang, L.; Ye, S. Dynamics of Soil Bacterial Community Diversity and Composition at Aggregate Scales in a Chronosequence of Tea Gardens. CATENA 2021, 206, 105486. [Google Scholar] [CrossRef]
  79. Jibola-Shittu, M.Y.; Heng, Z.; Keyhani, N.O.; Dang, Y.; Chen, R.; Liu, S.; Lin, Y.; Lai, P.; Chen, J.; Yang, C.; et al. Understanding and Exploring the Diversity of Soil Microorganisms in Tea (Camellia sinensis) Gardens: Toward Sustainable Tea Production. Front. Microbiol. 2024, 15, 1379879. [Google Scholar] [CrossRef]
  80. Ahmed, S.; Griffin, T.S.; Kraner, D.; Schaffner, M.K.; Sharma, D.; Hazel, M.; Leitch, A.R.; Orians, C.M.; Han, W.; Stepp, J.R.; et al. Environmental Factors Variably Impact Tea Secondary Metabolites in the Context of Climate Change. Front. Plant Sci. 2019, 10, 939. [Google Scholar] [CrossRef] [PubMed]
  81. Xie, H.; Chen, Z.; Feng, X.; Wang, M.; Luo, Y.; Wang, Y.; Xu, P. L-Theanine Exuded from Camellia Sinensis Roots Regulates Element Cycling in Soil by Shaping the Rhizosphere Microbiome Assembly. Sci. Total Environ. 2022, 837, 155801. [Google Scholar] [CrossRef] [PubMed]
  82. Rehan, M. Biosynthesis of Diverse Class Flavonoids via Shikimate and Phenylpropanoid Pathway. In Bioactive Compounds-Biosynthesis, Characterization and Applications; IntechOpen: London, UK, 2021; ISBN 978-1-83969-270-3. [Google Scholar] [CrossRef]
  83. Paul, A.; Acharya, K.; Chakraborty, N. Involvement of Phenylpropanoid Pathway and Shikimic Acid Pathway in Environmental Stress Response. In Biology and Biotechnology of Environmental Stress Tolerance in Plants; Apple Academic Press: Palm Bay, FL, USA, 2023; pp. 27–66. ISBN 978-1-00-334617-3. [Google Scholar]
  84. Sun, L. Exploration of Factors to Enhance Aromatic Quality in Green Tea. Ph.D. Thesis, Murdoch University, Perth, Australia, 2022. Available online: https://researchportal.murdoch.edu.au/esploro/fulltext/doctoral/Exploration-of-factors-to-enhance-aromatic/991005542568407891?repId=12135762170007891&mId=13136870480007891&institution=61MUN_INST (accessed on 18 September 2025).
  85. Xie, Y.; Cao, C.; Huang, D.; Gong, Y.; Wang, B. Effects of Microbial Biocontrol Agents on Tea Plantation Microecology and Tea Plant Metabolism: A Review. Front. Plant Sci. 2025, 15, 1492424. [Google Scholar] [CrossRef] [PubMed]
  86. Chen, H.; Song, Y.; Wang, S.; Fan, K.; Wang, H.; Mao, Y.; Zhang, J.; Xu, Y.; Yin, X.; Wang, Y.; et al. Improved Phyllosphere Microbiome Composition of Tea Plant with the Application of Small Peptides in Combination with Rhamnolipid. BMC Microbiol. 2023, 23, 302. [Google Scholar] [CrossRef] [PubMed]
  87. Chen, Y.; Fu, W.; Xiao, H.; Zhai, Y.; Luo, Y.; Wang, Y.; Liu, Z.; Li, Q.; Huang, J. A Review on Rhizosphere Microbiota of Tea Plant (Camellia sinensis L.): Recent Insights and Future Perspectives. J. Agric. Food Chem. 2023, 71, 19165–19188. [Google Scholar] [CrossRef] [PubMed]
Figure 1. Field layout model of the leguminous cover cropping with soybean and cowpea in tea plantation rows.
Agronomy 15 02217 g001
Figure 2. Taxonomic species annotation and ASV/OUT Venn diagram of the microbial communities in rhizosphere soil of monoculture tea plantation (CK) and leguminous cover-cropped tea plantations with soybean and cowpea (i.e., LC-S and LC-C). (A) Taxonomic species annotation across domain, phylum, class, order, family, genus, and species; (B) ASV/OUT Venn diagram across three different treatments of CK, LC-S, and LC-C (Note: Relative abundance is expressed in percentage; same in the following figures; in the Venn diagram, each colored section corresponds to a specific group, and the intersecting areas between the blocks signify the ASV/OTU shared by the relevant groups, and the number displayed in each section indicates the count of ASV/OTU found within that section).
Agronomy 15 02217 g002
Figure 3. Taxonomic unit count of the microbial community in the rhizosphere soil of monoculture tea plantation (CK) and leguminous cover-cropped tea plantations with soybean and cowpea (i.e., LC-S and LC-C).
Agronomy 15 02217 g003
Figure 4. Taxonomic composition analysis of microbial phyla (A) and genera (B) in the rhizosphere soil of monoculture tea plantation (CK) and leguminous cover-cropped tea plantations with soybean and cowpea (i.e., LC-S and LC-C) (Note: Top 10 phyla and top 10 genera of soil microbes were selected in this figure).
Agronomy 15 02217 g004
Figure 5. Bacterial community composition in the rhizosphere soil of monoculture tea plantation (CK) and leguminous cover-cropped tea plantations with soybean and cowpea (i.e., LC-S and LC-C). Krona species composition map of soil bacterial communities (ASVs/OTUs) across all three treatment samples (Note: The visualization employs a packed-circle layout, where the largest circles denote phyla, and progressively smaller nested circles represent descending taxonomic ranks (class, order, family, genus, and species). The innermost nodes correspond to the top 100 OTUs/ASVs by abundance at the genus and phylum levels, with a circle area scaled proportionally to taxon abundance).
Agronomy 15 02217 g005
Figure 6. Species accumulation curve of bacterial communities in the rhizosphere soil of monoculture tea plantation (CK) and leguminous cover-cropped tea plantations with soybean and cowpea (i.e., LC-S and LC-C).
Agronomy 15 02217 g006
Figure 7. Rarefaction curves of bacteria in the rhizosphere soil of monoculture tea plantation (CK) and leguminous cover-cropped tea plantations with soybean and cowpea (i.e., LC-S and LC-C). (A) Observed species; (B) Pielou’s evenness; (C) Chao1 index.
Agronomy 15 02217 g007
Figure 8. Hierarchical clustering analysis of bacterial communities in the rhizosphere soil of monoculture tea plantation (CK; CK1, CK2, and CK3) and leguminous cover-cropped tea plantations with soybean (LC-S; S1, S2, and S3) and cowpea (LC-C; C1, C2, and C3). (A) Phylum-level clustering; (B) genus-level clustering; (C) species-level clustering.
Agronomy 15 02217 g008
Figure 9. PCoA (A) and NMDS (B) analysis of microbial community diversity in the rhizosphere soil of monoculture tea plantation (CK) and leguminous cover-cropped tea plantations with soybean (LC-S) and cowpea (LC-C).
Agronomy 15 02217 g009
Figure 10. Cluster heat map of bacterial communities in the rhizosphere soil of monoculture tea plantation (CK) and leguminous cover-cropped tea plantations with soybean (LC-S) and cowpea (LC-C), (A) cluster heat map across phyla; (B) cluster heat map across genera; (C) cluster heat map across species.
Agronomy 15 02217 g010
Figure 11. PCA and OPLS-DA analysis of microbial bacterial communities in the rhizosphere soil of monoculture tea plantation (CK) and leguminous cover-cropped tea plantations with soybean (LC-S) and cowpea (LC-C). (A) PCA phylum-wide analysis; (B) OPLS-DA phylum-wide analysis (Note: Samples are represented as colored dots (blue: CK; red: LC-S; green: LC-C), where the spatial separation between groups reflects a divergence in microbial community structure. 95%-confidence ellipses).
Agronomy 15 02217 g011
Figure 12. LEfSe cladogram depicting taxonomic biomarkers of microbial communities in the rhizosphere soil of monoculture tea plantation (CK) and leguminous cover-cropped tea plantations with soybean (LC-S) and cowpea (LC-C). (A) Cladogram representing the mean of samples within a group; (B) cladogram representing overall means by the groups (Note: ‘P’ stands for phylum, ‘c’ stands for class, ‘o’ stands for order, ‘f’ stands for family, and ‘g’ stands for genus).
Agronomy 15 02217 g012
Figure 13. Metagenome sequence analysis results of microbial communities in the rhizosphere soil of monoculture tea plantation (CK) and leguminous cover-cropped tea plantations. (A) Soybean-enriched metagenome sequence analysis with soybean as upward-adjusted group and the control group of CK; (B) cowpea-enriched metagenome sequence analysis with cowpea as upward-adjusted group and the control group of CK (Note: The metagenomic sequence analyses were filtered at a sample frequency threshold of 0.3 (i.e., ASV/OTU present in ≥30% of samples within a group). Results are visualized as taxonomic profiles (phylum to genus) on the horizontal axis, with significance (−log10 (adjusted p-value)) on the vertical axis. Dot size reflects log2-transformed relative abundance (CPM/n), and color denotes phylum-level classification. Significant taxa (above the dotted line) are marked with colored solid dots (group-specific upregulation) or rings, while insignificant taxa are gray).
Agronomy 15 02217 g013
Figure 14. Metabolic pathway analysis of microbial communities present in the rhizosphere soil of monoculture tea plantation (CK) and leguminous cover-cropped tea plantations with soybean (LC-S) and cowpea (LC-C) (Note: The horizontal axis quantifies relative abundance as counts or normalized values (per million KO/PWY/COG units), while the vertical axis lists second-level functional classifications of metabolic pathways from integrated databases (KEGG, MetaCyc, COG). Each pathway is color-coded to represent its abundance across treatments: blue (CK), red (LC-S), and green (LC-C)).
Agronomy 15 02217 g014
Figure 15. Metabolic pathway difference analysis within the bacterial microbiota present in the tea rhizospheric soil region of monoculture tea plantation (CK) and leguminous cover-cropped tea plantations with soybean (LC-S) and cowpea (LC-C). (A) Metabolic pathway difference analysis; LC-S as an upward adjusted group compared to the control of CK; (B) metabolic pathway difference analysis; LC-C as an upward adjusted group compared to the control of CK (Note: The positive logFC value (log2 (fold change)) on the horizontal axis indicates the up-regulated group in comparison to the control group, while the negative value signifies down-regulation; the vertical axis denotes various pathway/group labels; different colors are used to show the degree of significance).
Agronomy 15 02217 g015
Disclaimer/Publisher’s Note: The statements, opinions and data contained in all publications are solely those of the individual author(s) and contributor(s) and not of MDPI and/or the editor(s). MDPI and/or the editor(s) disclaim responsibility for any injury to people or property resulting from any ideas, methods, instructions or products referred to in the content.