Article

Impact of Future Climate Change on the Climatic Suitability of Tea Planting on Hainan Island, China

1
Jiangsu Provincial University Key Laboratory of Agricultural and Ecological Meteorology, Nanjing University of Information Science and Technology, Nanjing 210044, China
2
School of Ecology and Applied Meteorology, Nanjing University of Information Science and Technology, Nanjing 210044, China
3
College of Resources and Environmental Sciences, Nanjing Agricultural University, Nanjing 210095, China
*
Authors to whom correspondence should be addressed.
Agronomy 2025, 15(9), 2196; https://doi.org/10.3390/agronomy15092196
Submission received: 4 August 2025 / Revised: 31 August 2025 / Accepted: 12 September 2025 / Published: 15 September 2025
(This article belongs to the Section Agroecology Innovation: Achieving System Resilience)

Abstract

Hainan Island is one of the main tea-producing regions in South China. Climate change has increased agricultural instability, causing fluctuations in tea yield and quality. Based on daily surface meteorological data from 19 national meteorological observation stations on the island from 1990 to 2019, as well as related factors such as topography, a spatial analysis model for climate zoning indicators was established. Zoning indicators were spatialized through GIS spatial analysis, and fuzzy logic was applied to construct membership functions based on climatic elements to assess climatic suitability for tea cultivation. This approach helped refine zoning for tea planting areas and assess potential future climate changes. Results show high climatic suitability for tea production in spring (March-May) and autumn (September–October), but low suitability in summer (June–August) due to high temperatures and strong sunlight. The most suitable zone for tea planting is centered in the northeastern parts of the island; the suitable zone is mainly distributed in the central mountainous areas and the western coastal region; the sub-suitable zone mainly includes central and southern parts of Dongfang; and the unsuitable zone mainly includes eastern and southern parts of Dongfang and southern parts of Changjiang. Under future climatic scenarios, the island’s temperatures will further increase, and suitable temperature areas will shrink from the periphery toward the central mountainous regions. Precipitation will also increase over time, leading to an expansion of suitable precipitation areas on the island. This study helps promote sustainable tea production and the rational utilization of agricultural climate resources on Hainan Island.

1. Introduction

Tea (Camellia sinensis (L.) Kuntze) is one of the important cash crops in China [1]. South China is one of the major tea-producing regions, with the tea planting area and yield accounting for 12.3% and 23.2% of the national total area and yield, respectively [2]. Hainan Island is located in the tropical zone and enjoys superior climatic resources, making it a key tea-producing area in South China. In recent years, the island’s temperature has shown a significant increase, with a warming rate of approximately 0.22 °C per decade. Concurrently, annual precipitation has exhibited a slight upward trend, increasing by approximately 88.5 mm per decade [3]. Extreme heat is expected to lead to a loss of 14% to 26% in tea production in South China in the near future [4]. Rising temperatures and irregular precipitation patterns significantly impact the chemical composition of tea, altering its flavor, color, and aroma, thereby affecting its overall quality [5,6]. Climate change affects the growth and development of tea, increasing the instability of yield and quality. Under a changing climate, the climatic resources, climatic suitability, and dynamic trends for regional tea production have received widespread attention [7,8,9,10].
In recent years, research on suitability evaluation for tea cultivation has steadily advanced to meet growing demands of the tea industry. Liang et al. [11] used key climate indicators, including annual mean temperature, annual extreme minimum temperature, ≥10 °C accumulated temperature, and annual precipitation, to conduct suitability zoning for tea planting in southern Shaanxi Province. Mao et al. [12] applied the expert evaluation method and analytic hierarchy process to classify suitable regions for tea cultivation in Luan City, Anhui Province. Sahu et al. [13] analyzed climate characteristics, topography, and soil factors, using machine learning and GIS technology to delineate suitable tea-growing zones within the Darjeeling region of India. Bo et al. [14] classified suitable tea-growing regions in Zhejiang Province, using an improved land ecological suitability evaluation model and GIS technology. Some researchers have employed fuzzy logic to construct membership functions with climatic elements and investigate the climatic suitability, variation characteristics, and climatic zoning of tea plantations [15,16,17,18]. The fuzzy logic method effectively addresses uncertainties associated with climate change by quantitatively analyzing bioclimatic adaptability, providing scientific support for decision-making in tea cultivation climatic suitability research. This method has been widely applied in fields such as geology, environment, and agriculture [19,20,21,22]. Some researchers have also constructed spatial analysis models by combining climate and topographic elements, enabling high-precision grid-based assessments of climatic suitability for tea cultivation [23,24,25].
Tea quality is constrained by natural ecological conditions, and climate change has reshaped the distribution of regions suitable for tea cultivation by altering these conditions [26,27,28]. Due to climate warming, suitable tea planting areas have shifted to higher elevations to avoid heat damage [29]. Regional crop suitability assessments can help avoid arbitrary crop planting, thereby optimizing management and enhancing economic benefits [30]. While past research has been conducted regarding the suitability of tea planting in some regions of China, the meteorological data used in previous reports were relatively old, with short durations and low spatial resolution. In addition, with the intensification of climate change and the advancements in tea planting technologies, traditional climatic suitability zonation can no longer effectively meet the demands for stable and high-quality tea production. Hainan is the only tropical island province in China with a distinct climate and topography. Reports on the climatic suitability of tea planting on the island are limited. Therefore, appropriate climatic suitability models and evaluation methods need to be applied to assess the climatic suitability for tea planting on the island.
Based on key climatic indicators for tea growth, fuzzy logic was used to construct membership functions for climatic elements. A spatial analysis model of climate, in combination with geographic information, was developed to evaluate climatic suitability for tea growing in response to climate change, and provide a scientific foundation for the optimization of tea on Hainan Island.

2. Materials and Methods

2.1. Study Region

Hainan Island is the principal component of Hainan Province and the largest tropical island in China (108°37′–111°03′ E; 18°03′–20°10′ N). The terrain of the island is high in the center and low near the coast, comprising mountains, hills, terraces, and plains, forming a ring-shaped layered landform with a distinct stepped structure. Hainan Island has a tropical monsoon climate, with warm to hot weather throughout the year, abundant rainfall, humid air, and sufficient sunlight. Hainan Island’s relatively high winter temperatures prevent low-temperature stress, supporting tea plant growth. These climatic conditions are generally conducive to tea production [31].

2.2. Data Sources

(1)
Daily meteorological data, including daily mean temperature, average precipitation, sunshine, etc., were collected from 19 meteorological observation stations from 1990 to 2019 on Hainan Island (Figure 1), provided by the National Meteorological Science Data Center (http://data.cma.cn/, accessed on 18 February 2025).
(2)
1:250,000 administrative division vector layers of the island, including the boundary of the island, and the scope and boundary of the administrative cities and counties, were collected from the Center for Resources and Environmental Science and Data (https://www.resdc.cn/, accessed on 18 February 2025).
(3)
Digital Elevation Model (DEM) Data of Hainan Province with 30 m × 30 m accuracy, obtained from the National Center for Basic Geographic Information (http://www.ngcc.cn/, accessed on 18 February 2025).
(4)
Simulation data of the CMIP6 (Coupled Model Intercomparison Project Phase 6) model under the medium emission scenario (SSP245), including temperature and precipitation data from 2020 to 2049, were gathered from the CEDA website (https://esgf-ui.ceda.ac.uk/cog/search/cmip6-ceda/, accessed on 20 February 2025).
(5)
Data for tea production on the island were collected from the Hainan Statistical Yearbook (2024) [32].

2.3. Methods

2.3.1. Distribution of Climate Resources

The annual mean temperature of the island is between 23.4 °C and 25.7 °C, with the coldest month being between 17.6 °C and 20.8 °C and the hottest month being between 26.4 °C and 29.5 °C. The average annual precipitation ranges from 1063.1 mm to 2326.5 mm, while the average monthly precipitation in the tea growth period (March–October) ranges from 123.8 mm to 251.1 mm. The annual accumulated temperature ranges from 8538.4 °C to 9402.6 °C. The average annual humidity is over 80%, and the average percentage of sunshine hours is 50%, with a total of 1993 h (Table 1).

2.3.2. Modeling of Spatial Analysis of Climate Zoning Indicators

Using the historical meteorological data of 19 stations on Hainan Island from 1990 to 2019 and the future meteorological data from 2020 to 2049 under the SSP245 scenario, combined with geographic data on the latitude, longitude, elevation, slope, and slope aspect of each station, the mathematical statistical method was applied to establish a spatial analysis model that links climate zoning indicators with the geographic factors noted above [23,24,25,33]. The model can be represented by the equation:
Y = f i   , j ,   z ,   α ,   β + ε
where Y is the climate zoning indicator factor, and i, j, z, α, and β are the latitude coordinate value (°), longitude coordinate value (°), elevation (m), slope (°), and slope aspect (°), respectively. ε is the residual term, the difference between the model predictions and the actual observations.

2.3.3. Tea Climatic Suitability Analysis

Based on a thorough literature review [15,16,17,34,35,36,37], values for key meteorological factors influencing tea production can be categorized into suitable, viable, and harmful ranges (Table 2). Sunlight, temperature, and moisture are major meteorological elements that affect the growth, yield, and quality of tea [38,39]. High sunlight and intense radiation will reduce the quality of tea leaves. The mean temperature and accumulated temperature reflect heat resources obtained by tea leaves. Insufficient precipitation and humidity are prone to triggering drought, which affects plant growth and tea quality.
Tea growth is strongly influenced by various meteorological factors. The degree of influence can be quantitatively analyzed using fuzzy logic. The effects of various meteorological conditions can be expressed by a unified quantitative indicator, suitability. Suitability indicates the degree of adaptation of a certain organism under specific conditions, with a domain of [0, 1]. Here, “least suitable” corresponds to 0, “most suitable” to 1, and values between the two represent different levels of suitability, such as “suitable” or “sub-suitable.” Based on the agricultural meteorological indicators for tea growth and development, along with a Cauchy-type distribution model influenced by meteorological factors [15,16,17], membership function models for key meteorological factors, including annual mean temperature, annual total precipitation, average monthly precipitation in the tea growth period, and sunlight percentage for tea planting, can be expressed as follows [15,16,17]:
μ T = 1 1 + 0.04 ( T   25 ) ) 2 T   >   25.0   °C        1 15.0   ° C     T     25.0   ° C 1 1 + 0.25 T   15 2 T   <   15.0   ° C
μ Y =   1   Y     1500   mm 1 1 + 0.01 Y 100 15 2 Y < 1500   mm
μ M R =   1   M R     100   mm 1 1 + 4 M R 100 1 2 M R < 100   mm
μ I =   1 I     45 % 1 1 + 0.01 I 45 2 I > 45 %
In the above formulas, μ T , μ Y , μ M R , and   μ I are the affiliation functions of annual mean temperature, annual precipitation, average monthly precipitation in the tea growth period, and sunlight percentage, respectively.
Based on the annual mean temperature (T/°C), annual precipitation (Y/mm), average monthly precipitation in the tea growth period (MR/mm), and the sunlight percentage (I/%) affiliation function, the relative distance ambiguity and climatic suitability for tea growth can be obtained [15,16,17] from the following formula:
R A = i   = 1 N 1 μ A i 2 N ;     M A = 1 R A
where μ A i is the degree of affiliation of the ith climate element of the A site. N is the total number of research elements; for this paper, N = 4. R A is the relative distance fuzzy degree of the optimal growth of tea plants at A site, and M A the degree of climatic suitability for the growth of tea plants at the A site, which describes the suitability for the growth of tea in various places.
The growth of tea is significantly affected by seasonal fluctuations, and the climatic conditions for tea cultivation vary across seasons. To assess the changing climatic suitability for tea in spring (March–May), summer (June–August), and autumn (September–October), we followed Yu et al. [17] and focused on three key climatic indicators: average temperature, monthly precipitation, and sunshine percentage.

3. Results

3.1. Spatial Analysis Model of Climate Zoning Indicators for Hainan Island

The results of the spatial analysis model linking climate zoning indicators with geographic elements (latitude, longitude, elevation, slope, slope direction) are shown in Table 3. All the models are significant at 0.05 or 0.01 levels, except for the future annual mean temperature model, which has a p-value of 0.124.

3.2. Single-Factor Suitability Zoning for Tea Meteorological Elements

(1)
Temperature suitability
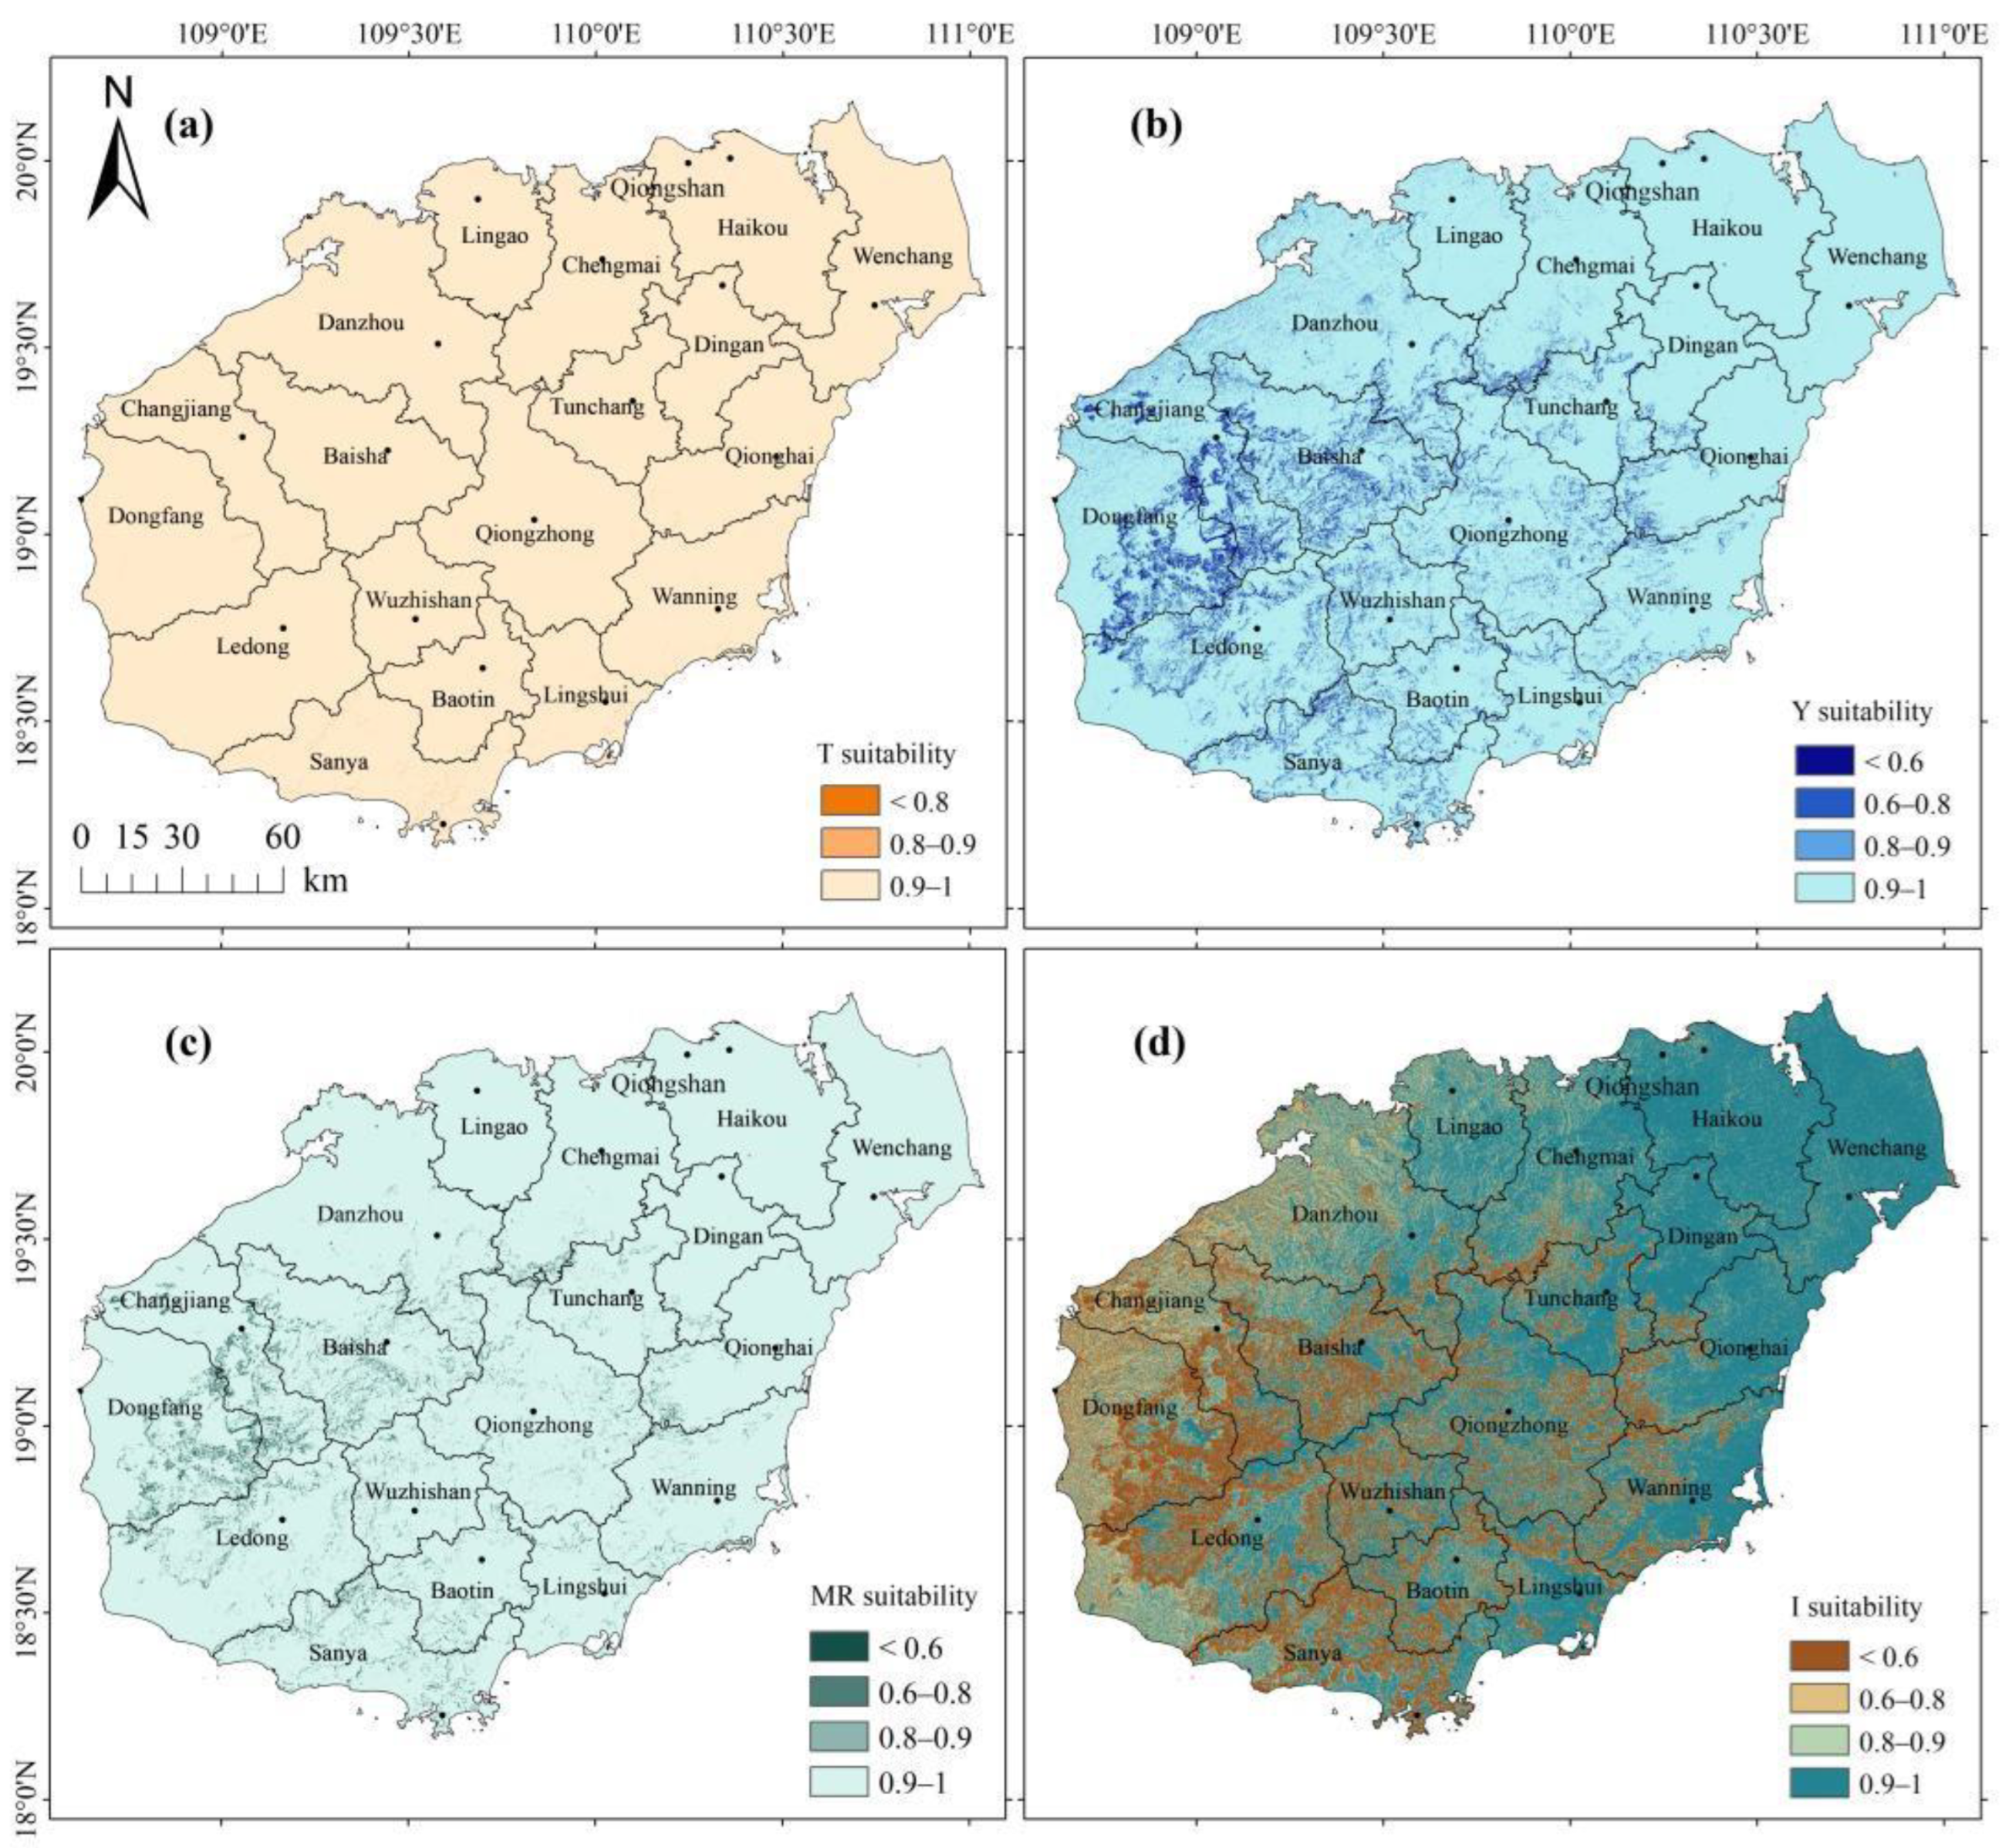
Most of Hainan Island fell within the optimal temperature range for tea cultivation, with the temperature suitability index exceeding 0.9. The annual average temperature ranged from 23.4 °C to 26.7 °C. In the southeastern areas of the island, including small parts of Sanya, Lingshui, and Dongfang, sub-optimal temperature existed, with the annual average temperature ranging from 27.5 °C to 28.8 °C. No areas had unsuitable temperatures (Figure 2a).
(2)
Precipitation Suitability
Over the past 30 years, precipitation suitability across the island generally increased from west to east (Figure 2b,c). The annual precipitation suitability ranged from 0.31 to 1.00, and the monthly average precipitation ranged from 0.20 to 1.00. The most suitable rainfall for tea growth was found primarily in the northern and eastern coastal regions, including Chengmai, Haikou, Ding’an, and Wenchang, with annual rainfall of 1556 mm to 2214 mm, and monthly average precipitation during the tea growth period of 116 mm to 236 mm. Sub-suitable areas were distributed in the central and southern parts of the island, primarily in Baisha, Changjiang, Sanya, and neighboring areas, with annual precipitation of 1000 mm to 1500 mm, and monthly average precipitation in the tea growth period of 50 mm to 100 mm. Unsuitable zones were primarily distributed in the western part of the island, including Dongfang, Changjiang, Ledong, and neighboring districts, with annual precipitation below 1000 mm and monthly precipitation under 50 mm.
(3)
Sunlight suitability
Over the past 30 years, sunlight suitability increased from the southwest to the northeast of the island, with values ranging from 0.02 to 1.00 (Figure 2d). The most suitable zone for tea planting in terms of sunlight percentage was in the northeastern region, mainly around Haikou, Ding’an, and Wenchang, with sunlight percentage ranging from 42% to 49%. The second most suitable zone was in the northwestern and central regions, particularly around Danzhou, Qiongzhong, and Wuzhishan, with sunlight percentage between 49% and 53%. The unsuitable zone was in the southwestern region, mainly around Dongfang, Ledong, and Sanya, with sunlight percentage exceeding 53%.

3.3. Climatic Suitability Features

Looking back over the past 30 years, based on annual average climate conditions, most areas of the island were suitable for tea planting (Table 4). However, tea growth is significantly affected by seasonal fluctuations, as climatic conditions vary by season. The climatic suitability for tea in different seasons was calculated to reflect the influence of sunlight, temperature, and water conditions on tea growth.
From March to May (spring), the average temperature on the island ranged from 24.5 °C to 26.3 °C. The temperature was highly suitable and the accumulated temperature sufficient. Precipitation was abundant, with relative humidity about 81%. The average sunshine percentage was 53%, lower than the other two factors in suitability for tea growth, but still within the suitable range. Overall, the meteorological factors were favorable for tea growth in spring.
From June to August (summer), the average temperature ranged from 27.1 °C to 30.0 °C. Precipitation was abundant, humidity high, and the average sunshine percentage was 59%. The relatively high temperature reduced temperature suitability for tea growth, while long sunlight hours and a high sunshine percentage became limiting factors. However, in the central mountainous areas of the island, relatively low temperatures, high humidity, and frequent cloud and fog create an ideal environment for tea plant growth. These conditions have given rise to high-quality Wuzhishan Black Tea and Baisha Green Tea, making the region’s tea stand out in both quantity and quality [40].
From September to October (autumn), the average temperature ranged from 24.5 °C to 27.4 °C, and temperature suitability was relatively high. Precipitation was abundant, humidity high, and the average sunshine percentage was 50%. The meteorological conditions were relatively favorable in autumn, making it the most suitable period for tea growth.

3.4. Temporal and Spatial Distribution of Climatic Resources on Hainan Island

(1)
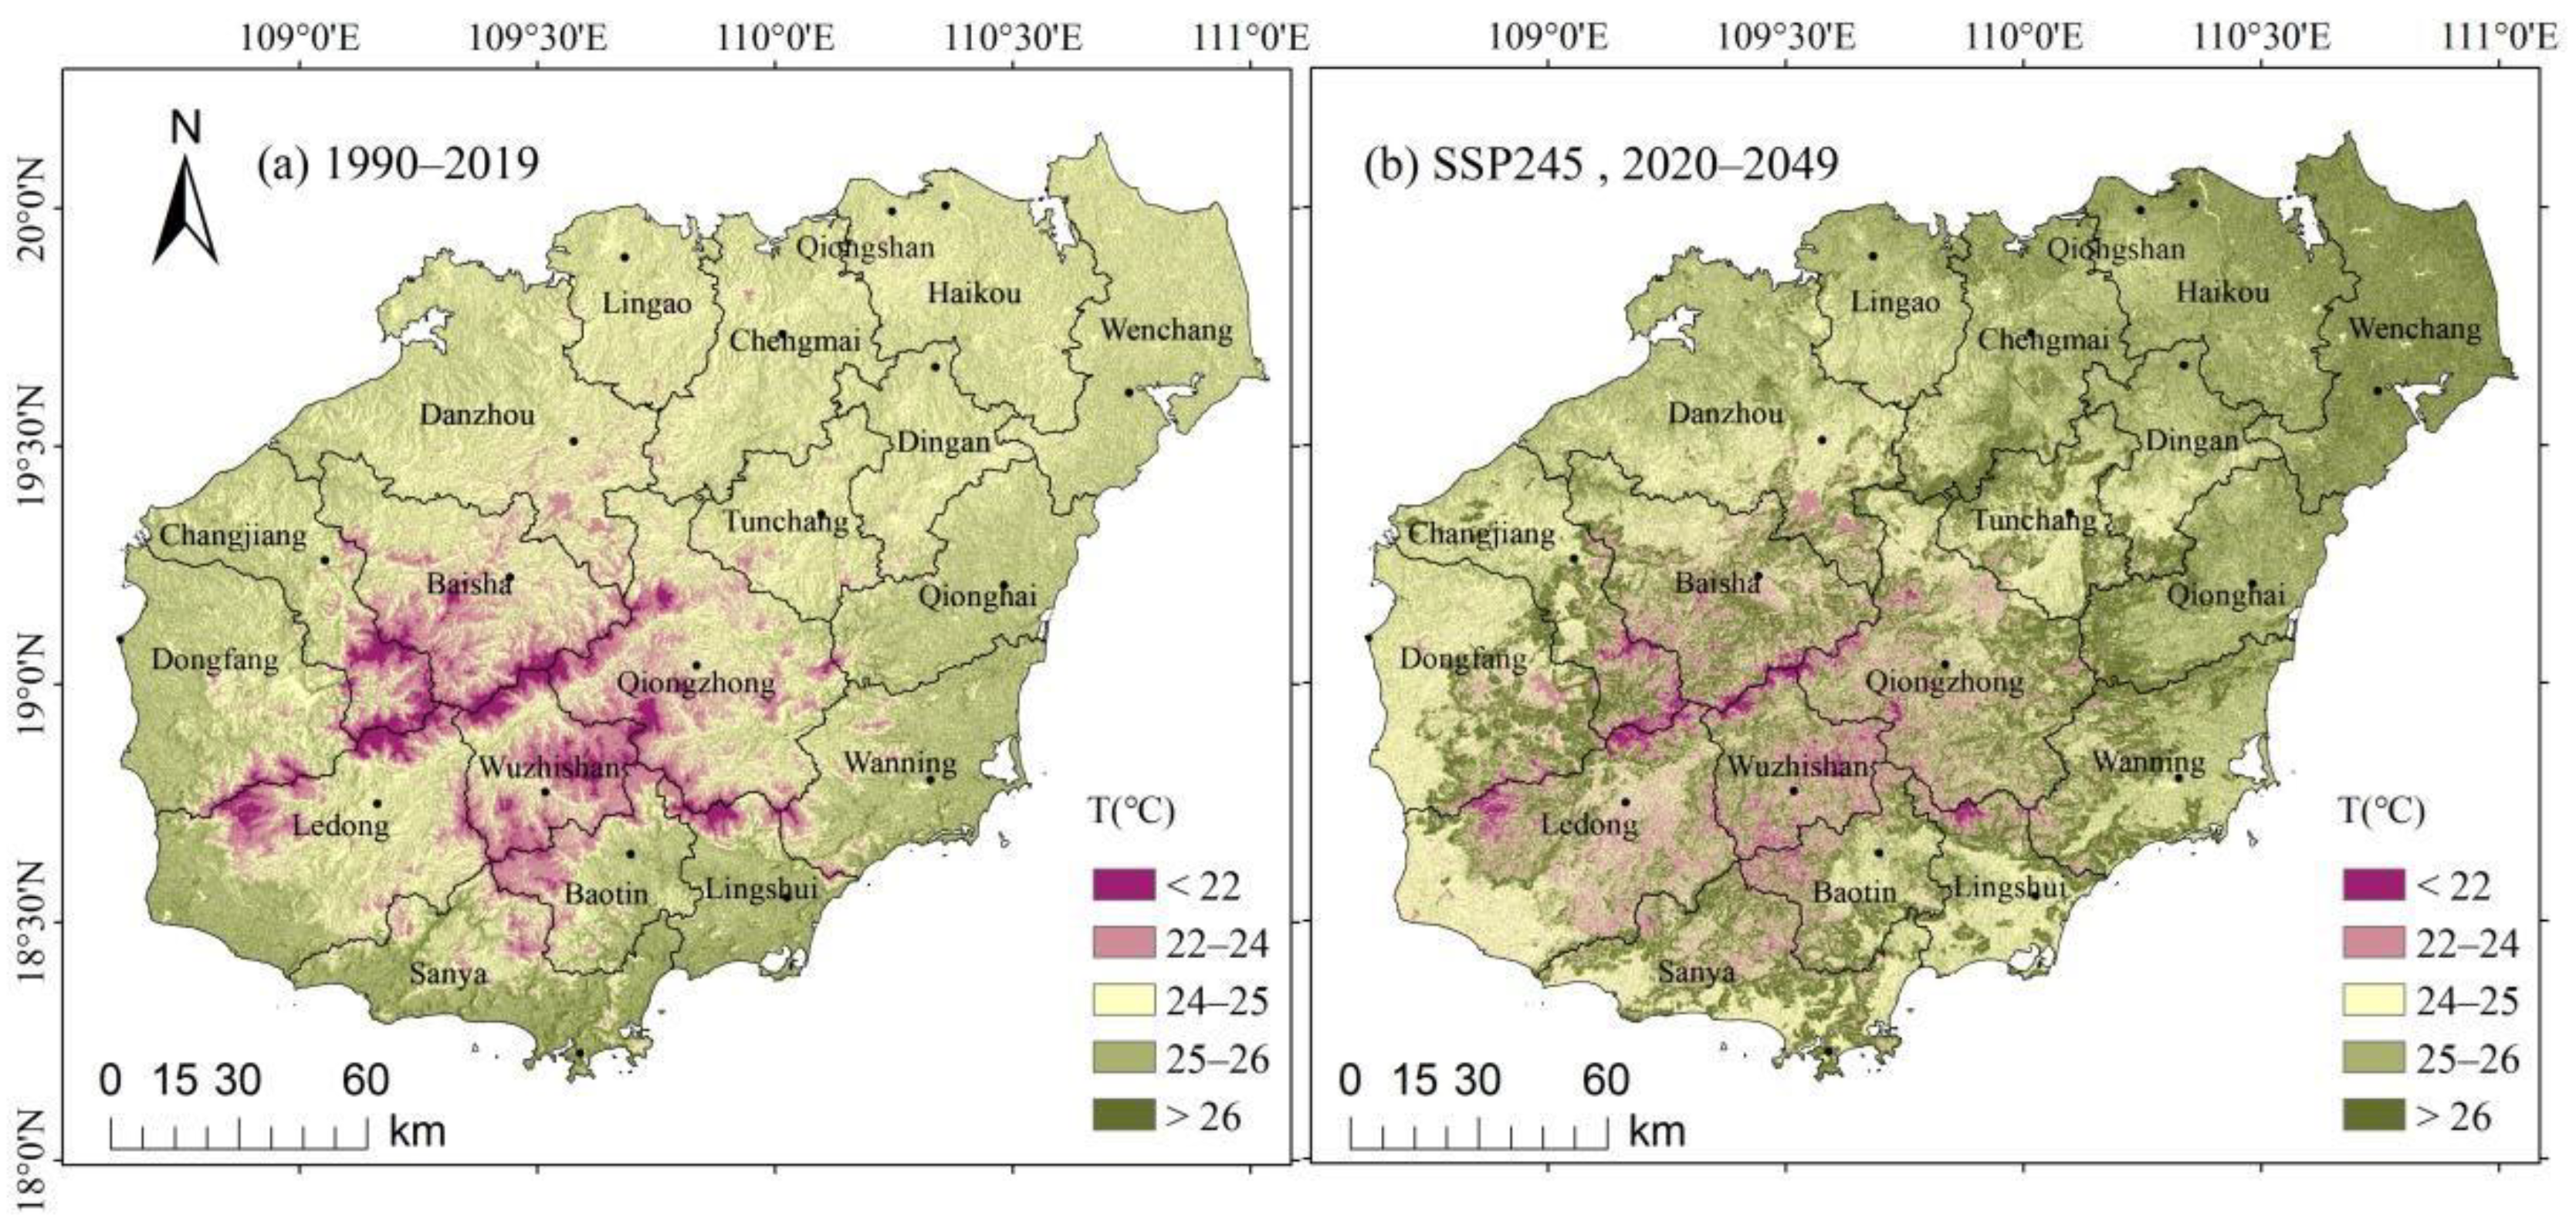
Temperature: The annual mean temperature generally showed a tendency to be higher at low elevations and lower in the central region. From 1990 to 2019 (Figure 3a), the average annual temperature was below 22 °C in the central region, while the northern and eastern regions had temperatures ranging from 24 °C to 25 °C. The annual mean temperature exceeded 26 °C in the southern coastal regions. According to the projection for the next 30 years (2020–2049) under the SSP245 scenario (Figure 3b), the area in the central region with the temperature below 22 °C will be smaller than that of the past 30 years, with a reduction of 357.6 km2, approximately 40% of the original area. In contrast, the area on the island with the temperature exceeding 25 °C will expand, increasing by 6555.1 km2, about 50% of the original area. Overall, the island’s annual mean temperature is expected to rise over the next 30 years. As the suitable temperature for tea growth is 15 °C–25 °C, suitable zones for tea planting will gradually retract.
(2)
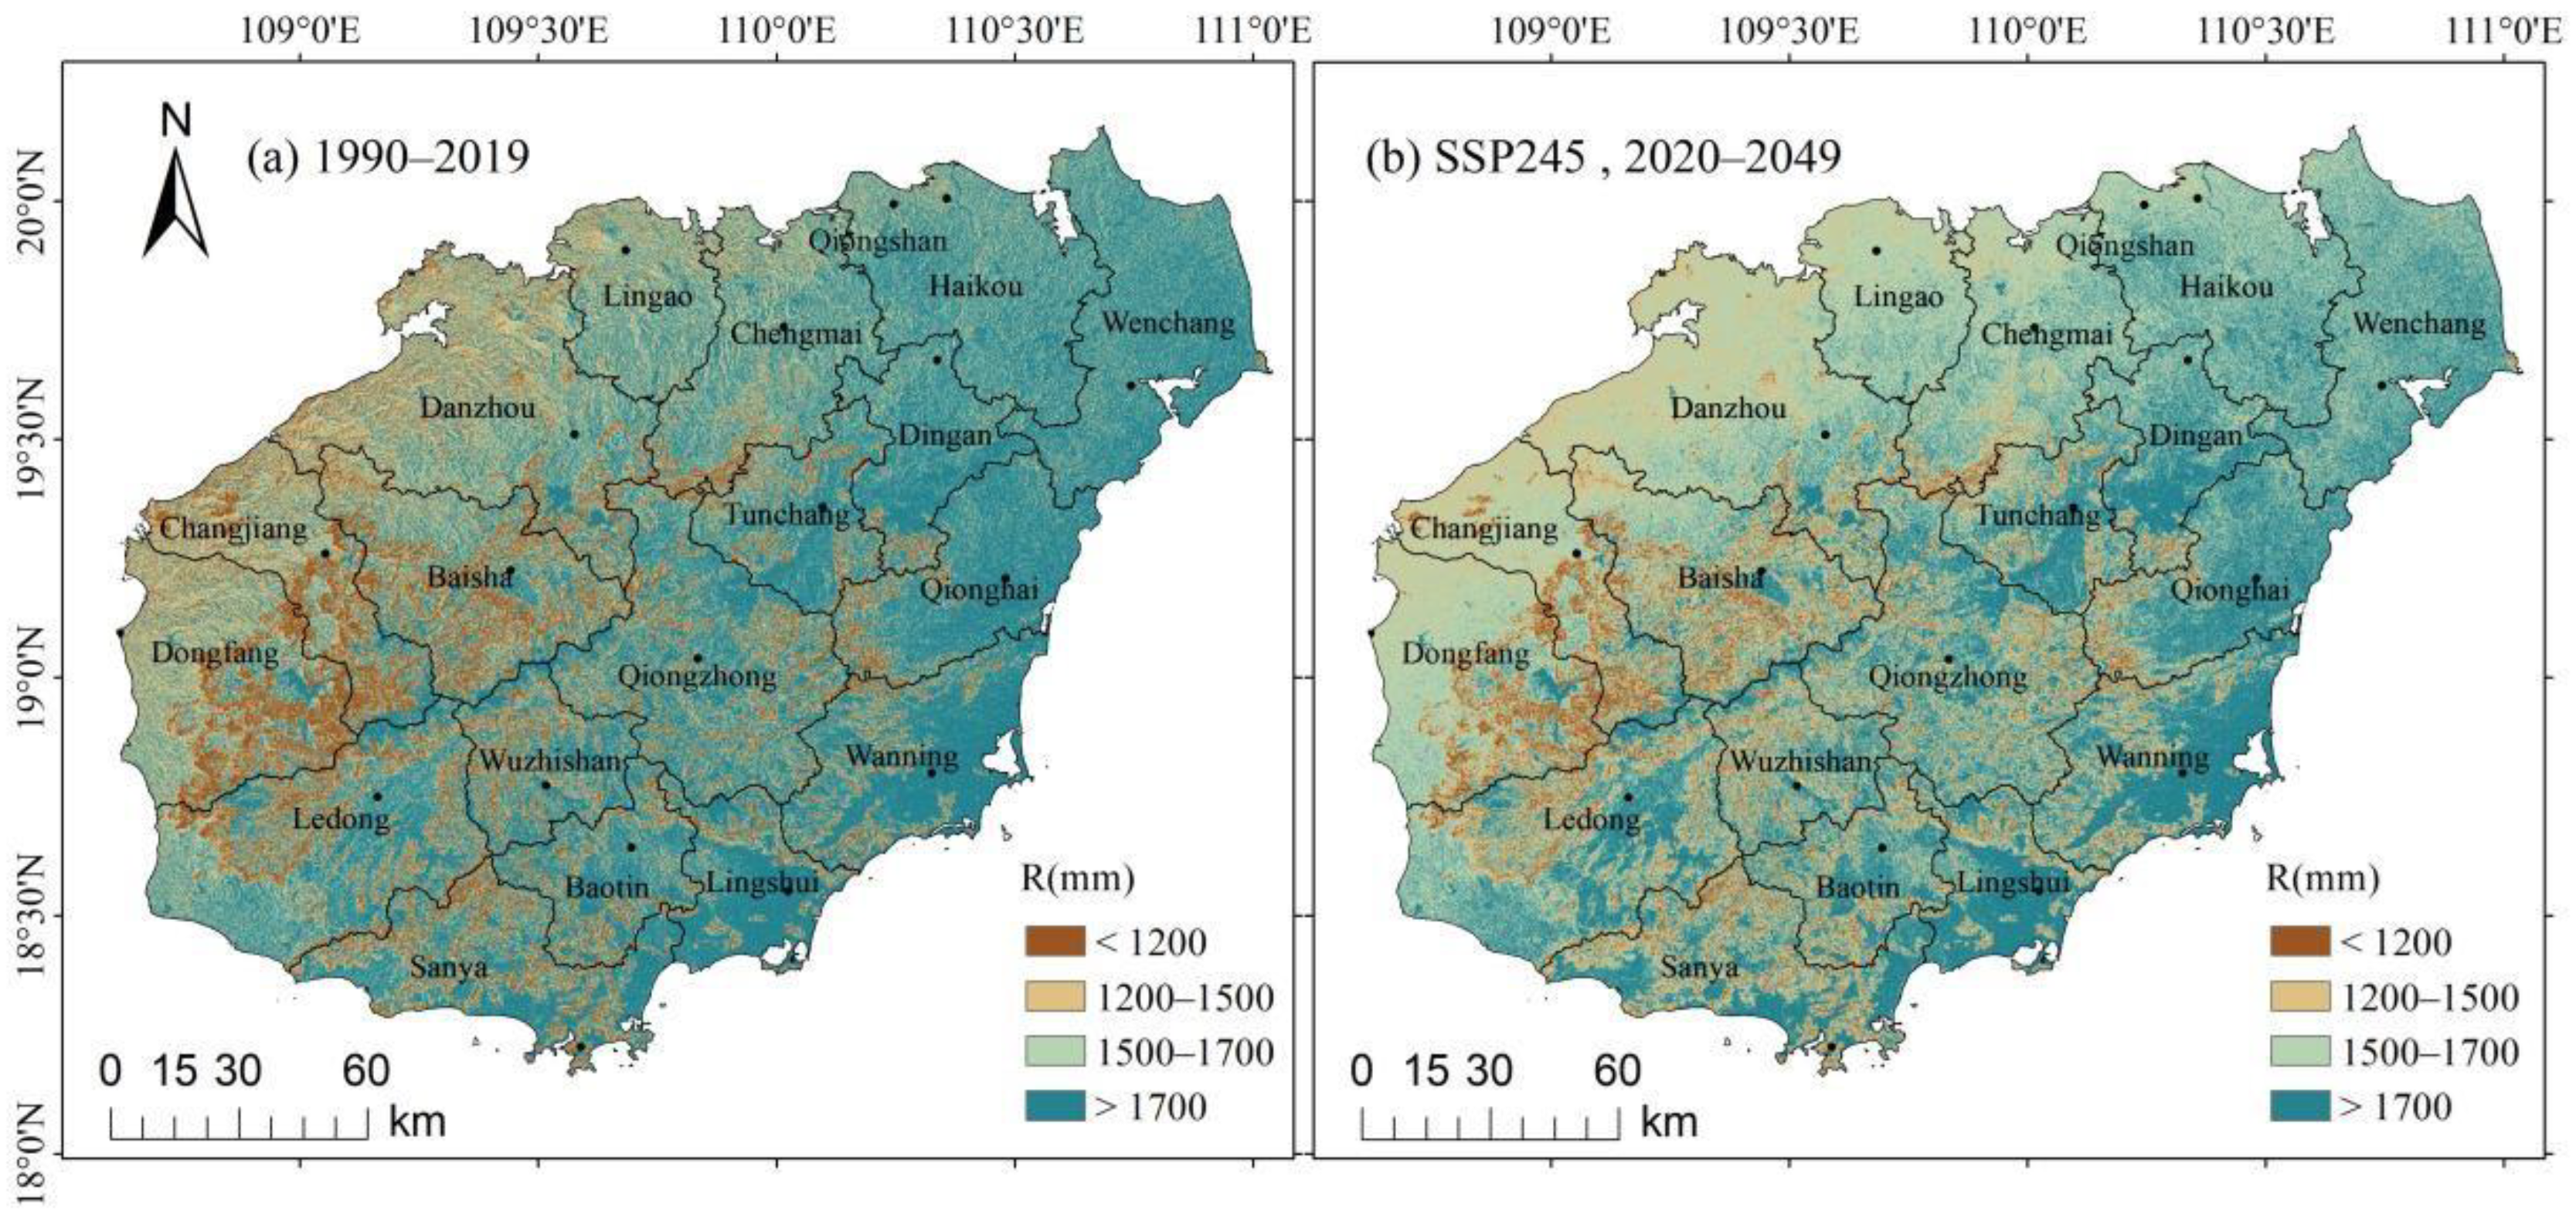
Precipitation: Yearly precipitation on the island was generally lower in the west and higher in the east. From 1990 to 2019 (Figure 4a), areas with annual precipitation below 1200 mm were mainly in the western part of the island, including Dongfang, Changjiang, and Baisha. The northeastern regions had the highest precipitation, with annual rainfall exceeding 1700 mm. According to the SSP245 scenario (Figure 4b), average values for the next 30 years (2020–2049) will result in a significant decrease in areas with precipitation below 1200 mm. At the same time, precipitation in the western regions will increase, while areas in the northeastern regions with rainfall exceeding 1700 mm will decrease. The regions with annual precipitation below 1500 mm will be smaller than those in the past 30 years, with a reduction of 8889.6 km2, approximately 53% of the original area. Overall, the island’s annual precipitation is expected to rise over the next 30 years. Areas with annual precipitation below 1500 mm are expected to shrink. Since tea growth requires annual precipitation above 1500 mm, suitable tea planting zones are expected to increase.

3.5. Climatic Suitability Zoning for Tea Cultivation

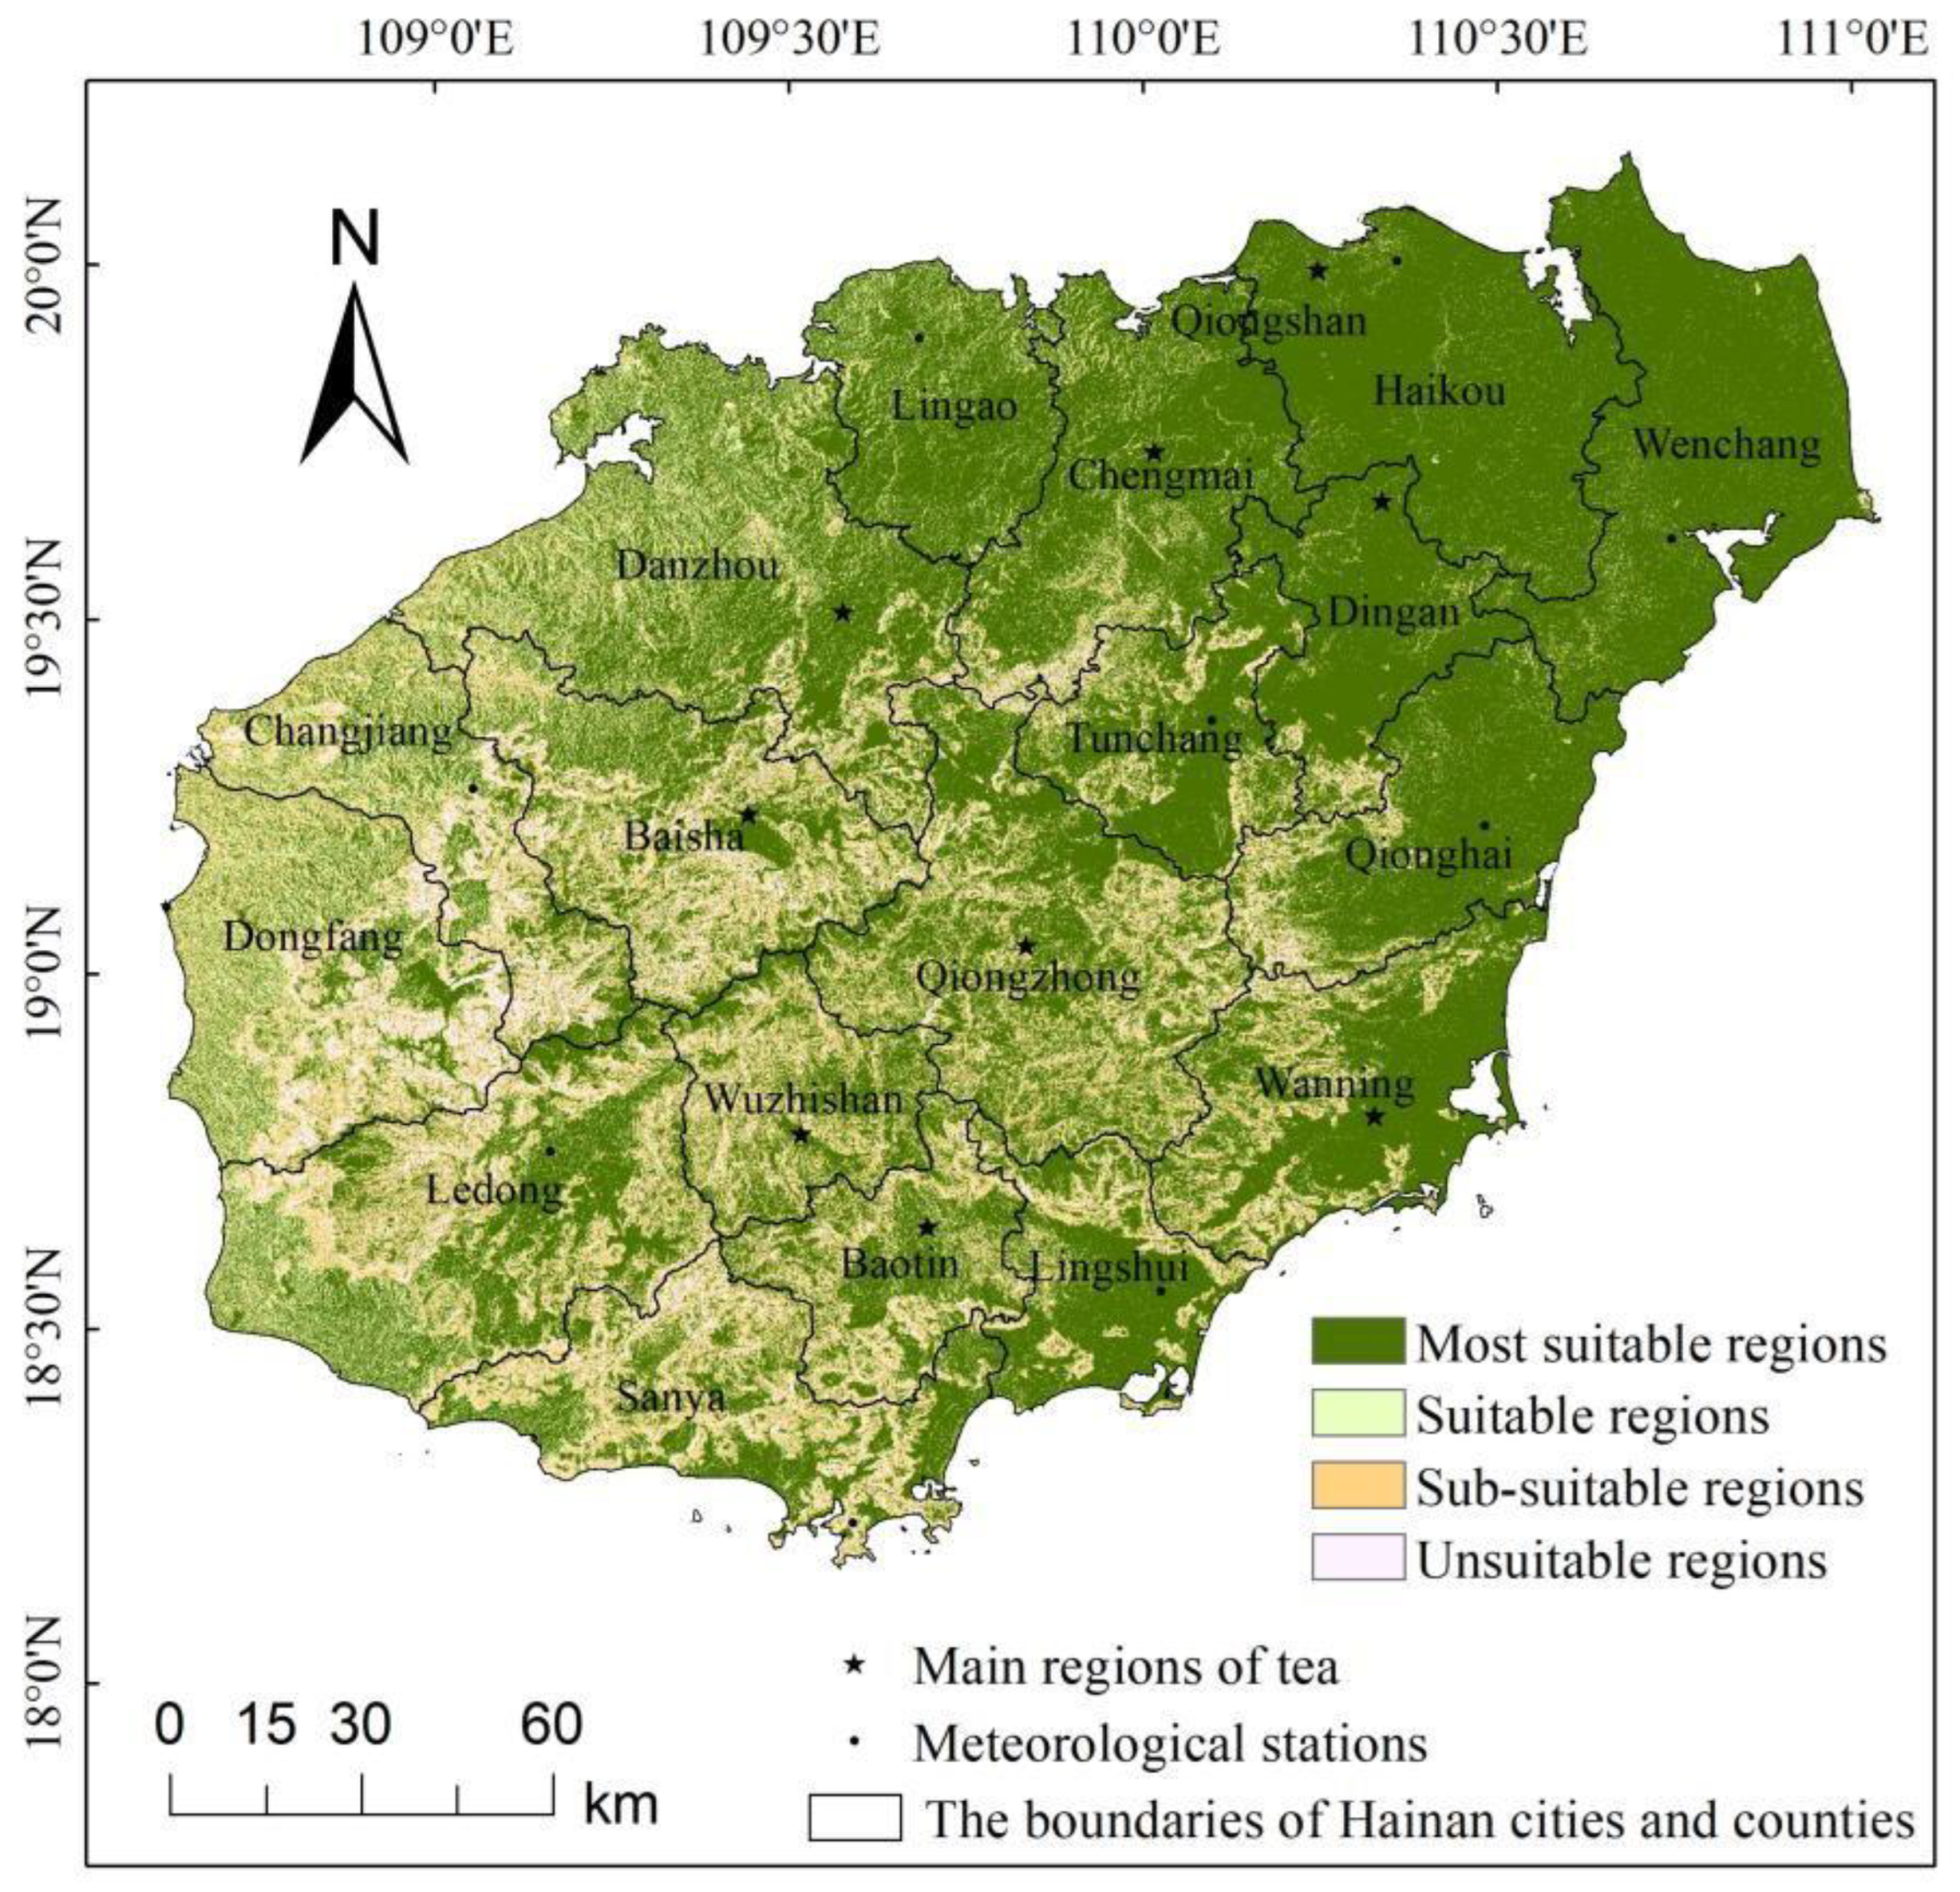
By modeling recent climatic conditions and topographic factors for tea cultivation, comprehensive zonation for tea planting on the island was developed (Figure 5), with the tea-growing zones classified into the most suitable planting zone, a suitable planting zone, a sub-suitable planting zone, and an unsuitable planting zone.
In the most suitable zone, the suitability index ranges from 0.9 to 1.0. This zone is mainly in the northeastern parts of the island, including most of Haikou, Qiongshan, Wenchang, Lingao, Chengmai, Ding’an, Qionghai, eastern parts of Danzhou, and eastern and southern parts of Tunchang. The zone also includes the southeastern region, covering eastern parts of Wanning, central and southern parts of Lingshui, central parts of Baoting, and central and northern parts of Qiongzhong. The area is approximately 21,859 km2. Annual average temperature in the zone is 23.4 °C to 26.7 °C, with the annual average precipitation of 1556 mm to 2327 mm. Average monthly precipitation in the tea growth period is 178 mm to 251 mm, and annual average sunshine duration is 1723 to 2162 h, with average sunshine percentage of 42% to 49%. The zone has abundant precipitation, with suitable temperature and sunlight conditions for tea cultivation. However, land available for tea planting is limited due to the rapid urbanization of Haikou, Qiongzhong, and nearby areas.
In the suitable zone, the suitability index ranges from 0.8 to 0.9. This zone is mainly in central mountainous areas and coastal regions in the west of the island, including Qiongzhong, Wuzhishan, Baoting, western parts of Wanning, Baisha, Dongfang, and Changjiang, central and western parts of Danzhou, and some areas in the west of Ledong. The area is approximately 4680 km2. Annual average temperature in the zone is 23.7 °C to 27.7 °C, with an annual average precipitation of 1236 mm to 2146 mm. Average monthly precipitation in the tea growth period is 124 mm to 247 mm, and annual average sunshine duration is 1749 to 2572 h, with average sunshine percentage of 48% to 51%. The temperature is suitable, the precipitation is abundant, and the sunshine is also relatively appropriate. The zone has relatively high elevations, with larger temperature differences between day and night, higher humidity, and more scattered sunlight, all of which are beneficial for tea growth.
In the sub-suitable zone, the suitability index ranges from 0.6 to 0.8, mainly covering small parts of central and southern Dongfang, southern parts of Changjiang, northwestern parts of Ledong, central and southern parts of Baisha, northern parts of Wuzhishan, eastern parts of Qiongzhong, western parts of Wanning, and most of Sanya, with an area of approximately 5701 km2. Annual average temperature in the zone is 24.1 °C to 28.8 °C, with an annual average precipitation of 1063 mm to 1560 mm. Average monthly precipitation in the tea growth period is 67 mm to 180 mm, and annual average sunshine duration is 2207 to 2838 h, with average sunshine percentage of 50% to 55%. The temperature is relatively suitable, but precipitation is relatively low, and sunlight characteristics are unsuitable in this zone.
In the unsuitable zone, the suitability degree is below 0.6, mainly including some areas in eastern and southern Dongfang, southern parts of Changjiang, some parts of northern and central Sanya, and small parts of southern and central Baisha, with an area of approximately 1642 km2. Average annual temperature in the zone exceeds 28 °C, with annual average precipitation below 1000 mm. Average monthly precipitation in the tea growth period is below 50 mm, and average annual sunshine duration exceeds 2700 h, with average sunshine percentage above 55%. The zone has high temperatures, insufficient precipitation, and excessive sunlight, making it unsuitable for tea cultivation.

4. Discussion

Climatic suitability indicators for tea cultivation vary by location. Previous studies investigated climatic factors, such as annual average temperature, annual extreme minimum temperature, ≥10 °C accumulated temperature, and annual precipitation, to evaluate suitable tea planting areas in Shaanxi Province [11]. Annual average temperature, ≥10 °C annual accumulated temperature, frequency of extreme low temperatures below −13 °C, and average humidity from April to October were used to evaluate suitable tea planting areas in Zhejiang Province [14]. And the number of days with daily minimum temperature below 0 °C from January to March, annual ≥10 °C accumulated temperature, annual sunshine percentage, and annual precipitation were used to evaluate tea planting areas in Sichuan Province [25]. In our study, based on agro-meteorological indicators for tea growth and the island’s topographic and environmental characteristics, four main climatic indicators were selected that affect climatic suitability for tea cultivation: annual average temperature, annual precipitation, monthly average precipitation in the tea growth period, and sunshine percentage, and provided the scientific basis for a zonation system to measure the degree of climatic suitability for tea cultivation on Hainan Island. Meteorological elements were mostly obtained through spatial interpolation, to overcome insufficient dataset resolution [16,17]. We then established a spatial analysis model for climatic zoning indicators coupled with geographic information elements, using GIS analysis technology to conduct a refined climatic suitability zoning for tea planting on the island. The suitable planting areas for tea were divided into four levels: the most suitable zone, a suitable zone, a sub-suitable zone, and an unsuitable zone, to assess potential climatic suitability changes under future climate scenarios.
Climate change has exacerbated the instability of agricultural production, causing fluctuations in both tea yield and quality [41]. Sunlight conditions are a critical factor limiting climatic suitability for tea cultivation on Hainan Island. Excessive radiation and prolonged sunshine can degrade tea quality [42]. The central mountainous regions, with relatively low temperatures, high humidity, and frequent cloud cover and fog, are considered the most suitable areas for future tea planting, with the potential to become a major tea production base [43], including Qiongzhong, Wuzhishan, Baisha, Baoting, and Tunchang. In addition, the northeastern regions of the island show high climatic suitability for tea cultivation, making them viable for expanding tea planting. Looking ahead 25 years, our analysis based on the SSP245 scenario indicates that significant areas of Hainan Island will remain suitable for tea cultivation.
Our study’s findings should help optimize tea production on the island. Of course, tea cultivation and development are influenced by many factors, including tea farmers’ economic benefits, market demand, and policy support [44,45]. In agricultural production practice, the decision-making process for tea planting also needs to incorporate other key factors, such as cultivation and harvesting technologies, incentives and subsidies, economic benefits, and market demand. Thus, before large-scale planting, we suggest conducting small-scale trials first and making further decisions based on local conditions. Tea growth is closely related to soil conditions, with factors such as soil quality, microbial activity, and pH directly affecting tea plant growth and quality [46,47,48]. Additionally, tea garden microclimates (involving canopy temperature and soil moisture) regulate the plant growth environment, further influencing tea plant physiological metabolism and thereby affecting tea yield and quality [49]. Future research is necessary to further evaluate the effects of soil quality, microclimate, and other fine-scale factors, to achieve more precise zoning, and give a stronger foundation for sustainable tea cultivation on Hainan Island.

5. Conclusions

Tea growth is strongly influenced by seasonal changes, and the climatic conditions for tea growth vary across the seasons. On Hainan Island, the climatic suitability for tea growth is relatively high in spring (March to May) and autumn (September to October), but lower in summer (June to August), mainly due to high temperatures and strong sunlight.
The most suitable zone for tea planting is centered in the northeastern parts of the island, with a suitability index of 0.9–1.0. The suitable zone is mainly located in the central mountainous areas and the western coastal region, with a suitability index of 0.8–0.9. The sub-suitable zone mainly includes central and southern parts of Dongfang, with a suitability index of 0.6–0.8. The unsuitable zone mainly includes eastern and southern parts of Dongfang and southern parts of Changjiang, with a suitability index below 0.6. Under future climate scenarios, temperatures will continue to rise, and the suitable temperature area would then shrink from the periphery toward the central mountainous regions. Precipitation will also increase over time, leading to an expansion of the suitable precipitation area on the island.

Author Contributions

Design of the study and financial support: Y.L. and L.R.; analysis of data and writing of manuscript: Q.Z. and Y.L.; data collection and writing—review: Y.S., Y.Y., X.W. and Y.T. All authors have read and agreed to the published version of the manuscript.

Funding

This research was conducted under the financial supports from the National Natural Science Foundation of China (41875177), and the Geological Survey Project of China Geological Survey (DD20190305).

Data Availability Statement

The original contributions presented in this study are included in the article. Further inquiries can be directed to the corresponding authors.

Conflicts of Interest

The authors declare no conflicts of interest.

References

  1. Wu, Q.; Yang, J.; Lin, C.; Guan, X. Research on the Changes of China’s Tea Production Layout. J. Tea Sci. 2022, 42, 290–300. [Google Scholar] [CrossRef]
  2. Mao, Z.; Fu, C.; Yuan, Y.; Zhang, X.; Yan, W.; Dong, X. Evolution of Spatial and Temporal Patterns of Tea Production in China and Analysis of Influencing Factors. Southwest J. Agric. 2024, 37, 2536–2546. [Google Scholar] [CrossRef]
  3. Zhang, M.; Zhang, J.; Liu, S.; Chen, X.; Lin, W. Variation Characteristics of Climate Change on Hainan Island During 1961–2011. J. Trop. Crops 2014, 35, 2488–2495. [Google Scholar] [CrossRef]
  4. Yan, Y.; Jeong, S.; Park, C.E.; Mueller, N.D.; Piao, S.; Park, H.; Joo, J.; Chen, X.; Wang, X.; Liu, J.; et al. Effects of Extreme Temperature on China’s Tea Production. Environ. Res. Lett. 2021, 16, 044040. [Google Scholar] [CrossRef]
  5. Tesfay, G.; Zhao, Y.; Zhao, M.; Li, K.; Demelash, T.; Xu, Y. Assessing the Impacts of Climate Change on Geographical Distribution of Tea (Camellia sinensis L.) in Kenya with Maximum Entropy Model. Agronomy 2024, 14, 2080. [Google Scholar] [CrossRef]
  6. Li, X.; Zhang, L.; Ahammed, G.; Li, Z.; Wei, J.; Shen, C.; Yan, P.; Zhang, L.; Han, W. Stimulation in Primary and Secondary Metabolism by Elevated Carbon Dioxide Alters Green Tea Quality in Camellia sinensis L. Sci. Rep. 2017, 7, 7937. [Google Scholar] [CrossRef]
  7. Chaturvedi, S.; Cheong, T.S.; Luo, Y.; Singh, C.; Shaw, R. IPCC AR6: Climate Change 2022—Impacts, Adaptation, and Vulnerability in Asia, IPCC. Switzerland. 2022. Available online: https://coilink.org/20.500.12592/sc4xfx (accessed on 31 July 2025).
  8. Lou, W.; Sun, K.; Zhao, Y.; Deng, S.; Zhou, Z. Impact of Climate Change on Inter-Annual Variation in Tea Plant Output in Zhejiang, China. Int. J. Climatol. 2021, 41, E479–E490. [Google Scholar] [CrossRef]
  9. Ahmed, S.; Stepp, J.R.; Orians, C.; Griffin, T.; Matyas, C.; Robbat, A.; Cash, S.; Xue, D.; Long, C.; Unachukwu, U.; et al. Effects of Extreme Climate Events on Tea (Camellia sinensis) Functional Quality Validate Indigenous Farmer Knowledge and Sensory Preferences in Tropical China. PLoS ONE 2014, 9, e109126. [Google Scholar] [CrossRef] [PubMed]
  10. Shao, Z.; Gao, W.; Liu, Y.; Chen, C.; Cao, J.; Lin, Z. Spatial Evolution of Tea Habitat and Spatial Response of Tea Production in Sichuan. China Agric. Resour. Zoning 2023, 44, 61–71. (In Chinese) [Google Scholar]
  11. Liang, Y.; Bai, Q.; Li, X.; Zhu, L.; Guo, Z.; He, W. GIS-Based Climate and Ecological Suitability Zoning of Tea Plant in Southern Shaanxi. China Agron. Bull. 2011, 27, 79–85. (In Chinese) [Google Scholar]
  12. Mao, X.; Chen, L.; Ma, Y.; Wang, J.; Tang, X. Evaluation on Suitability for the Tea Planting in Luan City Based on GIS. Chin. J. Agric. Resour. Reg. Plan. 2018, 39, 188–194. (In Chinese) [Google Scholar]
  13. Sahu, N.; Das, P.; Saini, A.; Varun, A.; Mallick, S.K.; Nayan, R.; Aggarwal, S.P.; Pani, B.; Kesharwani, R.; Kumar, A. Analysis of Tea Plantation Suitability Using Geostatistical and Machine Learning Techniques: A Case of Darjeeling Himalaya, India. Sustainability 2023, 15, 10101. [Google Scholar] [CrossRef]
  14. Bo, L.; Zhang, F.; Zhang, L.; Huang, J.; Jin, Z.; Gupta, D.K. Comprehensive Suitability Evaluation of Tea Crops Using GIS and a Modified Land Ecological Suitability Evaluation Model. Pedosphere 2012, 22, 122–130. [Google Scholar] [CrossRef]
  15. Li, X.; Min, Q.; Yu, W. Climatic Adaptation of Tea Growing in Nanjing. J. Nanjing Meteorol. Inst. 1995, 18, 572–577. [Google Scholar] [CrossRef]
  16. Luo, J.; Yan, L.; Xu, D.; Yang, Q. Climate Adaptability Analysis for Planting Regions of High Quality Green Tea in Tongren District. J. Tea Sci. 2011, 31, 136–142. [Google Scholar] [CrossRef]
  17. Yu, H. Characteristics of Climatic Suitability Change of Tea in Eastern Fujian. J. Mt. Geogr. 2016, 34, 415–424. [Google Scholar] [CrossRef]
  18. Jin, Z.; Ye, J.; Yang, Z.; Sun, R.; Hu, B.; Li, R. Climatic Suitability for Tea Growing in Zhejiang Province. Chin. J. Appl. Ecol. 2014, 25, 967–973. [Google Scholar] [CrossRef]
  19. Palanikkumar, D.; Upreti, K.; Venkatraman, S.; Suganthi, J.; Kannan, S.; Srinivasan, S. Fuzzy Logic for Underground Mining Method Selection. Intell. Autom. Soft Comput. 2022, 32, 1843–1854. [Google Scholar] [CrossRef]
  20. Ullah, I.; Kovacs, G.; Lenner, T. Impact of Climate Change on Flood Risk with Urban Resilience Perspective Using Fuzzy Logic Model. Earth Sci. Inform. 2025, 18, 346. [Google Scholar] [CrossRef]
  21. Bin, L.; Shahzad, M.; Khan, H.; Bashir, M.; Ullah, A.; Siddique, M. Sustainable Smart Agriculture Farming for Cotton Crop: A Fuzzy Logic Rule Based Methodology. Sustainability 2023, 15, 13874. [Google Scholar] [CrossRef]
  22. Bikdeli, S. Redevelopment Modeling for Land Suitability Evaluation of the Suburb Brown-fields Using Fuzzy Logic and GIS, Northeastern Iran. Environ. Dev. Sustain. 2020, 22, 6213–6232. [Google Scholar] [CrossRef]
  23. Zhao, H.; Mi, H.; Du, Z.; Jin, K. Study on the Climate Regionalization of Tea Plant in Henan Province. J. Tea Sci. 2016, 36, 330–336. [Google Scholar] [CrossRef]
  24. Hu, B.; Jin, Z.; Li, Y.; Ding, Y.; Li, R. Comprehensive Suitability Evaluation of Tea Plant Cultivation in Jiangnan Tea Area. Meteorol. Sci. Technol. 2018, 46, 390–395. [Google Scholar] [CrossRef]
  25. Zou, Y.; Yang, L.; Zhang, X.; Xie, S.; Feng, W.; Zhang, Y. Zoning of Ecological Suitability of Tea Production Based on GIS——Taking Wangcang County as an Example. J. Southwest Univ. Nat. Sci. Ed. 2021, 43, 53–59. [Google Scholar] [CrossRef]
  26. Jayasinghe, S.L.; Kumar, L. Climate Change May Imperil Tea Production in the Four Major Tea Producers According to Climate Prediction Models. Agronomy 2020, 10, 1536. [Google Scholar] [CrossRef]
  27. Jayasinghe, S.L.; Kumar, L. Modeling the Climate Suitability of Tea [Camellia sinensis (L.) O. Kuntze] in Sri Lanka in Response to Current and Future Climate Change Scenarios. Agric. For. Meteorol. 2019, 272, 102–117. [Google Scholar] [CrossRef]
  28. Zhao, Y.; Zhao, M.; Zhang, L.; Wang, C.; Xu, Y. Predicting Possible Distribution of Tea (Camellia sinensis L.) Under Climate Change Scenarios Using MaxEnt Model in China. Agriculture 2021, 11, 1122. [Google Scholar] [CrossRef]
  29. Zhao, Y.; Xu, Y.; Zhang, L.; Zhao, M.; Wang, C. Adapting Tea Production to Climate Change Under Rapid Economic Development in China from 1987 to 2017. Agronomy 2022, 12, 3192. [Google Scholar] [CrossRef]
  30. Parida, B.R.; Mahato, T.; Ghosh, S. Monitoring Tea Plantations During 1990–2022 Using Multi-temporal Satellite Data in Assam (India). Trop. Ecol. 2024, 65, 387–398. [Google Scholar] [CrossRef]
  31. Xu, G.; Guo, Q.; Niu, S.; Pei, S.; Zhu, L.; Zhu, N. Research on Climate Change Characteristics of Different Climatic Regions on Hainan Island in the Last 50 Years. J. Nat. Resour. 2013, 28, 799–810. [Google Scholar] [CrossRef]
  32. Hainan Provincial Bureau of Statistics; Survey Office of National Bureau of Statistics in Hainan. Hainan Statistical Yearbook 2024; China Statistics Press: Beijing, China, 2024; p. 216. [Google Scholar]
  33. Peng, Z.; Sun, Y. Fuzzy Mathematics and Its Applications; Wuhan University Press: Wuhan, China, 2002; pp. 142–143. [Google Scholar]
  34. Han, X.; Qu, M. Crop Ecology; Meteorological Press: Beijing, China, 1991; pp. 240–246. [Google Scholar]
  35. Tea Research Institute; Chinese Academy of Agricultural Sciences. Cultivation of the Chinese Tea Tree; Shanghai Science and Technology Press: Shanghai, China, 2005; pp. 128–140. [Google Scholar]
  36. Wang, T.; Jin, X. Effects of Ecological Conditions on Tea Quality. Tea Sci. Technol. 2014, 3, 6–12. [Google Scholar] [CrossRef]
  37. Luo, Y. Cultivation of Tea Tree, 5th ed.; China Agricultural Press: Beijing, China, 2015; pp. 93–157. [Google Scholar]
  38. Wang, M.; Yang, J.; LI, J.; Zhou, X.; Xiao, Y.; Liao, Y.; Tang, J.; Dong, F.; Zeng, L. Effects of Temperature and Light on Quality-related Metabolites in Tea [Camellia sinensis (L.) Kuntze] Leaves. Food Res. Int. 2022, 161, 111882. [Google Scholar] [CrossRef]
  39. Rigden, A.J.; Ongoma, V.; Huybers, P. Kenyan Tea is Made with Heat and Water: How Will Climate Change Influence Its Yield? Environ. Res. Lett. 2020, 15, 044003. [Google Scholar] [CrossRef]
  40. Zhang, W.; Rao, Y. A Brief Analysis of the Current Status and Strategic Suggestions for the Development of the Tea Industry in Hainan. China Tea 2020, 42, 58–61. [Google Scholar] [CrossRef]
  41. Jayasinghe, S.L.; Kumar, L. Potential Impact of the Current and Future Climate on the Yield, Quality, and Climate Suitability for Tea [Camellia sinensis (L.) O. Kuntze]: A Systematic Review. Agronomy 2021, 11, 619. [Google Scholar] [CrossRef]
  42. Zeng, L.; Watanabe, N.; Yang, Z. Understanding the Biosyntheses and Stress Response Mechanisms of Aroma Compounds in Tea (Camellia sinensis) to Safely and Effectively Improve Tea Aroma. Crit. Rev. Food Sci. Nutr. 2019, 59, 2321–2334. [Google Scholar] [CrossRef] [PubMed]
  43. Jiang, D.; Kong, Z.; Yang, C.; Yu, C.; Li, S.; Liu, X.; Hu, H. Effect of Altitude on the Quality of Different Types of Alpine Green Tea. Sci. Technol. Food Ind. 2025, 46, 1–12. [Google Scholar] [CrossRef]
  44. Biggs, E.M.; Gupta, N.; Saikia, S.D.; Duncan, J.M.A. The Tea Landscape of Assam: Multi-stakeholder Insights into Sustainable Livelihoods Under a Changing Climate. Environ. Sci. Policy 2018, 82, 9–18. [Google Scholar] [CrossRef]
  45. Deka, N.; Goswami, K. Organic Cultivation and Sustainable Value Chain Development for Tea Smallholders: Findings from Assam, India. Sustain. Prod. Consum. 2022, 32, 562–579. [Google Scholar] [CrossRef]
  46. Qiao, C.; Xu, B.; Han, Y.; Wang, J.; Wang, X.; Liu, L.; Liu, W.; Wan, S.; Tan, H.; Liu, Y.; et al. Synthetic Nitrogen Fertilizers Alter the Soil Chemistry, Production and Quality of Tea. A Meta-analysis. Agron. Sustain. Dev. 2018, 38, 10. [Google Scholar] [CrossRef]
  47. Bag, S.; Mondal, A.; Banik, A. Exploring Tea (Camellia sinensis) Microbiome: Insights into the Functional Characteristics and Their Impact on Tea Growth Promotion. Microbiol. Res. 2022, 254, 126890. [Google Scholar] [CrossRef] [PubMed]
  48. Jia, M.; Wang, Y.; Zhang, Q.; Lin, S.; Zhang, Q.; Chen, Y.; Hong, L.; Jia, X.; Ye, J.; Wang, H. Effect of Soil pH on the Uptake of Essential Elements by Tea Plant and Subsequent Impact on Growth and Leaf Quality. Agronomy 2024, 14, 1338. [Google Scholar] [CrossRef]
  49. Wang, S.H.; Juang, J.Y. Different Management Strategies Exert Distinct Influences on Microclimate of Soil and Canopy in Tea Fields through Surface-atmosphere Interactions. Agric. Water Manag. 2024, 291, 108617. [Google Scholar] [CrossRef]
Figure 1. Distribution of meteorological stations in the study area.
Agronomy 15 02196 g001
Figure 2. Spatial distribution of results from the four main climate sub-models for tea climatic suitability: (a) the annual mean temperature suitability index; (b) the annual total precipitation suitability index; (c) the monthly average precipitation in tea growth period suitability index; and (d) the sunlight percentage suitability index.
Agronomy 15 02196 g002
Figure 3. Spatial distribution of annual mean temperature under present (a) and future climate change scenarios (SSP245) (b) on Hainan Island.
Agronomy 15 02196 g003
Figure 4. Spatial distribution of annual mean precipitation under present (a) and future climate change scenarios (SSP245) (b) on Hainan Island.
Agronomy 15 02196 g004
Figure 5. Hainan Island’s current climatic suitability zoning for tea plants.
Agronomy 15 02196 g005
Table 1. Features of meteorological elements in the main tea planting areas from 1990 to 2019 on Hainan Island (Mean ± Standard Deviation).
StationAnnual Mean
Temperature (°C)
January Mean Temperature (°C)July Mean Temperature (°C)Annual
Accumulated Temperature (°C)
Annual Precipitation (mm)Average Monthly Precipitation in Tea Growth Period (mm)Sunshine
Hours
(h)
Percentage of Sunlight (%)Altitude (m)
Haikou24.6 ± 0.518.1 ± 1.328.8 ± 0.68994.6 ± 200.01794.7 ± 401.4204.5 ± 49.11902.4 ± 195.043% ± 4%63.5
Wuzhishan23.7 ± 1.718.7 ± 1.126.4 ± 0.58664.6 ± 620.31877.0 ± 340.5217.4 ± 39.21935.6 ± 286.244% ± 6%328.5
Baisha23.7 ± 0.617.8 ± 1.327.5 ± 0.68647.8 ± 205.31950.7 ± 327.5222.9 ± 40.72100.1 ± 141.447% ± 3%215.6
Qiongzhong23.4 ± 0.517.6 ± 1.327.2 ± 0.58538.4 ± 177.62326.5 ± 420.8247.0 ± 51.31955.6 ± 180.044% ± 4%250.9
Baoting25.0 ± 0.420.4 ± 1.027.7 ± 0.59141.8 ± 149.12166.1 ± 404.6251.1 ± 47.31749.5 ± 146.740% ± 3%68.6
Chengmai24.3 ± 0.517.9 ± 1.428.5 ± 0.58856.9 ± 182.41919.6 ± 386.7221.8 ± 46.71722.8 ± 145.739% ± 3%31.4
Dingan24.5 ± 0.418.3 ± 1.328.7 ± 0.58957.4 ± 147.52000.5 ± 401.0229.5 ± 48.41803.6 ± 160.141% ± 4%53.3
Wanning25.1 ± 0.419.6 ± 1.128.6 ± 0.59165.9 ± 139.42213.5 ± 492.9226.0 ± 52.11961.6 ± 150.344% ± 3%39.9
Danzhou24.1 ± 0.517.9 ± 1.428.1 ± 0.68807.0 ± 192.41938.4 ± 442.5221.5 ± 51.91955.3 ± 141.244% ± 3%169.0
Qiongshan24.8 ± 0.618.2 ± 1.229.0 ± 0.69055.7 ± 204.81856.1 ± 429.9210.2 ± 51.01962.3 ± 152.244% ± 3%9.9
Dongfang25.5 ± 0.519.4 ± 1.229.5 ± 0.59320.0 ± 167.01063.1 ± 276.6123.8 ± 34.52572.1 ± 130.858% ± 3%7.6
Lingao24.6 ± 1.517.7 ± 1.228.7 ± 0.68963.1 ± 548.81556.4 ± 414.3177.6 ± 50.92005.5 ± 148.945% ± 3%31.7
Changjiang25.5 ± 1.719.5 ± 1.228.9 ± 0.79316.8 ± 634.61767.6 ± 388.1210.2 ± 46.52225.4 ± 201.550% ± 4%98.1
Tunchang24.6 ± 1.618.2 ± 1.328.3 ± 0.58977.0 ± 575.62133.5 ± 408.1236.2 ± 48.91894.8 ± 178.743% ± 4%118.3
Qionghai24.9 ± 0.419.0 ± 1.228.7 ± 0.69094.7 ± 157.92141.7 ± 408.4230.2 ± 49.71919.8 ± 183.943% ± 4%23.3
Wenchang24.6 ± 0.418.6 ± 1.228.6 ± 0.48986.5 ± 159.61983.4 ± 441.3219.3 ± 51.11856.4 ± 172.942% ± 4%21.7
Ledong24.8 ± 0.420.1 ± 1.227.6 ± 0.69064.7 ± 134.91656.7 ± 355.8193.6 ± 43.71974.4 ± 184.545% ± 4%155.0
Sanya25.1 ± 1.720.8 ± 2.127.7 ± 1.69162.3 ± 616.71560.4 ± 330.3180.2 ± 37.42207.3 ± 291.950% ± 7%419.4
Lingshui25.7 ± 1.620.7 ± 0.928.3 ± 0.59402.6 ± 599.41795.8 ± 429.4205.1 ± 50.62162.3 ± 191.149% ± 4%35.2
Table 2. Agroclimatic indicators of tea growth.
Climatic FactorsSuitable ConditionsViable ConditionsHarmful Conditions
Mean temperature (°C)15~2513~15 or 25~35<13 or >35
Annual precipitation (mm)>15001000~1500<1000
Average monthly precipitation in tea growth period (mm)≥10050~100<50
Percentage of sunlight (%)35~4545~60>60
Table 3. Spatial analysis model of climate zoning indicators for Hainan Island.
Meteorological ElementsModel ExpressionR
Annual average temperature (°C)Y = 35.089 − 0.395i − 0.027j − 0.005z + 0.049α + 0.004β0.855 **
Total annual precipitation (mm)Y = −27499.901 − 357.803i + 333.650j + 1.220z − 56.261α − 2.047β0.842 **
Monthly precipitation in tea growth period (mm)Y = −2517.908 − 31.641i + 30.731j + 0.156z − 7.130α − 0.186β0.799 *
Percentage of sunlight (%)Y = 553.518 + 1.766i − 4.982j − 0.022z + 1.032α + 0.023β0.841 **
Future annual mean temperature (°C)Y = −14.021 + 0.607i + 0.243j − 0.006z + 0.202α + 0.003β0.693
Total future annual precipitation (mm)Y = −10729.642 − 191.274i + 147.959j + 0.720z − 35.131α − 0.470β0.813 **
Note: i is latitude/°, j is longitude/°, z is elevation/m, α is slope/°, β is slope aspect/°. *, ** showed significant difference at the 0.05 and 0.01 levels, respectively.
Table 4. Mean annual and seasonal climatic suitability for tea on Hainan Island, 1990–2019.
Growth PeriodTemperature SuitabilityPrecipitation SuitabilitySunshine SuitabilityClimatic Suitability
MinimumAverageMaximumMinimumAverageMaximumMinimumAverageMaximumMinimumAverageMaximum
Year0.980.991.000.920.991.000.370.931.000.670.971.00
Spring0.940.981.000.440.941.000.220.611.000.440.760.98
Summer0.500.690.851.001.001.000.150.400.960.450.600.86
Autumn0.810.931.001.001.001.000.250.781.000.560.861.00
Disclaimer/Publisher’s Note: The statements, opinions and data contained in all publications are solely those of the individual author(s) and contributor(s) and not of MDPI and/or the editor(s). MDPI and/or the editor(s) disclaim responsibility for any injury to people or property resulting from any ideas, methods, instructions or products referred to in the content.