Article

Interactive Effects of Different Field Capacity and Nitrogen Levels on Soil Fertility and Microbial Community Structure in the Root Zone of Jujube (Ziziphus jujuba Mill.) Seedlings in an Arid Region of Southern Xinjiang, China

The National-Local Joint Engineering Laboratory of High Efficiency and Superior-Quality Cultivation and Fruit Deep Processing Technology on Characteristic Fruit Trees, College of Horticulture and Forestry Sciences, Tarim University, Alar 843300, China
*
Author to whom correspondence should be addressed.
These authors contributed equally to this work.
Agronomy 2025, 15(9), 2191; https://doi.org/10.3390/agronomy15092191
Submission received: 7 August 2025 / Revised: 10 September 2025 / Accepted: 12 September 2025 / Published: 14 September 2025
(This article belongs to the Section Soil and Plant Nutrition)

Abstract

Understanding the regulatory mechanisms of water–nitrogen coupling effects on soil–plant–microbe systems in arid regions is crucial for sustainable agricultural development. This study systematically investigated the interactive effects of field capacity (75% vs. 45%) and nitrogen application rates (100 vs. 300 kg ha−1) combined with different enhanced-efficiency nitrogen fertilizers (EENFs) on rhizosphere soil fertility and microbial community structure of Jujube (Ziziphus jujuba Mill.) seedlings through a two-year pot experiment. Two-year-old jujube seedlings were employed with five treatments: NS (urea), NM (urease inhibitor), XH (nitrification inhibitor), W (microbial fertilizer), and CK (control), to analyze soil physicochemical properties and microbial community responses. Soil available N accumulated under high-N/adequate moisture but declined under drought. NM curbed NH3 volatilization by 32.38–43.22%, while XH increased NH4+-N by 35.76%. Drought raised microbial α-diversity (bacteria + 33.88–37.5%, fungi + 43.62–68.75%). NM demonstrated optimal performance in ammonia volatilization (32.38–43.22% reduction), while XH showed notable efficacy in ammonium-N regulation (35.76% enhancement). Microbial α-diversity exhibited enhanced responses under drought stress, with bacterial and fungal community improvements reaching 33.88–37.5% and 43.62–68.75%. Redundancy analysis showed environmental factors explained more community variance under water stress (bacteria: 79.19→88.76%; fungi: 64.64→92.52%). These findings provide theoretical support for jujube cultivation in arid zones, demonstrate the potential of targeted EENFs, and offer new insights for precision water–fertilizer and microbial management.

1. Introduction

In southern Xinjiang, rapid agricultural intensification and soaring fertilizer use have intensified environmental stress, soil degradation, and microbial imbalance under recurring drought and high salinity. These challenges accelerate the deterioration of soil physical and chemical properties, including aggregate stability, organic carbon, and salinity, thereby threatening the sustainable development of the jujube (Ziziphus jujuba Mill.) industry [1]. Field capacity (FC), soil fertility, and microbial community structure are highly sensitive determinants of jujube yield and quality under such extremes [2]. As an endemic salt-alkali-tolerant tree species, jujube growth and development are constrained by the dual limitations of diminished nitrogen utilization proficiency and rhizosphere microecosystem imbalance [3]. Although enhanced-efficiency nitrogen fertilizers (EENFs) can mitigate N losses to some extent, variations in FC exert profound effects on EENFs’ functional efficiency through their regulatory roles in soil fertility and microbial activity [4]. Therefore, elucidating the tripartite interactions among water, EENFs, and microorganisms represents a critical approach to overcoming regional ecological cultivation bottlenecks.
Jujube cultivation in arid regions requires a delicate balance between water use efficiency (WUE) and drought tolerance. Under such extreme conditions, the water–N coupling process—defined here as the interactive regulation between field capacity and N availability—critically governs soil fertility status and microbial community structure. The 45%FC can simulate drought stress conditions, while 75%FC represents adequate moisture conditions; this comparison enables the elucidation of physiological response mechanisms of jujube trees to water availability. Existing studies have universally confirmed that water stress exerts significant negative effects on jujube growth, primarily attributed to impaired gas exchange resulting from stomatal [5]. However, some investigations have revealed that within certain stress thresholds, the intrinsic water use efficiency (WUEi, net photosynthetic rate to stomatal conductance) of jujube trees may improve, which is considered an adaptive “water-saving” strategy for drought tolerance [6]. The 75%FC is typically regarded as near-optimal or mild water deficit conditions. Under this regime, although plants experience mild water stress, they can often maintain high productivity through physiological adjustments, such as enhanced WUE [7,8]. Multiple studies have demonstrated that implementing irrigation strategies at 75% water requirement can achieve higher or even enhanced crop yields and water productivity while conserving water resources [9,10]. 45%FC represents moderate to severe drought stress conditions. Under this water regime, various physiological activities of jujube trees are significantly inhibited [11]. For instance, research indicates that when soil relative water content falls below 58%, photosynthesis in Z. jujuba may experience pronounced stomatal limitations [12]. This water deficit significantly reduces leaf relative water content by 15–20% and decreases root activity. Nevertheless, plants maintain survival through osmotic adjustment mechanisms and may potentially enhance WUE [13,14].
Conventional N fertilizer application results in substantial nutrient losses of 30–50% through multiple pathways, including nitrate leaching and ammonia volatilization, thereby underscoring the imperative to optimize nitrogen management practices and mitigate resource wastage and environmental contamination as fundamental goals for sustainable agricultural advancement [15]. The EENFs examined in this investigation encompass urease inhibitor-treated N fertilizer (NM) [16,17], nitrification inhibitor-treated N fertilizer (XH) [18,19,20], and microbial-enhanced N fertilizer (W) [21,22,23]. All demonstrating significant potential for improving N use efficiency while reducing environmental pollution. Although the interactive effects between EENFs and soil moisture gradients on microbial community structure have emerged as a rapidly evolving research frontier characterized by continuous methodological innovations, persistent mechanistic uncertainties and conflicting conclusions across ecosystems remain prevalent [24,25,26]. According to established soil water content–N2O emission relationship models [27], optimal moisture conditions at 75%FC provide adequate hydration and aeration conditions that significantly enhance bacterial network complexity and Shannon diversity indices, while strengthening nitrification-denitrification functional gene expression (amoA, nosZ), consequently reducing N2O emission coefficients [28]. Conversely, these moisture conditions may intensify leaching processes, potentially diluting rhizosphere carbon-N hotspots and reducing the relative abundance of oligotrophic taxa such as Actinobacteria [29,30]. In contrast, moderate drought stress induced by 45%FC conditions, while decreasing overall α-diversity, promotes elevated fungi-to-bacteria ratios and enriches osmotically protective genera, including Streptomyces and Pseudomonas, establishing stress-tolerant “oligotrophic” communities [31,32]. However, whether this transformation genuinely enhances N retention efficiency or coincides with increased pathogenic fungal risks (e.g., Fusarium) remains unresolved [33]. More critically, the microbiological effects of EENFs exhibit pronounced variations across different moisture scenarios. NM demonstrates significant ammonia volatilization reduction of 30–50% under 45%FC conditions through urease activity suppression [33], yet it may simultaneously inhibit ammonia-oxidizing archaea (AOA) activity through synergistic high pH and low oxygen conditions, resulting in a 20–35% reduction in AOA relative abundance [34]. XH achieves optimal targeted inhibition of ammonia-oxidizing bacteria (AOB) under 75%FC conditions, reducing AOB activity by 40–65%, though effectiveness diminishes under drought conditions due to elevated AOA/AOB ratios [18,19]. W demonstrates superior performance under moderate moisture stress at 45%FC through establishing stable plant–microbe symbiotic systems [22]. However, the sustained colonization capacity of inoculated microorganisms under combined salinity-drought stress conditions remains contentious [35]. Therefore, elucidating water–N coupling effects among irrigation regimes, N forms, and rhizosphere microorganisms represents a critical approach to overcoming regional ecological cultivation bottlenecks.
Current research predominantly focuses on single N fertilizer application or fixed moisture conditions, lacking systematic analysis of microbial community dynamics under N fertilizer addition at 45% and 75%FC, particularly with long-term effects in southern Xinjiang jujube cultivation areas remaining unclear. Given the importance of sustainable jujube cultivation in arid regions of southern Xinjiang and the urgent need to optimize water–N management while maintaining soil microbial ecosystem integrity, this study systematically analyzes the interactive effects of different FC and EENFs on jujube orchard soil physical and chemical properties, N transformation processes, and microbial community structure. The research objectives are as follows: (1) Quantitative assessment of changes in key fertility indicators under water–N interactions; (2) characterization of soil bacterial and fungal community responses, including α-diversity indices, operational taxonomic unit (ASV) distribution (which reflects the abundance and diversity of microbial taxa), β-diversity patterns, and phylum-level taxonomic composition; (3) establishment of quantitative relationships among soil physicochemical properties, N cycling parameters, and microbial community indicators to propose optimized management strategies for sustainable jujube production.

2. Materials and Methods

2.1. Description of the Study Field and Experiment

The pot experimental site was located at the Horticulture Experimental Station of Tarim University in Alar City, Aksu Prefecture, Xinjiang, China (geographical coordinates: 81°17′56″ E, 40°32′27″ N), which belongs to the warm temperate extremely continental arid desert climate zone. Annual precipitation ranges from 40.1 to 82.5 mm, while annual evaporation reaches 1876.6 to 2558.9 mm.
The experiment was conducted from 2022 to 2024, spanning three growing seasons and using two-year-old jujube seedlings as experimental material. In mid-April 2022, seedlings with consistent growth were transplanted, with an average ground diameter of 3.09 ± 0.87 cm and seedling height of 31.12 ± 6.81 cm. Pot specifications were 60 × 30 × 60 cm (top diameter × bottom diameter× height), filled with sandy loam soil (physicochemical properties shown in Supplementary Table S1). A two-factor completely randomized design was employed, with fertilizer application rates optimized based on previous experimental studies [36,37,38], establishing two field capacities, two N application levels, and four N fertilizer types plus control, totaling 18 treatments. Each treatment included 10 seedlings, and each pot (containing one plant) was the independent experimental unit (180 seedlings in total). FC were set at 75% (W1) and 45% (W2); nitrogen application rates (NAR) were 100 kg ha−1 (N1) and 300 kg ha−1 (N2). N fertilizer types included urea (NS), urease inhibitor N fertilizer (NM), nitrification inhibitor-type N fertilizer (XH), microbial inoculant (W), and control (CK). Fertilization was conducted twice annually: 60% of the total amount applied in mid-April and 40% in mid-June. All treatments received supplemental phosphorus fertilizer (P2O5 ≥ 46%) at 100 kg ha−1 and potassium sulfate (K2O ≥ 51%) at 200 kg ha−1. Unified agronomic practices were implemented throughout the experiment, with specific fertilization details presented in Table 1.
The experiment utilized four distinct types of EENFs, designated as follows:
  • Urea (N ≥ 46%), meeting the Chinese national standard GB/T 2440-2017 [39], was used as the N fertilizer source and was produced by Aksu Huajin Chemical Fertilizer Co., Ltd., Aksu, China.
  • Urease inhibitor N fertilizer: Puzhilan (N ≥ 45%), to which the dual urease inhibitors NBTP and NTTP were added. Puzhilan is produced by Proswin (Hanhe Bio-Technology Co., Ltd., Nanning, China).
  • Nitrification inhibitor-type N fertilizer: Euro N (N ≥ 20.5%), to which the nitrification inhibitor DMPP was added. Euro N is produced by Eurosin Nanning Hanhe Bio-Technology Co., Ltd., Nanning, China.
  • Microbial inoculant: ≥1.0 × 10⁹ CFU/mL (Bacillussubtilis, Bacillus, amyloliquefaciens, Bacillus licheniformis, Bacillus pumilus) (produced by BioWish Inc., Cincinnati, OH, USA). According to the manufacturer’s instructions, it was applied in combination with conventional urea at an optimal ratio of 2 mL per kg of urea.

2.2. Field-Capacity Control

Soil moisture was maintained gravimetrically using ultrapure water (18.2 MΩ cm); pots were weighed daily at 08:00 and irrigated to 75% or 45%FC whenever weight dropped 5% below the target. Leachate was collected in saucers and discarded after each irrigation to prevent salt accumulation. Pots were rotated weekly within each randomized complete block to minimize microclimate gradients.

2.3. Soil Sample Collection and Analysis of Soil Properties

In late October 2024, soil samples were collected from the root zone of each treatment using a soil auger (Yoke Instrument Co., Ltd., Changzhou, China). For each treatment, five pots were randomly selected, and soil samples were collected from the rhizosphere zone at a depth of 0–20 cm using a soil auger. The collected samples were divided into two portions: (1) one was air-dried and passed through a 2 mm sieve for determination of pH and total nutrient content; (2) the other was air-dried and stored at −4 °C for subsequent measurement of NO3–N and soluble organic carbon/nitrogen. During the same period, three additional pots were randomly chosen from the remaining five pots per group. Rhizosphere soil was collected from the 0–20 cm depth using a soil auger, isolated via the rhizosphere shaking method, and stored at −80 °C for microbial diversity analysis and DNA extraction [40]. pH was determined using a soil-to-water ratio of 2.5:1 with a pH meter (PHS-3C); alkali-hydrolyzable N was measured by the alkali-hydrolysis diffusion method; ammonium N was determined using 1 mol/L KCl extraction followed by spectrophotometry; available phosphorus was analyzed by sodium bicarbonate extraction with molybdenum-antimony colorimetry; available potassium was measured using ammonium acetate extraction with flame photometry; total carbon (TC) and N (TN) were determined using a Euro EA3000 elemental analyzer (EuroVector S.p.A., Milan, Italy). Total phosphorus, potassium, and other elements were extracted with 0.01 mL CaCl2 (soil-to-solution ratio 1:10), shaken for 1 h, allowed to settle for 0.5 h, filtered, and analyzed by ICP (SPECTRO ARCOS: SPECTRO Analytical Instruments GmbH, Kleve, Germany). Soil ammonia volatilization was measured using the closed chamber method. Ammonia volatilization devices were placed at each treatment site on the day of fertilization (3 pots per treatment), with sampling beginning at 10:00 a.m. the following day. Samples were collected on days 1, 2, 3, 4, 5, 6, 7, 9, 11, 13, 15, 20, 25, and 30 after fertilization.

2.4. Soil DNA Extraction, PCR Amplification and Illumina MiSeq Sequencing

Soil aliquots (0.2–0.5 g) were homogenized in lysis buffer using a Tissuelyser-48 grinder (Shanghai Jingxin, 60 Hz). Genomic DNA was extracted with the OMEGA Soil DNA Kit (D5635-02: OMEGA Bio-tek, Inc., Norcross, GA, USA), assessed by 0.8% agarose gel electrophoresis, and quantified via Nanodrop. For bacterial communities, the 16S rRNA V3–V4 region was amplified with primers 338F/806R (ACTCCTACGGGA GGCAGCA)/(GGACTACH VGGGTWTCTAAT) in 25 μL reactions (Q5 High-Fidelity DNA Polymerase, NEB: New England Biolabs (NEB), Ipswich, MA, USA) under: 98 °C/5 min; 25 cycles of 98 °C/30 s, 53 °C/30 s, 72 °C/45 s; 72 °C/5 min. Fungal ITS1 (b) was amplified with ITS1F/ITS2 (GGAAGTAAAAGTCGTAACAAGG)/(GCTGCGTTCTTCA TCGATGC) using identical reagents but 55 °C annealing (45 s) for 28 cycles. All amplicons were sequenced by Personalbio (Shanghai, China).

2.5. Bioinformatic Processing and Statistical Analysis

Paired-end reads were merged and quality-filtered (maxEE = 1, truncQ = 2) with DADA2 v1.22 in QIIME2-2022.2, yielding exact amplicon sequence variants (ASVs). Chimeras were removed using the consensus method. Bacterial ASVs were classified against the SILVA SSU v138.1 99% identity classifier; fungal ASVs were classified against the UNITE v8.0 dynamic classifier, both at a ≥ 80% bootstrap threshold. ASVs represented by <10 reads across all samples were discarded. After filtering, high-quality bacterial reads per sample ranged from 63,769 to 105,431 (median = 77,265) and fungal reads from 79,518 to 121,432 (median = 103,078) (Supplementary Table S2). All 54 samples exceeded these minima and were retained. To standardize sequencing depth, each sample was rarefied to 56,565 bacterial and 75,542 fungal reads—the lowest read counts observed after quality control.
α-diversity was estimated on rarefied tables with vegan and phyloseq in R v4.3.2. Six indices were computed:
(1)
Chao1—bias-corrected species richness;
(2)
Faith’s PD—total phylogenetic branch length;
(3)
Goods_coverage—proportion of the total species represented;
(4)
Pielou’s evenness—Shannon-based evenness (0 = dominance, 1 = perfect evenness);
(5)
Shannon—composite diversity integrating richness and evenness;
(6)
Simpson—evenness-weighted diversity, less sensitive to rare taxa.
After calculation, each index was subjected to a three-way ANOVA with water regime (75% FC, 45% FC), N rate (N1, N2), and fertilizer type (CK, NS, NM, XH, W) as fixed factors. Normality and homoscedasticity were verified by Shapiro–Wilk and Levene tests, respectively. When significant interactions were detected (p < 0.05), Tukey’s HSD post hoc comparisons were performed with the emmeans package. For β-diversity, weighted UniFrac distance matrices were constructed and visualized with principal coordinates analysis (PCoA). A full-factor PERMANOVA (9999 permutations) was fitted with the same three fixed factors plus all two- and three-way interactions; effect sizes (R2) and p-values were obtained with vegan::adonis2.
Redundancy analysis (RDA) was conducted to quantify the influence of soil physicochemical variables on community structure. Prior to RDA, ASV tables were Hellinger-transformed, and environmental predictors were z-score standardized. Multicollinearity was evaluated by variance inflation factor (VIF); variables with VIF > 10 were removed. Forward selection retained only variables whose marginal effects were significant at p < 0.05 (9999 permutations). RDA models were run under scaling type 2 with the vegan::rda and vegan::ordiR2step functions. Permutation p-values and the percentage contribution of each selected variable to the constrained variance are reported in Supplementary Tables S6–S9. A three-way ANOVA (Water × N rate × Fertilizer) was applied to the same soil variables to test for interaction effects; corresponding F and p values are given in Supplementary Table S10.
Data processing and statistical analysis were conducted in R v4.3.2 with the vegan, emmeans, and ggplot2 packages; final figures were assembled in Origin 2021 (OriginLab Corporation, Northampton, MA, USA) and GraphPad Prism 2019 (GraphPad Software Inc., Boston, MA, USA).

3. Results

3.1. Effects on Soil Physicochemical Properties Induced by Water–N Management with EENFs

3.1.1. Response of Soil pH and Electrical Conductivity

Soil pH under W1 conditions (Figure 1A): the W1N1-NS treatment exhibited a pH of 7.91, representing a statistically significant 7.03% reduction compared to W1N2-NS. NM, XH, and W showed no significant differences relative to the control treatment. Under W2 conditions, pH values across all treatments increased by 1.83% to 2.28% compared to W1, demonstrating that drought stress systematically promotes soil pH elevation. Soil Electrical Conductivity (EC) Variations reveal that under W1 conditions (Figure 1B), the W1N1-W treatment achieved the highest EC (668.01 μS cm−1), representing a statistically significant 4.94% increase compared to W1N1-NS (p ≤ 0.05). The W1N1-NM and W1N1-XH treatments demonstrated moderate increases of 2.44% to 3.5% relative to control. N2 treatments exhibited significantly elevated electrical conductivity compared to N1 treatments by 2.33%, providing empirical evidence that high N application intensifies soil salinity accumulation. Under W2 conditions, the W2N2-NM treatment recorded the maximum EC (698.17 μS cm−1), surpassing the W2N2-NS and control treatments by 2.66% and 16.09%, respectively. W2 treatments demonstrated electrical conductivity increases ranging from 0.7% to 5.51%.

3.1.2. Response of Soil Available Nutrients

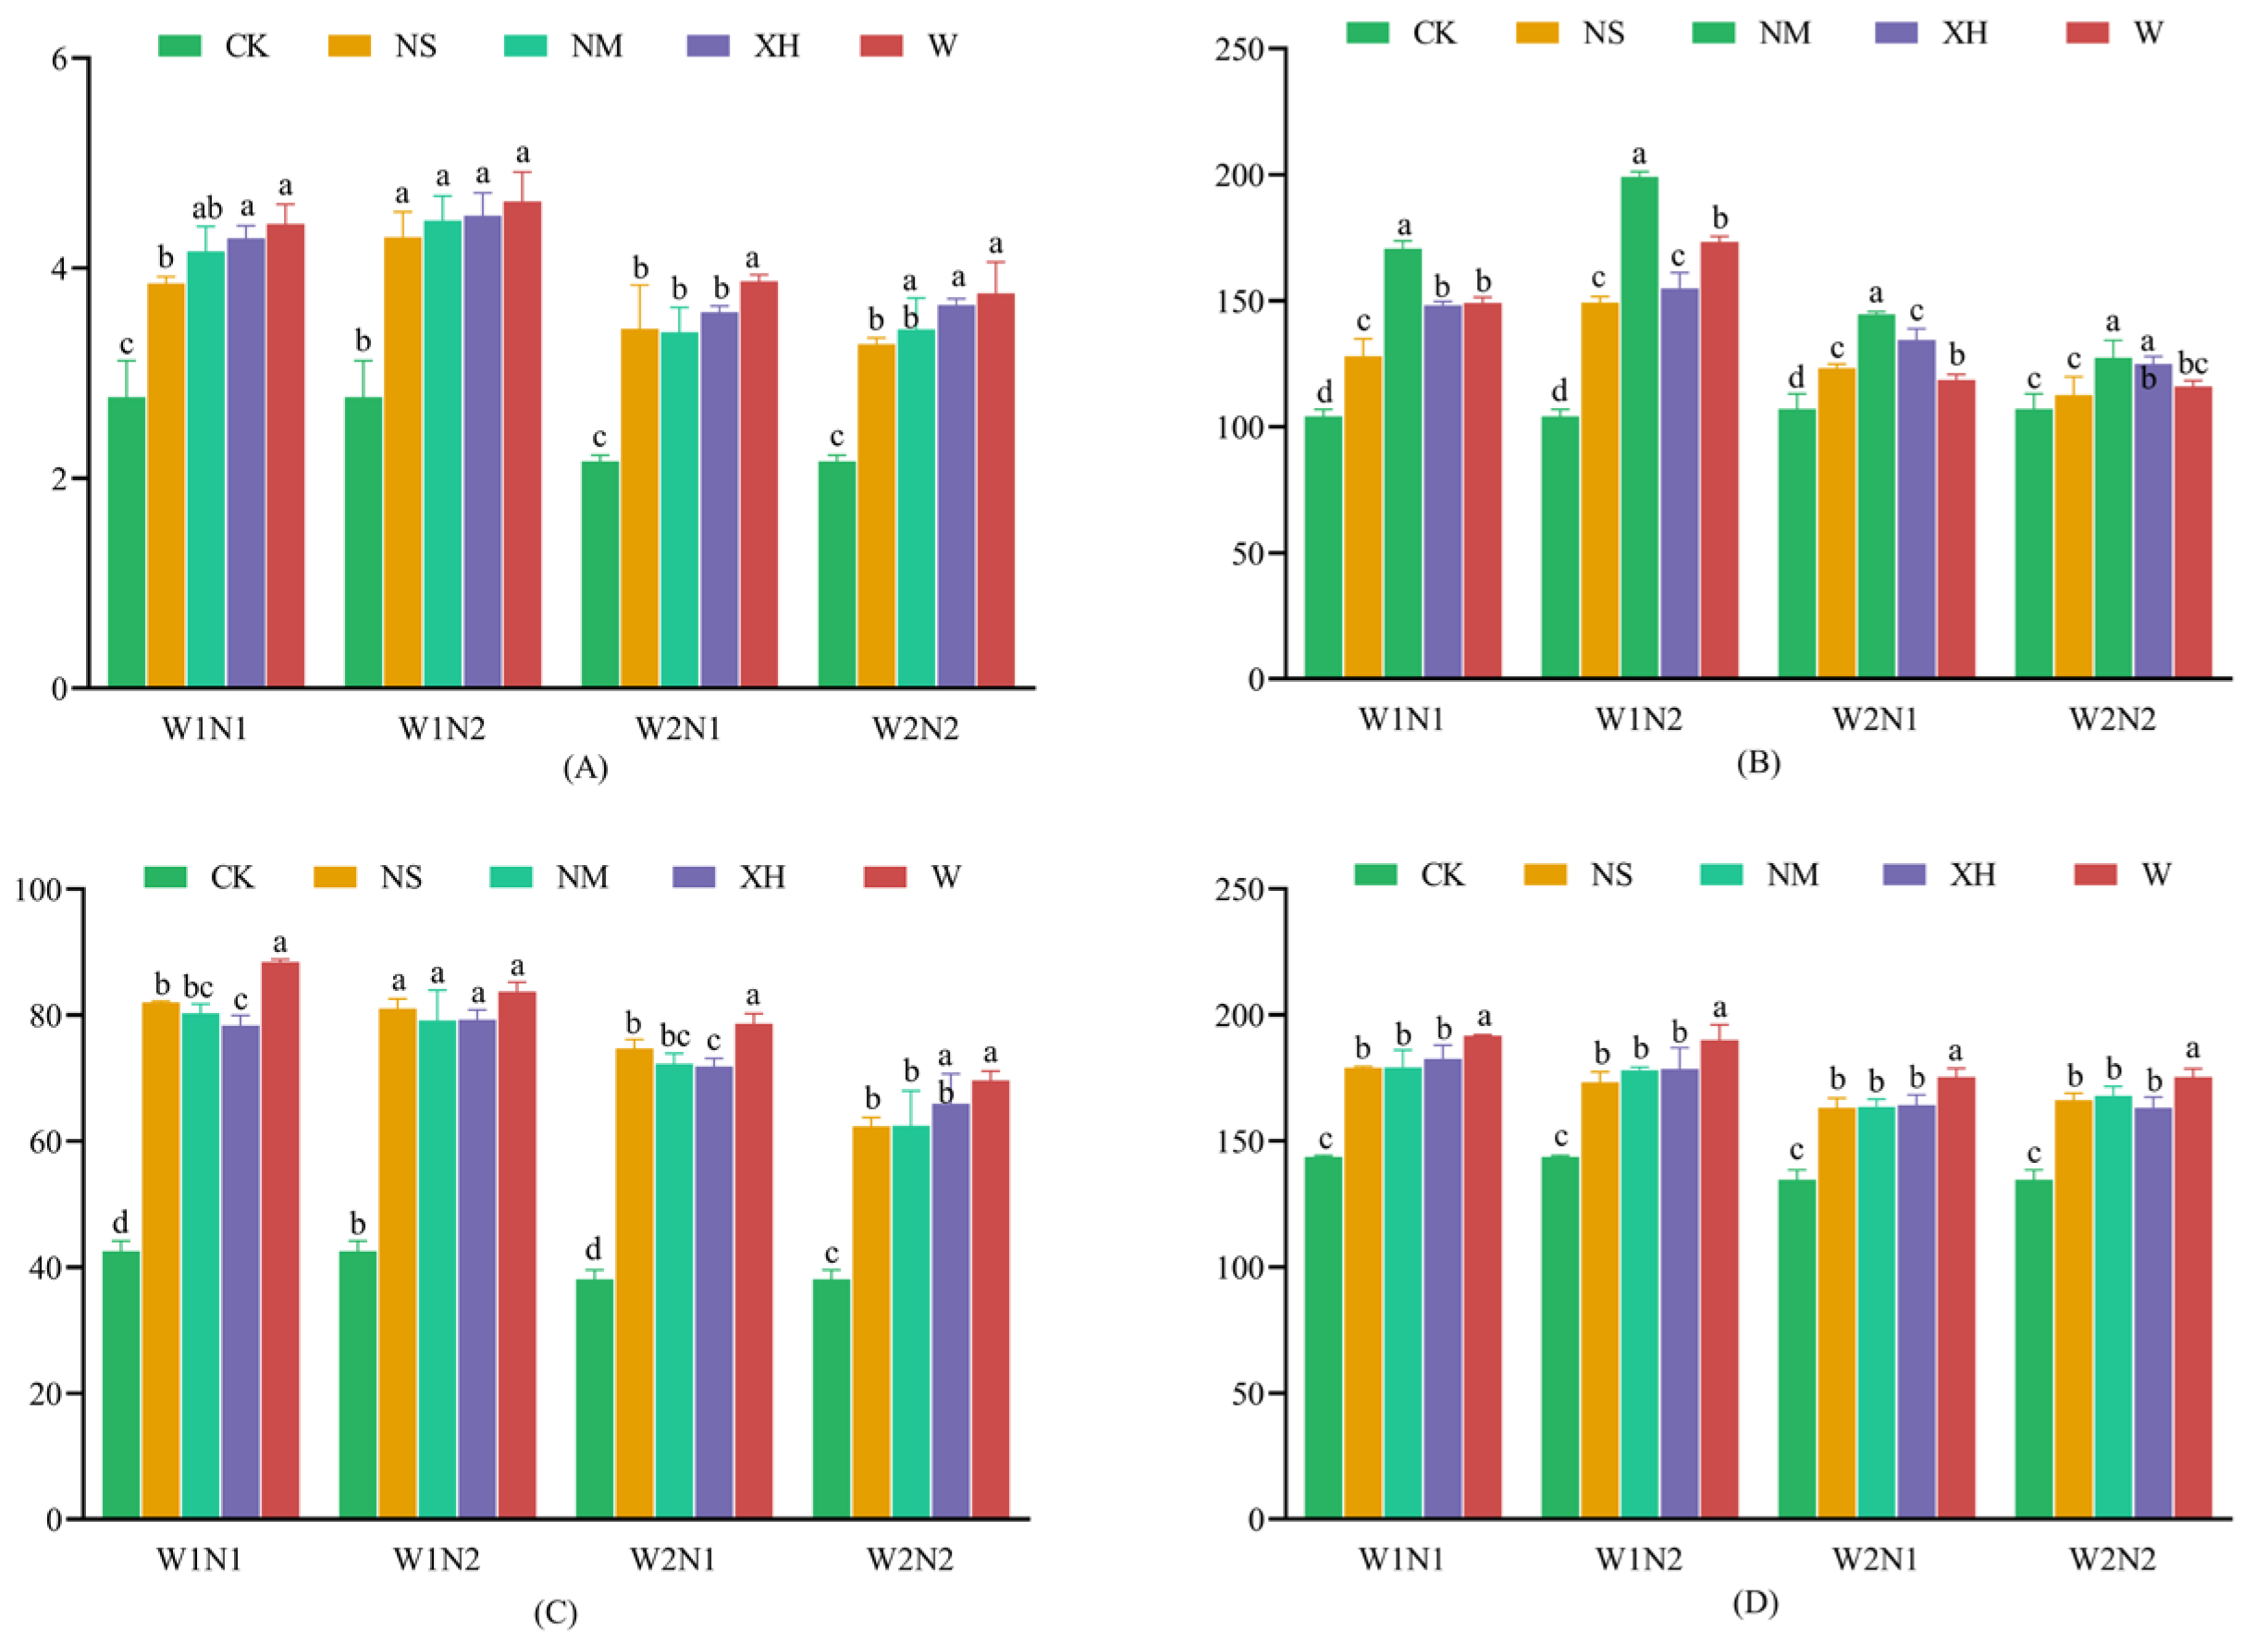
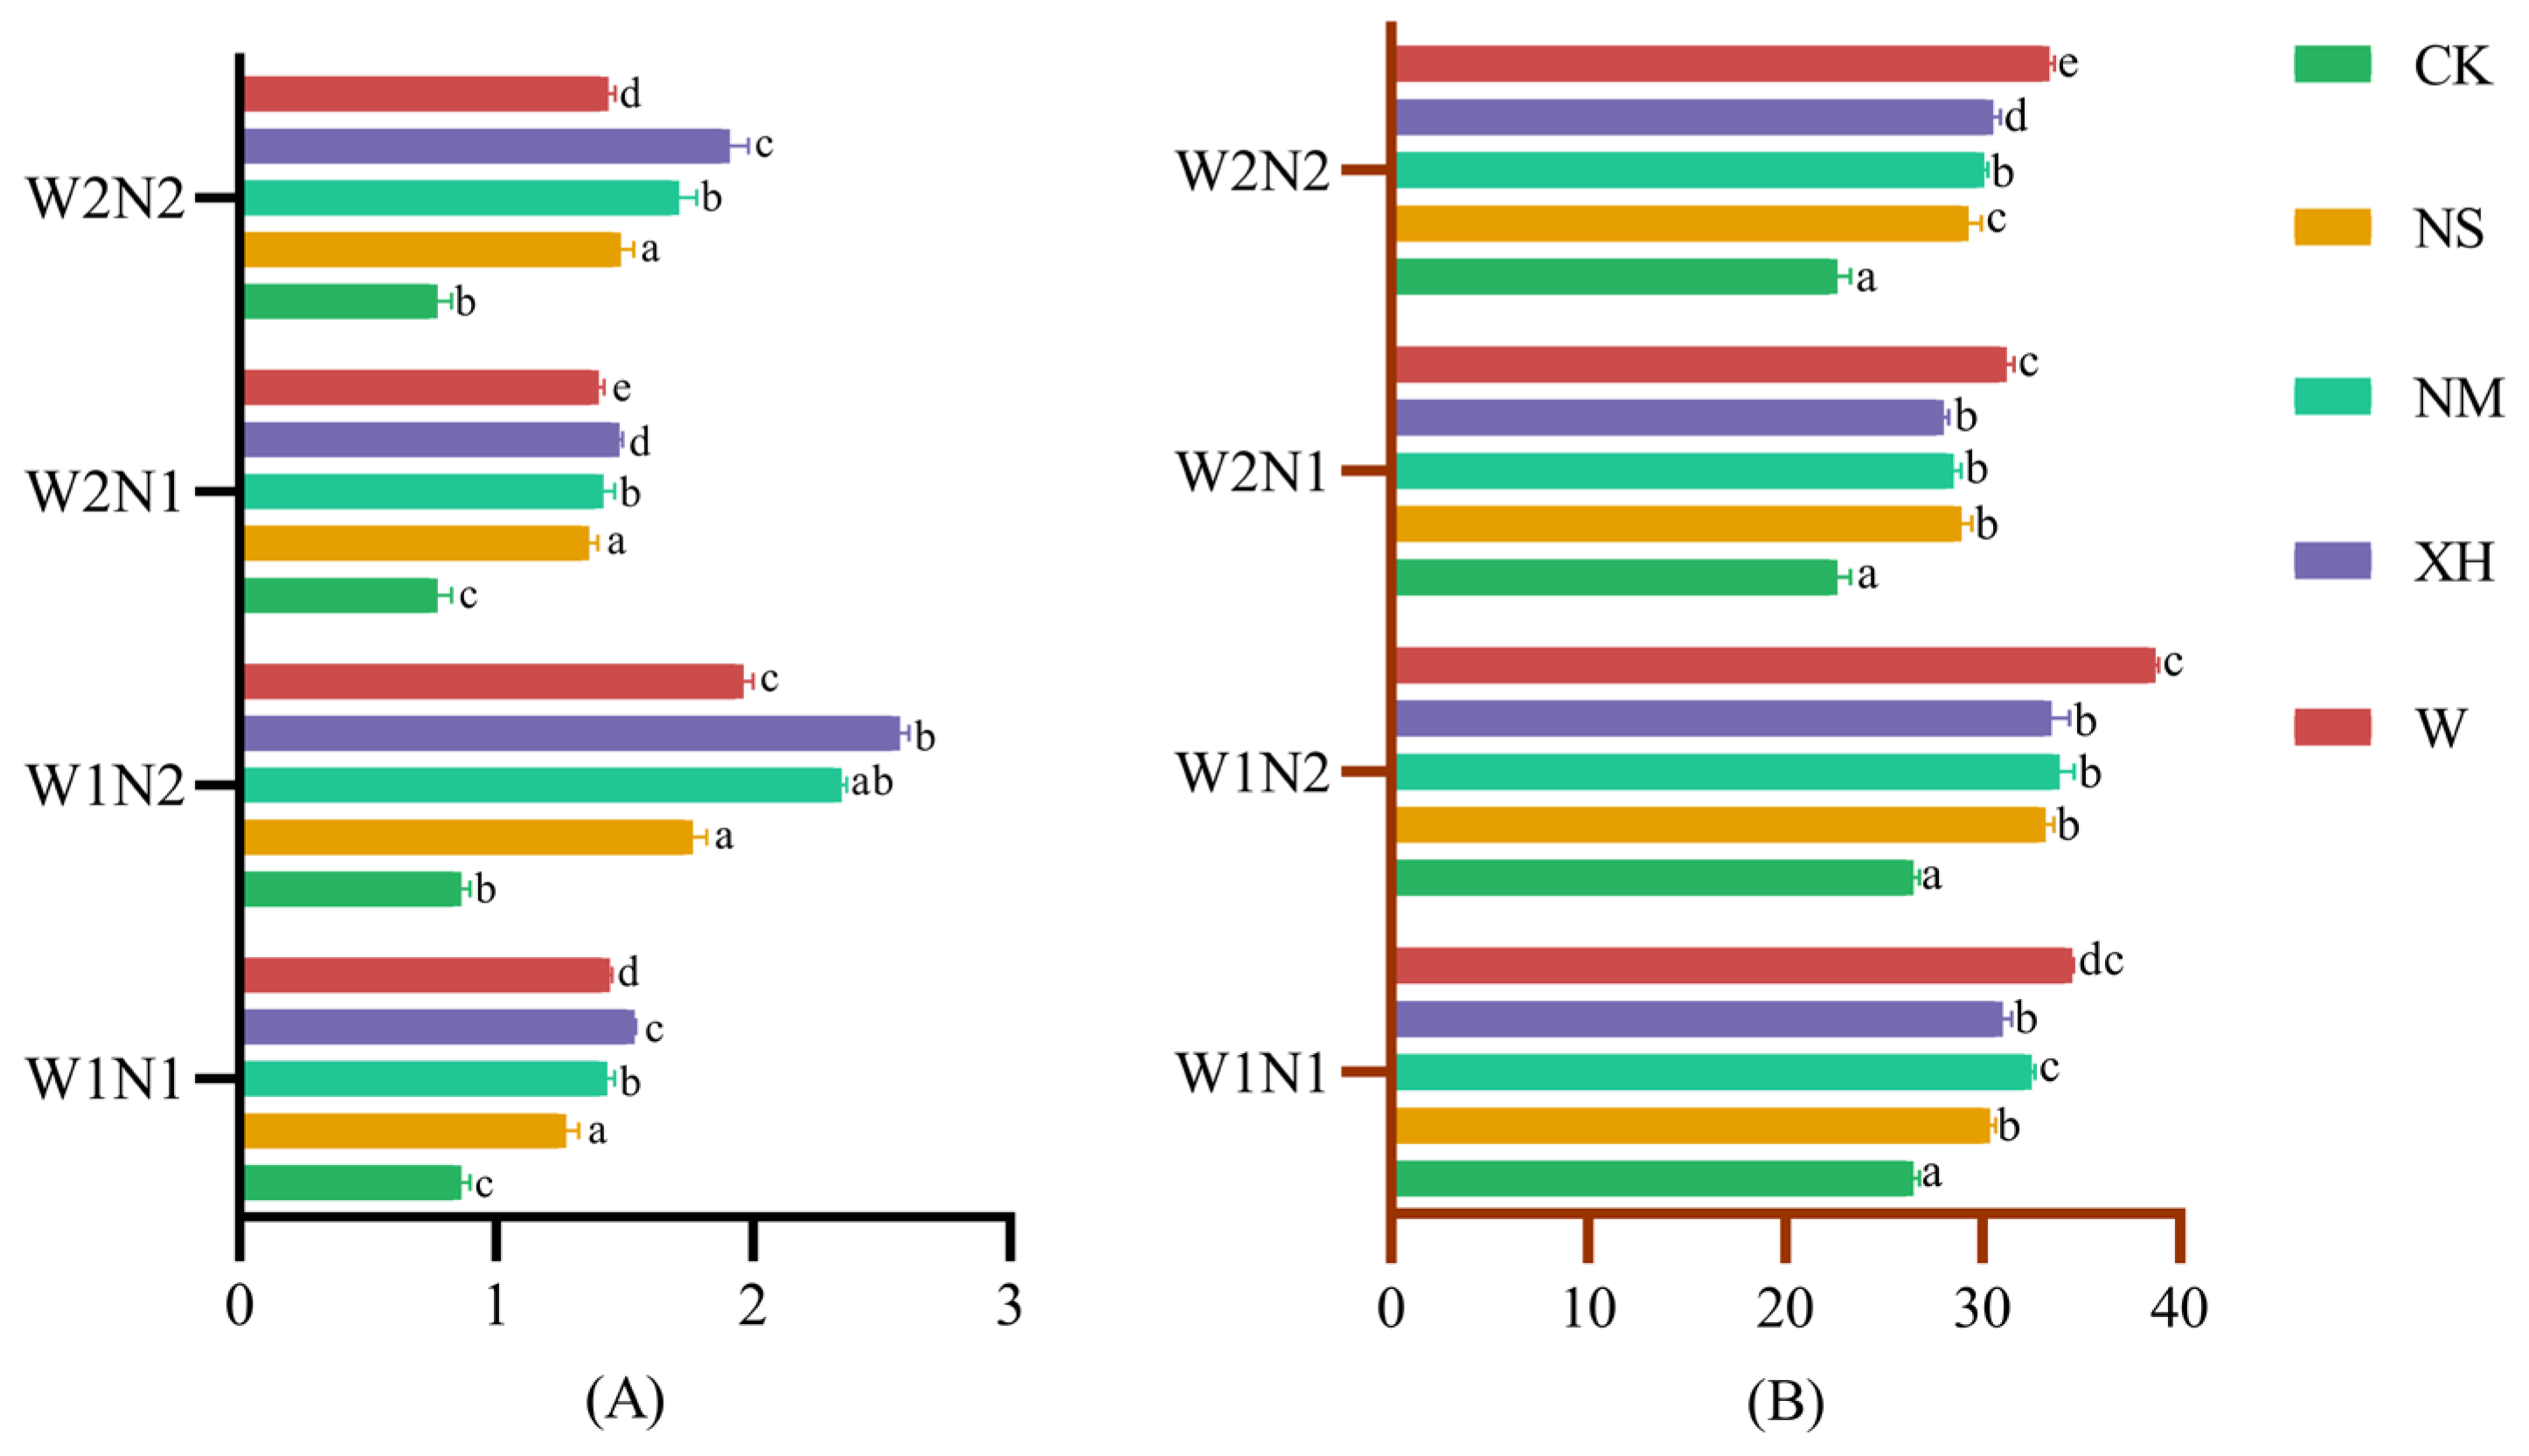
Under 75%FC, SOM accumulation was significantly enhanced (Figure 2A), with W treatment achieving optimal performance (4.63 g kg−1 under W1N2, 7.67% increase). EENFs demonstrated greater promotional effects under high N conditions (3.48–14.5% increases), while water stress markedly reduced these benefits (12.60–31.06% decreases compared to adequate moisture). Soil alkali-hydrolyzable N exhibited contrasting patterns between moisture conditions (Figure 2B). Under 75%FC, high N treatments promoted accumulation, with W1N2-XH reaching maximum levels (199.13 mg kg−1, 33.31% increase). However, under water stress, low N applications proved more favorable, exemplified by W2N1-NM (144.56 mg kg−1). Available phosphorus (AP) and potassium (AK) followed similar moisture-dependent trends (Figure 2C,D), with W1N1-W achieving peak values under adequate conditions (88.44 and 191.72 mg kg−1, respectively, 7.81% and 7.08% increases). TN and TC responses differed markedly (Figure 3A,B). TN accumulation was strongly promoted by adequate moisture, with W1N2-XH treatment yielding the highest content (2.57 g kg−1, 46.02% increase), while NM and W treatments showed 32.95% and 11.36% improvements, respectively.

3.1.3. Response of Soil Macroelement and Microelement Concentrations

FC at 45% significantly promoted K (Figure S1A) and P (Figure S1H) elemental enrichment, with concentrations demonstrating respective increases of 32.28% and 14.63% compared to adequate moisture conditions. Conversely, Na and Fe elements exhibited elevated concentrations under adequate moisture conditions (Figure S1B,D). Na elemental concentration averaged 21.24% higher under 75%FC (Figure S1C,E), with the W1N2-W treatment demonstrating the most pronounced effect, achieving a 19.94% increase. Fe elemental moisture response exhibited differential patterns across N application levels, with low N conditions demonstrating more pronounced moisture effects (24.64% versus 4.98% differential) (Figure S1F,G). NAR exerted significant regulatory effects on specific elemental dynamics. Na elemental concentration exhibited pronounced N dependency, with high N levels demonstrating an average 14.95% increase compared to low N levels, with this effect being more pronounced under adequate moisture conditions.

3.2. Effects of Water–N Coupling Combined with EENFs on Soil N Forms and Losses

3.2.1. Effects in Soil NO3-N and NH4+-N

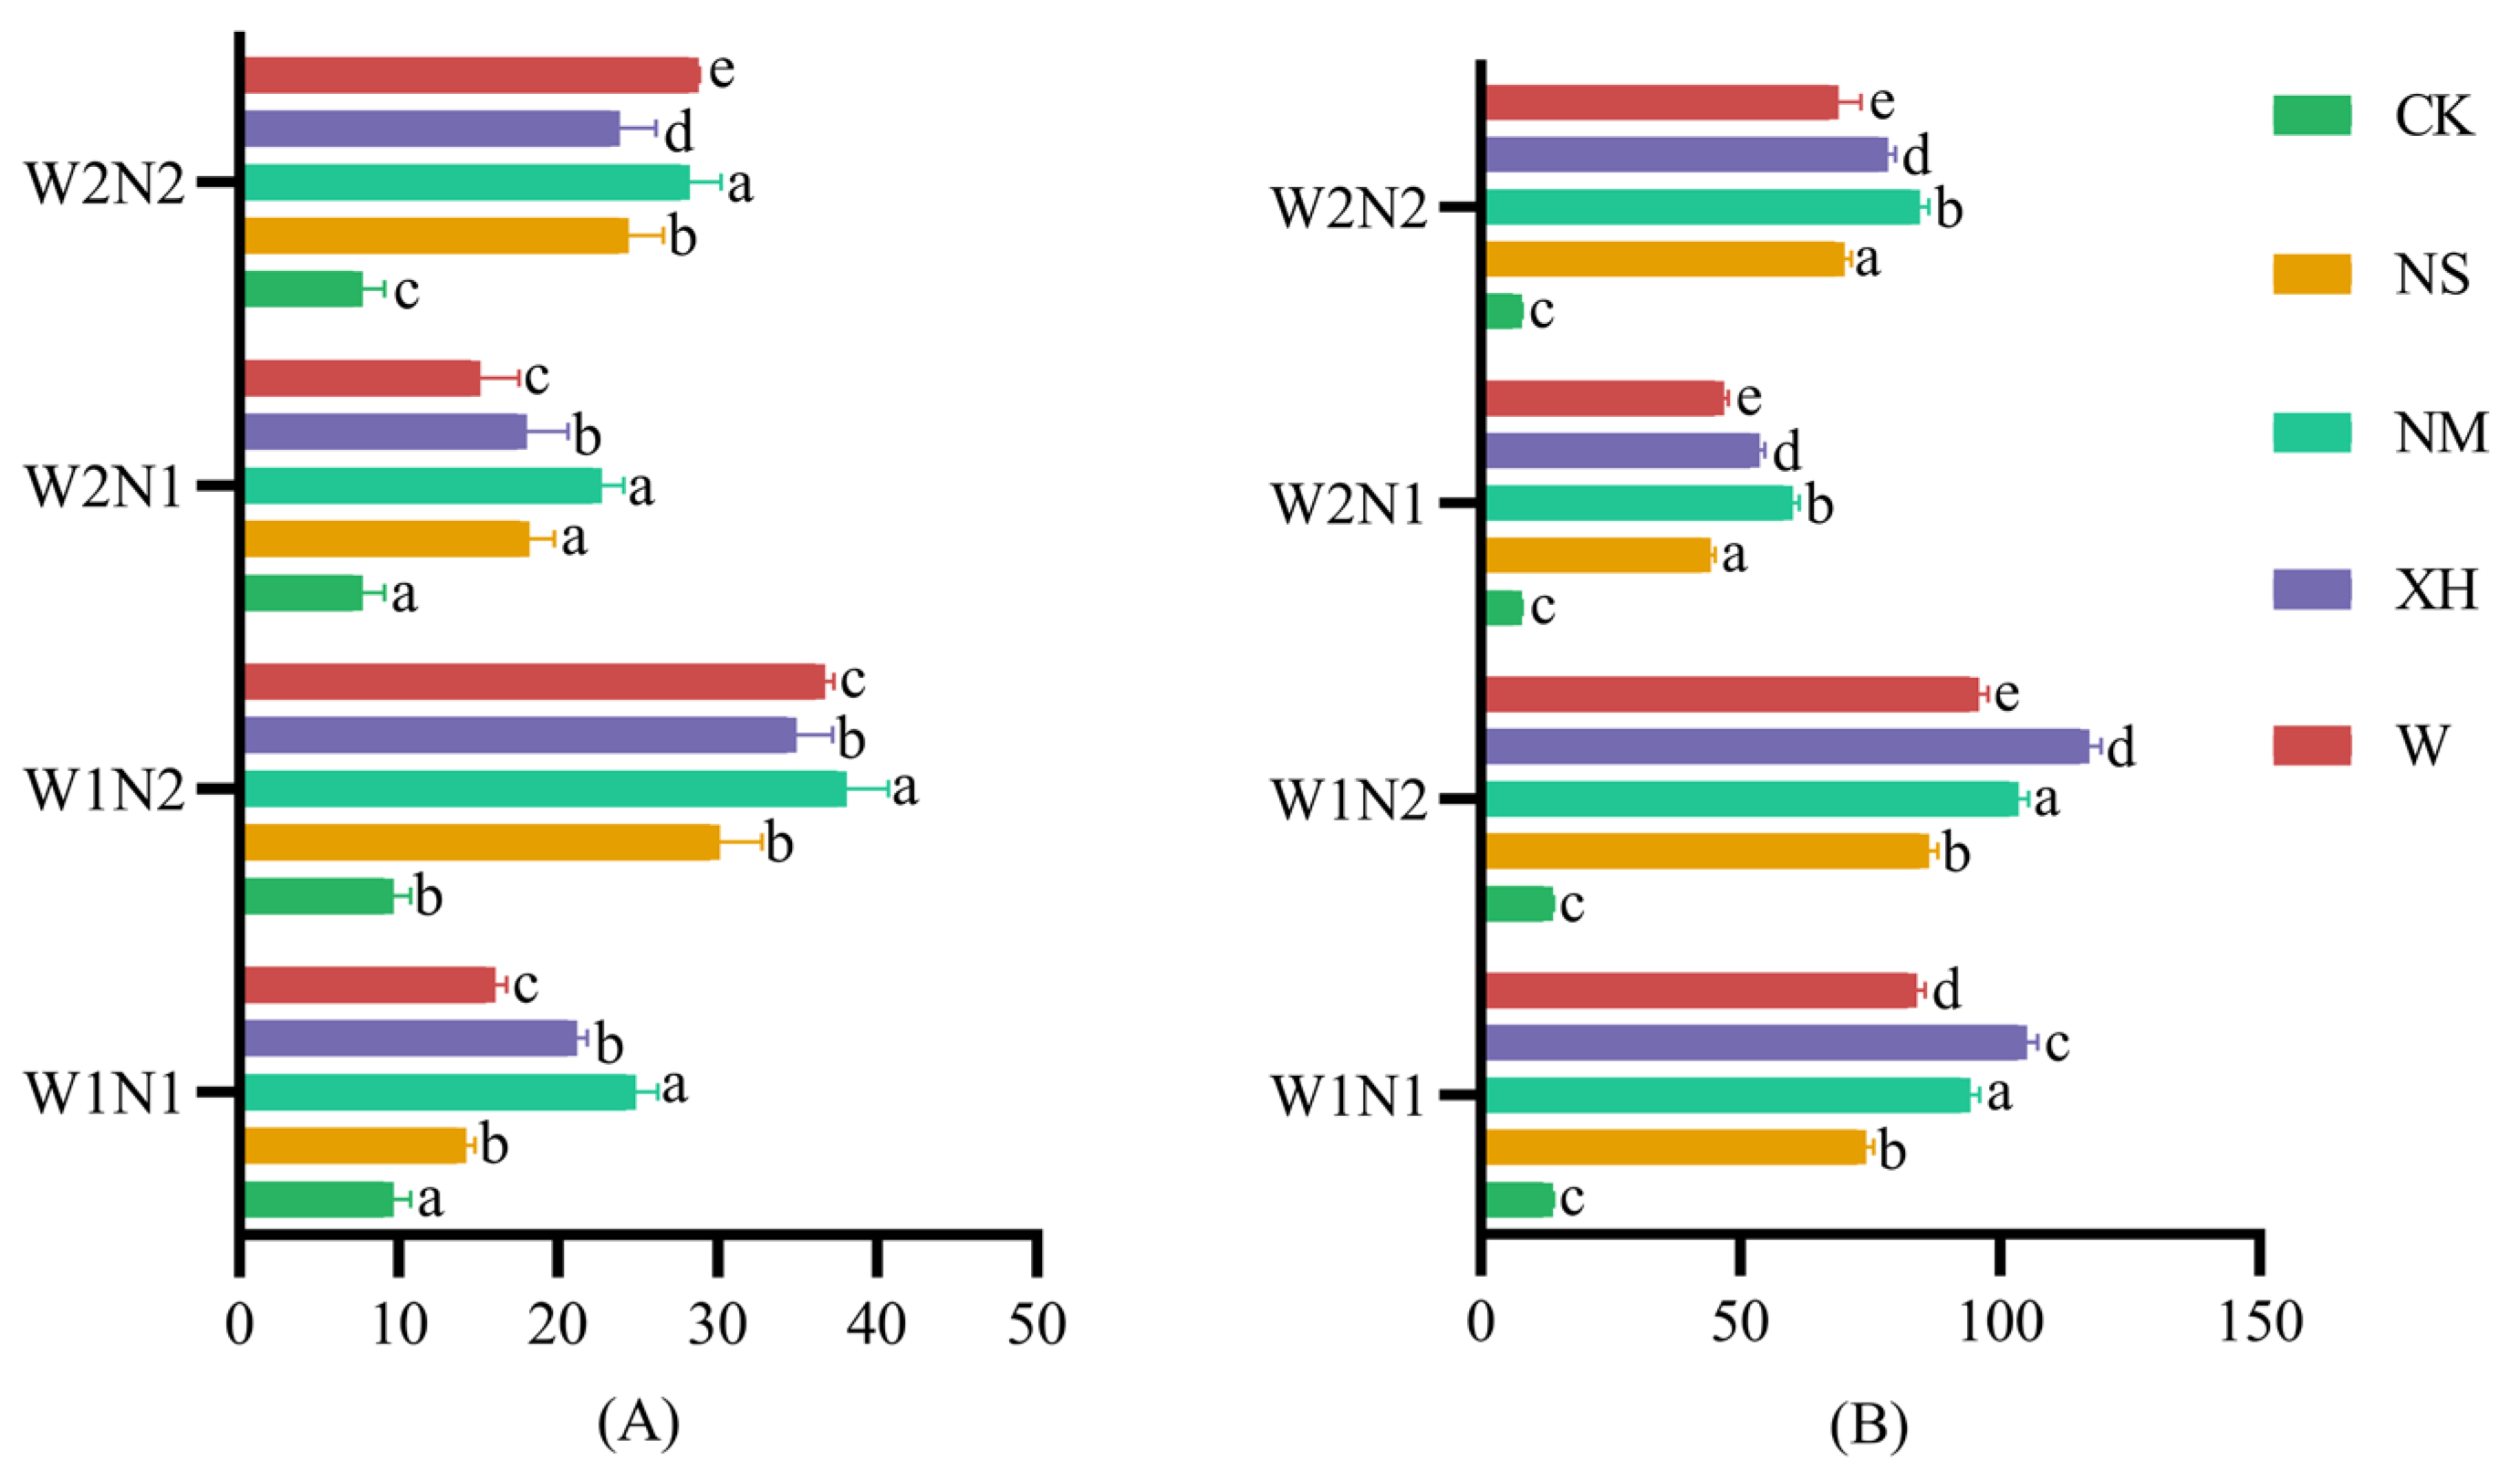
Soil Nitrate N (NO3-N) Content demonstrates that 75%FC exhibited an average 20.22% increase compared to 45%FC (Figure 4A). NAR effects were more pronounced, with N2 demonstrating 64.55% higher NO3-N content compared to N1, indicating that adequate N supply constitutes a critical factor for NO3-N formation. Among different EENF treatments, W demonstrated the most pronounced effects, with W1N2-NM treatment reaching 38.05 mg kg−1, representing a 26.45% increase compared to the control. Under adequate moisture conditions, NM, XH, and W treatments demonstrated NO3-N content increases of 26.45% to 75.24%, 8.46% to 16.02%, and 12.83% to 21.9%, respectively. Ammonium N (NH4+-N) indicates that NH4+-N exhibits greater sensitivity to moisture conditions (Figure 4B), with adequate moisture conditions demonstrating 50.85% higher content compared to drought conditions. XH demonstrated optimal performance in NH4+-N regulation, with W1N2-XH treatment reaching 117.18 mg kg−1, representing a 35.76% increase. EENFs demonstrated significant promotional effects under adequate moisture conditions: NM, XH, and W treatments exhibited increases of 27.01% to 35.76%, 31.50% to 41.84%, and 11.03% to 13.17%, respectively.

3.2.2. Response of Cumulative AV

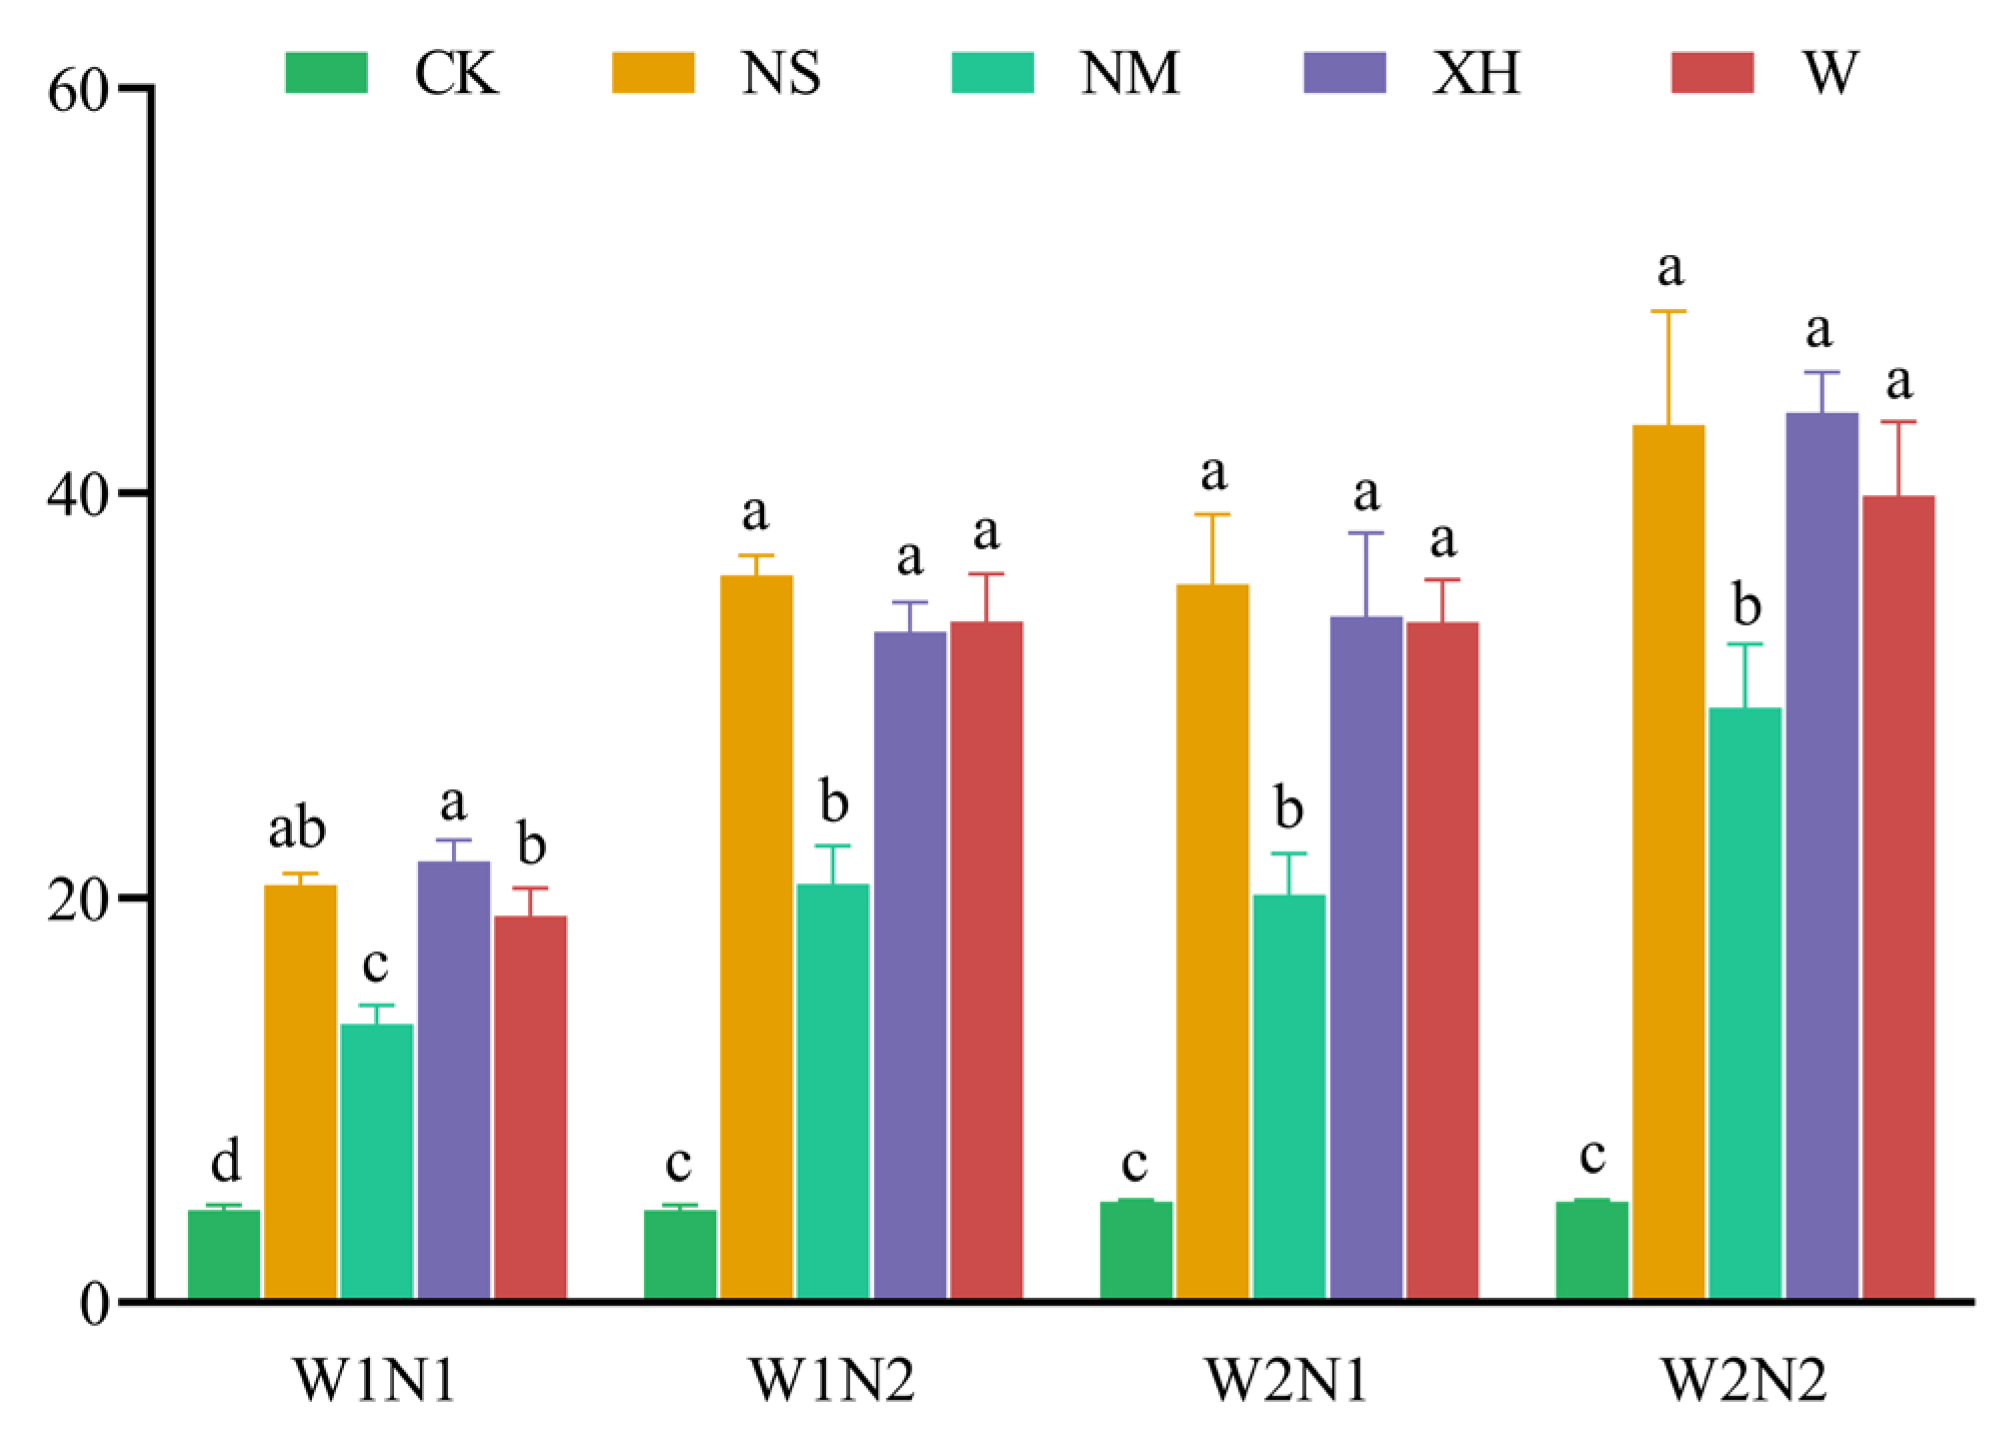
Under W1 conditions, cumulative ammonia volatilization ranged from 13.76 to 35.94 kg N ha−1 across all treatments (Figure 5). The hierarchical ranking was established as follows: N2NS (35.94) > N2W (33.66) > N2XH (33.16) > N1XH (21.81) > N2NM (20.69) > N1NS (20.62) > N1W (19.10) > N1NM (13.76) > CK (4.56 kg N ha−1). Under W2 conditions, cumulative ammonia volatilization exhibited elevated ranges from 25.14 to 43.38 kg N ha−1. The treatment hierarchy was characterized as N2NS (43.38) > N2XH (43.40) > N2W (39.89) > N1NS (35.49) > N1W (33.63) > N1XH (33.91) > N2NM (29.40) > N1NM (25.14) > CK (4.96 kg N ha−1).

3.3. Effects of Water–N Coupling Combined with EENFs on Soil Microbial Community Structure

3.3.1. Effects of Water–N Coupling Combined with EENFS on Microbial α-Diversity

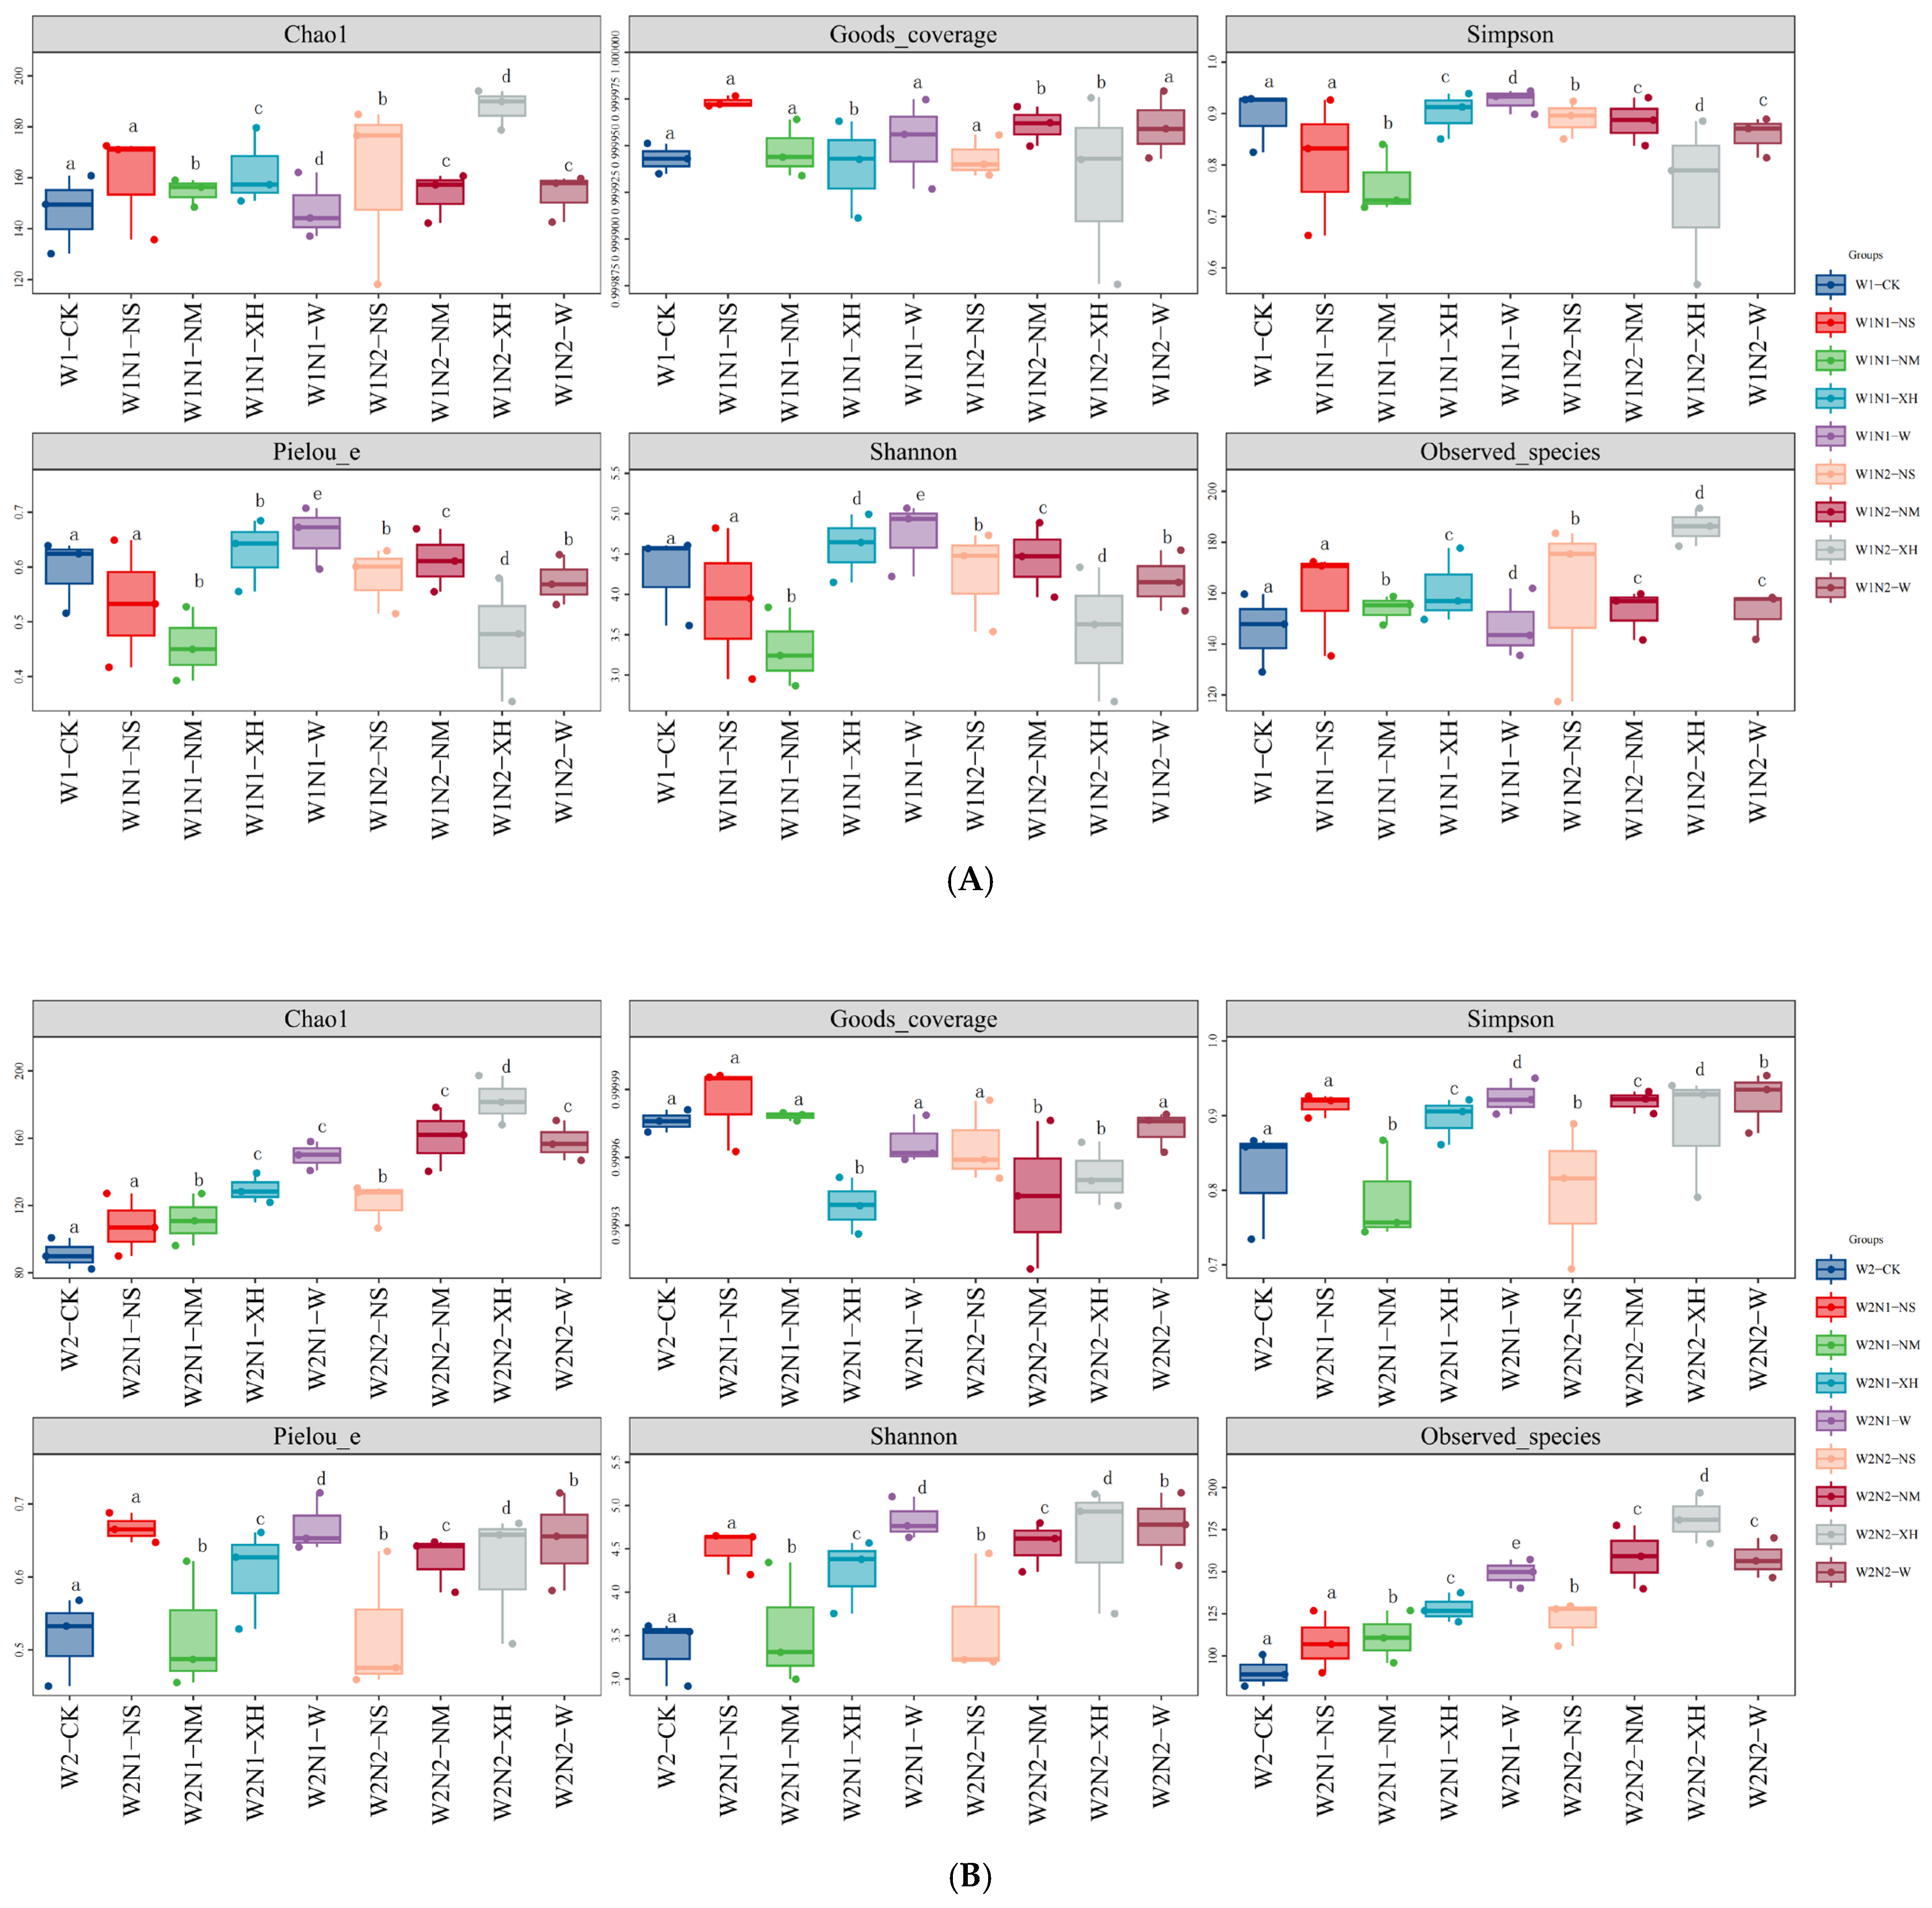
Under 75%FC conditions (Figure 6A), XH treatment exhibited optimal performance for bacterial α-diversity indices across both N application levels. At N1 level, XH treatment significantly enhanced the Chao1, Faith’s PD, Pielou_e, and Shannon indices by 13.43%, 5.15%, 1.11%, and 1.74%, respectively (p < 0.05). Under N2 conditions, the promoting effects of XH treatment remained pronounced, with respective increases of 10.88%, 4.42%, and 1.93% (p < 0.01), while NM treatment showed secondary effectiveness. The efficacy of W treatment was diminished under high N conditions. Under water stress conditions (45%FC, Figure 6B), moisture limitation significantly amplified the promotional effects of EENFs. The superiority of XH treatment became more pronounced, with diversity indices increasing by 13.15–6.63% at N1 level and further enhanced to 20.13–18.96% at N2 level.
Fungal communities exhibited heightened sensitivity to different treatments under 75%FC conditions (Figure 7A). At the N1 level, XH treatment significantly enhanced most diversity indices (28.03–25.21%), while W treatment demonstrated superior effects on specific indices (Pielou_e and Shannon indices increased by 36.96% and 29.86%, respectively). Under N2 conditions, NM and XH treatments showed comparable effectiveness, with diversity indices increasing by 12.46–22.28%. Under 45%FC (Figure 7B), fungal community responses exhibited distinct treatment-specific patterns. At the N1 level, W treatment demonstrated outstanding performance (Chao1 and Shannon indices increased by 38.47% and 30.89%, respectively), while under N2 conditions, XH treatment showed clear advantages (Chao1, Observed_species, and Shannon indices increased by 51.23%, 36.78%, and 15.15%, respectively).

3.3.2. Effects of Water–N Coupling Combined with EENFs on Abundance of Soil Bacterial and Fungal Microbial Communities

Under 75%FC (Figure S2A), XH treatment exhibited optimal performance across both N application levels, achieving 5030 and correspondingly elevated ASV numbers at N1 and N2 levels, respectively, representing increases of 12.24–17.79% relative to control groups. NM and W treatments also demonstrated promotional effects, with enhancement magnitudes ranging from 3.86% to 7.21%. Notably, the mean bacterial ASV abundance at the N1 level (4479 ASVs) exceeded that at the N2 level (4268 ASVs), indicating that moderate NAR are more conducive to bacterial community diversification. Under 45%FC, the promotional effects of all treatments were significantly intensified (Figure S2B). XH treatment achieved 4099 and 4418 ASVs at N1 and N2 levels, respectively, with enhancement magnitudes reaching 33.88–37.5%, substantially exceeding those observed under adequate moisture conditions. The efficacy of NM and W treatments was similarly enhanced, with increases of 33.71% and 34.95% at the N1 level, respectively. These findings indicate that under water stress conditions, EENFs demonstrate more pronounced regulatory capacity over bacterial communities. Fungal communities exhibited relatively moderate responses under 75%FC conditions (Figure S3A). XH treatment demonstrated optimal effectiveness at the N2 level (160 ASVs, 26.98% increase), while XH and W treatments showed equivalent optimal performance at the N1 level (138 ASVs, 14.05% increase). The overall treatment efficacy ranking was XH > NM > W > NS > CK. Under 45% FC, fungal community response patterns underwent significant alterations (Figure S3B). W treatment exhibited superior performance, achieving 135 and 162 ASVs at N1 and N2 levels, respectively, with enhancement magnitudes of 43.62% and 68.75%, substantially exceeding those under adequate moisture conditions. This transformation reflects the unique promotional effects of urease inhibitors on fungal communities under water stress conditions.

3.3.3. Effects of Water–N Coupling Combined with EENFs on Microbial β-Diversity

Principal coordinate analysis (PCoA) based on Bray–Curtis distances revealed distinct clustering patterns of treatments under both moisture regimes (Figure S4). Under 75% FC, PC1 and PC2 axes explained 55.8% and 27.6% of the variation, respectively. Treatments exhibited clear spatial differentiation, with NS clustering in the third quadrant, XH and W in the second quadrant, and NM near the Y-axis origin. Under 45% FC, the explained variation decreased to 50.6% and 24.4%, respectively, with reorganization of treatment positions. The complete PERMANOVA model (Water × N rate × Fertilizer) explained 61.1% (pseudo-F4,40 = 3.53, p = 0.001) and 66.2% (pseudo-F4,40 = 4.40, p = 0.001) of the variance under 75% and 45% FC, respectively, driven by the Water × Fertilizer interaction (R2 = 0.31, p = 0.001 and R2 = 0.34, p = 0.018) (n = 3). Post hoc pairwise comparisons (Tukey’s HSD, α = 0.05) were conducted to assess significant differences among treatments. Complete PERMANOVA results are provided in Supplementary Table S3.
Equivalent models for fungal communities (Figure S5) showed that under 75%FC, PC1 and PC2 axes explained 37.4% and 20.6% of the variation, respectively. Under 45% FC, the explained variation was 36.2%. The complete PERMANOVA model explained 73.0% (pseudo-F4,40 = 6.39, p = 0.001) and 65.9% (pseudo-F4,40 = 4.36, p = 0.001) of the variance under 75% and 45%FC, respectively, driven by N × Fertilizer (R2 = 0.30, p = 0.043) and Water × Fertilizer (R2 = 0.32, p = 0.027) interactions. Sample size and post hoc comparisons as in bacterial communities.

3.3.4. Effects of Water–N Coupling Combined with EENFs on the Community Structure at the Phylum Level of Soil Microorganisms

In bacterial community phylum-level distribution, Proteobacteria, Actinobacteriota, and Gemmatimonadota dominated under both moisture conditions, yet their response patterns exhibited significant differences. Under 75%FC (Figure S6A), high N levels (N2) promoted enhanced abundance of Proteobacteria and Actinobacteriota, with mean abundances reaching 31.21% and 21.47%, respectively, representing increases of 4.62% and 1.82% compared to N1 levels. EENFs demonstrated pronounced promotional effects on Proteobacteria, with the W treatment achieving the highest enhancement of 5.31%. Gemmatimonadota exhibited an opposite trend, with mean abundance under N2 levels (21.47%) exceeding that under N1 (19.21%). Under 45%FC (Figure S6B), the N response patterns of Proteobacteria and Actinobacteriota remained essentially consistent, albeit with greater enhancement magnitudes. Under N2 levels, mean abundances of Proteobacteria and Actinobacteriota reached 28.93% and 22.39%, respectively, representing increases of 3.5% and 4.42% compared to N1 levels. Notably, the response of Gemmatimonadota underwent reversal, with abundance under N1 levels (20.14%) exceeding that under N2 (16.74%), reflecting a decrease of 3.4%.
In fungal community phylum-level distribution, Ascomycota maintained absolute dominance under both moisture conditions, yet demonstrated distinctly different N response patterns. Under 75%FC (Figure S7A), high N levels significantly promoted Ascomycota abundance, with mean abundance under N2 levels (89.68%) exceeding that under N1 (79.25%) by 10.43%. EENFs demonstrated superior effects under N2 levels, with NM, XH, and W treatments achieving Ascomycota abundances of 92.6%, 93.95%, and 92.43%, respectively. Under 45%FC (Figure S7B), N effects underwent reversal. Mean Ascomycota abundance under N1 levels (93.51%) exceeded that under N2 (90.41%) by 3.1%. Rozellomycota emerged as the second major group, achieving the highest abundance (25.71%) in control groups.

3.4. RDA-Based Dissection of Environmental Drivers Shaping Soil Microbial Communities Under Differential Water–N Management Strategies

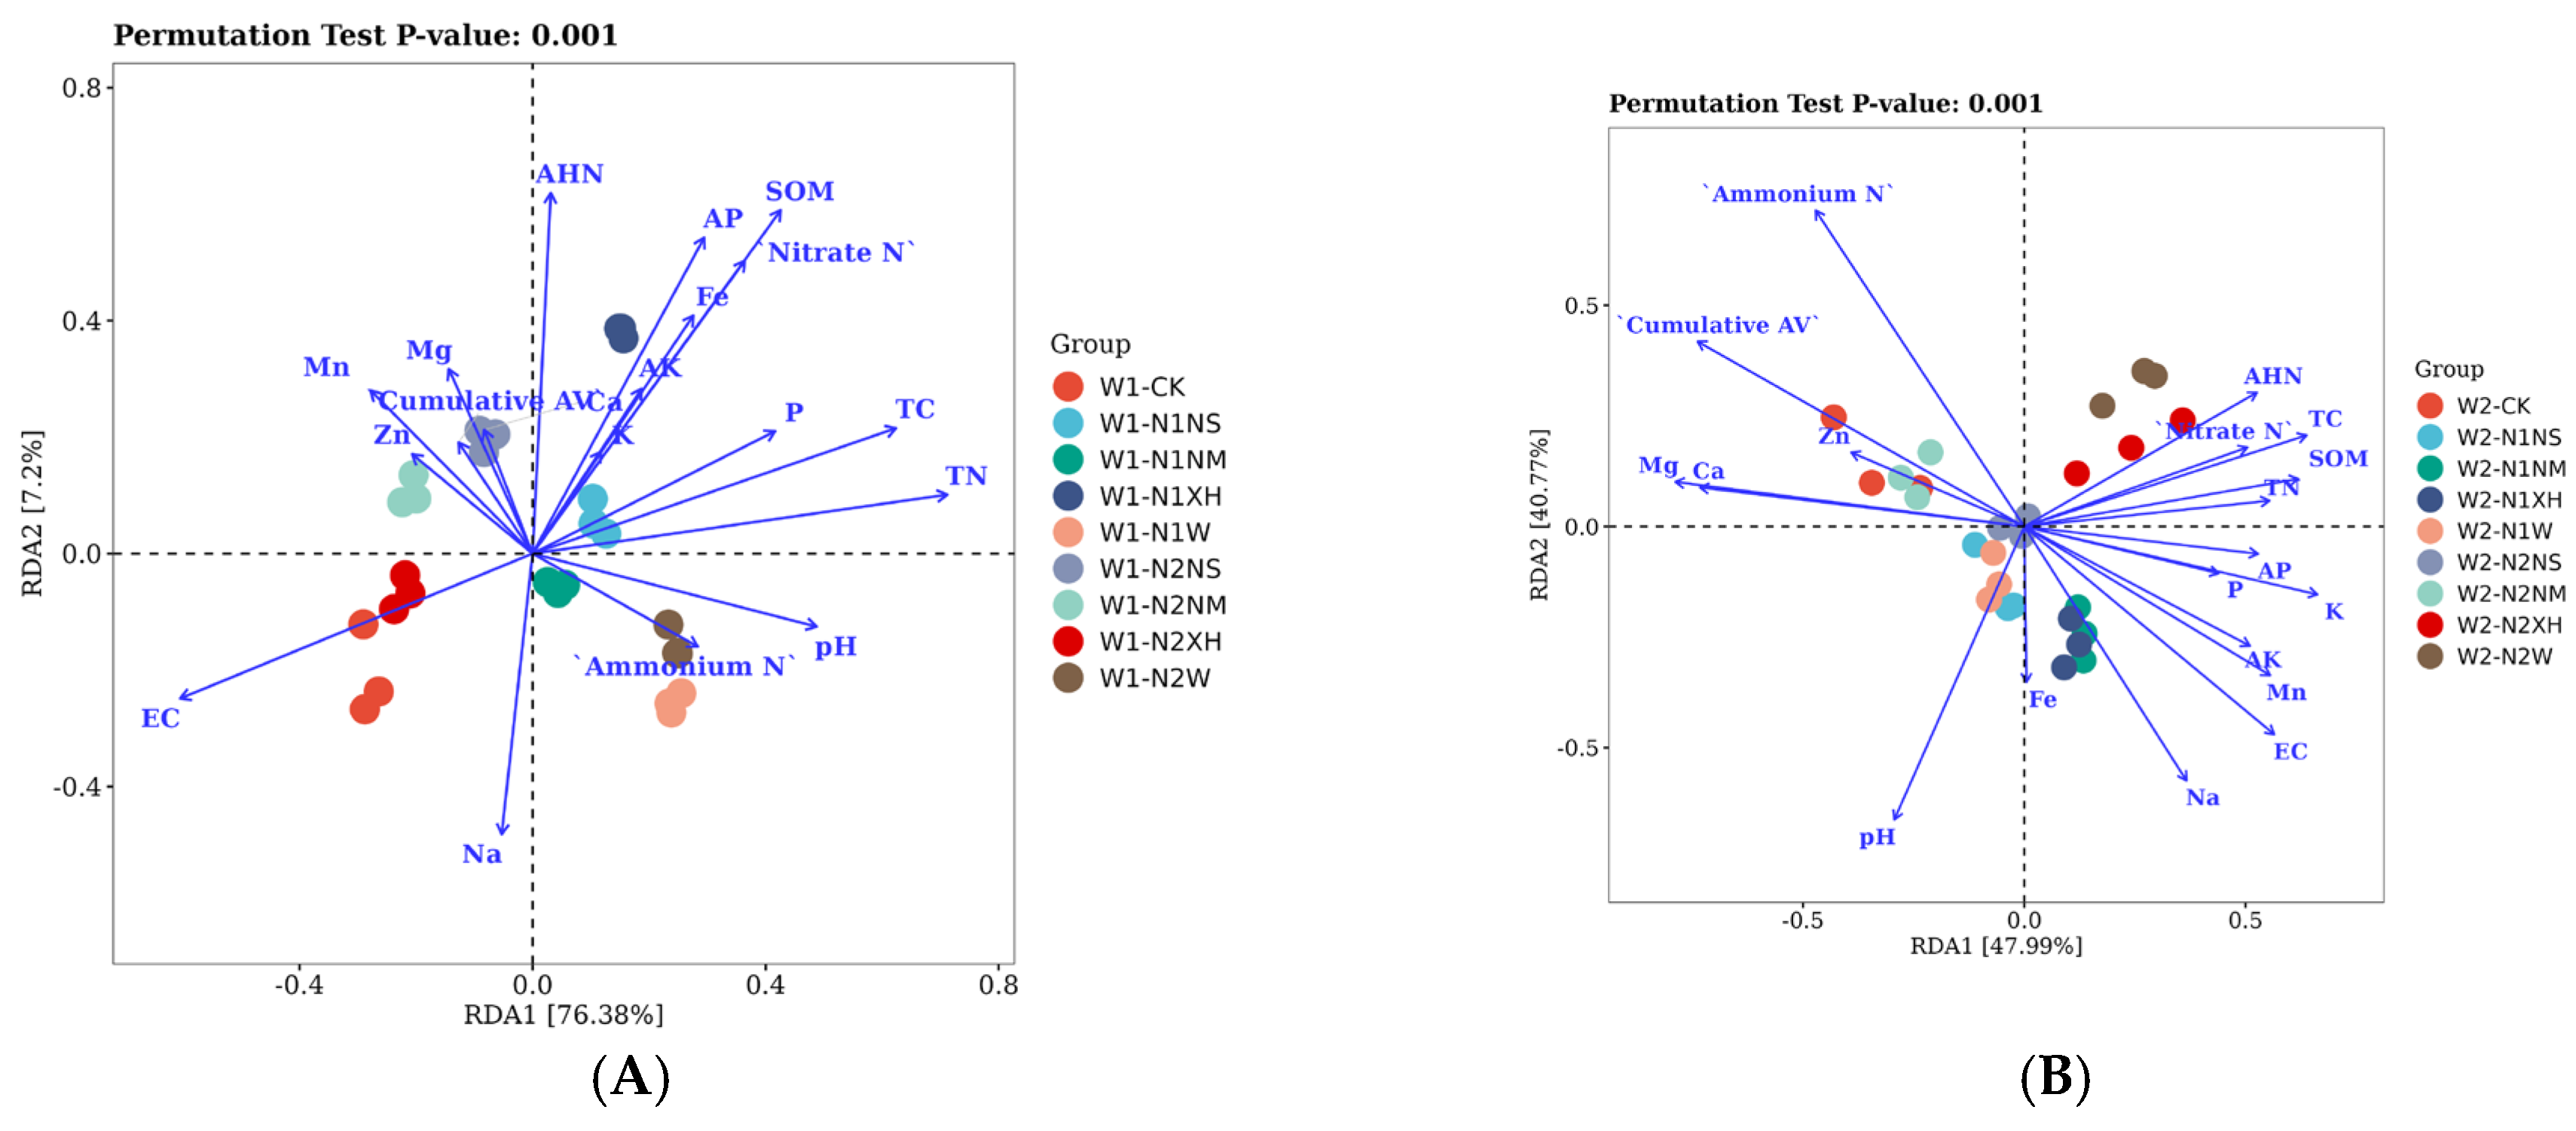
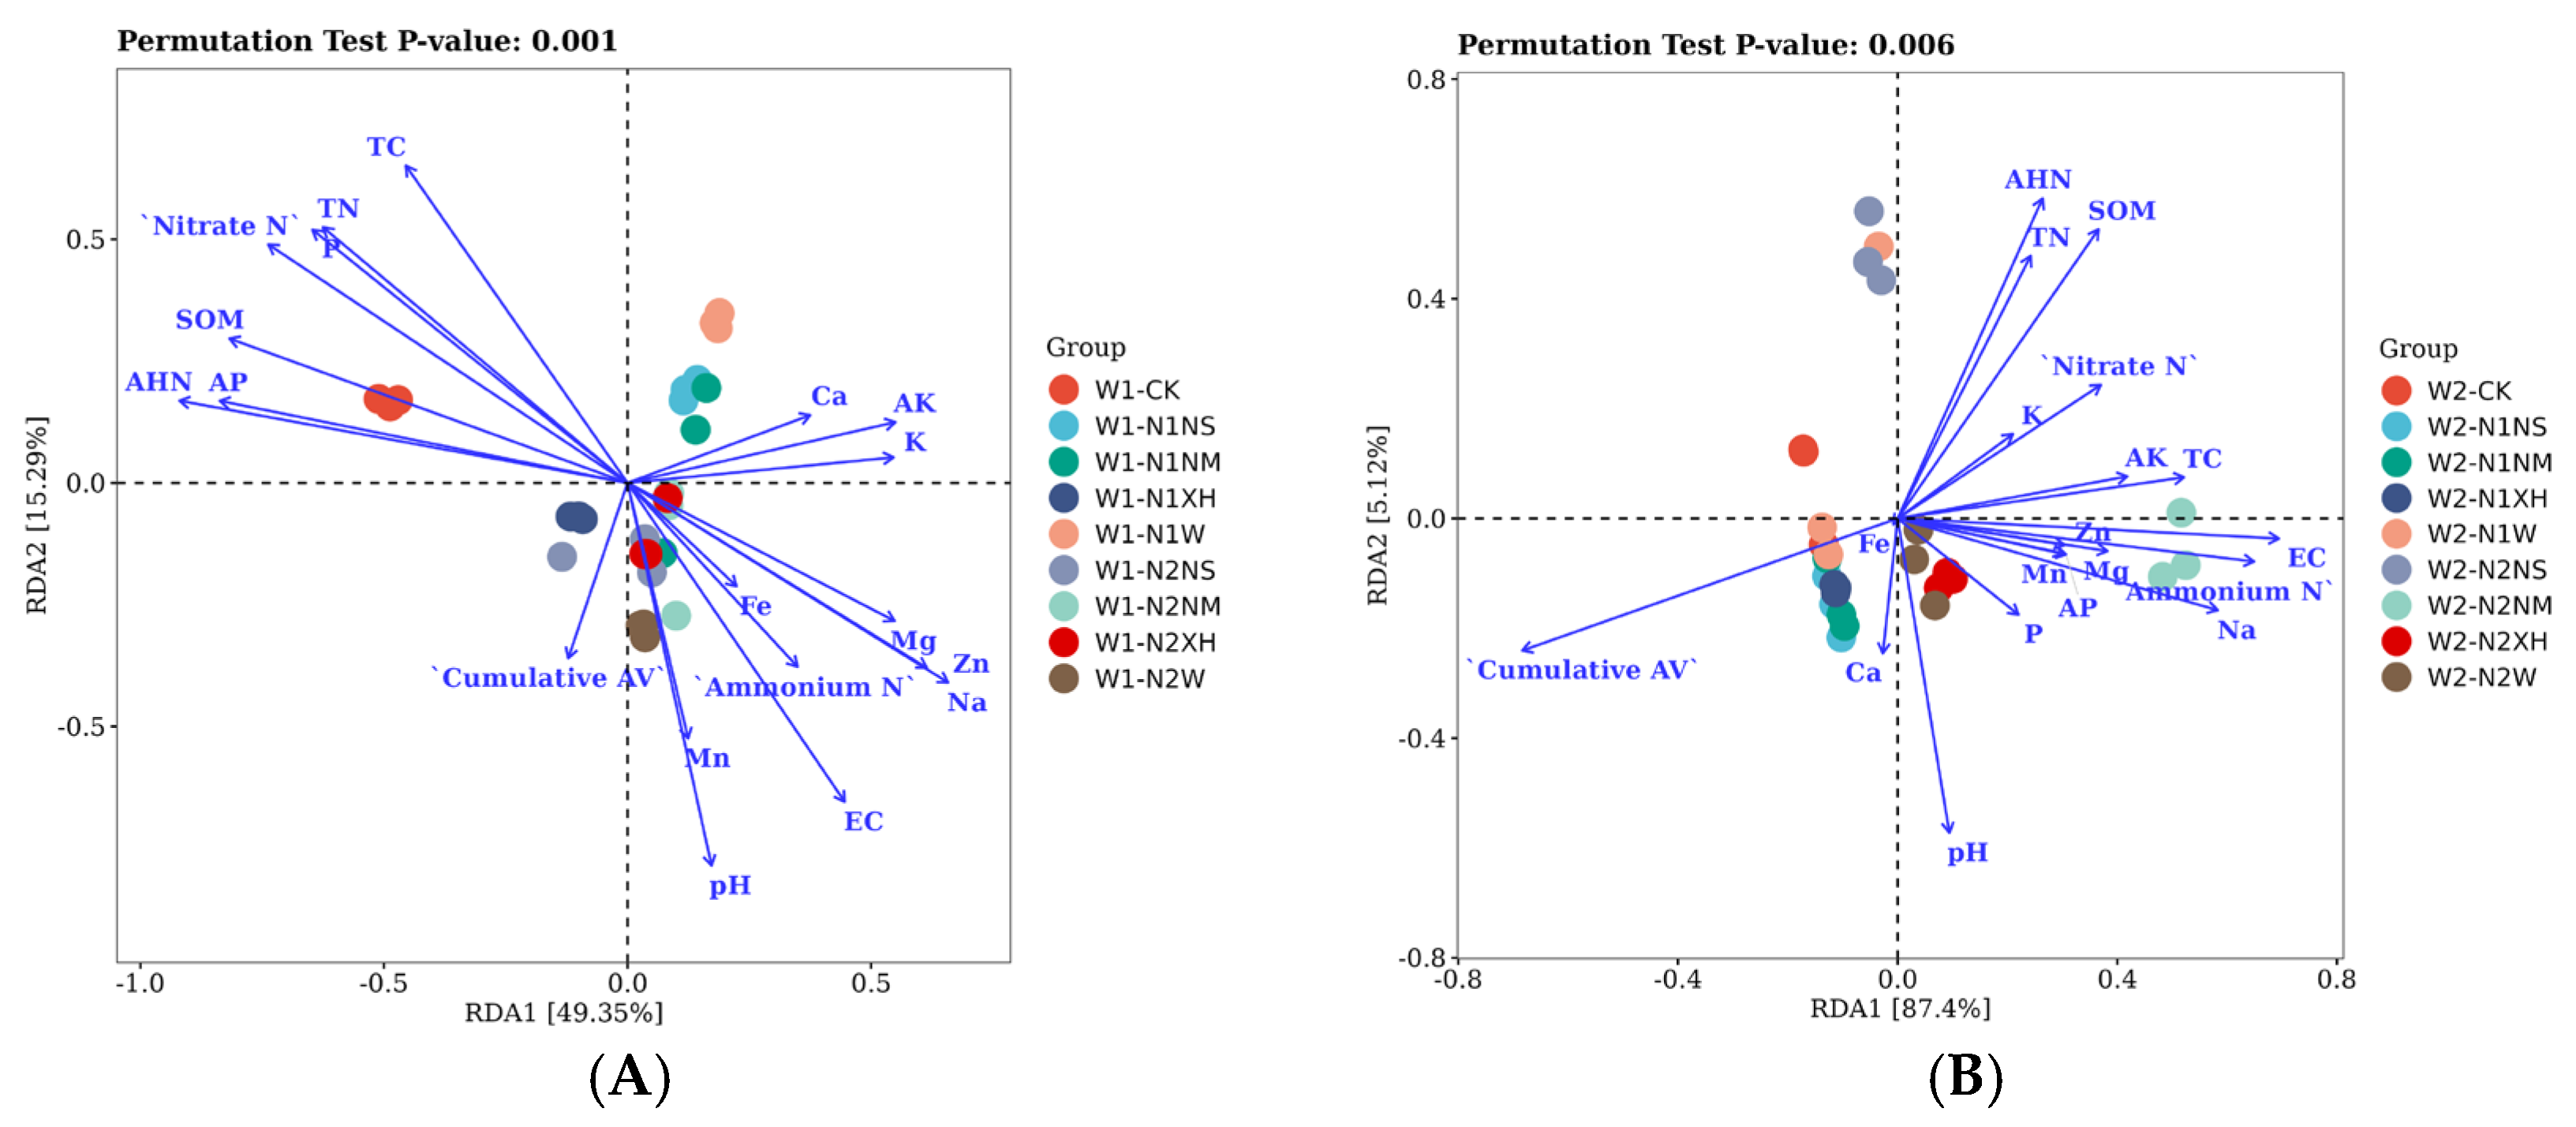
RDA permutation tests further quantified the contributions of environmental factors. Under 75%FC, bacterial communities exhibited an environmental explanatory power of 79.19% (Figure 8A), whereas under 45%FC, the environmental explanatory power reached 88.76% (Figure 8B). The explanatory variance for fungal communities demonstrated more pronounced differences, increasing from 64.64% to 92.52%, indicating that water stress intensified the deterministic role of environmental factors in microbial community assembly (Figure 9A,B). Concurrently, bacterial and fungal communities exhibited significantly differentiated response characteristics to environmental gradients. Under 75%FC conditions, SOM, TN, AP, AK, and micronutrients (Fe, Zn, Mn, Mg) constituted the primary positive driving factors for bacterial community distribution, while positive factors for fungal communities concentrated on carbon-N nutritional elements (SOM, TN, alkaline N, nitrate N). Under 45%FC, the importance of carbon-N factors (SOM, TN, TC, alkaline N) for bacterial communities increased, with micronutrients shifting to negative regulatory effects. The nutritional factor-driven effects for fungal communities were further strengthened. The distribution patterns of different N treatments in RDA ordination space revealed the regulatory mechanisms of N management on microbial communities. High N treatment groups (N2) tended to associate with nutrient-rich quadrants, whereas low N treatment groups (N1) were more influenced by physicochemical stress factors.

3.5. Correlation Analyses Between Soil Physicochemical Properties and the Community Structures of Bacterial and Fungal Assemblages

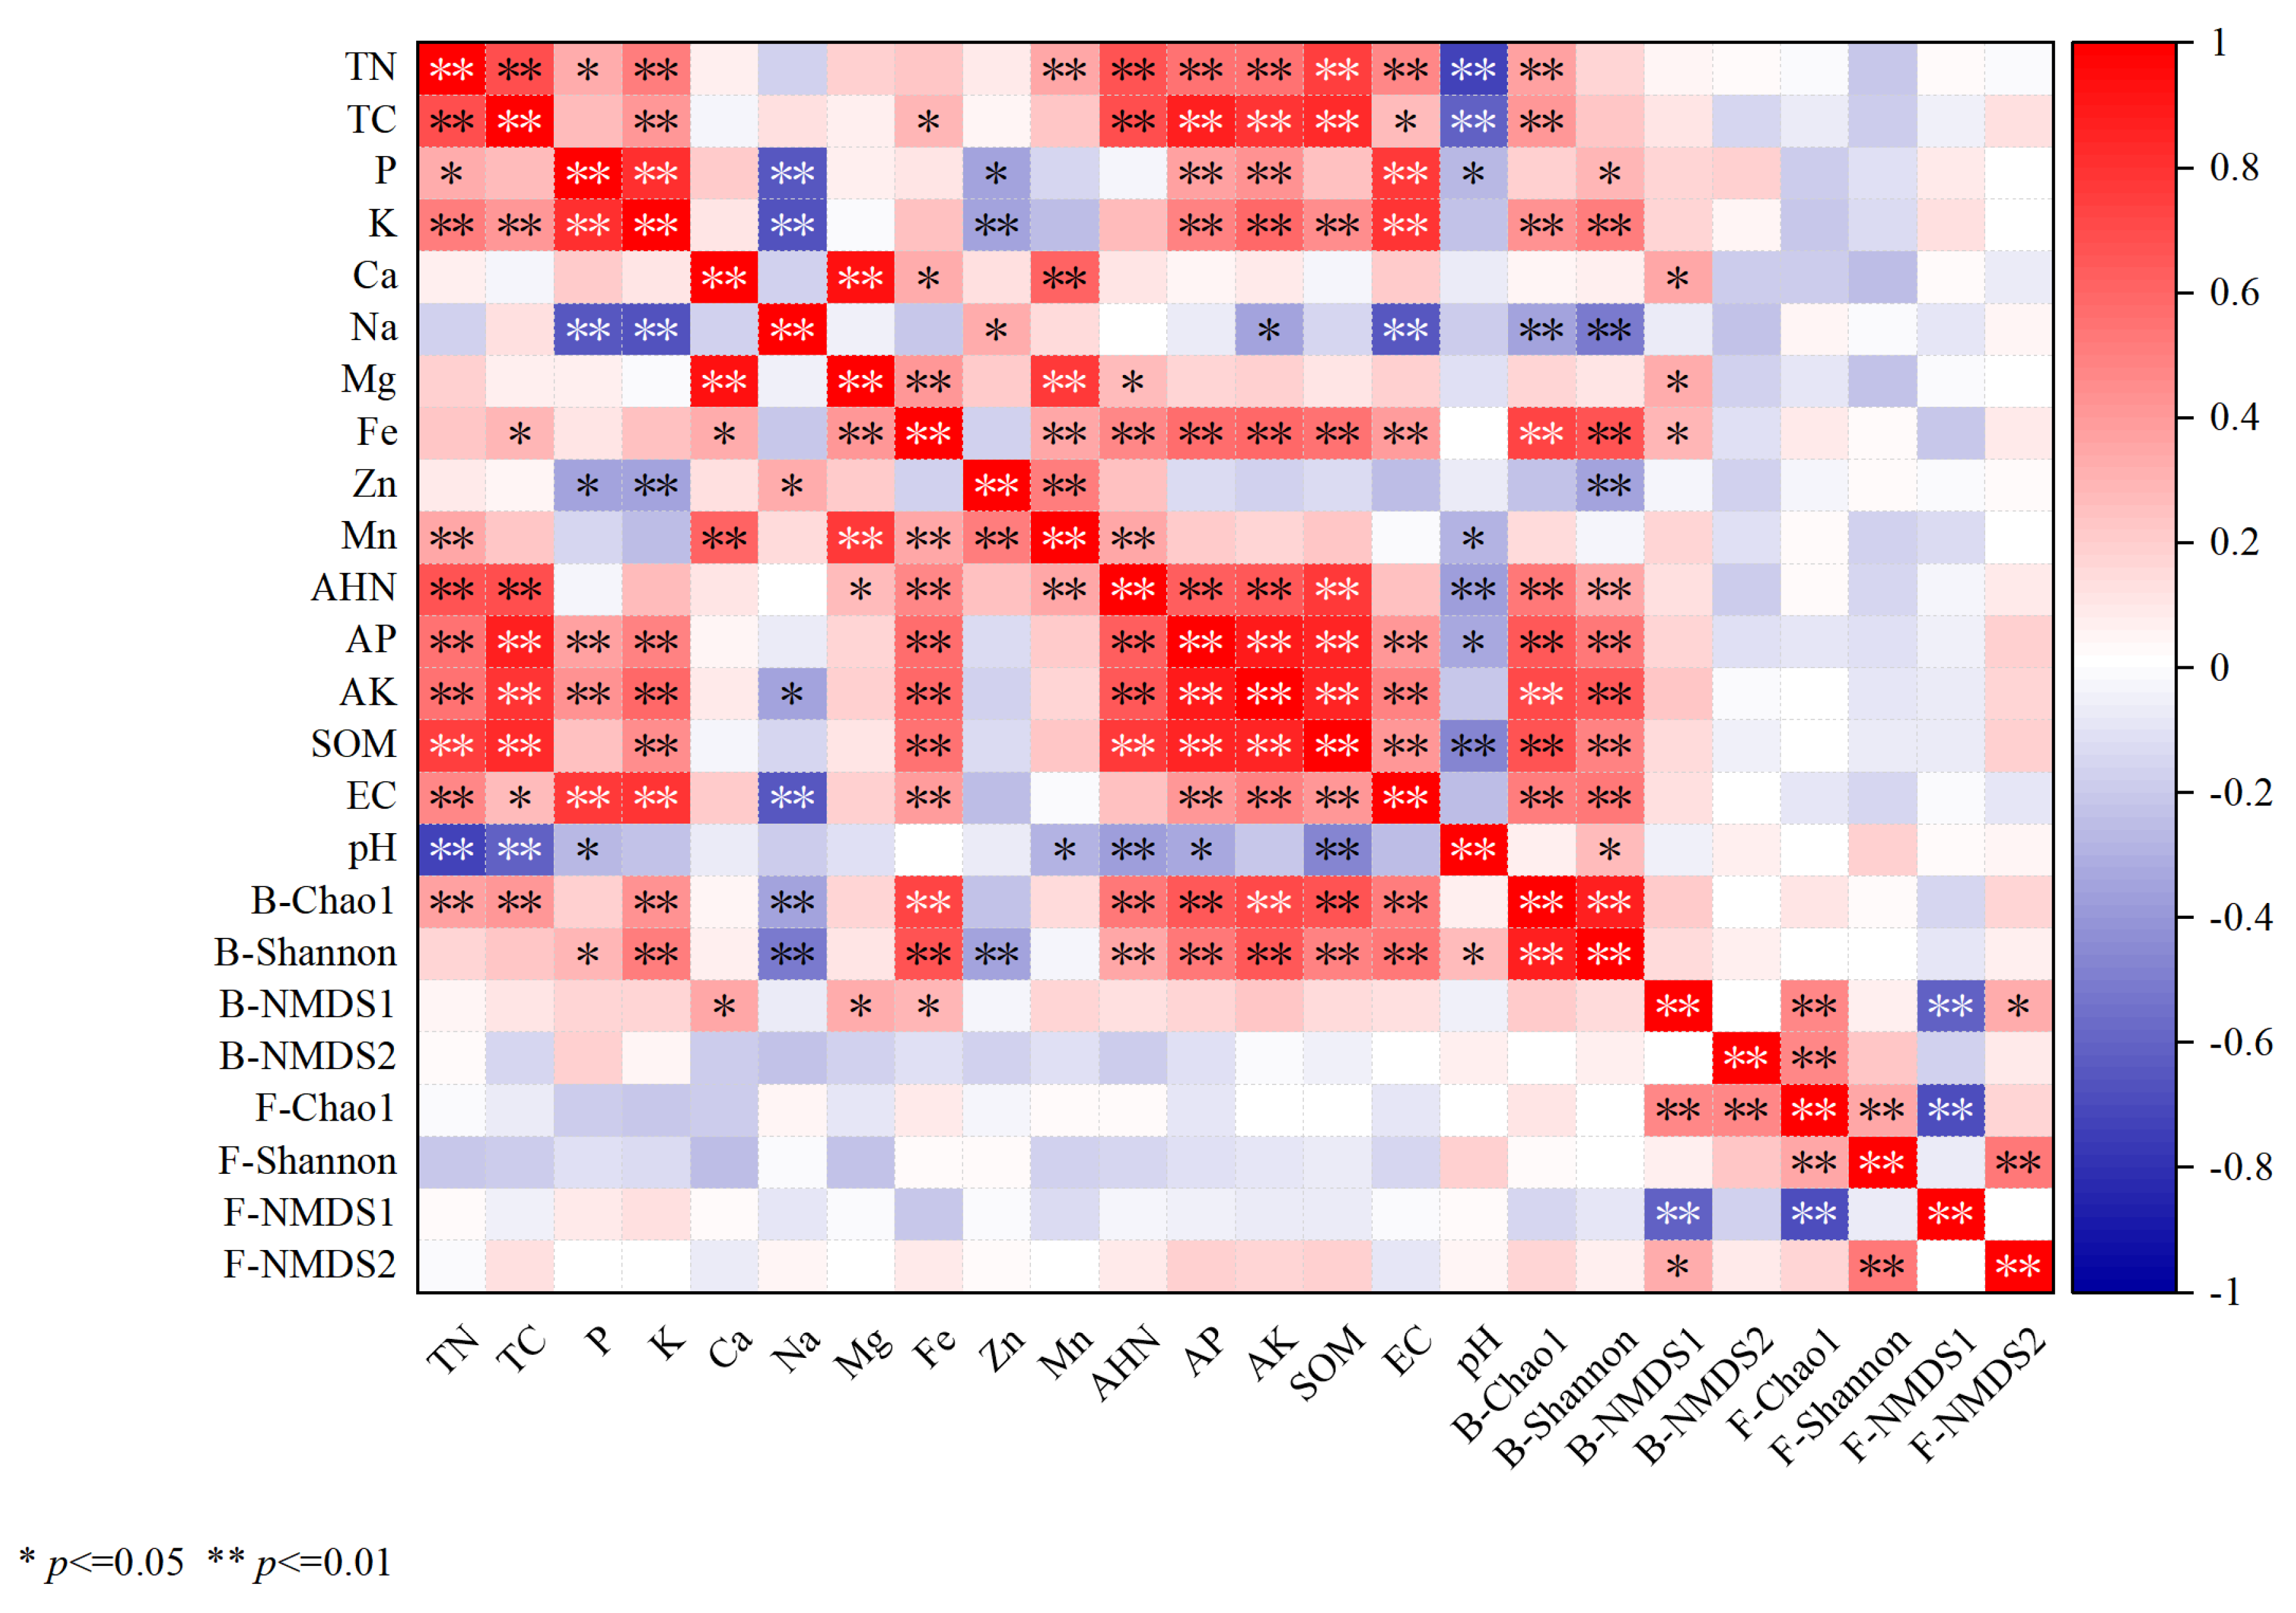
The bacterial Chao1 index displayed a highly significant positive correlation (p ≤ 0.01), while K and P demonstrated positive correlations with the Shannon index (Figure 10). Soil calcium content exhibited a significant positive correlation with the bacterial NMDS1 index (p ≤ 0.05). Conversely, soil sodium content demonstrated highly significant negative correlations with both bacterial Chao1 and Shannon indices (p ≤ 0.01), whereas iron content exhibited highly significant positive correlations with these parameters (p ≤ 0.01). Regarding soil nutrient dynamics, alkaline N, AK, AP, SOM, and EC demonstrated significant positive correlations with bacterial Chao1 and Shannon indices (p ≤ 0.05). In contrast, fungal community parameters demonstrated distinct response patterns. Soil elemental content and available nutrients exerted no significant effects on fungal Chao1, Shannon, NMDS1, or NMDS2 indices. Notably, bacterial NMDS1 and fungal NMDS1 indices exhibited highly significant negative correlations (p ≤ 0.01). Furthermore, the fungal Chao1 index demonstrated highly significant negative correlations with the fungal NMDS1 index (p ≤ 0.01) while maintaining highly significant positive correlations with the fungal Shannon index (p ≤ 0.01).

4. Discussion

4.1. The Interactive Effects of Moisture and N on Soil Physicochemical Properties

In semi-arid ecosystems, water availability—not N—governs soil physicochemical properties. At 75%FC, soil responsiveness to N fertilization increased, enhancing SOM, TN, TC, and available nutrients [41]. Adequate moisture directly stimulated root growth and activity of Z. jujuba, increasing root exudates and litter inputs, while simultaneously fostering microbial decomposition and mineralization that accelerated organic-matter turnover and nutrient release [42,43]. The combined W1N2 treatment illustrates the positive plant–microbial feedback generated by high moisture and high N. In contrast, 45%FC suppressed nutrient accumulation in all treatments and reversed the benefits of high N for some indices. Under 45% FC, alkaline N was higher under low-N than high-N inputs, likely due to drought-restricted nitrification and N fixation. High N rates, especially in surface soils subject to intense evaporation, increased salinity (elevated EC), and osmotic stress, thereby suppressing microbial activity and N assimilation [44]. Drought-induced pH increases were associated with salt-ion accumulation and diminished organic-acid production, thereby reducing P availability [45]. XH retained the most N at 75%FC and high N (W1N2-XH), yielding the highest TN. This reflects XH’s inhibition of ammonia oxidation, which limits NO3 formation and subsequent N2O emissions and leaching, thereby enhancing soil N retention [46]. The microbial fertilizer (W) markedly increased TC, SOM, AP, and AK—especially under W1N2—by introducing diazotrophs and P- and K-solubilizing bacteria [47]. This is attributed to the introduced specific functional microorganisms (such as N-fixing bacteria, phosphorus-solubilizing bacteria, and potassium-solubilizing bacteria) or their metabolic products, which can directly or indirectly enhance soil carbon fixation capacity, decompose complex organic matter, and activate fixed phosphorus-potassium elements in soil [48]. The urease inhibitor (NM) demonstrated superior environmental adaptability, particularly maintaining relatively effective performance for alkaline N and available nutrients under water stress. This may be attributed to its mechanism of delaying urea hydrolysis rates, achieving a “slow-release” N supply that better matches the gradual nutrient requirements of plants under drought conditions, reducing volatilization losses, and reducing potential microbial toxicity from instantaneous high-concentration NH4+ [49]. These findings align with recent research results in other dryland crop systems, indicating that EENF application strategies must be closely integrated with regional water management practices [50,51].

4.2. The Interactive Effects of Moisture and N on Microbial Community Structure

Soil microbial communities serve as critical linkages connecting nutrient cycling with soil health, exhibiting heightened sensitivity to environmental changes [52]. Under 45%FC conditions, XH treatments enhanced bacterial ASV abundance by 33.88–37.5%, substantially exceeding the 12.24–17.79% increases observed under adequate moisture conditions. This phenomenon aligns closely with the meta-analysis results of global arid ecosystems reported by Delgado-Baquerizo et al. (2023) [53]. Furthermore, W2 significantly enriched Proteobacteria and Actinobacteriota, whereas adequate moisture (W1) favored the proliferation of Acidobacteriota and Gemmatimonadota. These results correspond to the microbial-level manifestation of the “r/K selection theory” in macroecology [54]. Proteobacteria and Actinobacteriota are typically regarded as copiotrophic or stress-tolerant taxa, characterized by metabolic flexibility, capacity to utilize diverse carbon sources, and ability to rapidly proliferate or form dormant structures (such as actinobacterial spores) under environments with fluctuating moisture and nutrients, thereby conferring competitive advantages under drought stress [55]. Conversely, Acidobacteriota are generally considered oligotrophic K-strategists, preferring relatively stable, low-nutrient, and slightly acidic environments. Adequate moisture enhances soil microenvironmental stability and potentially provides specific substrates required by these organisms through promoted organic matter decomposition, thereby increasing their abundance [56]. The abundance variations of Proteobacteria, Actinobacteriota, and Gemmatimonadota across different treatments reveal reconstruction patterns of microbial community functional structure. The enhanced abundance of Proteobacteria under high N conditions primarily stems from abundant N metabolism functional genes within this phylum. Fierer et al. (2012) demonstrated through metagenomic functional annotation that Proteobacteria harbor significantly more nitrification, denitrification, and N fixation genes compared to other phyla, explaining their competitive advantages in high-N environments [57]. NAR, particularly at high levels (N2), imposed secondary selective pressure on microbial communities, primarily manifested as suppression of Acidobacteriota and Bacteroidota. Soil acidification induced by high N inputs (Figure 1A) and disrupted nutrient stoichiometric ratios constitute the primary mechanisms suppressing sensitive taxa such as Acidobacteriota, which has been confirmed in numerous N application experiments [58,59]. This analysis also reveals the differential impacts of different N fertilizer types on microbial communities. For instance, microbial N fertilizer treatment potentially alters community composition directly through the introduction of exogenous beneficial bacteria or stimulation of indigenous functional microbial groups, subsequently affecting their functional performance in carbon, P, and K cycling. XH indirectly modifies N cycling pathways by suppressing specific functional groups (ammonia-oxidizing bacteria/archaea), potentially triggering cascading effects among microbial communities and consequently reshaping overall community structure [60].

4.3. Key Roles of Environmental Factors in Water–N–Microorganism Interactions Within Arid-Zone Z. jujuba Systems

RDA analysis reveals that the driving patterns of environmental factors on microbial community assembly reflect the coupled relationships of matter-energy-information flows in soil ecosystems. Under high FC conditions, SOM, TN, and micronutrients constitute the primary driving factors for bacterial community distribution, reflecting the resource competition patterns of microbial communities in nutrient-rich environments [61]. In contrast, the enhanced importance of carbon-N factors under water stress conditions (explanatory power increasing to 88.76%) indicates the high dependence of microbial communities on key limiting resources. The significant enhancement of environmental explanatory power further supports this theoretical framework and reveals the critical role of water–N coupling in intensifying environmental selection effects [54]. Correlation analysis corroborates these niche differentiations. Proteobacteria and Actinobacteriota correlated positively with pH and EC yet negatively with SOM and TN, reflecting adaptation to alkaline, saline, and oligotrophic conditions typical of arid soils. Conversely, Acidobacteriota and Gemmatimonadota tracked high-fertility indicators (SOM, TN, TC) and lower pH, serving as reliable bio-indicators of healthy, high-carbon ecosystems [62,63]. Microbial diversity indices (Shannon, Simpson) increased linearly with SOM and TN, supporting the paradigm that high diversity underpins multifunctionality [64]. Collectively, water–N fertilization reshapes the soil environment along moisture-salinity-nutrient axes, generating a hierarchical filter that selects for stress-tolerant or copiotrophic functional groups and ultimately governs biogeochemical processes, soil health, and productivity [65,66]. Although these patterns are internally consistent, the limited replication warrants cautious interpretation; larger-scale field trials are needed to generalize the interactive effects of water–N management and arid-zone environmental stressors.

5. Conclusions

This research focuses on the coupled effects of soil fertility and microbial community structure in the rhizosphere soil of Z. jujuba seedlings in semi-arid regions. Results demonstrate that N response exhibits significant water-dependent reversal patterns, whereby low N levels under water stress conditions are more conducive to soil N accumulation. EENFs display distinct functional differentiation, with urease inhibitors achieving optimal NH4+-N control (reduction of 32.38–43.22%) and nitrification inhibitors demonstrating pronounced NH4+-N regulation effects (enhancement of 35.76%), while microbial community α-diversity analysis reveals enhanced responses under water stress conditions. The explanatory power of environmental factors on microbial community structure increases significantly under drought conditions. Future research should prioritize multi-site validation trials across different soil textures and climatic regions in southern Xinjiang sea buckthorn orchards to evaluate the cumulative effects of long-term enhanced N fertilizer application on soil ecosystem service functions. Given the inherent limitations of pot experimental conditions and the absence of data on yield, plant nitrogen uptake, and N2O emissions, any potential for N2O emission reduction through enhanced-efficiency fertilizers remains a hypothesis requiring direct field validation. Larger-scale field trials utilizing brackish water in Xinjiang’s typical drip-irrigation systems are recommended to validate these findings and translate them into practical management guidelines.

Supplementary Materials

The following supporting information can be downloaded at: https://www.mdpi.com/article/10.3390/agronomy15092191/s1. Figure S1. Effect of different water–N management with EENFs on soil macroelement and microelement concentrations; Table S1. Basic physical and chemical properties of soil of potting soil; Figure S2. Petal Diagrams of Rhizosphere Soil Bacterial ASV Distributions under 75%FC (A) and 45%FC (B) across different EENFs and NAR; Table S2. Sequencing depth summary for 54 soil samples after quality filtering and chimera removal; Figure S3. Petal Diagrams of Rhizosphere Soil fungal ASV Distributions under 75%FC (A) and 45%FC (B) across different EENFs and NAR; Table S3. PERMANOVA results for microbial β-diversity based on Bray–Curtis distances; Figure S4. PCoA of bacterial communities under 75%FC (A) and 45%FC (B); Table S4. Summary of three-way ANOVA results for bacterial α-diversity indices; Figure S5. PCoA of fungal communities under 75%FC (A) and 45%FC (B); Table S5. Summary of three-way ANOVA results for fungal α-diversity indices; Figure S6. The distribution of soil bacterial communities at the phylum level under each treatment at different FC; Table S6. Redundancy analysis (RDA) results for soil bacterial communities under 75%FC; Figure S7. The distribution of soil fungi communities at the phylum level under each treatment at different FC; Table S7. RDA results for soil bacterial communities under 45%FC; Table S8. RDA results for soil fungal communities under 75%FC; Table S9. RDA results for soil fungal communities under 45%FC; Table S10. Three-way ANOVA (Water × N_rate × Fertilizer) for soil chemical properties (df_error = 40).

Author Contributions

Conceptualization, Y.Z. and C.W.; methodology, H.L. and J.S.; software, Y.M.; validation, Y.M. and H.L.; formal analysis, Y.M. and J.S.; investigation, Y.M. and H.L.; resources, Y.Z.; data curation, Y.M. and J.S.; writing—original draft preparation, Y.M. and H.L.; writing—review and editing, Y.Z. and C.W.; supervision, Y.Z. and C.W.; funding acquisition, Y.Z. and C.W. All authors have read and agreed to the published version of the manuscript.

Funding

This research was financially supported by the Key areas of science and technology research plan (2023AB004-04) to Y.Z.; the open project of the national and local joint engineering laboratory of high efficiency and superior-quality cultivation and fruit deep processing technology of characteristic fruit trees in south Xinjiang (EF202201); Tarim University-Nanjing Agricultural University Joint Fund project (NNLH202407) to Y.Z. and the 2024 Xinjiang Production and Construction Corps Graduate Education Innovation Program (The response mechanisms of different nitrification inhibition pathways on the active phosphorus fixation and nitrogen fixation by soil as well as greenhouse gas emissions in jujube orchards) (no grant number) to Y.M.

Data Availability Statement

The data presented in this study are available on request from the corresponding author.

Conflicts of Interest

The authors declare no conflicts of interest.

References

  1. Singh, A.K.; Gupta, K.J.; Singla-Pareek, S.L.; Foyer, C.H.; Pareek, A. Raising crops for dry and saline lands: Challenges and the way forward. Physiol. Plant. 2022, 174, e13730. [Google Scholar] [CrossRef]
  2. Sparks, D.L. A golden period for environmental soil chemistry. Geochem. Trans. 2020, 21, 5. [Google Scholar] [CrossRef]
  3. Lyu, R.; Wang, R.; Wu, C.; Bao, Y.; Guo, P. Comparative transcriptome analysis of leaves of sour jujube seedlings under salt stress. Acta Physiol. Plant. 2022, 44, 119. [Google Scholar] [CrossRef]
  4. Feng, J.; Li, F.; Deng, A.; Feng, X.; Fang, F.; Zhang, W. Integrated assessment of the impact of enhanced-efficiency nitrogen fertilizer on N2O emission and crop yield. Agric. Ecosyst. Environ. 2016, 231, 218–228. [Google Scholar] [CrossRef]
  5. Luhe, Z.; Tong, Z.; Huaili, H.; Bo, W.; De, Z.; Fang, W.; Duofeng, W.; Yi, L. The physiological responses of ‘Zhanhuang Jujube’ and ‘Winter Jujube’ to drought stress. Agric. Res. Arid Reg. 2023, 41, 104–113. (In Chinese) [Google Scholar] [CrossRef]
  6. Zhou, C. Discussion on the Drought Resistance of Jujube Trees and Water-Saving Cultivation Techniques. Res. Econ. For. 2000, 1, 53–54. (In Chinese) [Google Scholar] [CrossRef]
  7. Jiang, S.; Li, Z.; Yuan, H.; Jin, J.; Xiao, C.; Cui, Y. Quantification Assessment of Winter Wheat Sensitivity under Different Drought Scenarios during Growth. Water 2024, 16, 2048. [Google Scholar] [CrossRef]
  8. Liu, M.; Yang, C.; Mu, R. Effect of soil water–phosphorus coupling on the photosynthetic capacity of Robinia pseudoacacia L. seedlings in semi-arid areas of the Loess Plateau, China. Environ. Monit. Assess. 2023, 195, 932. [Google Scholar] [CrossRef]
  9. Ahmed Mohammed, M.E.; Refdan Alhajhoj, M.; Ali-Dinar, H.M.; Munir, M. Impact of a Novel Water-Saving Subsurface Irrigation System on Water Productivity, Photosynthetic Characteristics, Yield, and Fruit Quality of Date Palm under Arid Conditions. Agronomy 2020, 10, 1265. [Google Scholar] [CrossRef]
  10. Dehghanisanij, H.; Salamati, N.; Emami, S.; Emami, H.; Fujimaki, H. An intelligent approach to improve date palm crop yield and water productivity under different irrigation and climate scenarios. Appl. Water Sci. 2023, 13, 56. [Google Scholar] [CrossRef]
  11. Jiang, W.; Chen, L.; Han, Y.; Cao, B.; Song, L. Effects of elevated temperature and drought stress on fruit coloration in the jujube variety ‘Lingwuchangzao’ (Ziziphus jujube cv. Lingwuchangzao). Sci. Hortic. 2020, 274, 109667. [Google Scholar] [CrossRef]
  12. Wang, R.; Xia, J.; Yang, J.; Liu, J.; Zhao, Y.; Sun, J. The water response characteristics of photosynthetic physiological parameters of acerola leaves in the shell sand habitat. Acta Ecol. Sin. 2013, 33, 6088–6096. (In Chinese) [Google Scholar] [CrossRef]
  13. Maraghni, M.; Gorai, M.; Steppe, K.; Neffati, M.; Van Labeke, M.C. Coordinated changes in photosynthetic machinery performance and water relations of the xerophytic shrub Ziziphus lASVs (L.) Lam. (Rhamnaceae) following soil drying. Photosynthetica 2019, 57, 113–120. [Google Scholar] [CrossRef]
  14. Xia, J.B.; Zhang, G.C.; Wang, R.R.; Zhang, S.Y. Effect of soil water availability on photosynthesis in Ziziphus jujuba var. spinosus in a sand habitat formed from seashells: Comparison of four models. Photosynthetica 2014, 52, 253–261. [Google Scholar] [CrossRef]
  15. Dimkpa, C.O.; Fugice, J.; Singh, U.; Lewis, T.D. Development of fertilizers for enhanced nitrogen use efficiency—Trends and perspectives. Sci. Total Environ. 2020, 731, 139113. [Google Scholar] [CrossRef]
  16. Cantarella, H.; Trivelin, P.C.O.; Contin, T.L.M.; Dias, F.L.F.; Rossetto, R.; Marcelino, R.; Coimbra, R.B.; Quaggio, J.A. Ammonia volatilisation from urease inhibitor-treated urea applied to sugarcane trash blankets. Sci. Agric. 2008, 65, 397–401. [Google Scholar] [CrossRef]
  17. Soares, J.R.; Cantarella, H.; Menegale, M.L.d.C. Ammonia volatilization losses from surface-applied urea with urease and nitrification inhibitors. Soil Biol. Biochem. 2012, 52, 82–89. [Google Scholar] [CrossRef]
  18. Liu, C.; Wang, K.; Zheng, X. Effects of nitrification inhibitors (DCD and DMPP) on nitrous oxide emission, crop yield and nitrogen uptake in a wheat–maize cropping system. Biogeosciences 2013, 10, 2427–2437. [Google Scholar] [CrossRef]
  19. Menéndez, S.; Barrena, I.; Setien, I.; González-Murua, C.; Estavillo, J.M. Efficiency of nitrification inhibitor DMPP to reduce nitrous oxide emissions under different temperature and moisture conditions. Soil Biol. Biochem. 2012, 53, 82–89. [Google Scholar] [CrossRef]
  20. Fan, X.; Yin, C.; Chen, H.; Ye, M.; Zhao, Y.; Li, T.; Wakelin, S.A.; Liang, Y. The efficacy of 3,4-dimethylpyrazole phosphate on N2O emissions is linked to niche differentiation of ammonia oxidizing archaea and bacteria across four arable soils. Soil Biol. Biochem. 2018, 130, 82–93. [Google Scholar] [CrossRef]
  21. Vessey, J.K. Plant growth promoting rhizobacteria as biofertilizers. Plant Soil 2003, 255, 571–586. [Google Scholar] [CrossRef]
  22. Bhardwaj, D.; Ansari, M.W.; Sahoo, R.K.; Tuteja, N. Biofertilizers function as key player in sustainable agriculture by improving soil fertility, plant tolerance and crop productivity. Microb. Cell Factories 2014, 13, 66. [Google Scholar] [CrossRef]
  23. Singh, J.S.; Pandey, V.C.; Singh, D.P. Efficient soil microorganisms: A new dimension for sustainable agriculture and environmental development. Agric. Ecosyst. Environ. 2011, 140, 339–353. [Google Scholar] [CrossRef]
  24. Burgess, C.J.; Myrold, D.D.; Mueller, R.S.; Wanzek, T.; Moore, J.M.; Kasschau, K.D.; Kleber, M. Drainage gradient versus seasonal cycles: Differential response of microbial community composition to variations in soil moisture. Soil Sci. Soc. Am. J. 2024, 88, 2123–2134. [Google Scholar] [CrossRef]
  25. Lei, L.; Marc, E.; Per, B.; Jian, L.; Dolores, A.; Häkan, W.; Josep, P. Drought legacies on soil respiration and microbial community in a Mediterranean forest soil under different soil moisture and carbon inputs. Geoderma 2021, 405, 115425. [Google Scholar] [CrossRef]
  26. Chen, M.M.; Zhu, Y.G.; Su, Y.H.; Chen, B.D.; Fu, B.J.; Marschner, P. Effects of soil moisture and plant interactions on the soil microbial community structure. Eur. J. Soil Biol. 2007, 43, 31–38. [Google Scholar] [CrossRef]
  27. Li, J.; Meng, B.; Yang, X.; Cui, N.; Zhao, T.; Chai, H.; Zhang, T.; Sun, W. Suppression of AMF accelerates N2O emission by altering soil bacterial community and genes abundance under varied precipitation conditions in a semiarid grassland. Front. Microbiol. 2022, 13, 961969. [Google Scholar] [CrossRef] [PubMed]
  28. Shi, X.; Hu, H.-W.; Zhu-Barker, X.; Hayden, H.; Wang, J.; Suter, H.; Chen, D.; He, J.-Z. Nitrifier-induced denitrification is an important source of soil nitrous oxide and can be inhibited by a nitrification inhibitor 3,4-dimethylpyrazole phosphate. Environ. Microbiol. 2017, 19, 4851–4865. [Google Scholar] [CrossRef]
  29. Delgado-Baquerizo, M.; Guerra, C.A.; Cano-Díaz, C.; Egidi, E.; Wang, J.-T.; Eisenhauer, N.; Singh, B.K.; Maestre, F.T. The proportion of soil-borne pathogens increases with warming at the global scale. Nat. Clim. Change 2020, 10, 550–554. [Google Scholar] [CrossRef]
  30. Wagg, C.; Schlaeppi, K.; Banerjee, S.; Kuramae, E.E.; van der Heijden, M.G.A. Fungal-bacterial diversity and microbiome complexity predict ecosystem functioning. Nat. Commun. 2019, 10, 4841. [Google Scholar] [CrossRef]
  31. Bhattacharyya, A.; Pablo, C.H.D.; Mavrodi, O.V.; Weller, D.M.; Thomashow, L.S.; Mavrodi, D.V. Rhizosphere plant-microbe interactions under water stress. Adv. Appl. Microbiol. 2021, 115, 65–113. [Google Scholar] [CrossRef] [PubMed]
  32. Chen, Q.-L.; Ding, J.; Zhu, D.; Hu, H.-W.; Delgado-Baquerizo, M.; Ma, Y.-B.; He, J.-Z.; Zhu, Y.-G. Rare microbial taxa as the major drivers of ecosystem multifunctionality in long-term fertilized soils. Soil Biol. Biochem. 2019, 141, 107686. [Google Scholar] [CrossRef]
  33. Liu, B.; Mørkved, P.T.; Frostegård, A.; Bakken, L.R. Denitrification gene pools, transcription and kinetics of NO, N2O and N2 production as affected by soil pH. FEMS Microbiol. Ecol. 2010, 72, 407–417. [Google Scholar] [CrossRef]
  34. Hu, H.-W.; Chen, D.; He, J.-Z. Microbial regulation of terrestrial nitrous oxide formation: Understanding the biological pathways for prediction of emission rates. FEMS Microbiol. Rev. 2015, 39, 729–749. [Google Scholar] [CrossRef]
  35. Mayak, S.; Tirosh, T.; Glick, B.R. Plant growth-promoting bacteria that confer resistance to water stress in tomatoes and peppers. Plant Sci. 2004, 166, 525–530. [Google Scholar] [CrossRef]
  36. Zhou, H.; Wang, L.; Xu, P.; Liu, D.; Zhang, L.; Hao, Y.; Wang, K.; Fan, H. Nitrogen use efficiency of drip irrigated sugar beet as affected by sub-optimal levels of nitrogen and irrigation. Agric. Water Manag. 2024, 298, 108849. [Google Scholar] [CrossRef]
  37. Zhang, J.; Wang, Q.; Xia, G.; Wu, Q.; Chi, D. Continuous regulated deficit irrigation enhances peanut water use efficiency and drought resistance. Agric. Water Manag. 2021, 255, 106997. [Google Scholar] [CrossRef]
  38. Chen, Q.; Qu, Z.; Ma, G.; Wang, W.; Dai, J.; Zhang, M.; Wei, Z.; Liu, Z. Humic acid modulates growth, photosynthesis, hormone and osmolytes system of maize under drought conditions. Agric. Water Manag. 2022, 263, 107447. [Google Scholar] [CrossRef]
  39. GB/T 2440–2017; Urea. General Administration of Quality Supervision, Inspection and Quarantine of the People’s Republic of China; Standardization Administration of China: Beijing, China, 2017.
  40. Yang, W.; Diao, L.; Wang, Y.; Yang, X.; Zhang, H.; Wang, J.; Luo, Y.; An, S.; Cheng, X. Responses of soil fungal communities and functional guilds to ~160 years of natural revegetation in the Loess Plateau of China. Front. Microbiol. 2022, 13, 967565. [Google Scholar] [CrossRef]
  41. Brewer, K.M.; Gaudin, A.C.M. Potential of crop-livestock integration to enhance carbon sequestration and agroecosystem functioning in semi-arid croplands. Soil Biol. Biochem. 2020, 149, 107936. [Google Scholar] [CrossRef]
  42. Kuzyakov, Y.; Blagodatskaya, E. Microbial hotspots and hot moments in soil: Concept & review. Soil Biol. Biochem. 2015, 83, 184–199. [Google Scholar] [CrossRef]
  43. Manzoni, S.; Taylor, P.; Richter, A.; Porporato, A.; Ågren, G.I. Environmental and stoichiometric controls on microbial carbon-use efficiency in soils. New Phytol. 2012, 196, 79–91. [Google Scholar] [CrossRef] [PubMed]
  44. Hartwig, R.P.; Santangeli, M.; Würsig, H.; Martín Roldán, M.; Yim, B.; Lippold, E.; Tasca, A.; Oburger, E.; Tarkka, M.; Vetterlein, D.; et al. Drought response of the maize plant-soil-microbiome system is influenced by plant size and presence of root hairs. Ann. Bot. 2025, 1–18. [Google Scholar] [CrossRef] [PubMed]
  45. Rengasamy, P. World salinization with emphasis on Australia. J. Exp. Bot. 2006, 57, 1017–1023. [Google Scholar] [CrossRef] [PubMed]
  46. Song, S.; Sha, Z.; Zhang, K.; Liu, X. Are dual inhibitors superior to urease or nitrification inhibitors for mitigating environmental risk and enhancing agronomic efficiency? Agric. Ecosyst. Environ. 2025, 392, 109752. [Google Scholar] [CrossRef]
  47. Lv, J.; Gui, D.; Zhang, Y.; Li, R.; Chen, X.; Sha, Z. Field application of microbial inoculants improved crop foliar morphology and physiology performance: A global meta-analysis. Sci. Hortic. 2023, 326, 112769. [Google Scholar] [CrossRef]
  48. Liu, J.; Li, H.; Yuan, Z.; Feng, J.; Chen, S.; Sun, G.; Wei, Z.; Hu, T. Effects of microbial fertilizer and irrigation amount on growth, physiology and water use efficiency of tomato in greenhouse. Sci. Hortic. 2023, 323, 112553. [Google Scholar] [CrossRef]
  49. Li, L.; Zhao, C.; Wang, X.; Tan, Y.; Wang, X.; Liu, X.; Guo, B. Effects of nitrification and urease inhibitors on ammonia-oxidizing microorganisms, denitrifying bacteria, and greenhouse gas emissions in greenhouse vegetable fields. Environ. Res. 2023, 237, 116781. [Google Scholar] [CrossRef]
  50. Pan, J.; Liu, Y.; Zhong, X.; Lampayan, R.M.; Singleton, G.R.; Huang, N.; Liang, K.; Peng, B.; Tian, K. Grain yield, water productivity and nitrogen use efficiency of rice under different water management and fertilizer-N inputs in South China. Agric. Water Manag. 2017, 184, 191–200. [Google Scholar] [CrossRef]
  51. Atwill, R.L.; Krutz, L.J.; Bond, J.A.; Reddy, K.R.; Gore, J.; Walker, T.W.; Harrell, D.L. Water management strategies and their effects on rice grain yield and nitrogen use efficiency. J. Soil Water Conserv. 2018, 73, 257–264. [Google Scholar] [CrossRef]
  52. Fierer, N. Embracing the unknown: Disentangling the complexities of the soil microbiome. Nat. Rev. Microbiol. 2017, 15, 579–590. [Google Scholar] [CrossRef]
  53. Delgado-Baquerizo, M.; Oliverio, A.M.; Brewer, T.E.; Benavent-González, A.; Eldridge, D.J.; Bardgett, R.D.; Maestre, F.T.; Singh, B.K.; Fierer, N. A global atlas of the dominant bacteria found in soil. Science 2018, 359, 320–325. [Google Scholar] [CrossRef] [PubMed]
  54. Fierer, N.; Bradford, M.A.; Jackson, R.B. Toward an Ecological Classification of Soil Bacteria. Ecology 2007, 88, 1354–1364. [Google Scholar] [CrossRef] [PubMed]
  55. Wang, L.; Huang, D. Nitrogen and phosphorus losses by surface runoff and soil microbial communities in a paddy field with different irrigation and fertilization managements. PLoS ONE 2021, 16, e0254227. [Google Scholar] [CrossRef] [PubMed]
  56. Kielak, A.M.; Barreto, C.C.; Kowalchuk, G.A.; van Veen, J.A.; Kuramae, E.E. The Ecology of Acidobacteria: Moving beyond Genes and Genomes. Front. Microbiol. 2016, 7, 744. [Google Scholar] [CrossRef]
  57. Fierer, N.; Leff, J.W.; Adams, B.J.; Nielsen, U.N.; Bates, S.T.; Lauber, C.L.; Owens, S.; Gilbert, J.A.; Wall, D.H.; Caporaso, J.G. Cross-biome metagenomic analyses of soil microbial communities and their functional attributes. Proc. Natl. Acad. Sci. USA 2012, 109, 21390–21395. [Google Scholar] [CrossRef]
  58. Zhou, J.; Deng, Y.; Shen, L.; Wen, C.; Yan, Q.; Ning, D.; Qin, Y.; Xue, K.; Wu, L.; He, Z.; et al. Temperature mediates continental-scale diversity of microbes in forest soils. Nat. Commun. 2016, 7, 12083. [Google Scholar] [CrossRef]
  59. Tan, W.; Wang, J.; Bai, W.; Qi, J.; Chen, W. Soil bacterial diversity correlates with precipitation and soil pH in long-term maize cropping systems. Sci. Rep. 2020, 10, 6012. [Google Scholar] [CrossRef]
  60. O’Callaghan, M.; Gerard, E.M.; Carter, P.E.; Lardner, R.; Sarathchandra, U.; Burch, G.; Ghani, A.; Bell, N. Effect of the nitrification inhibitor dicyandiamide (DCD) on microbial communities in a pasture soil amended with bovine urine. Soil Biol. Biochem. 2010, 42, 1425–1436. [Google Scholar] [CrossRef]
  61. Chang, D.; Lu, X.; Sun, Y.; Fan, H.; Wang, K. Responses of rhizosphere microbial communities and resource competition to soil amendment in saline and alkaline soils. Plant Soil 2025. [Google Scholar] [CrossRef]
  62. Weng, X.; Li, J.; Sui, X.; Li, M.; Yin, W.; Ma, W.; Yang, L.; Mu, L. Soil microbial functional diversity responses to different vegetation types in the Heilongjiang Zhongyangzhan Black-billed Capercaillie Nature Reserve. Ann. Microbiol. 2021, 71, 26. [Google Scholar] [CrossRef]
  63. Yao, Y.; Zhu, R.; Li, X.; Hu, G.; Dong, Y.; Liu, Z. Long-term adoption of plow tillage and green manure improves soil physicochemical properties and optimizes microbial communities under a continuous peanut monoculture system. Front. Microbiol. 2025, 15, 1513528. [Google Scholar] [CrossRef] [PubMed]
  64. Maron, P.-A.; Sarr, A.; Kaisermann, A.; Lévêque, J.; Mathieu, O.; Guigue, J.; Karimi, B.; Bernard, L.; Dequiedt, S.; Terrat, S.; et al. High Microbial Diversity Promotes Soil Ecosystem Functioning. Appl. Environ. Microbiol. 2018, 84, e02738-17. [Google Scholar] [CrossRef] [PubMed]
  65. Wang, Y.; Peng, Y.; Lin, J.; Wang, L.; Jia, Z.; Zhang, R. Optimal nitrogen management to achieve high wheat grain yield, grain protein content, and water productivity: A meta-analysis. Agric. Water Manag. 2023, 290, 108587. [Google Scholar] [CrossRef]
  66. Liu, L.; Chen, T.; Wang, Z.; Zhang, H.; Yang, J.; Zhang, J. Combination of site-specific nitrogen management and alternate wetting and drying irrigation increases grain yield and nitrogen and water use efficiency in super rice. Field Crops Res. 2013, 154, 226–235. [Google Scholar] [CrossRef]
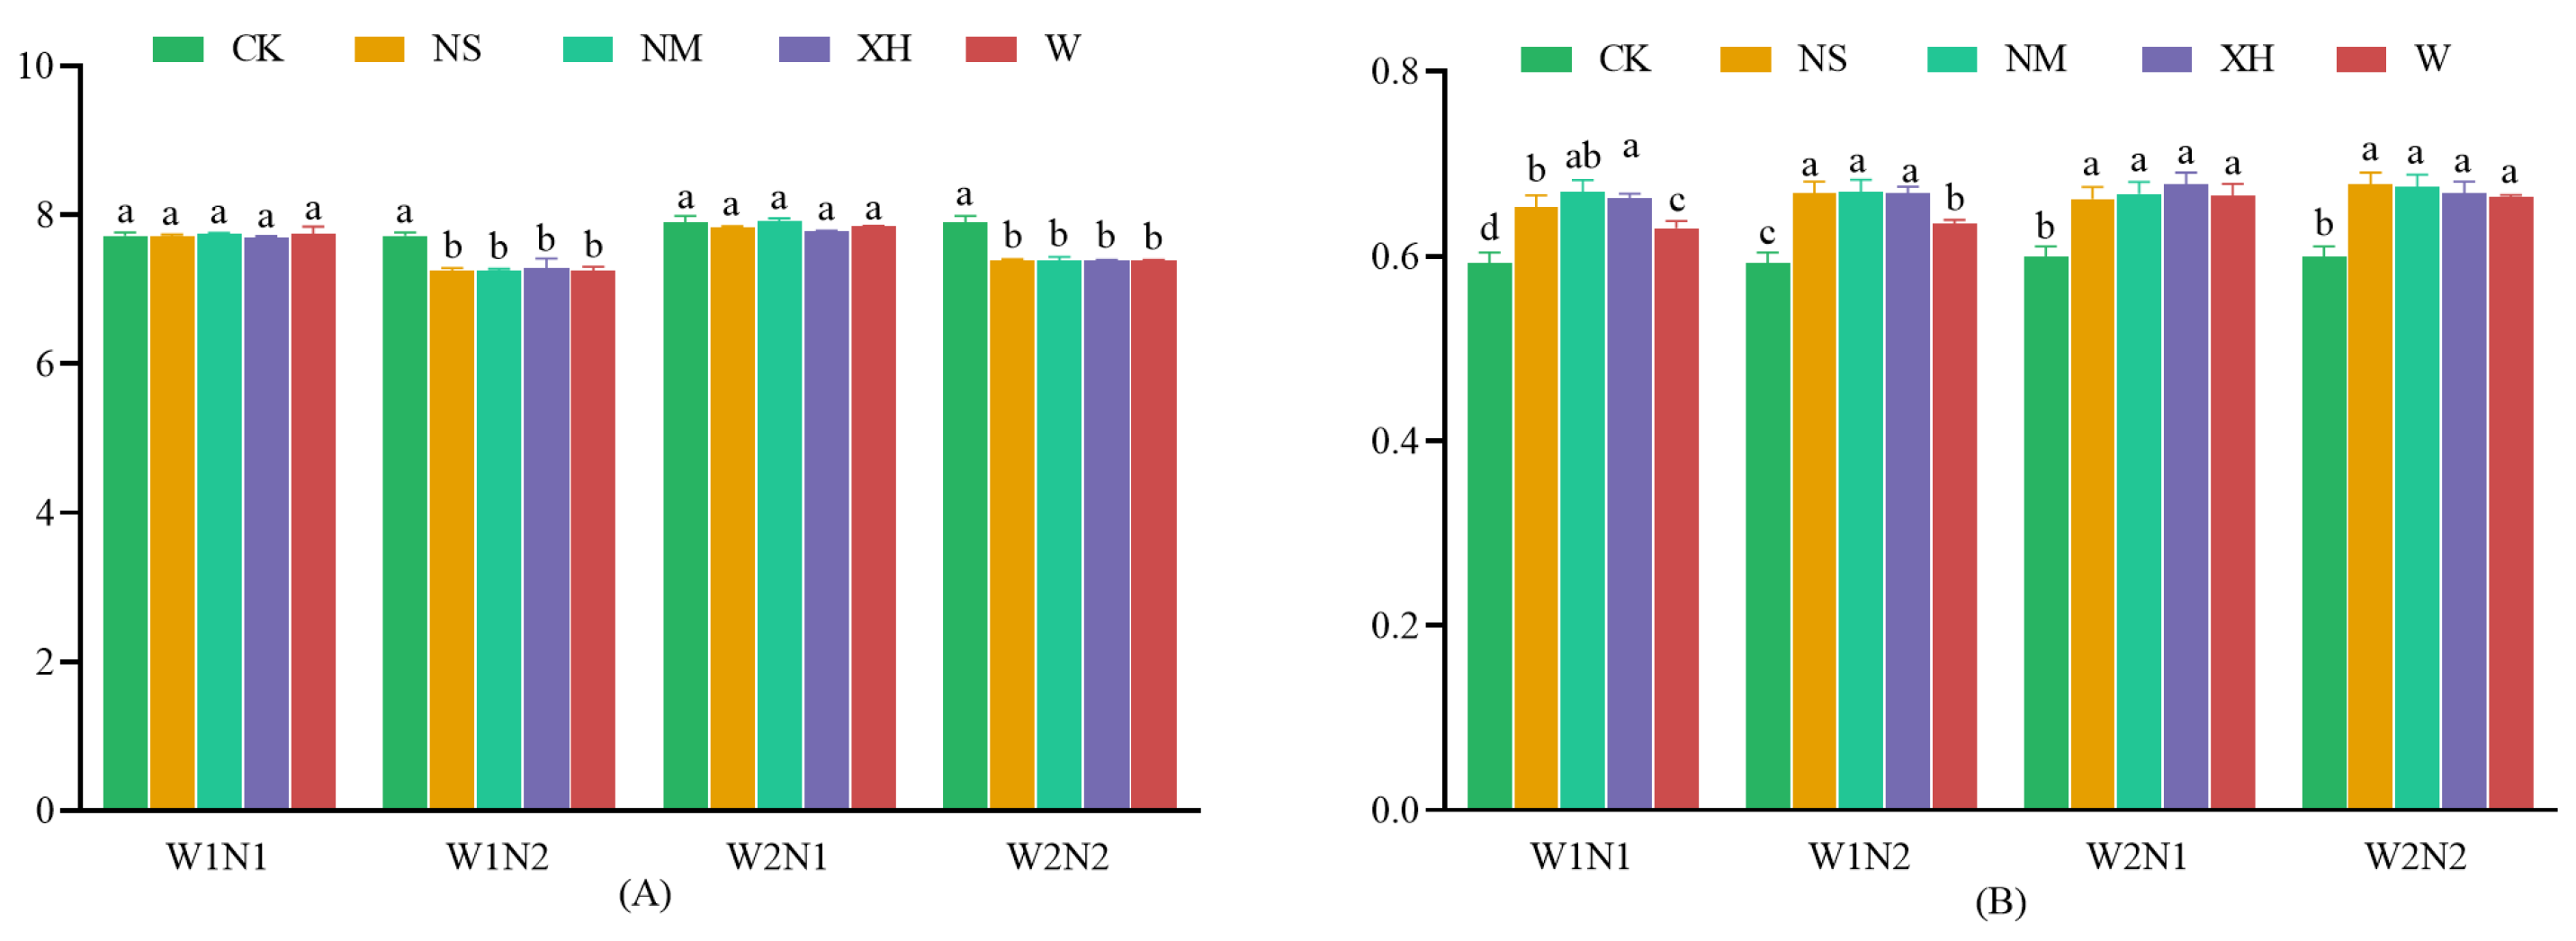
Figure 1. Effect of different water–N management with EENFs on (A) pH and (B) EC (dS cm−1). Values are means ± standard error (SE) of 10 replicates (pots). Two-way ANOVA (water regime × fertilizer type) followed by Tukey’s HSD test was used for multiple comparisons. Different lowercase letters above bars indicate significant differences among treatments within the same sampling period (p < 0.05). Error bars represent ±1 SE (n = 5).
Agronomy 15 02191 g001
Figure 2. Effect of different water–N management with EENFs on available nutrients. (A) Soil organic matter (SOM) (g kg−1), (B) alkali-hydrolyzable N (mg kg−1), (C) available phosphorus (AP) (mg kg−1) and (D) available potassium (AK) (mg kg−1). Data are means ± 1 SE (n = 5). Different lowercase letters denote significant differences among treatments within the same panel (two-way ANOVA followed by Tukey’s HSD, p < 0.05).
Agronomy 15 02191 g002
Figure 3. Effect of different water–N management with EENFs on (A) TN (g kg−1) and (B) TC (g kg−1). Data are means ± 1 SE (n = 5). Different lowercase letters denote significant differences among treatments within the same panel (two-way ANOVA followed by Tukey’s HSD, p < 0.05).
Agronomy 15 02191 g003
Figure 4. Effects of water–N coupling combined with EENFs on (A) NO3-N (mg kg−1) and (B) NH4+-N (mg kg−1). Data are means ± 1SE (n = 5). Different lowercase letters denote significant differences among treatments within the same panel (two-way ANOVA followed by Tukey’s HSD, p < 0.05).
Agronomy 15 02191 g004
Figure 5. Cumulative AV (kg N ha−1) of each treatment at 75% and 45%FC. Data are means ± 1SE (n = 3). Different lowercase letters denote significant differences among treatments within the same panel (two-way ANOVA followed by Tukey’s HSD, p < 0.05).
Agronomy 15 02191 g005
Figure 6. Soil bacterial α-diversity indices under 75%FC (A) and 45%FC (B) across N rates and EENFs (presented in order: Chao1, Goods_coverage, Simpson, Pielou_e, Faith’s pd, Shannon, observed_species). Boxplots show median (horizontal line), interquartile range (box), and 1.5 × IQR (whiskers); outliers are plotted individually. Different lowercase letters indicate significant differences (Tukey’s HSD, p < 0.05). Colors represent treatment groups (n = 3). Statistical significance was evaluated with a full-factorial three-way ANOVA (Water × N × Fertilizer); details on significant interactions are provided in Supplementary Tables S4 and S5.
Agronomy 15 02191 g006
Figure 7. Soil fungal α-diversity indices under different NAR and EENFs at 75%FC (A) and 45%FC (B) (presented in order: Chao1, Goods_coverage, Simpson, Pielou_e, Shannon, observed_species). Different lowercase letters indicate significant differences (Tukey’s HSD, p < 0.05). Colors represent treatment groups (n = 3).
Agronomy 15 02191 g007
Figure 8. RDA analysis illustrating the relationships between soil environmental variables and bacterial communities under 75%FC (A) and 45%FC (B) across different NAR. Each symbol represents one rhizosphere sample (n = 3). Arrows show standardized environmental predictors; arrow length and direction indicate the strength and sign of the correlation with RDA axes. The percentage of constrained variance explained by each axis is given in parentheses. Permutation tests (9999 permutations) confirmed model significance (p < 0.05).
Agronomy 15 02191 g008
Figure 9. RDA analysis illustrating the relationships between soil environmental variables and fungal communities under 75%FC (A) and 45%FC (B) across different NAR. Arrows denote environmental predictors. Each symbol represents one rhizosphere sample (n = 3). The percentage of constrained variance explained by each axis is given in parentheses. Permutation tests (9999 permutations) confirmed model significance (p < 0.05).
Agronomy 15 02191 g009
Figure 10. Pearson correlations matrix between soil physicochemical properties and microbial community structures. Color intensity indicates correlation coefficients for total nitrogen (TN), total carbon (TC), phosphorus (P), potassium (K), calcium (Ca), sodium (Na), magnesium (Mg), iron (Fe), zinc (Zn), manganese (Mn), alkaline-hydrolyzable nitrogen (AHN), available phosphorus (AP), available potassium (AK), soil organic matter (SOM), electrical conductivity (EC) and pH with bacterial Shannon diversity (B-Shannon), bacterial ordination axes (B-NMDS1 and B-NMDS2), fungal Chao1 (F-Chao1), fungal Shannon diversity (F-Shannon) and fungal ordination axes (F-NMDS1 and F-NMDS2). Asterisks below the panel denote significance levels. Color intensity indicates Pearson |r|; asterisks denote significance (* p ≤ 0.05, ** p ≤ 0.01).
Agronomy 15 02191 g010
Table 1. Potted jujube fertilization trial design table.
TreatmentField Capacity (FC)Fertilizer Application Rates for Each Treatment (kg N ha−1)
Urease Inhibitor-Type N Fertilizer Nitrification Inhibitor-Type N FertilizerMicrobial InoculantUrea Fertilizer
CK75%0000
W1N1-NS75%000100
W1N1-NM75%100000
W1N1-XH75%010000
W1N1-W75%001000
W1N2-NS75%000100
W1N2-NM75%100000
W1N2-XH75%010000
W1N2-W75%001000
CK45%0000
W2N1-NS45%000300
W2N1-NM45%300000
W2N1-XH45%030000
W2N1-W45%003000
W2N2-NS45%000300
W2N2-NM45%300000
W2N2-XH45%030000
W2N2-W45%003000
Disclaimer/Publisher’s Note: The statements, opinions and data contained in all publications are solely those of the individual author(s) and contributor(s) and not of MDPI and/or the editor(s). MDPI and/or the editor(s) disclaim responsibility for any injury to people or property resulting from any ideas, methods, instructions or products referred to in the content.