Article

Interlinked Temperature and Light Effects on Lettuce Photosynthesis and Transpiration: Insights from a Dynamic Whole-Plant Gas Exchange System

Laboratory of Plant Ecology, Faculty of Bioscience Engineering, Ghent University, Coupure links 653, B-9000 Gent, Belgium
*
Author to whom correspondence should be addressed.
Agronomy 2025, 15(9), 2180; https://doi.org/10.3390/agronomy15092180
Submission received: 14 August 2025 / Revised: 9 September 2025 / Accepted: 11 September 2025 / Published: 13 September 2025
(This article belongs to the Special Issue Light Environment Regulation of Crop Growth)

Abstract

Environmental control in closed environment agricultural systems (CEA) is challenging due to the high energy demand and the dynamic interactions between plants and their heterogeneous phylloclimate. Optimization of crop production in CEA systems therefore requires a thorough understanding of whole-plant functioning and the interconnected plant-climate interactions. Such optimization is limited by an incomplete knowledge of how leaf-level measurements of gas exchange relate to whole-plant processes and how to scale-up point measurements of the heterogeneous environment to inform plant-level decisions. To address both, a dynamic whole-plant gas exchange system was developed to quantify the effect of temperature, relative humidity and light intensity on whole-plant photosynthetic and transpiration rates in lettuce (Lactuca sativa L.). Results showed that light intensity was the primary driver for whole-plant photosynthesis, with temperature optima increasing from 5 °C at a photosynthetic photon flux density (PPFD) of 150 µmol·m−2·s−1 to 13 °C at 400 µmolm−2·s−1. These optima for lettuce plants were 10 to 20 °C lower than those observed at leaf level due to a shifted balance between respiration and photosynthesis within the complex habitus of lettuce. The results showed a decoupling of transpiration and photosynthesis under high relative humidity, with vapour pressure deficit (VPD) values of 0.5 kPa or lower, which physically limited transpiration. The newly developed dynamic gas exchange system has proven to be a helpful tool for examining the relative importance and combined effects of environmental factors on whole-plant photosynthesis and transpiration. Potential future applications of this system include research on phylloclimate, implementation in production facilities, and validation of crop models.

1. Introduction

The concept of closed environment agricultural systems (CEA) has gained a lot of interest as an alternative production system, reducing the need for arable land, water, herbicides and pesticides while providing year round production [1,2,3,4]. But these systems have a high demand in terms of investment cost, and a high energy demand for artificial lighting, heating, dehumidification and sensible cooling of 50%, 20%, 34% and 14%, respectively [5,6,7]. Optimization of said parameters therefore will highly impact the efficiency of resource usage.
The effect of environmental factors on plants is species-specific, and plant responses can differ across the developmental stages of a given crop [8,9]. Light is a critical driver of crop growth and physiology, influencing the CEA systems’ energy demand as it requires electricity for lighting and additional cooling to offset the generated heat [10]. For lettuce (Lactuca sativa L.), the model plant in this work, optimal photosynthetic photon flux density (PPFD) levels have been reported to range between 200 and 300 µmol·m−2·s−1 [9,11,12]. Higher PPFDs are associated with an increased risk of tipburn due to accelerated growth rates [13]. Talbot & Monfet [10] even reported an inhibition of growth in lettuce when PPFD exceeded 500 µmol·m−2·s−1. In addition to PPFD control, temperature management is vital for achieving balanced plant growth and maintaining crop quality [9]. Temperature regulation in a CEA system should aim to maximize photosynthesis and growth while minimizing respiration [14]. Reported gross and net photosynthetic rates show an increasing trend with temperature towards optimal values, after which they decline due to the increase in photo- and dark respiration [15,16,17,18,19]. Additionally, light intensity further shifts this balance as net respiration, driven by photorespiration, increases with increasing PPFD [20], resulting in a limited increase in temperature optimum under high light intensity [18]. Optimal temperatures for the photosynthetic rate of several species, as reported in the literature, are summarized in Table 1. Furthermore, Figure 1 was drafted to illustrate the dependency of photosynthetic rate on temperature and PPFD. Figure 1 shows the output of a coupled model of photosynthesis, stomatal conductance and transpiration [21]. For illustration, this model was calibrated for lettuce leaves and simulations were performed considering a homogeneous big leaf of one square meter (in-house generated, unpublished data). For lettuce production, reported optimal daytime temperatures generally range between 20 and 24 °C with night temperatures 3 to 5 °C lower than daytime temperatures [9,10,11,22,23]. Higher temperatures have been associated with loose leaf structures, while lower temperatures inhibit growth [22]. Additionally, high temperatures in CEA systems will result in a rise in vapour pressure deficit (VPD), and thus higher transpiration rates. When elevated temperatures are combined with higher humidity levels, generated through transpiration, the resulting VPD can help mitigate drought stress in plants while reducing the need for energy-intensive dehumidification [10,14,24]. On the other hand, high relative humidity (RH) might result in fungal disease, pests, stomatal malfunction and tipburn [13,14,25,26]. While high RH at night might help preventing tipburn [13], for lettuce, optimal RH range has been reported between 60 and 80% [9,14,27]. Based on reported optimal RH and temperature conditions, the optimal VPD was calculated to range between 0.5 and 1 kPa, which is in accordance with values reported in the literature [28]. This work will focus on the effects of PPFD, temperature, and RH, which are three critical drivers of plant physiology that also account for the largest share of energy demand in CEA systems.
Considering these parameters, published research has mainly focused on the effect of one or several environmental factors on plant morphology and physiology, often overlooking how plants directly influence their environment in return. Plants continuously alter the microclimate, and by extension the phylloclimate (i.e., the climate sensed by each plant organ), through processes such as transpiration, photosynthesis, light interaction and canopy-induced airflow alterations, which creates spatial and temporal heterogeneity. Heterogeneous environments are especially pronounced in CEA systems, where a high crop load, limited natural ventilation and often tall constructions amplify these effects [29]. Fine-tuning of operations in CEA systems therefore requires a thorough understanding of whole-plant functioning and the interlinked plant-climate interactions in such heterogeneous environments. This understanding is still hindered by a knowledge gap in two key areas: First, how leaf-level measurements of gas exchange relate to whole-plant processes within complex plant canopies. Extrapolation is often hindered by factors such as dense plant habitus, which affects airflow and light distribution, as well as heterogeneity within and between leaves, variations in leaf age, and plant developmental stage [30,31,32,33]. Second, how to scale-up point measurements of the heterogeneous environment to inform plant-level decisions. Models are increasingly being used to bridge this gap, offering tools to enhance our understanding of the complex interplay between whole plant morphology and physiology, and environmental factors. Most global models fail to capture the complex cross-talk between plant and environment, often simplifying plant physiology, representing it in generalized layers or zones [26,34,35] or by individual leaves [36,37], or homogenizing environmental parameters. Gu and Goto [38] developed a soybean model combining computational fluid dynamics (CFD) modelling with realistic three dimensional (3D) plant representations. This model demonstrated the possibility of simulating the microclimate of plants in a dynamic environment. However, in their approach, transpiration rate was assumed constant and uniform over the surface of the leaf, thus lacking the inclusion of a dynamic interaction between plant and environment. Plas et al. [37] further improved the approach by dynamically resolving leaf temperature and transpiration in function of stomatal resistance and PPFD. Simulations were performed for a small enclosure and stomatal resistance values were taken from published literature. These advanced modelling approaches, such as CFD and 3D plant models, partly address the defined knowledge gaps but they remain highly reliant on validation data that captures whole-plant responses to phylloclimatic drivers.
Comprehensive whole-plant measurements are essential for gaining a deeper understanding of the underlying mechanisms, driving the development of effective data collection methods. Numerous studies investigated environmental effects on whole-plant and canopy gas exchange, mostly using a closed gas exchange systems with multiple chambers [39,40,41,42]. Typically, these chambers are fixed structures, which hinder airflow and create a specific microclimate around the plants that differs from the microclimate experienced by plants in the ambient environment. Song et al. [43] described a dynamic closed canopy gas exchange system with a top that could be opened between measurements to restore the environment. However, the fixed walls limit the system’s ability to achieve a sufficient steady state with the environment, which is particularly problematic when the phylloclimate is the primary focus of the research.
To address the challenge of minimizing cuvette-induced disturbances to the plant-phylloclimate interaction and to enable optimal assessment of the cross-talk between plants and their phylloclimate, a dynamic closed gas exchange system was developed. This system was dubbed DynGES. This system features cuvettes that move completely away from the plants between measurements, thereby reducing their impact on the interactions between whole-plant photosynthesis, transpiration, and the surrounding environment. When operated in a precisely controlled growth chamber, the DynGES enables detailed mapping of the relationships between a wide range of environmental conditions and whole-plant functioning. This capability will enhance our understanding of the dynamic cross-talk between plants and their microclimate, and support future refinement of plant models. Such knowledge, whether integrated into plant models or applied directly, can then be employed to advance the development of CEA systems and optimize their climate control strategies, ultimately improving plant yield and quality while minimizing energy demand.
In this study, the DynGES was used in a controlled environment to investigate the combined effects of temperature and PPFD on whole-plant photosynthesis and transpiration in lettuce (Lactuca sativa L.), a species known for its compact and complex habitus. The research aimed to determine whether the plant-environment relationships observed at the leaf level could be extrapolated to the whole-plant level. Key environmental drivers and their combined impacts on photosynthesis and transpiration were analyzed, and the utility of the DynGES for similar research applications was evaluated. Our specific working hypotheses were: (i) the optimal temperature for whole-plant photosynthesis increases with increasing PPFD, (ii) leaf-level responses cannot be directly and/or linearly translated to whole-plant responses, (iii) whole-plant photosynthesis and transpiration are closely interrelated; and (iv) the newly developed DynGES system enables undisturbed analysis of whole-plant physiological responses such as photosynthesis, respiration and transpiration under varying environmental conditions.

2. Materials and Methods

2.1. Dynamic Whole-Plant Gas Exchange System

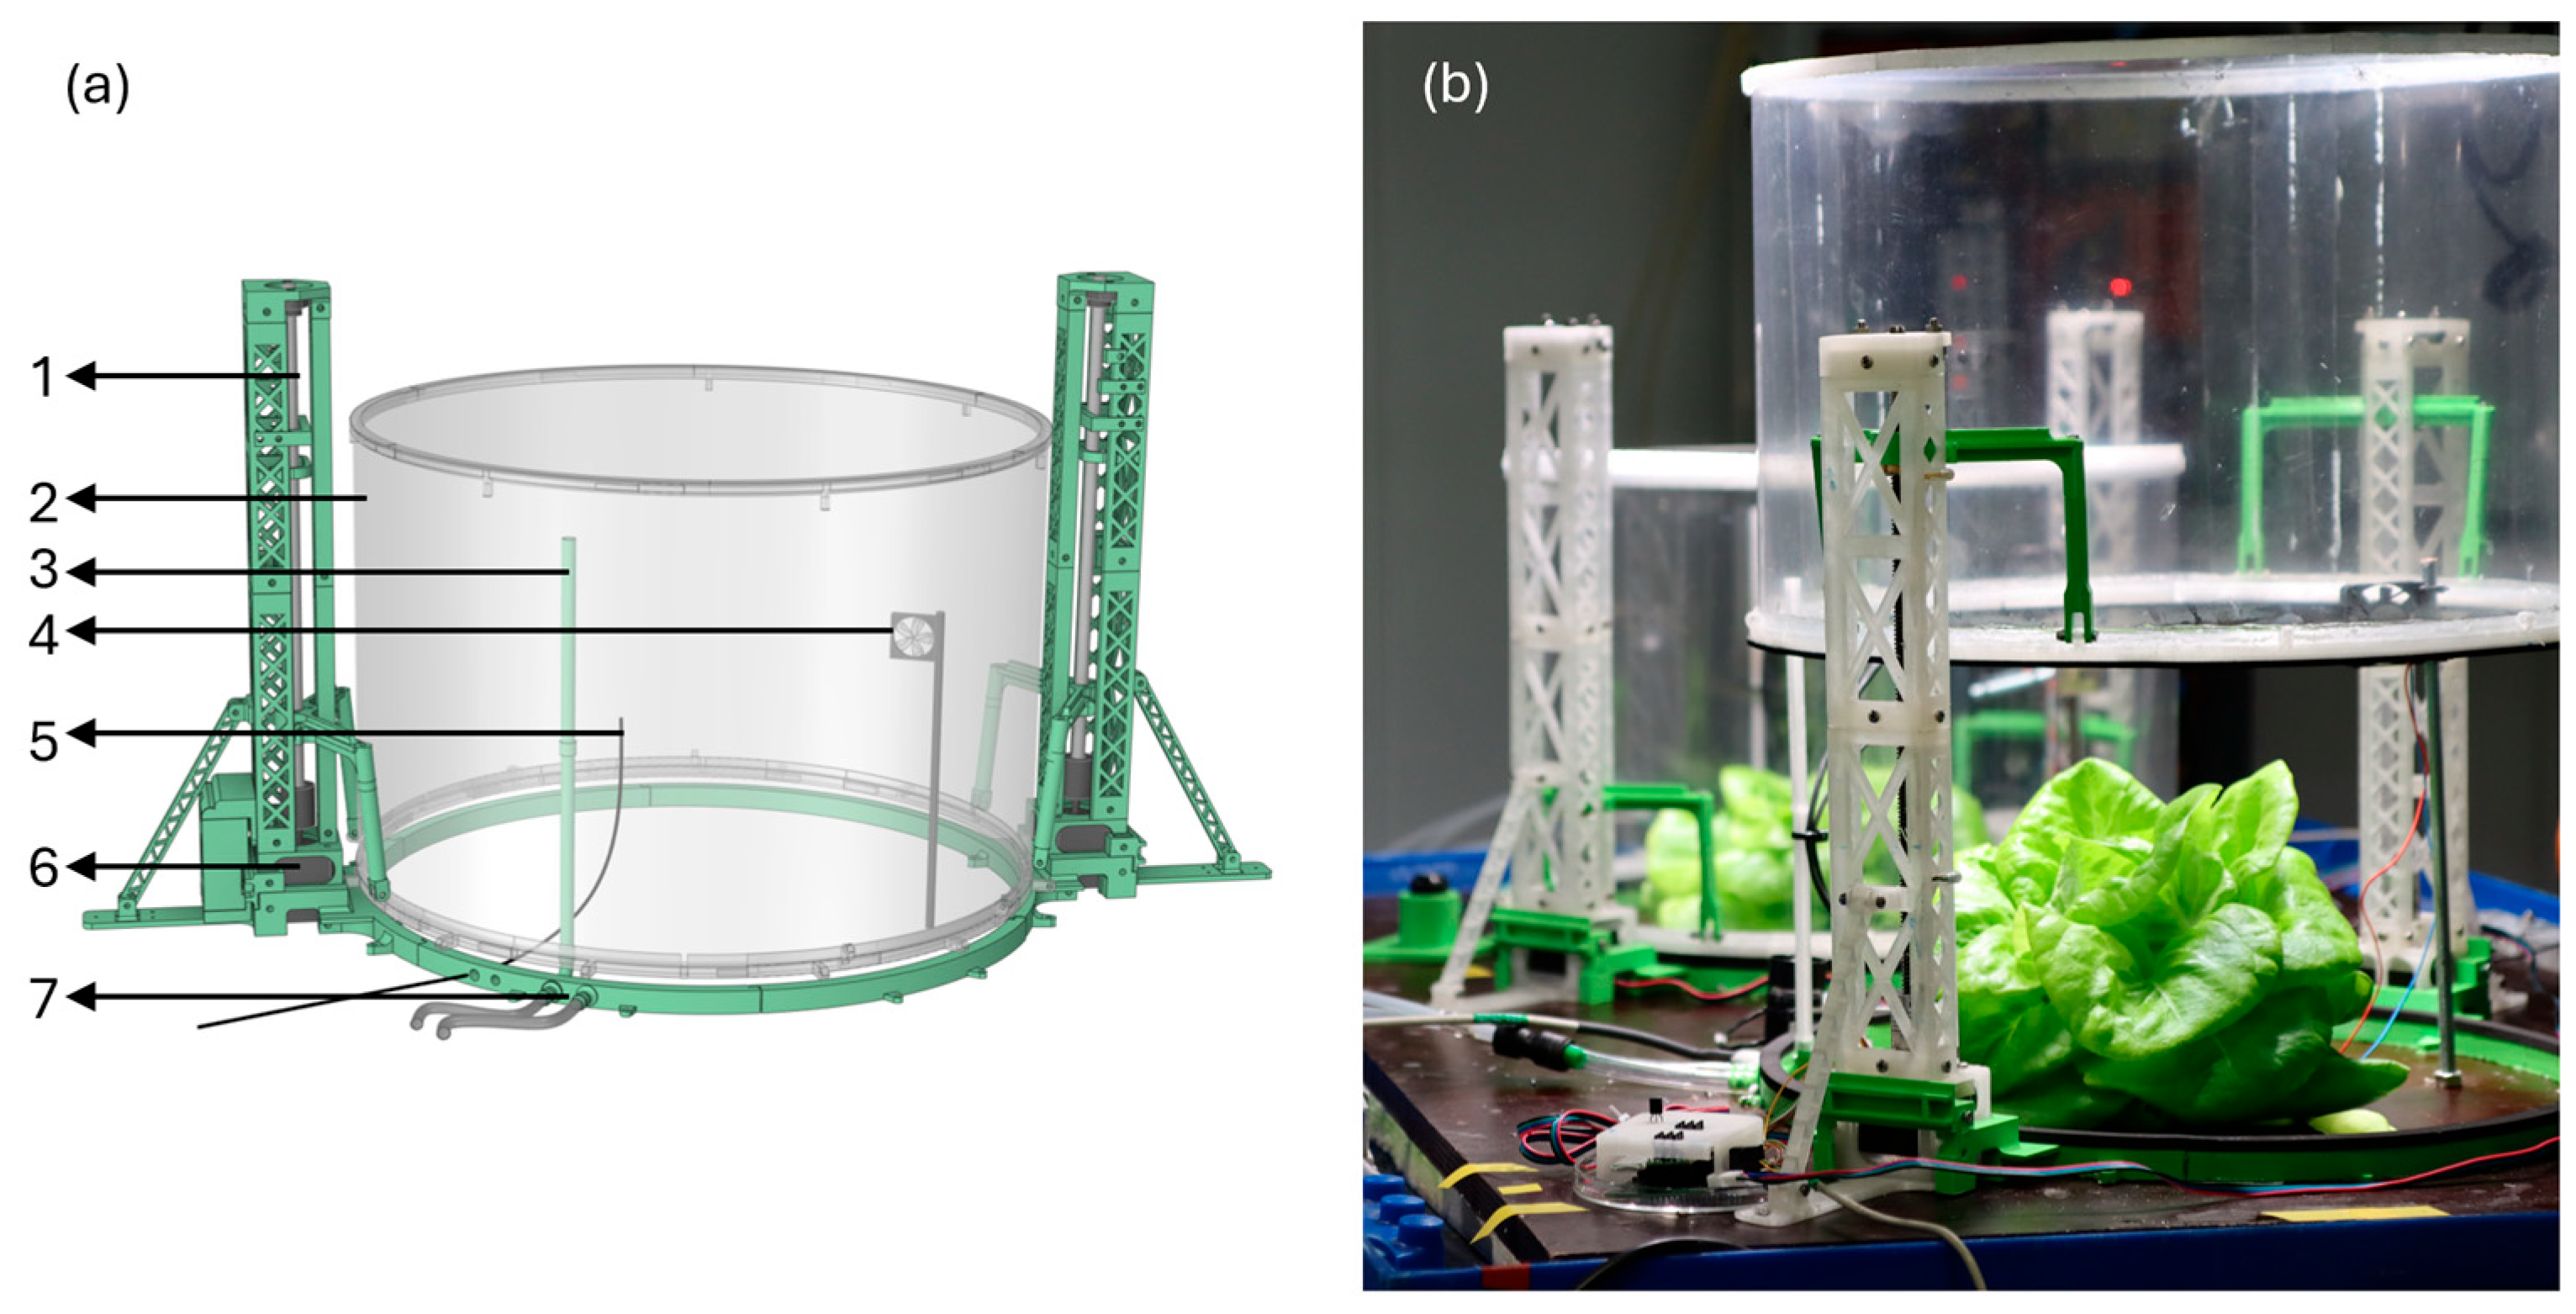
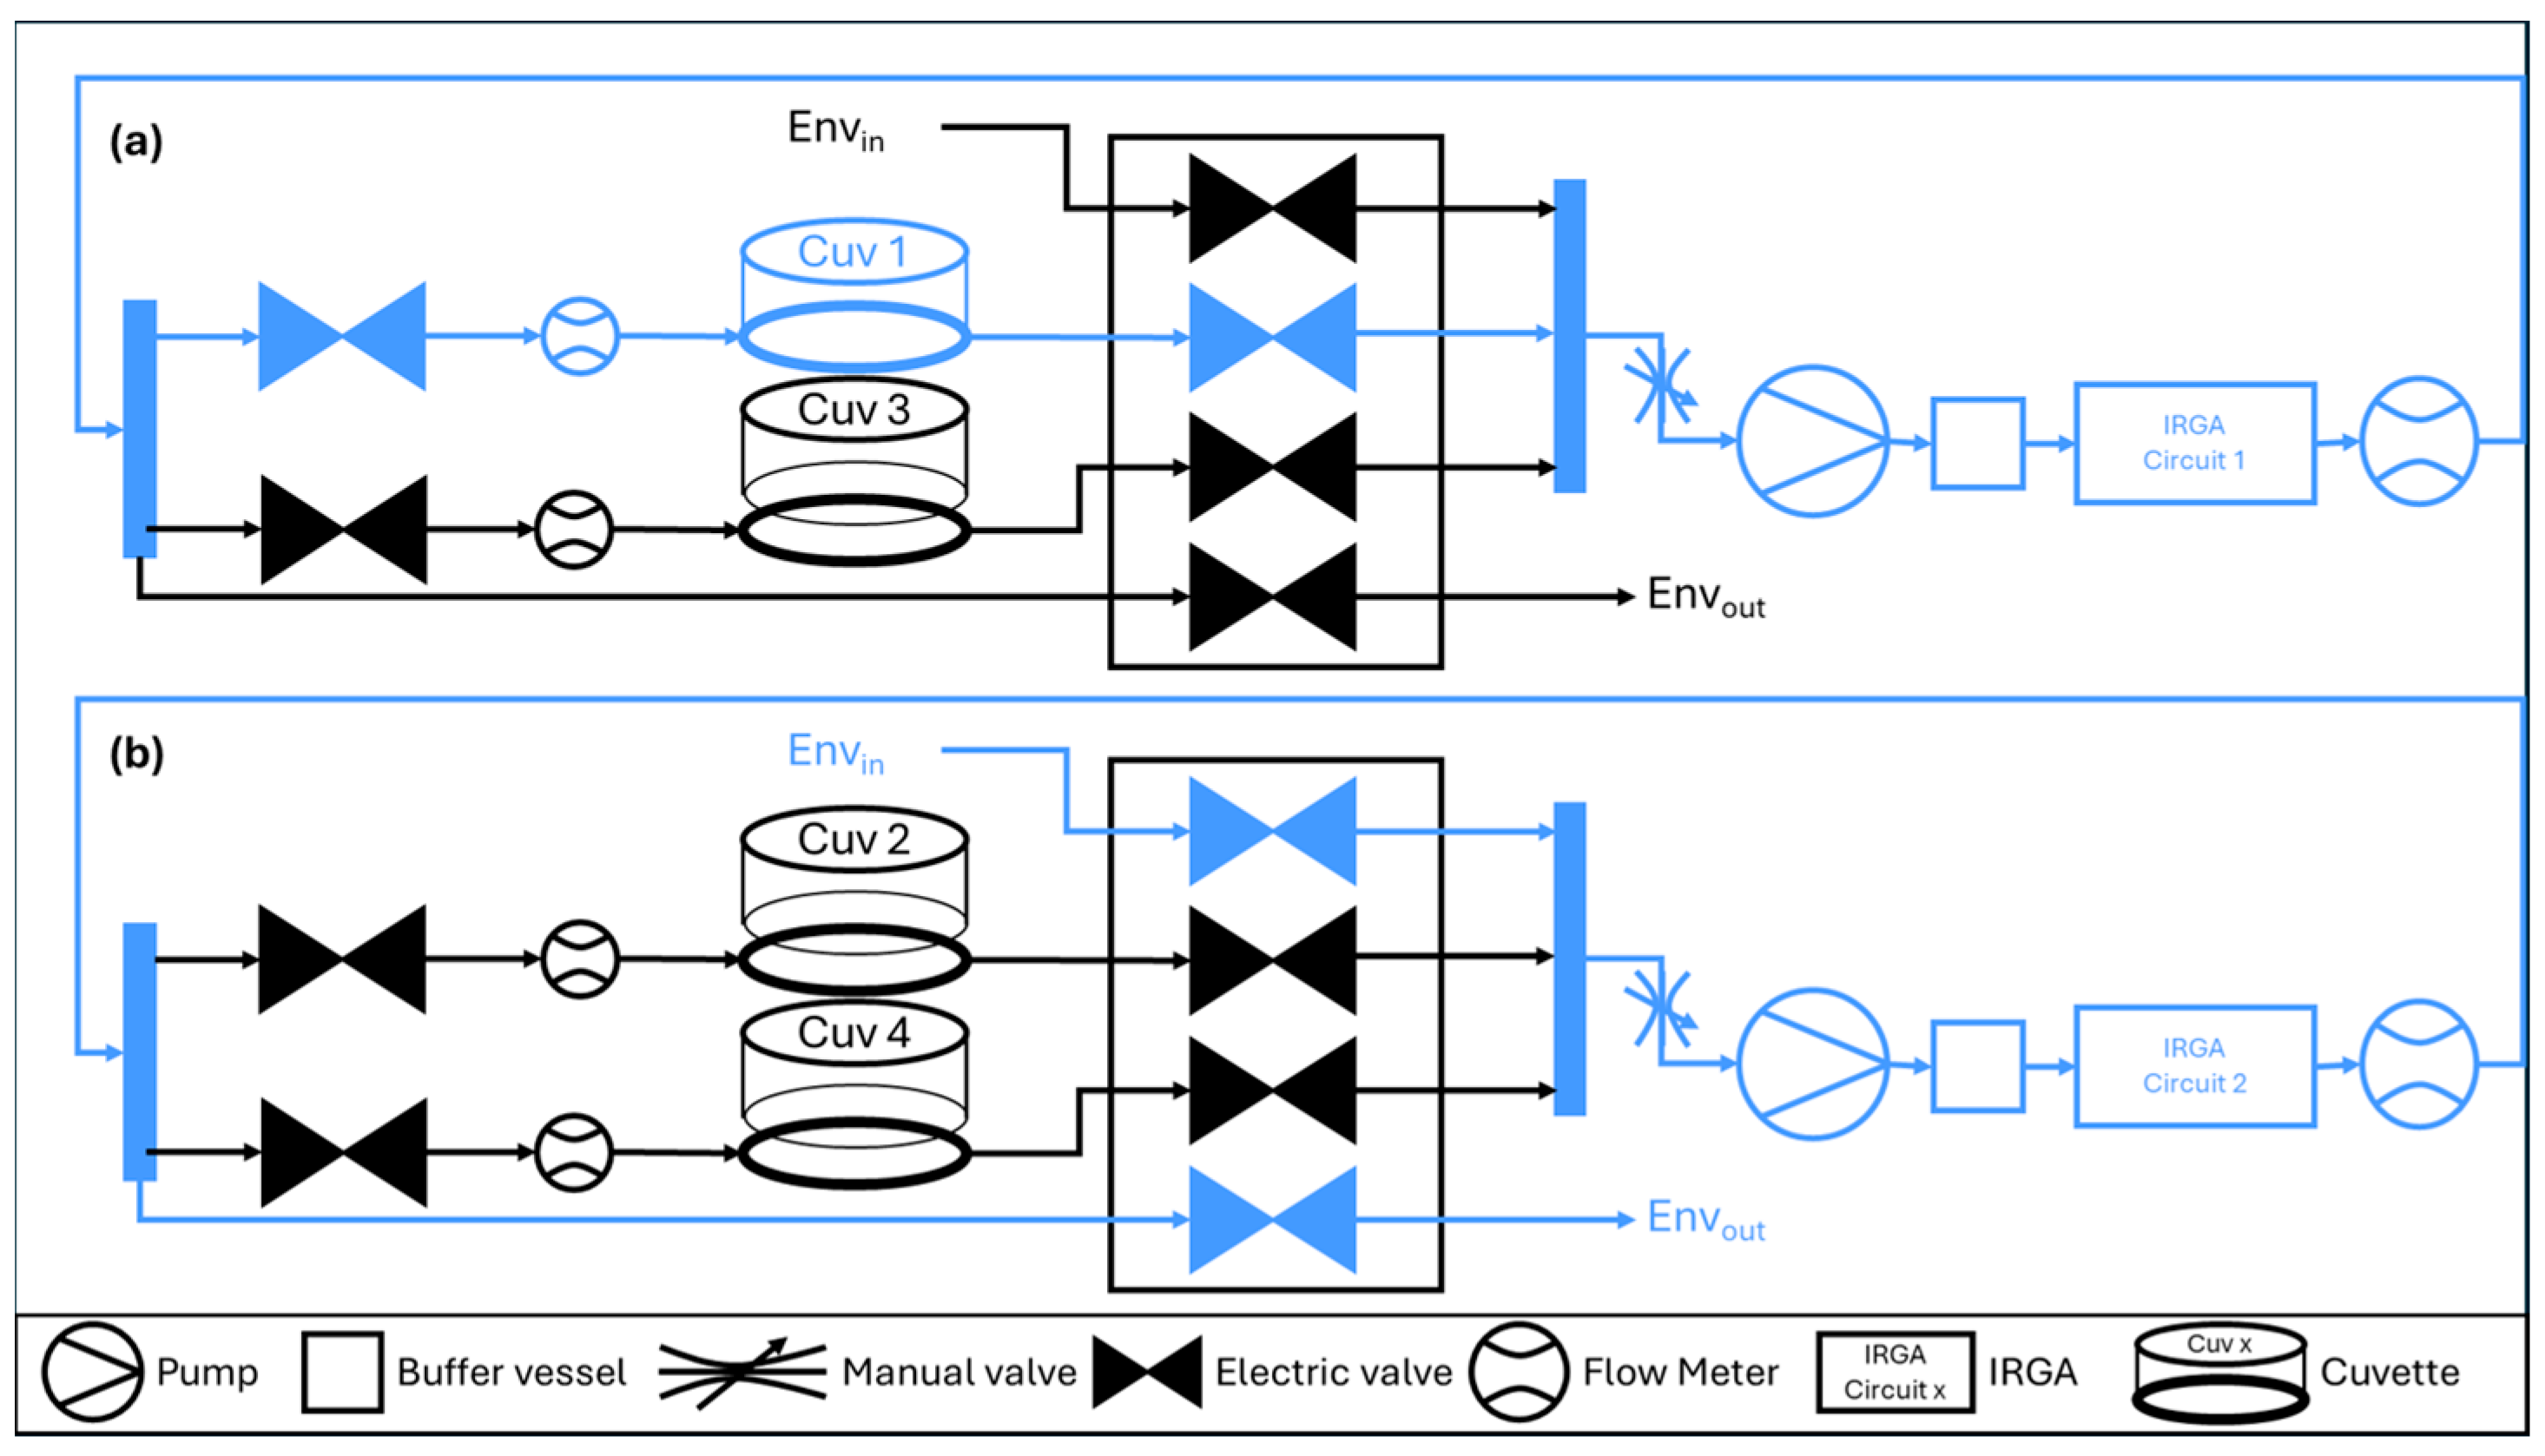
A novel dynamic, closed gas exchange system, referred to as DynGES, was developed with vertically adjustable whole-plant cuvettes (Figure 2). This system was used to continuously monitor the whole-plant photosynthesis, respiration and transpiration rates under different conditions, while minimizing the cuvettes’ impact on natural plant-environment interactions. Two identical measurement-circuits were used, each equipped with two mobile whole-plant cuvettes and one infra-red gas analyzer (IRGA, Model Li840A, LI-COR, Lincoln, NE, USA; Figure 3). Both IRGAs continuously measured the concentration of CO2 and H2O within their respective circuits. Each circuit was further equipped with a manual valve to regulate airflow through the circuit, a vacuum pump (VP 86, VWR, Radnor, PA, USA), an empty buffer vessel (0.2 L) to stabilize airflow fluctuations, and three flow meters (AWM5102, Honeywell, Charlotte, NC, USA), one before each cuvette and one following the IRGA. Airflow was regulated by electric valves.
Within each circuit, a measurement cycle for one cuvette is alternated with a flushing cycle. During the measurement cycle, air circulates in a closed loop, with only the selected cuvette remaining closed. This configuration allows the IRGA in that circuit to continuously measure the CO2- and H2O-concentration, reflecting the conditions inside the closed cuvette (Figure 3a). Simultaneously, the second circuit undergoes a flushing cycle, during which the valves redirect airflow to allow ambient air to pass through the pump, buffer vessel, IRGA and flow meter (Figure 3b). During the cuvette-experiments, two circuits operated in tandem, enabling quasi-continuous measurements of four plants. Each cuvette was closed for 5 min per cycle, including a closing time of 30 s, during which the previous cuvette opened again. Measurements were recorded every minute, with the first minute discarded due to the closing procedure. Preliminary tests showed stable measurements between cuvette closure and 5 min after closing. The 5th minute was included because cuvette-opening and the final measurement tended to overlap, ensuring at least 3 min of useable data. Subsequent analyses evaluated data stability.
Each cuvette (Figure 2) was equipped with two stepper motors (NEMA17 stepper motor, 123-3D, Almere, the Netherlands) to ensure precise vertical movement control. The cuvettes were constructed from transparent PVC sheets (0.3 mm thick) with a diameter of 40 cm and a height of 29 cm. The air inlet was positioned 25 cm above the base and 1 cm from the cuvette’s sidewall, while the air outlet was located at the base to ensure efficient airflow management. A small fan with an airflow of 15 L·min−1 (412FH, ebm-papst, Beek en Donk, the Netherlands) was installed opposite the air inlet, at a height of 20 cm and 3 cm from the sidewall and ensured uniform air mixing inside the closed cuvette and ventilation in the opened cuvette. In the open state, the cuvettes were elevated by 20 cm, allowing lettuce plants to be fully exposed to the environment within the growth chamber. All base and support structures were designed and 3D-printed at the UGent Laboratory of Plant Ecology (Ghent, Belgium). Leakage of the cuvettes was assessed by introducing high (800 ppm) and low (140 ppm) CO2 concentrations in the cuvette and registering the change in CO2 concentration as a function of time until it equilibrated with the ambient concentration. The maximum CO2 deltas (∆CO2) observed during the leakage test accounted for no more than 2% of the ∆CO2 measured during the experiments. Therefore, leakage was considered negligible. A RH-sensor (RH; HIH-4000, Honeywell, Charlotte, NC, USA) and a thermistor (GA10K3MBD1, TE Connectivity, Schaffhausen, Swiss) were installed inside the cuvette, positioned at a height of 15 cm and 7 cm from the sidewall to monitor RH and temperature conditions. The airflow rates during Experiments 1 and 2 were comparable, averaging 0.28 ± 0.04 L·min−1 and 0.31 ± 0.07 L·min−1 (mean ± sd), respectively. In Experiment 3, the airflow rate was 0.92 ± 0.7 L·min−1, approaching the upper operational limit of the IRGAs, which is 1 L·min−1. This increase in airflow rate during Experiment 3 was introduced to evaluate the effect of airflow system performance, specifically focusing on the sample volume transported from the cuvette to the IRGA.

2.2. Plant Material and Growing Conditions

Three repeated cuvette experiments were conducted at the Faculty of Bioscience Engineering in Ghent (Ghent University, Gent, Belgium). For each experiment, a different batch of green butterhead lettuce was used (Lactuca sativa L. cv. ‘Alyssa’, Rijk Zwaan, De Lier, The Netherlands). The experiments were conducted during May, June and November of 2023.
Throughout all stages of this study, PPFD was measured at the start of each experiment using a calibrated miniature spectrometer equipped with a CC-3-DA cosine corrector (Model Flame-NIR, Ocean Optics, Largo, FL, USA). The spectrometer was positioned on the growing bed. Temperature and RH were continuously monitored using an SHT25 sensor (Sensirion, Stäfa, Switzerland) housed in a radiation shield and carefully placed 15 cm above the growing bed.
Lettuce seeds were sown in Jiffy-7 pellets (Jiffy Products International B.V., Zwijndrecht, The Netherlands) and germinated in a growth chamber equipped with broad-spectrum white LEDs (NS1, Valoya, Helsinki, Finland). Seedlings received a PPFD of 185.4 ± 18.7 μmol·m−2·s−1 (16 h/8 h light/dark). The temperature was maintained at 18.0 ± 0.5 °C. Seedlings were transferred to a second growth chamber after 21 days for the first batch and after 15 days for the second and third batches. The first two batches of plants (Experiment 1 and 2) were exposed to broad-spectrum white light from Alina fixtures, while the third batch (Experiment 3) received similar broad-spectrum white light from a Lyda fixture (Alina/Lyda, RAYN Growing Systems-ETC, Middleton, WI, USA). Both lighting systems provided a PPFD of 200 ± 10 μmol·m−2·s−1. Temperature and RH conditions are summarized in Table 2.
The cuvette experiments were conducted in a third growth chamber (WEKK 10.40.8.L, Weisstechnik, Tiel, Germany), equipped with the custom-designed DynGES, which includes four dynamic whole-plant cuvettes (Figure 2 and Figure 3). Above each cuvette, a Rosa light fixture (RAYN Growing Systems—ETC, Middleton, WI, USA) was installed at a height of 58 cm above the growing bed. The three experiments started 53, 42 and 56 days after sowing, corresponding to 32, 27 and 41 days after transplanting, respectively.
During both the growth stage and the cuvette experiments, plants were grown using a deep water culture system, where Styrofoam rafts were floated on 200 L drip trays. During the growth stage, each tray accommodated 12 plants, spaced 26 cm apart. During the cuvette experiments, each tray supported two cuvettes, and thus housed two plants. The same nutrient solution was used across all growth phases, including germination, and contained 0.59 mM NH4+, 6.74 mM K+, 4.22 mM Ca2+, 1.69 mM Mg2+, 13.58 mM NO3, 1.35 mM H2PO4 and 2.11 mM SO42−. Micronutrients were separately added (0.02 g/L Chelal Flor NF, BMS MicroNutrients NV, Bornem, Belgium), resulting in 15.70 μM B, 0.98 μM Cu2+, 27.20 μM Fe3+, 8.01 μM Mn2+, 0.52 μM Mo and 3.98 μM Zn2+. The electric conductivity (EC) of the nutrient solution was maintained at approximately 2 mS·cm−1. The solution remained stable throughout each experiment, minimizing variability in plant response.

2.3. Experimental Design

To gain comprehensive insight into the effects of the environment on plant physiology, three cuvette experiments were conducted. These experiments aimed to expose plants to a wide range of temperature and PPFD combinations within the operational limits of the growth chamber. Given that lettuce is both cold-tolerant and commonly grown in greenhouse environments, a broad temperature range (5–35 °C) was applied.
For the cuvette experiments, broad-spectrum white LEDs in the Rosa fixtures were selected as the preferred light source. Across the three experiments, four distinct light intensity levels were applied: 57.6 ± 2.9 µmol·m−2·s−1, 108.3 ± 4.2 µmol·m−2·s−1, 220.8 ± 10.1 µmol·m−2·s−1 and 328.8 ± 27.3 µmol·m−2·s−1. PPFD measurements were performed using the calibrated Flame miniature spectrometer, as described above, at the center of each closed cuvette. For clarity throughout the text, these light intensity levels are rounded to 60, 110, 220 and 330 µmol·m−2·s−1, respectively.
During Experiment 1, light intensity was decreased daily from 330 µmol·m−2·s−1 on day one to 220 µmol·m−2·s−1 on days two and three, 110 µmol·m−2·s−1 on day four and 60 µmol·m−2·s−1 on day five. Each day, temperature was gradually varied from 5 to 35 °C in 5 °C steps, with each step lasting 1.5 h to ensure sufficient environmental stabilization. In Experiments 2 and 3, the measurement protocol was condensed by varying the temperature every four hours. Between each temperature step, the temperature was steadily adjusted to prevent oscillations, with an additional hour introduced between steps. During each temperature step, the light intensity cycled through the four pre-determined levels (60, 110, 220, and 330 µmol·m−2·s−1), with each intensity level maintained for one hour. Similarly to Experiment 1, the temperature increased in 5 °C increments. In Experiment 2, over the first two days, the temperature ranged from 20 to 10 °C, while on the third day, it ranged from 25 °C to 35 °C. In Experiment 3 temperatures ranged from 20 to 5 °C on day one, and from 25 to 35 °C on day two. Night temperatures, coinciding with dark periods, were set to 15 °C in Experiment 1 and 20 °C in both Experiments 2 and 3, allowing the environment and plants to stabilize between measurement days. RH remained relatively stable during both Experiments 1 and 3, averaging 92.2 ± 5.5% and 87.5 ± 4.7%, respectively. However, in Experiment 2, deviations in growth chamber controls caused fluctuations in RH, particularly at higher temperatures on day three. Mean RH was 89.7 ± 4.1% during days one and two. On day three, as temperatures increased, RH decreased, varying from 81.6 ± 4.2% at 25 °C to 69.2 ± 3.0% at 35 °C. The mean CO2-concentration in the growth chamber during Experiments 1, 2 and 3 was 422.7 ± 19.9, 410.8 ± 16.5 and 406.5 ± 12.5 ppm, respectively.
After each experimental cycle, leaves were carefully separated from each plant, arranged on a light panel and photographed to determine their individual leaf area and the total leaf area per plant. Post-processing of the images was conducted using ImageJ (version 1.54g) [44]. The total leaf area was subsequently used for further data analysis, as it proved a more accurate and standardized basis for comparison between plants across the three experiments.

2.4. Data Processing and Statistical Analysis

Environmental data, output of the IRGAs, airflow data and status data of the cuvettes were registered every minute using a datalogger (CR-1000, Campbell Scientific, Logan, UT, USA). Data were retrieved and stored using the PhytoSense software (V1.6; Plant AnalytiX, Mariakerke, Belgium). Data formatting, visualization and analysis, followed by a statistical analysis of the data were performed in R software (version 4.4) [45]. VPD was calculated from temperature (T) and RH using Formula (1).
V P D = 0.6108 e 17.27 T T + 237.36 1 R H 100
Whole-plant photosynthetic and transpiration rates were calculated from the decrease in CO2 concentration and the increase in H2O concentration between two consecutive minutes within a closed cuvette. The stabilization period required for these rates after cuvette closure was determined by analyzing the changes (deltas) in CO2 and H2O concentrations over time. Data from the first minute after cuvette closure were discarded, as this period coincided with the closing process, introducing variability. Similarly, data from the second minute were excluded because whole-plant photosynthesis and transpiration rates differed by more than 5% on average compared to the subsequent measurement point. After the second minute, differences between consecutive data points typically fell below 3%. Therefore, only data from the third, fourth, and fifth minutes after cuvette closure were used for analysis. To ensure a stable and homogeneous environment, data recorded during pre-set temperature transitions of the growth chamber was omitted from the analysis. Due to technicalities encountered during the experiments, data from two plants were excluded from Experiment 1, and data from one plant were excluded from both Experiments 2 and 3. This resulted in a final dataset of 720 data points for Experiment 1, 674 data points for Experiment 2 and 403 data points for Experiment 3, with each data point including environmental data and whole-plant gas exchange measurements.
The data were analyzed using linear mixed models (LMM) with RH, temperature, PPFD and their interactions as fixed effects and the different experiments as a random effect (lme4 package) [46]. Since night conditions remained constant throughout the experiments, these data were excluded from the LMMs. Significance p-values were calculated using the lmerTest package [47]. Stepwise backward regression was applied for model selection towards a model where all contributing variables and interactions were significant (p < 0.05). The effect of PPFD on whole-plant photosynthetic rate was assumed to be linear in the PPFD-range under consideration, being smaller than 300 µmol·m−2·s−1 [48,49]. The effect of temperature, both as a main variable and within the interaction temperature-PPFD, was assumed to follow a polynomial function [15]. The LMMs were fitted on a training dataset and validated using a test dataset, each containing half of the data, randomly assigned. The model terms and their coefficients are added in Table A1 and Table A2. Validation of the model towards the test dataset involved calculating R2 and RMSE. Sensitivity indices for both LMMs were calculated using the Sobol’ method (sensitivity package) [50,51].
Literature, mainly based on leaf-level studies, suggests an increasing tendency in temperature optimum for whole-plant photosynthetic rates at higher PPFD levels. To investigate this trend, the LMM for whole-plant photosynthetic rate (LMM-Ap) was applied to a generated dataset including a broad range of temperature and PPFD combinations. Simulations were conducted across a temperature range of 5 to 35 °C in steps of 0.01 °C, and a PPFD range from 50 to 400 µmol·m−2·s−1 in steps of 50 µmol·m−2·s−1. Optimal temperatures were calculated for each PPFD-level. To isolate the combined effect of temperature and PPFD on the whole-plant photosynthetic rate, RH was kept constant at 75%, a commonly preferred level for lettuce cultivation in CEA systems. Additional simulations incorporating a broader range for RH were performed and used to quantify the combined effect of temperature and RH, aggregated in VPD, and PPFD on whole-plant photosynthetic rate. Similarly, the LMM for whole-plant transpiration rate (LMM-Tp) was applied to simulate responses across the same range of environmental parameters. However, for LMM-Tp, only temperature and RH combinations observed during the cuvette experiments were included. This restriction ensured that extreme conditions beyond the calibration limits of the model were excluded.

3. Results

3.1. Environmental Data and Whole-Plant Photosynthesis and Transpiration Across Three Experiments

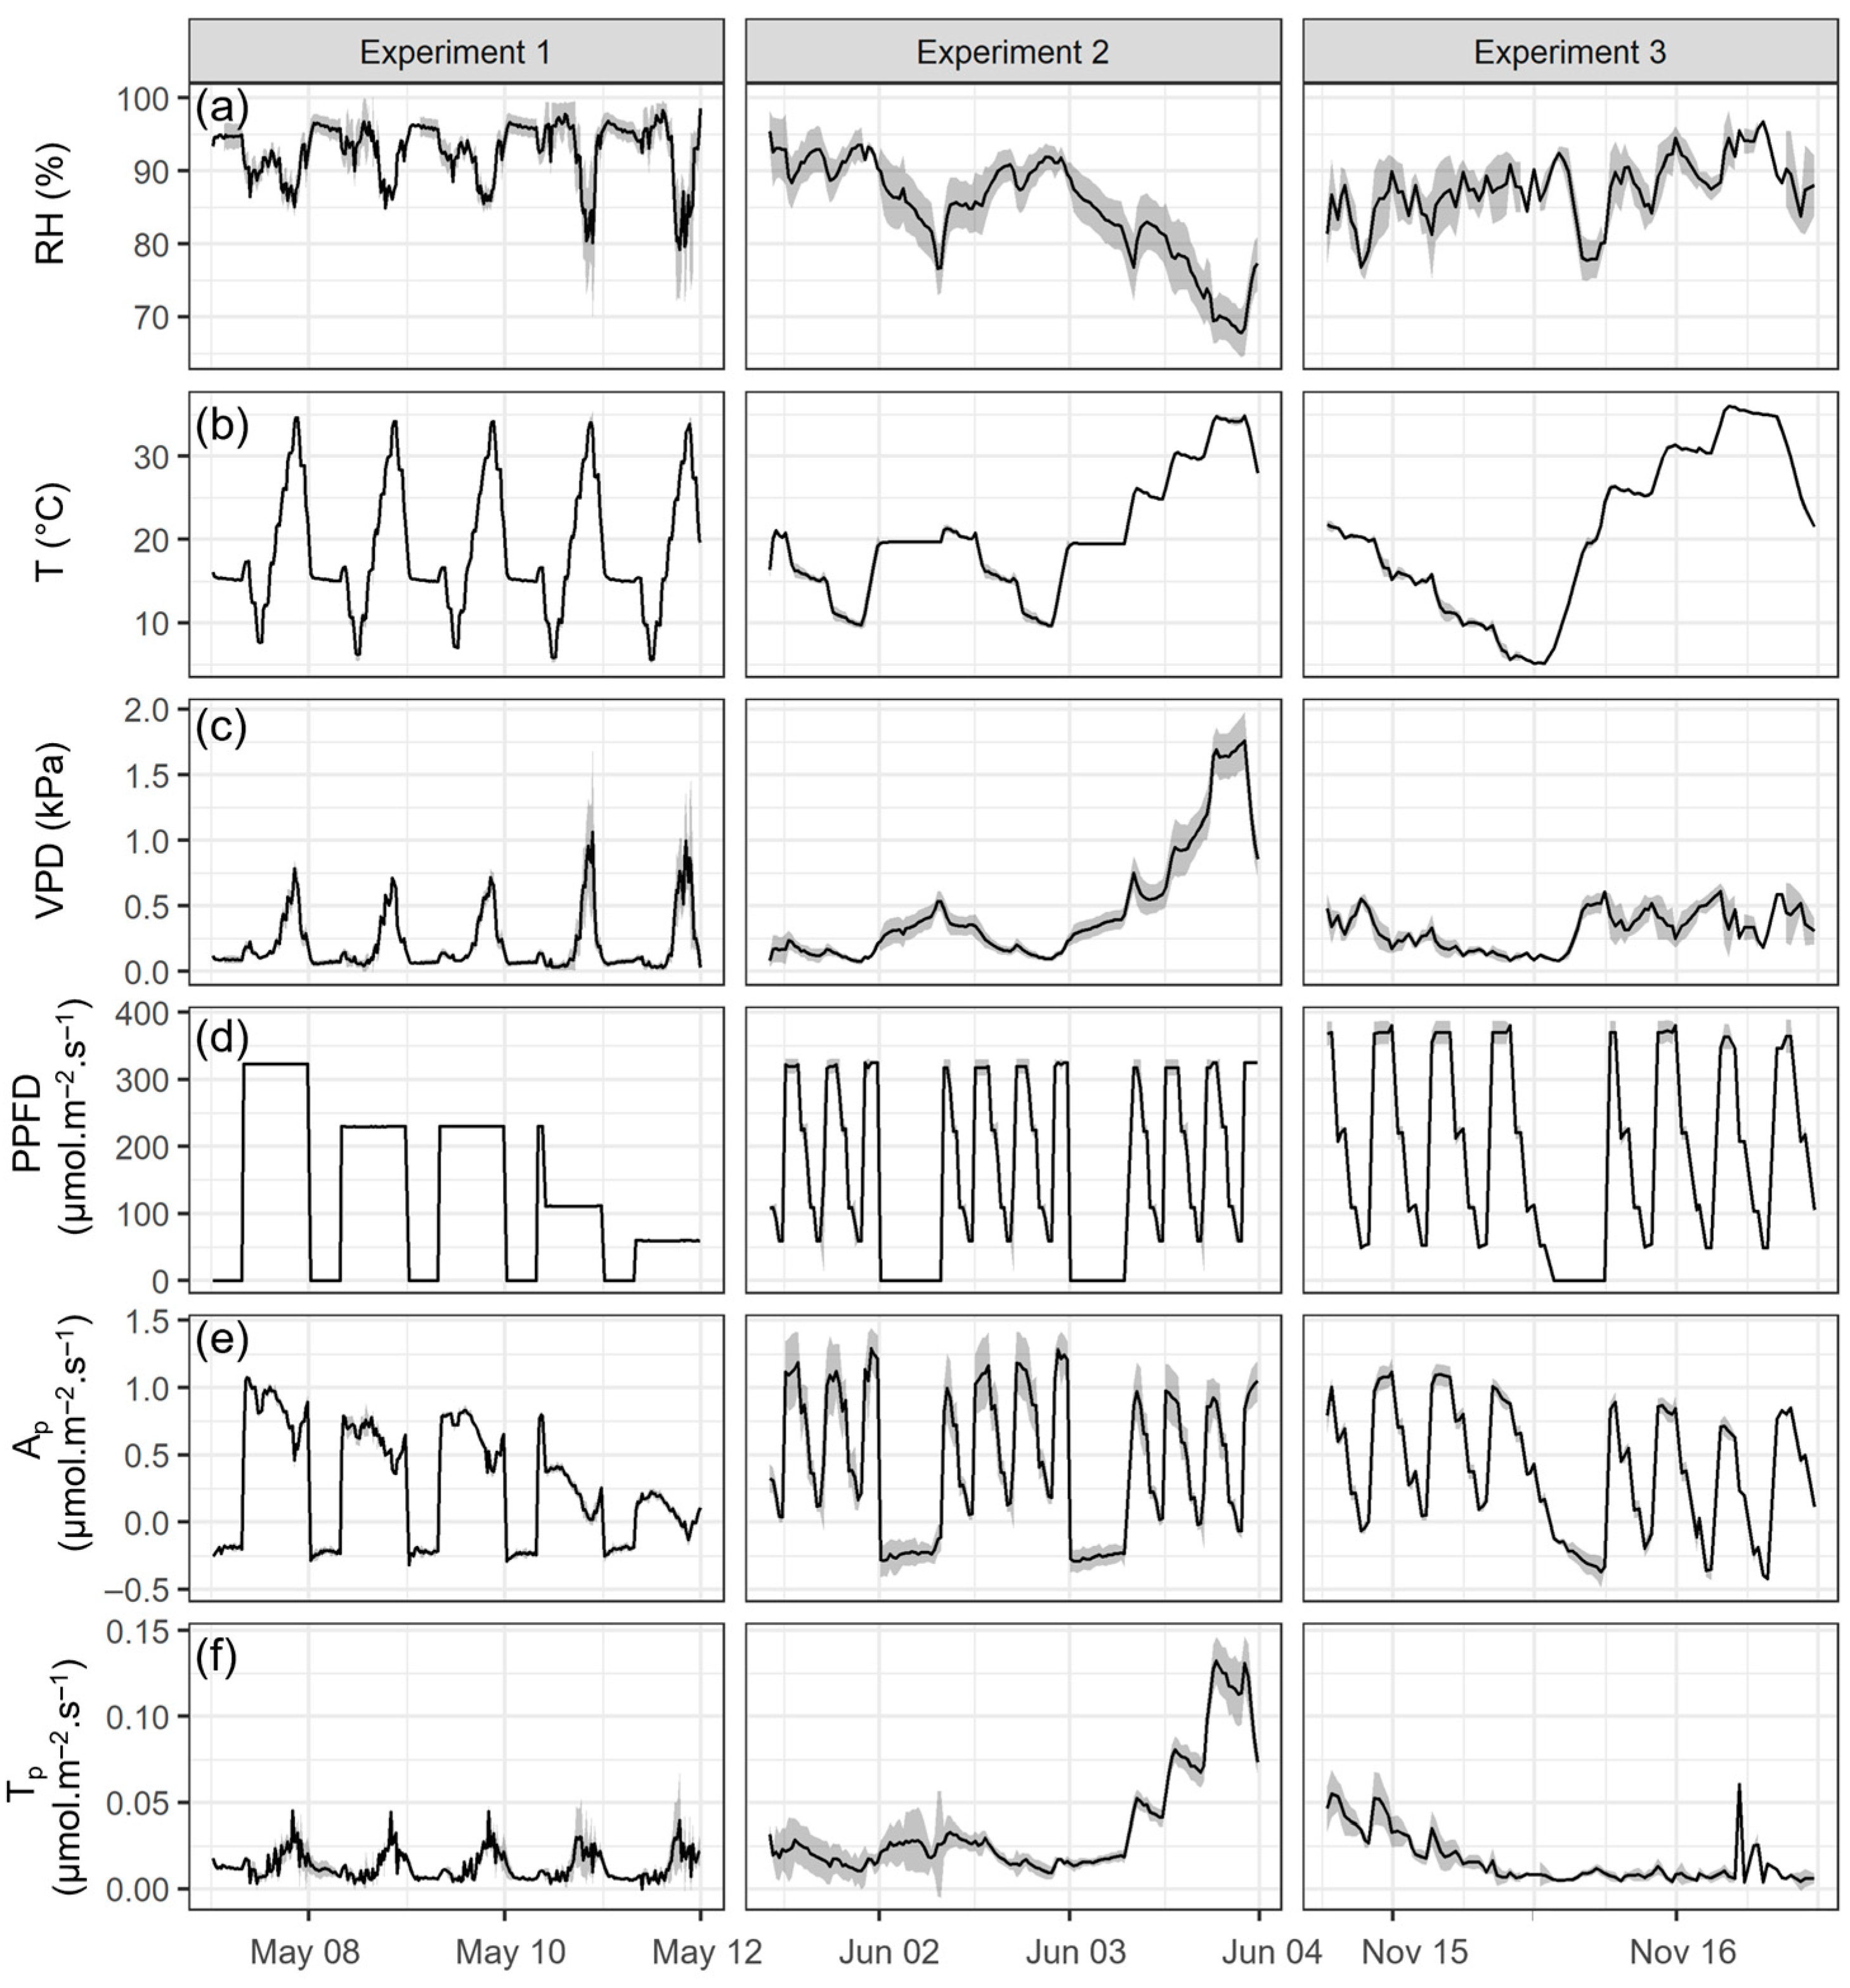
Figure 4 shows the environmental data, as well as the whole-plant photosynthetic and transpiration rates, for the three experiments. To enhance clarity and comparability, mean values were calculated for each 20 min measurement cycle, corresponding to a single closure of each cuvette. To minimize errors, the datapoints from the first two minutes after cuvette closure were discarded from the analysis. Whole-plant photosynthetic and transpiration rates are expressed per square meter of leaf area (Figure 4e–f). The mean leaf area for Experiment 1 was 0.436 ± 0.008 m2, for Experiment 2 was 0.265 ± 0.022 m2 and for Experiment 3 was 0.421 ± 0.070 m2.

3.2. Whole-Plant Photosynthetic Rates Across Temperature, VPD and PPFD Levels

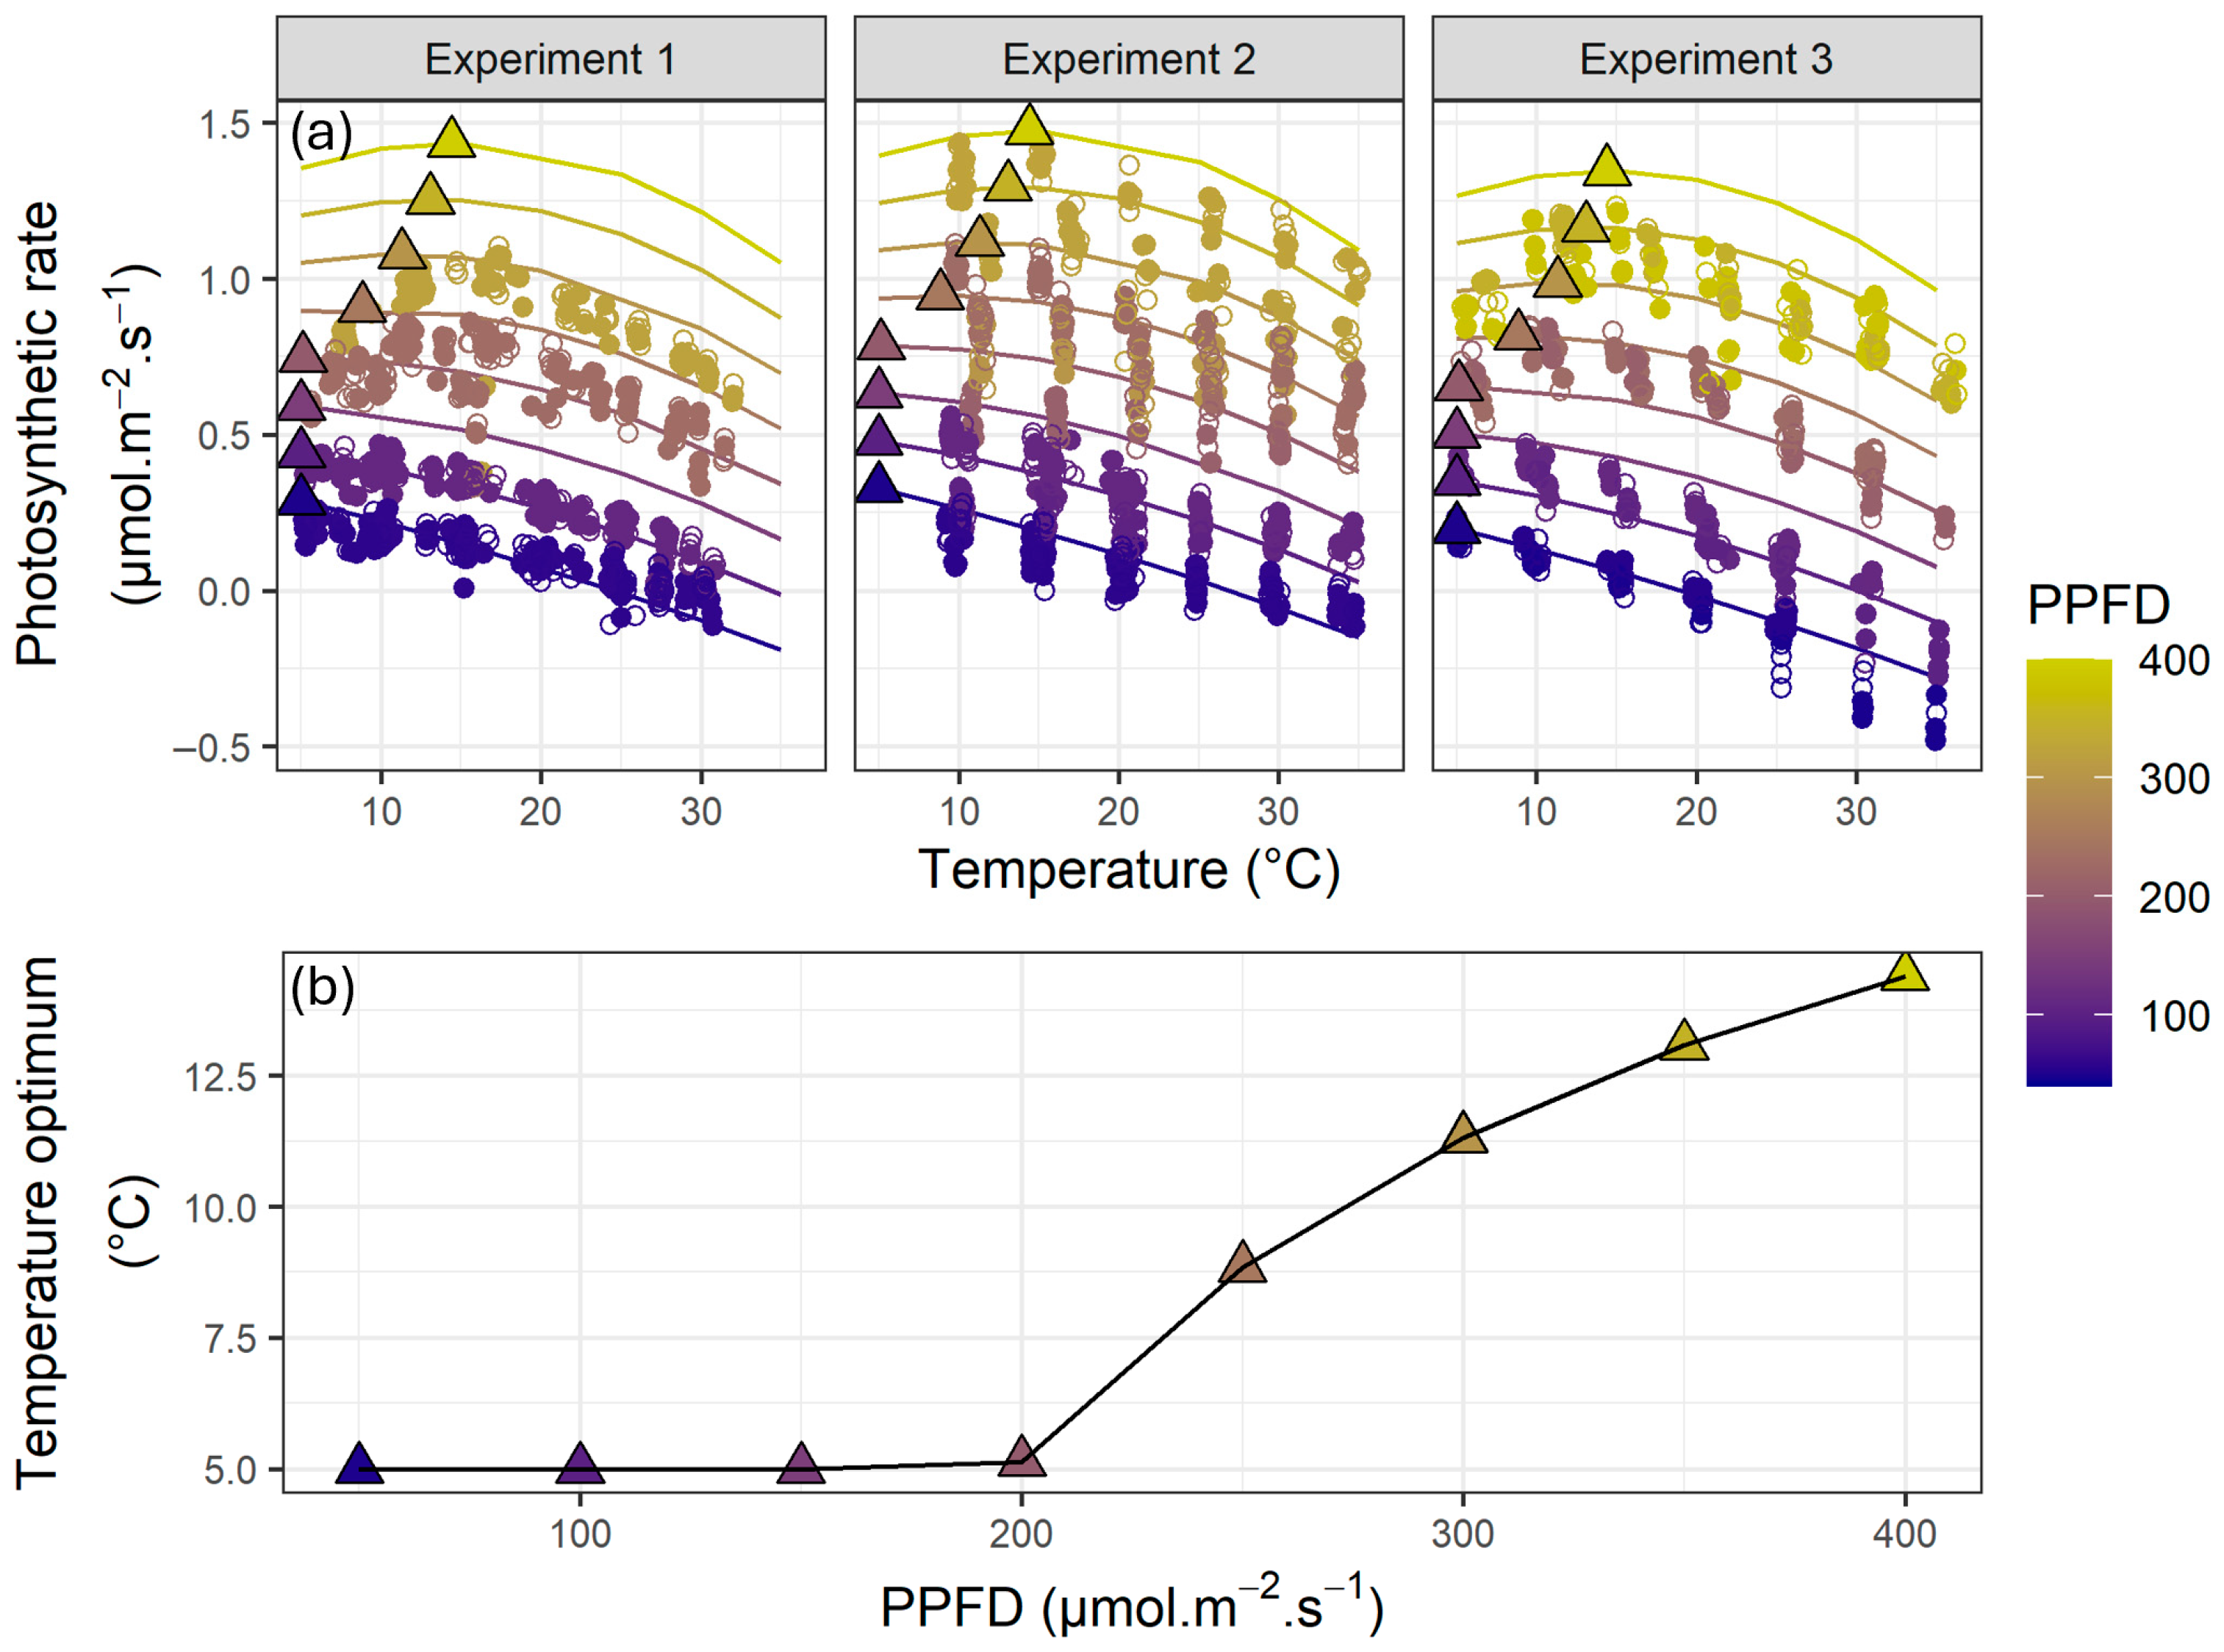
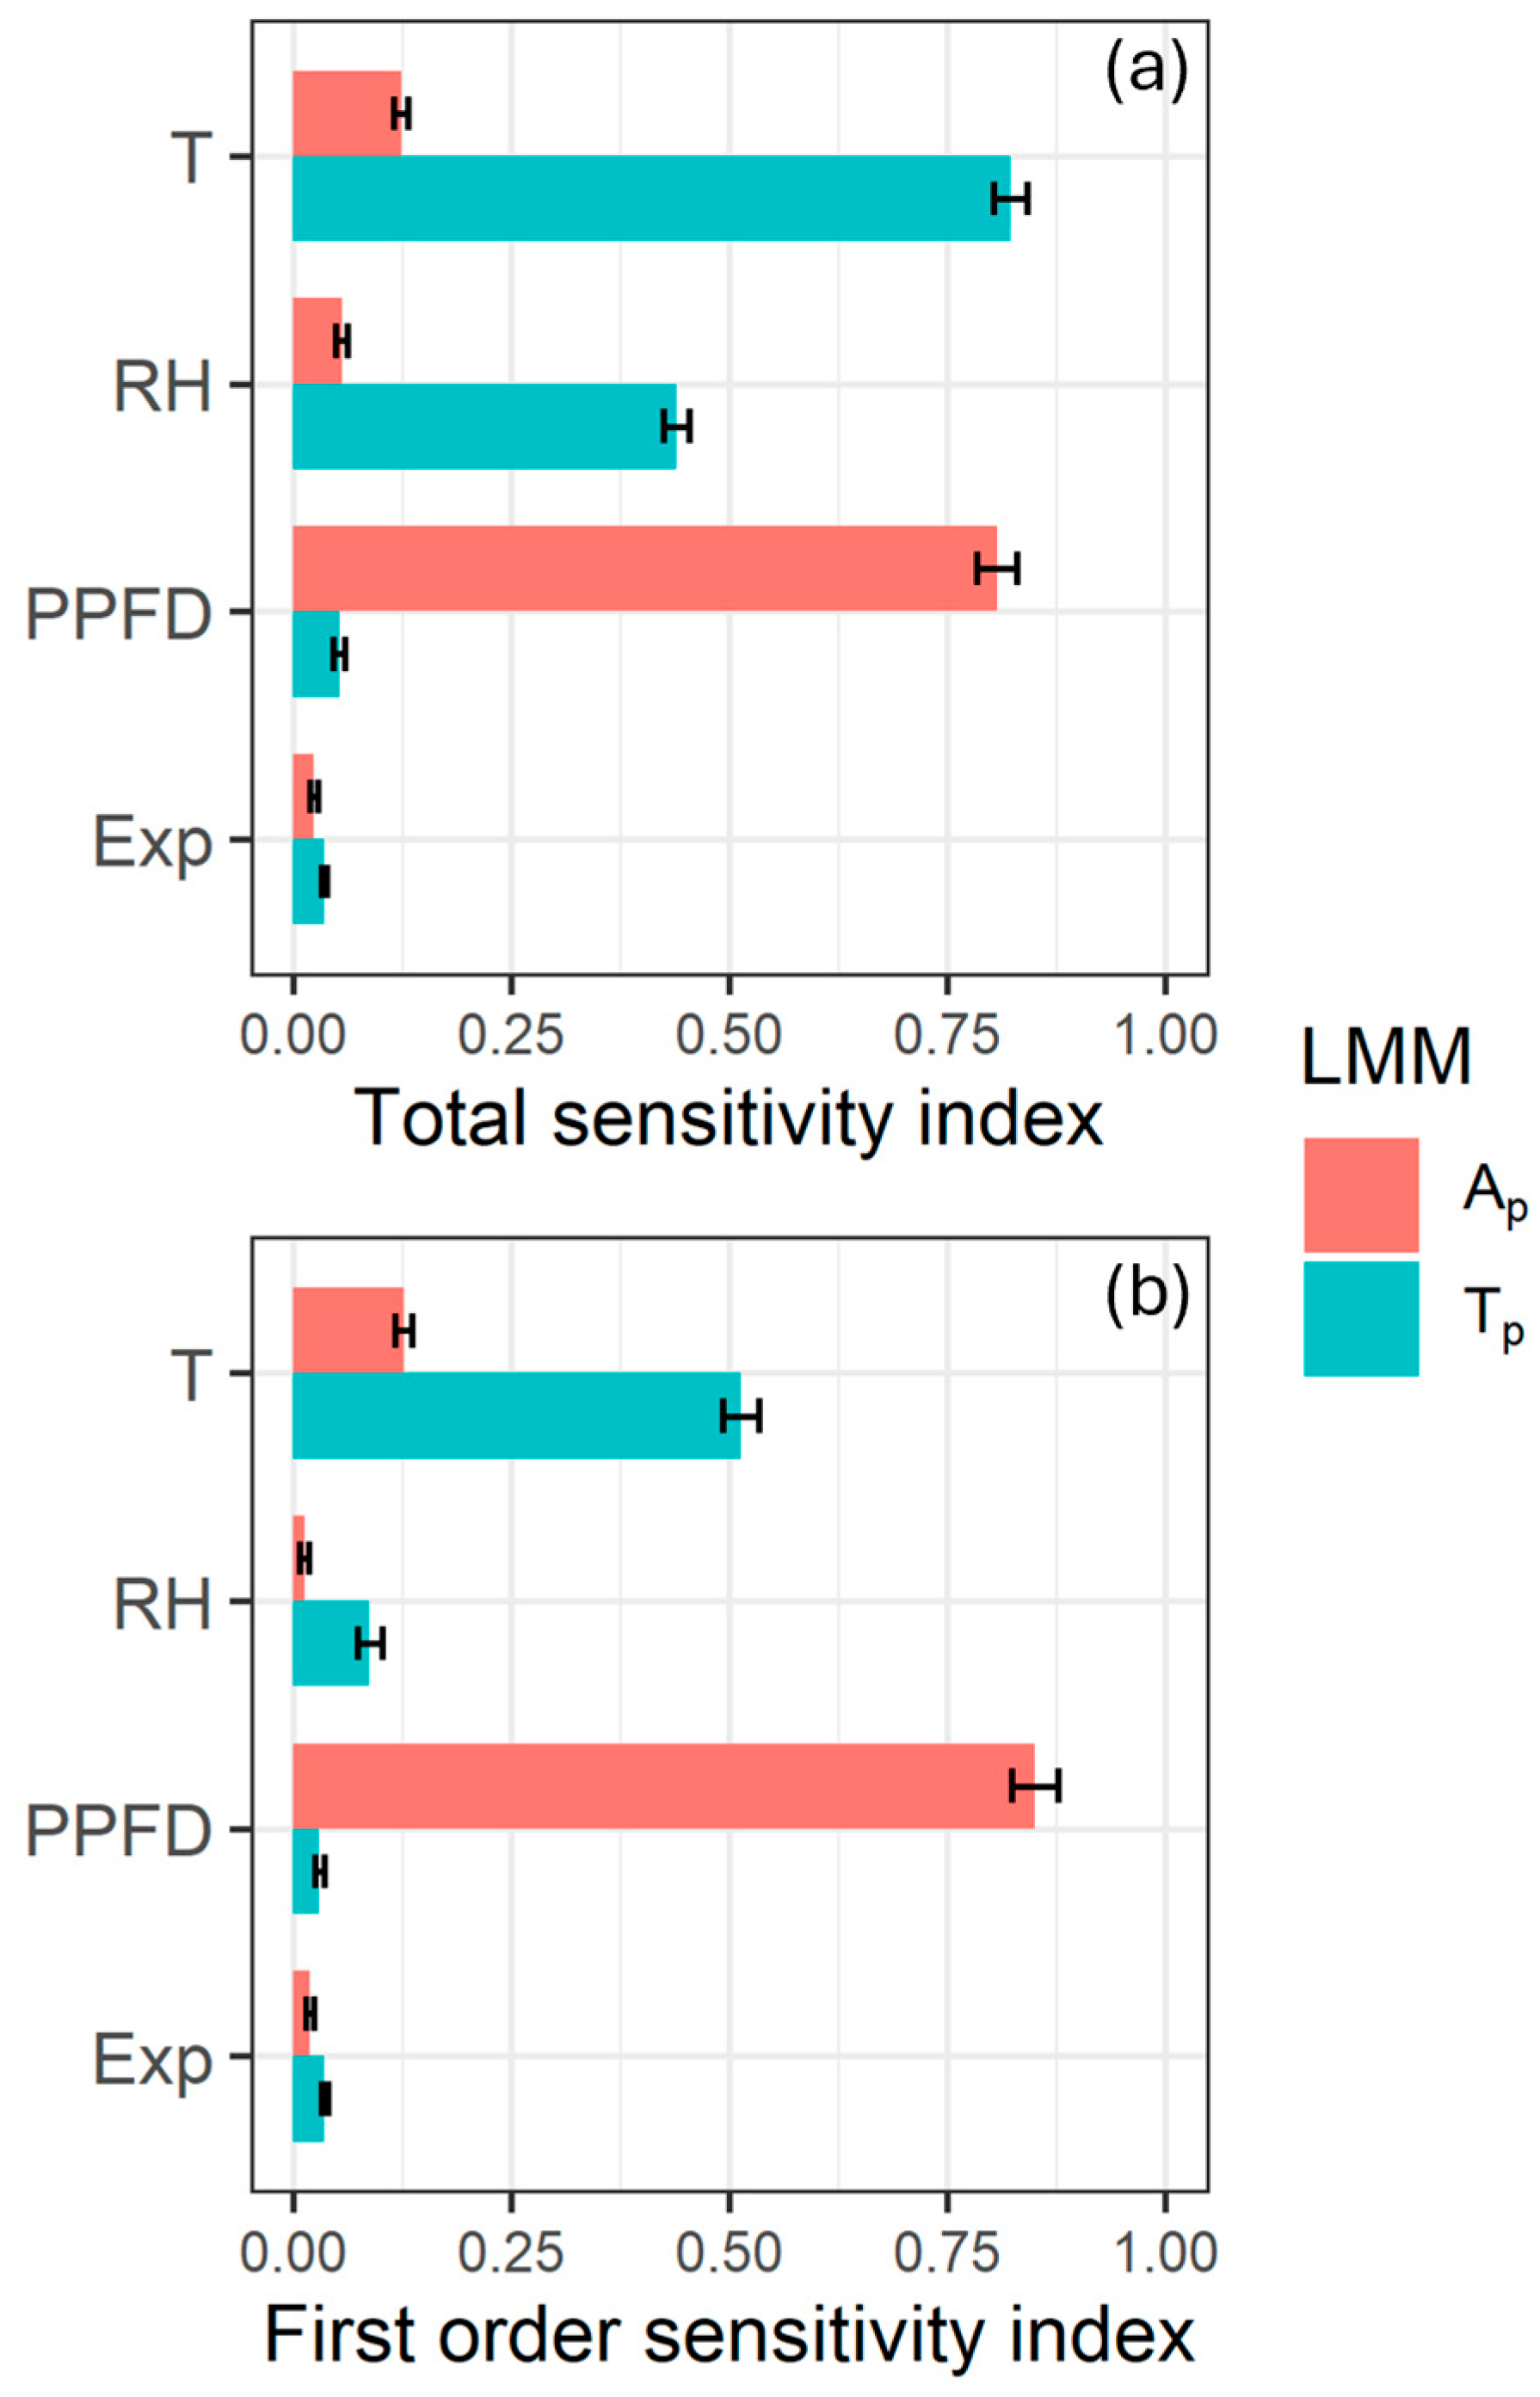
Simulations of whole-plant photosynthetic rates across different PPFD-levels and temperatures, under constant RH, closely aligned with the observed patterns in the measured photosynthetic rates from both the train and test datasets (Figure 5a). For each PPFD-level, whole-plant photosynthetic rates followed a polynomial trend, reaching a clear optimum. At low PPFD levels, the simulated optimal temperature was constrained to 5 °C, which represents the lower limit of the experimental temperature range. As PPFD increased, whole-plant photosynthetic rates rose, and at higher PPFD levels, above 200 µmol·m−2·s−1, the optimal temperature increased following a logarithmic trend. This trend was consistent across all experiments, which was added to the model as a random effect (Figure 5b). The minimal influence of experimental variation was further confirmed by the low total sensitivity index of the experiment with respect to whole-plant photosynthetic rate (Figure 6). According to the model, optimal temperatures did not exceed 15 °C when PPFD remained below 400 µmol·m−2·s−1 Among the analyzed factors, PPFD showed the highest total sensitivity index, while temperature and RH showed a relatively low sensitivity index (Figure 6).
Further simulations using the LMM-Ap were conducted across an extended range of RH values. To integrate the effects of both temperature and RH, the measured and simulated results were visualized as a function of vapor pressure deficit (VPD) (Figure 7). The simulations and measurements revealed a similar, but less pronounced, trend toward an optimal VPD, with a positive relationship between PPFD and whole-plant photosynthetic rate. Both Sobol’ sensitivity indices for RH remained low indicating a minimal impact of RH on whole-plant photosynthetic rate (Figure 6).

3.3. Whole-Plant Transpiration Rates Across VPD and PPFD Levels

Measurements from the cuvette experiments and simulations from the LMM-Tp model for whole-plant transpiration rate were evaluated across a range of PPFD, RH and temperature. Given the high total sensitivity indices for both RH and temperature (Figure 6), whole-plant transpiration rates were plotted against VPD to capture their combined influence (Figure 8). Whole-plant transpiration rates showed a positive quadratic trend with increasing VPD, which may result from increasing temperatures, decreasing RH or a combination of both factors. Sobol’ sensitivity indices revealed that temperature had a higher impact on whole-plant transpiration rate compared to RH. Additionally, the total sensitivity index for RH increased relative to its first order sensitivity index, emphasizing the importance of interaction effects involving RH. The visualization of the LMM-Tp showed that the effect of PPFD on whole-plant transpiration was minimal under low VPD conditions (VPD < 0.5 kPa). However, as VPD increased, the positive effect of PPFD on whole-plant transpiration became more pronounced. Despite this trend, both sensitivity indices for PPFD remained low. Similarly to the LMM-Ap, the experiment, included as random effect in the model, demonstrated a low total sensitivity index (Figure 6), indicating limited variability attributable to experimental differences.
To evaluate the performance of the LMM-Ap and LMM-Tp models, three validation metrics were calculated using the test dataset (Table 3). The validation metrics for LMM-Tp indicated weaker model performance compared to LMM-Ap. In addition, LMM-Tp indicated less consistent results across the experiments with R2 and NRMSE for Experiments 1 and 3 deviating from Experiment 2.

4. Discussion

4.1. Optimizing Whole-Plant Photosynthesis in Lettuce by Balancing Temperature and Light Dynamics for More Energy-Efficient Production

Measured data, supported by simulations with the LMM-Ap model, confirmed the hypothesis that increasing PPFD positively affects the optimal temperature for the whole-plant photosynthesis in lettuce. At lower PPFD levels (below 150–200 µmol·m−2·s−1), the optimal temperature was constrained by the experimental temperature range, reaching the lower limit of 5 °C (Figure 5). Although published literature lacks detailed studies on whole-plant photosynthetic responses across a broad range of temperatures and light intensities, underscoring the gap between leaf level and plant level knowledge, a shift in temperature optima for whole-plant photosynthesis in lettuce could be derived from work by Caporn et al. [48]. In their work, canopy photosynthetic rate of lettuce was determined at 6, 10 and 16 °C, while PPFD ranged from 0 to 300 µmol·m−2·s−1. In one experimental set of plants, photosynthesis at 16 °C outperformed photosynthesis at 10 °C when PPFD surpassed 250 µmol·m−2·s−1, while in a second set of plants, the photosynthetic rate at 16 °C outperformed that at 6 °C only at 300 µmol·m−2·s−1. Conversely, at lower irradiance levels, photosynthesis was more efficient at lower temperatures, which is consistent with findings from the present study. This difference was attributed to increased dark respiration, possibly maintenance respiration, at higher temperatures under low PPFD conditions. Lower temperatures, on the other hand, strongly reduced dark respiration.
Due to the discrete nature of the research of Caporn et al. [48], it is not possible to pinpoint the temperature optimum at the tipping points of 250 and 300 µmol·m−2·s−1. Ideally, assuming symmetry around the temperature optimum, the respective temperature optimums are projected to be around 13 °C at 250 µmol·m−2·s−1 (median of 10 and 16 °C) and 11 °C at 300 µmol·m−2·s−1 (median of 6 and 16 °C). As an increase in temperature optimums is expected, it can be assumed that the actual estimated temperature optimum lies in the range of 11 and 13 °C. Simulations in the present research suggest a temperature optimum around 9 °C at 250 µmol·m−2·s−1, and 11 °C at 300 µmol·m−2·s−1. This discrepancy may be explained by the elevated CO2 concentration in the study of Caporn et al. [48], which inhibits photorespiration and thereby raises the temperature optimum [17,18]. A similar relationship between PPFD and temperature optima has been observed in other species, including lichen [15], tobacco leaves [19], and canopy photosynthesis of tomato [18]. Simulations by Cannell et al. [17] based on literature, addressing leaf photosynthesis for various C3 plants, consistently reported higher temperature optima compared to our results (Table 1, Figure 5b). When comparing the results in this work (Figure 5b) to simulations on leaf level for lettuce (Figure 1), it can be concluded that the difference in optimal temperatures between leaf and plant level photosynthetic rates range between 10 and 20 °C. These differences can be attributed to the morphology and physiology of heading lettuce plants. In older, heading plants, the dense habitus results in self-shading, where older leaves are overgrown, and younger leaves are concealed within the lettuce head. Consequently, large parts of the leaf area receive only a fraction of the incident light, which promotes respiration over whole-plant gross photosynthesis [17]. In these shaded regions, dark and photorespiration dominate, particularly at high temperatures and low PPFD, resulting in relatively low optimal temperatures for the whole-plant photosynthesis. The fraction of shaded leaves helps explain the discrepancy in the magnitude of photosynthetic rates observed at the leaf-level (Figure 1) and the whole-plant level (Figure 5a). These findings highlight a critical distinction: optimal temperatures for photosynthesis differ between leaves and whole-plants, underscoring that leaf-level photosynthetic physiology cannot be directly extrapolated to whole-plant physiology in lettuce. As a result, the present study rejects the second hypothesis, emphasizing the complexity of translating leaf-scale processes to whole-plant systems.
Another key implication is that optimal temperatures for photosynthesis will vary throughout the cultivation period. In younger lettuce plants, a larger fraction of the leaf area is directly exposed to environmental conditions and light treatment. In addition, photosynthetic capacity declines with leaf age [52]. During crop development and, hence, throughout the lettuce production process, the balance between photosynthesis and respiration shifts, causing the optimal temperature to decrease in the later stages of lettuce production. Quantification of this temporal progression with the presented DynGES-system is expected to be highly significant in the validation of new and existing mechanistic plant models.
With the insights derived from the presented study, the optimization towards whole-plant photosynthesis should focus on carefully managing temperature and PPFD. Since light accounts for approximately 50% of the energy demand in a CEA system, PPFD levels must be carefully controlled, with temperature dynamically adjusted to match the PPFD level for optimal efficiency. However, achieving and maintaining optimal temperatures through sensible cooling and heating in a CEA systems remains technically challenging due to spatial heterogeneity in temperature distribution [5]. These inconsistencies can be partially mitigated through dynamic light regulation, where PPFD levels are adjusted in specific zones of the production facility to compensate for local temperature variations. Furthermore, whole-plant photosynthetic analysis offers valuable insights for optimizing environmental conditions throughout the production cycle. By aligning dynamic temperature and light strategies with crop growth stages and quality analysis, it becomes possible to maximize photosynthetic efficiency and enhance resource-use efficiency in lettuce cultivation.

4.2. The Decoupling of Whole-Plant Transpiration and Photosynthesis Under High Relative Humidity in Lettuce

Results from the cuvette experiments revealed that whole-plant transpiration rates were strongly driven by VPD, with PPFD having a less pronounced positive effect, especially when VPD was below 0.5 kPa (Figure 8). Similarly, the literature reports a small increase in leaf-level transpiration with rising PPFD up to 175 µmol·m−2·s−1 at moderate VPD (0.7–1 kPa) [53] while a substantial increase occurs at high PPFD (up to 1200 µmol·m−2·s−1) under elevated VPD (2.2 kPa) [54]. In contrast, Albornoz, Lieth and Gonzalez-Fuentes [55] observed a steady increase in transpiration of lettuce with increasing PPFD (from 500 to 2000 µmol·m−2·s−1) under moderate VPD (0.7–1 kPa). These findings suggest that the effect of PPFD on transpiration cannot be generalized, as it appears highly dependent on VPD levels. This observation aligns with the Sobol’ sensitivity indices derived from the LMM-Tp model for whole-plant transpiration. While temperature and RH showed high total sensitivity indices, PPFD had a low first order sensitivity index and a slightly higher total sensitivity index, emphasizing the interactive effects between PPFD and RH (Figure 6).
VPD is widely recognized as the most important driver of stomatal conductance, but its relative importance compared to PPFD varies across species [56,57,58]. Additionally, the combined effects of multiple environmental factors are often unpredictable and species-dependent [58]. In this work, whole-plant transpiration rates increased consistently with increasing VPD (Figure 8), whereas whole-plant photosynthetic rates showed no strong trend with VPD (Figure 7). This implies that stomatal conductance did not limit photosynthesis. The consistently high RH throughout most of the cuvette experiments likely resulted in high stomatal conductance [56], with no discernible effect on photosynthesis (Figure 7). These findings align with the low sensitivity indices for RH compared to temperature and especially PPFD in LMM-Ap (Figure 6). In addition, high RH (low VPD) physically limited transpiration, restricting whole-plant transpiration and rendering the effect of PPFD largely undefined under low VPD conditions (Figure 8) [9,59]. As VPD increased, particularly observed in Experiment 2, this physical barrier was lifted, resulting in a sharp increase in whole-plant transpiration and amplifying the positive effect of PPFD on transpiration (Figure 8). In contrast, whole-plant photosynthetic rates showed a subtle trend towards an optimal VPD, beyond which photosynthesis slightly decreased (Figure 7). This decline towards stabilization occurred under high VPD conditions, which were driven by both low RH and high temperatures (Figure 4a–c), and with elevated temperatures increasingly limiting whole-plant photosynthesis (Figure 5 and Figure 6). These results indicate that whole-plant transpiration and photosynthesis can become decoupled under specific environmental conditions, such as high RH or high temperatures, refuting the third hypothesis.
Controlling RH in the growth chamber proved challenging, with consistently high RH levels observed during most experiments. A sudden drop in RH during Experiment 2, combined with high temperatures, caused a sharp increase in VPD, leading to a corresponding increase in whole-plant transpiration (Figure 4). This pronounced effect in Experiment 2 improved the calibration of the LMM-Tp model for this experiment. In contrast, the low R2 values and relatively high NRMSE values for whole-plant transpiration rates in Experiments 1 and 3 were mainly caused by the high RH levels, which hindered transpiration (Table 3). For the LMM-Ap model, performance metrics revealed a slightly reduced model fit in Experiment 2 (Table 3), mainly due to the sharp decrease in RH during this experiment. However, the overall impact of RH on whole-plant photosynthetic rates remained relatively minor (Figure 6).
By utilizing both LMM-Ap and LMM-Tp models, whether or not coupled with 3D plant models or a CFD approach, environmental conditions in CEA systems can be dynamically optimized for both photosynthetic and transpiration rates throughout the cultivation cycle. However, care must be taken to balance potential side effects and operational costs, ensuring that environmental strategies align with crop physiological requirements and resource-use efficiency goals. The findings demonstrate that while high RH improves water use efficiency, it also limits transpiration, potentially reducing the transport of nutrients like Ca2+ which can increase the risk of tipburn. Furthermore, high humidity creates favorable conditions for fungal diseases such as botrytis and mildew [60]. For optimal lettuce production in indoor production facilities, RH levels should be maintained between 60 and 80% [26,27,60]. However, achieving this range is challenging due to the high energy costs of dehumidification [9,29].

4.3. Dynamic Closed Gas-Exchange Systems Enable Accurate Whole-Plant Response Analysis Under Prevailing Phylloclimate Conditions

The dynamic closed gas-exchange system (DynGES) described in this study has proven to be an effective tool for generating an extensive, useful dataset under a wide range of environmental combinations. It facilitated a detailed examination of the relative importance and combined effects of temperature, PPFD and RH on whole-plant photosynthesis and transpiration, supporting the hypothesis regarding its potential for optimizing environmental control in CEA systems. The results underscore the critical importance of whole-plant measurements as an essential step in translating leaf-level knowledge into whole-plant understanding. Furthermore, the DynGES holds significant promise for validating current and future models related to plant functioning and environmental control strategies in CEA systems.
The dynamic nature of DynGES allows plants to experience environmental conditions that closely mimic real-world scenarios, providing a significant advantage for research focused on phylloclimate and production facilities. The system minimizes disturbances to the boundary layer around the leaves, ensuring more realistic measurements of plant responses. Initial observations revealed that photosynthesis and transpiration did not stabilize within the first two minutes after cuvette closure (Section 2.4). To further improve measurement precision, stabilization time could be minimized by accelerating the cuvette-closing process and reducing the interval between measurement points. Shorter closing times would also prevent the rapid build-up of water vapour, which can otherwise hinder transpiration measurements. In its current configuration, a DynGES measurement cycle, involving four dynamic cuvettes, required 20 min per cycle. In contrast, Liu and Van Iersel [42] used an open gas exchange system to measure ten fixed cuvettes (with two empty cuvettes serving as controls) in 10 to 20 min. The longer cycle time of DynGES is justified by the physical requirements of opening and closing dynamic cuvettes and the need to ensure minimal disturbance to the phylloclimate during measurements. This extended duration reduces potential artifacts caused by the measurement process itself and enhances the reliability of the collected data. The DynGES system can be scaled up by adding multiple independent measurement circuits (Figure 3) that can operate simultaneously and independently. However, each additional circuit requires a dedicated IRGA, which raised operational costs and might impact scalability for budgetary reasons.

5. Conclusions

The high energy demand in closed agricultural production systems necessitates a thorough optimization of climate parameters across the facility, and with that a thorough understanding of the dynamic interactions between plant and environment. While much of our current understanding and plant modelling efforts are based on leaf-level measurements, translating these findings to the whole-plant level remains challenging. In this study a dynamic whole-plant gas exchange system (DynGES) is introduced. This system was deployed to identify key environmental drivers governing both whole-plant photosynthesis and transpiration. Photosynthesis was mainly driven by light intensity (PPFD), with a clear relationship observed between increasing light intensity and a rise in the temperature optimum, ranging from 5 °C at a PPFD of 150 µmol·m−2·s−1 to 13 °C at 400 µmol·m−2·s−1. However, these temperature optima were 10 to 20 °C lower than those observed at the leaf level, due to an increase in respiration within the lettuce head under rising temperatures. In contrast, whole-plant transpiration rates were strongly influenced by temperature and relative humidity (RH), while the effect of light intensity was relatively minor, particularly under high RH conditions, with vapour pressure deficit (VPD) values of 0.5 kPa or lower. Under these high RH conditions, a decoupling of transpiration and photosynthesis was observed. The DynGES has demonstrated its effectiveness as a robust tool for analyzing undisturbed whole-plant physiology within CEA systems. Data generated by the DynGES will be instrumental in the optimization of CEA systems, as well as the validation and refinement of plant models, serving as a translator between leaf level knowledge and whole-plant functioning. This study highlights the importance of whole-plant measurements in refining environmental strategies and advancing sustainable and efficient crop production in closed agricultural systems.

Supplementary Materials

The following supporting information can be downloaded at: https://www.mdpi.com/article/10.3390/agronomy15092180/s1.

Author Contributions

Conceptualization, S.L., J.R.C. and K.S.; methodology, S.L. and K.S.; software, S.L. and J.R.C.; validation, S.L., J.R.C. and K.S.; formal analysis, S.L., investigation, S.L.; resources, K.S.; data curation, S.L.; writing—original draft preparation, S.L.; writing—review and editing, K.S. and S.L.; visualization, S.L.; supervision, K.S.; project administration, J.R.C. and K.S.; funding acquisition, K.S. All authors have read and agreed to the published version of the manuscript.

Funding

Funding was provided by the Research Foundation Flanders (FWO) under Research Programme FWO-SBO Cross-talk (S006219N) granted to K.S. and supporting the PhD work of S.L. Additionally, funding was provided by the Special Research Fund Ghent University under (i) BOF24/CDV/50 to S.L. to extend the PhD trajectory that was delayed due to COVID-19, (ii) BOF/15/BAS/045 to K.S. supporting the installation of the growth chamber (WEKK 10.40.8.L, Weisstechnik) and (iii) BOF.BAS.01B04320 to K.S. for the lighting systems.

Data Availability Statement

Data is contained within the Supplementary Material.

Acknowledgments

The authors wish to thank Erik Moerman and Philip Deman for their dedication towards the design and development of DynGES, Geert Favyts for his valuable assistance with the experimental setup, RAYN Growing Systems, and the UGent Agrotopia Endowed Chair (under supervision of Jan Pieters) for supporting the work. The authors have reviewed and edited the output and take full responsibility for the content of this publication.

Conflicts of Interest

The authors declare no conflicts of interest.

Abbreviations

The following abbreviations are used in this manuscript:
CEAClosed environment agriculture
DynGESDynamic gas exchange system
IRGAInfra-red gas analyzer
LMMLinear mixed models
PPFDPhotosynthetic photon flux density
RHRelative humidity
VPDVapour pressure deficit

Appendix A

Table A1. Model parameters and associated estimated coefficients for linear mixed models for whole-plant photosynthetic rate (LMM-Ap). The model was fitted on a train dataset obtained from three separate cuvette experiments. Models were fitted using backward regression. The significance of each coefficient is shown. The model includes temperature (T, °C), relative humidity (RH, %), photosynthetic photon flux density (PPFD, µmol·m−2·s−1) as fixed effects and the experiment as random effect.
TermCoefficientSEp-Value
Fixed effectsMain effectIntercept2.03 × 10−14.29 × 10⁻²*
T−1.68 × 10−29.14 × 10−4***
PPFD4.59 × 10−32.98 × 10⁻⁴***
Interaction effectPPFD: RH−2.69 × 10−53.18 × 10−6***
PPFD: T−1.07 × 10−41.19 × 10−5***
PPFD: T2−2.26 × 10−62.68 × 10−7***
Random effects Experiment
(Intercept)
4.44 × 10⁻⁴
Estimated coefficients are shown with their standard error. Significance levels are indicated (*: p < 0.05, **: p < 0.01, ***: p < 0.001). The train dataset contained data of 8 plants over 3 experiments (Number of datapoints = 910).
Table A2. Model parameters and associated estimated coefficients for linear mixed models for whole-plant transpiration rate (LMM-Tp). The model was fitted on a train dataset obtained from three separate cuvette experiments. Models were fitted using backward regression. The significance of each coefficient is shown. The model includes temperature (T, °C), relative humidity (RH, %), photosynthetic photon flux density (PPFD, µmol·m−2·s−1) as fixed effects and the experiment as random effect.
TermCoefficientSEp-Value
Fixed effectsMain effectIntercept−9.59 × 10−12.13 × 10−1***
T4.73 × 10−26.84 × 10⁻³***
PPFD4.74 × 10−45.41 × 10⁻⁵***
RH1.93 × 10−24.73 × 10⁻³***
RH2−9.60 × 10−52.62 × 10−5***
Interaction effectPPFD: RH−5.18 × 10−66.20 × 10−7***
PPFD: T−9.43 × 10−41.55 × 10−4***
PPFD: T24.3 × 10−68.84 × 10⁻⁷***
Random effects Experiment
(Intercept)
4.96 × 10⁻⁵
Estimated coefficients are shown with their standard error. Significance levels are indicated (*: p < 0.05, **: p < 0.01, ***: p < 0.001). The train dataset contained data of 8 plants over 3 experiments (Number of datapoints = 910).

References

  1. Despommier, D.D. The Vertical Farm: Feeding the World in the 21st Century, 1st ed.; Picador: New York, NY, USA, 2011; ISBN 978-0-312-61069-2. [Google Scholar]
  2. Benke, K.; Tomkins, B. Future Food-Production Systems: Vertical Farming and Controlled-Environment Agriculture. Sustain. Sci. Pract. Policy 2017, 13, 13–26. [Google Scholar] [CrossRef]
  3. Van Gerrewey, T.; Boon, N.; Geelen, D. Vertical Farming: The Only Way Is Up? Agronomy 2022, 12, 2. [Google Scholar] [CrossRef]
  4. Vatistas, C.; Avgoustaki, D.D.; Bartzanas, T. A Systematic Literature Review on Controlled-Environment Agriculture: How Vertical Farms and Greenhouses Can Influence the Sustainability and Footprint of Urban Microclimate with Local Food Production. Atmosphere 2022, 13, 1258. [Google Scholar] [CrossRef]
  5. Graamans, L.; Baeza, E.; van den Dobbelsteen, A.; Tsafaras, I.; Stanghellini, C. Plant Factories versus Greenhouses: Comparison of Resource Use Efficiency. Agric. Syst. 2018, 160, 31–43. [Google Scholar] [CrossRef]
  6. Tuomisto, H.L. Vertical Farming and Cultured Meat: Immature Technologies for Urgent Problems. One Earth 2019, 1, 275–277. [Google Scholar] [CrossRef]
  7. Blom, T.; Jenkins, A.; Pulselli, R.M.; van den Dobbelsteen, A.A.J.F. The Embodied Carbon Emissions of Lettuce Production in Vertical Farming, Greenhouse Horticulture, and Open-Field Farming in the Netherlands. J. Clean. Prod. 2022, 377, 134443. [Google Scholar] [CrossRef]
  8. Hatfield, J.L.; Prueger, J.H. Temperature Extremes: Effect on Plant Growth and Development. Weather Clim. Extrem. 2015, 10, 4–10. [Google Scholar] [CrossRef]
  9. Ahamed, M.S.; Sultan, M.; Monfet, D.; Rahman, M.S.; Zhang, Y.; Zahid, A.; Bilal, M.; Ahsan, T.M.A.; Achour, Y. A Critical Review on Efficient Thermal Environment Controls in Indoor Vertical Farming. J. Clean. Prod. 2023, 425, 138923. [Google Scholar] [CrossRef]
  10. Talbot, M.-H.; Monfet, D. Analysing the Influence of Growing Conditions on Both Energy Load and Crop Yield of a Controlled Environment Agriculture Space. Appl. Energy 2024, 368, 123406. [Google Scholar] [CrossRef]
  11. Choi, K.Y.; Paek, K.Y.; Lee, Y.B. Effect of Air Temperature on Tipburn Incidence of Butterhead and Leaf Lettuce in a Plant Factory. In Transplant Production in the 21st Century; Kubota, C., Chun, C., Eds.; Springer: Dordrecht, The Netherlands, 2000; pp. 166–171. ISBN 978-90-481-5570-5. [Google Scholar]
  12. Zhang, X.; He, D.; Niu, G.; Yan, Z.; Song, J. Effects of Environment Lighting on the Growth, Photosynthesis, and Quality of Hydroponic Lettuce in a Plant Factory. Int. J. Agric. Biol. Eng. 2018, 11, 33–40. [Google Scholar] [CrossRef]
  13. Frantz, J.M.; Ritchie, G.; Cometti, N.N.; Robinson, J.; Bugbee, B. Exploring the Limits of Crop Productivity: Beyond the Limits of Tipburn in Lettuce. J. Am. Soc. Hortic. Sci. 2004, 129, 331–338. [Google Scholar] [CrossRef] [PubMed]
  14. Farhangi, H.; Mozafari, V.; Roosta, H.R.; Shirani, H.; Farhangi, M. Optimizing Growth Conditions in Vertical Farming: Enhancing Lettuce and Basil Cultivation through the Application of the Taguchi Method. Sci. Rep. 2023, 13, 6717. [Google Scholar] [CrossRef]
  15. Lange, O.L.; Geiger, I.L.; Schulze, E.-D. Ecophysiological Investigations on Lichens of the Negev Desert. V. A Model to Simulate Net Photosynthesis and Respiration of Ramalina Maciformis. Oecologia 1977, 28, 247–259. [Google Scholar] [CrossRef] [PubMed]
  16. Farquhar, G.D.; Von Caemmerer, S.; Berry, J.A. A Biochemical Model of Photosynthetic CO2 Assimilation in Leaves of C3 Species. Planta 1980, 149, 78–90. [Google Scholar] [CrossRef]
  17. Cannell, M.; Thornley, J.H.M. Temperature and CO2 Responses of Leaf and Canopy Photosynthesis: A Clarification Using the Non-Rectangular Hyperbola Model of Photosynthesis. Ann. Bot. 1998, 82, 883–892. [Google Scholar] [CrossRef]
  18. Körner, O.; Heuvelink, E.; Niu, Q. Quantification of Temperature, CO2, and Light Effects on Crop Photosynthesis as a Basis for Model-Based Greenhouse Climate Control. J. Hortic. Sci. Biotechnol. 2009, 84, 233–239. [Google Scholar] [CrossRef]
  19. Yamori, W.; Evans, J.R.; Von Caemmerer, S. Effects of Growth and Measurement Light Intensities on Temperature Dependence of CO2 Assimilation Rate in Tobacco Leaves. Plant Cell Environ. 2010, 33, 332–343. [Google Scholar] [CrossRef]
  20. Schulze, E.-D.; Beck, E.; Buchmann, N.; Clemens, S.; Müller-Hohenstein, K.; Scherer-Lorenzen, M. Plant Ecology; Springer: Berlin/Heidelberg, Germany, 2019; ISBN 978-3-662-56231-4. [Google Scholar]
  21. Kim, S.H.; Lieth, J.H. A Coupled Model of Photosynthesis, Stomatal Conductance and Transpiration for a Rose Leaf (Rosa hybrida L.). Ann. Bot. 2003, 91, 771–781. [Google Scholar] [CrossRef]
  22. Decoteau, D.R. Vegetable Crops; Prentice Hall: Upper Saddle River, NJ, USA, 2000; ISBN 978-0-13-956996-8. [Google Scholar]
  23. Carotti, L.; Graamans, L.; Puksic, F.; Butturini, M.; Meinen, E.; Heuvelink, E.; Stanghellini, C. Plant Factories Are Heating Up: Hunting for the Best Combination of Light Intensity, Air Temperature and Root-Zone Temperature in Lettuce Production. Front. Plant Sci. 2021, 11, 592171. [Google Scholar] [CrossRef]
  24. Lawson, T.; Blatt, M.R. Stomatal Size, Speed, and Responsiveness Impact on Photosynthesis and Water Use Efficiency. Plant Physiol. 2014, 164, 1556–1570. [Google Scholar] [CrossRef]
  25. Carvalho, D.R.A.; Torre, S.; Kraniotis, D.; Almeida, D.P.F.; Heuvelink, E.; Carvalho, S.M.P. Elevated Air Movement Enhances Stomatal Sensitivity to Abscisic Acid in Leaves Developed at High Relative Air Humidity. Front. Plant Sci. 2015, 6, 383. [Google Scholar] [CrossRef]
  26. Naranjani, B.; Najafianashrafi, Z.; Pascual, C.; Agulto, I.; Chuang, P.-Y.A. Computational Analysis of the Environment in an Indoor Vertical Farming System. Int. J. Heat Mass Transf. 2022, 186, 122460. [Google Scholar] [CrossRef]
  27. Ahmed, H.A.; Yu-Xin, T.; Qi-Chang, Y. Optimal Control of Environmental Conditions Affecting Lettuce Plant Growth in a Controlled Environment with Artificial Lighting: A Review. S. Afr. J. Bot. 2020, 130, 75–89. [Google Scholar] [CrossRef]
  28. Shamshiri, R.R.; Jones, J.W.; Thorp, K.R.; Ahmad, D.; Man, H.C.; Taheri, S. Review of Optimum Temperature, Humidity, and Vapour Pressure Deficit for Microclimate Evaluation and Control in Greenhouse Cultivation of Tomato: A Review. Int. Agrophysics 2018, 32, 287–302. [Google Scholar] [CrossRef]
  29. Graamans, L.; van den Dobbelsteen, A.; Meinen, E.; Stanghellini, C. Plant Factories; Crop Transpiration and Energy Balance. Agric. Syst. 2017, 153, 138–147. [Google Scholar] [CrossRef]
  30. Bugbee, B. Steady-State Canopy Gas Exchange: System Design and Operation. HortSci 1992, 27, 770–776. [Google Scholar] [CrossRef]
  31. Takahashi, N.; Ling, P.P.; Frantz, J.M. Considerations for Accurate Whole Plant Photosynthesis Measurement. Environ. Control Biol. 2008, 46, 91–101. [Google Scholar] [CrossRef]
  32. Kölling, K.; George, G.M.; Künzli, R.; Flütsch, P.; Zeeman, S.C. A Whole-Plant Chamber System for Parallel Gas Exchange Measurements of Arabidopsis and Other Herbaceous Species. Plant Methods 2015, 11, 48. [Google Scholar] [CrossRef]
  33. Ferraz, T.M.; Rodrigues, W.P.; Netto, A.T.; De Oliveira Reis, F.; Peçanha, A.L.; De Assis Figueiredo, F.A.M.M.; De Sousa, E.F.; Glenn, D.M.; Campostrini, E. Comparison between Single-Leaf and Whole-Canopy Gas Exchange Measurements in Papaya (Carica papaya L.) Plants. Sci. Hortic. 2016, 209, 73–78. [Google Scholar] [CrossRef]
  34. Impron, I.; Hemming, S.; Bot, G.P.A. Simple Greenhouse Climate Model as a Design Tool for Greenhouses in Tropical Lowland. Biosyst. Eng. 2007, 98, 79–89. [Google Scholar] [CrossRef]
  35. Vanthoor, B.H.E.; Stanghellini, C.; van Henten, E.J.; Visser, P.H.B. de A Methodology for Model-Based Greenhouse Design: Part 1, a Greenhouse Climate Model for a Broad Range of Designs and Climates. Biosyst. Eng. 2011, 110, 363–377. [Google Scholar] [CrossRef]
  36. Defraeye, T.; Derome, D.; Verboven, P.; Carmeliet, J.; Nicolai, B. Cross-Scale Modelling of Transpiration from Stomata via the Leaf Boundary Layer. Ann. Bot. 2014, 114, 711–723. [Google Scholar] [CrossRef] [PubMed]
  37. Plas, W.; Demeester, T.; Ahmed, Z.Y.; Coussement, J.R.; Steppe, K.; De Paepe, M. A Detailed Plant Model in CFD That Resolves the Microclimate around Individual Leaves. Biosyst. Eng. 2025, 254, 104144. [Google Scholar] [CrossRef]
  38. Gu, X.; Goto, E. Evaluation of Plant Canopy Microclimates with Realistic Plants in Plant Factories with Artificial Light Using a Computational Fluid Dynamics Model. Build. Environ. 2024, 264, 111876. [Google Scholar] [CrossRef]
  39. Van Iersel, M.W.; Bugbee, B. A Multiple Chamber, Semicontinuous, Crop Carbon Dioxide Exchange System: Design, Calibration, and Data Interpretation. J. Am. Soc. Hortic. Sci. 2000, 125, 86–92. [Google Scholar] [CrossRef]
  40. Frantz, J.M.; Bugbee, B. Acclimation of Plant Populations to Shade: Photosynthesis, Respiration, and Carbon Use Efficiency. J. Am. Soc. Hortic. Sci. 2005, 130, 918–927. [Google Scholar] [CrossRef]
  41. Zhen, S.; Bugbee, B. Far-red Photons Have Equivalent Efficiency to Traditional Photosynthetic Photons: Implications for Redefining Photosynthetically Active Radiation. Plant Cell Environ. 2020, 43, 1259–1272. [Google Scholar] [CrossRef]
  42. Liu, J.; Van Iersel, M.W. Far-Red Photons Increase Light Capture but Have Lower Photosynthetic Capacity Than Red Photons. J. Amer. Soc. Hort. Sci. 2023, 148, 253–265. [Google Scholar] [CrossRef]
  43. Song, Q.; Xiao, H.; Xiao, X.; Zhu, X.-G. A New Canopy Photosynthesis and Transpiration Measurement System (CAPTS) for Canopy Gas Exchange Research. Agric. For. Meteorol. 2016, 217, 101–107. [Google Scholar] [CrossRef]
  44. Schneider, C.A.; Rasband, W.S.; Eliceiri, K.W. NIH Image to ImageJ: 25 Years of Image Analysis. Nat Methods 2012, 9, 671–675. [Google Scholar] [CrossRef]
  45. R Core Team. R, version 2023.12.0.369; A Language and Environment for Statistical Computing; Posit Software, PBC: Boston, MA, USA, 2023.
  46. Bates, D.; Mächler, M.; Bolker, B.; Walker, S. Fitting Linear Mixed-Effects Models Using Lme4. J. Stat. Soft. 2015, 67. [Google Scholar] [CrossRef]
  47. Kuznetsova, A.; Brockhoff, P.B.; Christensen, R.H.B. lmerTest Package: Tests in Linear Mixed Effects Models. J. Stat. Soft. 2017, 82. [Google Scholar] [CrossRef]
  48. Caporn, S.J.M.; Hand, D.W.; Mansfield, T.A.; Wellburn, A.R. Canopy Photosynthesis of CO2-Enriched Lettuce (Lactuca sativa L.). Response to Short-Term Changes in CO2, Temperature and Oxides of Nitrogen. New Phytol. 1994, 126, 45–52. [Google Scholar] [CrossRef]
  49. Zhou, J.; Li, P.; Wang, J. Effects of Light Intensity and Temperature on the Photosynthesis Characteristics and Yield of Lettuce. Horticulturae 2022, 8, 178. [Google Scholar] [CrossRef]
  50. Iooss, B.; Da Veiga, S.; Janon, A.; Pujol, G. Sensitivity, version 1.30.0; Software for Global Sensitivity Analysis of Model Outputs and Importance Measures, R 2024; Microsoft: Washington, WA, USA, 2024.
  51. Sobol’, I.M.; Tarantola, S.; Gatelli, D.; Kucherenko, S.S.; Mauntz, W. Estimating the Approximation Error When Fixing Unessential Factors in Global Sensitivity Analysis. Reliab. Eng. Syst. Saf. 2007, 92, 957–960. [Google Scholar] [CrossRef]
  52. Locke, A.M.; Ort, D.R. Leaf Hydraulic Conductance Declines in Coordination with Photosynthesis, Transpiration and Leaf Water Status as Soybean Leaves Age Regardless of Soil Moisture. J. Exp. Bot. 2014, 65, 6617–6627. [Google Scholar] [CrossRef]
  53. Mayorga-Gomez, A.M.; Van Iersel, M.W.; Ferrarezi, R.S. Varying Light Intensities Affect Lettuce Growth and Physiology in Controlled Indoor Environments. Horticulturae 2024, 10, 931. [Google Scholar] [CrossRef]
  54. Gavhane, K.P.; Hasan, M.; Singh, D.K.; Kumar, S.N.; Sahoo, R.N.; Alam, W. Determination of Optimal Daily Light Integral (DLI) for Indoor Cultivation of Iceberg Lettuce in an Indigenous Vertical Hydroponic System. Sci. Rep. 2023, 13, 10923. [Google Scholar] [CrossRef]
  55. Albornoz, F.; Heinrich Lieth, J.; Gonzalez-Fuentes, J.A. Effect of Different Day and Night Nutrient Solution Concentrations on Growth, Photosynthesis, and Leaf NO3- Content of Aeroponically Grown Lettuce. Chil. J. Agric. Res. 2014, 74, 240–245. [Google Scholar] [CrossRef]
  56. Bunce, J.A. Does Transpiration Control Stomatal Responses to Water Vapour Pressure Deficit? Plant Cell Environ. 1997, 20, 131–135. [Google Scholar] [CrossRef]
  57. Kaiser, E.; Morales, A.; Harbinson, J.; Kromdijk, J.; Heuvelink, E.; Marcelis, L.F.M. Dynamic Photosynthesis in Different Environmental Conditions. J. Exp. Bot. 2015, 66, 2415–2426. [Google Scholar] [CrossRef]
  58. Merilo, E.; Jõesaar, I.; Brosché, M.; Kollist, H. To Open or to Close: Species-specific Stomatal Responses to Simultaneously Applied Opposing Environmental Factors. New Phytol. 2014, 202, 499–508. [Google Scholar] [CrossRef] [PubMed]
  59. Ben-Asher, J.; Garcia Y Garcia, A.; Flitcroft, I.; Hoogenboom, G. Effect of Atmospheric Water Vapor on Photosynthesis, Transpiration and Canopy Conductance: A Case Study in Corn. Plant Soil Environ. 2013, 59, 549–555. [Google Scholar] [CrossRef]
  60. Brechner, M.; Both, A.J.; CEA Staff. Hydroponic Lettuce Handbook. Cornell Control. Environ. Agric. 1996, 834, 504–509. [Google Scholar]
Figure 1. The dependency of leaf photosynthetic rate on temperature (°C) and photosynthetic photon flux density (PPFD; µmol·m−2·s−1). This visualization represents the output of a coupled model of photosynthesis, stomatal conductance and transpiration [21]. The model was calibrated for lettuce leaves and simulations were performed considering a homogeneous big leaf of one square meter (unpublished data). The optimal temperature corresponding to the maximum leaf photosynthetic rates at each PPFD-level is shown (▲). This visualization illustrates the progression of leaf photosynthetic rates towards a temperature optimum as well as a shift in this temperature optimum across different PPFD-levels.
Agronomy 15 02180 g001
Figure 2. Dynamic whole-plant cuvette. (a) Schematic overview. All green and white components are 3D printed. (1) Threaded rod, allowing precise vertical movement of the cuvette. (2) Cuvette body with the two white rings securing a transparent PVC sheet (0.3 mm thick). (3) Air inlet, positioned 25 cm above the base and 1 cm from the sidewall. (4) Fan located 20 cm above the base and 3 cm from the sidewall, positioned opposite the air inlet. (5) Relative humidity (RH) sensor and thermistor, installed 15 cm above the base and 7 cm from the sidewall. (6) Stepper motor to control the movement and precise positioning of the cuvette. (7) Air outlet positioned at the base of the cuvette. (b) Picture of a closed (back) and opened (front) dynamic whole-plant cuvette.
Agronomy 15 02180 g002
Figure 3. Schematic overview of the dynamic, closed gas exchange system (DynGES) consisting of two identical measurement-circuits, each containing two dynamic whole-plant cuvettes. Air continuously flows through a pump, buffer vessel, infra-red gas analyzer (IRGA-Li840) and a flow meter. Automated electric valves control the redirection of airflow at each step of the measurement cycle. (a) Closed circuit: air from the closed cuvette is directed to the IRGA for measurement over a duration of five minutes. (b) Open circuit: air from the environment (Envin) flows through the IRGA, flushing the system. Afterwards, the air is redirected back into the environment (Envout). Cuvettes 1 to 4 close sequentially, allowing each circuit to alternate between a measurement and a flushing cycle.
Agronomy 15 02180 g003
Figure 4. Mean values and standard deviations of environmental variables inside the closed cuvettes, and whole-plant photosynthetic and transpiration rates for all measured lettuce plants within each experiment. Means were calculated from stable datapoints of closed cuvettes. (a) Relative humidity (RH, %). (b) Temperature (T, °C). (c) Vapour pressure deficit (VPD, kPa). (d) Photosynthetic photon flux density, (PPFD) measured prior to the cuvette experiments. Data from the measured PPFD were coupled with the light control timing to obtain a continuous reading for each cuvette (PPFD, µmol·m−2·s−1). (e) Whole-plant photosynthetic rate, calculated from the slope of the CO2-concentration inside the cuvette (Ap, µmol·m−2·s−1). (f) Whole-plant transpiration rate, calculated from the slope of the H2O-concentration inside the cuvette (Tp, mmol·m−2·s−1).
Agronomy 15 02180 g004
Figure 5. Shift in optimal temperature (Topt, °C) for whole-plant photosynthetic rate driven by changes in photosynthetic photon flux density (PPFD, µmol·m−2·s−1). (a) Simulated whole-plant photosynthetic rates for different PPFD-levels (lines) with their calculated Topt (▲) plotted on top of measurements with DynGES of whole-plant photosynthetic rate from the three experiments. Both the train (○) and test (•) dataset are shown. Simulations were performed with the linear mixed model for whole-plant photosynthetic rate (LMM-Ap) across a range of environmental conditions with temperature ranging from 5 to 35 °C in steps of 0.01 °C, PPFD ranging from 50 to 400 µmol·m−2·s−1 in steps of 50 µmol·m−2·s−1 and RH set to 75%, which is considered preferable for lettuce in CEA systems. (b) Shift in simulated Topt (▲) as a function of PPFD. At low PPFD, Topt is limited by the lower experimental temperature limit of 5 °C.
Agronomy 15 02180 g005
Figure 6. Sobol’ indices of the fixed effects, temperature (T, °C), relative humidity (RH, %) and photosynthetic photon flux density (PPFD, µmol·m−2·s−1), and of the random effect, experiment (Exp) for both linear mixed models for whole-plant photosynthetic rate (LMM-Ap) and whole-plant transpiration rate (LMM-Tp). (a) Mean total sensitivity indices with associated standard deviation. (b) First order sensitivity indices with associated standard deviation. High indices signify more important variables. First order sensitivity indices do not take interaction terms into account, whereas total sensitivity indices do.
Agronomy 15 02180 g006
Figure 7. The effect of vapour pressure deficit (VPD, kPa) and photosynthetic photon flux density (PPFD, µmol·m−2·s−1) on whole-plant photosynthetic rate for lettuce. Measured whole-plant photosynthetic rates from the three experiments (symbols) are plotted on top of mean simulations with the linear mixed model for whole-plant photosynthetic rate (LMM-Ap; lines) and their standard deviation indicated by grey error bars. Simulations were performed with LMM-Ap across a range of environmental conditions with temperature ranging from 5 to 35 °C in steps of 1 °C, PPFD ranging from 50 to 400 µmol·m−2·s−1 in steps of 50 µmol·m−2·s−1 and relative humidity ranging from 60 to 100% in steps of 1%. Combinations of temperature and relative humidity were limited to combinations observed in the cuvette experiments.
Agronomy 15 02180 g007
Figure 8. The effect of vapour pressure deficit (VPD, kPa) and photosynthetic photon flux density (PPFD, µmol·m−2·s−1) on whole-plant transpiration rate for lettuce. Measured whole-plant transpiration rates from the three experiments (symbols) are plotted on top of mean simulations with the linear mixed model for whole-plant transpiration rate (LMM-Tp; lines) and their standard deviation indicated by grey error bars. Simulations were performed with LMM-Tp across a range of environmental conditions with temperature ranging from 5 to 35 °C in steps of 1 °C, PPFD ranging from 50 to 400 µmol·m−2·s−1 in steps of 50 µmol·m−2·s−1 and relative humidity ranging from 60 to 100% in steps of 1%. Combinations of temperature and relative humidity were limited to combinations observed in the cuvette experiments.
Agronomy 15 02180 g008
Table 1. Optimal temperatures (Topt, °C) for photosynthetic rate reported for different species under varying atmospheric CO2-concentrations (Ca, ppm) and photosynthetic photon flux density levels (PPFD, µmol·m−2·s−1).
SpeciesCa/PPFDTOptReference
LichenAmbient/20–4004–20[15]
Tobacco-Leaves380/100–45018–28[19]
Tomato-Canopy400/300–60025–26[18]
Tomato-Leaves350/Light saturation22[17]
Lettuce-Leaves400/100–35019–25Figure 1
Table 2. Mean values and standard deviation of environmental conditions in the growth chamber during the lettuce growth phase for each experiment, including relative humidity (RH, %), day and night temperature (Tx, °C) and day and night vapour pressure deficit (VPDx, kPa).
RHTDayVPDDayTNightVPDNight
Experiment 182.5 ± 8.219.8 ± 0.50.43 ± 0.2017.1 ± 0.70.30 ± 0. 14
Experiment 283.4 ± 7.919.8 ± 0.50.41 ± 0.2017.1 ± 0.70.28 ± 0.13
Experiment 360.2 ± 5.318.9 ± 1.90.92 ± 0.1915.9 ± 1.40.61 ± 0.11
Table 3. Three performance evaluation metrics, R2, root mean squared error (RMSE) and normalized RMSE (NRMSE) were calculated for each experiment and for both the linear mixed model for whole-plant photosynthetic rate (LLM-Ap) and transpiration rate (LMM-Tp). Data were split into train (model fitting) and test (validation) datasets. The metrics represent the comparison between measured values in the test dataset and model-fitted values.
R2RMSENRMSE
ApTpApTpApTp
Experiment 10.940.110.080.010.060.11
Experiment 20.920.870.130.010.080.09
Experiment 30.940.050.100.010.060.19
The test dataset used to calculate these indices contained data of 8 plants over 3 experiments (Number of datapoints = 887). Metrics were calculated for Experiment 1 (n = 2; 357 datapoints), Experiment 2 (n = 3; 311 datapoints) and Experiment 3 (n = 3; 219 datapoints). RMSE in µmol·m−2·s−1 for Ap and in mmol·m−2.s−1 for Tp.
Disclaimer/Publisher’s Note: The statements, opinions and data contained in all publications are solely those of the individual author(s) and contributor(s) and not of MDPI and/or the editor(s). MDPI and/or the editor(s) disclaim responsibility for any injury to people or property resulting from any ideas, methods, instructions or products referred to in the content.