Article

Preharvest Far-Red Light Affects Respiration Rate and Carbohydrate Status in Lettuce Grown in a Vertical Farm and Stored Under Modified Atmosphere Conditions

by
Ellen Van de Velde
1,*,
Lauriane Van Wilder
1,
Marie-Christine Van Labeke
1,
Bruno De Meulenaer
2,
Kathy Steppe
3,
Frank Devlieghere
2 and
Emmy Dhooghe
1,*
1
Horticulture Research Group, Department of Plants and Crops, Faculty of Bioscience Engineering, Ghent University, 9000 Ghent, Belgium
2
Department of Food Technology, Safety and Health, Faculty of Bioscience Engineering, Ghent University, 9000 Ghent, Belgium
3
Laboratory of Plant Ecology, Department of Plants and Crops, Faculty of Bioscience Engineering, Ghent University, 9000 Ghent, Belgium
*
Authors to whom correspondence should be addressed.
Agronomy 2025, 15(8), 1957; https://doi.org/10.3390/agronomy15081957
Submission received: 19 July 2025 / Revised: 9 August 2025 / Accepted: 12 August 2025 / Published: 13 August 2025
(This article belongs to the Special Issue Light Environment Regulation of Crop Growth)

Abstract

Vertical farming allows for precise control of environmental conditions, including light quality, enabling the optimization of plant growth and the synthesis of specific phytochemicals. However, the effects of such conditions on postharvest quality remain underexplored. In this study, butterhead lettuce (Lactuca sativa cv. ‘Alyssa’) was grown for three weeks under light-emitting diode (LED) lighting (190 µmol m−2 s−1; 89% red, 11% blue), with or without supplemental far-red light (ca. 50 µmol m−2 s−1). Growth and quality parameters were assessed at harvest, followed by postharvest evaluation of fresh-cut lettuce stored under equilibrium modified atmosphere packaging (EMAP: 3% O2, balance N2) at 7 °C in darkness for 13 days. The respiration rate of the produce was also determined. Far-red light supplementation increased dry weight (+17%) and elevated glucose (+57%) and fructose (+64%) levels at harvest, without affecting fresh weight, pigment content, vitamin C, or sucrose levels. Although respiration rates during storage were about 54% higher for lettuce grown under far-red light, visual quality seemed slightly better preserved. Total aerobic psychrotrophic counts showed no significant differences between treatments at harvest or during storage. These findings suggest that far-red light can enhance certain quality traits of lettuce, particularly carbohydrate accumulation and dry weight, but the associated rise in respiration may limit these benefits postharvest. Further research is needed to clarify its long-term impact in vertical farming systems.

1. Introduction

Light management is a critical process in indoor vertical farming. Not only is artificial lighting the principal determinant of the farm’s energy consumption [1], but it also determines plant development as well as many quality aspects of the produce. Numerous studies have focused on the potentially beneficial effects of far-red photons (700–750 nm), which can increase the efficiency of photosynthesis by balancing the excitation levels of photosystem I and II [2,3]. In addition, far-red light modulates the state of the phytochrome photoreceptors, which exist in two conformations. The stable, inactive state (Pr) can be converted into its active form (Pfr) by absorbing red light, while absorption of far-red photons converts Pfr back to its inactive conformation [4,5]. This inactivation of phytochromes is associated with adaptations to shaded conditions [6].
When leafy greens, such as lettuce, are grown in indoor conditions, supplementation of the photosynthetic photon flux density (PPFD, 400–700 nm) with far-red photons generally stimulates leaf expansion, resulting in a higher fresh and dry biomass [7,8,9,10]. Specific leaf area tends to increase as well, indicating that the leaves are thinner [8,9], which may in turn increase respiration rates because of a greater allocation of biomass to metabolic instead of structural components or due to a better gas diffusion into the leaves [11]. The concentration of photosynthetic pigments in lettuce often decreases under far-red light [8,12,13], which may affect the visual appearance of the plants [14]. On the other hand, the levels of soluble sugars (glucose, fructose and sucrose) are typically increased when far-red light is supplemented [8,9,15].
Light research for indoor plant cultivation has long focused on finding the optimal light recipes for biomass yield and nutritional quality, which are evaluated at harvest. The postharvest life of the produce, however, remains relatively underexplored. Consumers value healthiness and convenience and often choose minimally processed vegetables that have undergone limited processing steps such as cutting, mixing and packaging [16,17]. However, these operations may impact the shelf life. Leafy greens, in particular, are highly perishable due to wilting, mechanical damage or enzymatic discoloration [18,19]. To harness the potential of indoor vertical farming, it is important to address food losses stemming from quality deterioration during storage, transportation and distribution, as they lead to a loss of both economic and nutritional value [20].
The postharvest performance of lettuce is determined by its nutritional value, organoleptic quality, microbial spoilage and the rate of metabolic processes such as respiration and water loss [18,19,21]. Key nutritional components include vitamin C, encompassing ascorbic acid and dehydroascorbic acid, which acts as an antioxidant and may reduce enzymatic pinking and browning during storage [19]. Vitamin C also serves as a cofactor for enzymes and is therefore essential for human nutrition [22]. Carotenoids, which function as antioxidants and some as precursors of vitamin A [23], are also present, as well as carbohydrates (glucose, fructose, sucrose and starch) that contribute to a sweeter flavor [24] and serve as an important energy reserve for the respiring product [25].
Organoleptic quality is also related to sensory aspects such as color, texture and odor. In green lettuce, color is determined by the chlorophyll content, with yellowing, senescence browning and enzymatic browning or pinking of the cut surface being undesirable [19,21,26]. In terms of texture, consumers appreciate firm, crispy leaves [19,26,27]. The odor is influenced by processing operations or stress-induced metabolic processes. Storage under excessively low O2 conditions can lead to fermentation and the production of acetaldehyde, ethanol and lactate, which negatively impact the odor [28,29]. Microbial contamination, caused by sources such as soil, water, workers, seeds and inadequate decontamination, can lead to spoilage and also produce volatile compounds, impacting the odor [30,31]. In the literature, it has been reported that Pseudomonas spp. is often the dominating bacterial species under aerobic conditions, while under anaerobic conditions, lactic acid bacteria such as Leuconostoc spp. and Lactobacillus spp. are most prevalent [31,32].
During dark storage, energy-rich compounds are broken down by respiration, while other processes, such as enzymatic browning and transpiration, also take place [25,33]. To extend the shelf life, it is necessary to slow down the rate at which these processes occur. Common preservation technologies for fresh-cut lettuce include low-temperature storage, which decreases the biochemical reaction rates and slows down microbial growth, and modified atmosphere packaging (MAP), in which the produce is stored at a low O2 concentration and high CO2 concentration to counteract respiration. A low O2 level also reduces enzymatic pinking and browning [34]. The optimum gas composition depends on the type of produce, the storage temperature and preceding processing steps [33,35].
Preharvest environmental conditions can impact the quality and postharvest performance of fresh produce [36], and preservation technologies are often most effective when applied to crops with a high initial quality [35]. However, there is a lack of studies on the integration of preharvest conditions with preservation technologies. The aim of this study was to investigate the effects of preharvest far-red light supplementation on the quality retention of fresh-cut lettuce during cold MAP storage at 7 °C. We hypothesized that far-red light would result in the development of larger, thinner leaves with higher soluble sugar levels and thus higher energy reserves, potentially influencing microbial growth and shelf life.

2. Materials and Methods

2.1. Plant Materials and Experimental Setup

The experiment took place in growth chambers of the Faculty of Bioscience Engineering at Ghent University, Belgium. Seeds of green butterhead lettuce (Lactuca sativa L.) cv. ‘Alyssa’ (Rijk Zwaan, Enkhuizen, The Netherlands) were sown in Jiffy-7 plugs (Jiffy Products International B.V., Zwijndrecht, The Netherlands). The plugs were saturated with nutrient solution, composed of 0.59 mM NH4+, 6.74 mM K+, 4.22 mM Ca2+, 1.69 mM Mg2+, 13.58 mM NO3, 1.35 mM H2PO4 and 2.11 mM SO42−, 15.70 µM B3+, 0.98 µM Cu2+, 27.20 µM Fe3+, 8.01 µM Mn2+, 0.52 µM Mo2+ and 3.98 µM Zn2+ (electrical conductivity [EC] 2.0 dS m−1, pH 5.5). The plugs were placed under white-light-emitting diodes (LEDs) (NS12, Valoya, Helsinki, Finland) with an intensity of 185.4 ± 18.7 µmol m−2 s−1 (20.8% blue, 39.8% green and 39.4% red). During the period of germination and seedling establishment, the light was switched on at 6:00 a.m. and off at 10:00 p.m. (16 h/8 h light/dark cycle). The plugs were regularly sprayed with nutrient solution to keep them moist. The temperature and relative humidity were monitored using DL-USB-173 temperature/relative humidity dataloggers (ATAL, Purmerend, The Netherlands). The temperature was 15.8 ± 0.2 °C (mean ± SE), and the relative humidity was 70.1 ± 0.1%. After 8 days, it was noticed that a few plugs suffered from a fungal infection. Therefore, the plugs were successfully treated with Signum (6.7% pyraclostrobin en 26.7% boscalid, BASF, Ludwigshafen am Rhein, Germany).
Three weeks after sowing, uniform seedlings were selected and transferred to a small-scale deep water flow system. Six plants were randomly divided over a growth container (40 × 30 × 12 cm), resulting in a planting density of 50 plants m−2. The growth containers were filled with approximately 4 L of nutrient solution with the same composition as described above. The nutrient solution was covered with non-transparent plastic foil to prevent the growth of algae. Every hour, the nutrient solution was aerated for 20 min using aerator stones connected to a compressor. The EC and pH of the nutrient solution were monitored twice per week with a TetraCon 325 standard conductivity measuring cell (Xylem Analytics, Weilheim, Germany) and a Lab 855 Blueline 14 pH meter (Xylem Analytics, Weilheim, Germany), respectively. The target ranges for EC and pH were 2.0–2.2 dS m−1 and 5.5–6.5, respectively. When the EC dropped below 2.0 or the pH rose above 6.5, the nutrient solution was discarded completely and replaced with fresh nutrient solution. Throughout the experiment, the mean EC was 2.1 ± 0.2 dS m−1 and the pH was 6.3 ± 0.5.
The growth containers were placed in racks equipped with LED fixtures (GreenPower LED dynamic module, Signify, Eindhoven, The Netherlands). Two light treatments were applied. Per light treatment, twelve growth containers were used, each containing six plants. Both light treatments had a photosynthetic photon flux density (PPFD) of approximately 190 µmol m−2 s−1, consisting of 89% red photons (600–700 nm, peak wavelength 660 nm) and 11% blue photons (400–500 nm, peak wavelength 450 nm). Additionally, the +FR treatment received about 50 µmol m−2 s−1 of far-red photons (700–750 nm, peak wavelength 735 nm), while the −FR treatment did not receive far-red photons, implying that the extended PPFD (ePPFD) differed between the light treatments. The light intensities and spectral compositions were verified at the plant level using an SS-110 spectroradiometer (Apogee Instruments, Logan, UT, USA) and are shown in Table 1. The lamps were switched on at 6:00 a.m. and off at 10:00 p.m., resulting in a 16 h/8 h light/dark cycle. The far-red fraction is positively correlated with plant responses mediated by phytochrome and was therefore chosen as a metric for phytochrome effects. The far-red fraction is calculated as:
Far-red fraction = far-red photon flux/(red photon flux + far-red photon flux)
considering a red photon flux from 650 to 670 nm and a far-red photon flux between 720 and 740 nm [37]. The red/far-red (R/FR) ratio was calculated as the ratio of the photon flux from 655 to 665 nm and the photon flux from 725 to 735 nm [38], while the phytochrome photostationary state (PSS) was estimated by multiplying the measured photon flux at every wavelength by the relative absorption of the red- and far-red-absorbing forms of phytochrome, as described by Sager et al. [39]. These metrics are included in Table 1 for reference. During the experiment, the air temperature was 19.4 ± 0.1 °C and the relative humidity was 76.0 ± 0.7%. No CO2 enrichment was applied in this trial.

2.2. Assessment of Plant Status at Harvest

2.2.1. Measurement of Biomass Accumulation and Processing of Fresh Lettuce

After three weeks of cultivation in the deep water flow system, the plants were harvested by cutting them off with a knife under the lettuce head. Per treatment, the fresh weight (FW) of six plants (leaves + stem) was determined. These plants were subsequently dried at 70 °C for 72 h, after which the dry weight (DW) was determined. The other plants were aggregated per three containers, cut into 2 cm wide pieces with a knife and mixed, resulting in four pooled samples per light treatment. Samples of fresh leaf material were stored at −80 °C and later ground in liquid nitrogen with pestle and mortar. The ground samples were again stored at −80 °C until chemical analysis.

2.2.2. Photosynthetic Pigment Analysis

Photosynthetic pigments were analyzed as described by Lichtenthaler and Buschman [40]. Ca. 90 mg of ground leaf material was incubated in 1.5 mL of acetone (80 vol%) for 24 h at −20 °C to extract the chlorophyll a (Chla), chlorophyll b (Chlb) and carotenoids (Cx+c). After centrifugation at 4000 rpm for 10 min (Centrifuge 5804 R, Eppendorf, Hamburg, Germany), 200 µL of the supernatant was transferred to a 96-well plate. The absorbance was measured at 470 nm, 647 nm and 663 nm with a spectrophotometer (Infinite 200, Tecan Group Ltd., Männedorf, Switzerland) and adjusted for pathlength using the law of Lambert–Beer. The pigment contents were calculated in µg mL−1 using the following equations:
Chla = 12.25 × A663−2.79 × A647,
Chlb = 21.5 × A647−5.1 × A663,
Cx+c= (1000 × A470−1.82 × Chla−85.02 × Chlb)/198,
with Ax being the absorbance measured at wavelength x. Subsequently, the pigment concentrations were recalculated to µg g−1 FW.

2.2.3. Vitamin C Analysis

The determination of the vitamin C concentration (sum of ascorbic acid and dehydroascorbic acid) was performed based on a combination of earlier published protocols [41,42]. During the analysis, all glasswork was protected from daylight to prevent vitamin C oxidation. Ca. 30 g of freshly harvested lettuce leaves was weighed, submersed in extraction buffer (0.1 M citric acid and 0.05 M ethylenediaminetetraacetic acid (EDTA) in 5% MeOH) with four droplets of Antifoam C emulsion (Sigma-Aldrich, St. Louis, MO, USA) into a total volume of 50.0 mL and homogenized with a mixer. The mixture was then 1:2 diluted and filtered over a fold filter. A total of 10.0 mL of the filtrate was transferred to a falcon tube with 200 mg acid-washed active charcoal to convert the present ascorbic acid to dehydroascorbic acid. The tube was then shaken vigorously for 30 s, and its content was again filtered over a fold filter. A total of 5.0 mL of the filtrate was transferred to a volumetric flask of 25 mL and 1:5 diluted with 5% MeOH (pH 2.3), followed by filtration over a Whatman 40 filter. Next, 5 mL of the filtrate was transferred to a volumetric flask of 10 mL. A total of 1.0 mL of orthophenylenediamine (OPD, 2.5 g/L) was added, and the solution was further diluted by adding 4.0 mL of 5% MeOH (pH 2.3). A total of 1 mL of the resulting solution was then transferred to an HPLC vial. By adding the OPD, the dehydroascorbic acid formed its highly fluorescent quinoxaline derivative. After 60 min of incubation in the dark, these samples were analyzed using an HPLC 1100 Series (Agilent, Waldbronn, Germany) with a fluorescence detector (excitation wavelength 350 nm, emission wavelength 430 nm). A reverse-phase C18 column (Pursuit XRs 3 C18, 150 × 4.6 mm) was used at a column temperature of 35 °C. The mobile phase consisted of 5% MeOH, 5 mM cetrimide and 50 mM KH2PO4 (pH 4.6).

2.3. Packaging and Storage Conditions

During storage, fresh vegetables continue to actively metabolize, and therefore, it is recommended to use cold storage and a low O2 concentration (1–5% O2) [43,44]. To maintain these conditions during storage in this experiment, the pooled fresh-cut lettuce samples were packed using an equilibrium modified atmosphere packaging (EMAP) approach. Bags of 47 cm × 22 cm were custom-made using Top 40PA foil (Amcor, Zurich, Switzerland) with an O2 permeability of approximately 420 mL day−1 m−2 at 7 °C. Every bag contained approximately 50 g of fresh-cut lettuce. The bags were filled with a gas mixture of ca. 3.0% O2 (balance N2) and sealed using a Multivac C300 vacuum packaging machine (Multivac, Mechelen, Belgium) connected to a Witt MG18-3MSO gas mixer (Gasetechnik, Dortmund, Germany). The packaged lettuce was subsequently stored in the dark in a walk-in cold room at 7 °C. This storage temperature was selected based on the Belgian food hygiene regulation, which defines this as the maximum temperature for the refrigerated storage of fresh-cut vegetables [45].

2.4. Evaluation of Postharvest Quality

2.4.1. Respiration Measurements

To study the respiration rate of the produce, fresh-cut lettuce was stored at 7 °C in air-tight bottles, as described by Jacxsens et al. [43]. Ca. 50 g of fresh-cut lettuce was transferred to a bottle (ca. 660 mL). This bottle was subsequently filled with a gas mixture of approximately 9.8% O2 (balance N2) with the equipment described in Section 2.3. The bottles were hermetically sealed using petrol jelly (VWR, Leuven, Belgium) and stored in a fridge at 7 °C. The lid of each respiration bottle contained a rubber septum that allowed for sampling the headspace with a syringe. The first headspace sampling was carried out after 24 h of storage, and the sampling was repeated every 12 h. Each time, the O2 and CO2 concentrations were determined using a CheckMate III (Dansensor/Ametek Mocon, Brooklyn Park, MN, USA). After 96 h, the measurements were concluded. To describe the relation between time and the O2 concentration inside the bottle, a second-degree polynomial was used:
[O2] = a⋅t2 + b⋅t + c,
where [O2] represents the O2 concentration in the bottles (in %) and t represents the time (in hours). By determining the regression coefficients a and b, the timepoint t at which the O2 level reaches a certain concentration can be calculated by solving the quadratic equation for every bottle. The respiration rate (expressed as the oxygen consumption rate, RO2, in mL O2 kg−1 h−1) at any given time t can then be calculated as
RO2(t) = −(2⋅a⋅t + b)·V/(100⋅W)
with V being the gas volume in the bottle (in mL) and W being the plant weight transferred to the bottle (in kg). For this experiment, RO2 was calculated at 3% O2, as this is a desirable O2 concentration for EMAP of lettuce [43]. Per treatment, eight bottles were filled and sampled. Three respiration bottles of each treatment started leaking during the sampling period and were omitted from the RO2 calculation.

2.4.2. Sampling of the Packaged Lettuce

During storage, the packaged lettuce was periodically sampled to assess the postharvest performance. The first sample was taken on the first day after harvest (DAH), and the next sampling moments were 3, 5, 7, 9, 11 and 13 DAH. First, the gas composition of the sampled bag was checked by taking a gas sample and analyzing it using a CheckMate III (Dansensor/Ametek Mocon, Brooklyn Park, MN, USA) to ensure EMAP conditions and the absence of leakages. The mean O2 concentration in the bags was 3.4 ± 0.3%, and the mean CO2 concentration was 2.1 ± 0.2%. The bag was then opened, and its content was divided into subsamples for different measurements. To obtain a first impression of the overall visual quality (OVQ) and the usefulness of a consumer panel for evaluating EMAP-stored lettuce, the sensory quality was assessed by two experienced assessors (see Section 2.4.3). At 1, 3, 5, 7 and 13 DAH, lettuce samples were ground in liquid nitrogen for the analysis of soluble sugars (see Section 2.4.4). At 7 and 13 DAH, samples were taken to determine the total aerobic psychrotrophic count (see Section 2.4.5).

2.4.3. Sensory Quality Assessment

At every sampling moment, two experienced evaluators independently assessed the sensory quality of a lettuce sample of both treatments. Attributes evaluated included color (yellowing, senescence browning, wound browning/pinking of the cut surface), texture (firmness, crispness) and odor (smell, aroma). These were scored on a 9-point hedonic scale based on the criteria listed in Table 2. All evaluations took place at room temperature under white fluorescent light, with samples presented in randomized order. The OVQ score was calculated as the mean of the separate scores for color, texture and odor.

2.4.4. Soluble Sugars

At the times specified in Section 2.4.2, three samples were taken from a bag, ground in liquid nitrogen and stored at −80 °C until analysis. The extraction of soluble carbohydrates was performed as described by Christiaens et al. [47]. Ca. 250 mg of ground lettuce was suspended in 6 mL of 80% EtOH for 3 h at 45 °C. After 5 min of centrifugation at 5000 rpm, the supernatant was purified with 50 mg mL−1 polyvinylpyrrolidone. After another 5 min of centrifugation at 5000 rpm, the supernatant was transferred to an Eppendorf tube. The ethanol was evaporated, and the precipitates were resuspended in cold 90% acetonitrile, followed by centrifugation for 5 min at 11,000 rpm. The supernatant was filtered through a Chromafil filter (pore size 0.20 µm, Roth GmbH, Karlsruhe, Germany) and transferred to a vial for analysis by ultra-performance liquid chromatography (UPLC). The equipment used was an Acquity H-Class UPLC system (Waters, Milford, MA, USA) coupled with an Acquity Evaporative Light Scattering Detector (Waters, Milford, MA, USA). Glucose, fructose and sucrose were separated using an Acquity UPLC BEH Amide column (130 Ä, 1.7 μm, 2.1 mm × 100 mm) kept at 55 °C.

2.4.5. Microbial Contamination

The level of microbial contamination was assessed by determining the total aerobic psychrotrophic count (TAPC). A total of 10 g of fresh-cut lettuce was transferred to a sterile stomacher bag. A total of 90 g of peptone saline solution (1 g/L Neutralized Bacteriological Peptone, Oxoid Ltd., UK, and 8.5 g/L NaCl) was added, and this mixture was homogenized for 60 s using a Stomacher Lab-Blender 400 (Led Techno, Heusden-Zolder, Belgium). A decimal dilution series was prepared in peptone saline solution, and 1 mL aliquots were pour-plated in plate count agar (Oxoid Ltd., Hampshire, UK). The plates were subsequently incubated at 22 °C for 96 h. The number of colony-forming units (CFUs) was counted, and the total aerobic psychrotrophic count was expressed as the log CFU g−1 FW. At every sampling moment, this analysis was performed with three replicates.

2.5. Statistical Analysis

Statistical analysis was performed using RStudio (R version 4.4.3 [48]), extended with the ggplot2 [49] and car [50] packages. For every timepoint, normality of the residuals was assessed using a Shapiro–Wilk test and homoscedasticity was checked by performing a Levene test. In all cases, both assumptions were met, and subsequently, a two-sample t-test was used to compare the two preharvest light treatments. As there were only two assessors in the sensory evaluation, no statistical comparison was performed on these data.

3. Results

3.1. Plant Quality at Harvest

Plants grown under the −FR light treatment showed a more compact growth than +FR plants (Figure 1). After three weeks of cultivation under the light treatments, there was no statistically significant difference in FW between −FR plants (107.08 ± 8.43 g) and +FR plants (113.53 ± 2.68 g) (Table 3, p = 0.241). The DW, however, showed a statistically significant increase of more than 17% when far-red light was supplemented (p = 0.033). According to the spectrophotometric analysis of plant pigments, far-red light supplementation did not significantly affect the chlorophyll a and carotenoid contents in the leaves (Table 3, p = 0.907 and p = 0.817, respectively). The chlorophyll b level, on the other hand, seemed to be slightly decreased in +FR plants (−19.2%, p = 0.076). The vitamin C level (sum of ascorbic acid and dehydroascorbic acid) was 118 ± 10 µg g−1 FW for −FR plants. The plants cultivated under the +FR treatment showed a slightly higher vitamin C level (141 ± 11 µg g−1 FW), but this difference was not statistically significant (p = 0.168).

3.2. Overall Visual Quality

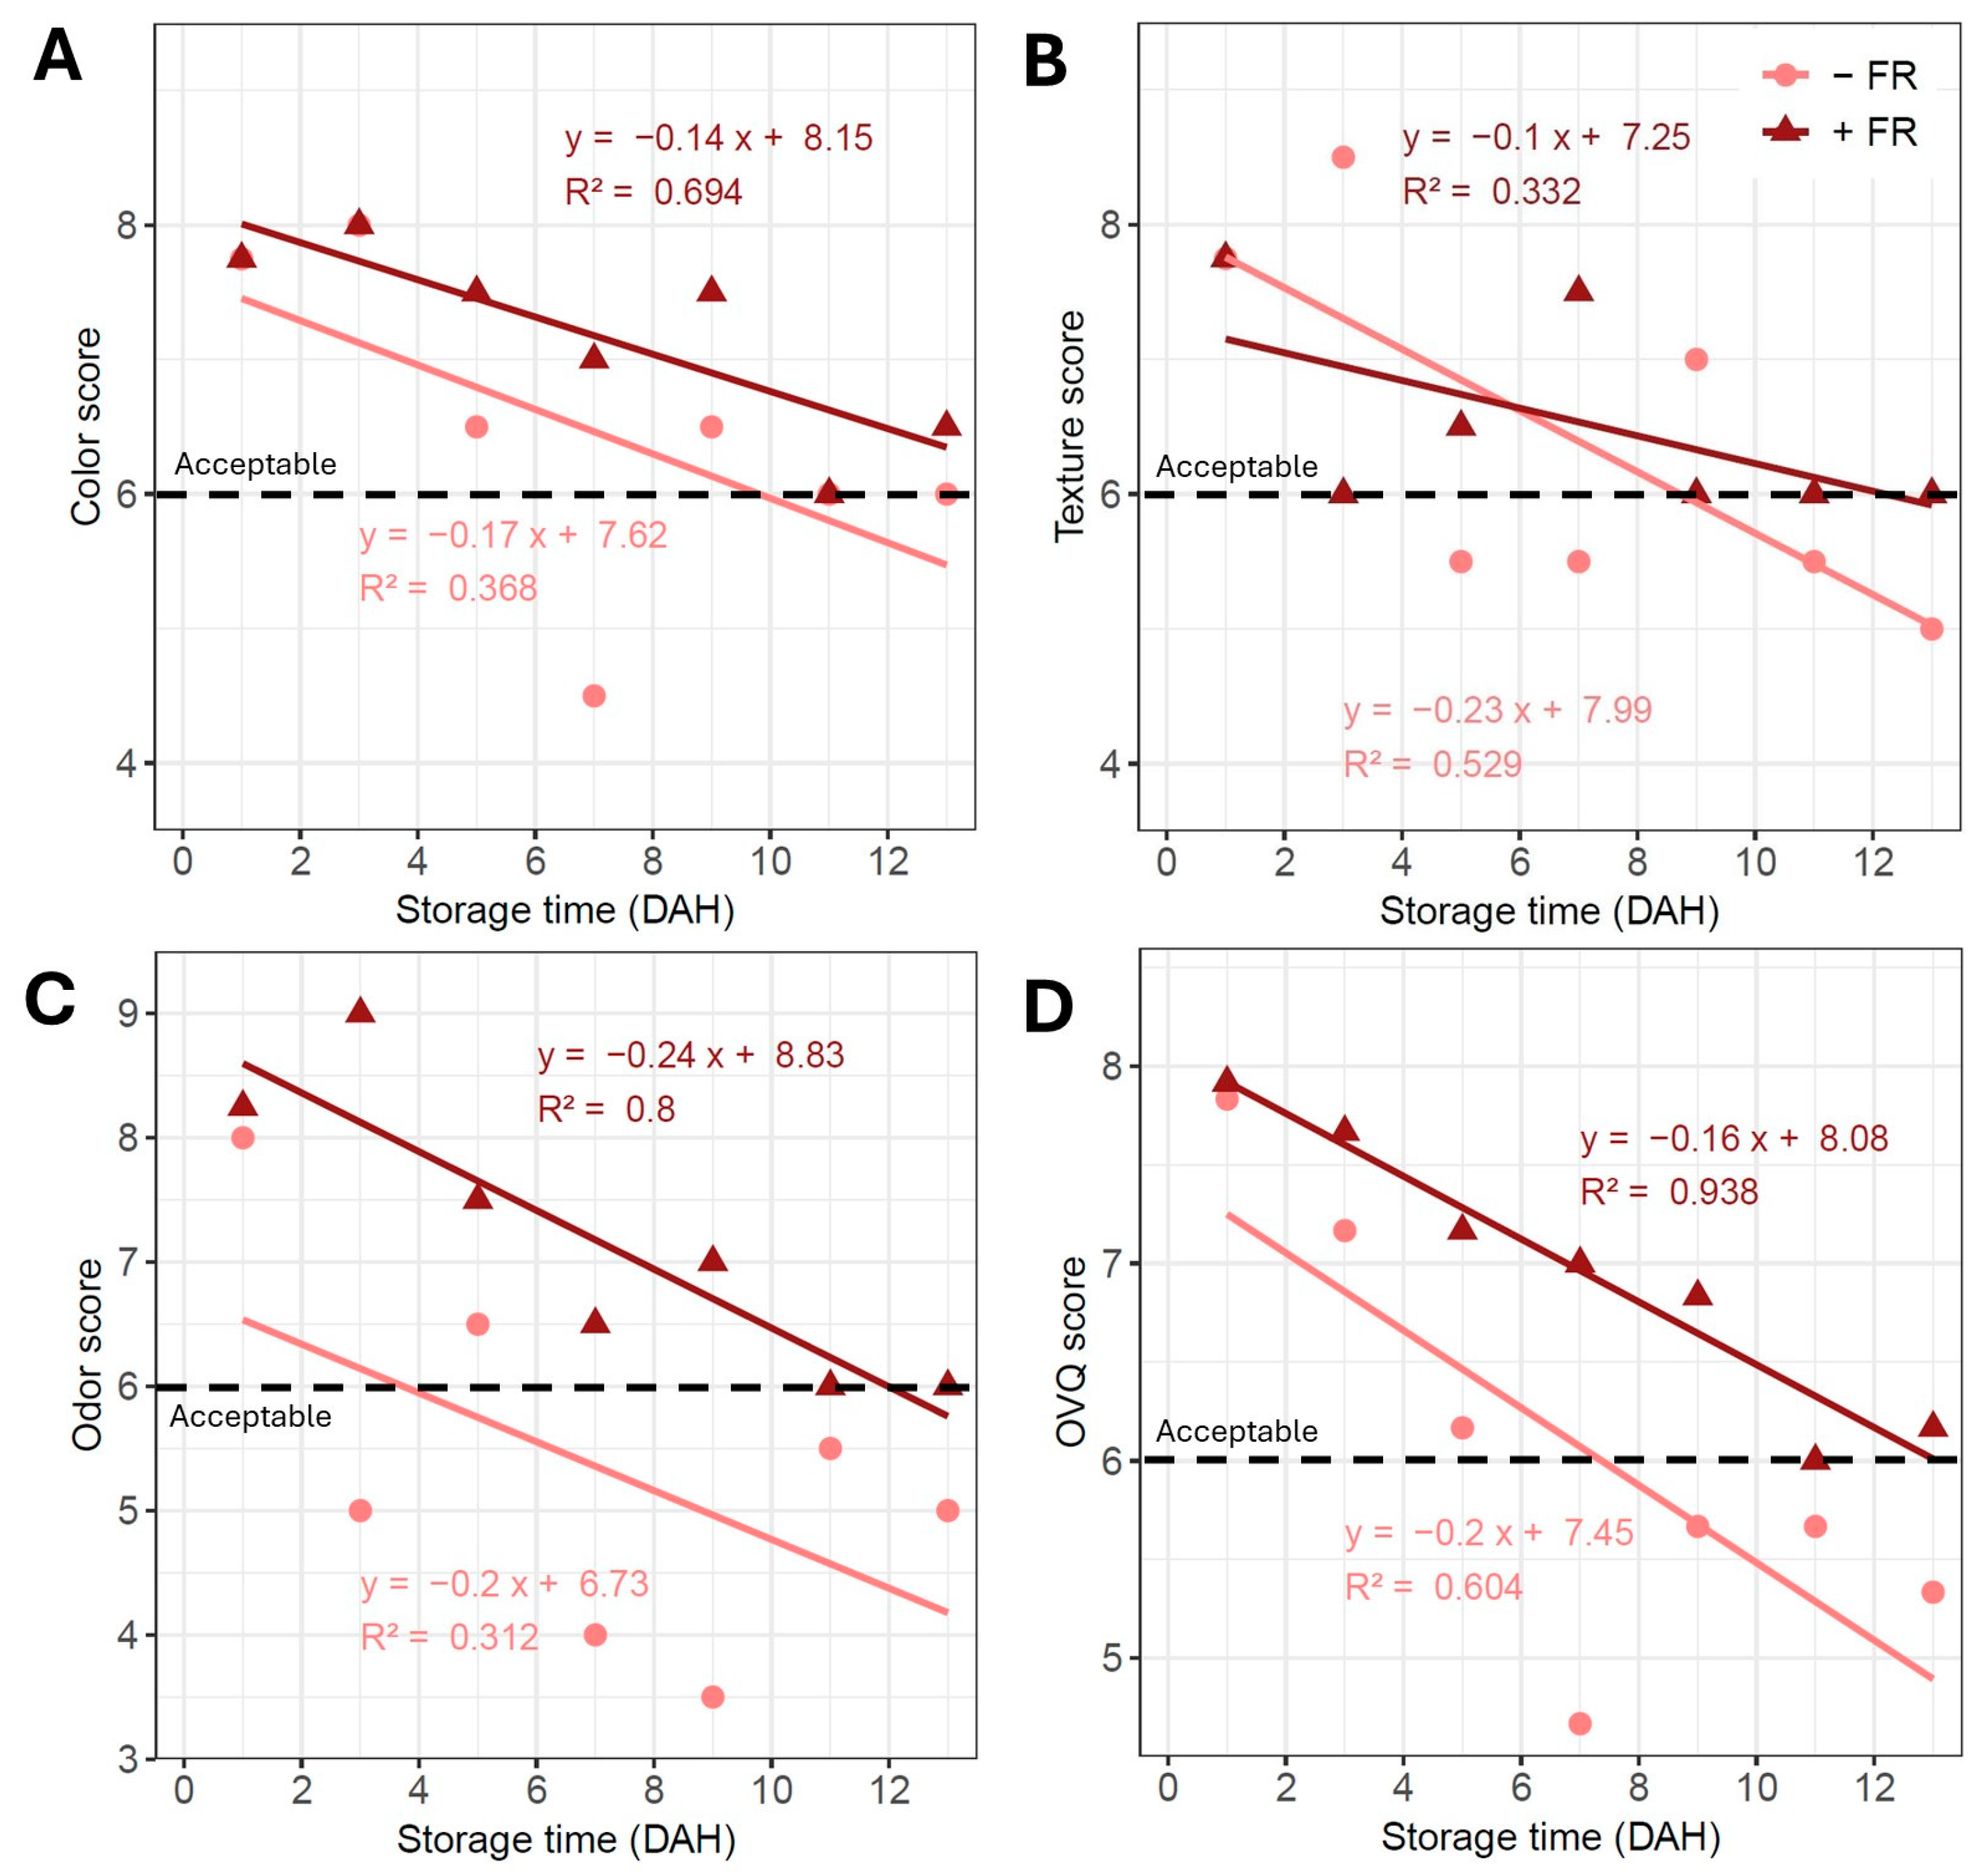
As a first indication of the overall postharvest performance, the color (Figure 2A), texture (Figure 2B) and odor (Figure 2C) of the produce were assessed. The OVQ was then calculated as the mean of the aforementioned quality attributes (Figure 2D). For every light treatment, a linear regression was fitted to describe the relation between storage time and the parameter of interest. The lowest R2 was found for relation between odor and time of the −FR treatment (R2 = 0.312), while the highest R2 was observed for the OVQ score of the +FR treatment (R2 = 0.938). Due to the limited number of observations, differences between the light treatments during cultivation could not be statistically evaluated. However, it can be stated that the scores were generally higher for the +FR treatment than for the −FR treatment, except for the texture scores at 1 and 3 DAH. For all quality attributes and the OVQ, the intersection of the regression line and the acceptability threshold (y = 6) was reached at an earlier point during storage for the −FR treatment.

3.3. Respiration Rate

The oxygen concentration inside the sealed respiration bottles (initial O2 concentration ca. 9.8%, balance N2) was modelled as a function of time using a second-degree polynomial (Figure 3A). To calculate the respiration rate, expressed as the oxygen consumption rate (in mL O2 kg−1 h−1) around 3% O2, a model was fitted for every bottle, so the respiration rate inside every bottle could be calculated separately. The respiration rate of lettuce grown with far-red light (+FR) was significantly higher than the respiration rate of lettuce cultivated without far-red light (−FR) (p = 0.022), as shown in Figure 3B. The respiration rates of the +FR and −FR treatments were on average 10.33 ± 1.10 mL O2 kg−1 h−1 and 6.70 ± 1.06 mL O2 kg−1 h−1, respectively, indicating that far-red light supplementation increased the respiration rate with about 54%.

3.4. Soluble Sugar Content

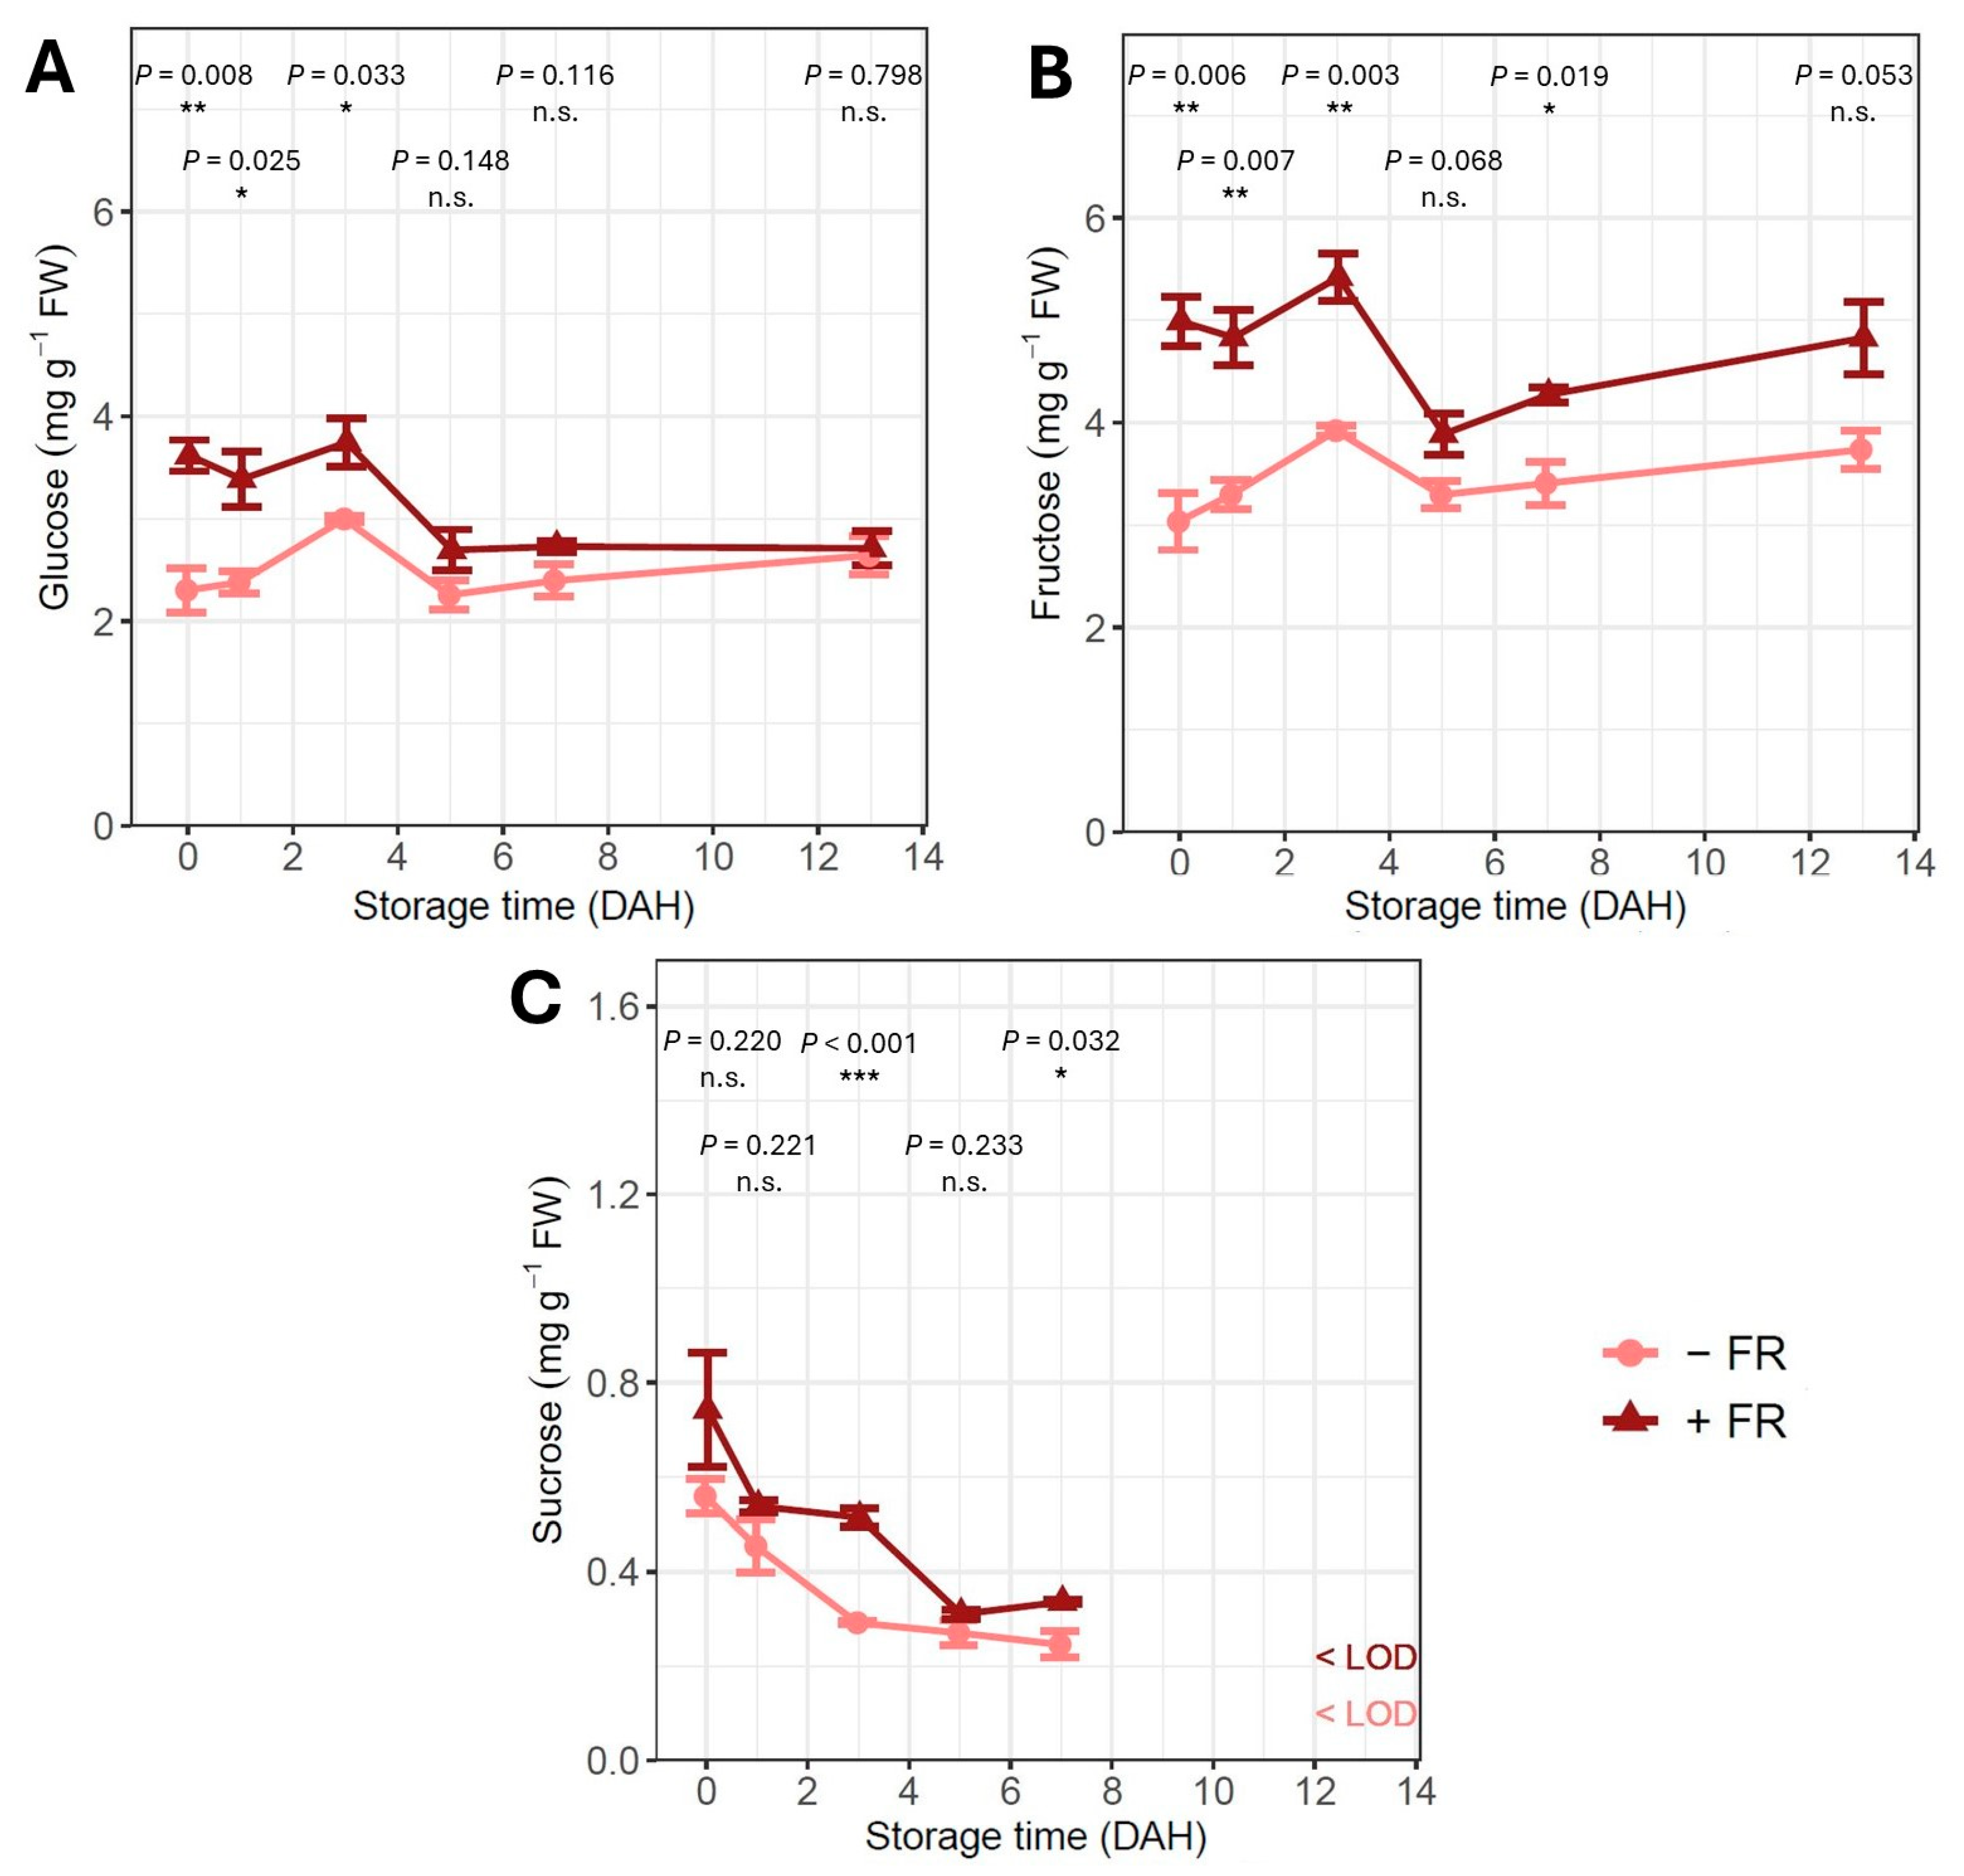
The levels of glucose, fructose and sucrose present in the lettuce and their evolution during the EMAP storage are shown in Figure 4A–C, respectively. At harvest (0 DAH), the level of glucose was 2.3 ± 0.2 mg g−1 FW for −FR plants. For +FR plants, the glucose content was 3.6 ± 0.2 mg g−1 FW, which is a significant increase (p = 0.008) of about 57%. Similarly, far-red light supplementation significantly increased the fructose content at harvest with about 64% (p = 0.006). The sucrose content, in contrast, did not show a significant difference between the light treatments at the moment of harvesting (p = 0.220).
During the first three days of storage, the glucose and fructose levels showed an increasing trend, which was most apparent for the −FR treatment (+ 30% and + 29% by the 3rd DAH for glucose and fructose, respectively, compared to + 4% and + 9% for the +FR treatment). The content of both compounds remained significantly higher for plants grown under far-red light (p = 0.033 for glucose and p = 0.003 for fructose at 3 DAH). On the other hand, the sucrose levels declined during the first three days (−48% for plants grown under the −FR treatment and −31% for +FR).
The content of both glucose and fructose declined sharply between 3 and 5 DAH, and the downward trend in sucrose content also continued. For the remainder of the storage time (5–13 DAH), glucose levels remained constant, but statistical differences between the light treatments were no longer present (p = 0.148 at 5 DAH, p = 0.116 at 7 DAH and p = 0.798 at 13 DAH). On the contrary, the fructose levels seemed to slightly increase again in both treatments. The fructose content remained higher in the +FR treatment (p = 0.068 at 5 DAH, p = 0.019 at 7 DAH and p = 0.053 at 13 DAH). The sucrose level remained relatively stable between 5 DAH and 7 DAH. At 13 DAH, however, the sucrose content in the plant material had fallen below the limit of detection (LOD) of the analysis method, which was 0.2 mg g−1 FW.

3.5. Microbial Contamination

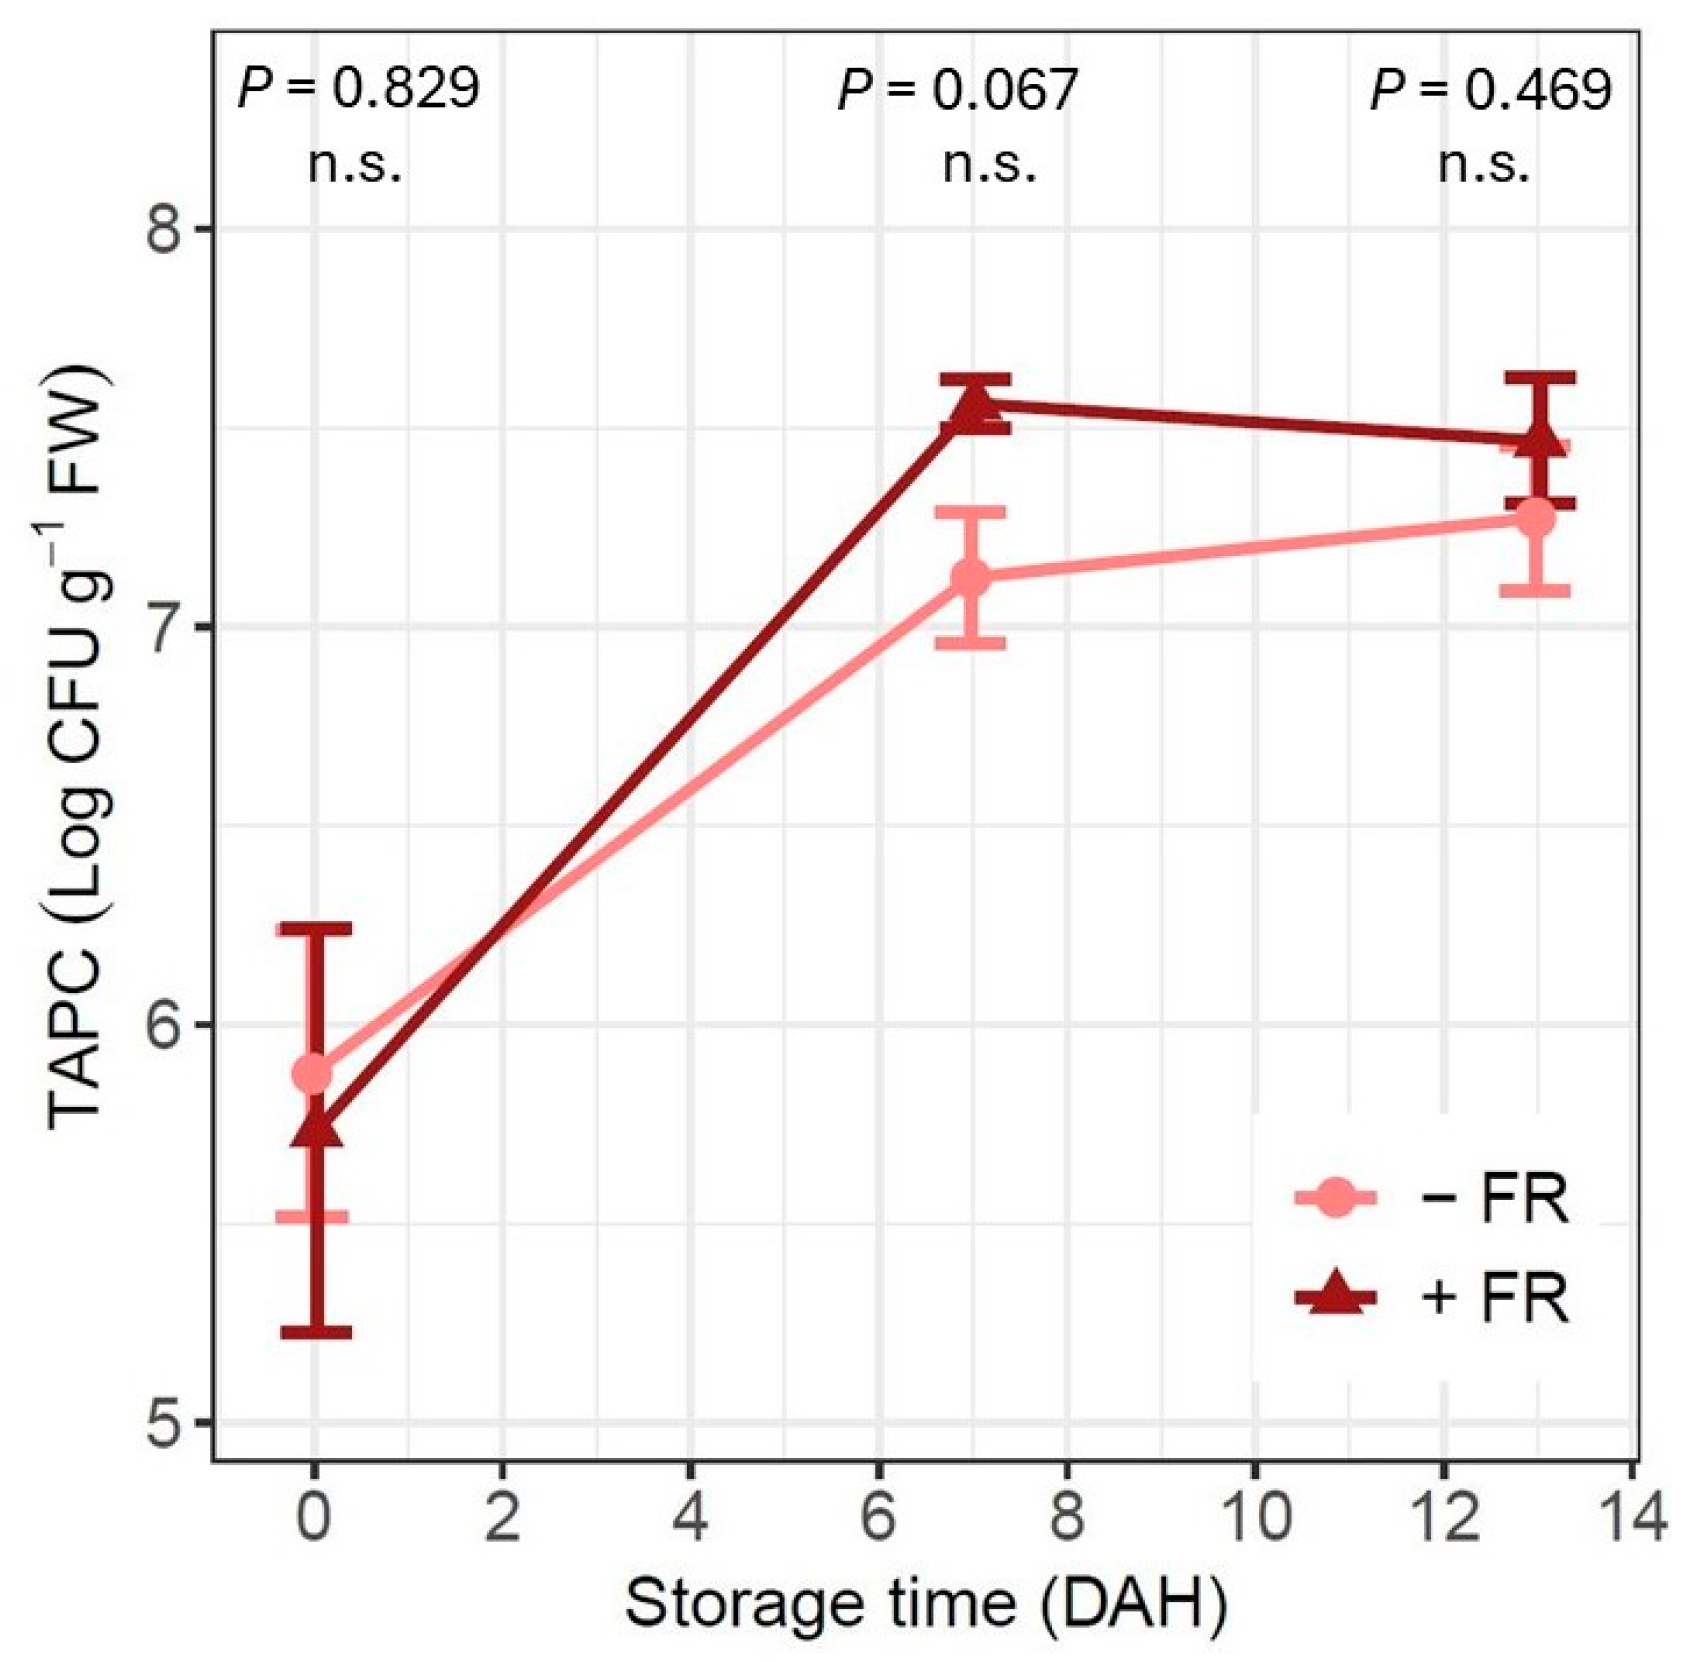
The results of the microbial counts during the storage of fresh-cut lettuce under EMAP conditions are shown in Figure 5. The initial TAPC at 0 DAH was about 5.80 log CFU g−1 FW and did not statistically differ between the preharvest light treatments (p = 0.829). At 7 DAH, the TAPC of the +FR treatment had increased to 7.56 ± 0.06 log CFU g−1 FW, compared to 7.12 ± 0.16 log CFU g−1 FW for the −FR treatment (p = 0.067). At 13 DAH, the TAPC of both preharvest light treatments remained at the same level of magnitude, with 7.47 ± 0.16 log CFU g−1 FW for the +FR treatment and 7.27 ± 0.18 log CFU g−1 FW for the −FR treatment (p = 0.469).

4. Discussion

Although the effects of far-red light supplementation on lettuce growth in indoor conditions have been extensively studied (e.g., [7,8,9,10,12,13,14,15]), little attention has been paid to the postharvest performance of the produce. Zou et al. [27] evaluated the nutraceutical quality and shelf life of lettuce produced with far-red light supplementation, but they did not apply storage under low-oxygen conditions. To the best of our knowledge, the present study is the first report on the effect of preharvest far-red light addition on the postharvest phase of fresh-cut lettuce under refrigerated EMAP storage conditions.

4.1. Preharvest Far-Red Light Minimally Affects Plant Quality at Harvest

In the present study, the fresh weight of the lettuce plants was not affected by far-red light supplementation. In contrast, far-red light significantly increased the dry weight, indicating an increase in dry matter content in plants exposed to far-red light. Far-red light commonly stimulates leaf expansion, which often also results in a higher dry weight. While this is often accompanied by a higher fresh weight [8,9,10], this is not always the case [51].
The analysis of photosynthetic pigments showed no significant differences between the light treatments for chlorophyll a and carotenoids. This seems contradictory to many other reports found in the literature, where a significantly lower pigment content is found under far-red light supplementation. However, these measurements are often obtained with sensor measurements such as SPAD (e.g., [10]) or the results are expressed relative to the leaf area [8]. The decrease in pigment content is then often explained as a “dilution” effect due to increased leaf expansion [52]. When the pigment content is expressed per leaf mass, as is the case in the present study, some studies report only a limited effect of far-red light supplementation [9,14]. Another explanation for the lack of a statistically significant difference in pigment content could be the sampling method used. Instead of selecting a specific leaf (e.g., the youngest fully expanded leaf), the samples were taken from a mixture of dark-green outer leaf tissue and light-green inner leaf tissue. This likely increased variability within the samples and may have affected the outcome of the statistical analysis. In contrast to the chlorophyll a and carotenoid contents, the content of chlorophyll b slightly decreased under far-red light supplementation. It has been shown that the chlorophyll a/b ratio can be lowered by far-red light as a strategy to maximize light harvesting in shaded conditions [53].
Vitamin C is an important antioxidant in lettuce and may help reduce enzymatic pinking and browning [19]. Its concentration is known to be affected by light quantity and quality. In our trial, the vitamin C concentration at harvest was not significantly affected by the far-red light supplementation. According to the literature, far-red light supplementation during indoor lettuce cultivation has a neutral [7] or negative effect on vitamin C content [14,27]. As the main function of vitamin C is to scavenge reactive oxygen species, it is mostly produced when the plant experiences stress, for example, under high light intensity [19] or when ultraviolet-A is added to the spectrum [54].

4.2. Limited Impact of Preharvest Far-Red Light on Visual Quality

To assess the value of visual assessments of lettuce packaged under a modified atmosphere after a preharvest light treatment, a preliminary evaluation of the overall visual quality (OVQ) of the lettuce was performed by two experienced assessors.
All quality parameters deteriorated with increasing storage time for both light treatments. The color was the most stable parameter throughout the storage period. This can partly be attributed to the cultivar used (‘Alyssa’, Rijk Zwaan), which has the KnoxTM trait that delays pinking [55]. The differences in color between lettuce cultivated with or without far-red light were relatively limited, which reflects the lack of difference in chlorophyll content observed at harvest. In contrast, other studies found that far-red light resulted in paler, yellower leaves [10,14]. However, these studies evaluated leaf color instrumentally on intact leaves. By cutting and mixing the lettuce, we obtained a mixture of fragments from the outer and inner leaves. Since inner leaves have a lower chlorophyll content than outer leaves [26] and because the color assessment was performed visually by assessors, differences in color were possibly more different when observed in our trial.
Lettuce cultivated with far-red light received higher scores for odor than lettuce cultivated without far-red light. The odor score seemed to decrease at the highest rate (highest absolute regression coefficient), which indicates that the decrease in OVQ can largely be attributed to this decrease in odor score. During storage, an unpleasant odor may arise from hypoxic conditions (<1% O2), which induce fermentation and the formation of products such as ethanol, acetaldehyde and lactate [28,29]. In the present trial, however, the O2 concentration remained above 2% for all bags. Another explanation may lie in the production of volatile compounds by microorganisms. Lactic acid bacteria, in particular Leuconostoc spp., can cause an accumulation of acetic and lactic acids in the produce, which is associated with a sour off-odor [31].
In our trial, texture degradation occurred more rapidly for lettuce grown without far-red light. Texture is closely related to crispness and may be affected by the thickness of the leaf and the cel wall plasticity and epidermal cell size, with a higher thickness resulting in a firmer, more appreciable texture [56]. Far-red light supplementation is known to decrease leaf thickness [8,9,12], which may negatively impact the texture at harvest. Texture decay is often a result of water loss and senescence processes [26,36] and is associated with a decline in carbohydrate levels [24].
However, the results of the OVQ assessment in the present study should be approached with caution, as the number of replicates was too limited to allow for statistical testing. In addition, the coefficients of determination of the linear regressions were highly variable, indicating that factors other than storage time affect the different quality attributes. Nevertheless, our findings indicate that larger-scale consumer panels may be useful in evaluating the overall visual quality of EMAP-stored lettuce, providing avenues for further research.

4.3. Far-Red Light Addition Affects Carbohydrate Metabolism but Not Microbial Growth

During storage, metabolic respiration takes place in the harvested plant material, resulting in the breakdown of energy-rich compounds. Carbohydrates (soluble sugars and starch) serve as an important energy reserve for the respiring product, and carbohydrate depletion during dark storage is one of the factors related to postharvest deterioration [25,36]. Additionally, higher sugar levels may result in a sweeter, less bitter flavor [24]. Sugar levels in lettuce are known to be controlled by preharvest light quality and quantity [19,57], and far-red light supplementation in particular increases the levels of soluble sugars in most trials [8,9,15]. In this work, preharvest far-red light supplementation significantly increased the levels of glucose and fructose in lettuce, while no significant difference was found for sucrose. During senescence, catabolic processes take place in leaves to produce respiratory sugars from storage compounds, such as starch or disaccharides [58]. Indeed, our findings indicate that sucrose was broken down into glucose and fructose during the first three days of storage. Starch, on the other hand, was not measured in the present study, but it should be included in future studies to confirm its contribution to the observed sugar dynamics. Whereas other research indicated that higher carbohydrate levels at harvest could be maintained for longer during storage [19], this was not the case in our trial, as no significant differences between the light treatments were present by the end of the storage period. The respiration rate is affected by several factors, including the maturity stage of the plant and its degree of wounding, as well as the temperature and gas composition during storage [59]. Moreover, an increased availability of substrates, such as soluble sugars, can lead to higher transpiration rates [60]. Therefore, the higher respiration rate of lettuce grown under far-red light may be due to its increased glucose and fructose contents. In addition, far-red light supplementation often leads to thinner leaves in lettuce [8,9]. If these thinner leaves experienced a higher degree of wounding or bruising during cutting, this may also have contributed to the increased respiration rate. Often, the shelf life of the product is inversely proportional to the respiration rate, but this was not the case in the present trial, as the overall visual quality was better preserved in plants grown under far-red light.
As the levels of glucose and fructose at harvest were higher for plants grown under far-red light supplementation, we hypothesized that this could increase microbial growth, as microorganisms are able to metabolize these high-energy compounds. Additionally, microorganisms present in the produce also respire, and aerobic bacteria, such as Pseudomonas spp., may significantly contribute to the overall oxygen consumption [61]. However, the initial total aerobic psychrotrophic count determined at harvest did not show a significant difference between the light treatments. At 7 DAH, the microbial count seemed slightly higher for lettuce grown under far-red light supplementation, but by 13 DAH, this difference was no longer present. During storage, the total aerobic psychrotrophic count increased from ca. 5.8 log CFU g−1 FW at harvest to ca. 7.3 log CFU g−1 FW after 13 days of storage for both preharvest light treatments. These microbial loads are in the same order of magnitude as the findings obtained by Ioannidis et al. [32], who reported an increase in total aerobic psychrotropic count from about 4.8 to 7.7 log CFU g−1 FW from day 1 to day 10 of EMAP storage at 4 °C. It has been shown that a psychrotrophic count exceeding 8 log CFU g−1 FW can result in visual defects [35]. The lack of a statistically significant difference in microbial contamination could be partly due to the increased respiration rate, whereby the higher sugar levels in lettuce grown under far-red light supplementation are metabolized for respiration, leaving fewer sugars available for microbial growth. While only the total aerobic psychrotrophic count was assessed in this study, this method provides a general indication of microbial load and is commonly used in postharvest quality evaluation. Future work incorporating microbial community profiling could offer a more detailed understanding of the specific taxa involved.

5. Conclusions

This study explored the impact of preharvest far-red light supplementation on the postharvest performance of fresh-cut lettuce cultivated under indoor conditions and stored using EMAP. The results show that far-red light supplementation during cultivation had no significant effect on photosynthetic pigment content and vitamin C levels at harvest but resulted in elevated initial glucose and fructose contents. This treatment was also associated with an increased respiration rate. A preliminary assessment of the overall visual quality suggested that far-red light supplementation may enhance the appearance of the produce, while the total aerobic psychrotrophic count was not significantly different between the two light treatments. These findings suggest that far-red light supplementation holds promise for improving certain commercially relevant aspects of postharvest quality, which may prove interesting for vertical farming companies and retailers. However, further research is required to clarify its full potential.

Author Contributions

Conceptualization, E.V.d.V., F.D. and E.D.; methodology, E.V.d.V., B.D.M. and F.D.; formal analysis, E.V.d.V. and L.V.W.; investigation, E.V.d.V. and L.V.W.; resources, B.D.M. and F.D.; writing—original draft preparation, E.V.d.V.; writing—review and editing, L.V.W., M.-C.V.L., B.D.M., K.S., F.D. and E.D.; visualization, E.V.d.V. and L.V.W.; supervision, F.D. and E.D.; project administration, K.S.; funding acquisition, K.S. All authors have read and agreed to the published version of the manuscript.

Funding

This research was funded by the Research Foundation—Flanders (FWO) under the Strategic Basic Research (SBO) Programme, project Cross-talk (grant no. S006219N), supporting the PhD work of E.V.d.V. The master thesis work of L.V.W. was supported by the UGent-Agrotopia Endowed Chair. This work was published with the support of the University Foundation of Belgium.

Data Availability Statement

The data that support the findings of this study are available from the corresponding author upon reasonable request.

Acknowledgments

The authors want to express their gratitude to Goedele Luyten from the Centre for Industrial Biotechnology and Biocatalysis (InBio.be) of Ghent University for the UPLC sugar analysis. Furthermore, they wish to thank Danny Pauwels and Ann Dirckx for the introduction to the research infrastructure, Nathalie De Muer for her help with vitamin C analysis and Thomas De Bock for his help in optimizing the respiration measuring procedure at the Department of Food Technology, Safety and Health of Ghent University. Christophe Petit is acknowledged for providing technical assistance during the experiment.

Conflicts of Interest

The authors declare no conflicts of interest. The funders had no role in the design of the study; in the collection, analyses, or interpretation of data; in the writing of the manuscript; or in the decision to publish the results.

Abbreviations

The following abbreviations are used in this manuscript:
LEDLight-emitting diode
(E)MAP(Equilibrium) modified atmosphere packaging
(e)PPFD(Extended) photosynthetic photon flux density
ECElectrical conductivity
PSSPhytochrome photostationary state
FWFresh weight
DWDry weight
EDTAEthylenediaminetetraacetic acid
OPDOrthophenylenediamine
DAHDays after harvest
OVQOverall visual quality
UPLCUltra performance liquid chromatography
TAPCTotal aerobic psychrotrophic count
CFUColony forming units
LODLimit of detection

References

  1. WayBeyond and Agritecture Consulting. 2021 Global CEA Census Report; WayBeyond: Auckland, New Zealand, 2021. [Google Scholar]
  2. Zhen, S.; van Iersel, M.W. Far-Red Light Is Needed for Efficient Photochemistry and Photosynthesis. J. Plant Physiol. 2017, 209, 115–122. [Google Scholar] [CrossRef]
  3. Zhen, S.; Bugbee, B. Far-red Photons Have Equivalent Efficiency to Traditional Photosynthetic Photons: Implications for Redefining Photosynthetically Active Radiation. Plant Cell Environ. 2020, 43, 1259–1272. [Google Scholar] [CrossRef] [PubMed]
  4. Sheerin, D.J.; Hiltbrunner, A. Molecular Mechanisms and Ecological Function of Far-Red Light Signalling. Plant Cell Environ. 2017, 40, 2509–2529. [Google Scholar] [CrossRef]
  5. Sharrock, R.A. The Phytochrome Red/Far-Red Photoreceptor Superfamily. Genome Biol. 2008, 9, 230. [Google Scholar] [CrossRef] [PubMed]
  6. Franklin, K.A. Shade Avoidance. New Phytol. 2008, 179, 930–944. [Google Scholar] [CrossRef] [PubMed]
  7. Li, Q.; Kubota, C. Effects of Supplemental Light Quality on Growth and Phytochemicals of Baby Leaf Lettuce. Environ. Exp. Bot. 2009, 67, 59–64. [Google Scholar] [CrossRef]
  8. Zou, J.; Fanourakis, D.; Tsaniklidis, G.; Cheng, R.; Yang, Q.; Li, T. Lettuce Growth, Morphology and Critical Leaf Trait Responses to Far-Red Light during Cultivation Are Low Fluence and Obey the Reciprocity Law. Sci. Hortic. 2021, 289, 110455. [Google Scholar] [CrossRef]
  9. van Brenk, J.B.; Courbier, S.; Kleijweg, C.L.; Verdonk, J.C.; Marcelis, L.F.M. Paradise by the Far-Red Light: Far-Red and Red:Blue Ratios Independently Affect Yield, Pigments, and Carbohydrate Production in Lettuce, Lactuca Sativa. Front. Plant Sci. 2024, 15, 1383100. [Google Scholar] [CrossRef]
  10. Meng, Q.; Runkle, E.S. Far-Red Radiation Interacts with Relative and Absolute Blue and Red Photon Flux Densities to Regulate Growth, Morphology, and Pigmentation of Lettuce and Basil Seedlings. Sci. Hortic. 2019, 255, 269–280. [Google Scholar] [CrossRef]
  11. Reich, P.B.; Walters, M.B.; Ellsworth, D.S.; Vose, J.M.; Volin, J.C.; Gresham, C.; Bowman, W.D. Relationships of Leaf Dark Respiration to Leaf Nitrogen, Specific Leaf Area and Leaf Life-Span: A Test across Biomes and Functional Groups. Oecologia 1998, 114, 471–482. [Google Scholar] [CrossRef]
  12. Van de Velde, E.; Steppe, K.; Van Labeke, M.-C. Leaf Morphology, Optical Characteristics and Phytochemical Traits of Butterhead Lettuce Affected by Increasing the Far-Red Photon Flux. Front. Plant Sci. 2023, 14, 1129335. [Google Scholar] [CrossRef]
  13. Liu, J.; van Iersel, M.W. Far-Red Light Effects on Lettuce Growth and Morphology in Indoor Production Are Cultivar Specific. Plants 2022, 11, 2714. [Google Scholar] [CrossRef]
  14. Li, Y.; Wu, L.; Jiang, H.; He, R.; Song, S.; Su, W.; Liu, H. Supplementary Far-Red and Blue Lights Influence the Biomass and Phytochemical Profiles of Two Lettuce Cultivars in Plant Factory. Molecules 2021, 26, 7405. [Google Scholar] [CrossRef]
  15. Zou, J.; Zhang, Y.; Zhang, Y.; Bian, Z.; Fanourakis, D.; Yang, Q.; Li, T. Morphological and Physiological Properties of Indoor Cultivated Lettuce in Response to Additional Far-Red Light. Sci. Hortic. 2019, 257, 108725. [Google Scholar] [CrossRef]
  16. Ares, G.; Martínez, I.; Lareo, C.; Lema, P. Failure Criteria Based on Consumers’ Rejection to Determine the Sensory Shelf Life of Minimally Processed Lettuce. Postharvest Biol. Technol. 2008, 49, 255–259. [Google Scholar] [CrossRef]
  17. Ragaert, P.; Verbeke, W.; Devlieghere, F.; Debevere, J. Consumer Perception and Choice of Minimally Processed Vegetables and Packaged Fruits. Food Qual. Prefer. 2004, 15, 259–270. [Google Scholar] [CrossRef]
  18. Peng, H.; Simko, I. Extending Lettuce Shelf Life through Integrated Technologies. Curr. Opin. Biotechnol. 2023, 81, 102951. [Google Scholar] [CrossRef]
  19. Min, Q.; Marcelis, L.F.M.; Nicole, C.C.S.; Woltering, E.J. High Light Intensity Applied Shortly before Harvest Improves Lettuce Nutritional Quality and Extends the Shelf Life. Front. Plant Sci. 2021, 12, 615355. [Google Scholar] [CrossRef]
  20. Okawa, K. Market and Trade Impacts of Food Loss and Waste Reduction. In OECD Food, Agriculture and Fisheries Papers; OECD Publishing: Paris, France, 2015; Volume 75. [Google Scholar] [CrossRef]
  21. Martínez-Ispizua, E.; Calatayud, Á.; Marsal, J.I.; Basile, F.; Cannata, C.; Abdelkhalik, A.; Soler, S.; Valcárcel, J.V.; Martínez-Cuenca, M.R. Postharvest Changes in the Nutritional Properties of Commercial and Traditional Lettuce Varieties in Relation with Overall Visual Quality. Agronomy 2022, 12, 403. [Google Scholar] [CrossRef]
  22. Granger, M.; Eck, P. Dietary Vitamin C in Human Health. In Advances in Food and Nutrition Research; Academic Press Inc: Cambridge, MA, USA, 2018; Volume 83, pp. 281–310. [Google Scholar]
  23. Kim, M.J.; Moon, Y.; Tou, J.C.; Mou, B.; Waterland, N.L. Nutritional Value, Bioactive Compounds and Health Benefits of Lettuce (Lactuca sativa L.). J. Food Compos. Anal. 2016, 49, 19–34. [Google Scholar] [CrossRef]
  24. Lin, K.H.; Huang, M.Y.; Huang, W.D.; Hsu, M.H.; Yang, Z.W.; Yang, C.M. The Effects of Red, Blue, and White Light-Emitting Diodes on the Growth, Development, and Edible Quality of Hydroponically Grown Lettuce (Lactuca sativa L. Var. Capitata). Sci. Hortic. 2013, 150, 86–91. [Google Scholar] [CrossRef]
  25. O’Leary, B.M.; Plaxton, W.C. Plant Respiration. In Encyclopedia of Life Sciences; Wiley: Hoboken, NJ, USA, 2016; pp. 1–11. [Google Scholar]
  26. Agüero, M.V.; Barg, M.V.; Yommi, A.; Camelo, A.; Roura, S.I. Postharvest Changes in Water Status and Chlorophyll Content of Lettuce (Lactuca sativa L.) and Their Relationship with Overall Visual Quality. J. Food Sci. 2008, 73, S47–S55. [Google Scholar] [CrossRef] [PubMed]
  27. Zou, J.; Fanourakis, D.; Tsaniklidis, G.; Woltering, E.J.; Cheng, R.; Li, T. Far-Red Radiation during Indoor Cultivation Reduces Lettuce Nutraceutical Quality and Shortens the Shelf-Life When Stored at Supra Optimal Temperatures. Postharvest Biol. Technol. 2023, 198, 112269. [Google Scholar] [CrossRef]
  28. Lonchamp, J.; Barry-Ryan, C.; Devereux, M. Identification of Volatile Quality Markers of Ready-to-Use Lettuce and Cabbage. Food Res. Int. 2009, 42, 1077–1086. [Google Scholar] [CrossRef]
  29. Beaudry, R.M. Responses of Horticultural Commodities to Low Oxygen: Limits to the Expanded Use of Modified Atmosphere Packaging. HortTechnology 2000, 10, 491–500. [Google Scholar] [CrossRef]
  30. Ragaert, P.; Devlieghere, F.; Devuyst, E.; Dewulf, J.; Van Langenhove, H.; Debevere, J. Volatile Metabolite Production of Spoilage Micro-Organisms on a Mixed-Lettuce Agar during Storage at 7 °C in Air and Low Oxygen Atmosphere. Int. J. Food Microbiol. 2006, 112, 162–170. [Google Scholar] [CrossRef]
  31. Paillart, M.J.M.; van der Vossen, J.M.B.M.; Levin, E.; Lommen, E.; Otma, E.C.; Snels, J.C.M.A.; Woltering, E.J. Bacterial Population Dynamics and Sensorial Quality Loss in Modified Atmosphere Packed Fresh-Cut Iceberg Lettuce. Postharvest Biol. Technol. 2017, 124, 91–99. [Google Scholar] [CrossRef]
  32. Ioannidis, A.G.; Kerckhof, F.M.; Riahi Drif, Y.; Vanderroost, M.; Boon, N.; Ragaert, P.; De Meulenaer, B.; Devlieghere, F. Characterization of Spoilage Markers in Modified Atmosphere Packaged Iceberg Lettuce. Int. J. Food Microbiol. 2018, 279, 1–13. [Google Scholar] [CrossRef]
  33. Lareo, C.; Ares, G.; Ferrando, L.; Lema, P.; GÁmbaro, A.; Soubes, M. Influence of Temperature on Shelf Life of Butterhead Lettuce Leaves under Passive Modified Atmosphere Packaging. J. Food Qual. 2009, 32, 240–261. [Google Scholar] [CrossRef]
  34. Woltering, E.J.; Paillart, M.J.M. Effect of Low Oxygen Modified- and Controlled-Atmospheres on Quality Attributes and Microbial Population Dynamics in Fresh-Cut Iceberg Lettuce. Acta Hortic. 2024, 1386, 169–173. [Google Scholar] [CrossRef]
  35. Ragaert, P.; Devlieghere, F.; Debevere, J. Role of Microbiological and Physiological Spoilage Mechanisms during Storage of Minimally Processed Vegetables. Postharvest Biol. Technol. 2007, 44, 185–194. [Google Scholar] [CrossRef]
  36. Woltering, E.J.; Witkowska, I.M. Effects of Pre-and Postharvest Lighting on Quality and Shelf Life of Fresh-Cut Lettuce. Acta Hortic. 2016, 1134, 357–365. [Google Scholar] [CrossRef]
  37. Kusuma, P.; Bugbee, B. Far-Red Fraction: An Improved Metric for Characterizing Phytochrome Effects on Morphology. J. Am. Soc. Hortic. Sci. 2021, 146, 3–13. [Google Scholar] [CrossRef]
  38. Holmes, M.G.; Smith, H. The Function of Phytochrome in the Natural Environment—Characterization of Daylight for Studies in Photomorphogenesis and Photoperiodism. Photochem. Photobiol. 1977, 25, 533–538. [Google Scholar] [CrossRef]
  39. Sager, J.C.; Smith, W.O.; Edwards, J.L.; Cyr, K.L. Photosynthetic Efficiency and Phytochrome Photoequilibria Determination Using Spectral Data. Am. Soc. Agric. Eng. 1988, 31, 1882–1889. [Google Scholar] [CrossRef]
  40. Lichtenthaler, H.K.; Buschmann, C. Chlorophylls and Carotenoids: Measurement and Characterization by UV-VIS Spectroscopy. Curr. Protoc. Food Anal. Chem. 2001, 1, F4.3.1–F4.3.8. [Google Scholar] [CrossRef]
  41. Zapata, S.; Dufour, J.-P. Ascorbic, Dehydroascorbic and Isoascorbic Acid Simultaneous Determinations by Reverse Phase Ion Interaction HPLC. J. Food Sci. 1992, 57, 506–511. [Google Scholar] [CrossRef]
  42. Dodson, K.Y.; Young, E.R.; Soliman, A.-G.M. Determination of Total Vitamin C in Various Food Matrixes by Liquid Chromatography and Fluorescence Detection. J. AOAC Int. 1992, 75, 887–890. [Google Scholar] [CrossRef]
  43. Jacxsens, L.; Devlieghere, F.; De Rudder, T.; Debevere, J. Designing Equilibrium Modified Atmosphere Packages for Fresh-Cut Vegetables Subjected to Changes in Temperature. LWT 2000, 33, 178–187. [Google Scholar] [CrossRef]
  44. Zagory, D.; Kader, A.A. Modified Atmosphere Packaging of Fresh Produce. Food Technol. 1988, 42, 70–77. [Google Scholar]
  45. Belgian Official Gazette. Koninklijk Besluit van 13 Juli 2014 Betreffende Levensmiddelenhygiëne; Belgian Official Gazette: Brussels, Belgium, 2014. [Google Scholar]
  46. Kader, A.A.; Lipton, W.J.; Morris, L.L. Systems for Scoring Quality of Harvested Lettuce. HortScience 1973, 8, 408–409. [Google Scholar] [CrossRef]
  47. Christiaens, A.; De Keyser, E.; Lootens, P.; Pauwels, E.; Roldán-Ruiz, I.; De Riek, J.; Gobin, B.; Van Labeke, M.C. Cold Storage to Overcome Dormancy Affects the Carbohydrate Status and Photosynthetic Capacity of Rhododendron Simsii. Plant Biol. 2015, 17, 97–105. [Google Scholar] [CrossRef]
  48. R Core Team. R: A Language and Environment for Statistical Computing; R Foundation for Statistical Computing: Vienna, Austria, 2022. [Google Scholar]
  49. Wickham, H. Ggplot2: Elegant Graphics for Data Analysis; Springer-Verlag: New York, NY, USA, 2016; ISBN 978-3-319-24277-4. [Google Scholar]
  50. Fox, J.; Weisberg, S. An {R} Companion to Applied Regression, 3rd ed.; Sage: Thousand Oaks, CA, USA, 2019. [Google Scholar]
  51. Mickens, M.A.; Skoog, E.J.; Reese, L.E.; Barnwell, P.L.; Spencer, L.E.; Massa, G.D.; Wheeler, R.M. A Strategic Approach for Investigating Light Recipes for ‘Outredgeous’ Red Romaine Lettuce Using White and Monochromatic LEDs. Life Sci. Space Res. 2018, 19, 53–62. [Google Scholar] [CrossRef]
  52. Wong, C.E.; Teo, Z.W.N.; Shen, L.; Yu, H. Seeing the Lights for Leafy Greens in Indoor Vertical Farming. Trends Food Sci. Technol. 2020, 106, 48–63. [Google Scholar] [CrossRef]
  53. Evans, J.R.; Poorter, H. Photosynthetic Acclimation of Plants to Growth Irradiance: The Relative Importance of Specific Leaf Area and Nitrogen Partitioning in Maximizing Carbon Gain. Plant Cell Environ. 2001, 24, 755–767. [Google Scholar] [CrossRef]
  54. Chen, Y.; Li, T.; Yang, Q.; Zhang, Y.; Zou, J.; Bian, Z.; Wen, X. UVA Radiation Is Beneficial for Yield and Quality of Indoor Cultivated Lettuce. Front. Plant Sci. 2019, 10, 1563. [Google Scholar] [CrossRef] [PubMed]
  55. Rijk Zwaan KnoxTM. Available online: https://www.rijkzwaan.com/en/page/knox (accessed on 25 March 2025).
  56. Clarkson, G.J.J.; O’Byrne, E.E.; Rothwell, S.D.; Taylor, G. Identifying Traits to Improve Postharvest Processability in Baby Leaf Salad. Postharvest Biol. Technol. 2003, 30, 287–298. [Google Scholar] [CrossRef]
  57. Chen, X.; Wang, L.; Li, T.; Yang, Q.; Guo, W. Sugar Accumulation and Growth of Lettuce Exposed to Different Lighting Modes of Red and Blue LED Light. Sci. Rep. 2019, 9, 6926. [Google Scholar] [CrossRef]
  58. Kim, J. Sugar Metabolism as Input Signals and Fuel for Leaf Senescence. Genes Genom. 2019, 41, 737–746. [Google Scholar] [CrossRef]
  59. Jacxsens, L.; Devlieghere, F.; Debevere, J. Quality of Equilibrium Modified Atmosphere Packaged (EMAP) Fresh-Cut Vegetables. In Production Practices and Quality Assessment of Food Crops; Dris, R., Mohan Jain, S., Eds.; Kluwer Academic Publishers: Dordrecht, The Netherlands, 2004; Volume 3, pp. 473–523. [Google Scholar]
  60. Hüve, K.; Bichele, I.; Ivanova, H.; Keerberg, O.; Pärnik, T.; Rasulov, B.; Tobias, M.; Niinemets, Ü. Temperature Responses of Dark Respiration in Relation to Leaf Sugar Concentration. Physiol. Plant 2012, 144, 320–334. [Google Scholar] [CrossRef]
  61. Chaix, E.; Broyart, B.; Couvert, O.; Guillaume, C.; Gontard, N.; Guillard, V. Mechanistic Model Coupling Gas Exchange Dynamics and Listeria Monocytogenes Growth in Modified Atmosphere Packaging of Non Respiring Food. Food Microbiol. 2015, 51, 192–205. [Google Scholar] [CrossRef]
Figure 1. Representative images of lettuce plants grown without far-red (−FR) and with far-red (+FR) light after removing them from the cultivation system. Scalebar = 5 cm.
Agronomy 15 01957 g001
Figure 2. Effect of preharvest far-red light supplementation on the (A) color, (B) texture, (C) odor and (D) overall visual quality (OVQ) of fresh-cut lettuce during EMAP storage (3.4% O2, 2.1% CO2) at 7 °C. The OVQ was calculated as the mean of the color, texture and odor scores. The data points represent the mean of the scores attributed by two experienced assessors. A score of 6 represents the lower limit of acceptability. In panel (A), the color scores of the light treatments overlap at 1 and 3 DAH. This is also the case for the texture score at 1 DAH in panel (B).
Agronomy 15 01957 g002
Figure 3. (A) Oxygen concentration inside the respiration bottles as a function of time during storage of fresh-cut lettuce at 7 °C. The data points represent the mean ± SE (N = 5), to which a second-degree polynomial function is fitted. (B) Effect of preharvest far-red light supplementation on the respiration rate of fresh-cut lettuce (expressed as the oxygen consumption rate around 3% O2). Values shown are the mean ± SE, N = 5. In panel (B), the data were analyzed using a two-sample t-test, * indicates significance at the p < 0.05 level.
Agronomy 15 01957 g003
Figure 4. Effect of preharvest far-red light supplementation on concentration of (A) glucose, (B) fructose and (C) sucrose of fresh-cut lettuce during EMAP storage (3.4% O2, 2.1% CO2) at 7 °C. Data shown are means ± SE, N = 3. The light treatments were compared per timepoint using a two-sample t-test. N.s. means that no significant differences were found, * indicates significance at p < 0.05, ** indicates significance at p < 0.01 and *** indicates significance at p < 0.001.
Agronomy 15 01957 g004
Figure 5. Effect of preharvest far-red light supplementation on the total aerobic psychrotrophic count (TAPC), expressed as the log CFU per g fresh weight of fresh-cut lettuce, during EMAP storage (3.4% O2, 2.1% CO2) at 7 °C. Data shown are means ± SE, N = 3. The light treatments were compared per timepoint using a two-sample t-test. N.s. means that no significant differences were found.
Agronomy 15 01957 g005
Table 1. Spectral characteristics of the light treatments.
TreatmentBlue
(µmol m−2 s−1)
Green
(µmol m−2 s−1)
Red
(µmol m−2 s−1)
Far-Red
(µmol m−2 s−1)
PPFD
(µmol m−2 s−1)
ePPFD
(µmol m−2 s−1)
R/FRPSSFR
Fraction
−FR21.6 ± 0.20.8 ± 0.0169.7 ± 1.30.2 ± 0.0192.1 ± 1.5192.3 ± 1.50.8850.0
+FR22.1 ± 0.21.4 ± 0.1168.4 ± 1.651.5 ± 0.5192.2 ± 1.9238.8 ± 2.34.90.81719.3
Data are means ± SE of 18 measurements. The photon flux density is given for the blue (400–500 nm), green (500–600 nm), red (600–700 nm) and far-red (700–750 nm) ranges, as well as the PPFD (400–700 nm) and ePPFD (400–750 nm). The R/FR ratio [38], PSS [39] and far-red (FR) fraction [37] are also shown.
Table 2. Scoring system for the overall visual quality (OVQ) of lettuce [19,46].
ScoreDescription
9—ExcellentBright and typical natural color of leaf blade and petiole, no browning, firm and crispy with fresh grass-like smell.
8—Very goodOne slightly discolored or browning or pinking features are shown at the leaf cut edge or blade. Leaves are firm and crisp and with a fresh grass-like smell.
7—GoodFew slightly discolored leaves and brown edges are allowed. Leaves still crisp, reduced fresh smell.
6—AcceptableThe defined consumer acceptance threshold. Slightly discolored leaves and moderate brown edges are allowed. No unpleasant odor or texture decay.
5—MediocreSome yellowing and browning of leaf blade, slightly brown petiole, darker brown cut edge, texture decay but still acceptable, slightly unpleasant odor emerged.
4—BorderlineObvious discoloration on leaf blades, browning of leaf blade and petiole, clearly mild soft in texture, unpleasant odor.
3—PoorStrong discoloration, browning of leaves, wilted texture, obvious unpleasant odor.
2—BadComplete yellow or brown leaf, texture decay with liquid leakage, strong off-odor.
1—Very badComplete discolored leaf, liquid leaking from leaf material, fermented smell.
Table 3. Effect of preharvest far-red light supplementation on lettuce fresh weight (FW), dry weight (DW), concentration of chlorophyll a (Chla), chlorophyll b (Chlb), carotenoids (Cx+c) and vitamin C content, all determined at harvest.
TreatmentFW
(g)
DW
(g)
Chla
(µg g−1 FW)
Chlb
(µg g−1 FW)
Cx+c
(µg g−1 FW)
Vitamin C
(µg g−1 FW)
−FR107.08 ± 8.434.36 ± 0.33260 ± 4194 ± 1370 ± 10118 ± 10
+FR113.53 ± 2.685.12 ± 0.16193 ± 1176 ± 359 ± 3141 ±11
p-value0.2410.0330.9070.0760.8170.168
Significancen.s.*n.s.n.s.n.s.n.s.
N663334
Data shown are means ± SE. The light treatments were compared using a two-sample t-test. N.s. means that no significant differences were found, and * indicates significance at p < 0.05.
Disclaimer/Publisher’s Note: The statements, opinions and data contained in all publications are solely those of the individual author(s) and contributor(s) and not of MDPI and/or the editor(s). MDPI and/or the editor(s) disclaim responsibility for any injury to people or property resulting from any ideas, methods, instructions or products referred to in the content.