Article

Time-Course Transcriptome Analysis Reveals Dynamic Nitrogen Response Mechanisms and Key Regulatory Networks in Sugarcane

1
State Key Laboratory for Conservation and Utilization of Subtropical Agro-Bioresources, Guangxi Key Laboratory of Sugarcane Biology, College of Agriculture, Guangxi University, Nanning 530004, China
2
Guangxi Key Laboratory of Sugarcane Biology & National Demonstration Center for Experimental Plant Science Education, Guangxi University, Nanning 530004, China
*
Author to whom correspondence should be addressed.
These authors contributed equally to this work.
Agronomy 2025, 15(9), 2164; https://doi.org/10.3390/agronomy15092164
Submission received: 6 August 2025 / Revised: 6 September 2025 / Accepted: 8 September 2025 / Published: 10 September 2025
(This article belongs to the Special Issue Advancements in Genetic Research and Breeding of Sugar Crops)

Abstract

Nitrogen is an essential mineral nutrient for plant growth and development. However, the molecular response mechanisms of sugarcane under varying nitrogen regimes remain unclear. This study investigated the dynamic responses of sugarcane (GT42) leaves to nitrogen treatment using hydroponic systems. Leaf samples were collected under low nitrogen (LN, 0.2 mM NH4NO3) and normal nitrogen (NN, 2 mM NH4NO3) treatments at 1, 3, 6, 12, 24, 48, and 72 h, as well as under high nitrogen (HN, 6 mM NH4NO3) treatment at 3, 6, and 24 h. RNA-Seq analysis identified differentially expressed genes (DEGs) between LN/NN and HN/NN treatments at corresponding time points. Kyoto Encyclopedia of Genes and Genomes (KEGG) pathway analysis of DEGs from both LN/NN and HN/NN comparisons revealed significant enrichment in nitrogen metabolism and zeatin biosynthesis pathways. These findings aligned with our Weighted Gene Co-Expression Network Analysis (WGCNA) results from LN-treated samples. Through detailed reconstruction of the nitrogen metabolic pathway and zeatin biosynthesis co-expression networks, we established their pivotal regulatory roles in sugarcane’s adaptation to varying nitrogen availability. Our results demonstrate a dynamic, concentration-dependent regulatory network in sugarcane leaves under nitrogen treatment. These findings provide potential targets for improving nitrogen use efficiency (NUE) in sugarcane breeding programs. The study offers new insights into the molecular mechanisms underlying sugarcane’s response to nitrogen fluctuations, with implications for developing nitrogen-efficient cultivars.

1. Introduction

Sugarcane, cultivated in tropical and subtropical regions worldwide, is a significant economic crop valued for its high sucrose content and potential for bioethanol production [1]. Its remarkable biomass yield, environmental resilience, and diverse industrial applications make it a crucial driver of economic growth and development in many regions [2]. Nitrogen, a fundamental component of proteins, nucleic acids, and chlorophyll, is essential for plant growth, development, and treatment tolerance [3]. Plants primarily absorb nitrogen from the soil in the form of nitrate or ammonium, and its assimilation is facilitated by enzymes like glutamine synthetase (GS) and nitrate reductase (NR) [3]. Enhancing NUE has become a top priority in plant research and breeding. This is due to nitrogen’s dual role as both a growth-limiting element for plants and a major component of agricultural fertilizers. Numerous studies have shown that nitrogen fertilizer can significantly boost sugar yield, biomass accumulation, and stalk yield in sugarcane [4,5]. However, excessive nitrogen application promotes excessive vegetative growth at the expense of yield and quality. Conversely, nitrogen deficiency leads to reduced vegetative growth and cane yield.
Nitrogen metabolism and Zeatin biosynthesis pathways significantly impact plant growth and development through complex signaling mechanisms. Nitrogen availability triggers both systemic and local responses that collectively regulate plant growth and metabolism [6]. In soil environments, the two main forms of nitrogen are nitrate-N and ammonium-N. Plants absorb nitrate-N via nitrate transporters (NRTs) and ammonium-N via ammonium transporters (AMTs) [7,8,9]. Cytokinin, particularly trans-zeatin (TZ), mediate growth responses to nitrogen availability and are crucial for long-distance communication between roots and shoots [10]. They function as root-to-shoot signaling molecules, indicating the nitrogen status by accumulating in roots, xylem sap, and leaves following nitrate supplementation [11]. These findings underscore the complexity of crop nitrogen metabolism, providing critical insights for investigating concentration-dependent nitrogen treatment responses in sugarcane leaves.
RNA sequencing (RNA-Seq) is a powerful transcriptome profiling method often used to investigate molecular regulatory processes and identify treatment-responsive genes [12]. WGCNA offers a robust analytical framework for microarray or RNA-Seq data. It enables systematic examination of gene co-expression relationships and facilitates the identification of potential gene-trait associations by constructing biologically meaningful networks. To predict key regulatory genes and their roles in treatment responses, WGCNA has been widely applied in plant systems [13]. It helps in the study of gene expression patterns under various environmental challenges such as drought [14] and low temperatures [15]. Recent research has successfully combined differential expression analysis (differentially expressed genes, DEGs) with WGCNA to identify key genes related to nitrogen uptake and utilization in important crops like rice [16] and potatoes [17]. We combine DEGs with WGCNA, and this combination helps us more efficiently identify key pathways and key candidate genes, which is crucial for understanding how nitrogen treatment at different concentrations affects sugarcane leaves.
The main objectives of this study are as follows: (1) identify key genes associated with different nitrogen concentration treatments over time; (2) combine DEGs and WGCNA analyses to preliminarily determine candidate pathways related to different nitrogen treatments and time; (3) use KEGG enrichment analysis to preliminarily clarify the functions of candidate genes under different nitrogen concentration treatments.

2. Materials and Methods

2.1. Plant Materials and Experimental Methods

The experimental materials consisted of GT42 (one of major sugarcane commercial cultivars in China) sugarcane, cultivated under regular conditions at Guangxi University. Seedlings at the three-leaf and one-heart developmental stage were transplanted into hydroponic systems containing modified Hoagland’s nutrient solution with three nitrogen regimes in June 2024: normal nitrogen (NN, 2 mM NH4NO3), low nitrogen (LN, 0.2 mM NH4NO3), and high nitrogen (HN, 6 mM NH4NO3). The complete nutrient solution composition, maintained at pH 6.0, included: 1.0 mM KH2PO4, 2.0 mM KCl, 1.0 mM MgSO4·7H2O, 2.5 mM CaCl2·2H2O, 0.025 mM Fe-EDTA, 5.0 μM MnCl2·4H2O, 20.0 μM H3BO3, 0.2 μM CuSO4·5H2O, 0.4 μM ZnSO4·7H2O, and 0.05 μM Na2MoO4·2H2O. The nutrient solution was renewed every 4 days with intermittent aeration (30 min/h). A completely randomized design with three biological replicates (individual plants) per treatment was implemented. For temporal analysis, leaf samples from NN- and LN-treated plants were collected at 1, 3, 6, 12, 24, 48, and 72 h post-treatment, while HN-treated plants were sampled at 3, 6, and 24 h. All collected samples were immediately flash-frozen in liquid nitrogen and stored at −80 °C until further analysis.

2.2. RNA-Seq Analysis

RNA-Seq [18] analysis was conducted to clarify the transcriptional kinetics of GT42 under various nitrogen regimes. Leaf tissues were collected, and total RNA was extracted using the Trizol reagent kit (Vazyme Biotech Co., Ltd, Nanjing, China). Libraries were prepared and sequenced on the MGI T7 sequencer (MGI Tech Co., Ltd., Shenzhen, China). After quality control, raw sequencing data were aligned to the R570 (https://sugarcane.gxu.edu.cn/scdb/download (accessed on 15 June 2025)) reference genome [19] using HISAT2 v2.1.0 [20], with the genome index pre-built by Bowtie v2.2.3 [21]. Gene expression levels were quantified and normalized using transcripts per million (TPM) [22,23] measurements.

2.3. Differentially Expressed Gene (DEG) Analysis

DEG analysis is crucial for identifying biomarkers and understanding biological processes in RNA-seq data [24,25]. We performed DGE analysis using the Illumina® NEBNext® Ultra™ RNA Library Prep Kit (New England Biolabs, Ipswich, MA, USA) and sequenced on the BGISEQ platform (Shenzhen Huada Gene Science and Technology Service Co.; Shenzhen, China). Genes with statistically significant differential expression were identified using strict thresholds, with significantly differentially expressed genes defined by |log2 Fold Change| ≥ 1 and p < 0.05.

2.4. Functional Annotation

We used the Kyoto Encyclopedia of Genes and Genomes (KEGG) [26] pathway to annotate DEGs. KEGG pathway analysis was performed using KOBAS (v3.0) [27]. We obtained all markers within these genes and their annotation data. Functions and pathways with p-values less than 0.05 were deemed significantly enriched.

2.5. WGCNA

To identify gene expression patterns at different time points under low nitrogen treatment, we performed WGCNA using the WGCNA plugin in TBtools (v.2.322) software [28]. A gene expression matrix was created from sugarcane leaf transcriptome data that showed significant differential expression under low nitrogen treatment (|log2FC| ≥ 2 and p < 0.05). During network construction, dynamic tree cutting and module merging processes were employed. Dynamic tree cutting clustered genes according to their pairwise correlation coefficients to form unique modules representing collections of genes with similar expression profiles. Subsequent module merging combined highly similar modules (similarity threshold = 0.6) into larger functional units. This approach reduced the number of modules while preserving biological relevance. Throughout the analysis, a minimum module size of 120 genes was maintained to ensure reliable biological interpretation of each co-expression module.

3. Results

3.1. RNA-Seq Analysis of Sugarcane Leaves Under Nitrogen Treatment

To investigate the dynamic changes in gene expression in leaves of a modern sugarcane cultivar under varying nitrogen (N) levels, GT42 sugarcane seedlings were subjected to normal nitrogen (NN), low nitrogen (LN), and high nitrogen (HN) treatments. Leaf samples were collected at 1, 3, 6, 12, 24, 48, and 72 h after NN and LN treatment. Meanwhile, under HN treatment, samples were collected at 3, 6, and 24 h. In RNA-seq, 370.65 Gb of data was obtained from 51 samples. Following stringent quality control, the Q20 and Q30 base percentages were higher than 98% and 94%, respectively, suggesting that the sequencing data quality met the requirements for subsequent analyses (Table S1). A total of 195,493 DEGs were identified by using R570 genome as reference.
We analyzed the number of DEGs across specific time points to compare the transcriptional responses under LN and HN treatments relative to NN treatment. Under LN treatment, 10,204, 3528, 7483, 6678, 3339, 4737, and 2157 DEGs were identified at 1, 3, 6, 12, 24, 48, and 72 h, respectively (Table S2). The greatest number of upregulated DEGs under LN treatment occurred at 12 h (4554), whereas the peak number of down-regulated DEGs was observed at 1 h (7380). Transcriptional profiling further revealed two distinct peaks of gene up-regulation at 12 and 48 h under LN conditions (Figure 1A). In contrast, under HN treatment, 3167, 4219, and 4358 DEGs were identified at 3, 6, and 24 h, respectively (Table S3). The highest number of up-regulated DEGs under HN treatment was observed at 3 h (1369), while the maximum number of down-regulated DEGs occurred at 24 h (3599) (Figure 1B). Furthermore, comparative analysis identified DEGs responding to both HN and LN treatment at the same time points, 433 common DEGs at 3 h, 1022 common DEGs at 6 h, and 490 common DEGs at 24 h (Figure 1C, Table S4).

3.2. WGCNA of Sugarcane Under Low Nitrogen Conditions

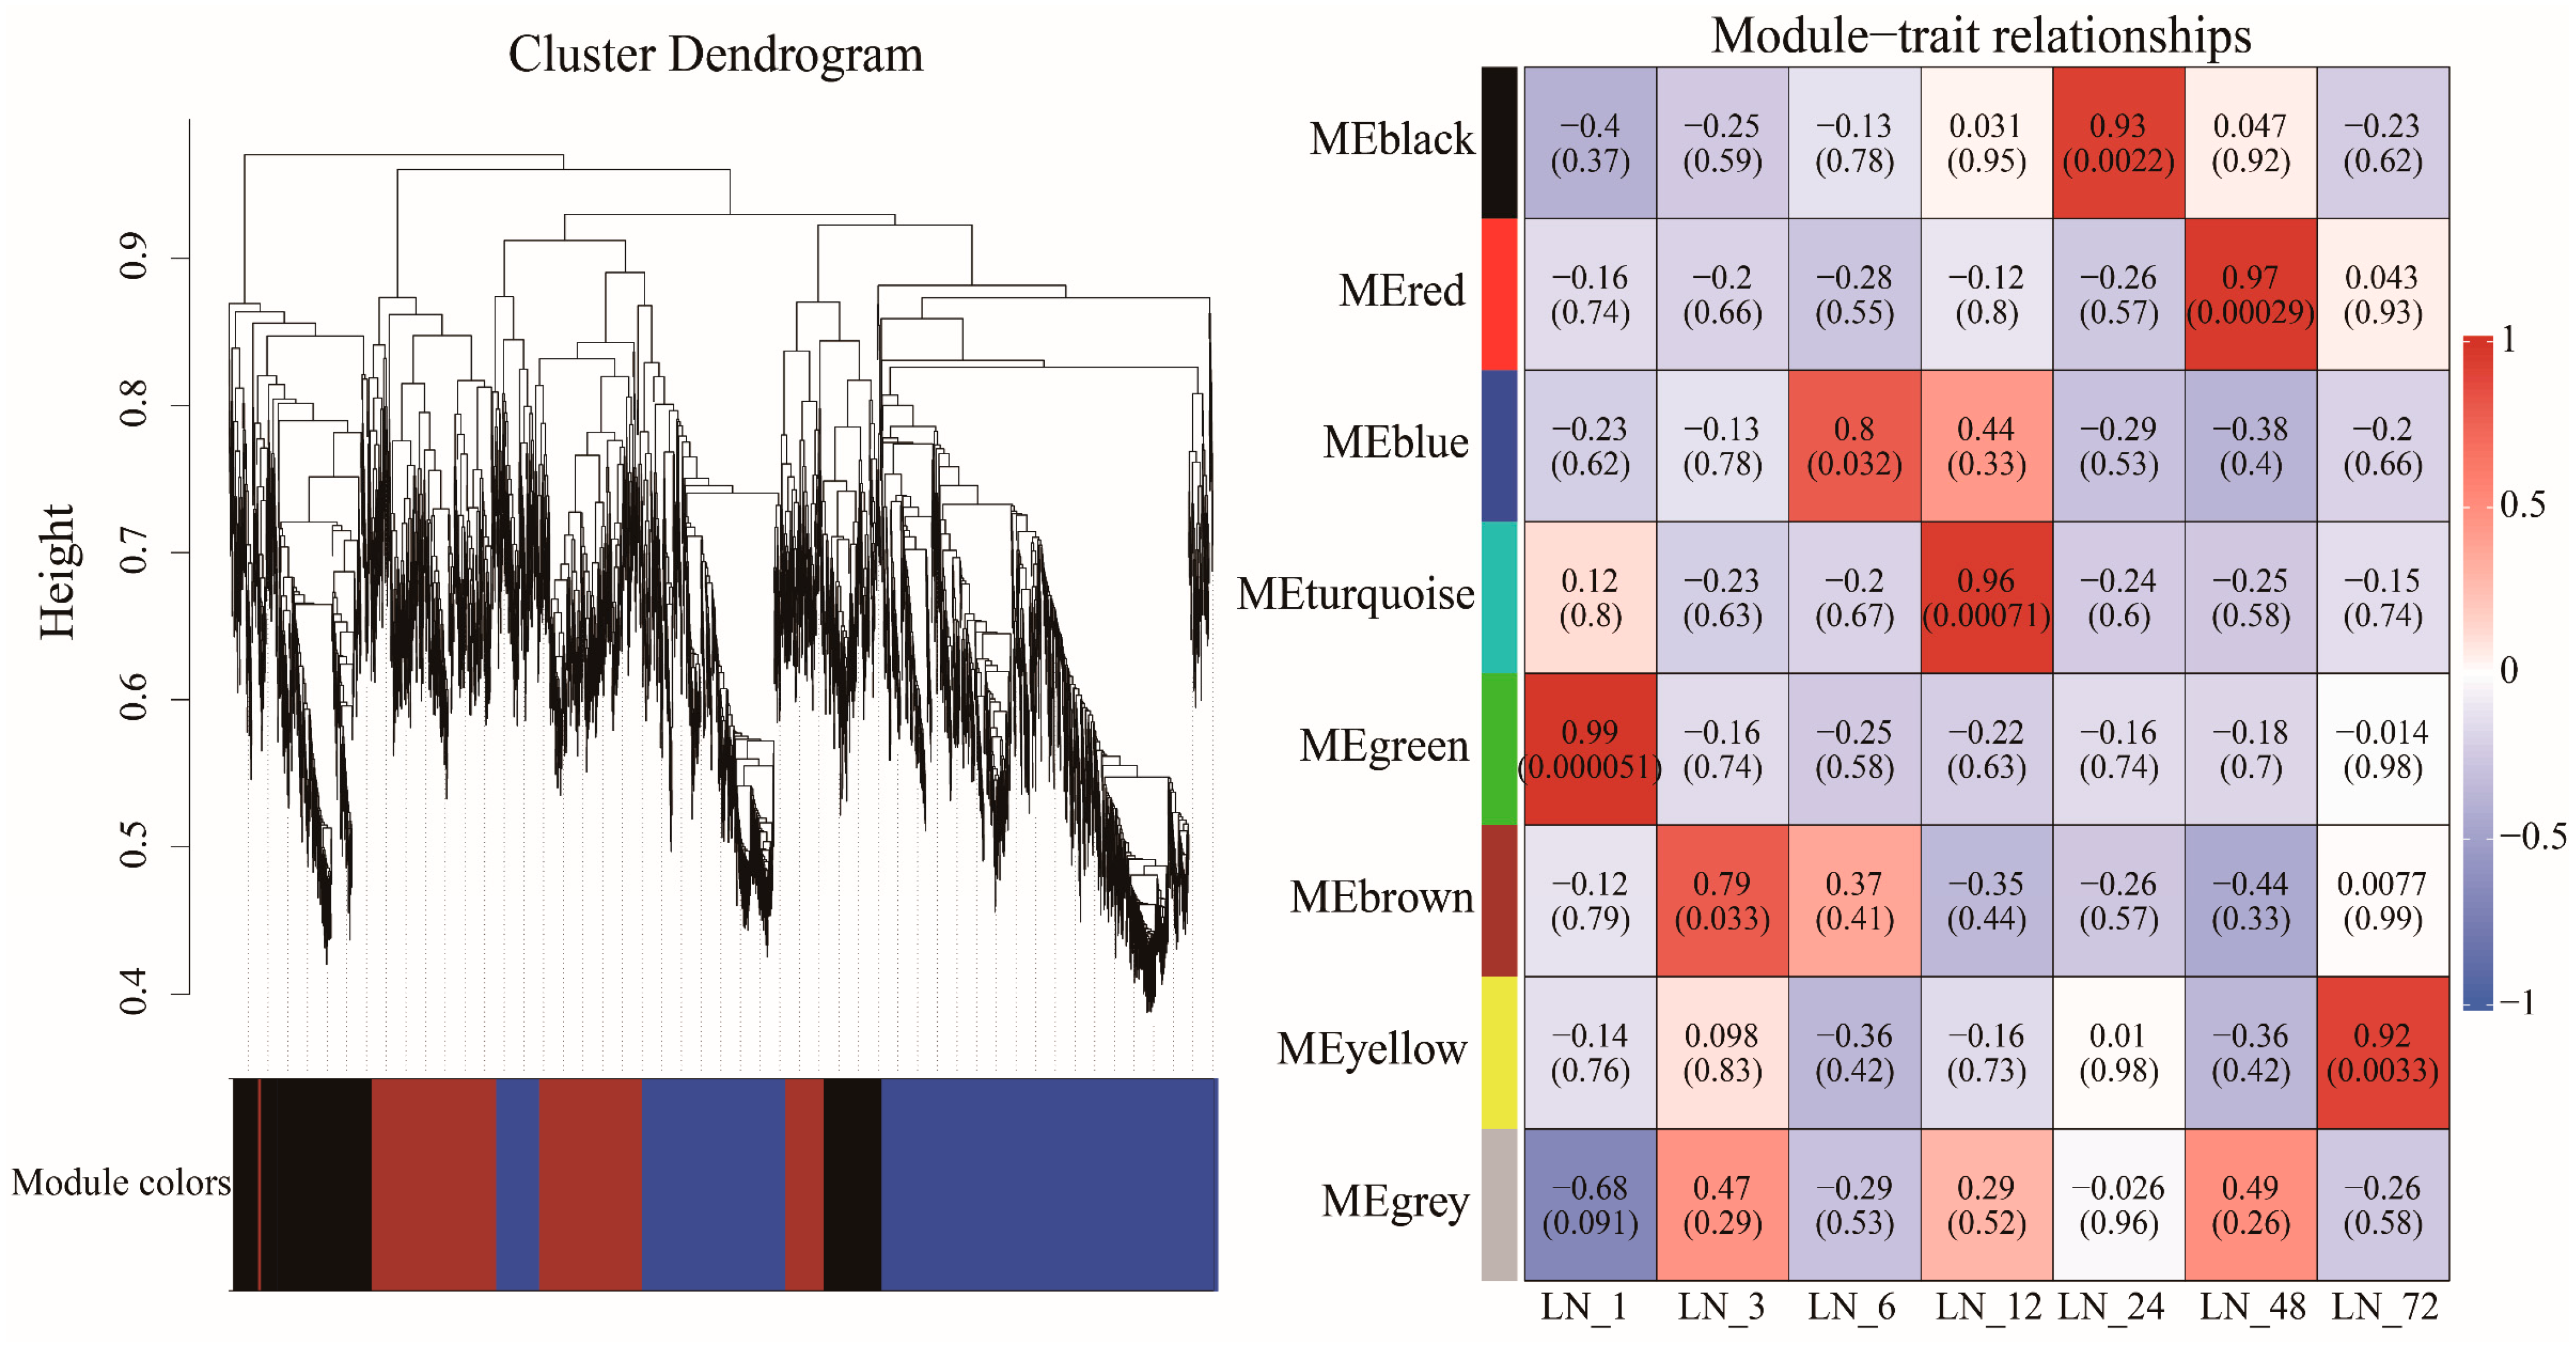
Transcriptional dynamics of DEGs have elucidated sugarcane seedlings’ specific responses to varying nitrogen (N) concentrations. However, the key temporal differences in gene expression across time point under the nitrogen treatment in sugarcane leaves remain insufficiently characterized, and thereby limited a comprehensive understanding of nitrogen regulatory mechanisms. For the LN treatment, we selected 16,509 DEGs (|Log2FC| ≥ 2) and extracted their TPM values for WGCNA. This analysis identified seven temporally enriched co-expression modules corresponding to the seven sampling time points: the MEgreen module (1626 DEGs) at 1 h, the MEbrown module (2357 DEGs) at 3 h, the MEblue module (2429 DEGs) at 6 h, the MEturquoise module (4851 DEGs) at 12 h, the MEblack module (1514 DEGs) at 24 h, the MEred module (1530 DEGs) at 48 h, and the MEyellow module (2176 DEGs) at 72 h (Figure 2, Table S5). Notably, the MEturquoise module at 12 h exhibited the highest DEG representation, comprising 4851 genes, indicating a critical transcriptional response phase under LN conditions.

3.3. Functional Annotation and Enrichment Analysis of Differentially Expressed Genes

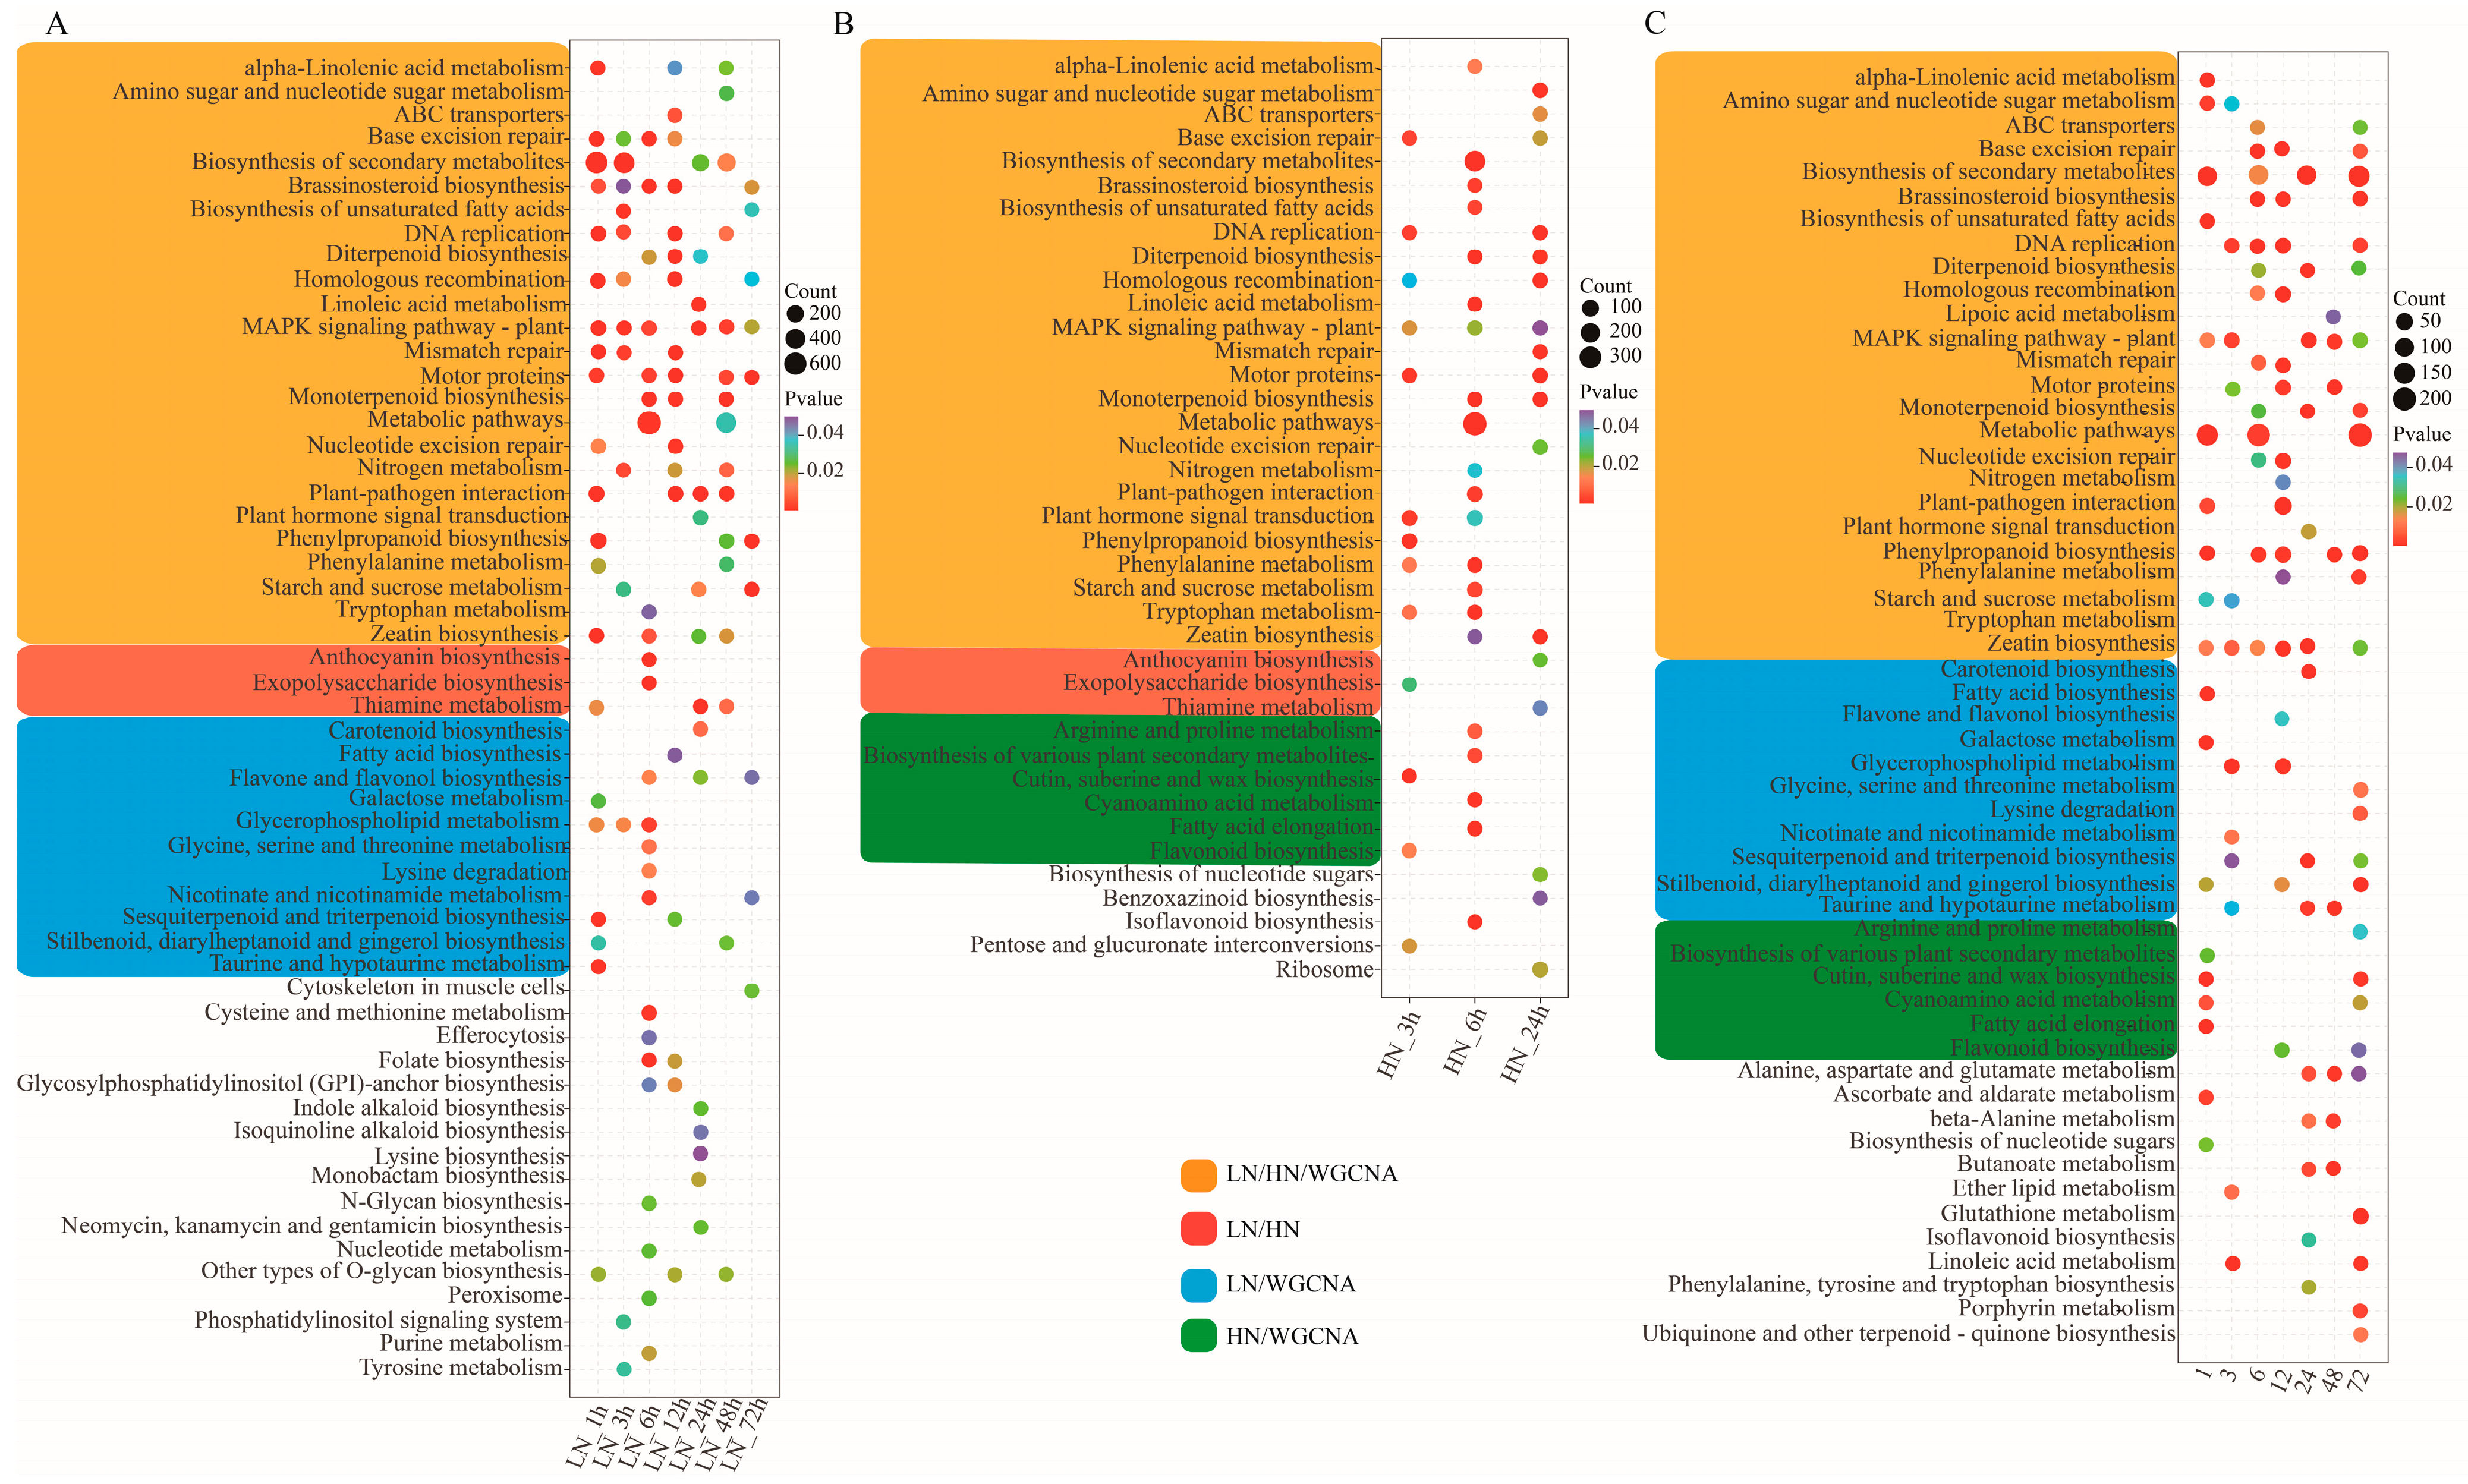
We conducted KEGG analyses on DEGs from seven time points (1, 3, 6, 12, 24, 48, and 72 h) under low nitrogen (LN) treatment (Figure 3A, Table S6), three time points (3, 6, and 24 h) under high nitrogen (HN) treatment (Figure 3B, Table S7), and DEGs identified within seven significant modules derived from WGCNA (Figure 3C, Table S8). The results demonstrated that DEGs from all three datasets were commonly enriched in 25 pathways, including Zeatin Biosynthesis, MAPK signaling pathway—Plant, Nitrogen Metabolism, Phenylpropanoid Biosynthesis, and Biosynthesis of Secondary Metabolites (Figure 3A–C, Table S9). DEGs from the seven LN and the three HN time points were co-enriched in three shared pathways, including Thiamine Metabolism, Exopolysaccharide Biosynthesis, and Anthocyanin Biosynthesis (Figure 3A,B, Table S9). The intersection DEGs between LN time points and WGCNA module yielded 11 co-enriched pathways, such as Carotenoid Biosynthesis, Flavone and Flavonol Biosynthesis, and Glycine, Serine and Threonine Metabolism (Figure 3A,C, Table S9). Furthermore, DEGs from the three HN time points and WGCNA modules shared enrichment in six pathways, including Arginine and Proline Metabolism, Biosynthesis of Various Plant Secondary Metabolites, and Flavonoid Biosynthesis (Figure 3B,C, Table S9). In addition, 17 metabolic pathways were uniquely enriched for the LN-specific DEGs, such as Plant-Pathogen Interaction, Lysine Biosynthesis, and Cysteine and Methionine Metabolism (Figure 3A, Table S9). In contrast, five pathways were exclusive to the HN-specific DEGs, including Ribosome, Isoflavonoid Biosynthesis, and Nucleotide Sugar Biosynthesis (Figure 3B, Table S9). Furthermore, 12 pathways were uniquely enriched in the WGCNA module-specific DEGs, such as β-Alanine Metabolism and Porphyrin Biosynthesis (Figure 3C, Table S9). These distinct and overlapping pathway enrichments highlight nitrogen concentration-dependent regulatory networks underlying sugarcane responses.

3.4. Dynamic Response of Nitrogen Metabolism-Related Genes in Sugarcane Leaves to Differential Nitrogen Treatments

Genes involved in nitrogen metabolism pathways are essential for understanding the mechanisms of nitrogen response in sugarcane seedling leaves. This study employs an integrative approach, combining WGCNA with enrichment analysis to investigate nitrogen metabolism pathways. Our findings indicate significant enrichment of nitrogen metabolism pathways at 3 h, 12 h, and 48 h under LN treatment (Figure 3A), while HN treatment showed significant enrichment at 6 h (Figure 3B). Importantly, nitrogen metabolism pathways were notably enriched within the MEturquoise module derived from WGCNA, demonstrating pronounced expression at 12 h (Figure 3C). Through these enrichment analyses, we identified a total of 38 genes associated with nitrogen metabolism, thereby providing a focused gene set for further functional characterization (Table S10).
The expression patterns of all 38 key nitrogen metabolism genes were visualized using heatmaps at 3 h, 6 h, and 24 h under both LN and HN treatments, revealing distinct expression trends between the two conditions (Figure 4). Further analysis indicated that 11 genes were significantly expressed exclusively under HN treatment, while 10 genes were specifically expressed under LN treatment. Notably, only one gene, SoffiXsponR570.07Ag147300.v2.1, which belongs to the glutamate dehydrogenase family, exhibited significant expression under both LN and HN treatments.

3.5. Dynamic Regulatory Mechanisms of Nitrogen Response in Sugarcane Leaves Mediated by the Zeatin Biosynthesis Pathway

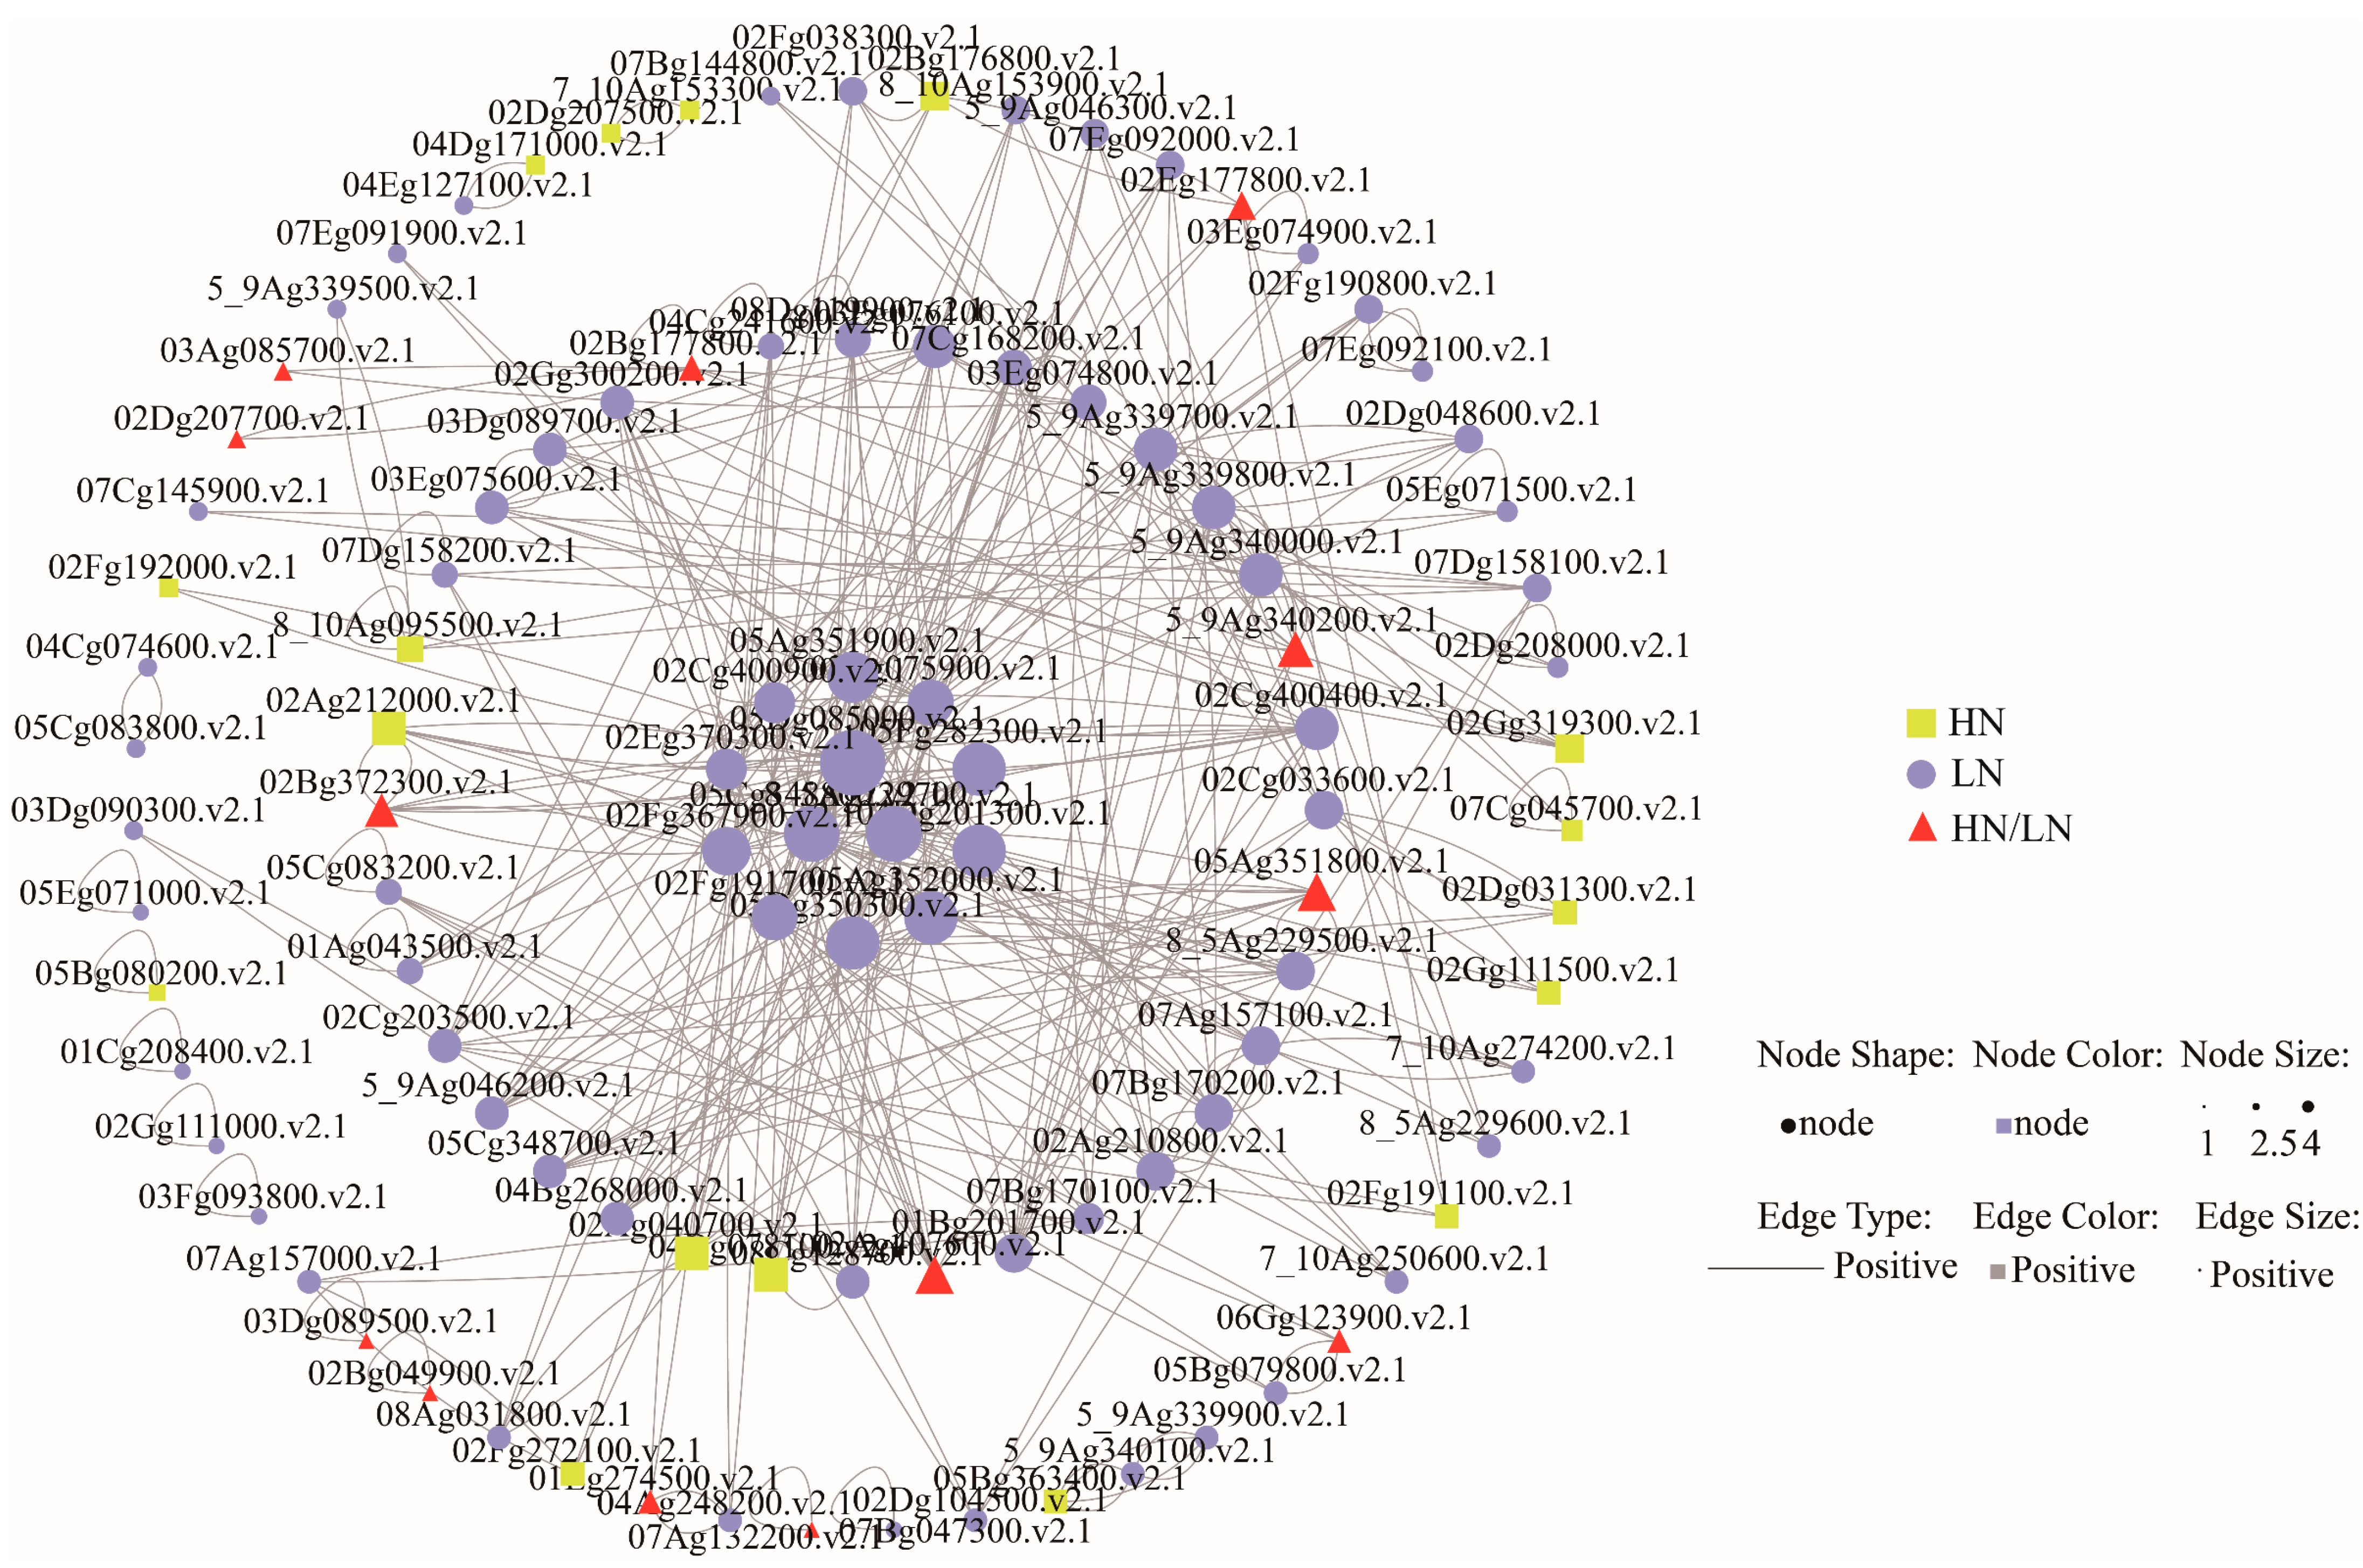
The zeatin biosynthesis pathway, recognized as a primary route for cytokinin synthesis and a crucial node in plant nitrogen signal transduction, exhibited significant enrichment at 1 h, 6 h, 24 h, and 48 h under LN treatment (Figure 3A), while it was enriched at 6 h and 24 h under HN treatment (Figure 3B). Notably, WGCNA revealed significant enrichment of this pathway across six distinct modules (Figure 3C). To further investigate the coordinated regulatory relationships among genes in the zeatin pathway, we selected all DEGs that showed significant enrichment across these three analytical approaches, totaling 105 DEGs, and obtained their expression profiles at three time points under both LN and HN treatments (Figure 5, Table S11). Comparative analysis of each gene across the three analytical frameworks facilitated the construction of a gene co-expression network (correlation coefficient ≥ 0.8, p-value ≤ 0.05). Our findings demonstrate that among these 105 DEGs, 13 exhibited significant differential expression exclusively under HN treatment, another 13 showed significant differential expression under both HN and LN treatments, while the remaining 79 DEGs were specifically and significantly expressed only under LN treatment (Table S12).

4. Discussion

Nitrogen is a key macronutrient for plant growth and development. Previous research has shown that different nitrogen levels cause varied physiological responses across plant species. Studies on quinoa seedlings under various nitrogen conditions have identified important DEGs and related metabolites [29]. Similarly, tobacco roots exposed to high and low nitrate concentrations display distinct gene expression and transcription factor activation patterns [30]. Comparisons of rice genotypes with different nitrogen treatment responses have revealed genotype-specific DEGs linked to NUE and root architecture [31]. Research on Arabidopsis in nitrate-deficient and nitrate-sufficient environments has discovered novel nitrate-inducible genes involved in metabolic and regulatory pathways [32]. Studies shows that sugarcane exhibits varying responses to nitrogen selection pressure and has different response times to nitrogen stress. To explore the short-term response mechanism of sugarcane leaves to nitrogen stress, we selected three nitrogen treatment gradients based on references: LN (0.2 mM NH4NO3), NN (2 mM NH4NO3), and HN (6 mM NH4NO3). Additionally, we selected seven time points (1, 3, 6, 12, 24, 48, and 72 h) for leaf collection to conduct RNA-Seq analysis. In this study, we observed significant temporal variations in DEG profiles under different nitrogen treatments. Three hours post-treatment, there were 3528 DEGs in LN and 3167 in HN compared to NN. At six hours, these numbers increased to 7483 (LN vs. NN) and 4219 (HN vs. NN). At 24 h, we detected 3339 DEGs (LN vs. NN) and 4358 (HN vs. NN). These dynamic changes in nitrogen-responsive gene expression across different time points and treatment intensities align with previous findings, further supporting the dynamic nature of plant transcriptional responses to nitrogen availability.
Previous studies have faced difficulties in prioritizing the numerous DEGs identified under different nitrogen treatments and associating these genes with phenotypic traits [33,34]. To more effectively identify key candidate genes, our study utilized WGCNA, a valid method for constructing gene co-expression networks and exploring module-trait correlations. We applied WGCNA to the sugarcane leaf DEGs (|Log2FC| ≥ 2) identified under LN treatment across multiple time points. Using this method, we were able to categorize these differentially expressed genes into distinct modules according to the seven time points of low-nitrogen treatment and investigate the relationships between these modules and time. Subsequently, KEGG enrichment analysis was performed on the significantly enriched modules, and the results showed that the main enrichment was in nitrogen metabolism and zeatin biosynthesis pathways, which was consistent with our expected results. In this study, by combining differential genes with WGCNA, we successfully identified key pathways. The genes within these pathways might play crucial roles in plant responses to nitrogen treatment, providing valuable insights for our research on the molecular mechanisms underlying nitrogen utilization and plant growth regulation under low-nitrogen conditions.
Nitrogen metabolism is essential for plant growth and development, with changes in nitrogen oxidation states being central to this process. Plants absorb nitrogen as nitrate, ammonium, or amino acids and convert it into organic molecules using GS [35] and glutamate synthase [36,37]. In this study, by combining DEGs with WGCNA, the nitrogen metabolism pathway was identified [38]. NRTs first import nitrate (NO3) and nitrite (NO2) from the external environment into cells. NR then catalyzes the first reduction step, converting nitrate to nitrite. While all nitrogen is eventually reduced to ammonia (NH3), the primary metabolic hub, some nitrite is converted into gaseous signaling molecules like nitric oxide and nitrous oxide. Glutamate synthetase converts ammonia to glutamine, which is directly incorporated into amino acid metabolism and the creation of nitrogenous compounds [39,40]. Plants also detoxify environmental nitrogenous chemicals through formamide breakdown and cyanate degradation, aiding environmental adaptation and protection [41,42]. When exposed to nitrogen, this integrated metabolic framework in leaves activates rapidly. Our findings demonstrate that both HN and LN treatments can rapidly activate this integrated nitrogen metabolic network framework. This sophisticated framework enables plants to efficiently assimilate and utilize environmental nitrogenous compounds, thereby significantly enhancing their adaptive capacity to complex nitrogen environments.
Zeatin and other cytokinins play an essential role in nitrogen signaling and promoting plant growth [43]. Elevated nitrogen levels increase the leaf content of zeatin and dihydrozeatin, thereby delaying leaf senescence [44]. Systemic nitrogen signaling relies on cytokinin production and transport, with root-derived TZ regulating shoot growth in response to nitrogen availability [10]. Both nitrogen nutrition and elevated CO2 influence cytokinin concentrations in xylem sap and leaves [45,46]. This study reveals that zeatin biosynthesis consistently relies on the IPT-cytochrome P450 (CYP735A) pathway [47] under both LN and HN treatment conditions. The mevalonate pathway provides dimethylallyl diphosphate (DMAPP) as the initial substrate. CYP735A then hydroxylates DMAPP to produce bioactive TZ. Cytokinin oxidase (CKX) dynamically regulates zeatin turnover to maintain hormonal homeostasis. Under LN treatment, NLP transcription factors stimulate zeatin synthesis and accumulation by upregulating CYP735A and IPT3/5/7 expression. This process enhances root architecture remodeling and delays leaf senescence, improving plant adaptation to nitrogen limitation. In contrast, HN conditions activate CKX, accelerating zeatin degradation and reducing its cellular levels. These distinct zeatin biosynthesis patterns under varying nitrogen regimes provide novel insights into how zeatin influences nitrogen metabolism.

5. Conclusions

In summary, this study subjected sugarcane leaves to nitrogen stress treatments of varying concentrations. We used RNA-Seq analysis to identify DEGs in LN/NN and HN/NN treatments at corresponding time points. Through KEGG and WGCNA analyses, we found that the nitrogen metabolism pathway and zeatin biosynthesis pathway respond significantly and play key regulatory roles in the short-term nitrogen metabolism response of sugarcane leaves. These findings greatly advance our understanding of how sugarcane adapts to nitrogen treatments and provide valuable targets for sugarcane breeding programs. They also shed light on sugarcane’s short-term adaptation to nitrogen stress, offering valuable targets for sugarcane breeding initiatives.

Supplementary Materials

The following supporting information can be downloaded at: https://www.mdpi.com/article/10.3390/agronomy15092164/s1, Table S1: Quality of transcriptome sequencing data; Table S2: Differentially expressed genes between LN and NN at various time points; Table S3: Differentially expressed genes between HN and NN at various time points; Table S4: Venn diagram of differentially expressed genes between LN and NN; Table S5: WGCNA-related modules; Table S6: KEGG analysis of LN at various time points; Table S7: KEGG analysis of HN at various time points; Table S8: KEGG analysis of WGCNA at various time points; Table S9: LN, HN and WGCNA significant modules (p ≤ 0.05); Table S10: Genes involved in nitrogen metabolism pathway; Table S11: Genes in the zeatin synthesis pathway (correlation ≥ 0.8; p ≤ 0.05); Table S12: Correlation and p-values of differential genes in the zeatin synthesis pathway.

Author Contributions

W.W. and L.Z. conceived the study, led the research, and wrote the paper. S.L. carried out data analysis. M.C. created the figures. X.Y. contributed to the writing and editing. All authors have read and agreed to the published version of the manuscript.

Funding

This work was supported by Ministry of Science and Technology of the People’s Republic of China (2022YFD2301100).

Data Availability Statement

Data are contained within the article.

Conflicts of Interest

The authors declare no conflicts of interest.

References

  1. Arencibia, A.D. Gene Transfer in Sugarcane. In Biotechnology of Food Crops in Developing Countries; Hohn, T., Leisinger, K.M., Eds.; Plant Gene Research; Springer: Vienna, Austria, 1999. [Google Scholar] [CrossRef]
  2. Heinrichs, R.; Otto, R.; Magalhães, A.; Meirelles, G.C. Importance of Sugarcane in Brazilian and World Bioeconomy. In Knowledge-Driven Developments in the Bioeconomy; Dabbert, S., Lewandowski, I., Weiss, J., Pyka, A., Eds.; Economic Complexity and Evolution; Springer: Cham, Switzerland, 2017. [Google Scholar] [CrossRef]
  3. Kishorekumar, R.; Bulle, M.; Wany, A.; Gupta, K.J. An Overview of Important Enzymes Involved in Nitrogen Assimilation of Plants. Methods Mol. Biol. 2020, 2057, 1–13. [Google Scholar] [CrossRef]
  4. da Silva, N.F.; da Silva, E.C.; Muraoka, T.; Teixeira, M.B.; Soares, F.A.L.; Cunha, F.N.; Adu-Gyamfi, J.; Cavalcante, W.S.d.S. Nitrogen Utilization from Ammonium Nitrate and Urea Fertilizer by Irrigated Sugarcane in Brazilian Cerrado Oxisol. Agriculture 2020, 10, 323. [Google Scholar] [CrossRef]
  5. Trivelin, P.C.O.; Vitti, A.C.; Oliveira, M.W.; Gava, G.J.C.; Sarriés, G.A. Nitrogen utilization and sugarcane (plant cane) yield on a sandy soil with incorporated crop residues. Rev. Bras. Cienc. Solo 2002, 26, 637–646. [Google Scholar] [CrossRef]
  6. Alvarez, J.M.; Vidal, E.A.; Gutiérrez, R.A. Integration of local and systemic signaling pathways for plant N responses. Curr. Opin. Plant Biol. 2012, 15, 185–191. [Google Scholar] [CrossRef] [PubMed]
  7. Rennenberg, H.; Dannenmann, M.; Gessler, A.; Kreuzwieser, J.; Simon, J.; Papen, H. Nitrogen balance in forest soils: Nutritional limitation of plants under climate change treatmentes. Plant Biol. 2009, 11 (Suppl. S1), 4–23. [Google Scholar] [CrossRef]
  8. Wang, Y.Y.; Hsu, P.K.; Tsay, Y.F. Uptake, allocation and signaling of nitrate. Trends Plant Sci. 2012, 17, 458–467. [Google Scholar] [CrossRef]
  9. Singh, A.; Kumar, P.; Gautam, V.; Rengasamy, B.; Adhikari, B.; Udayakumar, M.; Sarkar, A.K. Root transcriptome of two contrasting indica rice cultivars uncovers regulators of root development and physiological responses. Sci. Rep. 2016, 6, 39266. [Google Scholar] [CrossRef]
  10. Sakakibara, H. Cytokinin biosynthesis and transport for systemic nitrogen signaling. Plant J. Cell Mol. Biol. 2021, 105, 421–430. [Google Scholar] [CrossRef]
  11. Takei, K.; Takahashi, T.; Sugiyama, T.; Yamaya, T.; Sakakibara, H. Multiple routes communicating nitrogen availability from roots to shoots: A signal transduction pathway mediated by cytokinin. J. Exp. Bot. 2002, 53, 971–977. [Google Scholar] [CrossRef]
  12. Que, Y.; Su, Y.; Guo, J.; Wu, Q.; Xu, L. A global view of transcriptome dynamics during Sporisorium scitamineum challenge in sugarcane by RNA-Seq. PLoS ONE 2014, 9, e106476. [Google Scholar] [CrossRef]
  13. Langfelder, P.; Horvath, S. WGCNA: An R package for weighted correlation network analysis. BMC Bioinform. 2008, 9, 559. [Google Scholar] [CrossRef]
  14. Lv, Y.; Xu, L.; Dossa, K.; Zhou, K.; Zhu, M.; Xie, H.; Tang, S.; Yu, Y.; Guo, X.; Zhou, B. Identification of putative drought-responsive genes in rice using gene co-expression analysis. Bioinformation 2019, 15, 480–489. [Google Scholar] [CrossRef]
  15. Zeng, Z.; Zhang, S.; Li, W.; Chen, B.; Li, W. Gene-coexpression network analysis identifies specific modules and hub genes related to cold treatment in rice. BMC Genom. 2022, 23, 251. [Google Scholar] [CrossRef] [PubMed]
  16. Wang, W.; Xin, W.; Chen, N.; Yang, F.; Li, J.; Qu, G.; Jiang, X.; Xu, L.; Zhao, S.; Liu, H.; et al. Transcriptome and co-expression network analysis reveals the molecular mechanism of rice root systems in response to low-nitrogen conditions. Int. J. Mol. Sci. 2023, 24, 5290. [Google Scholar] [CrossRef]
  17. Wei, Q.; Yin, Y.; Deng, B.; Song, X.; Gong, Z.; Shi, Y. Transcriptome analysis of nitrogen-deficiency-responsive genes in two potato cultivars. Agronomy 2023, 13, 2164. [Google Scholar] [CrossRef]
  18. Nagalakshmi, U.; Waern, K.; Snyder, M. RNA-Seq: A method for comprehensive transcriptome analysis. Curr. Protoc. Mol. Biol. 2010, 89, 4.11.1–4.11.13. [Google Scholar] [CrossRef]
  19. Healey, A.L.; Lovell, J.T.; Garsmeur, O.; Jenkins, J.W.; Grimwood, J.; Aitken, K.S.; Henry, R.J.; D’Hont, A.; Schmutz, J. Leveraging Multiple Sequencing Technologies to Generate a Haplotype Specific Assembly of Sugarcane R570; CIRAD: San Diego, CA, USA, 2020. [Google Scholar]
  20. Kim, D.; Langmead, B.; Salzberg, S.L. HISAT: A fast spliced aligner with low memory requirements. Nat. Methods 2015, 12, 357–360. [Google Scholar] [CrossRef] [PubMed]
  21. Langmead, B.; Trapnell, C.; Pop, M.; Salzberg, S.L. Ultrafast and memory-efficient alignment of short DNA sequences to the human genome. Genome Biol. 2009, 10, R25. [Google Scholar] [CrossRef]
  22. Abrams, Z.B.; Johnson, T.S.; Huang, K.; Payne, P.R.O.; Coombes, K. A protocol to evaluate RNA sequencing normalization methods. BMC Bioinform. 2019, 20 (Suppl. S24), 679. [Google Scholar] [CrossRef]
  23. Wagner, G.P.; Kin, K.; Lynch, V.J. Measurement of mRNA abundance using RNA-seq data: RPKM measure is inconsistent among samples. Theory Biosci. 2012, 131, 281–285. [Google Scholar] [CrossRef]
  24. Rosati, D.; Palmieri, M.; Brunelli, G.; Morrione, A.; Iannelli, F.; Frullanti, E.; Giordano, A. Differential gene expression analysis pipelines and bioinformatic tools for the identification of specific biomarkers: A review. Comput. Struct. Biotechnol. J. 2024, 23, 1154–1168. [Google Scholar] [CrossRef]
  25. McDermaid, A.; Monier, B.; Zhao, J.; Liu, B.; Ma, Q. Interpretation of differential gene expression results of RNA-seq data: Review and integration. Brief. Bioinform. 2019, 20, 2044–2054. [Google Scholar] [CrossRef] [PubMed]
  26. Kanehisa, M.; Goto, S. KEGG: Kyoto encyclopedia of genes and genomes. Nucleic Acids Res. 2000, 28, 27–30. [Google Scholar] [CrossRef] [PubMed]
  27. Bu, D.; Luo, H.; Huo, P.; Wang, Z.; Zhang, S.; He, Z.; Wu, Y.; Zhao, L.; Liu, J.; Guo, J.; et al. KOBAS-i: Intelligent prioritization and exploratory visualization of biological functions for gene enrichment analysis. Nucleic Acids Res. 2021, 49, W317–W325. [Google Scholar] [CrossRef] [PubMed]
  28. Chen, C.; Wu, Y.; Li, J.; Wang, X.; Zeng, Z.; Xu, J.; Liu, Y.; Feng, J.; Chen, H.; He, Y.; et al. TBtools-II: A “one for all, all for one” bioinformatics platform for biological big-data mining. Mol. Plant 2023, 16, 1733–1742. [Google Scholar] [CrossRef]
  29. Li, H.; Wang, Q.; Huang, T.; Liu, J.; Zhang, P.; Li, L.; Xie, H.; Wang, H.; Liu, C.; Qin, P. Transcriptome and Metabolome Analyses Reveal Mechanisms Underlying the Response of Quinoa Seedlings to Nitrogen Fertilizers. Int. J. Mol. Sci. 2023, 24, 11580. [Google Scholar] [CrossRef]
  30. Yang, H.; Zhang, Y.; Zhou, Y.; Wang, J.; Geng, X.; Shi, H. Transcriptome analysis of tobacco root response to different concentrations of nitrate. Agron. J. 2020, 112, 1111–1125. [Google Scholar] [CrossRef]
  31. Subudhi, P.K.; Garcia, R.S.; Coronejo, S.; Tapia, R. Comparative transcriptomics of rice genotypes with contrasting responses to nitrogen treatment reveals genes influencing nitrogen uptake through the regulation of root architecture. Int. J. Mol. Sci. 2020, 21, 5759. [Google Scholar] [CrossRef]
  32. Wang, R.; Guegler, K.; LaBrie, S.T.; Crawford, N.M. Genomic analysis of a nutrient response in Arabidopsis reveals diverse expression patterns and novel metabolic and potential regulatory genes induced by nitrate. Plant Cell 2000, 12, 1491–1509. [Google Scholar] [CrossRef]
  33. Tiwari, J.K.; Buckseth, T.; Zinta, R.; Saraswati, A.; Singh, R.K.; Rawat, S.; Dua, V.K.; Chakrabarti, S.K. Transcriptome analysis of potato shoots, roots and stolons under nitrogen treatment. Sci. Rep. 2020, 10, 1152. [Google Scholar] [CrossRef]
  34. Sinha, S.K.; Sevanthi V., A.M.; Chaudhary, S.; Tyagi, P.; Venkadesan, S.; Rani, M.; Mandal, P.K. Transcriptome analysis of two rice varieties contrasting for nitrogen use efficiency under chronic n starvation reveals differences in chloroplast and starch metabolism-related genes. Genes 2018, 9, 206. [Google Scholar] [CrossRef]
  35. Miflin, B.J.; Habash, D.Z. The role of glutamine synthetase and glutamate dehydrogenase in nitrogen assimilation and possibilities for improvement in the nitrogen utilization of crops. J. Exp. Bot. 2002, 53, 979–987. [Google Scholar] [CrossRef] [PubMed]
  36. Fortunato, S.; Nigro, D.; Lasorella, C.; Marcotuli, I.; Gadaleta, A.; de Pinto, M.C. The Role of Glutamine Synthetase (GS) and Glutamate Synthase (GOGAT) in the Improvement of Nitrogen Use Efficiency in Cereals. Biomolecules 2023, 13, 1771. [Google Scholar] [CrossRef] [PubMed]
  37. Zayed, O.; Hewedy, O.A.; Abdelmoteleb, A.; Ali, M.; Youssef, M.S.; Roumia, A.F.; Seymour, D.; Yuan, Z.C. Nitrogen Journey in Plants: From Uptake to Metabolism, Treatment Response, and Microbe Interaction. Biomolecules 2023, 13, 1443. [Google Scholar] [CrossRef]
  38. Zhang, X.; Pan, S.; Chen, D.; Pan, Y.; Bhanot, D.; Xu, T.; Gupta, S.; Zhang, J.; Huang, Y. WGCNA analysis and identification of key genes in tobacco in response to different nitrogen levels. BMC Plant Biol. 2025, 25, 465. [Google Scholar] [CrossRef]
  39. Pengpeng, W.; Tan, Z. Ammonia assimilation in rumen bacteria: A review. Anim. Biotechnol. 2013, 24, 107–128. [Google Scholar] [CrossRef]
  40. Inokuchi, R.; Kuma, K.I.; Miyata, T.; Okada, M. Nitrogen-assimilating enzymes in land plants and algae: Phylogenic and physiological perspectives. Physiol. Plant. 2002, 116, 1–11. [Google Scholar] [CrossRef]
  41. Machingura, M.; Salomon, E.; Jez, J.M.; Ebbs, S.D. The β-cyanoalanine synthase pathway: Beyond cyanide detoxification. Plant Cell Environ. 2016, 39, 2329–2341. [Google Scholar] [CrossRef]
  42. Howden, A.J.; Harrison, C.J.; Preston, G.M. A conserved mechanism for nitrile metabolism in bacteria and plants. Plant J. Cell Mol. Biol. 2009, 57, 243–253. [Google Scholar] [CrossRef]
  43. Gu, J.; Li, Z.; Mao, Y.; Struik, P.C.; Zhang, H.; Liu, L.; Wang, Z.; Yang, J. Roles of nitrogen and cytokinin signals in root and shoot communications in maximizing of plant productivity and their agronomic applications. Plant Sci. Int. J. Exp. Plant Biol. 2018, 274, 320–331. [Google Scholar] [CrossRef]
  44. Singh, S.; Letham, D.S.; Jameson, P.E.; Zhang, R.; Parker, C.W.; Bandenoch-Jones, J.; Noodén, L.D. Cytokinin Biochemistry in Relation to Leaf Senescence: IV. Cytokinin Metabolism in Soybean Explants. Plant Physiol. 1988, 88, 788–794. [Google Scholar] [CrossRef]
  45. Yong, J.W.; Wong, S.C.; Letham, D.S.; Hocart, C.H.; Farquhar, G.D. Effects of elevated [CO2] and nitrogen nutrition on cytokinins in the xylem sap and leaves of cotton. Plant Physiol. 2000, 124, 767–780. [Google Scholar] [CrossRef]
  46. Takei, K.; Sakakibara, H.; Taniguchi, M.; Sugiyama, T. Nitrogen-dependent accumulation of cytokinins in root and the translocation to leaf: Implication of cytokinin species that induces gene expression of maize response regulator. Plant Cell Physiol. 2001, 42, 85–93. [Google Scholar] [CrossRef]
  47. Takei, K.; Yamaya, T.; Sakakibara, H. Arabidopsis CYP735A1 and CYP735A2 encode cytokinin hydroxylases that catalyze the biosynthesis of trans-Zeatin. J. Biol. Chem. 2004, 279, 41866–41872. [Google Scholar] [CrossRef]
Figure 1. Number of DEGs under LN and HN treatment, and Venn diagrams of DEGs identified between LN and HN at three time points. (A) Number of up-regulated and down-regulated DEGs between LN and NN at 1, 3, 6, 12, 24, 48, and 72 h; (B) Number of up-regulated and down-regulated DEGs between HN and NN at 3, 6, and 24 h; (C) Venn diagram of DEGs between LN and HN at 3, 6, and 24 h. The numbers in the circles indicate the number of DEGs.
Agronomy 15 02164 g001
Figure 2. Co-expression network constructed by WGCNA for 7 time points (1, 3, 6, 12, 24, 48, and 72 h) under LN treatment. Correlation analysis of each module at 7 time points under LN treatment. The redder the color between modules, the higher the correlation among them.
Agronomy 15 02164 g002
Figure 3. KEGG pathway enrichment analysis. (A) KEGG enrichment analysis at 7 time points (1, 3, 6, 12, 24, 48, and 72 h) under LN treatment; (B) KEGG enrichment analysis at 3 time points (3, 6, and 24 h) under HN treatment; (C) KEGG enrichment analysis of 7 significantly enriched modules from WGCNA. Yellow represents pathways common to LN, HN, and WGCNA; red represents pathways common to LN and HN; blue represents pathways common to LN and WGCNA; green represents pathways common to HN and WGCNA.
Agronomy 15 02164 g003
Figure 4. DEGs in the nitrogen metabolism pathway that constitutes the common intersection of LN, HN, and WGCNA are involved in nitrogen uptake, transport, and biosynthesis processes. Additionally, the gene expression patterns at 3, 6, and 24 h under LN and HN treatments are presented; red indicates that the gene is a differentially expressed gene at the corresponding time point under the specified treatment. Blue solid arrows represent nitrogen metabolism pathways; red solid arrows indicate significantly enriched nitrogen metabolism pathways; blue dashed arrows denote entry into other metabolic pathways through certain physiological activities.
Agronomy 15 02164 g004
Figure 5. Gene co-expression network of significantly enriched DEGs in the zeatin synthesis pathway that is the common intersection of LN, HN, and WGCNA, with a correlation coefficient ≥ 0.8 and p-value ≤ 0.05. Yellow squares represent DEGs specific to HN; purple circles represent DEGs specific to LN; red triangles represent DEGs shared by both LN and HN.
Agronomy 15 02164 g005
Disclaimer/Publisher’s Note: The statements, opinions and data contained in all publications are solely those of the individual author(s) and contributor(s) and not of MDPI and/or the editor(s). MDPI and/or the editor(s) disclaim responsibility for any injury to people or property resulting from any ideas, methods, instructions or products referred to in the content.