Article

ESG-YOLO: An Efficient Object Detection Algorithm for Transplant Quality Assessment of Field-Grown Tomato Seedlings Based on YOLOv8n

1
College of Mechanical and Electrical Engineering, Fujian Agriculture and Forestry University, Fuzhou 350002, China
2
Fujian University Engineering Research Center for Modern Agricultural Equipment, Fujian Agriculture and Forestry University, Fuzhou 350002, China
*
Author to whom correspondence should be addressed.
These authors contributed equally to this work.
Agronomy 2025, 15(9), 2088; https://doi.org/10.3390/agronomy15092088
Submission received: 27 July 2025 / Revised: 24 August 2025 / Accepted: 26 August 2025 / Published: 29 August 2025
(This article belongs to the Section Precision and Digital Agriculture)

Abstract

Intelligent detection of tomato seedling transplant quality represents a core technology for advancing agricultural automation. However, in practical applications, existing algorithms still face numerous technical challenges, particularly with prominent issues of false detections and missed detections during recognition. To address these challenges, we developed the ESG-YOLO object detection model and successfully deployed it on edge devices, enabling real-time assessment of tomato seedling transplanting quality. Our methodology integrates three key innovations: First, an EMA (Efficient Multi-scale Attention) module is embedded within the YOLOv8 neck network to suppress interference from redundant information and enhance morphological focus on seedlings. Second, the feature fusion network is reconstructed using a GSConv-based Slim-neck architecture, achieving a lightweight neck structure compatible with edge deployment. Finally, optimization employs the GIoU (Generalized Intersection over Union) loss function to precisely localize seedling position and morphology, thereby reducing false detection and missed detection. The experimental results demonstrate that our ESG-YOLO model achieves a mean average precision mAP of 97.4%, surpassing lightweight models including YOLOv3-tiny, YOLOv5n, YOLOv7-tiny, and YOLOv8n in precision, with improvements of 9.3, 7.2, 5.7, and 2.2%, respectively. Notably, for detecting key yield-impacting categories such as “exposed seedlings” and “missed hills”, the average precision (AP) values reach 98.8 and 94.0%, respectively. To validate the model’s effectiveness on edge devices, the ESG-YOLO model was deployed on an NVIDIA Jetson TX2 NX platform, achieving a frame rate of 18.0 FPS for efficient detection of tomato seedling transplanting quality. This model provides technical support for transplanting performance assessment, enabling quality control and enhanced vegetable yield, thus actively contributing to smart agriculture initiatives.

1. Introduction

As an essential component of the human dietary structure, vegetables hold an irreplaceable position in daily consumption. According to data from the United Nations Food and Agriculture Organization (FAO), China’s vegetable industry ranks first globally in scale, with planting area and output accounting for 52.25 and 58.31% of the world’s total, respectively [1]. In cultivation practices, seedling transplanting technology is widely adopted in agricultural production, with over 50% of domestic vegetable varieties cultivated using this method [2]. The quality of tomato seedling transplanting operations directly affects subsequent growth and yield formation, making the establishment of a scientific transplanting evaluation system critical. Systematic monitoring of transplanting outcomes enables both rapid identification of cultivation deficiencies and data-driven replanting decisions. However, current assessments primarily rely on manual patrol-based assessment, which suffers from inefficiency and poor timeliness. These limitations become significantly more challenging in large-scale cultivation scenarios.
During mechanized seedling extraction and transplanting operations, environmental disturbances and equipment factors frequently lead to abnormal conditions such as blockages, seedling damage, clamping failures, and seedling detachment. These issues subsequently cause three typical transplanting defects: exposed seedlings (root exposure), covered seedlings (excessive soil coverage), and missed hills (seedling absence) [3]. Existing research predominantly focuses on conventional problems like missed hill identification and exposed seedling detection [4,5,6]. Field practices demonstrate that terrain-induced mismatches in mechanical parameters significantly exacerbate abnormal planting depth. Failure to promptly adjust operational parameters substantially increases seedling mortality due to dehydration or suffocation, directly impacting economic returns. China’s current transplanting quality assessment system remains underdeveloped, primarily relying on manual inspections and empirical judgments with limited intelligent detection capabilities. In recent years, machine vision—as a core agricultural digitalization technology—has achieved widespread implementation across agricultural production stages [7,8]. In seedling detection, Liao et al.’s [9] improved Otsu algorithm enhances segmentation robustness for rice seedlings under varying histogram distributions. However, its dependence on manual feature extraction results in complex procedures and low detection accuracy, limiting applicability in complex scenarios [10,11,12].
Currently, deep learning has gained widespread application in agricultural detection [13]. Zhang et al. [14] proposed a YOLO model with a feature enhancement mechanism for detecting maize seedlings, achieving 87.22% mean average precision and 91.54% recall rate. Quan et al. [15] improved the Faster R-CNN (Faster Region-based Convolutional Neural Networks) model using VGG19 as the feature extraction network, ultimately attaining 97.71% mAP (mAP represents the average of AP across multiple categories) for maize seedling detection. Pan et al. [16] utilized an improved Faster R-CNN model to identify sugarcane seedlings in UAV-captured images, employing ResNet50 for feature extraction and achieving 96.83% mAP. Sun et al. [17] researched broccoli seedlings and proposed an improved Faster R-CNN-based crop detection method with ResNet101, yielding 91.73% mAP. Zhang et al. [18] introduced an enhanced YOLOv7-tiny-based algorithm for broccoli seedling quality detection, achieving 94.3% mAP. Wu et al. [19] studied cabbage seedlings, integrating Focal-EIOU Loss, multi-scale attention mechanisms, and DCNV3 into an improved YOLOv8s model, attaining 96.2% mAP and 92.2% recall. Zheng et al. [20] addressed key challenges in potato seedling detection with the YOLO-PS model, achieving 96.67% mAP. Liu et al. [21] proposed a lightweight quality detection method based on improved YOLOv8s for rice transplanting operations, reaching 92.41% mAP, 92.11% precision, and 92.04% recall on test sets. Cui et al. [22] developed a real-time missing rice seedling counting method using enhanced YOLOv5s and ByteTrack, achieving 72.3% mAP and 93.2% counting accuracy. Liu et al. [23] employed an object detection network with DBIFPN and CBAM_Dense for sweet potato seedling transplantation monitoring, attaining 97.66% mAP. Li et al. [24] introduced an improved YOLOv5s-based navigation line extraction method for seedling and direct seeding systems. Perugachi-Diaz et al. [25] demonstrated AlexNet’s 94% average recognition accuracy for cabbage seedlings. Li et al. [26] achieved 86.2% mAP for hydroponic lettuce seedling sorting using enhanced Faster R-CNN. These studies confirm the significant advantages of deep learning in crop seedling detection accuracy and efficiency. While various improved models exhibit exceptional performance across crops, real-time bottlenecks hinder scalable field deployment. Future efforts require lightweight models and edge computing solutions to bridge laboratory validation and real-time fieldwork.
Deep learning technology offers innovative solutions for detection challenges in complex agricultural environments. However, existing research excessively prioritizes algorithm precision optimization while neglecting model lightweighting and inference speed, failing to meet practical demands for portability and cost-effectiveness in agricultural production. This contradiction has propelled edge computing to the forefront of current research, with numerous scholars dedicated to developing lightweight detection models suitable for field scenarios. He et al. [27] developed a YOLOv5-Lite-based rice seedling detection system deployed on NVIDIA Jetson Nano, achieving 81.9% mAP@0.5, 99.2% seedling counting accuracy, 90.3% missed seedling counting accuracy, and 3.95 FPS processing speed. Wu et al. [28] proposed an improved YOLOv5s model for sugarcane seedling detection on NVIDIA Jetson TX2, attaining 97.2% precision, 86.7% recall, and 23 FPS. Gu et al. [29] deployed an enhanced YOLOv8 model on NVIDIA Jetson Orin Nano for simultaneous detection of mango fruit and stem, achieving 97.63% fruit precision and 94.5% stem precision. Ji et al. [30] implemented Shufflenetv2-YOLOX on Jetson Nano for apple detection, reaching 96.76% AP, 95.62% precision, 93.75% recall, and 26.3 FPS. Huang et al. [31] utilized YOLOv3-tiny on Jetson Nano for pitaya maturity detection. Recent breakthroughs in edge computing have enabled deployment of deep learning models on resource-constrained devices through model compression and architectural optimization. This advancement maintains detection accuracy while significantly improving computational efficiency, providing a viable pathway for real-time field applications in smart agriculture.
In recent years, significant technological advancements have been made in tomato seedling recognition. For example, Zhang et al. [32] proposed a YOLOv3-Tiny object detection model to improve the accuracy of tomato seedling sorting, transplanting, and grading detection. After dataset training, the improved model achieved a mean average precision (mAP) of 97.64% on the test set. Zhao et al. [33] introduced a classification and recognition model for tomato pot seedlings based on an enhanced YOLOv5s object detection algorithm to establish a monitoring system. The refined model showed a 3.8% increase in average precision (AP), a 1.9% improvement in mAP@0.5, and a 3.2% boost in recall rate compared to the baseline. Jing et al. [34] developed a tomato seedling grading detection method using a modified YOLOv3-Tiny framework under Darknet. The optimized algorithm improved the mAP for seedling grading by 9.8%, with detection accuracies reaching 98.1% for robust seedlings, 94.80% for no-seedling cases, and 93.62% for weak seedlings. Current research on tomato seedling detection faces two primary limitations: first, a lack of targeted solutions for post-transplant seedling status monitoring, and second, insufficient validation in model performance in real-world deployments on edge computing devices.
To address the aforementioned challenges, this study proposes an improved lightweight ESG-YOLO model for detecting post-transplant tomato seedling quality, ultimately deploying it on NVIDIA Jetson TX2 NX for effective real-world detection. The main contributions of this research are as follows: (1) We propose a novel object detection and classification method specifically designed for tomato seedling planting quality, categorizing growth quality into four classes: “qualified seedling”, “exposed seedling”, “covered seedling”, and “missed hill”. We have established a multi-angle tomato seedling dataset for this research, contributing pioneering work to the field of vegetable planting quality inspection. (2) We developed the ESG-YOLO deep learning model, which achieves 97.4% mAP in detecting tomato seedling planting quality. Compared to the baseline model, it reduces model parameters by 7%, decreases computational load by 10%, and compresses model size by 8%. (3) By deploying the ESG-YOLO model on NVIDIA Jetson TX2 NX, we achieved effective detection of tomato seedling planting quality on low-cost edge computing platforms with limited computational power and memory capacity. This implementation establishes a baseline for intelligent agricultural robotics in field applications.

2. Materials and Methods

2.1. Grading of Tomato Seedling Conditions Post-Transplantation

This study classifies tomato seedlings based on their planting conditions, which critically influences subsequent growth and development. In establishing the classification criteria, we integrated insights from studies on transplanter performance testing and the correlation between vegetable planting depth and yield [35,36]. As illustrated in Figure 1, the tomato seedling planting quality assessment framework comprises four categories: (1) Qualified seedling: The root ball is fully covered by soil without touching the seedling leaves. (2) Exposed seedling: The root ball is partially or entirely exposed above the ground surface. (3) Covered seedling: Excessively deep planting where soil covers the seedling leaves or stem apex. (4) Missed hill: No seedling detected within the predefined planting spacing.
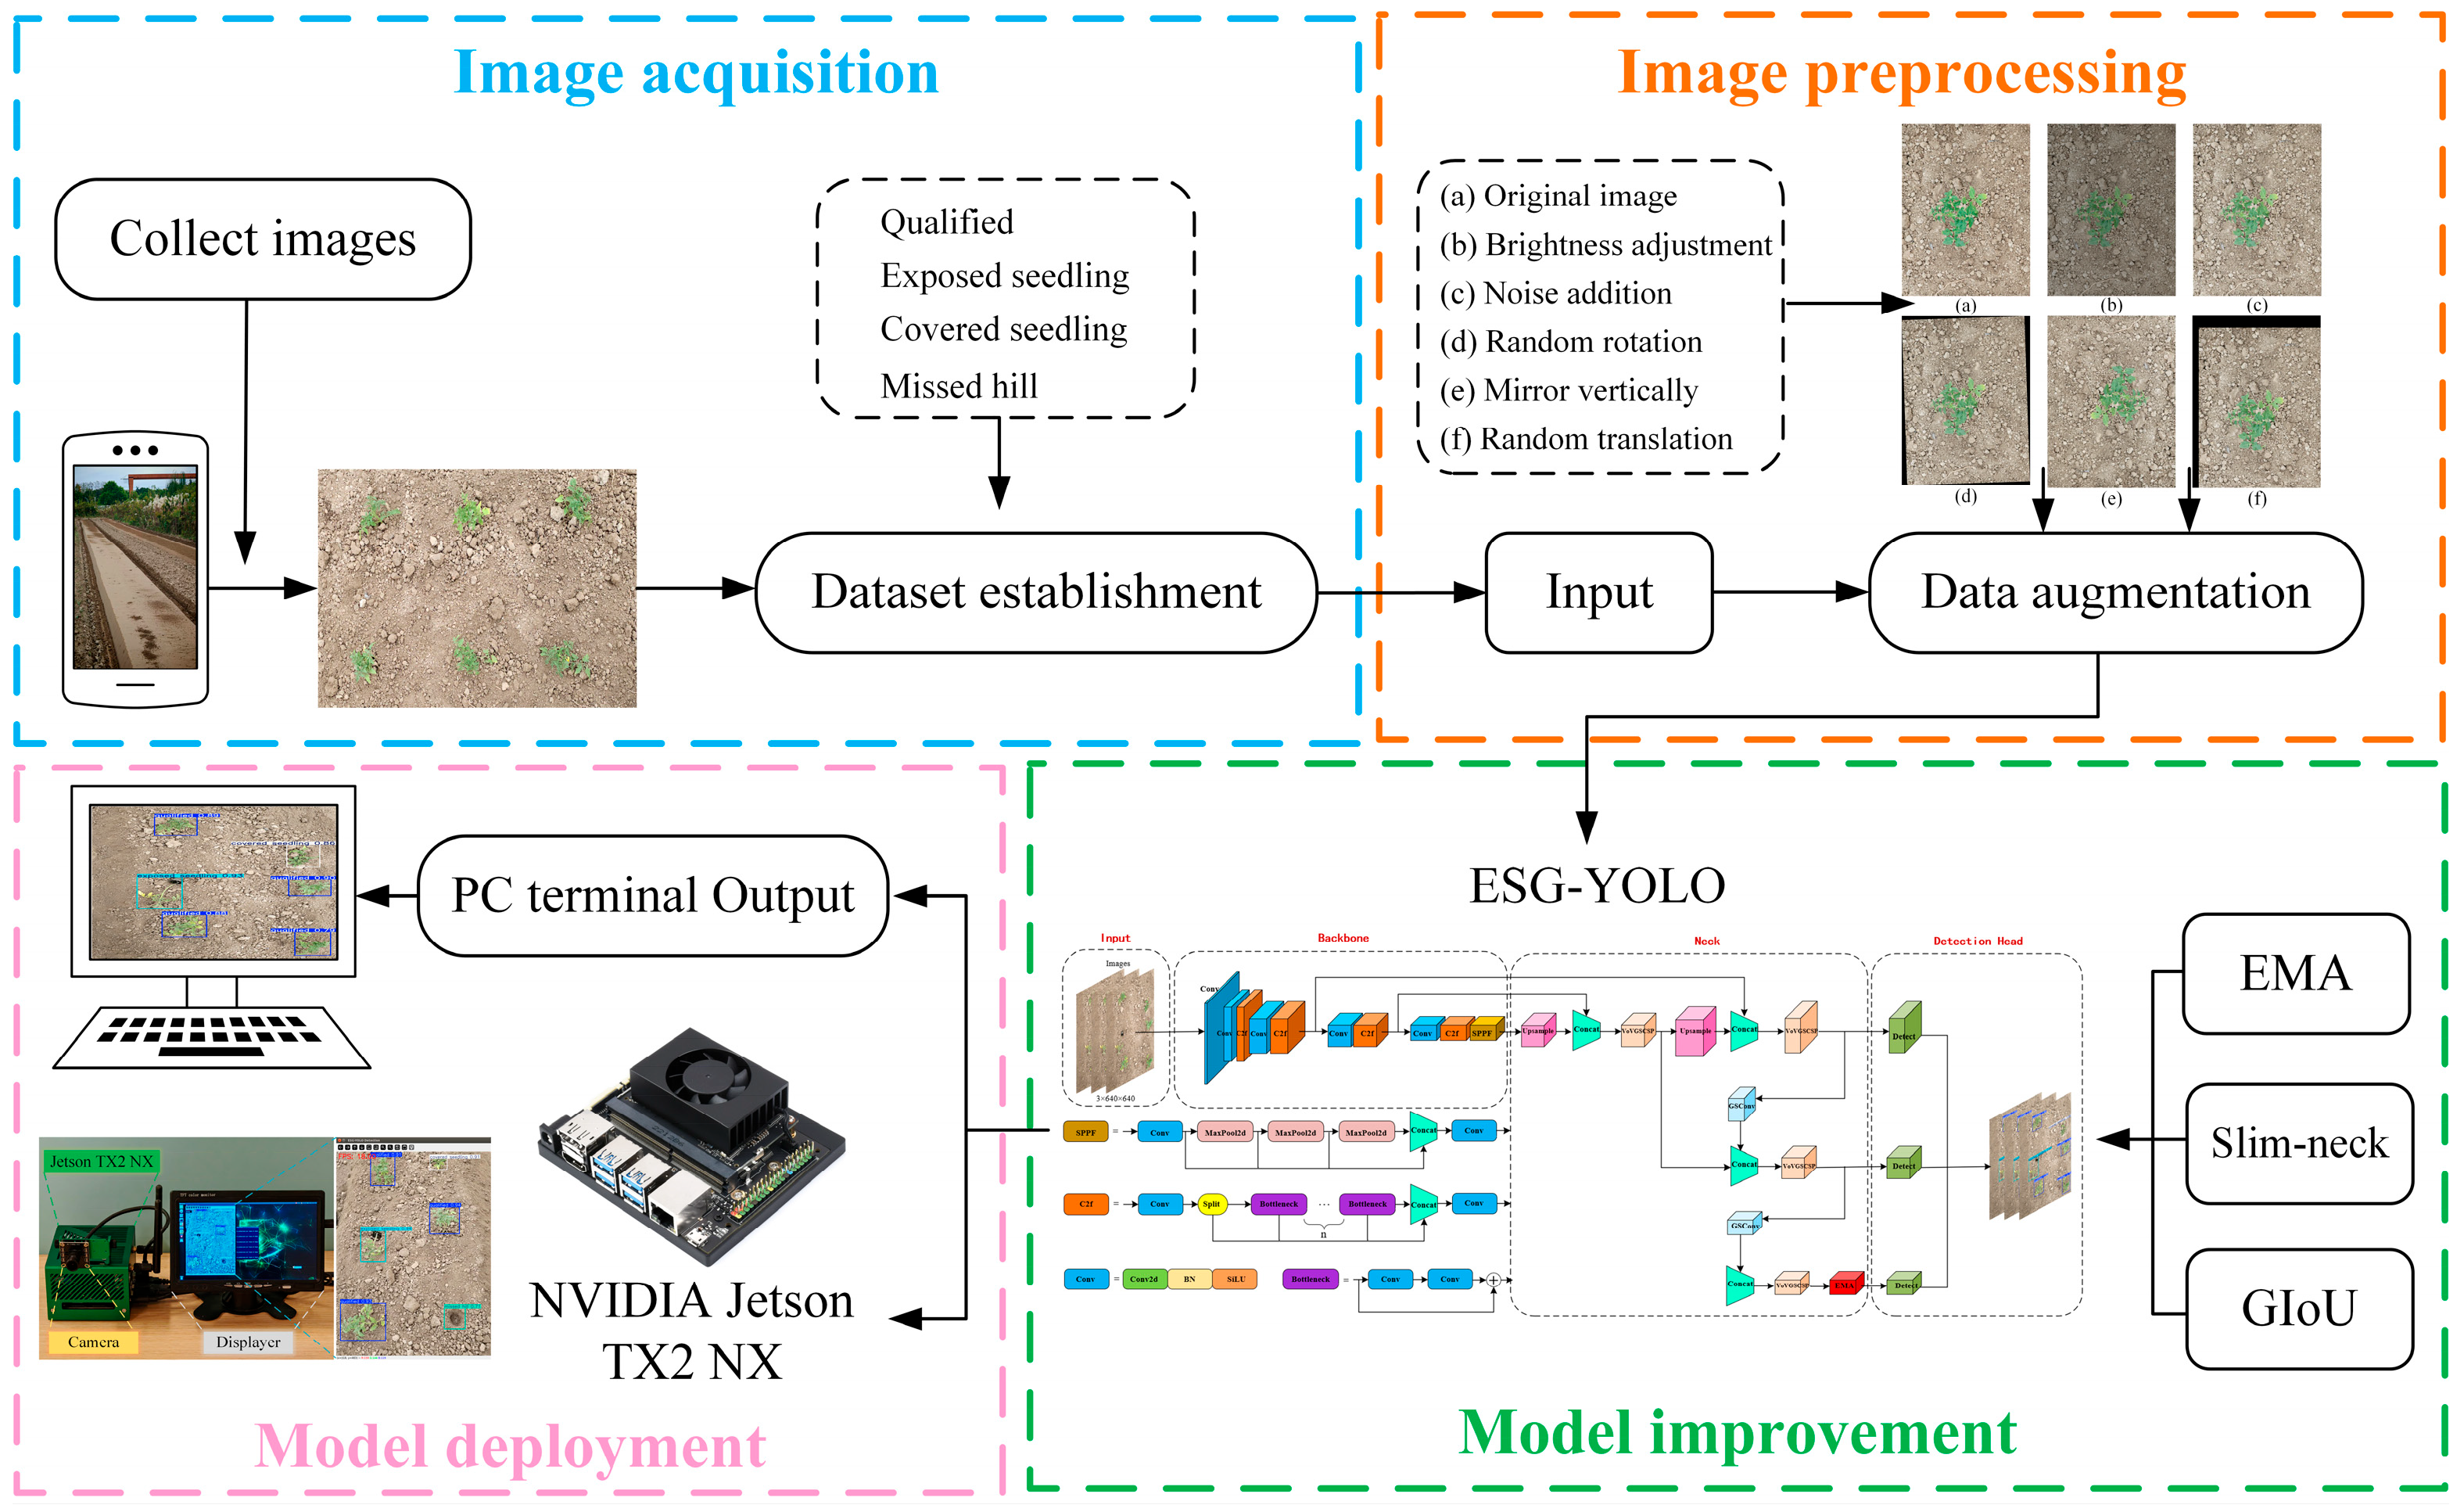
Based on the aforementioned classification framework, this study proposes an innovative tomato planting quality target detection method, with its complete technical architecture illustrated in Figure 2. The research process comprises four key phases: (1) Initial Data Acquisition: Multi-perspective imaging of tomato seedling samples; (2) Training Set Construction: Implementation of data augmentation techniques to develop diversified training sets, enhancing model adaptability across complex farmland environments; (3) Core Innovation: Development of the ESG-YOLO lightweight detection model and design of edge computing hardware dedicated to seedling quality assessment; (4) Cross-Platform Deployment: Successful implementation on PC workstations and embedded deployment on NVIDIA Jetson TX2 NX platforms. Figure 2 visually documents the end-to-end technical workflow—from raw data acquisition and algorithm optimization to hardware implementation—delivering an operational solution for intelligent monitoring in modern agriculture.

2.2. Image Acquisition and Dataset Construction

2.2.1. Image Acquisition

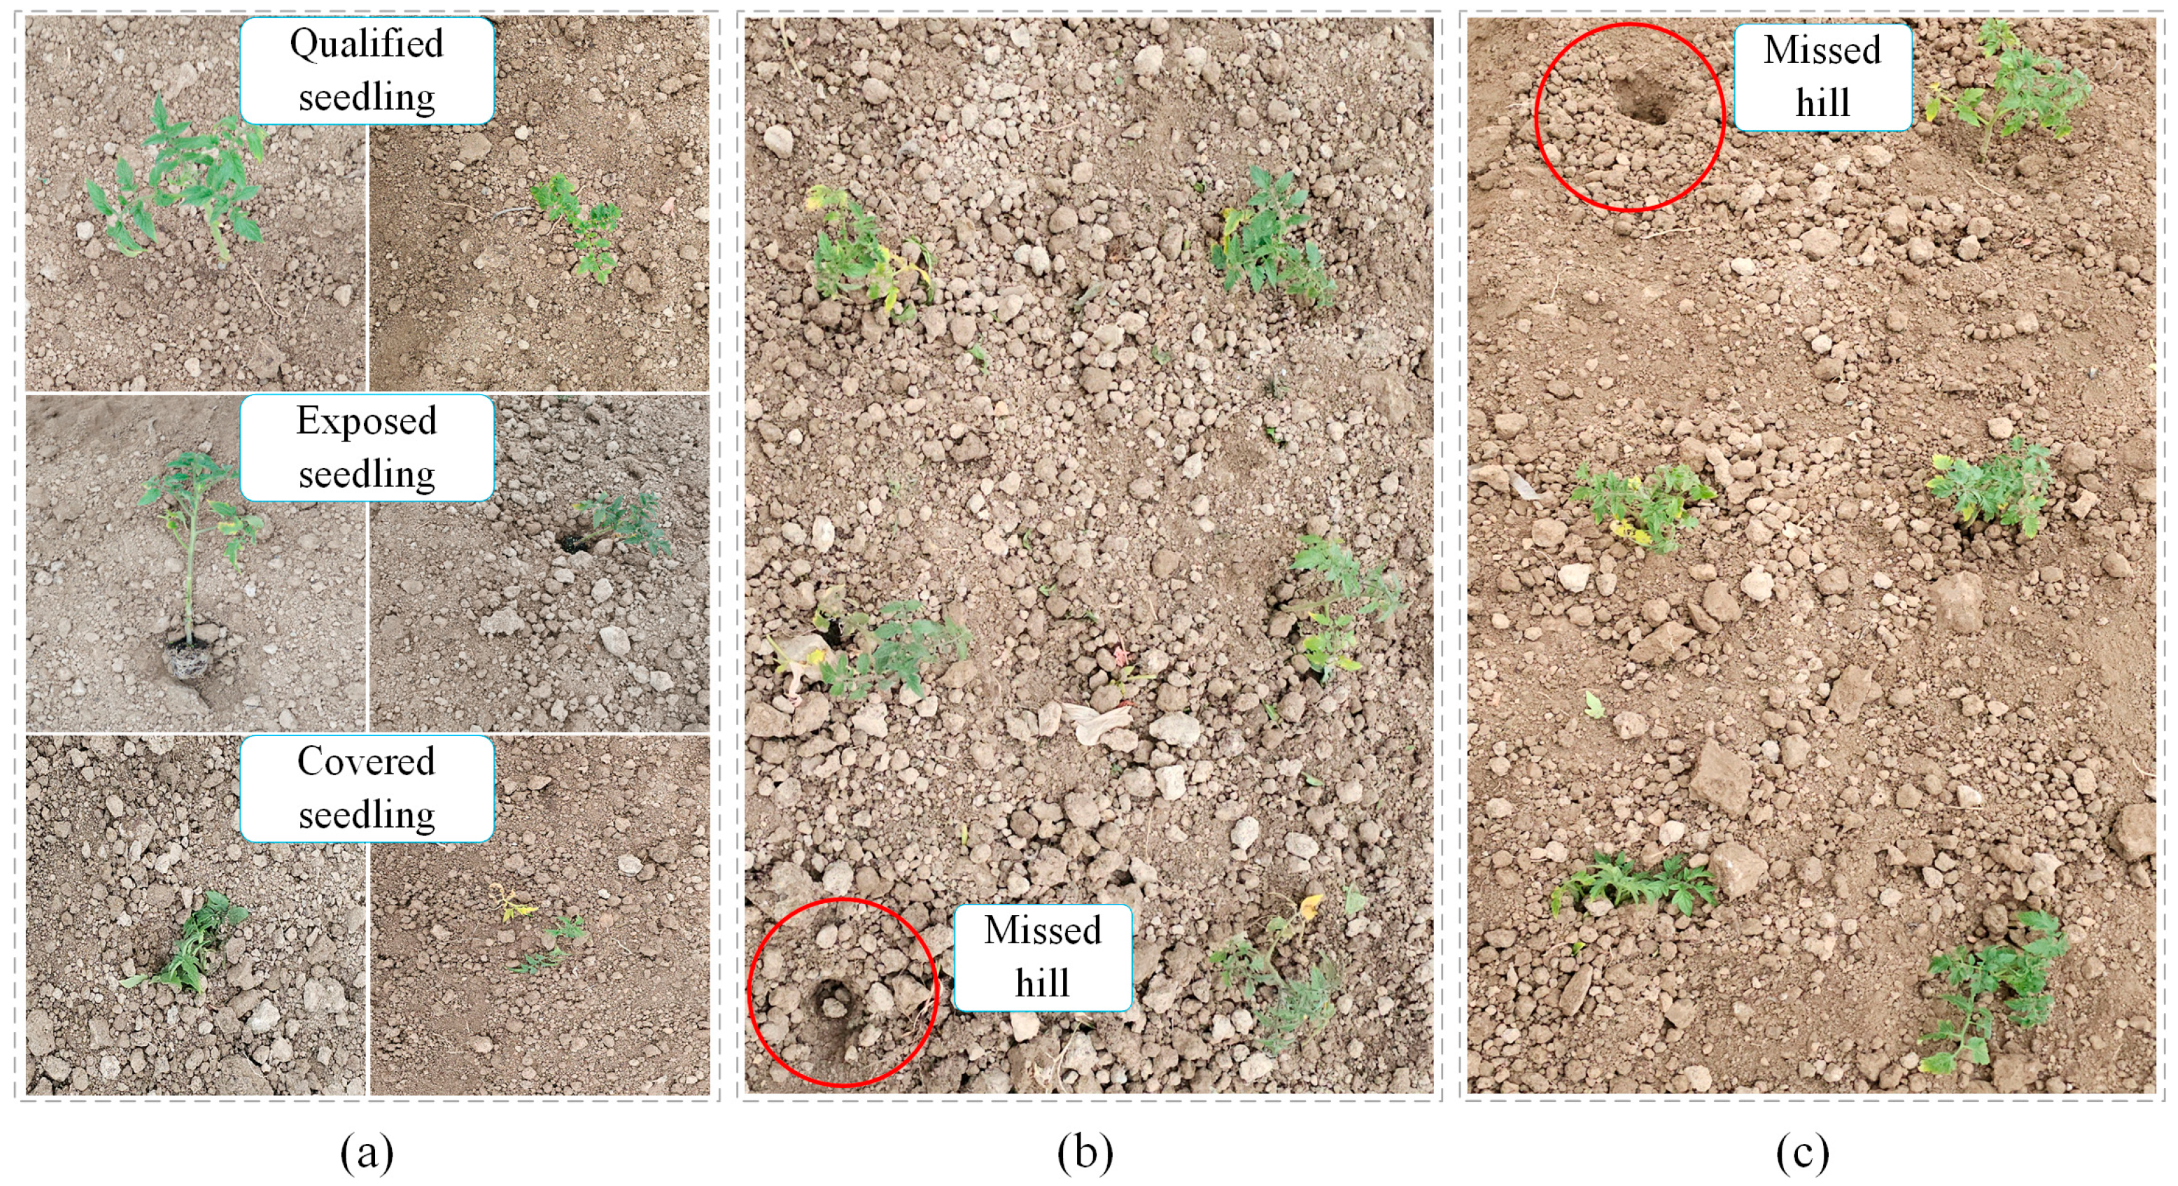
This study conducted image acquisition trials in the tomato cultivation area of Yinong Agricultural Base (119°47′ E, 25°91′ N) in Changle District, Fuzhou City, Fujian Province. The experimental materials consisted of locally cultivated tomato seedlings at 30–35 days of growth, with plant heights of 15–20 cm, possessing 4–6 true leaves. To obtain high-quality image data, a SAMSUNG Galaxy S23 Ultra smartphone was used for photography between 9:00 AM and 5:00 PM on 20 March 2025. To meet the development requirements of agricultural robotic seedling detection systems, two shooting angles (45° and 90°) were specifically employed to simulate robotic observation perspectives under different motion states. A total of 1691 original images were captured, documenting the growth conditions of individual and multiple plants under varying lighting conditions, with particular emphasis on recording various post-transplanting states of tomato seedlings, including qualified seedlings, exposed seedlings, covered seedlings, and missed hills. Relevant sample images are shown in Figure 3.

2.2.2. Data Preprocessing and Dataset Construction

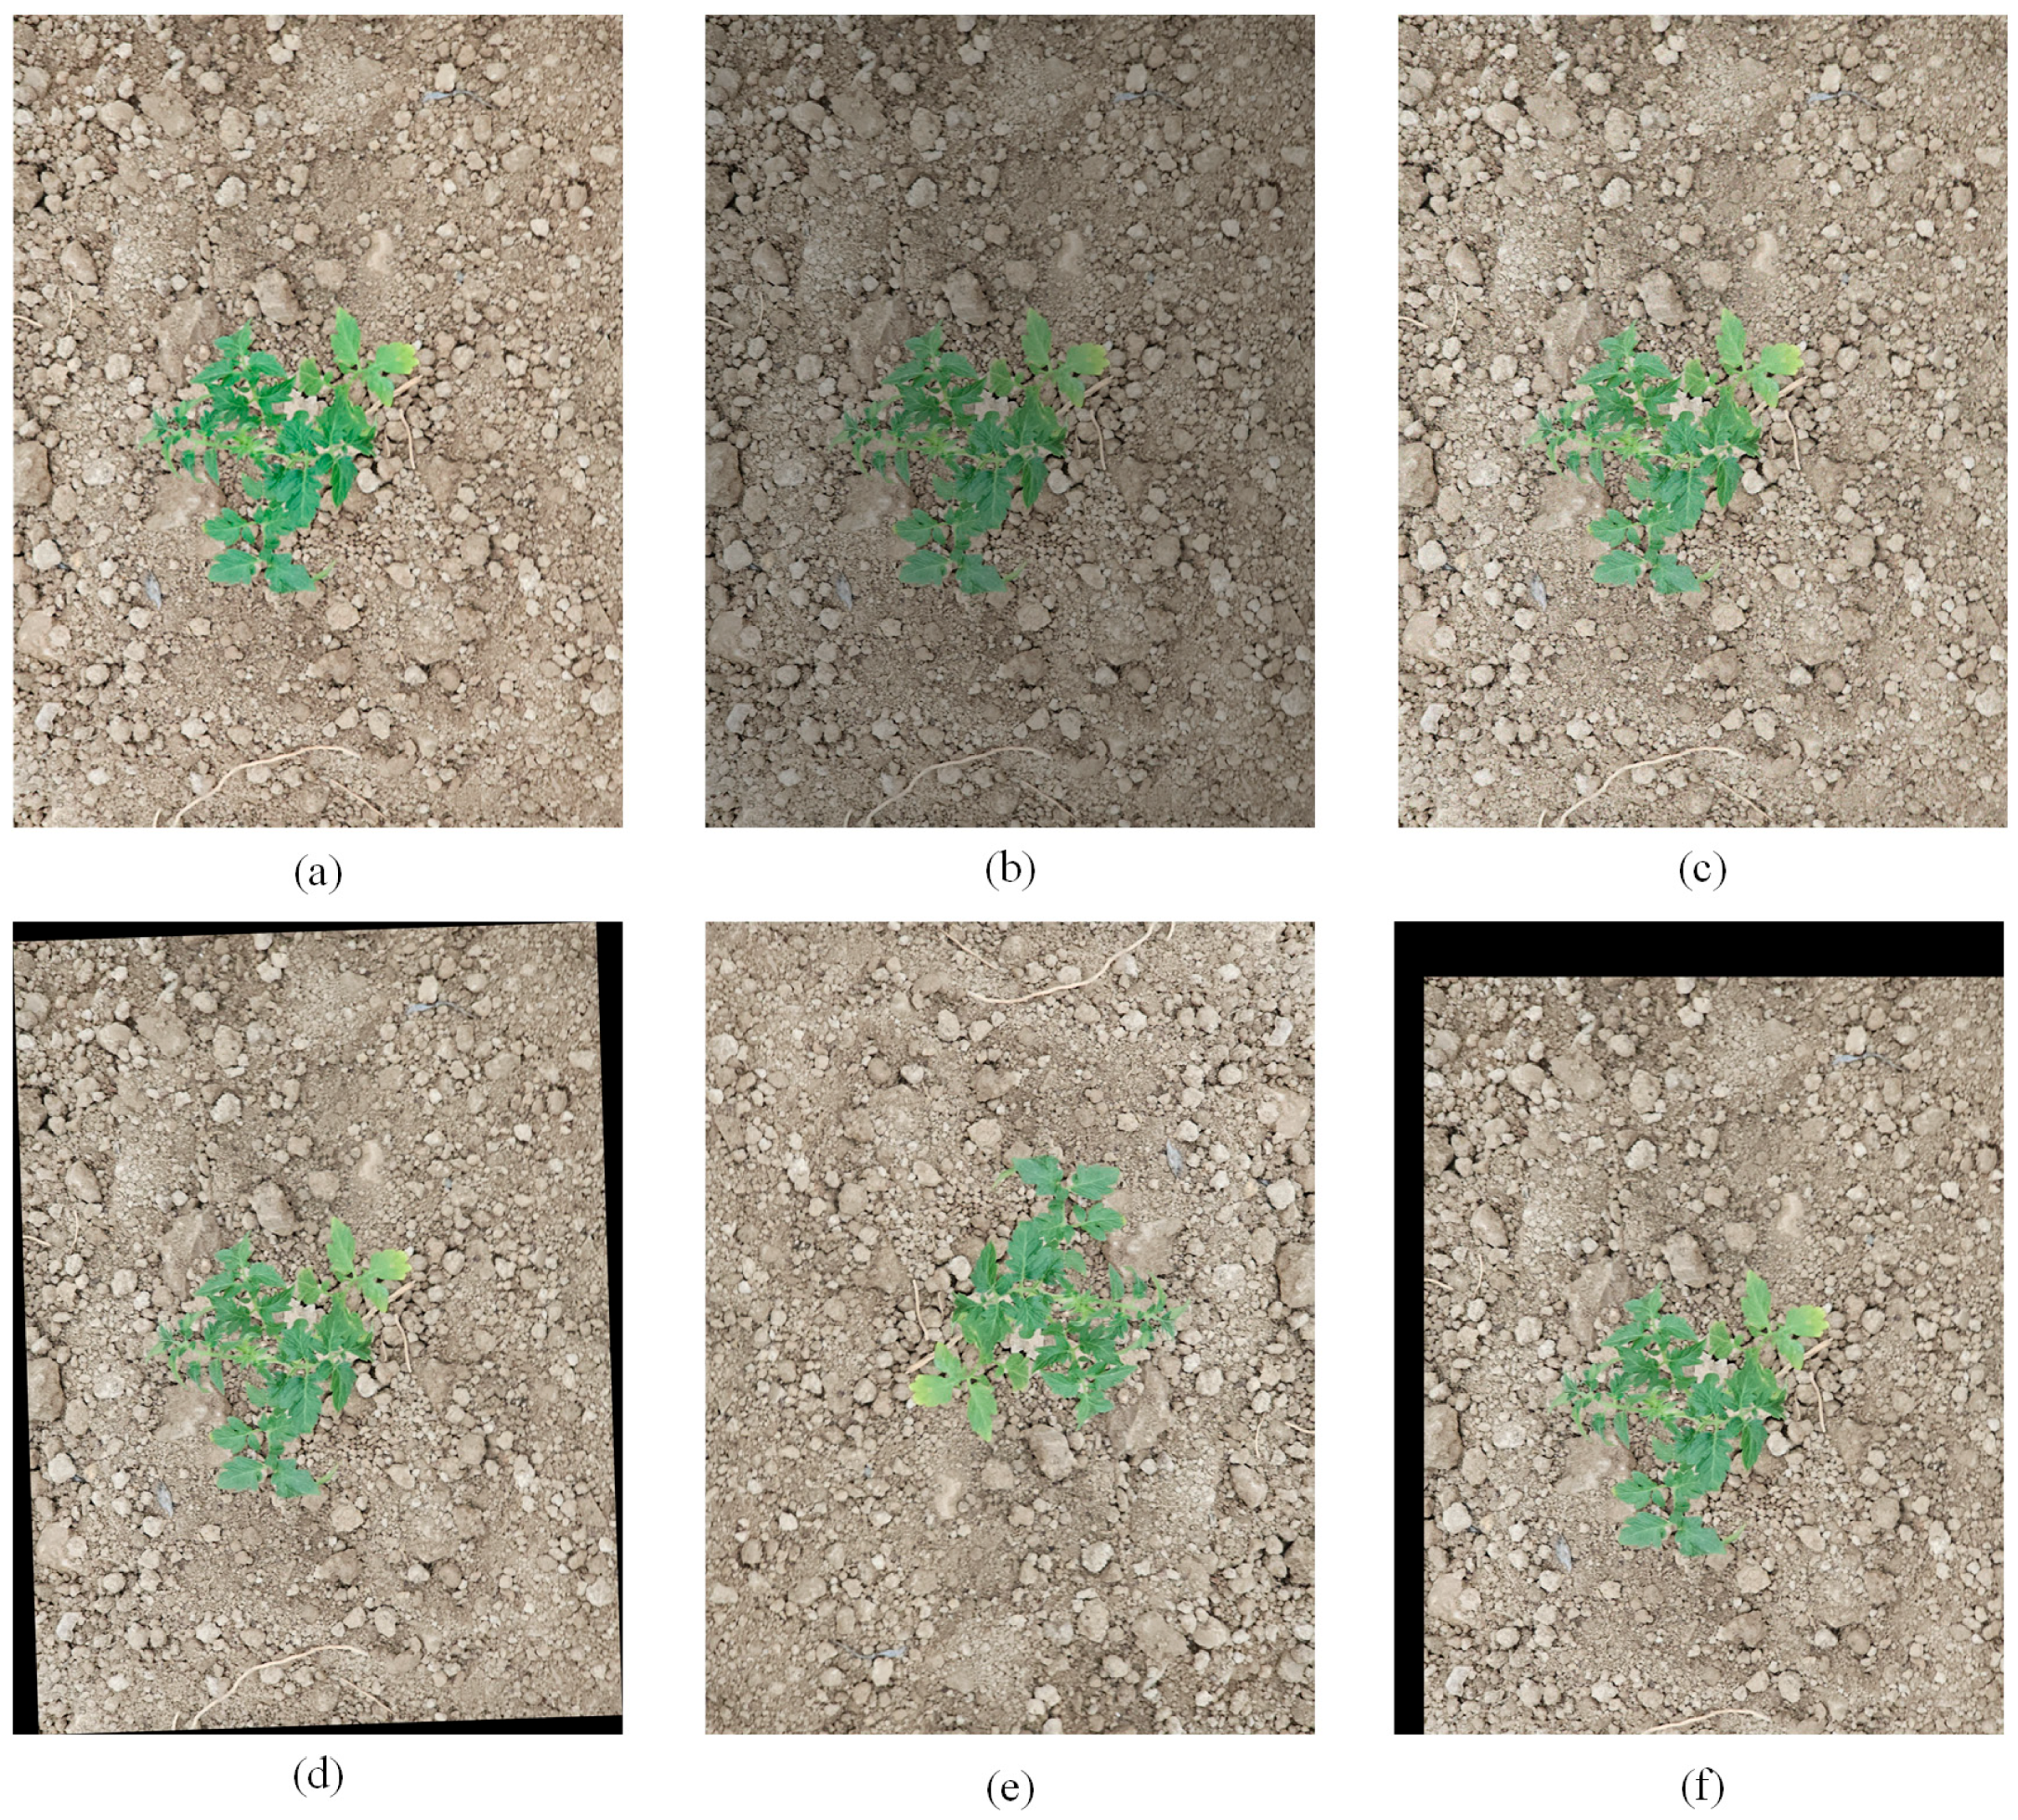
This study employed multiple data augmentation techniques using the OpenCV 4.8 toolkit to conduct comprehensive offline enhancement processing on original tomato seedling images, including spatial geometric transformations (translation, rotation, horizontal/vertical flipping), illumination condition adjustments (brightness variation), and image quality degradation through Gaussian noise addition; the relevant processing effects are shown in Figure 4. The augmentation strategies were specifically designed such that brightness adjustment simulates lighting variations under different weather conditions (sunny/overcast), rotation and flipping operations replicate diverse observation angles encountered during field operation of robotic detection systems, while noise injection mimics interference factors like sensor noise during image acquisition. Through systematic data augmentation, the experimental dataset expanded significantly from the original 1691 to 7606 images, providing richer and more diverse sample resources for subsequent model training.
This study establishes a comprehensive experimental dataset construction pipeline to address tomato seedling transplanting quality assessment requirements. Based on transplanting quality characteristics, seedling samples were categorized into four classes: qualified seedlings (normal transplanting), exposed seedlings (root exposure), covered seedlings (excessive soil coverage), and missed hills (seedling absence). The dataset was strictly partitioned following a 7:2:1 ratio allocation principle, resulting in 1183 training images, 338 validation images, and 170 test images. Manual annotation was performed using the professional labeling tool LabelImg 1.8.6 (https://github.com/tzutalin/labelImg, accessed on 30 March 2025), with detailed records of each seedling’s category attributes and precise positional coordinates within the images. All annotations were stored in YOLO object detection standard format and saved as .txt files after specific conversion processing. Through systematic data augmentation, the original dataset was significantly expanded to 7606 high-quality annotated images. To ensure annotation accuracy and reliability, all labeling results underwent rigorous review and validation by senior cultivation experts, effectively guaranteeing dataset annotation precision and establishing a solid foundation for subsequent model training. The complete dataset composition is detailed in Table 1.

2.3. Strategies for Improving the YOLOv8 Model

2.3.1. ESG-YOLO Object Detection Algorithm

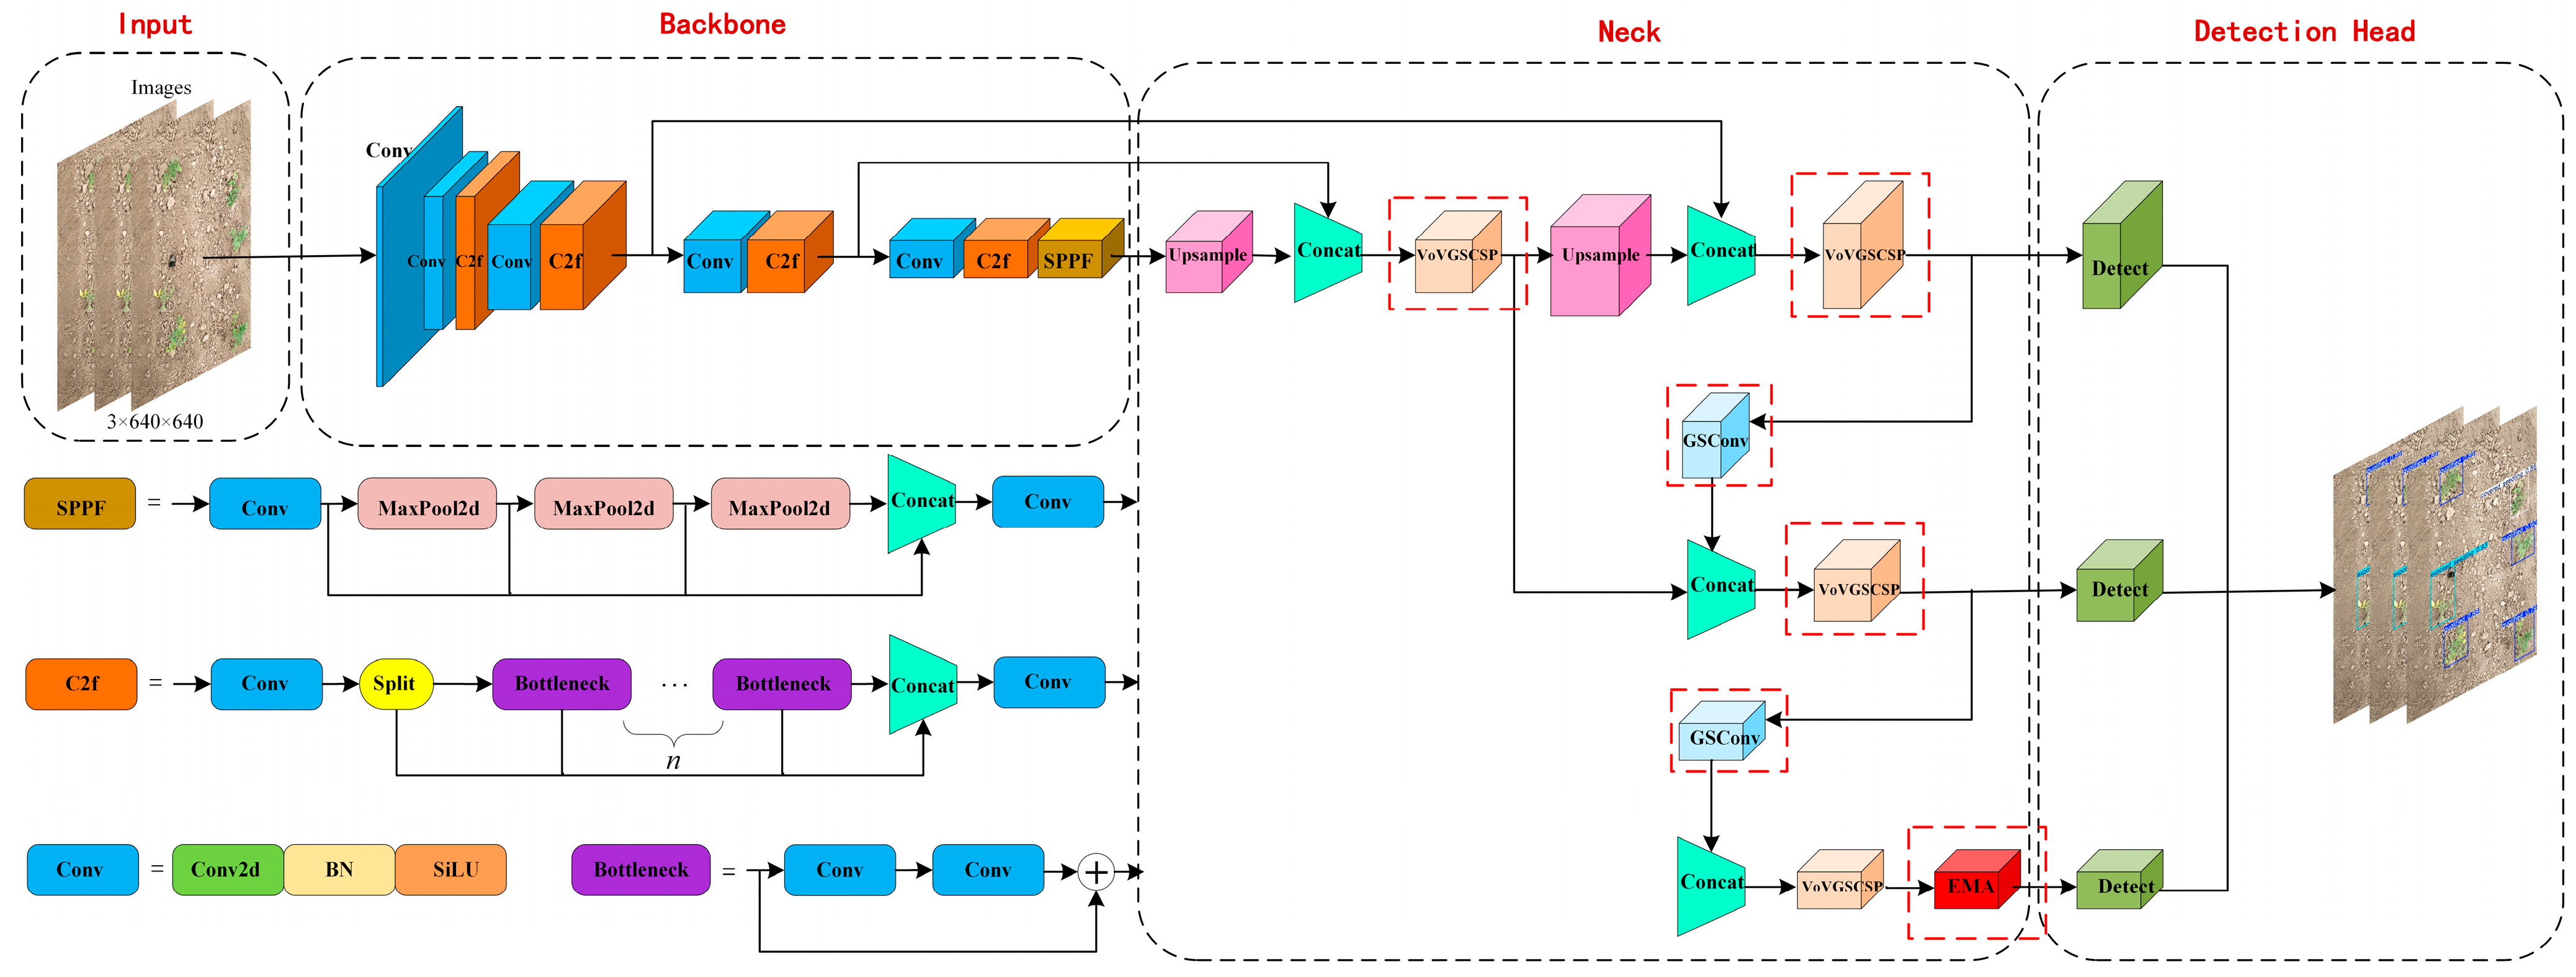
This study developed a novel tomato seedling detection model, ESG-YOLO, based on the YOLOv8 framework. While inheriting the lightweight characteristics of the original architecture, the model significantly improves the recognition accuracy of tomato seedling transplanting quality in field environments. As shown in Figure 5 (where key improvement areas are marked with red dashed boxes), we implemented three targeted optimizations: (1) An Efficient Multi-Scale Attention (EMA) module was added to the 13th layer of YOLOv8’s neck to reduce interference from redundant information and enhance the model’s focus on tomato seedlings as a whole. (2) The original YOLOv8 feature fusion network was reconstructed using a lightweight Grouped Stochastic Convolution (GSConv) module and a lightweight integration module, VoVGSCSP, reducing model complexity with minimal loss in accuracy. (3) Replacing the original CIoU loss function with the GIoU loss function enables more precise localization of seedling positions and shapes, reducing false detections and missed detections, thereby improving overall detection accuracy.

2.3.2. EMA Attention Module

During the detection of transplanted tomato seedlings, several significant technical challenges arise. First, individual seedlings are small in size during the early growth stages, causing non-target regions to dominate the image. Second, seedlings of varying sizes exhibit pronounced scale differences within the frame. Notably, when seedlings are in the exposed seedling state, their growth substrates undergo a gradual transition from partial exposure to complete unveiling on the soil surface. The high visual similarity between substrates and soil makes substrate identification accuracy critical for accurately determining whether seedlings are exposed. The EMA attention module substantially enhances model performance through multi-dimensional optimization. Its technical advantages are highlighted as follows: (1) Parallel Computing Architecture: A multiscale feature extraction network processes feature correlations across different temporal spans synchronously. This design reduces network complexity while improving computational efficiency. (2) Cross-Scale Feature Fusion: Attention distribution maps generated by branch networks are intelligently integrated, enabling multi-level capture of spatial features. This mechanism sharpens focus on key image regions, providing finer pixel-level attention for deep feature learning and ultimately elevating the model’s representational capacity. The specific implementation architecture is illustrated in Figure 6 [37].
Firstly, the EMA module takes the feature map X R C × H × W extracted from the backbone network as input. It then divides this feature map into G groups along the channel dimension, resulting in G subgroups of sub-feature maps: X = X 0 , X 1 , , X i , , X G 1 , where each sub-feature map X i R C G × H × W . Here, H and W represent the dimensions in the vertical and horizontal spatial directions respectively, while C denotes the number of channels.
Secondly, during the feature processing stage, these G groups of feature maps are fed separately into two parallel sub-networks for processing. The first sub-network employs a 1 × 1 convolutional structure with a dual-path design: One path performs 1D global average pooling along the horizontal axis. The other path executes identical pooling operations along the vertical axis. This dual-path architecture effectively captures both global dependencies and positional features of the feature map across horizontal and vertical spatial dimensions. The mathematical representation of this process is as follows:
z c H H = 1 W 0 i W x c H , i
z c W W = 1 H 0 j H x c j , W
In the 1 × 1 branch, one-dimensional global average pooling is performed on the sub-feature maps along both horizontal and vertical dimensions, generating corresponding feature maps z c H H and z c W W . The generated feature maps z c H H and z c W W are concatenated along the vertical dimension. By introducing a 1 × 1 convolutional kernel, the system effectively establishes correlations between channel features and spatial positions, achieving decoupling processing of the feature maps across two spatial dimensions. Subsequently, the system employs a Sigmoid activation function to process the feature maps, generating attention weight distribution maps for horizontal and vertical dimensions respectively. These weight maps undergo feature updating with the original sub-feature maps through matrix multiplication. The updated intermediate feature map first undergoes group normalization, followed sequentially by average pooling and Softmax operations. This series of operations realizes the effective fusion of global spatial features and channel features, yielding an output dimensionality of C G × 1 × 1 . The specific feature fusion formula is as follows:
z c = 1 H × W j H i W x c i , j
x c i , j denotes the input feature at spatial position i , j in channel C t h , where z c represents channel C t h feature after 2D global average pooling.
Following the Softmax operation, the resulting feature map undergoes matrix multiplication with the feature sub-map processed by a 3 × 3 convolutional kernel. This yields the first spatial attention weight map with dimensions 1 × H × W .
The 3 × 3 branch network adopts a processing flow similar to that of the 1 × 1 branch. The output features of this branch undergo matrix multiplication with the features from the group normalization-processed 1 × 1 branch, generating another spatial attention weight map of dimensions 1 × H × W . This computation effectively enhances feature interactions across different spatial dimensions.
In the final stage, the system aggregates the two spatial attention weight maps and applies a Sigmoid function for value normalization, producing the optimized attention weight map. The original feature map is then weighted and fused using this final attention weight map. This enables the network to output attention-enhanced feature representations that accentuate critical regions within the image.

2.3.3. GSConv-Based Slim-Neck

In agricultural field scenarios, the performance of robots executing seedling quality inspection is directly constrained by algorithmic model efficiency. Notably, model operational efficiency depends not only on detection accuracy but is equally determined by processing speed. Generally, model architectures with lower parameters and FLOPs (floating-point operations) can significantly enhance algorithmic execution efficiency and are better suited for deployment on resource-constrained edge computing devices. To achieve the dual objectives of high-precision detection and rapid inference while ensuring model compatibility with edge computing environments, this study innovatively employs the GSConv module [38] to reconstruct and optimize the neck structure of the YOLOv8 model.
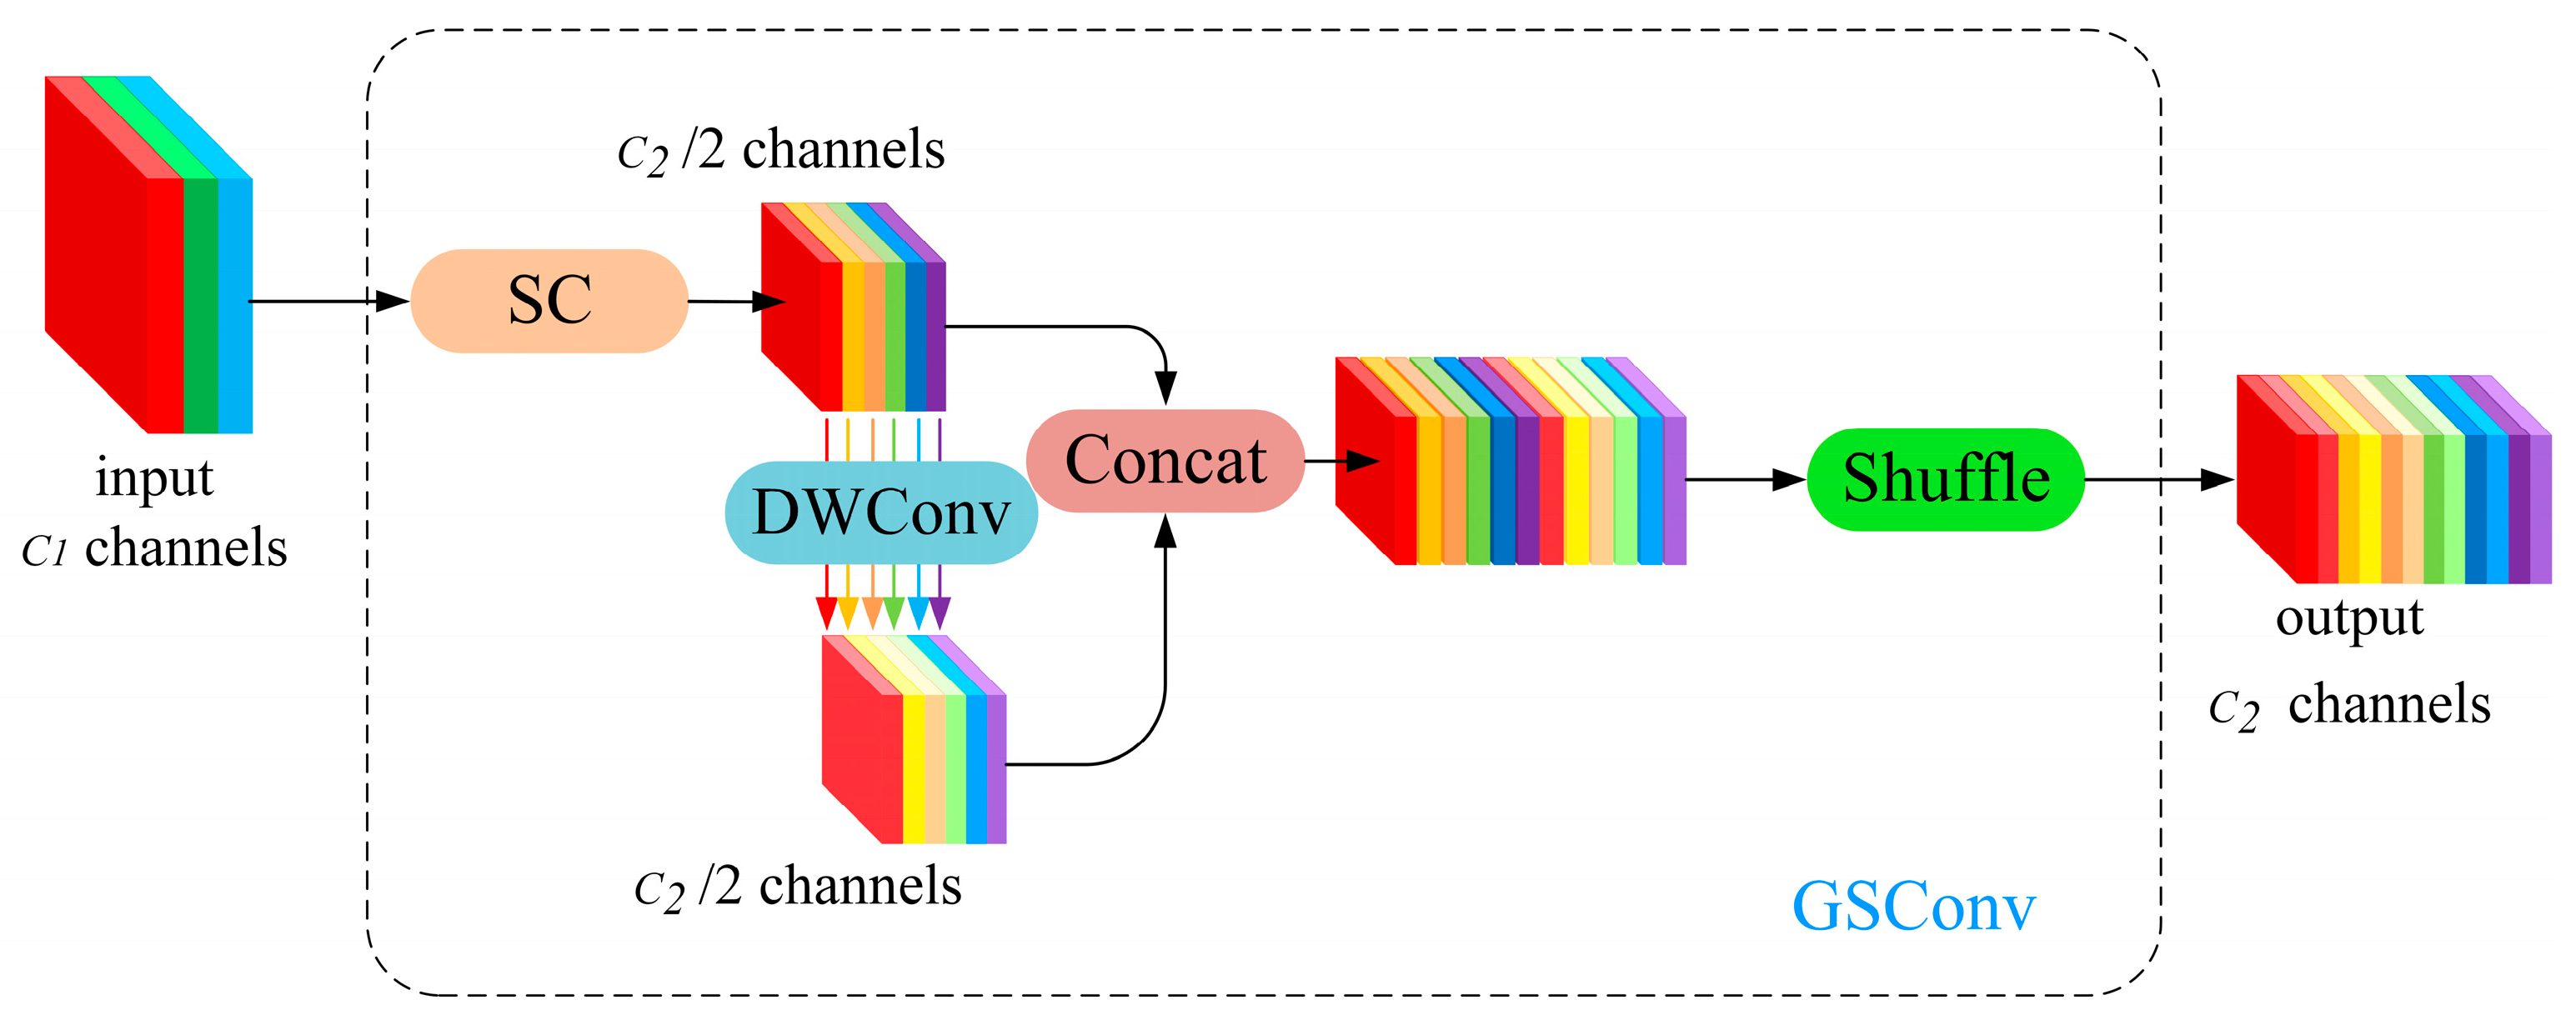
The structure of GSConv is illustrated in Figure 7. Initially, the input feature map undergoes downsampling through standard convolution, followed by depthwise convolution (DWConv). The outputs from these two convolutional operations are then channel-concatenated. Finally, a Shuffle operation reorganizes channels with semantically correlated information generated by the preceding convolutions. GSConv aims to make the output of depthwise separable convolution (DSC) approximate that of standard convolution as closely as possible. Through the Shuffle operation, it fuses information from standard convolution into all regions of DSC-generated features. This approach significantly reduces model complexity while maintaining high accuracy. The method enables comprehensive integration of standard convolution information into DSC outputs, achieving a superior balance between model accuracy and inference speed.
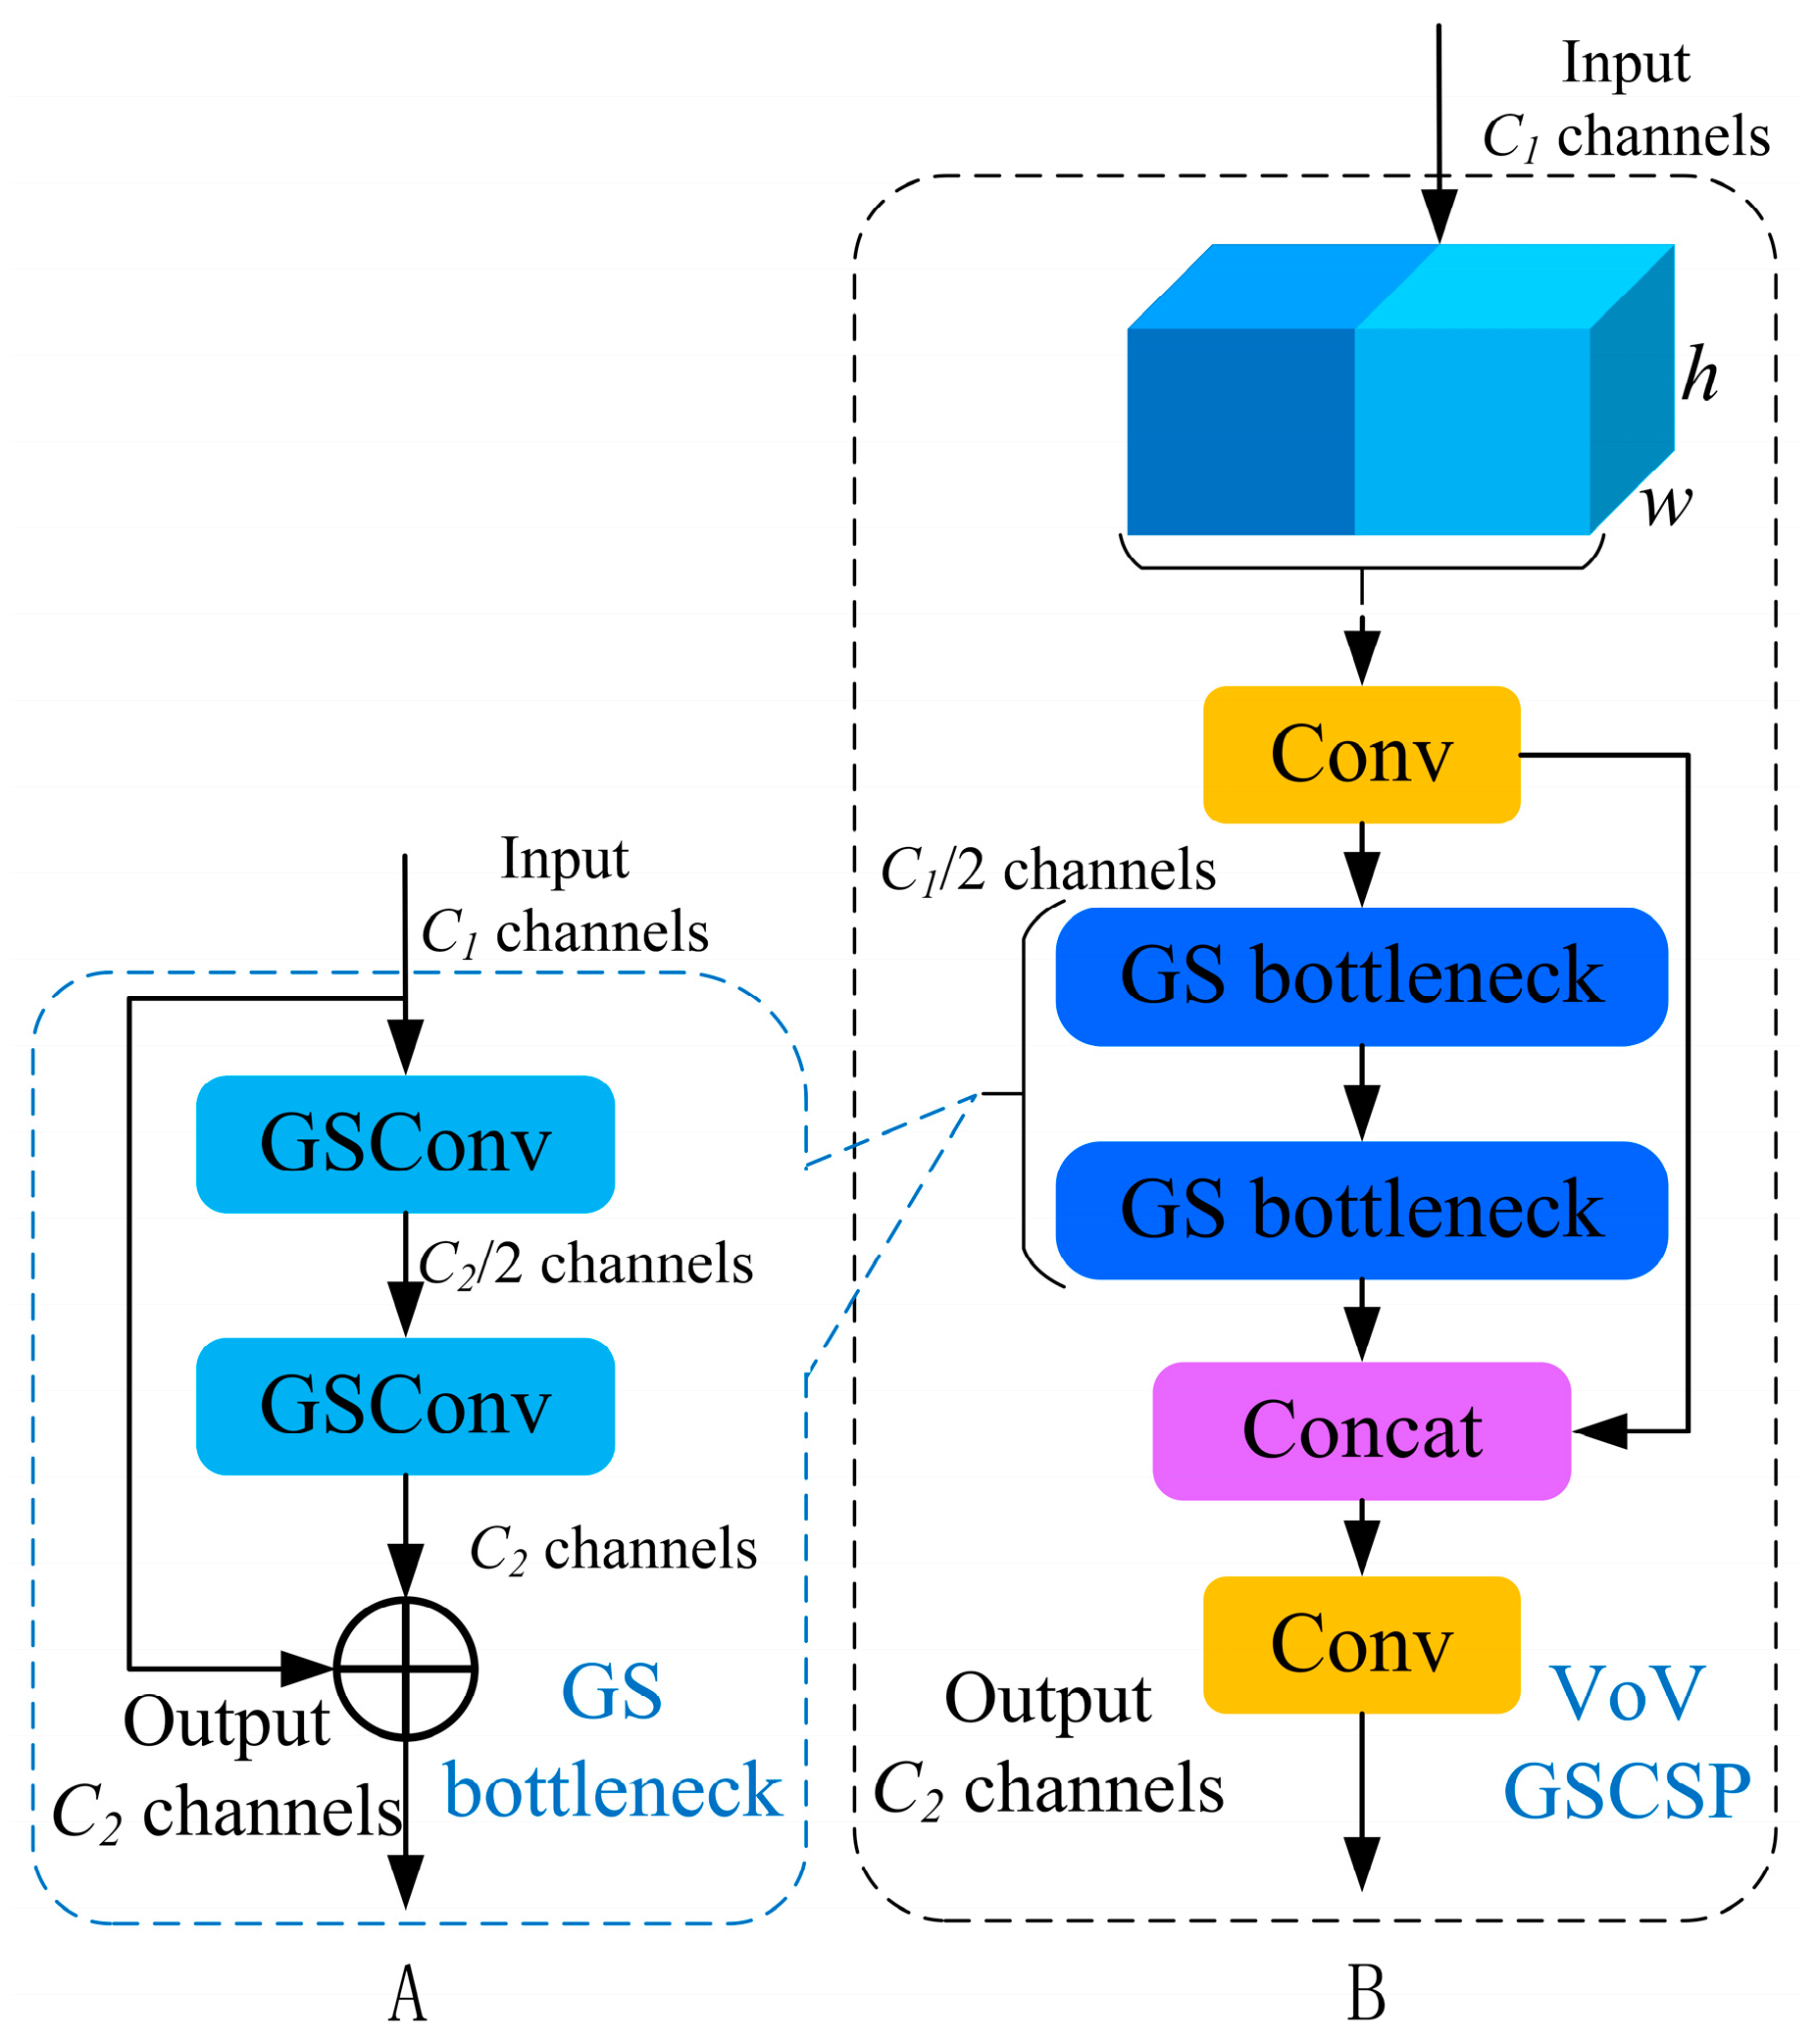
This study employs the lightweight GSConv convolution structure to replace traditional convolution operations. The computational overhead of this structure accounts for only 60–70% of standard convolution, yet delivers comparable feature learning capabilities. As illustrated in Figure 8A, we innovatively designed the GSbottleneck module based on GSConv, subsequently reconstructing the C2f module of YOLOv8. The resulting novel module is designated as VoVGSCSP (Figure 8B). Through seamless integration of the GSConv module with the VoVGSCSP lightweight architecture (termed the Slim-neck network), we achieved model lightweighting while retaining baseline detection accuracy. Specifically, this study optimizes the neck structure of YOLOv8 using the Slim-neck network. This modification not only significantly reduces computational complexity but also maintains high-precision recognition capabilities for tomato seedling transplanting quality detection tasks.

2.3.4. Improvement of IoU-Loss

The YOLOv8 model employs CIoU (Complete Intersection over Union) as its default bounding box regression loss function. However, this loss function exhibits a significant limitation: the inability to synchronously adjust the width and height of anchor boxes, which constrains the model’s optimization potential. Although CIoU comprehensively considers three factors—intersection-over-union ratio, center point offset, and aspect ratio—to optimize bounding box position and shape during regression, it still suffers from several drawbacks: (1) Poor performance in detecting small targets: For diminutive objects such as tomato seedlings, CIoU struggles to capture subtle edge features in complex backgrounds, resulting in high missed-detection rates and inadequate recognition of overlapping objects; (2) Limited discriminative capability in agricultural scenarios: Under field conditions with variable lighting, soil color, and environmental interference, root balls of tomato seedlings often blend into the background. In cases of partial burial, limited above-ground exposure and scattered seedling leaves further complicate detection. Fixed-aspect anchor boxes fail to capture complete spatial information, and CIoU lacks sufficient sensitivity to these details. These limitations reduce detection accuracy, compromise model robustness, and increase task difficulty. To address these challenges, this study adopts the GIoU (Generalized Intersection over Union) loss function [39] to replace the original IoU loss. This modification significantly enhances localization accuracy for small-scale targets while accelerating model convergence. The formulas for IoU and GIoU are defined as follows:
I o U A , B = A B A B
G I o U = I o U A , B C A B C
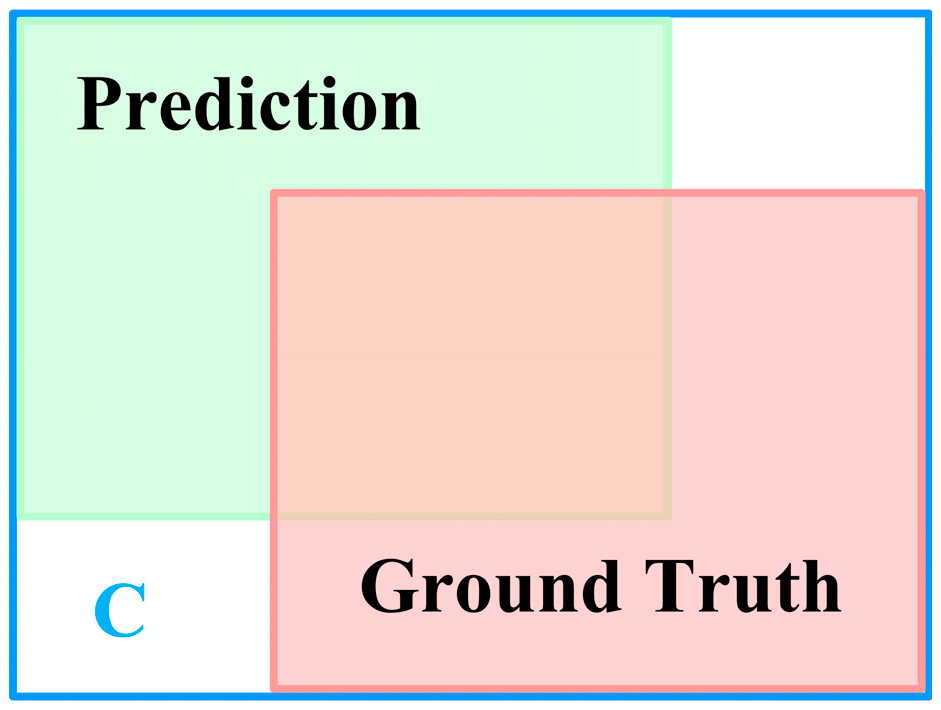
In this formula, A and B represent the predicted and ground truth bounding boxes respectively, where A B denotes their union and A B their intersection. The term C signifies the minimum enclosing rectangle of these two boxes, as illustrated in Figure 9. This computational approach demonstrates enhanced universality while providing more precise quantification of spatial relationships and overlap between detection boxes, thereby establishing refined and comprehensive evaluation standards for computer vision tasks. The application of the GIoU loss function in tomato seedling transplanting quality identification leverages its comprehensive inter-box relationship modeling to achieve adaptive scaling to target dimensions. This enables the model to accurately capture state characteristics of seedlings, consequently improving task performance and robustness. The mechanism of this loss function effectively strengthens the model’s adaptive learning capability, facilitating efficient recognition across diverse scenarios.

2.4. Experimental Environment and Evaluation Metrics

2.4.1. Experimental Environment

All relevant experiments in this study, including comparative experiments on attention mechanisms, loss functions, ablation experiments of the ESG-YOLO model, and comparisons between ESG-YOLO and other state-of-the-art models, were conducted on the same device. The specific hardware configuration and experimental environment are detailed in Table 2.
In this study, several parameters were configured for the experiment. The pre-training weight is yolov8n.pt, the initial value of random seed is set to 0, the experimental train epoch is set to 100 epochs, the batchsize is set to 32, the workers is set to 8, and the input image size imgsz is 640 × 640. Training parameters are specified below.
(1)
AMP: Whether to use Automatic Mixed Precision (AMP) for training. AMP is a deep learning training technique that employs half-precision floating-point numbers to accelerate the training process and reduce memory consumption.
(2)
Optimizer: The optimizer, a core parameter controlling model weight update strategies, minimizes the loss function via gradient descent algorithms to enhance model performance.
Additionally, certain hyperparameters were fine-tuned during experiments. All adjusted parameters, including training parameters and hyperparameters, are detailed in Table 3.

2.4.2. Evaluation Metrics

This study adopts a dual-dimensional evaluation framework, conducting quantitative analysis from two perspectives: model efficacy and computational resource requirements. In terms of performance evaluation, three core metrics are examined: Precision (P) reflects the correctness of prediction results, Recall (R) represents the capability to identify positive samples, and Average Precision (AP) comprehensively characterizes the overall performance of the P-R curve (see Table 4). For complexity assessment, the focus is on four key elements: parameter count, floating-point operations (FLOPs), model size, and frames processed per second (FPS), with specific calculation formulas provided in Table 5.

3. Results

3.1. Comparative Experiments on Attention Modules

To evaluate the performance of the EMA attention mechanism, this study selected five widely adopted attention methods in current seedling detection tasks for comparative analysis, including Squeeze-and-Excitation (SE), Convolutional Block Attention Module (CBAM), Coordinate Attention (CA), Efficient Channel Attention (ECA), and Simple Parameter-Free Attention Module (SimAM). During the experimental design phase, the EMA module in the ESG-YOLO network architecture was respectively replaced with each of the five attention mechanisms while strictly maintaining identical parameters for all other network components—ensuring the fairness of the comparative experiments. Detailed performance comparison data can be found in Table 6.
Through comparative analysis of six attention modules, the EMA module demonstrates the most outstanding performance in tomato seedling quality detection tasks, leading the other compared methods in key metrics including Precision (P), Recall (R), and Average Precision (AP). Experimental results show that integrating the EMA module achieves 90.0% Precision, outperforming the SE, CBAM, CA, ECA, and SimAM modules by 1.6, 0.2, 2.3, 2.1, and 1.7%, respectively. Notably, since these modules maintain similar parameter counts, computational complexity, and model sizes, their impact on inference speed (FPS) is negligible. The study also reveals inherent limitations of alternative attention mechanisms: the SE module’s sole reliance on channel attention causes feature smoothing, resulting in 88.4% Precision (1.6% lower than EMA), highlighting the negative impact of spatial feature neglect; CBAM’s serial structure introduces computational redundancy, and despite achieving 89.8% Precision (close to EMA), its limited multi-scale feature extraction capability leads to a 0.2% performance gap; the CA module’s weakness in long-range dependency modeling yields only 87.7% Precision (2.3% lower than EMA), as its coordinate encoding restricts global context capture; the ECA module’s simplistic 1D convolution structure inadequately extracts spatial features, resulting in 87.9% Precision (2.1% lower than EMA); and SimAM’s parameter-free design, while achieving 88.3% Precision, suffers from insufficient scene adaptability, causing a 1.7% performance gap. The EMA module achieves 90.0% Precision through its cross-scale interaction mechanism, with its advantages stemming from: (1) a parallel architecture that avoids CBAM’s computational redundancy, (2) multi-scale grouping that compensates for ECA’s spatial feature limitations, and (3) a global-local synergy mechanism that overcomes CA’s long-range modeling deficiencies.

3.2. Comparative Experiments on Loss Functions

To evaluate the performance differences of various loss functions in seedling detection tasks, this study conducted a comparative analysis of five widely used loss functions in object detection: Complete-IoU (CIoU), Distance-IoU (DIoU), Efficient-IoU (EIoU), SCYLLA-IoU (SIoU), and Generalized Intersection over Union (GIoU). During the experimental design, the loss function module in the ESG-YOLO network architecture was sequentially replaced with these five loss functions while strictly maintaining identical network parameters to ensure the reliability of the comparative tests. The results demonstrate that the GIoU loss function exhibits significant advantages across all performance metrics, with detailed comparative data presented in Table 7.
Through systematic comparative analysis of five loss functions, it is clearly observed that GIoU demonstrates significant advantages in tomato seedling detection tasks. This loss function outperforms other comparative methods across key metrics, including mean average precision (mAP), recall rate (Recall), and frames per second (FPS). Experimental results show that GIoU achieves an mAP of 97.4%, representing improvements of 2.3, 1.0, 0.9, and 1.5% over CIoU, DIoU, EIoU, and SIoU loss functions, respectively. The data clearly reveals the performance limitations of each loss function: CIoU’s gradient instability results in an mAP of 95.1%, lagging 2.3% behind GIoU, confirming the impact of inconsistent optimization objectives on training convergence; DIoU’s neglect of shape information yields only 96.4% mAP, 1.0% lower than that of GIoU, proving that center distance optimization alone cannot fully describe target spatial relationships; EIoU’s deficiency in small target detection is reflected in its 96.5% mAP, showing a 0.9% gap with GIoU that reveals the scale sensitivity of its aspect ratio decoupling strategy; SIoU’s rigid angular penalty constraints result in 94.9% mAP, trailing by 1.5%, exposing its adaptation limitations to biological morphological diversity. GIoU’s comprehensive lead with 97.4% mAP stems from three key advantages: (1) minimum enclosing region design solves gradient vanishing in non-overlapping cases; (2) scale invariance adapts to seedling size variations; (3) spatial relationship modeling accelerates inference. These results demonstrate that GIoU’s systematic optimization of geometric features overcomes the local optimization limitations of traditional loss functions.

3.3. Ablation Experiment

To evaluate the optimization effects of key modules, this study conducted systematic ablation experiments on three critical modules: the EMA attention mechanism, Slim-neck structure, and GIoU loss function (see Table 8). Experimental data revealed that while the baseline YOLOv8 model demonstrated excellent inference speed (FPS), significant optimization potential remained across metrics including tomato seedling recognition accuracy, model parameter count, and computational complexity (Test Group 1). After implementing the proposed enhancements, ESG-YOLO not only substantially improved seedling transplantation quality detection precision while maintaining acceptable speed reduction, but also achieved model architecture lightweighting. Quantitative analysis demonstrated that the enhanced model elevated average precision by 2.2 percentage points and boosted recall by 4.2% in seedling detection tasks, concurrently reducing model parameters by 7%, computational load by 10%, and model size by 8% (Test Group 8).
The experimental results demonstrate that introducing the EMA attention module significantly enhances model performance. Specifically, Group 2 trials show that this module improves tomato seedling recognition accuracy by 1.7% and increases average precision by 0.7%, while model parameters and complexity remain largely unchanged, with no significant increase in model size. For model lightweighting, Group 3, adopting the Slim-neck structure, revealed that its feature map channel shuffling operation disrupts data continuity, reducing parallel computing efficiency on some GPUs and consequently lowering FPS; however, parameters, FLOPs, and model size decreased by 7.0, 9.8, and 9.7%, respectively. This trade-off holds practical value for subsequent mobile deployment, with performance loss remaining within acceptable limits. Notably, Group 4 experiments achieved performance optimization through the GIoU loss function. Although detection accuracy and recall showed minor fluctuations, the model achieved a 1.2% average precision improvement and 3 FPS inference speed acceleration while maintaining original computational overhead. The critical importance of the GIoU loss function was further validated in Group 5: its removal from the ESG-YOLO model caused synchronized declines in detection accuracy, recall, and average precision, alongside a 34 FPS reduction, highlighting GIoU’s essential role in boosting overall detection accuracy while ensuring detection speed.
In Group 6 trials, the ESG-YOLO model without the lightweight Slim-neck structure exhibited a decline in tomato seedling recall, partially compromising detection comprehensiveness. In Group 7 trials, when the EMA attention module was removed from the ESG-YOLO model, the average precision of tomato seedling detection significantly dropped to 94.8%, representing a 2.6% decrease compared to the model with the EMA module. This change highlights the crucial role of the EMA module in improving detection accuracy. A detailed analysis of these two ablation experiments (Groups 6 and 7) is provided in the following subsection.

3.3.1. Slim-Neck Lightweight Network (Group 6)

Comparative analysis of the two neck architectures (Group 6 and Group 8) fully validated the advantages of GSConv and VoVGSCSP in optimizing model efficiency (see Table 9). Experimental data demonstrated that the model adopting Group 8 neck architecture achieved outstanding computational efficiency: a 21% reduction in total parameters and a 40% decrease in FLOPs. Crucially, this configuration achieved dual breakthroughs in performance metrics—boosting tomato seedling detection recall by 5.8% and increasing average precision by 0.4% compared to the Group 6 neck architecture.
The experimental results demonstrate that reconstructing the YOLOv8 neck network with GSConv and VoVGSCSP offers significant advantages, achieving breakthroughs in two aspects: effectively simplifying the model architecture while moderately improving detection accuracy. This balanced approach to efficiency and performance optimization provides a new technical pathway for developing lightweight object detection models.

3.3.2. EMA Attention Module (Group 7)

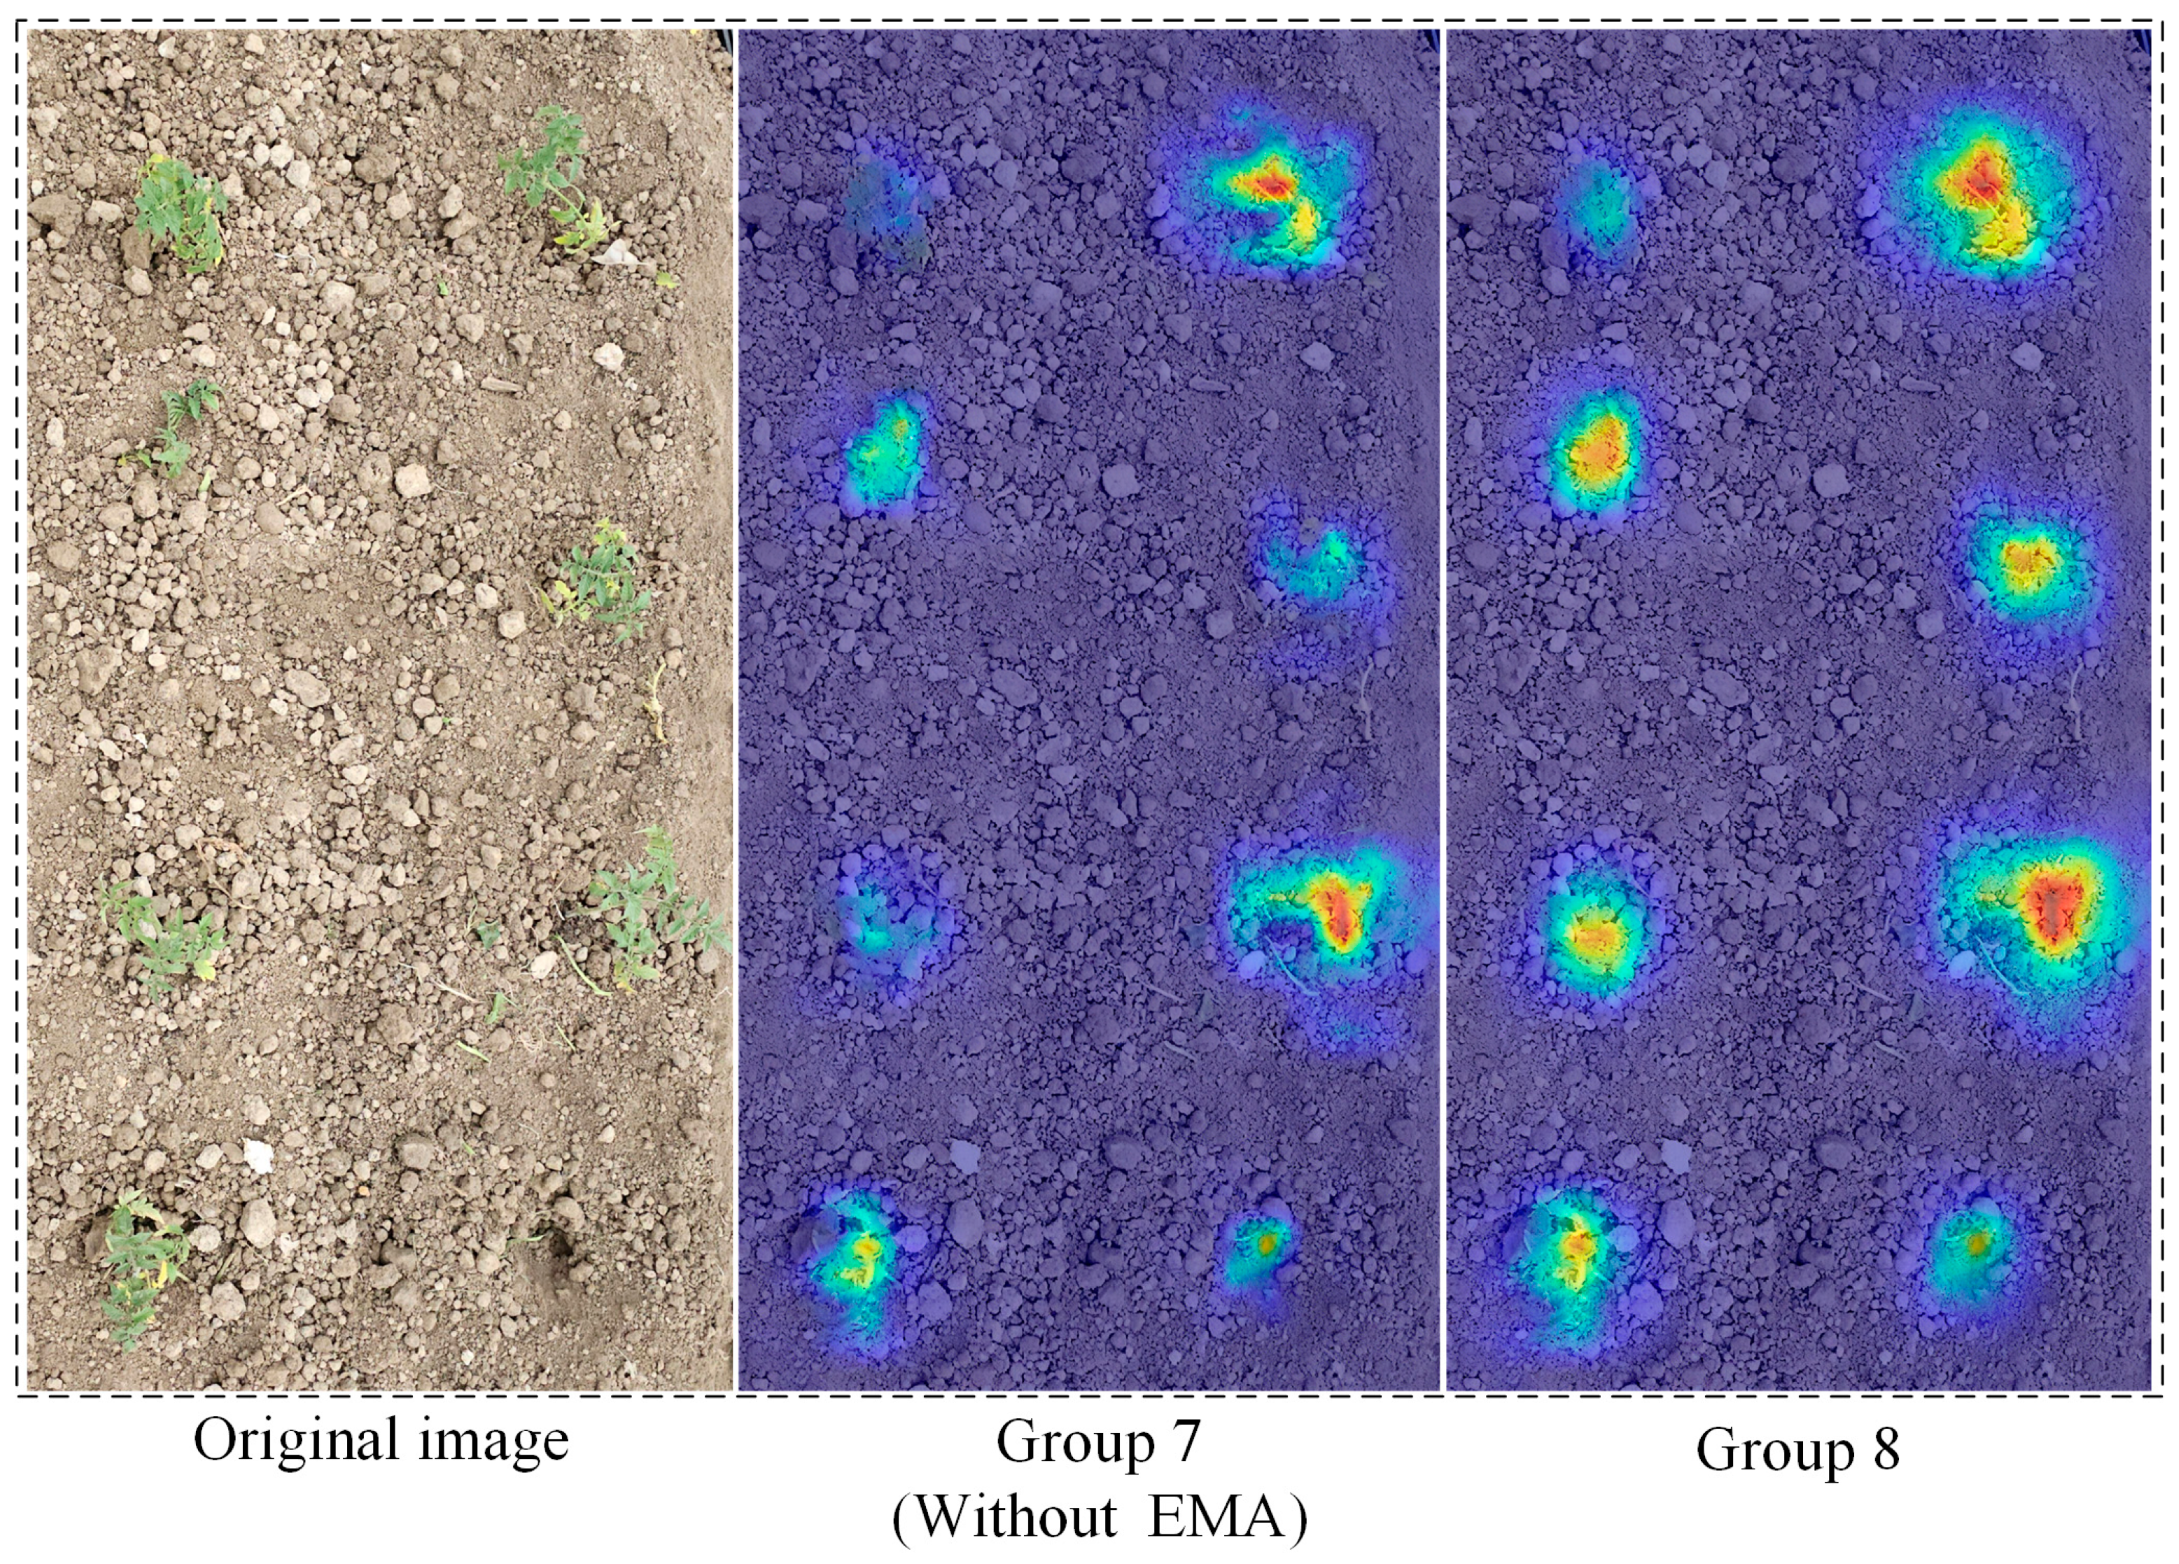
To further validate the effectiveness of the EMA attention module, heatmaps from the neck network output layer were generated for models in Groups (7) and (8), as shown in Figure 10. Initial observations revealed that the Group (7) model exhibited insufficient attention to seedling regions (lighter areas), resulting in imprecise detection of transplanted tomato seedling quality in field conditions and increased false detection rates. By contrast, the Group (8) model demonstrated higher attention focus on critical seedling features (darker regions), enabling enhanced seedling targeting. This substantially reduced false detections and missed detections, thereby improving detection accuracy. This distinct contrast demonstrates that integrating the EMA attention module into the neck network effectively mitigates field background distractions, directing the model’s focus toward key tomato seedling characteristics. Consequently, this integration elevates precision in detecting transplanted tomato seedling quality under field conditions. In summary, the implementation of the EMA attention module significantly enhances detection performance.

3.4. Comparative Experiments Among ESG-YOLO and Other Lightweight Models

The ESG-YOLO model proposed in this study demonstrates outstanding performance in both accuracy and model lightweight design. To comprehensively evaluate its advantages in tomato seedling detection, comparative experiments were conducted between ESG-YOLO and other state-of-the-art lightweight object detection models. As shown in Table 10, among lightweight models including YOLOv3-tiny, YOLOv5n, YOLOv7-tiny, and YOLOv8n, YOLOv5n exhibits superior computational efficiency with minimal network parameters, the lowest computational complexity, and the smallest model size, achieving real-time detection at 125 FPS. However, this extreme lightweight design significantly compromises detection accuracy. Comprehensive evaluation reveals that YOLOv8n achieves the optimal balance between detection precision and inference speed, thus serving as our baseline architecture for optimization. The final ESG-YOLO model achieves breakthrough performance with an mAP@0.5 of 97.4% and recall rate of 96.5%, setting new benchmarks. Notably, the model contains only 2.81 M parameters and 7.4 G FLOPs, with its model file size compressed to 5.7 MB, realizing extreme lightweight capabilities while maintaining high-precision detection. As clearly demonstrated in Table 11, ESG-YOLO outperforms YOLOv8n across three critical detection categories. Significant improvements emerged in precision and recall for “qualified seedlings,” “covered seedlings,” and “missed hills.” Specifically, the “qualified seedlings” category showed remarkable recall improvement of 4.4 and 0.9% higher average precision. For “covered seedlings,” both precision and recall increased by 1.7 and 1.1% respectively. Most notably, the “missed hills” category achieved the most substantial enhancements: while YOLOv8n attained only 88.3% average precision, ESG-YOLO reached 94% (5.7% increase), with recall surging by 11.3%, demonstrating breakthroughs in detecting this challenging category. These results conclusively validate ESG-YOLO’s superior performance across all detection tasks.
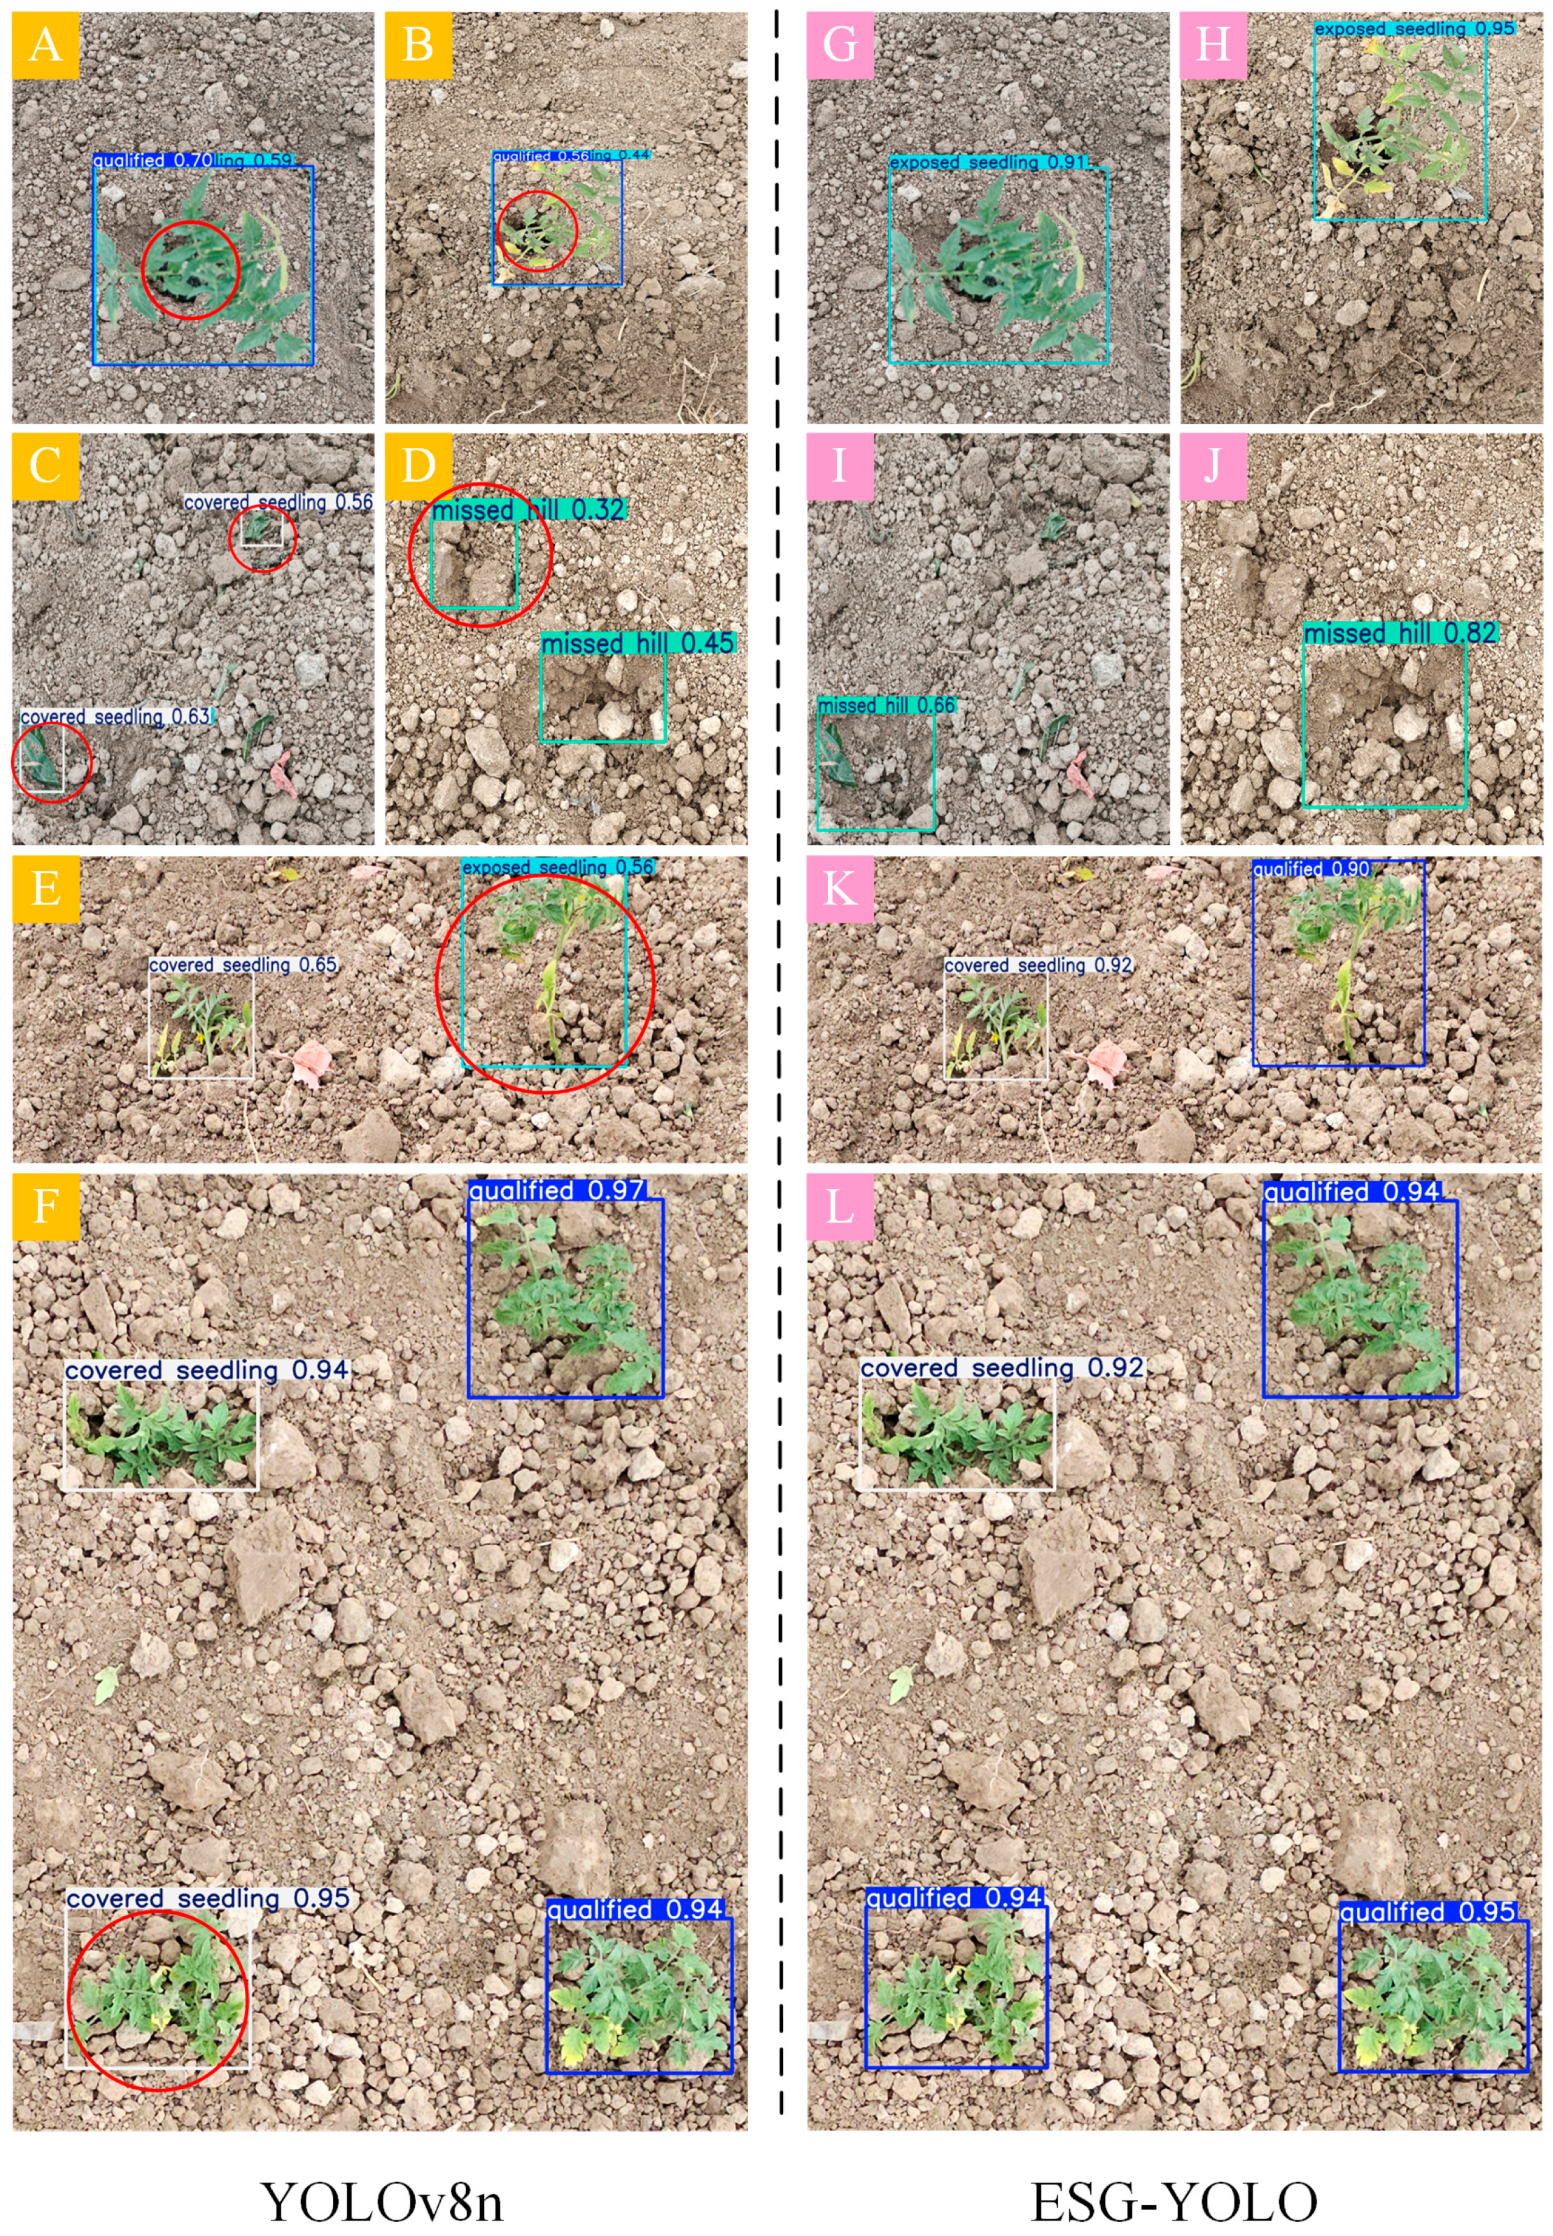
Figure 11 presents a comparative analysis of detection performance between the ESG-YOLO algorithm and the baseline model. During detection, the original model exhibited several typical misdetection cases: (1) Occlusion and Similarity Issues: As shown in Figure 11A,B, occlusion caused by overlapping tomato seedling foliage and the high color similarity between roots and soil hindered accurate differentiation between exposed and qualified seedlings. (2) Background Misidentification: Figure 11C demonstrates the baseline model mistakenly identifying background seedling leaves as “covered seedlings,” while Figure 11D shows erroneous classification of background elements as “missed hills.” (3) Morphological Interference: In Figure 11E, seedlings with excessively elongated root systems were misclassified as “exposed seedlings,” whereas Figure 11F illustrates “covered seedling” misdetection due to undersized leaves. Additionally, the baseline model underperformed in detecting small-sized seedlings, yielding low precision. The enhanced ESG-YOLO algorithm successfully addressed these detection challenges, demonstrating superior comprehensive evaluation metrics and regression performance compared to the original model.

3.5. Deployment of ESG-YOLO on NVIDIA Jetson TX2 NX

3.5.1. Introduction to NVIDIA Jetson TX2 NX

Jetson TX2 NX is an embedded development platform specifically designed for AI applications, featuring an NVIDIA Pascal architecture GPU and an Arm-based CPU. This device offers high-speed data transfer interfaces and high-capacity memory bandwidth, enabling efficient processing of deep learning algorithms and computer vision tasks while maintaining compatibility with multiple sensor input modes. With its compact design and exceptional power efficiency, this development board serves as an ideal edge computing device for running the ESG-YOLO object detection model.

3.5.2. Deploying the ESG-YOLO Model

This study focuses on developing an efficient and lightweight detection model for evaluating the quality of tomato seedling transplantation operations. To validate the practical application value of the ESG-YOLO algorithm in edge computing environments while advancing intelligent agricultural robotics technology, researchers have successfully deployed the model on the NVIDIA Jetson TX2 NX embedded platform. Detailed hardware configurations and software environment parameters are specified in the system deployment documentation presented in Table 12.
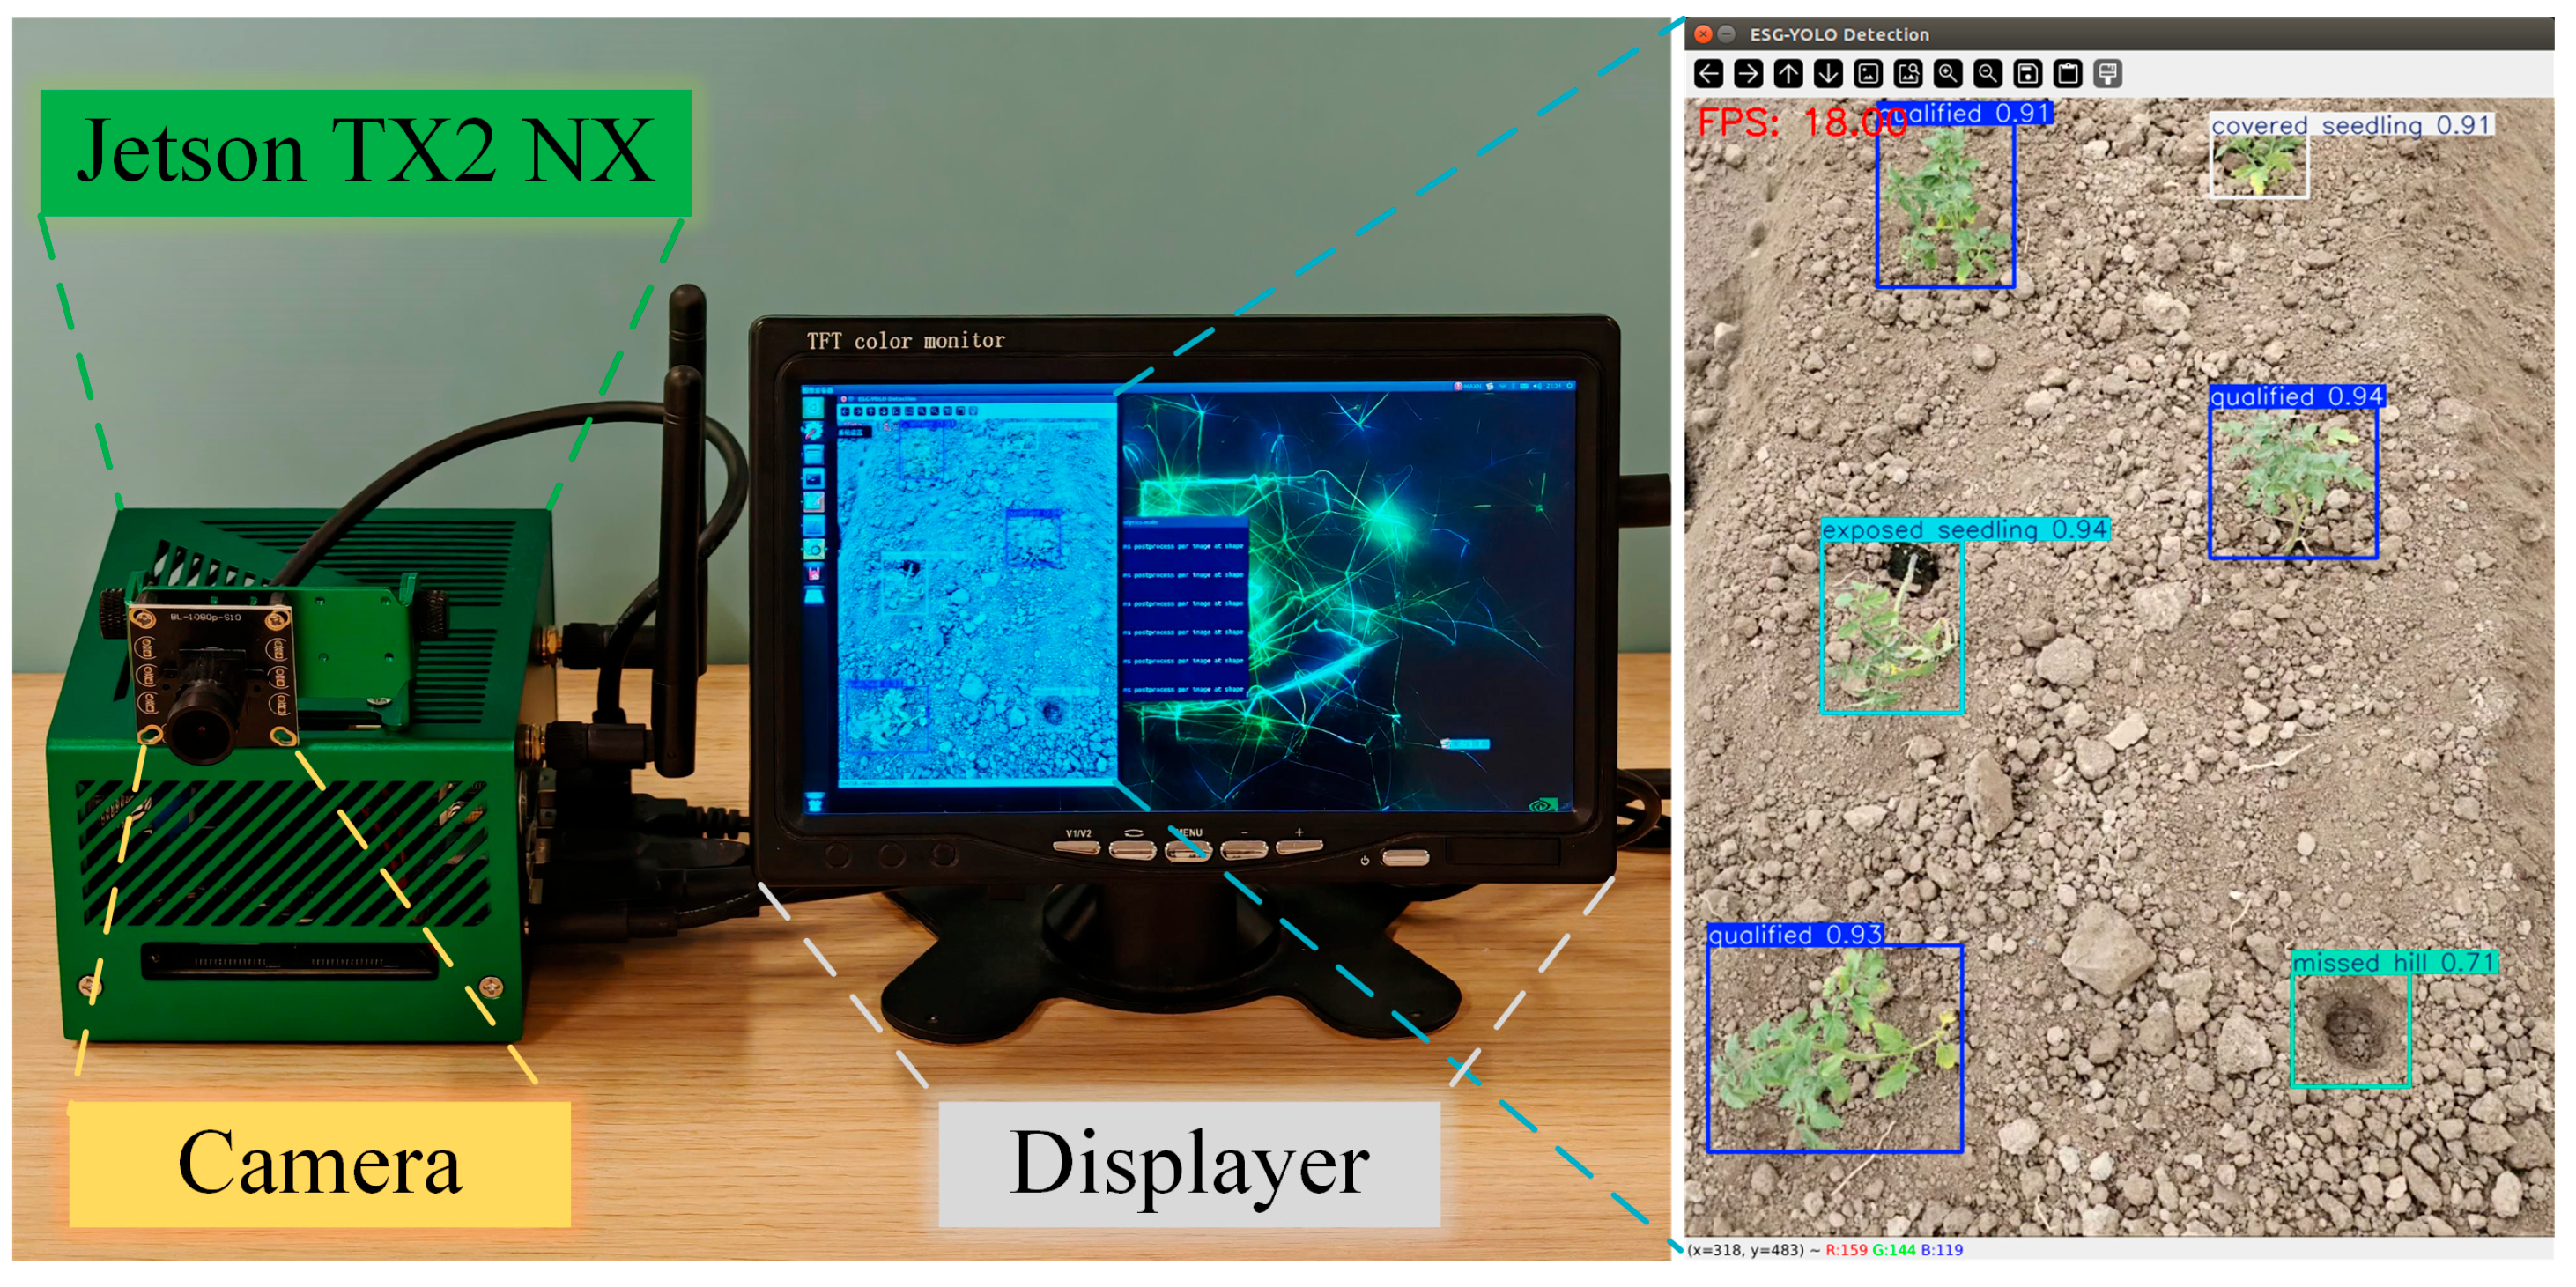
By connecting a color camera via USB interface, we successfully captured images of tomato seedlings. Subsequent experiments were conducted on the Jetson TX2 NX platform to evaluate the ESG-YOLO model, specifically examining the impact of different resolutions on model performance. The results revealed that when the input image size was set to 640 × 640 pixels, the ESG-YOLO model maintained a stable detection rate exceeding 18 FPS, demonstrating significant performance advantages over the 320 × 320 resolution. This finding aligns with established research conclusions regarding the relationship between resolution and frame rate. The deployment demonstration, detailed in Figure 12, confirms that all configurations achieved expected outcomes, providing robust support for precise tomato seedling recognition.

4. Conclusions

This study innovatively developed the ESG-YOLO model, an efficient object detection algorithm specifically designed for assessing the transplanting quality of tomato seedlings. The algorithm enables real-time detection of field-transplanted tomato seedlings, identifying four categories: qualified seedlings, exposed seedlings, covered seedlings, and missed hills. The model has been successfully adapted to edge computing devices, achieving efficient operation in field environments.
(1)
To address the challenges of miniature tomato seedlings and the similar characteristics between root balls and soil in detection scenarios, an EMA attention module was embedded into the model’s neck network. This enhancement allows more precise focus on critical regions of seedlings, providing finer pixel-level attention for deep feature learning.
(2)
For constructing a lightweight deployable model, the YOLOv8 neck module was reconstructed using a Slim-neck architecture. This modification significantly reduces computational complexity while maintaining high-precision recognition capabilities for transplanting quality assessment.
(3)
The study replaced the original CIoU loss function with the GIoU loss function, substantially improving localization accuracy for small-scale targets and accelerating model convergence.
(4)
Ablation experiments demonstrate breakthrough progress in the ESG-YOLO model. The final mAP@0.5 reached 97.4%, representing a 2.2 percentage point increase in average precision for seedling detection compared to the baseline model. Recall improved by 4.2%, while model parameters decreased by 7%, computational load reduced by 10%, and model size compressed by 8%.
(5)
Field validation on the NVIDIA Jetson TX2 NX embedded platform achieved a stable detection rate exceeding 18 FPS, fully meeting real-time application requirements for transplanting quality assessment.
Future research will expand the model’s applicability boundaries to cover more vegetable seedling varieties, thereby enhancing the environmental adaptability of agricultural intelligence systems. This solution addresses the critical limitations of conventional agricultural drones’ high cost and the “long-range but low-resolution” observation challenge by integrating mobile terminal data acquisition with edge computing. Particularly in seedling transplanting operations, our system enables precise identification and automated handling. We are currently developing a next-generation intelligent transplanting device that will achieve simultaneous real-time quality assessment of transplanted seedlings through deep integration of vision detection algorithms into the equipment control system. This technological convergence is expected to drive an automation revolution in transplanting and replanting operations. Such innovations will effectively support global precision agriculture development, playing crucial roles in enhancing production efficiency, reducing resource consumption, and ensuring food security.

Author Contributions

Conceptualization, Z.D.; methodology, Z.D., X.W. and C.W.; software, Z.D.; validation, Z.Z. and Y.G.; formal analysis, Z.D.; investigation, X.W. and Z.Z.; resources, Z.D., C.W. and Y.G.; data curation, C.W. and Z.Z.; writing—original draft preparation, Z.D.; writing—review and editing, X.W., C.W. and S.Z.; visualization, Z.D., X.W. and C.W.; supervision, X.W.; project administration, X.W. and S.Z.; funding acquisition, S.Z. All authors have read and agreed to the published version of the manuscript.

Funding

This research was supported by the Fujian Provincial Natural Science Foundation Project (Grant No.: 2024J01420).

Data Availability Statement

All data are presented in this article in the form of figures and tables.

Acknowledgments

The authors would like to acknowledge the College of Mechanical Electronic Engineering, Fujian Agriculture and Forestry University.

Conflicts of Interest

The authors declare no conflicts of interest.

References

  1. Wang, H.; He, J.; Aziz, N.; Wang, Y. Spatial Distribution and Driving Forces of the Vegetable Industry in China. Land 2022, 11, 981. [Google Scholar] [CrossRef]
  2. Cui, Z.; Guan, C.; Yang, Y.; Gao, Q.; Chen, Y.; Xiao, T. Research status of vegetable mechanical transplanting technology and equipment. J. Chin. Agric. Mech. 2020, 41, 85–92. [Google Scholar] [CrossRef]
  3. Cui, Z.; Guan, C.; Xu, T.; Fu, J.; Chen, Y.; Yang, Y.; Gao, Q. Design and experiment of transplanting machine for cabbage substrate block seedlings. INMATEH Agric. Eng. 2021, 64, 375–384. [Google Scholar] [CrossRef]
  4. Yang, R.; Chen, M.; Lu, X.; He, Y.; Li, Y.; Xu, M.; Li, M.; Huang, W.; Liu, F. Integrating UAV remote sensing and semi-supervised learning for early-stage maize seedling monitoring and geolocation. Plant Phenomics 2025, 7, 100011. [Google Scholar] [CrossRef]
  5. Wu, S.; Ma, X.; Jin, Y.; Yang, J.; Zhang, W.; Zhang, H.; Wang, H.; Chen, Y.; Lin, C.; Qi, L. A novel method for detecting missing seedlings based on UAV images and rice transplanter operation information. Comput. Electron. Agric. 2025, 229, 109789. [Google Scholar] [CrossRef]
  6. Gao, J.; Tan, F.; Cui, J.; Hou, Z. Unmanned aerial vehicle image detection of maize-YOLOv8n seedling leakage. Front. Plant Sci. 2025, 16, 1569229. [Google Scholar] [CrossRef]
  7. Kamilaris, A.; Prenafeta-Boldu, F.X. Deep learning in agriculture: A survey. Comput. Electron. Agric. 2018, 147, 70–90. [Google Scholar] [CrossRef]
  8. Dalal, M.; Mittal, P. A Systematic Review of Deep Learning-Based Object Detection in Agriculture: Methods, Challenges, and Future Directions. Comput. Mater. Contin. 2025, 84, 57–91. [Google Scholar] [CrossRef]
  9. Liao, J.; Wang, Y.; Yin, J.; Liu, L.; Zhang, S.; Zhu, D. Segmentation of Rice Seedlings Using the YCrCb Color Space and an Improved Otsu Method. Agronomy 2018, 8, 269. [Google Scholar] [CrossRef]
  10. Fang, X.; Zhen, T.; Li, Z. Lightweight Multiscale CNN Model for Wheat Disease Detection. Appl. Sci. 2023, 13, 5801. [Google Scholar] [CrossRef]
  11. Latif, G.; Abdelhamid, S.E.; Mallouhy, R.E.; Alghazo, J.; Kazimi, Z.A. Deep Learning Utilization in Agriculture: Detection of Rice Plant Diseases Using an Improved CNN Model. Plants 2022, 11, 2230. [Google Scholar] [CrossRef]
  12. Li, M.-W.; Chan, Y.-K.; Yu, S.-S. Use of CNN for Water Stress Identification in Rice Fields Using Thermal Imagery. Appl. Sci. 2023, 13, 5423. [Google Scholar] [CrossRef]
  13. Li, S.; Li, K.; Qiao, Y.; Zhang, L. A multi-scale cucumber disease detection method in natural scenes based on YOLOv5. Comput. Electron. Agric. 2022, 202, 107363. [Google Scholar] [CrossRef]
  14. Zhang, H.; Fu, Z.; Han, W.; Yang, G.; Niu, D.; Zhou, X. Detection method of maize seedlings number based on improved YOLO. Trans. Chin. Soc. Agric. Mach. 2021, 52, 221–229. [Google Scholar] [CrossRef]
  15. Quan, L.; Feng, H.; Lv, Y.; Wang, Q.; Zhang, C.; Liu, J.; Yuan, Z. Maize seedling detection under different growth stages and complex field environments based on an improved Faster R-CNN. Biosyst. Eng. 2019, 184, 1–23. [Google Scholar] [CrossRef]
  16. Pan, Y.; Zhu, N.; Ding, L.; Li, X.; Goh, H.-H.; Han, C.; Zhang, M. Identification and Counting of Sugarcane Seedlings in the Field Using Improved Faster R-CNN. Remote Sens. 2022, 14, 5846. [Google Scholar] [CrossRef]
  17. Sun, Z.; Zhang, C.; Ge, L.; Zhang, M.; Li, W.; Tan, Y. Image detection method for broccoli seedlings in field based on Faster R-CNN. Trans. Chin. Soc. Agric. Mach. 2019, 50, 216–221. [Google Scholar] [CrossRef]
  18. Zhang, T.; Zhou, J.; Liu, W.; Yue, R.; Yao, M.; Shi, J.; Hu, J. Seedling-YOLO: High-Efficiency Target Detection Algorithm for Field Broccoli Seedling Transplanting Quality Based on YOLOv7-Tiny. Agronomy 2024, 14, 931. [Google Scholar] [CrossRef]
  19. Wu, X.; Guo, W.; Zhu, Y.; Zhu, H.; Wu, H. Transplant status detection algorithm of cabbage in the field based on improved YOLOv8s. Smart Agric. 2024, 6, 107–117. [Google Scholar] [CrossRef]
  20. Zheng, H.; Zhou, L.; Wang, Q. Research on detection method of potato seedling based on YOLO-PS. J. Chin. Agric. Mech. 2024, 45, 245–250. [Google Scholar] [CrossRef]
  21. Liu, S.; Zhang, W.; Hu, X.; Wang, L.; Song, Z.; Wang, J. Rice planting machinery operation quality detection based on Improved YOLO v8s. Trans. Chin. Soc. Agric. Mach. 2024, 55, 61–70. [Google Scholar] [CrossRef]
  22. Cui, J.; Zheng, H.; Zeng, Z.; Yang, Y.; Ma, R.; Tian, Y.; Tan, J.; Xiao, F.; Long, Q. Real-time missing seedling counting in paddy fields based on lightweight network and tracking-by-detection algorithm. Comput. Electron. Agric. 2023, 212, 108045. [Google Scholar] [CrossRef]
  23. Liu, Z.; Wang, X.; Zheng, W.; Lv, Z.; Zhang, W. Design of a Sweet Potato Transplanter Based on a Robot Arm. Appl. Sci. 2021, 11, 9349. [Google Scholar] [CrossRef]
  24. Li, Y.; Zhu, Y.; Li, S.; Liu, P. The Extraction Method of Navigation Line for Cuttage and Film Covering Multi-Functional Machine for Low Tunnels. Inventions 2022, 7, 113. [Google Scholar] [CrossRef]
  25. Perugachi-Diaz, Y.; Tomczak, J.; Bhulai, S. Deep learning for white cabbage seedling prediction. Comput. Electron. Agric. 2021, 184, 106059. [Google Scholar] [CrossRef]
  26. Li, Z.; Li, Y.; Yang, Y.; Guo, R.; Yang, J.; Yue, J.; Wang, Y. A high-precision detection method of hydroponic lettuce seedlings status based on improved Faster RCNN. Comput. Electron. Agric. 2021, 182, 106054. [Google Scholar] [CrossRef]
  27. He, L.; Li, Y.; An, X.; Yao, H. Real-time monitoring system for evaluating the operational quality of rice transplanters. Comput. Electron. Agric. 2025, 234, 110204. [Google Scholar] [CrossRef]
  28. Wu, T.; Zhang, Q.; Wu, J.; Liu, Q.; Su, J.; Li, H. An improved YOLOv5s model for effectively predict sugarcane seed replenishment positions verified by a field re-seeding robot. Comput. Electron. Agric. 2023, 214, 108280. [Google Scholar] [CrossRef]
  29. Gu, Z.; He, D.; Huang, J.; Chen, J.; Wu, X.; Huang, B.; Dong, T.; Yang, Q.; Li, H. Simultaneous detection of fruits and fruiting stems in mango using improved YOLOv8 model deployed by edge device. Comput. Electron. Agric. 2024, 227, 109512. [Google Scholar] [CrossRef]
  30. Ji, W.; Pan, Y.; Xu, B.; Wang, J. A Real-Time Apple Targets Detection Method for Picking Robot Based on ShufflenetV2-YOLOX. Agriculture 2022, 12, 856. [Google Scholar] [CrossRef]
  31. Huang, X.; Chen, W.; Hu, Z.; Chen, L. An AI Edge Computing-Based Robotic Arm Automated Guided Vehicle System for Harvesting Pitaya. In Proceedings of the 2022 IEEE International Conference on Consumer Electronics (ICCE), Las Vegas, NV, USA, 7–9 January 2022. [Google Scholar] [CrossRef]
  32. Zhang, X.; Jing, M.; Yuan, Y.; Yin, Y.; Li, K.; Wang, C. Tomato seedling classification detection using improved YOLOv3-Tiny. Trans. Chin. Soc. Agric. Eng. 2022, 38, 221–229. [Google Scholar] [CrossRef]
  33. Zhao, X.; Fang, J.; Zhao, Y. Tomato Potting Seedling Classification and Recognition Model Based on Improved YOLOv5s. Sci. Technol. Eng. 2024, 24, 11774–11785. [Google Scholar] [CrossRef]
  34. Jing, M.; Kong, D.; Zhang, X.; Wang, P.; Yuan, Y.; Feng, S.; Li, J. A Study on Tomato Seedling Grading Detection Based on Deep Learning. J. Hebei Agric. Univ. 2023, 46, 118–124. [Google Scholar] [CrossRef]
  35. Vavrina, C.; Shuler, K.; Gilreath, P. Evaluating the Impact of Transplanting Depth on Bell Pepper Growth and Yield. Hort Sci. 1994, 29, 1133–1135. [Google Scholar] [CrossRef]
  36. Wang, Y.; He, Z.; Wang, J.; Wu, C.; Yu, G.; Tang, H. Experiment on transplanting performance of automatic vegetable pot seedling transplanter for dry land. Trans. Chin. Soc. Agric. Eng. 2018, 34, 19–25. [Google Scholar] [CrossRef]
  37. Ouyang, D.; Su, H.; Zhang, G.; Luo, M.; Guo, H.; Zhan, J.; Huang, Z. Efficient Multi-Scale Attention Module with Cross-Spatial Learning. In Proceedings of the ICASSP 2023—2023 IEEE International Conference on Acoustics, Speech and Signal Processing (ICASSP), Rhodes Island, Greece, 4–10 June 2023. [Google Scholar] [CrossRef]
  38. Li, H.; Li, J.; Wei, H.; Liu, Z.; Zhan, Z.; Ren, Q. Slim-neck by GSConv: A lightweight-design for real-time detector architectures. J. Real Time Image Process. 2024, 21, 62. [Google Scholar] [CrossRef]
  39. Rezatofighi, H.; Tsoi, N.; Gwak, J.; Sadeghian, A.; Reid, I.; Savarese, S. Generalized Intersection Over Union: A Metric and a Loss for Bounding Box Regression. In Proceedings of the 2019 IEEE/CVF Conference on Computer Vision and Pattern Recognition (CVPR), Long Beach, CA, USA, 15–20 June 2019. [Google Scholar] [CrossRef]
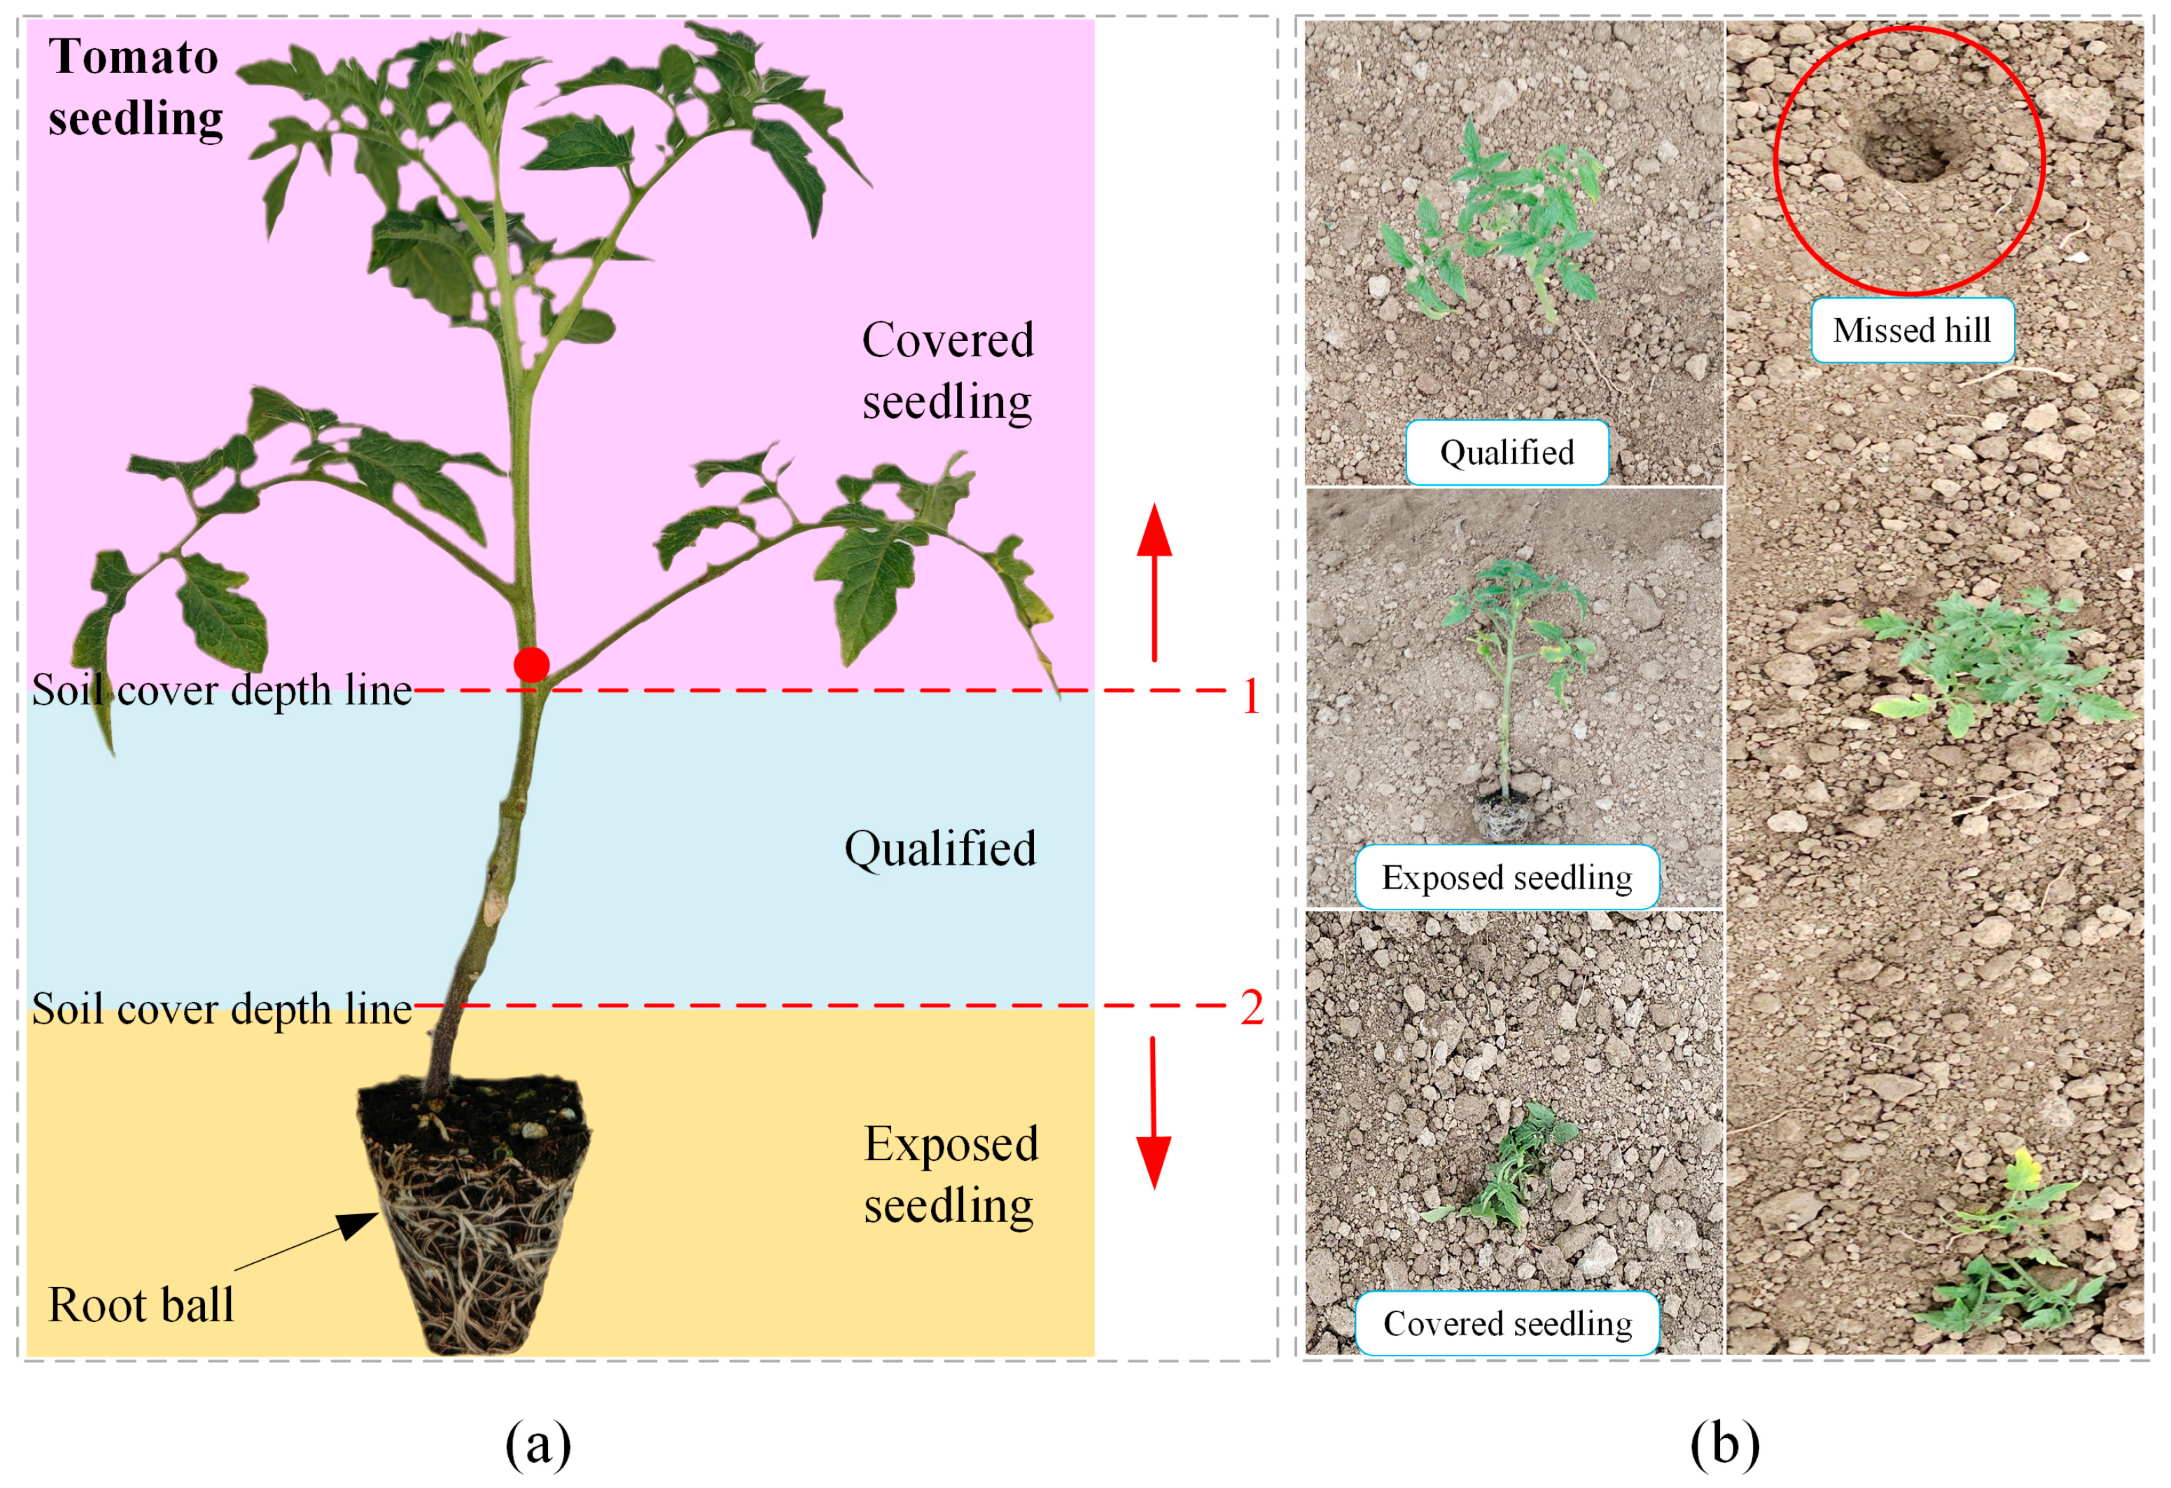
Figure 1. Evaluation criteria for tomato seedling planting quality grading. Figure 1 illustrates the grading evaluation criteria for tomato seedling planting quality, comprising two key components. The left diagram (a) details the determination method for soil coverage depth, demarcating three coverage status zones using two defined critical lines (dashed line 1 and dashed line 2): (1) Covered seedling: Soil surface exceeds the upper critical line; (2) Exposed seedling: Soil surface falls below the lower critical line; (3) Qualified seedling: Soil surface between the two critical lines. The right diagram (b) visually demonstrates seedling differences under varying coverage states through typical examples, providing a visual reference for field transplanting quality assessment. Arrow annotations clearly indicate the determination criteria for each critical line: Upward arrow: Indicates coverage exceeding the upper critical value. Downward arrow: Represents exposure below the lower critical value.
Agronomy 15 02088 g001
Figure 2. Overall research framework of this study.
Agronomy 15 02088 g002
Figure 3. Sample images from the tomato seedling dataset: (a) Single seedling close-up view; (b) 90° angle view; (c) 45° angle view.
Agronomy 15 02088 g003
Figure 4. Data augmentation images: (a) Original image; (b) Brightness adjustment; (c) Noise addition; (d) Random rotation; (e) Vertical mirroring; (f) Random translation.
Agronomy 15 02088 g004
Figure 5. ESG-YOLO network structure diagram.
Agronomy 15 02088 g005
Figure 6. EMA Network structure diagram.
Agronomy 15 02088 g006
Figure 7. Structural diagram of the GSConv module. DWConv: Depthwise Convolution; Shuffle: Channel Shuffle.
Agronomy 15 02088 g007
Figure 8. (A) GS bottleneck module; (B) VOVGSCSP module. GSConv: GROUP Shuffle Convolution. GS bottleneck: Group Shuffle Bottleneck network.
Agronomy 15 02088 g008
Figure 9. Illustration of the GIoU loss function. The green bounding box represents A. The red bounding box represents B. The blue bounding box represents C (denoting the minimum enclosing bounding box for A B ).
Agronomy 15 02088 g009
Figure 10. Comparison of heatmaps from the neck network output layer of Group (7) and Group (8) models.
Agronomy 15 02088 g010
Figure 11. Comparative analysis of detection performance between the ESG-YOLO model and YOLOv8n. Note: Panels (AF) illustrate the detection results of the baseline model YOLOv8n, while panels (GL) present the outcomes of the improved ESG-YOLO model. Red circles (○) in the figure indicate erroneous detections.
Agronomy 15 02088 g011
Figure 12. Deployment diagram of the ESG-YOLO model on the Jetson TX2 NX development board.
Agronomy 15 02088 g012
Table 1. Composition of the tomato seedling dataset.
DatasetClassification of Tomato Seedlings After PlantingTotal
Qualified
Seedling
Exposed
Seedling
Covered
Seedling
Missed Hill
Training set18601674171618487098
Validation set86838485338
Detection set45394244170
Total19911796184219777606
Table 2. Hardware configuration and experimental environment.
HardwareConfigurationToolVersion
SystemWindows 11Python3.10.16
CPUIntel i5-12600 KFPyTorch2.5.1 + cu124
GPURTX4070-super (12 GB)Torchvision0.20.1 + cu124
RAM32 GBTorchaudio2.5.1 + cu124
Table 3. Training hyperparameter settings.
Training ParameterValue
weightyolov8n.pt
batch-size32
epochs100
ampTrue
workers8
imgsz640 × 640
optimizerAdam
seed0
cos-lrFalse
lr00.001
lrf0.01
momentum0.937
weight_decay0.0005
mosaic1.0
Table 4. Model performance evaluation metrics.
Evaluation MetricFull NameComputational Formula
PPrecision rate P = T P T P + F P × 100 %
RRecall rate R = T P T P + F N × 100 %
APAverage Precision AP = 0 1 P R d R
Note: TP denotes True Positive (correctly detected state of tomato seedlings), FP indicates False Positive (erroneously detected state of tomato seedlings), and FN represents False Negative (undetected but actually existing state of tomato seedlings).
Table 5. Evaluation metrics for model complexity.
Evaluation MetricFull nameComputational Formula
Parameters (Conv)Parameters in convolutional layers C o u t × K × K × C i n + 1
Parameters (FC)Parameters in fully connected layers n i n × n o u t + n o u t
FLOPs (Conv)Floating-point operations for convolution 2 × C i n × K 2 1 × H × W × C o u t
FLOPs (Pool)Floating-point operations for pooling H S × W S × C o u t
FLOPs (FC)Floating-point operations for fully connected layers n i n × n o u t + n o u t
Size (MB)Model storage size p a r a m e t e r s × 4 1024 2
FPSFrames processed per second 1000 T o t a l   inference   time   ( ms )
Note: C i n denotes the number of channels in the input feature map, K represents the kernel size, C o u t indicates the number of channels in the output feature map, and H × W signifies the spatial dimensions of the output feature map. S corresponds to the convolution stride. n i n refers to the number of input nodes, while n o u t represents the number of output nodes. Total inference time = Pre-processing time + Inference time + Post-processing time.
Table 6. Comparative experiments of multiple attention modules.
GroupPrecision
(%)
Recall
(%)
mAP@0.5
(%)
Parameters
(M)
FLOPs
(G)
Size
(MB)
FPS
(BS = 1)
X + EMA90.096.597.42.817.45.786
X + SE88.495.197.22.817.45.787
X + CBAM89.895.396.82.827.45.886
X + CA87.795.897.22.947.55.985
X + ECA87.994.997.12.807.45.688
X + SimAM88.394.396.62.807.45.688
Note: X represents a component of the ESG-YOLO model after the removal of its attention modules. BS: batch size. @0.5 indicates the Intersection over Union (IoU) threshold of 0.5.
Table 7. Comparative experiments on multiple loss functions.
GroupPrecision
(%)
Recall
(%)
mAP@0.5
(%)
FPS
(BS = 1)
CIoU90.088.895.181
DIoU90.292.596.481
EIoU89.293.096.563
SIoU92.191.895.984
GIoU90.096.597.486
Table 8. Ablation experiment of the ESG-YOLO model.
CaseEMAS-NGIOUPrecision
(%)
Recall
(%)
mAP@0.5
(%)
Parameters
(M)
FLOPs
(G)
Size
(MB)
FPS
(BS = 1)
1×××90.692.395.23.018.26.2115
2××92.391.695.93.028.36.3106
3××89.393.295.92.807.45.682
4××88.990.096.43.018.26.2118
5×90.088.895.12.817.45.781
6×92.890.797.03.028.36.3110
7×88.191.594.82.807.45.684
890.096.597.42.817.45.786
Table 9. Neck network complexity comparison between Group 6 and Group 8 models.
Neck Network of Group 6Neck Network of Group 8
LayersFLOPs/GParametersLayersFLOPs/GParameters
Upsample0.000Upsample0.000
Concat0.000Concat0.000
C2f0.48148,224VoVGSCSP0.30129,600
Upsample0.000Upsample0.000
Concat0.000Concat0.000
C2f0.4837,248VoVGSCSP0.3133,056
Conv0.1236,992GSConv0.0619,360
Concat0.000Concat0.000
C2f0.40123,648VoVGSCSP0.22105,024
Conv0.12147,712GSConv0.0675,584
Concat0.000Concat0.000
C2f0.40493,056VoVGSCSP0.22414,848
EMA0.1010,368EMA0.1010,368
Total2.10997,248Total1.27787,840
Table 10. Comparative experiment of ESG-YOLO against other state-of-the-art object detection models.
ModelPrecision
(%)
Recall
(%)
mAP@0.5
(%)
Parameter
(M)
FLOPs
(G)
Size
(MB)
FPS
(BS = 1)
YOLOv3-tiny81.985.288.18.7012.917.469
YOLOv5n87.488.990.22.507.25.1125
YOLOv7-tiny88.889.691.76.0513.212.475
YOLOv8n90.692.395.23.018.26.2115
ESG-YOLO90.096.597.42.817.45.786
Table 11. Precision and recall rates of ESG-YOLO vs. YOLOv8n across four tomato seedling transplanting quality categories.
SetYOLOv8nESG-YOLO
PRAPPRAP
Qualified seedling94.8%92.5%98.0%94.8%96.9%98.9%
Exposed seedling92.2%98.8%98.4%90.7%98.8%98.8%
Covered seedling82.6%97.7%96.0%81.2%98.8%97.7%
Missed hill92.9%80.2%88.3%93.3%91.5%94.0%
Table 12. Deployment environment for NVIDIA Jetson TX2 NX.
Hardware/Software EnvironmentFull Name
Development boardNVIDIA Jetson TX2 NX
Operating systemUbuntu 18.04
Python3.8.20
Torch1.11.0
Torchvision0.12.0
CUDA10.2.300
CuDNN8.2.1.32
TensorRT8.2.1.9
Ultralytics8.2.50
Timm1.0.15
Disclaimer/Publisher’s Note: The statements, opinions and data contained in all publications are solely those of the individual author(s) and contributor(s) and not of MDPI and/or the editor(s). MDPI and/or the editor(s) disclaim responsibility for any injury to people or property resulting from any ideas, methods, instructions or products referred to in the content.