Article

Effects of Glucose and Its Derivatives on Growth and Nutrient Absorption in Wheat

State Key Laboratory of Efficient Utilization of Arable Land in China, Key Laboratory of Plant Nutrition and Fertilizer, Ministry of Agriculture and Rural Affairs, Institute of Agricultural Resources and Regional Planning, Chinese Academy of Agricultural Sciences, Beijing 100081, China
*
Author to whom correspondence should be addressed.
These authors contributed equally to this work.
Agronomy 2025, 15(9), 2054; https://doi.org/10.3390/agronomy15092054
Submission received: 4 July 2025 / Revised: 17 August 2025 / Accepted: 25 August 2025 / Published: 26 August 2025
(This article belongs to the Section Soil and Plant Nutrition)

Abstract

Glucose and its derivatives serve as key carbon sources and signaling molecules in plants, yet how structurally distinct carbohydrates differentially influence crop growth remains unclear. Our study employed glucose (Glc, -CHO), sorbitol (Sbt, -OH), gluconic acid (GlcA, -COOH), and glucuronic acid (GroA, -COOH; -CHO) as treatment factors, thereby maximizing variation in oxygen-containing functional groups while keeping the C6 carbon backbone constant. A completely randomized hydroponic experiment was established with four concentration levels (0, 10, 25, and 50 mg L−1) to systematically elucidate how glucose and its derivatives influence wheat growth and nutrient uptake, and to clarify the role of functional group chemistry in the performance of carbon-based bio-stimulants. All carbohydrate treatments significantly improved wheat dry matter (17.50–35.00%) and nutrient uptake (N: 17.12–32.18%, P: 21.73–36.97%, K: 12.28–30.51%) compared with the control, primarily by promoting root vigor and nutrient absorption. Among the four carbohydrates, Glc showed the greatest stimulatory effect, significantly enhancing root vigor. Sbt primarily facilitated root elongation and surface area, whereas GlcA and GroA were slightly less effective but still promoted nutrient uptake. The optimal concentrations were 10 mg L−1 for Glc and 25 mg L−1 for its derivatives. These findings provide practical guidance for enhancing nutrient use efficiency and crop productivity using structurally targeted carbohydrates for sustainable agriculture.

1. Introduction

Carbohydrates are widely applied in agricultural production as exogenous regulators to boost plant growth [1,2,3] and crop yield [4]. Glucose, a simple yet highly reactive carbohydrate, plays a fundamental role in plant growth both as a nutrient and a signaling molecule [5,6]. It regulates a range of metabolic processes, including root growth, photosynthesis, flowering, and senescence [1]. Glucose derivatives in which specific atoms or groups within glucose are substituted can likewise regulate plant metabolism [7] and exhibit properties similar to those of glucose, including high bioactivity, biocompatibility, biodegradability, and chelating capacity [8]. Some derivatives have demonstrated higher solubility, stability, antibacterial properties, and antioxidant activity than glucose [9], suggesting that structural differences can significantly affect their function [10]. For example, sugar alcohols (e.g., sorbitol) enhance osmotic potential and improve crop stress resistance, which is attributed to their multiple hydroxyl groups (-OH) [11]. Sugar acids (e.g., gluconic acid and glucuronic acid) feature carboxyl groups (-COOH), granting negative charges that enable cation chelation [12]. These advances create new opportunities for developing structure-tailored, carbon-based bio-stimulants; however, comprehensive and systematic evaluations of the efficacy of different glucose derivatives are still lacking.
Exogenous application of glucose has been shown to markedly enhance crop biomass and nutrient uptake [13,14]. The agronomic effects of glucose derivatives are determined by the oxygen-containing functional groups they carry [15,16]. Aldehyde groups (-CHO) can serve as electron acceptors or donors in respiratory pathways and supply carbon skeletons for auxin biosynthesis, thereby rapidly modulating root branching and C-N metabolism [17]. And unsaturated carbonyls additionally form covalent adducts with protein thiols to trigger defense signaling [18]. However, CHO high reactivity may induce excessive reactive oxygen species (ROS) and dose-dependent inhibition of photosynthesis [19]. Hydroxyl groups (-OH) establish extensive hydrogen-bond networks with water, elevate cellular water potential, and stabilize membranes, conferring drought and salinity tolerance [20]; their hydrogen-donating capacity underlies radical-scavenging activity, and polyols containing only -OH (e.g., sorbitol) have been shown to facilitate long-distance phloem transport of nitrate and promote chlorophyll synthesis [21]. Carboxyl groups (-COOH) dissociate to yield negatively charged species that chelate Fe3+, Zn2+, and other cations while buffering rhizosphere pH, thereby increasing micronutrient bioavailability [22]. Gluconic acid [23] and glucuronic acid [24] have also been shown to enhance plant physiological processes and root growth. Hence, the functional group configuration is the principal chemical determinant of how carbohydrate-based bio-stimulants act. Yet most studies address a single carbohydrate, and systematic comparisons of -OH, -CHO, and -COOH dominated derivatives within one crop system are lacking, limiting mechanistic insight and constraining the rational deployment of glucose derivatives in sustainable agriculture.
Carbohydrate concentration is a key factor that influences physiological effects on crop growth. Previous studies have reported that glucose concentrations of 1%, 3%, and 5% have a biphasic effect on Arabidopsis roots, with root length and lateral root number peaking at 3%, but declining at higher levels [5]. By contrast, Ma et al. found that glucose enhanced root and stem biomass, as well as nitrogen uptake in pakchoi, only when applied at concentrations below 50 μmol [25]. These studies [5,25] suggested that optimal glucose concentration varies widely across species and growth conditions. In general, high carbohydrate concentrations tend to produce dose-dependent inhibitory effects, whereas lower concentrations more effectively stimulate photosynthesis, root development, and flowering [26]. In addition, the optimal concentration also depends on the carbohydrate types. Gibson [1] observed that 0.3 M glucose promoted lateral root formation but inhibited seed germination, whereas sorbitol at the same concentration had minimal effects, and 3-O-methylglucose delayed germination at just 84 mmol. Similarly, Mahdy et al. [27] found that 30 mg L−1 glucose promoted banana organ proliferation, whereas sorbitol inhibited growth at all tested concentrations. However, the mechanisms by which the concentration and structural specificity of glucose and its derivatives jointly influence plant development remain unclear. Addressing this gap is essential to optimizing carbohydrate-based growth strategies in agriculture.
To isolate functional-group effects on the same C6 backbone, we selected glucose, sorbitol, gluconic acid, and glucuronic acid, representing -CHO, poly-OH, -COOH, and -COOH + -CHO structures, respectively. A completely randomized hydroponic experiment was conducted to quantify their differential impacts on wheat growth and nutrient uptake at different concentrations, thereby elucidating how distinct functional groups modulate the bio-stimulant activity of carbohydrate derivatives.

2. Materials and Methods

2.1. Plant Growth and Experimental Design

Wheat seeds (Triticum aestivum, var. Jimai 22) were surface sterilized in 75% alcohol for 10 min, washed, and soaked in distilled water for 24 h. Afterward, the seeds were sown in a culture dish with distilled water and pregerminated in an incubator (dark, 25 °C), and the distilled water was changed every two days. After 6 days of incubation, wheat seedlings of uniform growth were selected, and their endosperm was removed, followed by transferring seedlings into black hydroponic boxes (L12 cm × W11 cm × H8 cm, 6 planting holes, 4 plants per hole) containing half-strength Hoagland nutrient solution whose formula was in accordance with Jing et al. [22]. The seedlings were allowed to acclimate for two days to facilitate adaptation to the new environment and to minimize transplant-induced stress responses.
The glucose (Glc), sorbitol (Sbt), and gluconic acid (GlcA)were purchased from Sinopharm Chemical Reagent Co., Ltd. (Shanghai, China). The glucuronic acid (GroA) was purchased from Shanghai Macklin Biochemical Co., Ltd. (Shanghai, China). The solution was substituted with full-strength Hoagland nutrient solution containing either Glc, Sbt, GlcA, or GroA at different concentrations. We chose 10, 25, and 50 mg L−1 as treatment concentrations because this range lies within the physiological “safe window” of rhizosphere-soluble sugars (0.01–0.5 mmol L−1), enhances nutrient uptake, and does not impose osmotic stress or toxicity [26,28,29]. The Hoagland nutrient solution without Glc, Sbt, GlcA, or GroA was arranged as a control (CK). There were three replicates for each treatment. The experimental design was a completely randomized block design (Figure 1). The nutrient solution was renewed every 3 days during the incubation period, and the pH of the nutrient solution under every treatment was adjusted to be 6.0 ± 0.5. The experiments were performed during September 2023 in an artificial climate culture room (25 °C day (7:00–18:00), 20 °C night (18:00–7:00), 60% relative humidity, and 300 μmol m−2 s−1 light intensity) at Dezhou Experimental Station for Saline Soil Improvement, Chinese Academy of Agricultural Sciences.

2.2. Laboratory Analysis

Seedlings were harvested on the 21st day after transplanting. Wheat seedlings in each box were divided equally into two categories, and each plant was rinsed and divided into root and aboveground parts. One category of wheat seedlings was used to assess dry biomass and nutrient content, and the remainder was stored in liquid nitrogen to determine root morphology and physiological indicators.
After weighing, the dried samples were crushed using a ball mill (MM400, RETSCH, Haan, Germany) and digested with H2SO4-H2O2 [30]. The digestion solution was used to assess the contents of nitrogen, phosphorus, and potassium by the Kjeldahl method, vanadium–molybdenum yellow colorimetric method, and flame spectrophotometry, respectively [30].
The root morphology of wheat seedlings was scanned (Epson, Perfection V800 Photo, Suwa, Nagano, Japan), and the root length, surface area, diameter, and volume were analyzed using the WinRHIZO root analysis software (WinRHIZO2021, Québec, Canada). The root absorbing area and root vigor were determined using the methylene blue adsorption [31] and 2,3,5-triphenyltetrazolium chloride (TTC) reduction methods [32].
Wheat leaves stored in liquid nitrogen were used to determine the chlorophyll content, glutamine synthetase activity, and soluble protein content using anhydrous ethanol extraction [33], colorimetric [2], and Thomas Brilliant Blue colorimetric methods, respectively [34].

2.3. Statistical Analysis

Data are presented as mean ± SD (n = 3). Homogeneity of variance was assessed with Levene’s test (α = 0.05). Variables meeting this assumption were examined by one-way ANOVA, with Fisher’s LSD used for pairwise comparisons after a significant omnibus F. For heteroscedastic variables, Welch’s ANOVA followed by Games–Howell post hoc tests was applied. All F statistics, degrees of freedom, and p-values are compiled in Supplementary Table S12 for verification. Statistical significance was accepted at p < 0.05 (two-tailed). A two-way ANOVA was additionally performed to evaluate the interaction between carbohydrate type and concentrations. Principal component analysis (PCA) was employed to visualize the multivariate response of wheat growth to carbohydrate type. The relationships between glucose and its derivative types, root viability capacity, leaf photosynthesis and nitrogen metabolism, and nutrient uptake were explored by using a partial least squares path model (PLS-PM). Path coefficients and loadings were estimated by validating R (4.2.1) with the plspm package.

3. Results

3.1. Effect of Glucose and Its Derivatives on Wheat Biomass

To explore the effects of glucose (Glc), sorbitol (Sbt), gluconic acid (GlcA), and glucuronic acid (GroA) on wheat growth, we calculated the wheat biomass treated with glucose and its derivatives at different concentrations. The results indicated that both glucose and its derivatives increased wheat biomass compared with the control treatment (CK) (Figure 2). The carbohydrate type (Supplementary Table S1, F = 9.51 **) and concentration (Supplementary Table S1, F = 4.18 *) had strong effects on wheat total biomass, but the interaction between type and concentration was not significant (Supplementary Table S1, F = 1.96 ns). The promoting effect of glucose and its derivatives on the total biomass of wheat is Glc > Sbt > GlcA > GroA. Compared with glucose derivatives, Glc increased root biomass, aboveground biomass, and total biomass by 4.69–9.84%, 6.64–16.29%, and 6.23–14.89%, respectively (Supplementary Table S1). In addition, the wheat total biomass treated with glucose was the highest of all treatments at different concentrations, significantly increased by 31.25–37.08% compared to CK. Notably, the dry matter accumulation peaked at 10 mg L−1 (Figure 2).

3.2. Effect of Glucose on Nutrient Uptake of Wheat Seedlings Was Greater than Its Derivatives

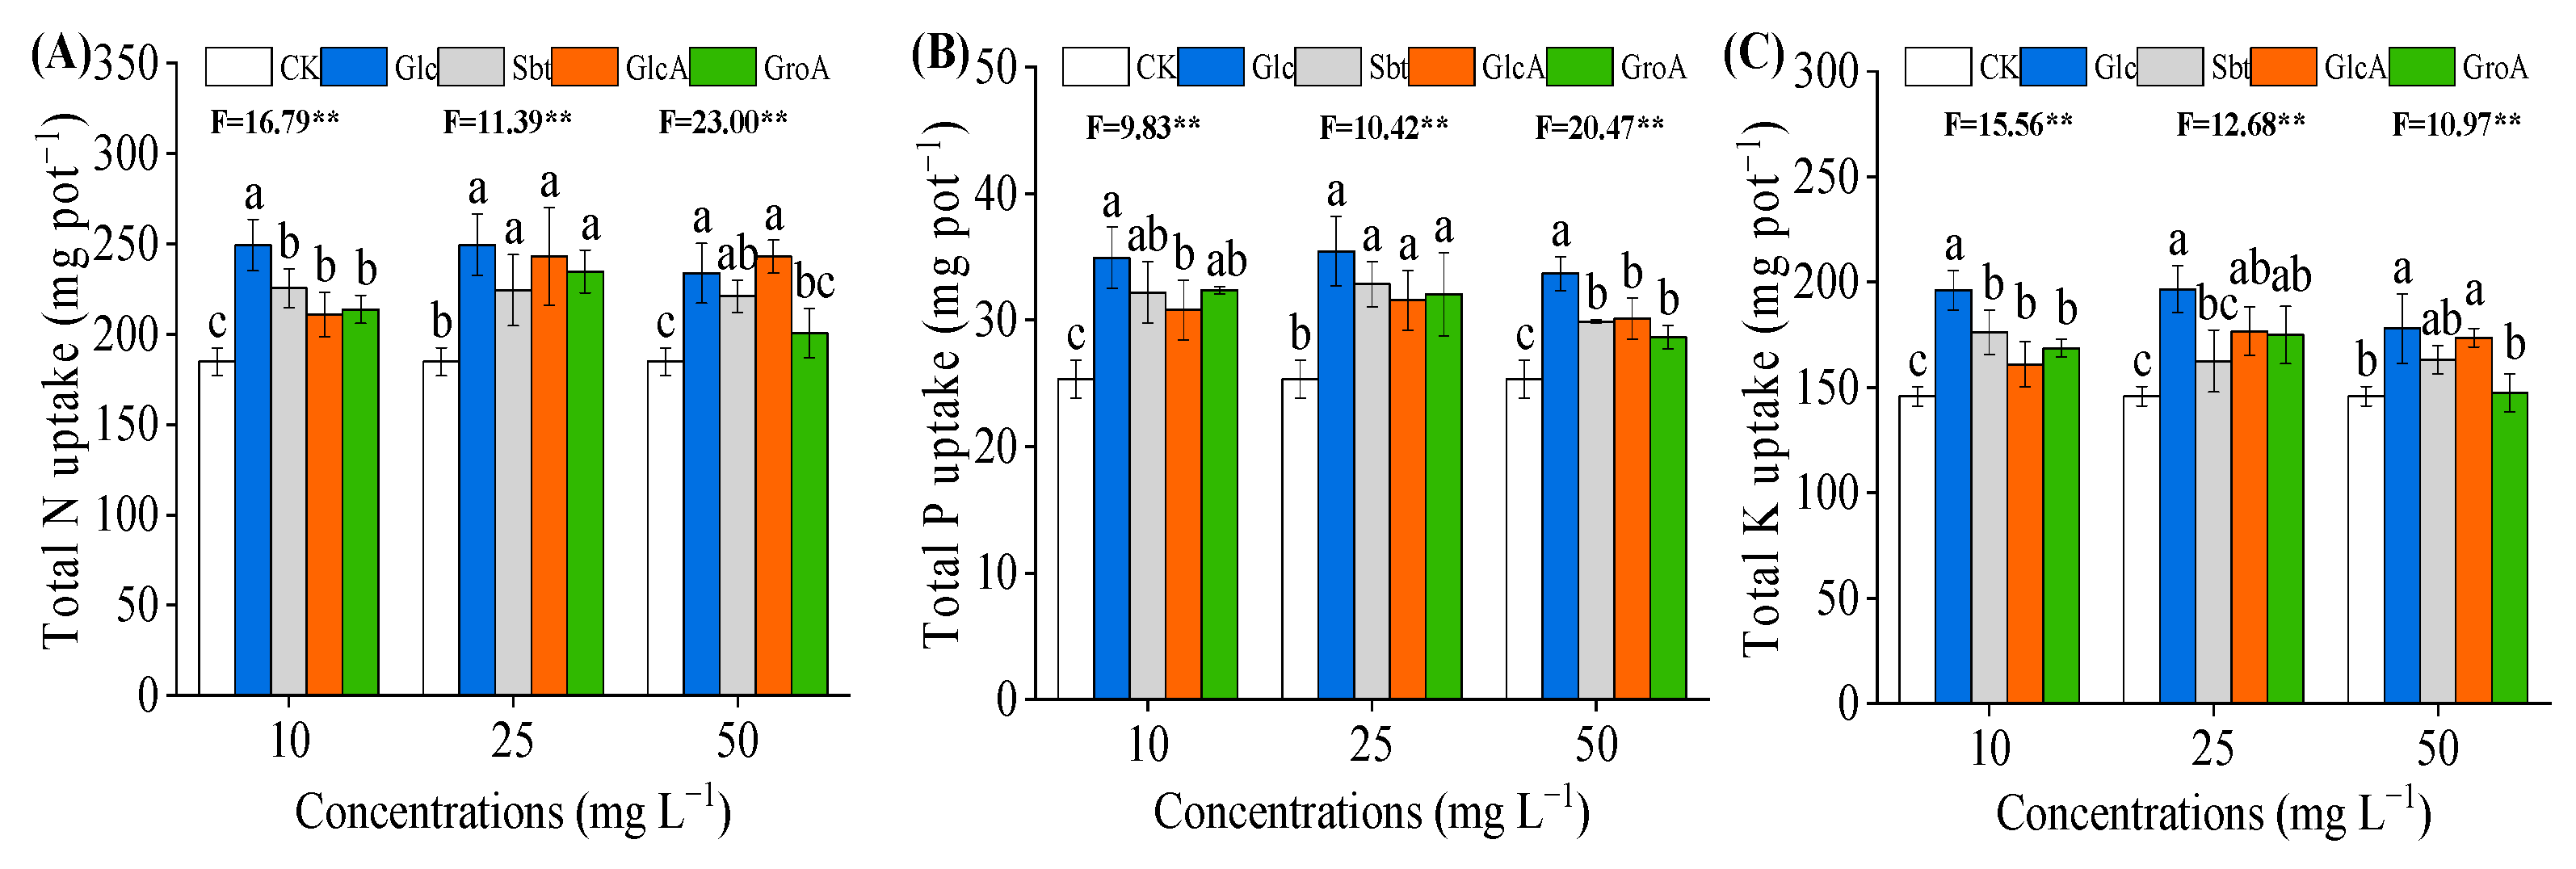
Since the dry biomass accumulation is highly dependent on the supply of mineral nutrients, we measured N, P, and K uptake at different concentrations of Glc, Sbt, GlcA, and GroA. The results showed that exogenous glucose and its derivatives stimulated the nutrient absorption of wheat seedlings under different concentrations (Figure 3). Carbohydrate type had a highly significant effect on the total N (Supplementary Table S2, F = 5.77 **), total P (Supplementary Table S3, F = 6.96 **), and total K (Supplementary Table S4, F = 10.83 **) uptake of wheat, and the concentration of glucose and its derivatives also had a significant effect on both total P (Supplementary Table S3, F = 4.76 *) and total K (Supplementary Table S4, F = 4.32 *) uptake. Glc treatment was the most effective in stimulating N uptake by wheat. Compared with glucose derivatives, Glc significantly increased total N uptake (no significant difference between GlcA and Glc), total P uptake, and total K uptake in wheat by 5.09–12.86%, 9.64–12.52%, and 11.63–16.24%, respectively. Carbohydrate concentration also affected nutrient uptake, with 25 mg L−1 being the most effective at promoting nutrient uptake, followed by 10 mg L−1. In addition, the root and aboveground nutrient uptake were similar to the total nutrient uptake under different concentrations of glucose and its derivatives (Supplementary Tables S9–S11).

3.3. Effect of Glucose and Its Derivatives on Root Morphology and Root Activity of Wheat

As the key organ to absorb nutrients, the morphological and physiological characteristics of the wheat root system affect the growth and nutrient uptake. We measured the length, surface area, diameter, and volume of wheat roots and investigated the effect of carbohydrates on the root morphology of wheat. The results showed that exogenous glucose and its derivatives improved the root morphology of wheat seedlings (Figure 4). The results of two-factor analysis indicated that there was a highly significant effect of carbohydrate type, concentration, and their interaction on root morphology (Supplementary Table S5). Carbohydrates manifested wheat root length in the order Sbt > GroA > Glc > GlcA (Supplementary Table S5, F = 13.44 **), and the root length of Sbt treatment was significantly increased by 7.18%–18.53% compared to other carbohydrate treatments. Meanwhile, Sbt and Glc increased the root surface area more than GlcA and GroA. The effect of glucose on stimulating root diameter coarse and root volume increased by 7.51–11.71% and 7.30–20.13%, respectively. In addition, at lower concentration (10 mg L−1), root length (F = 78.70 **), surface area (F = 65.75 **), and volume (F = 13.98 **) were significantly greater when treated with different carbohydrates than at higher concentrations (25 and 50 mg L−1). However, at high concentration (50 mg L−1), the root diameter became short and thick. At 10 mg L−1, glucose and its derivatives were most effective in improving root morphology, root length, surface area, diameter, and volume and were higher by 1.16–28.91% (F = 13.03 **), 17.01–34.14% (F = 39.12 **), 1.62–32.97% (F = 10.45 **), and 30.37–78.52% (F = 44.56 **), respectively, when treated with carbohydrates, compared to CK. Among them, the Glc treatment resulted in the largest root surface area, diameter, and volume, which significantly increased by 34.14%, 32.97%, and 78.52%, respectively.
Root vigor and root absorption area are important indicators of the nutrient uptake capacity of roots. The results showed that the total root absorption area, active absorption area, and root vigor treated with different carbohydrates were significantly higher than those of CK (Figure 5). Carbohydrate type (F = 14.76 **), concentration (F = 47.22 **), and their interactions (F = 5.92 **) had highly significant effects on the root vigor of wheat. Carbohydrate type (F = 5.13 **) and the interaction (F = 3.19 *) had significant effects on the root total absorption area as well as the active absorption area (Supplementary Table S6). In general, the results indicated that the total absorption area was greater in Sbt treatments than in Glc, GlcA, and GroA, but there was no significant difference between Glc and Sbt. Root vigor was significantly improved in Glc treatments by 21.25–23.96% compared to its derivatives treatments (F = 14.76 **). At 25 mg L−1, root vigor was increased by 39.64% and 17.07% compared with that at 10 and 50 mg L−1, respectively.

3.4. Effect of Glucose and Its Derivatives on Physiological Indicators of Wheat Leaves

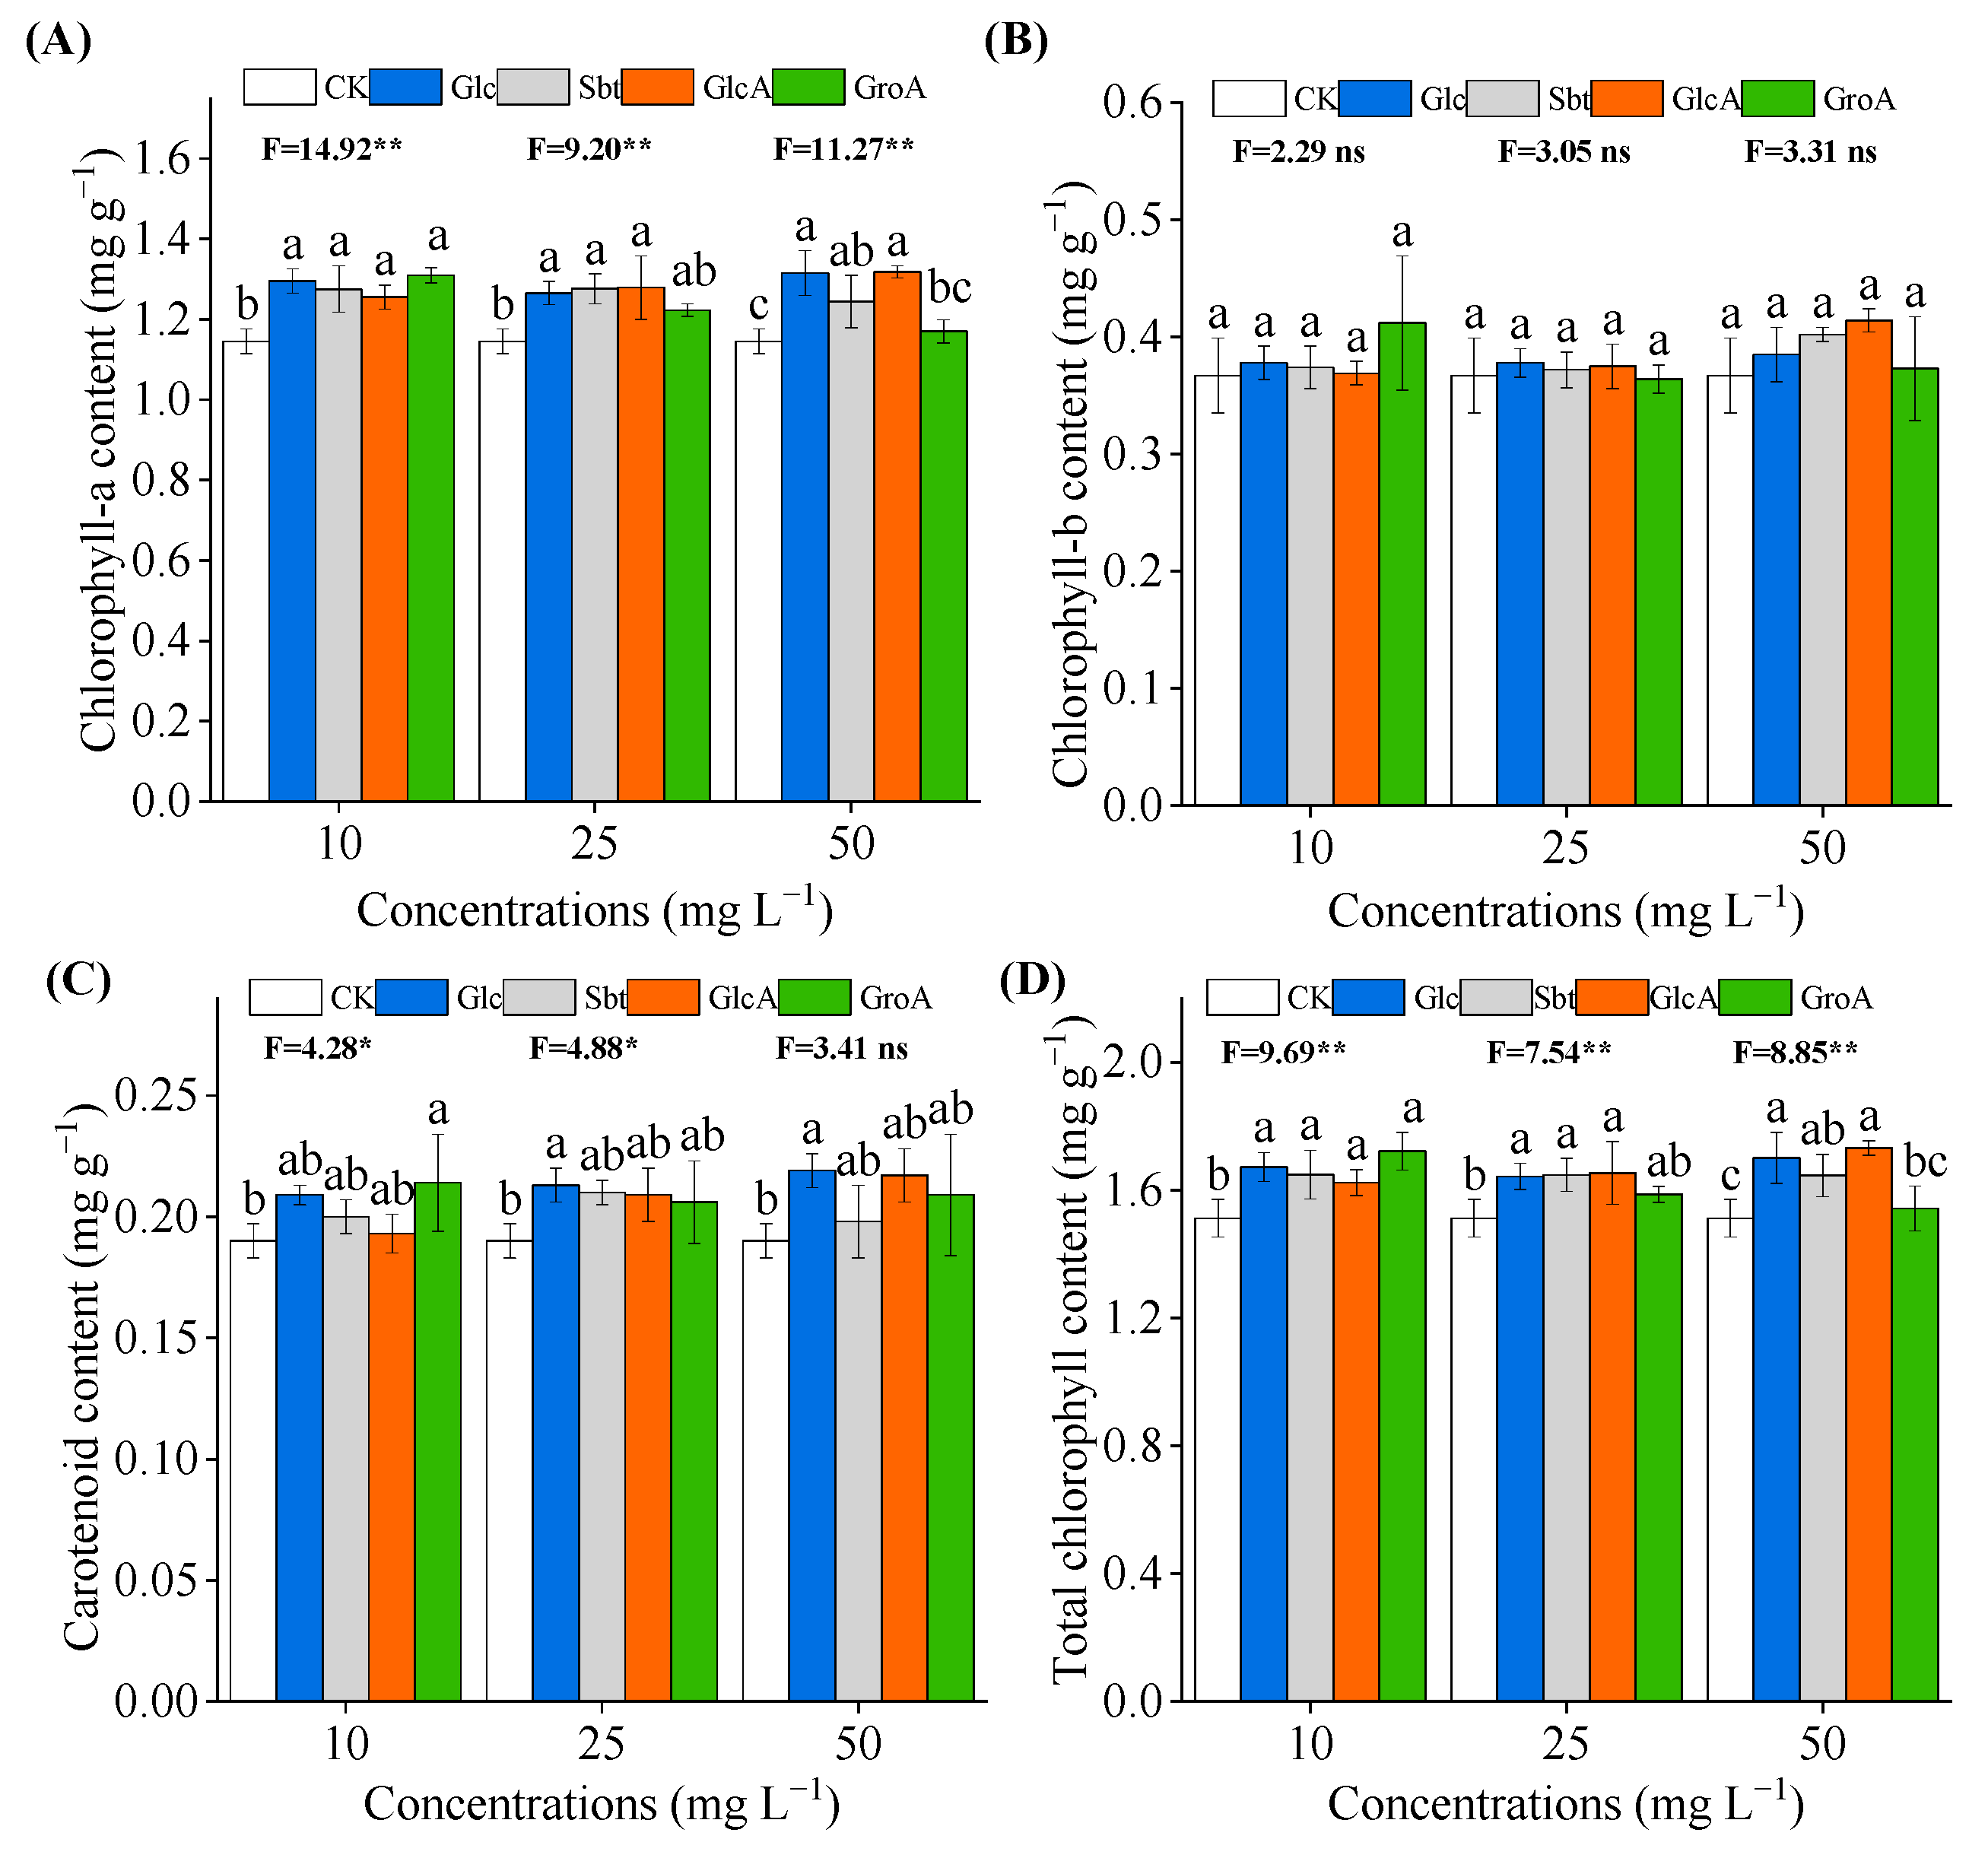
Clarifying the changes in nutrient uptake and the root system, we then focused on the functional state of leaves. The dry biomass was mainly derived from photosynthesis, and the chlorophyll content in wheat leaves was measured. It was shown that glucose and its derivatives promoted photosynthesis and significantly increased chlorophyll content by 9.61–14.41% in wheat leaves compared to CK (Figure 6). Carbohydrate type (F = 3.06 *) and the interaction (F = 3.16 *) between carbohydrate type and concentration significantly impacted the chlorophyll-a content (Supplementary Table S7). Glc treatments had the highest chlorophyll-a content, which increased by 2.38%, 0.78%, and 4.88% compared with the Sbt, GlcA, and GroA treatments, respectively. The effect of Glc treatment was significantly higher than that of GroA.
Glutamine synthetase activity and soluble protein content are important indicators for evaluating nitrogen metabolism in plants. Glucose and its derivatives increased glutamine synthetase activity and soluble protein content in wheat leaves (Figure 7). The results showed that carbohydrate concentration (F = 5.54 *) and the interaction (F = 2.54 *) between carbohydrate type and concentration significantly affected leaf glutamine synthetase activity. At 25 mg L−1, leaf glutamine synthetase activity significantly increased by 7.52% and 5.32% compared to that of 10 and 50 mg L−1, respectively. Similarly, carbohydrate concentration (F = 42.11 **) had a significant effect on the soluble protein content; wheat leaves had the highest soluble protein content at 25 mg L−1 (Supplementary Table S8). At 25 mg L−1, glucose and its derivatives significantly increased the glutamine synthetase activity and soluble protein content by 17.75–29.26% and 40.72–56.88% compared with CK, respectively (Figure 7).

3.5. Principal Component Analysis of Glucose and Its Derivatives on Wheat Growth and Nutrient Uptake

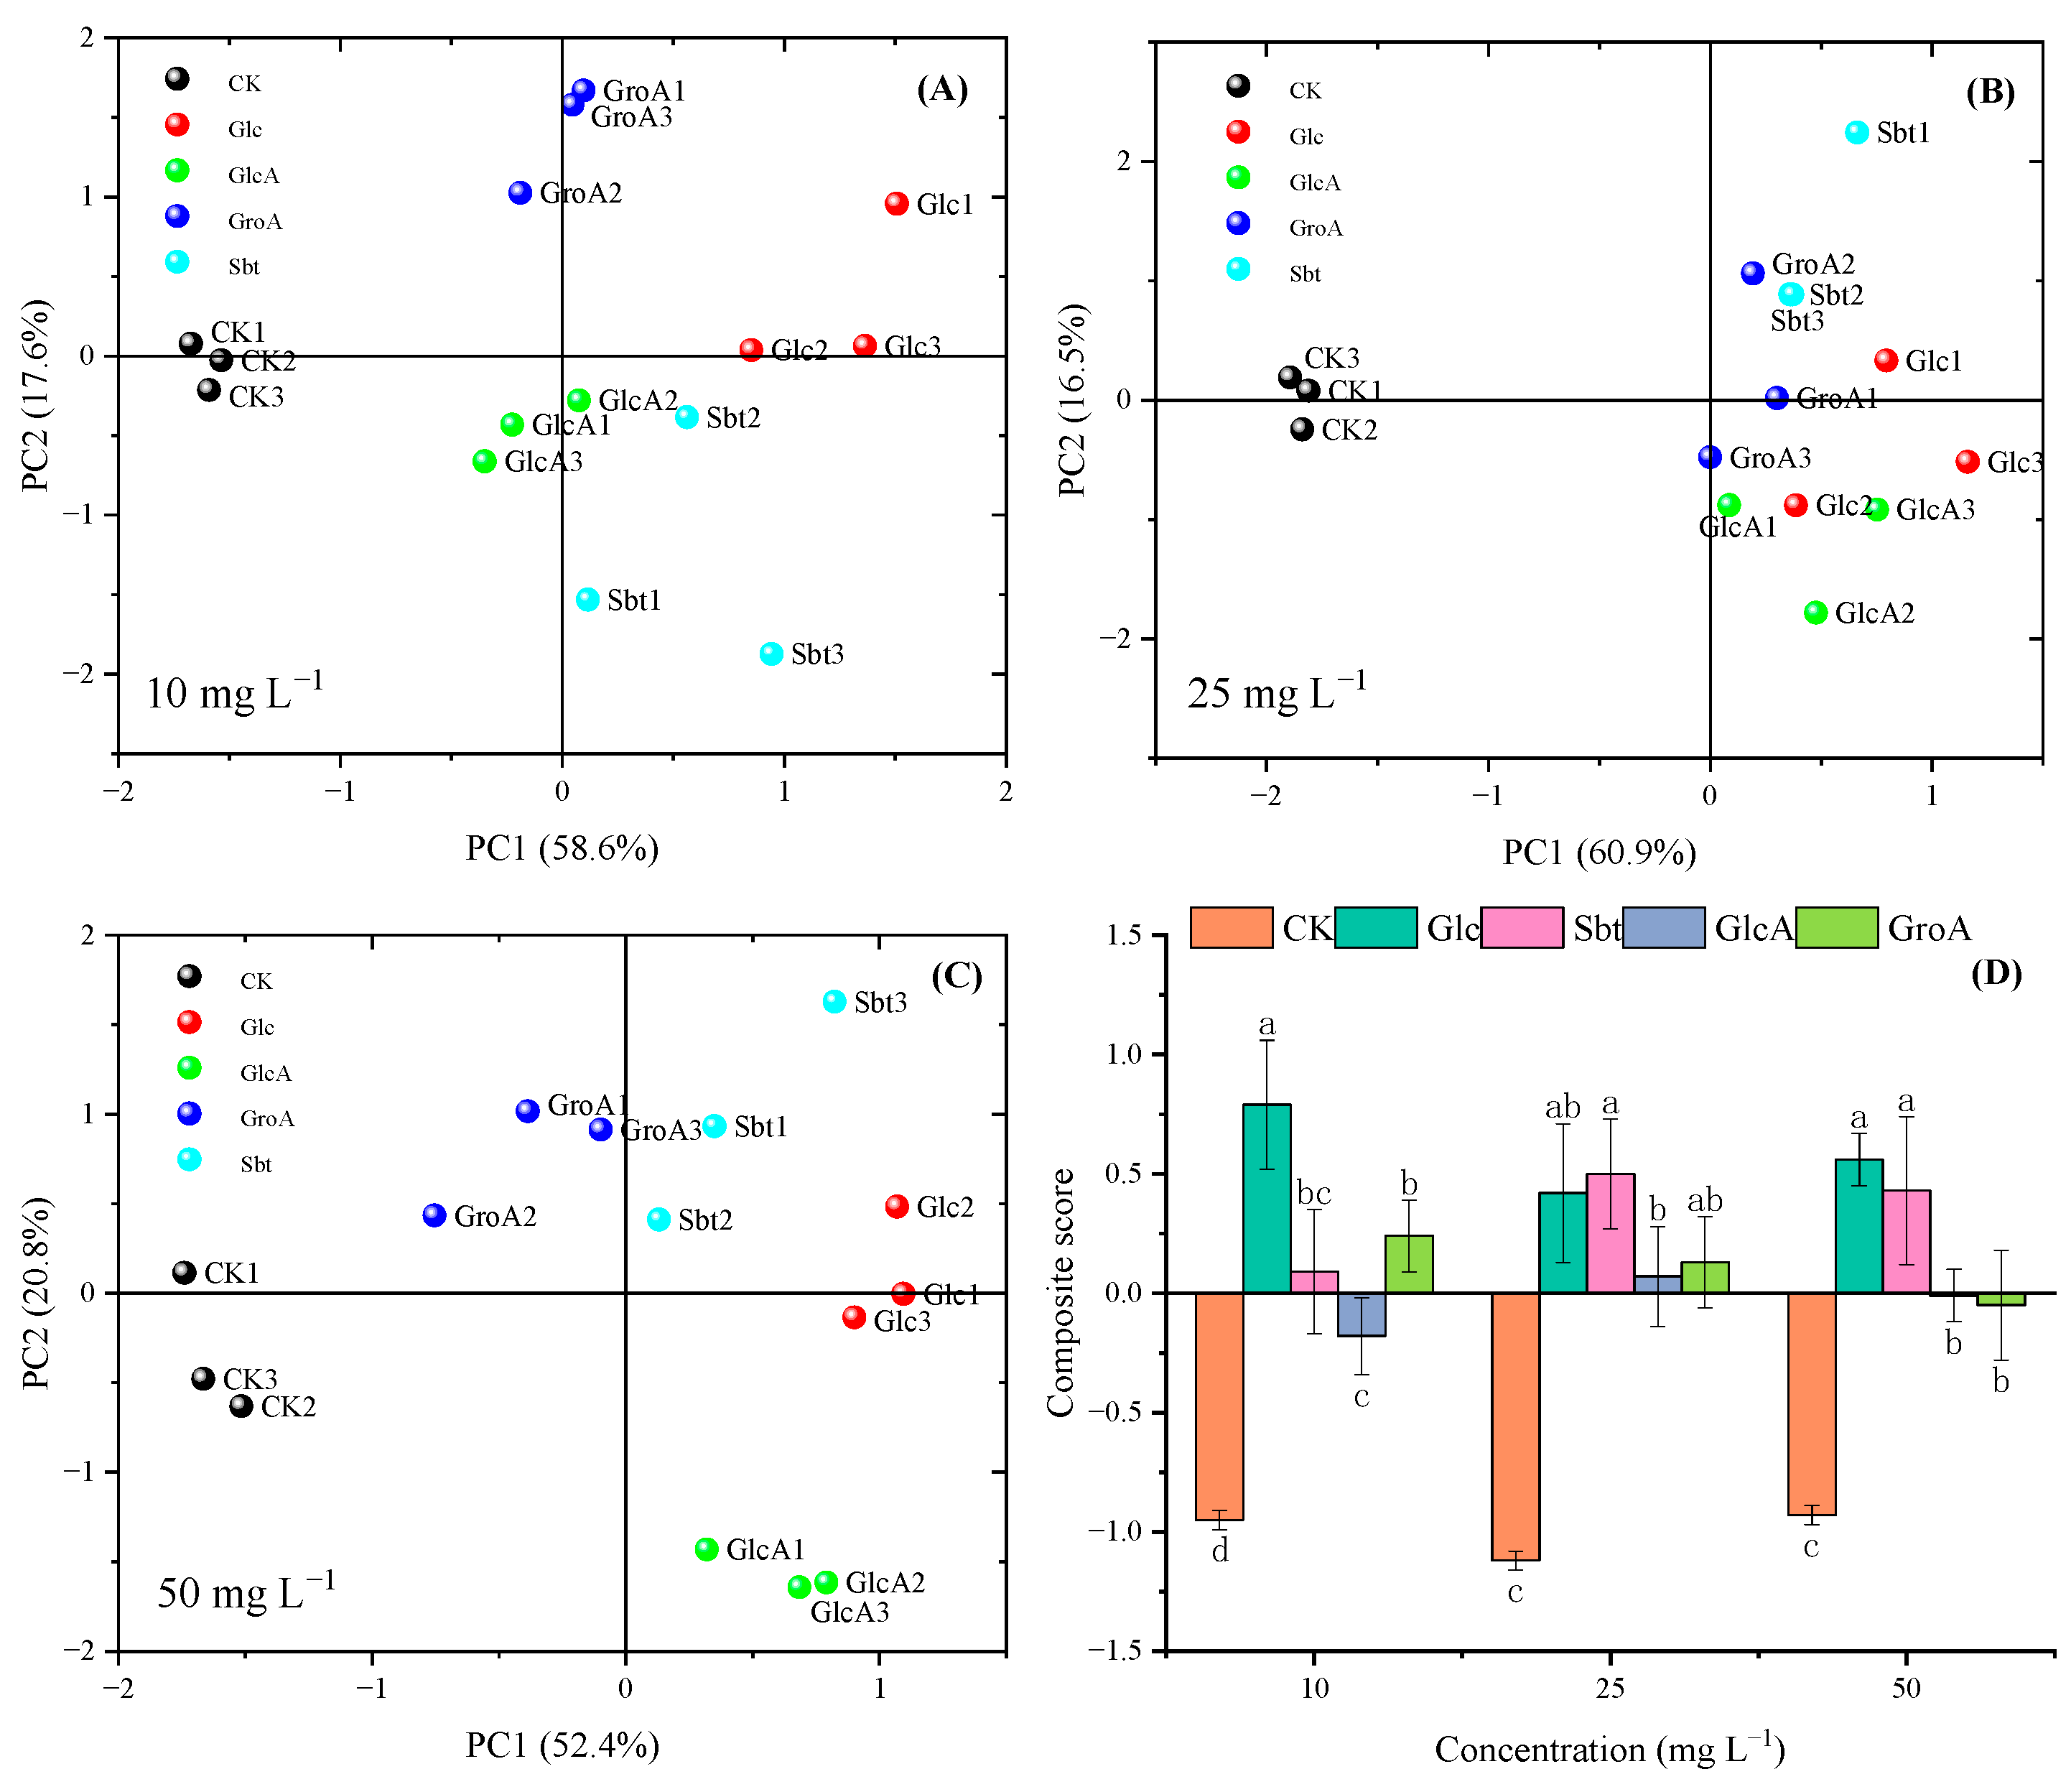
In order to systematically analyze the coordinated response patterns of various growth indices under the action of exogenous glucose, we performed principal component analysis for all treatments at different concentrations (Figure 8). The plot of the scores from the principal component analysis showed that the differences between groups were greater than those within groups, indicating a significant difference between treatments. The sum of the cumulative contributions of PC1 and PC2 was greater than 70%, indicating that these two principal components represented the effects of different treatments on wheat growth and nutrient uptake (Figure 8A–C). Therefore, we used the first two principal components to score the growth and physiological indices of wheat under different treatments (Figure 8D). The comprehensive evaluation function is the sum of the product of each principal component score and its corresponding contribution rate. The results showed that glucose and its derivatives promoted wheat growth and nutrient uptake compared to CK; among them, the Glc treatment performed better than its derivatives at different concentrations, followed by Sbt.

3.6. The Partial Least Squares Path Model (PLS-PM) Analysis

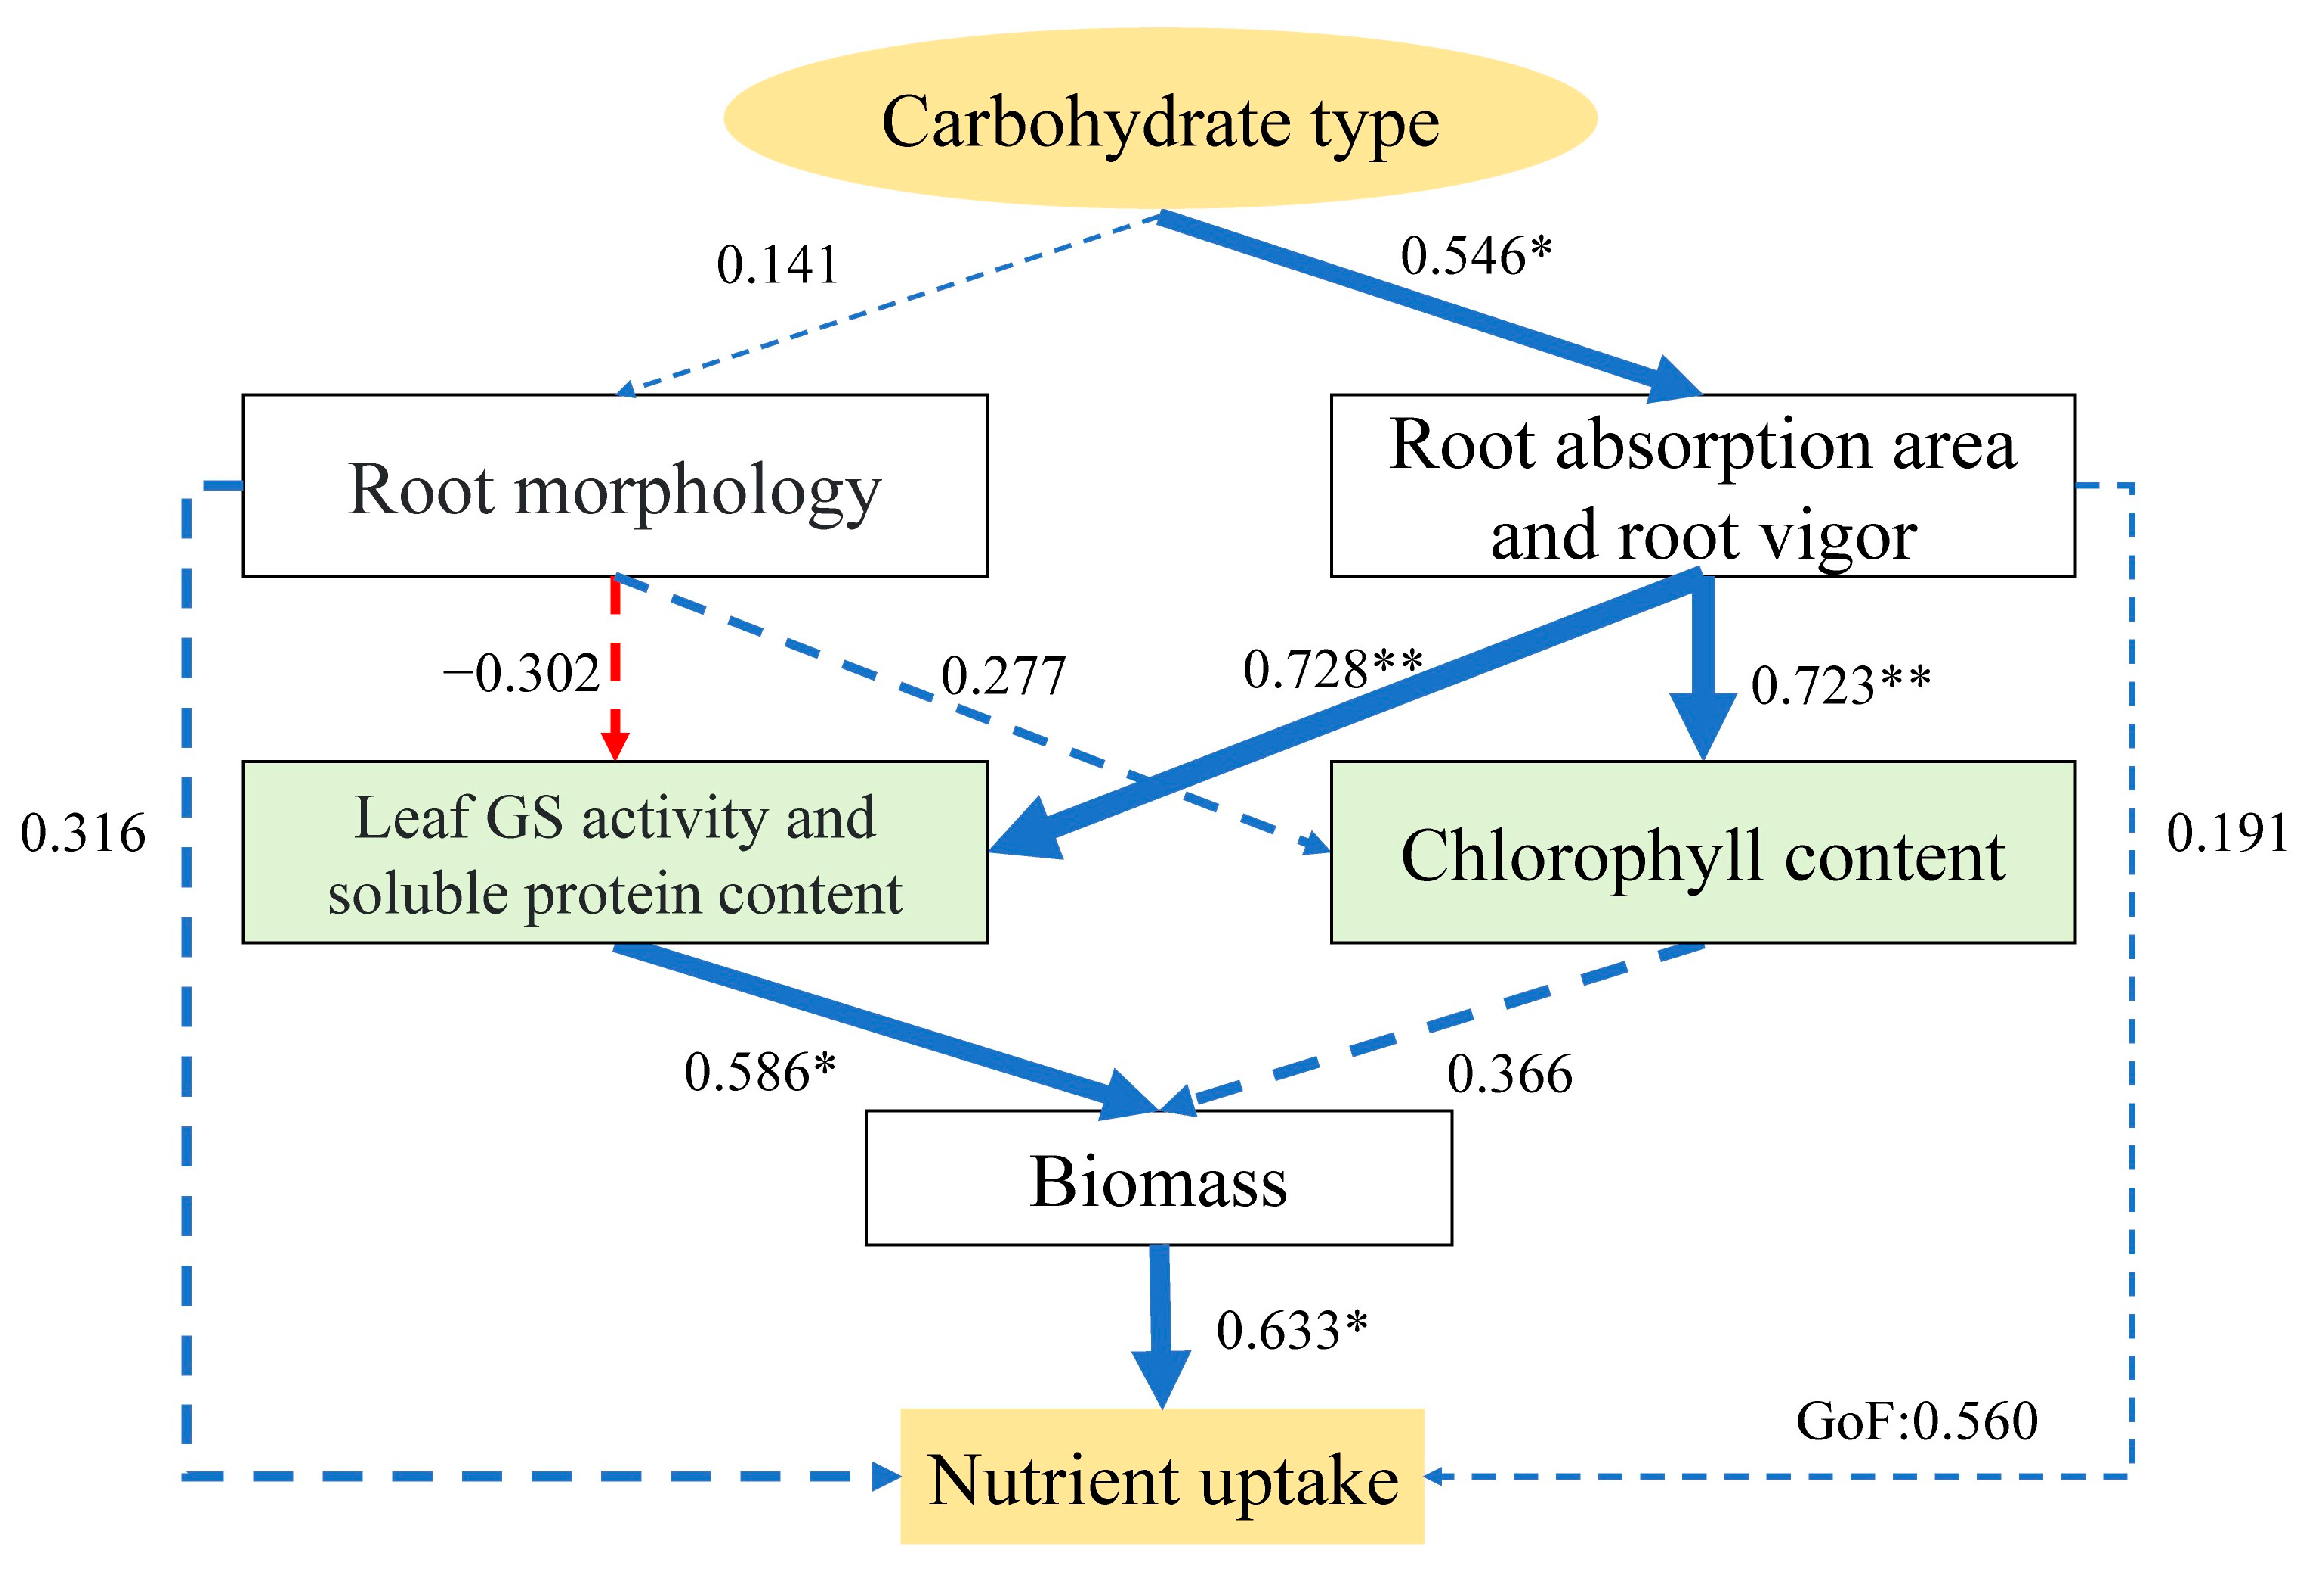
The effects of glucose and its derivatives at 25 mg L−1 were all positive on wheat seedling growth (Figure 9). Therefore, we constructed a structural equation model using PLS-PM to analyze the relationship of carbohydrate type, root morphology, root physiological traits, aboveground physiological traits, biomass, and nutrient uptake at 25 mg L−1 (Figure 9). The model showed that carbohydrate type had a direct and positive effect on root absorption area and root vigor, and the root physiological traits had a highly significant direct and positive influence on the aboveground physiological traits. However, only leaf glutamine synthetase activity and soluble protein directly affected wheat biomass and then significantly stimulated nutrient absorption. The model indicated that carbohydrates mainly promoted aboveground growth by stimulating the root absorption area and root vigor, which in turn affected wheat biomass and nutrient uptake.
Based on our findings, glucose and its derivatives regulate shoot growth primarily through stimulating root system development (Figure 10). Specifically, Glc mainly enhanced root activity, while Sbt significantly increased root length and surface area. Notably, GlcA and GroA were observed to markedly promote root diameter expansion.

4. Discussion

In this study, we demonstrated that exogenous glucose and its derivatives stimulated wheat growth and nutrient absorption at different concentrations compared to CK (Figure 2, Figure 3), consistent with previous findings in pakchoi [25] and apple rootstock [14], where exogenous carbohydrates enhanced plant growth under species-specific conditions. It is well known that carbohydrates contribute directly to plant growth and physiological processes as carbon and energy sources [26,35]. We found that 10 mg·L−1 Glc and 25 mg·L−1 of its derivatives were the optimal concentrations for promoting wheat growth and nutrient absorption, while wheat growth and physiological indexes showed a decreasing trend at the high concentration of 50 mg·L−1 (Supplementary Tables S1–S4). This divergence arises because Glc as a rapidly absorbed monosaccharide, hits an osmotic stress threshold at lower concentrations (beyond 10 mg·L−1), whereas its derivatives, with slower absorption and reduced osmotic activity due to structural modifications, require a higher extracellular concentration (25 mg·L−1) to reach effective intracellular levels without inducing early osmotic stress, though both exceed cellular tolerance at 50 mg·L−1 [29]. Roots play an important role in plant growth, and plant biomass and nutrient uptake are generally attributed to improving the root morphology and physiological indices [36]. This study showed that carbohydrates increased root absorption area and root activity and affected root morphology of wheat at different concentrations (Figure 4 and Figure 5). Lang et al. [14] researched that exogenous glucose increased root surface area, root volume, and root enzyme activity, which was similar to the results of this study. It is possible that carbohydrates are absorbed by plants; these then act as signaling molecules that regulate root growth and physiology [35,37]. An increase in root length, surface area, diameter, and volume is beneficial for increasing the absorption and utilization of nutrients by plants [38]. At lower concentration (10 mg L−1), the effect of carbohydrates on root elongation was consistent with previous results, in which exogenous glucose significantly increased root length [5]. This is mainly because sugars stimulate the growth of the root apical meristematic zone [39], which in turn induces root architecture. However, carbohydrates inhibited root elongation but increased root diameter at a higher concentration (50 mg L−1). Previous studies have shown that higher sugar concentrations inhibit root length mainly because of reduced auxin levels in the root meristem zone [39].
The results indicated that carbohydrates significantly promoted shoot growth by directly increasing root absorption area and root activity, and further improved wheat seedlings’ biomass and nutrient absorption (Figure 9). The dry matter accumulation in crops mainly originated from photosynthesis, and the chlorophyll content determines the strength of photosynthesis in crops [40]. In this study, the chlorophyll content of carbohydrate treatments was higher than that in the CK treatment (Figure 6). Exogenous sugars have been reported to promote photosynthesis and the accumulation of reserve carbohydrates in crops [41]. Wang et al. [2] found that exogenous glucose and sucrose increased SPAD value and net photosynthetic rate of triticale seedlings. However, glucose inhibiting the synthesis of photosynthetic pigments was proved by Stanichuk et al. [42]; this difference is mainly due to the excessive addition of glucose (1%), which inhibited chlorophyll and phycocyanobilin biosynthesis. The wheat biomass was directly affected by leaf nitrogen metabolism (Figure 9). Exogenous organic matter affects plant nitrogen uptake and nitrogen metabolism [14,43]. Glutamine synthetase is a key enzyme in the process of nitrogen uptake and assimilation in plants [14]. The soluble protein content in plant leaves is involved in various metabolic enzyme activities, the level of which reflects the level of nitrogen metabolism in the plant [44]. Carbohydrates promoted nitrogen uptake and assimilation in the present study, probably by increasing glutamine synthetase activity and soluble protein content in the leaves (Figure 7). In general, carbohydrates further promote wheat biomass and nutrient uptake primarily by promoting root-stimulated shoot growth.
The results showed that the carbohydrate type had significant effects on the growth and physiological indices of wheat seedlings (Supplementary Tables S1–S4). A previous study also showed that carbohydrate type, concentration, and interaction had significant effects on the proliferation of lingonberry seedlings, and that various carbohydrates had significant differences in the formation of callosities [15]. The results above indicate that the different carbohydrate types have significant effects on plant growth. Their structure determines their function and properties, and different functional group structures and quantities of carbohydrates lead to different biological activities [10,45]. Carbohydrates with similar molecular weights were selected for this study; therefore, the primary reason for their different effects on wheat growth should be the different structures of the functional groups. Glucose, sorbitol, gluconic acid, and glucuronic acid contain multiple hydroxyl functional groups that adsorb mineral nutrients via hydrogen bonding [46]. Therefore, it is beneficial for the absorption of nutrients by the roots. The results showed that the composite scores of the growth and physiological indicators of wheat treated with glucose were higher at different concentrations, especially at lower concentrations (Figure 8). The root surface area, diameter, absorption area, and vigor were higher after treatment with Glc (Supplementary Tables S5 and S6), which can improve the absorption and utilization of nutrients by the roots. Studies have shown that lower glucose concentrations increase sugar transport in plants [47], stimulating an increase in root metabolism [48]. The hydroxyl group at the position of glucose c-1 has high biological activity and plays an important role in cell recognition and transport [49]. In addition, glucose as a signaling molecule is specific for promoting plant growth and regulating gene expression [5,50]. Glucose derivatives, such as mannitol and 3-O-methylglucose, do not have the same induction effect on plant growth [51]. The effect of sorbitol on growth and physiological indices of wheat was higher at 25 and 50 mg L−1, and there was no significant difference from the Glc treatment (Figure 9). Unlike glucose treatment, sorbitol stimulated wheat growth and nutrient uptake primarily by increasing root length, root surface area, and root absorption area (Supplementary Tables S5 and S6). Sorbitol contains hydroxyl groups and exhibits strong hydrogen bonding, resulting in enhanced nutrient adsorption capacity. Compared to glucose, sorbitol has no aldehyde or ketone functional groups, making it more suitable for cell activity, nutrient transport, and storage [20]. Furthermore, the hydroxyl functional group is more hydrophilic, and the poly hydroxyl structure of sugar alcohol determines its strong penetration, wetting, and reduction in the surface tension of the solution [11], which in turn increases the absorption area of the root system and promotes the nutrient uptake by wheat. However, the root vitality treated with glucose was higher than that treated with sorbitol. This may be due to the aldehyde group acting as an electron acceptor, which can promote the respiratory chain to produce more ATP and facilitate nutrient transport in the root system [17]. Overall, gluconic acid and glucuronic acid promoted wheat growth to a lesser extent than glucose and sorbitol, most likely because their -COOH groups chelate Fe3+, Zn2+, and other cations [22]; releasing these complexes requires sustained rhizosphere acidification via H+-ATPase activity, which diverts metabolic energy and can limit net nutrient uptake [52]. However, it is necessary to conduct an in-depth analysis combining changes in rhizosphere pH and metal complexation. Based on the agronomic data from this study, the hierarchical order of biological activity of functional groups in glucose derivatives may be as follows: aldehyde group > hydroxyl group > carboxyl group. This might be attributed to the high activity of aldehyde groups in auxin synthesis [53], which further promoted plant growth, accounting for glucose’s emergence as the most effective wheat growth promoter in our experimental system. Economic cost–benefit analysis showed that the price of Glc (USD 0.8/100 g) was lower than that of its derivatives (Sbt: USD 9/100 g; GlcA: USD 18/100 g, GroA: USD 1200/100 g), and demonstrated a huge, significant economic benefit, particularly showing better growth-promoting effects at lower addition amounts. In summary, different functional group structures promote wheat growth through different pathways (Figure 10). However, the underlying mechanisms of different functional groups on wheat physiology and metabolism remain to be further explored via molecular analysis and metabolic tracking of sugars.
In the future, it is necessary to further investigate the effects of glucose and its derivatives on wheat growth at different developmental stages under field conditions, as well as their impact on yield, quality, and stress resistance. In addition, the molecular mechanisms underlying their regulation of crop productivity should be clarified to provide a theoretical basis for their agricultural application.

5. Conclusions

We demonstrated that glucose and its derivatives exert distinct effects on wheat growth and nutrient uptake, depending on their functional group composition. These findings provide theoretical support for the rational formulation and practical application of carbon-based bio-stimulants in crop production. Our experimental results demonstrate optimal efficacy at concentrations of 10–25 mg L−1, with structural variations among derivatives inducing distinct physiological responses. Notably, aldehyde-containing glucose derivatives exhibited superior growth-promoting effects, primarily through root diameter expansion and enhanced root system vitality. In contrast, hydroxyl-rich sorbitol derivatives stimulated plant development predominantly by elongating root structures and increasing total root surface area. Our findings highlight the influence of the molecular structure of carbohydrates on their agronomic effects.

Supplementary Materials

The following supporting information can be downloaded at https://www.mdpi.com/article/10.3390/agronomy15092054/s1, Table S1: Effects of carbohydrate type and concentration on wheat biomass (g pot−1); Table S2: Effects of carbohydrate type and concentration on nitrogen uptake in wheat (mg pot−1); Table S3: Effects of carbohydrate type and concentration on phosphorus uptake in wheat (mg pot−1); Table S4: Effects of carbohydrate type and concentration on potassium uptake in wheat (mg pot−1); Table S5: Effects of carbohydrate type and concentration on wheat root morphology; Table S6: Effects of carbohydrate type and concentration on root absorption area and root activity in wheat; Table S7: Effects of carbohydrate type and concentration on chlorophyll content in wheat leaves; Table S8: Effects of carbohydrate type and concentration on glutamine synthase activity and soluble protein content in wheat leaves; Table S9: Effects of exogenous glucose and its derivatives on nitrogen uptake in wheat seedlings; Table S10: Effects of exogenous glucose and its derivatives on phosphorus uptake in wheat seedlings; Table S11: Effects of exogenous glucose and its derivatives on potassium uptake in wheat seedlings; Table S12: Summary of one-way ANOVA results (p and F values) for the effect of glucose and derivatives on growth and nutrient absorption.

Author Contributions

Y.Y.: Investigation, Data curation, Methodology, Writing—original draft preparation. S.Z.: Conceptualization, Writing—original draft preparation. M.X.: Investigation. J.X.: Software. Y.L.: Supervision. B.Z.: Validation, Funding acquisition, Project administration. L.Y.: Writing—review and editing, Resources, Funding acquisition. All authors have read and agreed to the published version of the manuscript.

Funding

This research was funded by the National Key Research and Development Program of China during the 14th Five-Year Plan period (2023YFD1700201), the Fundamental Research Funds for Central Non-profit Scientific Institution (No. 1610132023012), and the China Agriculture Research System (Grant No. CARS–03).

Data Availability Statement

The original contributions presented in the study are included in the article/Supplementary Material; further inquiries can be directed to the corresponding author/s.

Acknowledgments

We acknowledge Yuan Liu for the assistance during sample treatments.

Conflicts of Interest

The authors declare no conflicts of interest.

References

  1. Gibson, S.I. Control of Plant Development and Gene Expression by Sugar Signaling. Curr. Opin. Plant Biol. 2005, 8, 93–102. [Google Scholar] [CrossRef]
  2. Wang, L.H.; Li, G.L.; Wei, S.; Li, L.J.; Zuo, S.Y.; Liu, X.; Gu, W.R.; Li, J. Effects of Exogenous Glucose and Sucrose on Photosynthesis in Triticale Seedlings under Salt Stress. Photosynthetica 2019, 57, 286–294. [Google Scholar] [CrossRef]
  3. Qi, X.; Li, Q.; Shen, J.; Qian, C.; Xu, X.; Xu, Q.; Chen, X. Sugar Enhances Waterlogging-induced Adventitious Root Formation in Cucumber by Promoting Auxin Transport and Signalling. Plant Cell Environ. 2020, 43, 1545–1557. [Google Scholar] [CrossRef]
  4. Kosar, F.; Alshallash, K.S.; Akram, N.A.; Sadiq, M.; Ashraf, M.; Alkhalifah, D.H.M.; Abdel Latef, A.A.H.; Elkelish, A. Trehalose-Induced Regulations in Nutrient Status and Secondary Metabolites of Drought-Stressed Sunflower (Helianthus annuus L.) Plants. Plants 2022, 11, 2780. [Google Scholar] [CrossRef]
  5. Mishra, B.S.; Singh, M.; Aggrawal, P.; Laxmi, A. Glucose and Auxin Signaling Interaction in Controlling Arabidopsis Thaliana Seedlings Root Growth and Development. PLoS ONE 2009, 4, e4502. [Google Scholar] [CrossRef] [PubMed]
  6. Zhu, Q.; Wang, L.; Dong, Q.; Chang, S.; Wen, K.; Jia, S.; Chu, Z.; Wang, H.; Gao, P.; Zhao, H.; et al. FRET-Based Glucose Imaging Identifies Glucose Signalling in Response to Biotic and Abiotic Stresses in Rice Roots. J. Plant Physiol. 2017, 215, 65–72. [Google Scholar] [CrossRef] [PubMed]
  7. Malinova, I.; Kössler, S.; Orawetz, T.; Matthes, U.; Orzechowski, S.; Koch, A.; Fettke, J. Identification of Two Arabidopsis Thaliana Plasma Membrane Transporters Able to Transport Glucose 1-Phosphate. Plant Cell Physiol. 2020, 61, 381–392. [Google Scholar] [CrossRef]
  8. Hu, M.; Shi, Z.; Zhang, Z.; Zhang, Y.; Li, H. Effects of Exogenous Glucose on Seed Germination and Antioxidant Capacity in Wheat Seedlings under Salt Stress. Plant Growth Regul. 2012, 68, 177–188. [Google Scholar] [CrossRef]
  9. Li, Q.; Qiu, L.; Tan, W.; Gu, G.; Guo, Z. Novel 1,2,3-Triazolium-Functionalized Inulin Derivatives: Synthesis, Free Radical-Scavenging Activity, and Antifungal Activity. RSC Adv. 2017, 7, 42225–42232. [Google Scholar] [CrossRef]
  10. Synytsya, A. Structural Diversity of Fungal Glucans. Carbohydr. Polym. 2013, 92, 792–809. [Google Scholar] [CrossRef]
  11. Zhou, X.; Sun, Z.; Huang, Y.; He, D.; Lu, L.; Wei, M.; Lin, S.; Luo, W.; Liao, X.; Jin, S.; et al. WRKY45 Positively Regulates Salinity and Osmotic Stress Responses in Arabidopsis. Plant Physiol. Biochem. 2025, 219, 109408. [Google Scholar] [CrossRef]
  12. Mehtiö, T.; Toivari, M.; Wiebe, M.G.; Harlin, A.; Penttilä, M.; Koivula, A. Production and Applications of Carbohydrate-Derived Sugar Acids as Generic Biobased Chemicals. Crit. Rev. Biotechnol. 2016, 36, 904–916. [Google Scholar] [CrossRef]
  13. Ma, Q.; Wu, Z.; Pan, F.; Wang, J.; Zhou, H.; Jiang, C.; Xu, Y.; Yu, W. Effect of Glucose Addition on the Fate of Urea-N-15 in Fixed Ammonium and Soil Microbial Biomass N Pools. Eur. J. Soil Biol. 2016, 75, 168–173. [Google Scholar] [CrossRef]
  14. Dongmei, L.; Zitan, Z.; Sijun, Q.; Deguo, L. Root Architecture and Nitrogen Metabolism in Roots of Apple Rootstock Respond to Exogenous Glucose Supply in Low Carbon Soil. Plant Soil Environ. 2018, 64, 240–246. [Google Scholar] [CrossRef]
  15. Debnath, S.C. Effects of Carbon Source and Concentration on Development of Lingonberry (Vaccinium vitis-idaea L.) Shoots Cultivated in Vitro from Nodal Explants. Vitr. Cell. Dev. Biol.-Plant 2005, 41, 145–150. [Google Scholar] [CrossRef]
  16. Wen, R.; Zhu, M.; Yu, J.; Kou, L.; Ahmad, S.; Wei, X.; Jiao, G.; Hu, S.; Sheng, Z.; Zhao, F.; et al. Photosynthesis Regulates Tillering Bud Elongation and Nitrogen-use Efficiency via Sugar-induced NGR5 in Rice. New Phytol. 2024, 243, 1440–1454. [Google Scholar] [CrossRef]
  17. Zhao, J.; Missihoun, T.D.; Bartels, D. The Role of Arabidopsis Aldehyde Dehydrogenase Genes in Response to High Temperature and Stress Combinations. J. Exp. Bot. 2017, 68, 4295–4308. [Google Scholar] [CrossRef]
  18. Sauerland, M.; Mertes, R.; Morozzi, C.; Eggler, A.L.; Gamon, L.F.; Davies, M.J. Kinetic Assessment of Michael Addition Reactions of Alpha, Beta-Unsaturated Carbonyl Compounds to Amino Acid and Protein Thiols. Free Radic. Biol. Med. 2021, 169, 1–11. [Google Scholar] [CrossRef]
  19. Zhou, X.; Joshi, S.; Patil, S.; Khare, T.; Kumar, V. Reactive Oxygen, Nitrogen, Carbonyl and Sulfur Species and Their Roles in Plant Abiotic Stress Responses and Tolerance. J. Plant Growth Regul. 2022, 41, 119–142. [Google Scholar] [CrossRef]
  20. Dumschott, K.; Richter, A.; Loescher, W.; Merchant, A. Post Photosynthetic Carbon Partitioning to Sugar Alcohols and Consequences for Plant Growth. Phytochemistry 2017, 144, 243–252. [Google Scholar] [CrossRef]
  21. Tian, G.; Liu, C.; Xu, X.; Xing, Y.; Liu, J.; Lyu, M.; Feng, Z.; Zhang, X.; Qin, H.; Jiang, H.; et al. Effects of Magnesium on Nitrate Uptake and Sorbitol Synthesis and Translocation in Apple Seedlings. Plant Physiol. Biochem. 2023, 196, 139–151. [Google Scholar] [CrossRef] [PubMed]
  22. Jing, J.; Zhang, S.; Yuan, L.; Li, Y.; Chen, C.; Zhao, B. Humic Acid Modified by Being Incorporated Into Phosphate Fertilizer Increases Its Potency in Stimulating Maize Growth and Nutrient Absorption. Front. Plant Sci. 2022, 13, 885156. [Google Scholar] [CrossRef] [PubMed]
  23. Kundu, A.; Raha, P.; Dubey, A.N.; Rani, M.; Paul, A.; Patel, R. Differential Responses of Rice (Oryza sativa L.) to Foliar Fertil. Org. Potassium Salts. J. Plant Nutr. 2020, 44, 1330–1348. [Google Scholar] [CrossRef]
  24. Qian, L.; Song, F.; Xia, J.; Wang, R. A Glucuronic Acid-Producing Endophyte Pseudomonas Sp. MCS15 Reduces Cadmium Uptake in Rice by Inhibition of Ethylene Biosynthesis. Front. Plant Sci. 2022, 13, 876545. [Google Scholar] [CrossRef]
  25. Ma, Q.; Cao, X.; Xie, Y.; Xiao, H.; Tan, X.; Wu, L. Effects of Glucose on the Uptake and Metabolism of Glycine in Pakchoi (Brassica chinensis L.) Expo. Var. Nitrogen Sources. BMC Plant Biol. 2017, 17, 58. [Google Scholar] [CrossRef]
  26. Sami, F.; Yusuf, M.; Faizan, M.; Faraz, A.; Hayat, S. Role of Sugars under Abiotic Stress. Plant Physiol. Biochem. 2016, 109, 54–61. [Google Scholar] [CrossRef]
  27. El-Mahdy, M.T.; Youssef, M. Genetic Homogeneity and High Shoot Proliferation in Banana (Musa acuminata Colla) by Altering Medium Thiamine Level and Sugar Type. Vitr. Cell. Dev. Biol.-Plant 2019, 55, 668–677. [Google Scholar] [CrossRef]
  28. Afzal, S.; Chaudhary, N.; Singh, N.K. Role of Soluble Sugars in Metabolism and Sensing Under Abiotic Stress. In Plant Growth Regulators; Aftab, T., Hakeem, K.R., Eds.; Springer International Publishing: Cham, Switzerland, 2021; pp. 305–334. ISBN 978-3-030-61152-1. [Google Scholar]
  29. Zahid, M.; Iqbal, N.; Muhammad, S.; Faisal, S.; Mahboob, W.; Hussain, M.; Khan, Z.U.D. Efficacy of Exogenous Applications of Glucose in Improving Wheat Crop (Triticum aestivum L.) Performance under Drought Stress. Pak. J. Agric. Res. 2018, 31, 202–290. [Google Scholar] [CrossRef]
  30. KALRA Handbook of Reference Methods for Plant Analysis. Available online: https://www.webofscience.com/wos/alldb/full-record/CABI:19990701167 (accessed on 18 November 2022).
  31. Ju, H.; Liu, J.; Gao, J.; Fang, Y.; Bian, M.; Yang, Z. Potassium Uptake Characteristics of Two Maize Hybrids and Their Parents Under the Stress from a Low Amount of Potassium. J. Plant Nutr. 2014, 37, 123–135. [Google Scholar] [CrossRef]
  32. Chen, C.W.; Yang, Y.W.; Lur, H.S.; Tsai, Y.G.; Chang, M.C. A Novel Function of Abscisic Acid in the Regulation of Rice (Oryza sativa L.) Root Growth and Development. Plant Cell Physiol. 2006, 47, 1–13. [Google Scholar] [CrossRef] [PubMed]
  33. Macias-Sanchez, M.D.; Mantell Serrano, C.; Rodriguez Rodriguez, M.; de la Ossa, E.M.; Lubian, L.M.; Montero, O. Extraction of Carotenoids and Chlorophyll from Microalgae with Supercritical Carbon Dioxide and Ethanol as Cosolvent. J. Sep. Sci. 2008, 31, 1352–1362. [Google Scholar] [CrossRef]
  34. Bradford, M.M. A Rapid and Sensitive Method for the Quantitation of Microgram Quantities of Protein Utilizing the Principle of Protein-Dye Binding. Anal. Biochem. 1976, 72, 248–254. [Google Scholar] [CrossRef] [PubMed]
  35. Rolland, F.; Baena-Gonzalez, E.; Sheen, J. Sugar sensing and signaling in plants: Conserved and Novel Mechanisms. Annu. Rev. Plant Biol. 2006, 57, 675–709. [Google Scholar] [CrossRef]
  36. Takehisa, H.; Sato, Y.; Igarashi, M.; Abiko, T.; Antonio, B.A.; Kamatsuki, K.; Minami, H.; Namiki, N.; Inukai, Y.; Nakazono, M.; et al. Genome-Wide Transcriptome Dissection of the Rice Root System: Implications for Developmental and Physiological Functions: Transcriptome Dissection of the Rice Root. Plant J. 2012, 69, 126–140. [Google Scholar] [CrossRef]
  37. Wang, L.; Ruan, Y.-L. Shoot–Root Carbon Allocation, Sugar Signalling and Their Coupling with Nitrogen Uptake and Assimilation. Funct. Plant Biol. 2016, 43, 105. [Google Scholar] [CrossRef]
  38. Giehl, R.F.H.; Gruber, B.D.; von Wiren, N. Its Time to Make Changes: Modulation of Root System Architecture by Nutrient Signals. J. Exp. Bot. 2014, 65, 769–778. [Google Scholar] [CrossRef]
  39. Yuan, T.-T.; Xu, H.-H.; Zhang, K.-X.; Guo, T.-T.; Lu, Y.-T. Glucose Inhibits Root Meristem Growth via ABA INSENSITIVE 5, Which Represses PIN1 Accumulation and Auxin Activity in Arabidopsis. Plant Cell Environ. 2014, 37, 1338–1350. [Google Scholar] [CrossRef]
  40. Chen, F.; Zheng, G.; Qu, M.; Wang, Y.; Lyu, M.-J.A.; Zhu, X.-G. Knocking out negative regulator of photosynthesis 1 Increases Rice Leaf Photosynthesis and Biomass Production in the Field. J. Exp. Bot. 2021, 72, 1836–1849. [Google Scholar] [CrossRef] [PubMed]
  41. Cha-um, S.; Charoenpanich, A.; Roytrakul, S.; Kirdmanee, C. Sugar Accumulation, Photosynthesis and Growth of Two Indica Rice Varieties in Response to Salt Stress. Acta Physiol. Plant. 2009, 31, 477–486. [Google Scholar] [CrossRef]
  42. Stadnichuk, I.; Rakhimberdieva, M.G.; Bolychevtseva, Y.V.; Yurina, N.P.; Karapetyan, N.V.; Selyakh, I.O. Inhibition by Glucose of Chlorophyll a and Phycocyanobilin Biosynthesis in the Unicellular Red Alga Galdieria Partita at the Stage of Coproporphyrinogen III Formation. Plant Sci. 1998, 136, 11–23. [Google Scholar] [CrossRef]
  43. Ruffel, S.; Gojon, A.; Lejay, L. Signal Interactions in the Regulation of Root Nitrate Uptake. J. Exp. Bot. 2014, 65, 5509–5517. [Google Scholar] [CrossRef]
  44. Rossato, L.; Laine, P.; Ourry, A. Nitrogen Storage and Remobilization in Brassica Napus L. During the Growth Cycle: Nitrogen. Fluxes Within Plant Changes Soluble Protein Patterns. J. Exp. Bot. 2001, 52, 1655–1663. [Google Scholar] [CrossRef]
  45. Sun, Z. Synthesis, Characterization, and Antimicrobial Activities of Sulfonated Chitosan. Carbohydr. Polym. 2017, 155, 321–328. [Google Scholar] [CrossRef]
  46. Wu, F.-C.; Tseng, R.-L.; Juang, R.-S. A Review and Experimental Verification of Using Chitosan and Its Derivatives as Adsorbents for Selected Heavy Metals. J. Environ. Manag. 2010, 91, 798–806. [Google Scholar] [CrossRef]
  47. Rolland, F.; Winderickx, J.; Thevelein, J.M. Glucose-Sensing Mechanisms in Eukaryotic Cells. Trends Biochem. Sci. 2001, 26, 310–317. [Google Scholar] [CrossRef] [PubMed]
  48. Dillaway, D.N.; Stringer, J.W.; Rieske, L.K. Light Availability Influences Root Carbohydrates, and Potentially Vigor, in White Oak Advance Regeneration. For. Ecol. Manag. 2007, 250, 227–233. [Google Scholar] [CrossRef]
  49. Dumas, C.; Petrig, J.; Frei, L.; Spingler, B.; Schibli, R. Functionalization of Glucose at Position C-3 for Transition Metal Coordination: Organo-Rhenium Complexes with Carbohydrate Skeletons. Bioconjugat. Chem. 2005, 16, 421–428. [Google Scholar] [CrossRef]
  50. Zhou, L.; Jang, J.; Jones, T.L.; Sheen, J. Glucose and Ethylene Signal Transduction Crosstalk Revealed by an Arabidopsis Glucose-Insensitive Mutant. Proc. Natl. Acad. Sci. USA 1998, 95, 10294–10299. [Google Scholar] [CrossRef] [PubMed]
  51. Lejay, L.; Gansel, X.; Cerezo, M.; Tillard, P.; Müller, C.; Krapp, A.; von Wirén, N.; Daniel-Vedele, F.; Gojon, A. Regulation of Root Ion Transporters by Photosynthesis: Functional Importance and Relation with Hexokinase. Plant Cell 2003, 15, 2218–2232. [Google Scholar] [CrossRef]
  52. Li, J.; Guo, Y.; Yang, Y. The Molecular Mechanism of Plasma Membrane H+-ATPases in Plant Responses to Abiotic Stress. J. Genet. Genom. 2022, 49, 715–725. [Google Scholar] [CrossRef] [PubMed]
  53. Yuan, X.; Xu, P.; Yu, Y.; Xiong, Y. Glucose-TOR Signaling Regulates PIN2 Stability to Orchestrate Auxin Gradient and Cell Expansion in Arabidopsis Root. Proc. Natl. Acad. Sci. USA 2020, 117, 32223–32225. [Google Scholar] [CrossRef] [PubMed]
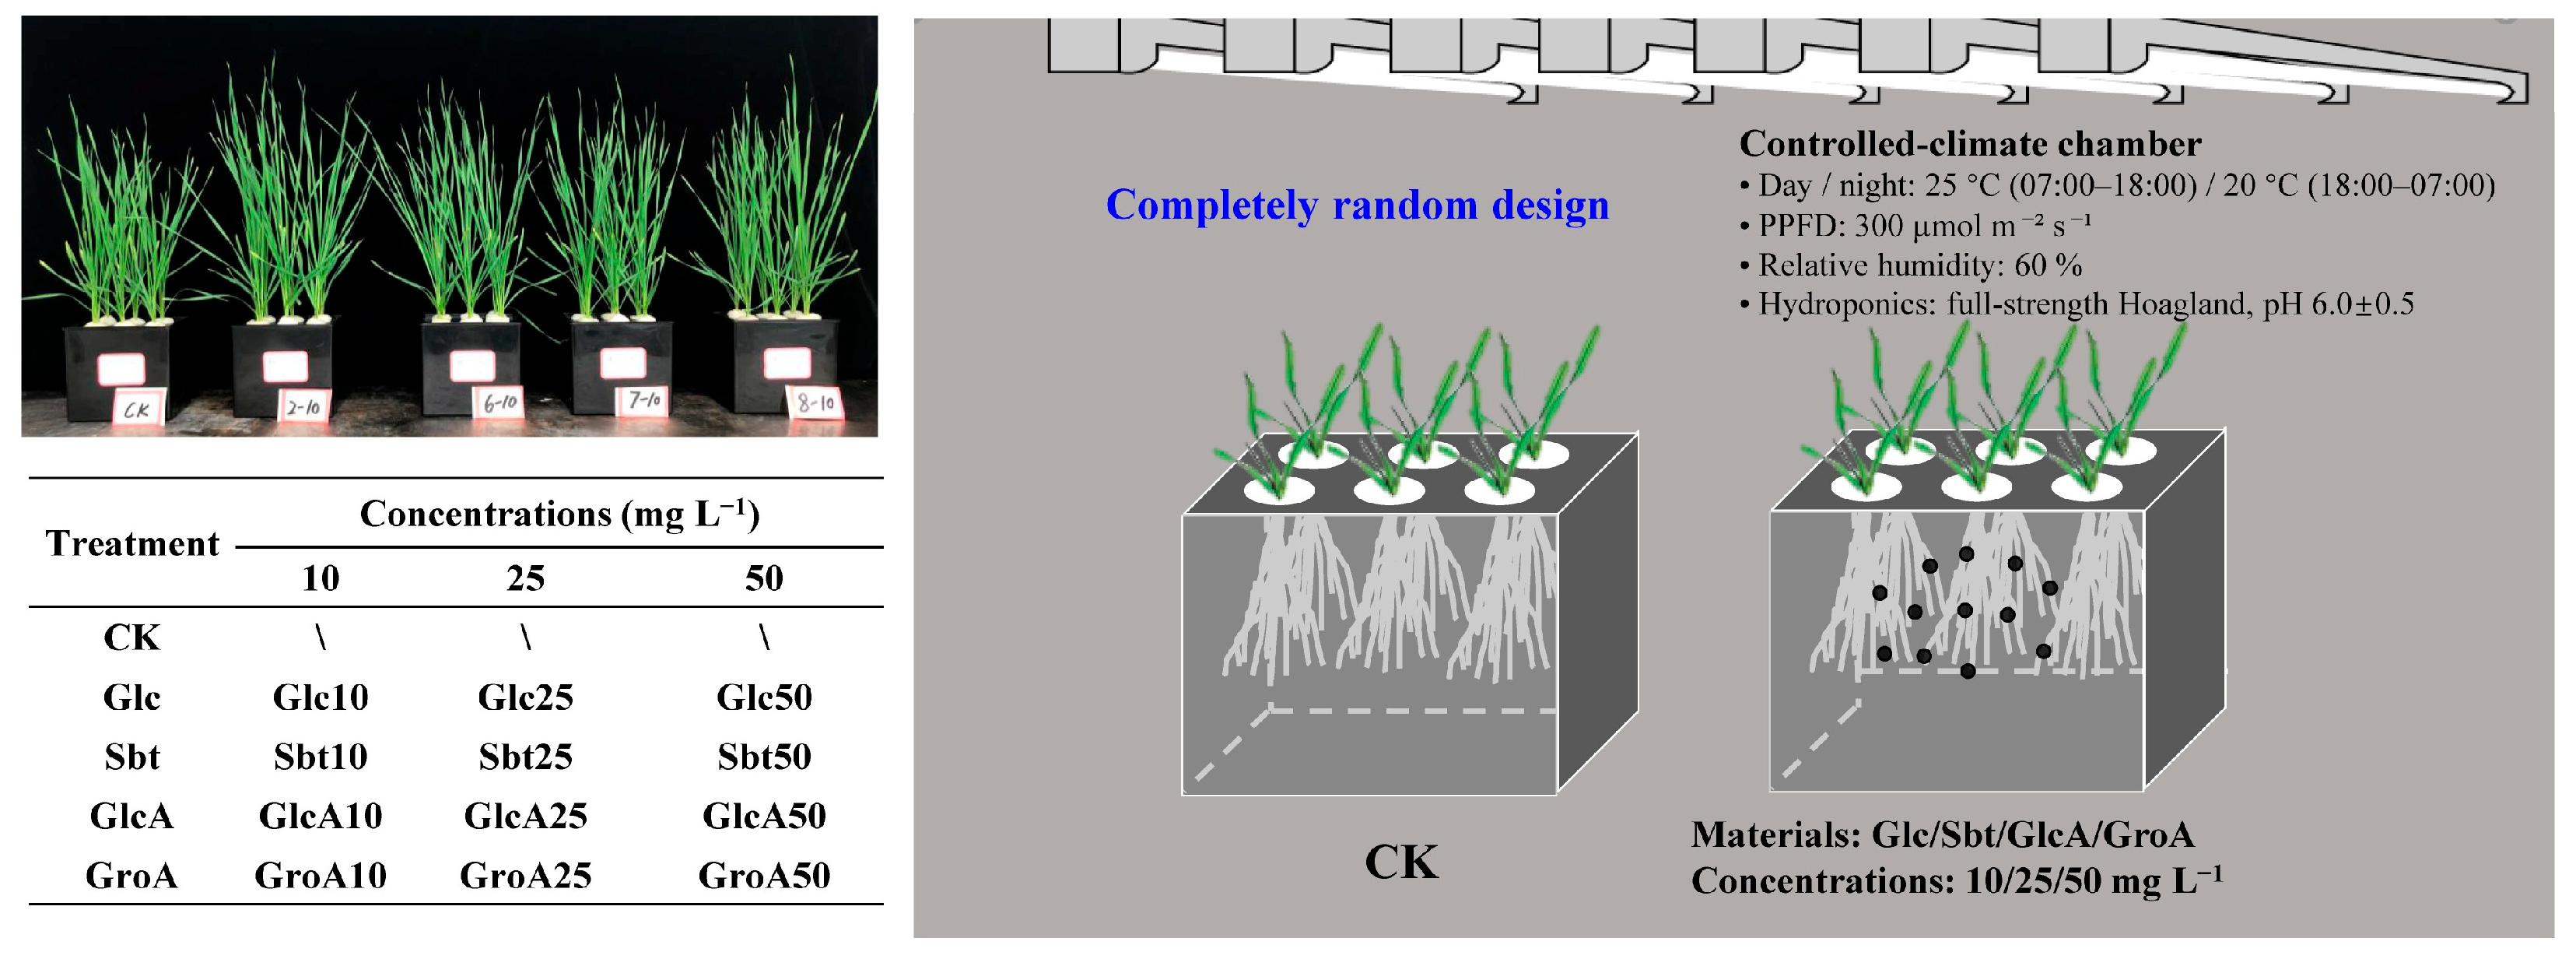
Figure 1. Schematic diagram of experimental design.
Agronomy 15 02054 g001
Figure 2. Effects of 10–50 mg L−1 of Glc, Sbt, GlcA, or GroA on the root biomass (A), aboveground biomass (B), and total dry biomass (C). Error bars represent standard deviations (n = 3). Different lowercase letters in each column indicate significant differences between treatments at the same addition level. ** indicates p < 0.01, * indicates p < 0.05.
Agronomy 15 02054 g002
Figure 3. Effect of exogenous glucose and its derivatives on N (A), P (B), and K (C) uptake of wheat. Error bars represent standard deviations (n = 3). Different lowercase letters in each column indicate significant differences between treatments at the same addition level. ** indicates p < 0.01.
Agronomy 15 02054 g003
Figure 4. Effect of glucose and its derivatives on the root length (A), Surf Area (B), Avg Diam (C), and Root Volume (D) of wheat. Error bars represent standard deviations (n = 3). Different lowercase letters in each column indicate significant differences between treatments at the same addition level. ** indicates p < 0.01, * indicates p < 0.05.
Agronomy 15 02054 g004
Figure 5. Effect of glucose and its derivatives on total absorption area (A), active absorption area (B) and root vigor of wheat. (C) Error bars represent standard deviations (n = 3). Different lowercase letters in each column indicate significant differences between treatments at the same addition level. ** indicates p < 0.01.
Agronomy 15 02054 g005
Figure 6. Effect of glucose and its derivatives on chlorophyll-a content (A), chlorophyll-b content (B), carotenoid content (C), and total chlorophyll content (D) in wheat. Error bars represent standard deviations (n = 3). Different lowercase letters in each column indicate significant differences between treatments at the same addition level. ** indicates p < 0.01, * indicates p < 0.05, ns indicates no significant differences.
Agronomy 15 02054 g006
Figure 7. Effect of glucose and its derivatives on glutamine synthetase activity (A) and soluble protein content (B) of leaves (n = 3). Error bars represent standard deviations (n = 3). Different lowercase letters in each column indicate significant differences between treatments at the same addition level. ** indicates p < 0.01, * indicates p < 0.05.
Agronomy 15 02054 g007
Figure 8. Principal component analysis of glucose and its derivatives on wheat growth and nutrient uptake at 10 (A), 25 (B), and 50 mg L−1 (C). Composite score of different treatments on growth and physiological indexes in wheat (D). Different lowercase letters in each column indicate significant differences between treatments at the same addition level.
Agronomy 15 02054 g008
Figure 9. The partial least squares path model (PLS-PM) analysis to examine the effects of glucose and its derivatives on wheat growth and nutrient uptake. Each box is a latent or observed variable, and the dashed box indicates the loadings of the latent variable with the associated observed variable. Blue arrows indicate direct positive effects, red arrows indicate negative effects, and wider arrows indicate larger effects. The asterisk in the upper right corner of the number indicates the degree of effect: * p < 0.05, ** p < 0.01. The model was evaluated using the goodness-of-fit (GoF) statistic value.
Agronomy 15 02054 g009
Figure 10. A schematic summary of the proposed structure–function relationship. Arrows denote promotion.
Agronomy 15 02054 g010
Disclaimer/Publisher’s Note: The statements, opinions and data contained in all publications are solely those of the individual author(s) and contributor(s) and not of MDPI and/or the editor(s). MDPI and/or the editor(s) disclaim responsibility for any injury to people or property resulting from any ideas, methods, instructions or products referred to in the content.