Article

Controlled-Release Nitrogen Fertilizer Enhances Saline–Alkali Soil Organic Carbon by Activating Straw Decomposition Agents

1
State Key Laboratory of Nutrient Use and Management, Key Laboratory of Wastes Matrix Utilization, Ministry of Agriculture, Shandong Provincial Engineering Research Center of Environmental Protection Fertilizers, Institute of Agricultural Resources and Environment, Shandong Academy of Agricultural Sciences, Jinan 250100, China
2
College of Resources and Environmental Sciences, Qingdao Agricultural University, Qingdao 266109, China
3
The Market Supervision and Administration Bureau of Pingyuan County, Dezhou 253000, China
4
The Agricultural Development Service Center of Kenli District, Dongying 257500, China
*
Author to whom correspondence should be addressed.
Agronomy 2025, 15(9), 2053; https://doi.org/10.3390/agronomy15092053
Submission received: 22 July 2025 / Revised: 18 August 2025 / Accepted: 25 August 2025 / Published: 26 August 2025
(This article belongs to the Section Soil and Plant Nutrition)

Abstract

Soil organic carbon (SOC) represents a crucial factor in agricultural production, and its accumulation is influenced by soil microbial community and microbial metabolism. Straw returning combined with decomposing agents is recognized practice to enhance SOC. On the other hand, the impacts of controlled-release nitrogen fertilizer (CR) on the function of the decomposing agent in degrading straw are underexplored. In this study, an incubation experiment with 13C labeled straw in three nitrogen fertilizer treatments (CK, no nitrogen applied; UR, urea applied; CR, controlled-release fertilizer applied) was carried out to elucidate how CR regulates the straw decomposition agent and bacterial community to influence the SOC sequestration, based on field experiments. And we examined the changes in soil organic carbon and the stability of the bacterial networks by combining co-occurrence networks and a structural equation model. In the incubation experiment, the results demonstrated that CR increased the relative abundance of straw decomposition agent and straw-derived SOC (SO13C). Additionally, CR enhanced the stability of soil bacterial networks, compared with UR, by strengthening the interactions within the soil bacterial community. Pearson correlations confirmed that straw decomposition agent was positively associated with SO13C. Moreover, the straw decomposition agent was positively correlated with the activities of the nitrogen-cycling enzyme (urease, N-acetyl-β-glucosaminidase) and carbon-degrading enzyme (β-1,4-glucosidase, cellulase). Furthermore, structural equation modeling indicated that soil inorganic nitrogen played the most direct role in changes in the straw decomposition agent and then indirectly stimulated the activity of cellulase, ultimately increasing straw-derived carbon in the soil. This study elaborates the mechanism of straw returning combined with straw decomposition agent and controlled-release fertilizers to enhance the SOC of coastal saline–alkali soil from the perspective of underground biology. Collectively, the results of this research might improve the management of straw returning and sustainable utilization of fertility in saline–alkali soil. It provides a new perspective on fertilization for increasing soil carbon sequestration in future farmland ecosystems.

1. Introduction

SOC constitutes the largest reservoir of carbon in the biosphere. Preserving and regenerating soil organic carbon is at the core of mitigating climate change and ensuring food security [1]. In agroecosystems, the global production of crop straw has reached 3.8 Gt yr−1, which serves as a crucial component of agricultural carbon footprint [2]. Straw returning has been widely recognized as an effective management practice to promote SOC storage globally. The effects of straw return on SOC sequestration are determined not only by the type of straw-derived carbon and quality of organic matter inputs, but also highly depend on soil microbial activities [3,4].
Soil microorganisms are known to play a vital role in ecosystem services and ecological functions. By participating in the formation and decomposition of exogenous soil organic matter (SOM), soil microorganisms contribute to essential ecosystem services such as soil carbon sequestration, soil health and plant productivity [5,6,7]. Soil microorganisms modify the soil organic matter or exogenous organic matter (e.g., in terms of quantity, size, distribution, composition and stability) through in vivo turnover and ex vivo modification [8]. These activities result in a close connection between microorganisms and SOM dynamics, especially in ex vivo biological processes such as extracellular enzyme-mediated reactions [9]. Previous research has proposed that the effectiveness of straw returning in SOC sequestration must be enzymatically degraded before microbial assimilation, suggesting that extracellular enzymes play an essential role in exogenous carbon mineralization [10]. For example, the enzyme cellobiohydrolase is closely associated with the degradation of cellulose, which is a major component of straw returned to soils [11]. Following depolymerization of cellulose, β-1,4-glucosidase hydrolyzes the resulting oligosaccharides into low molecular weight sugars [12,13]. β-1,4-N-acetylglucosaminidase is often used as an indicator of straw decomposition and nutrient release [14].
However, in situ soil microorganisms are often unable to decompose straw efficiently due to low microbial biomass and diversity, a loss of ecosystem functions, and weakened interactions among microorganisms, resulting in a reduction in the quality and quantity of straw returned [15].Thus, the effect of decomposition agent on straw return is an essential area of interest. Relevant studies indicate that inoculation of a decomposition agent can significantly alter the microbial community’s composition and enhance metabolic activity within the agricultural system [16]. For example, Bacillus strains can release various metabolites to degrade cellulose, hemicellulose and lignin in straw [17]. Straw decomposition agents have been widely used to accelerate straw decomposition globally, but such decomposition processes are frequently constrained by nitrogen deficiency [18]. Saline–alkali soil has insufficient N to meet the microbial N demands required for straw decomposition, forcing microbes to decompose soil organic matter to obtain N for straw degradation [19]. Therefore, straw returning to the field requires sufficient nitrogen fertilizer to meet the nutrient requirements of microorganisms during the straw degradation process [20].
Urea application, a practice for increasing soil nitrogen, accelerates the decomposition of the readily decomposable carbon pools in straw during the early stages. However, due to the rapid depletion of nutrients, the decomposition and transformation rate of straw in the middle and late stages slows down and is even inhibited [21]. Straw not only contains easily decomposable organic matter, but also low-quality substrates rich in lignin and cellulose, with a decomposition process lasting up to 2 months or even over 2 years. And some research reported that during most stages of straw decomposition, the soil C:N needs to be maintained at approximately 25:1 [22,23]. Therefore, to improve the efficiency of returning straw to the field, a continuous input of nitrogen sources is required. Compared with urea, controlled-release fertilizers slowly release nutrients according to the release rate and period, which is beneficial for meeting the continuous N demands of the straw decomposition agent [24]. In this study, a microcosm experiment with 13C labeled straw was established based on a long-term field N fertilizer experiment to: (1) Explore the effect of controlled-release fertilizer on the straw decomposition agent; (2) Clarify the microbial groups and interactions, as well as the key soil enzyme activities involved in SOC. We hypothesized that: (1) Controlled-release fertilizer would strengthen the stability of soil bacterial networks, which will be confirmed by network analysis; (2) Controlled-release fertilizer might enhance the function of straw decomposition agents to boost enzyme activities and subsequently increase the soil SOC, which will be verified through structural equation modeling (SEM) and enzyme activity assays.

2. Materials and Methods

2.1. Soil Sampling in Field Experiment

The field experiment was established in 2017 at the seed multiplication farm located in Kenli, Shandong Province (37°24′ N, 118°15′ E), according to soil salt, pH, nitrogen and organic carbon content. This region is characterized by a warm temperate continental monsoon climate. The average annual temperature is 14.0 °C, and the precipitation is 555.9 mm. All the agricultural sites had been farmland with winter wheat and summer maize rotation systems, and fertilization followed the local intensive production patterns by local farmers. This experiment randomly implemented two application treatments: urea applied (UR) and controlled-release fertilizer applied (CR). The experiment adopted a completely randomized block design with three replicates. The size of each plot was 105 m2 (7 m × 15 m). For all treatments, straw was returned to the fields and straw decomposition agent was applied. The controlled-release fertilizer was coated with a water-based polymer. Nitrogen fertilizer was applied at sowing time each year at a rate of 225 kg ha −1. The straw decomposition agent mainly contained Bacillus and Streptomyces. In 2020, 2022 and 2023, at the ripening stage of maize, five soil cores were randomly collected from each plot using a 4 cm diameter auger at a depth of 0–20 cm and then homogeneously mixed to form a composite sample. Soil samples were air-dried for soil physical and chemical analysis. The fresh samples were stored individually in plastic bags and kept at 4 °C in a refrigerator.

2.2. Soil Incubation Experiment

The test soil was collected from the abandoned land next to the field experiment. The test soil characteristics were as follows: SOC was 9.5 g kg−1, the soil total nitrogen was 0.49 g kg−1 and the soil salt content was 3.1 g kg−1. Soil incubation experiment was designed based on the field experiment. The experiment was conducted from 5 November 2023 to 5 February 2024. Incubation was carried out in an incubator at 25 °C for all stages. The treatments were consistent with those in the field experiment. Plastic pots (inner diameter 10 cm, height 10 cm) were used to incubate 500 g fresh soil. 2g isotope-13C labeled straw (13C maize residue, 5 atom % 13C) was added into each pot. After incubation of 30, 60 and 90 days, destructive sampling was carried out. Each treatment has 5 replicates at each collected stage. A total of 45 samples (3 treatments × 3 harvests × 5 replications) were arranged in a randomized complete block design. To calculate the 13C stock in different pools, soil without straw returning was also included in the design. Throughout the incubation, the moisture content was monitored daily and maintained at 20% water content by adding sterile deionized water when necessary. At harvest, each soil sample was mixed and passed through a 2 mm sieve. Two fresh subsamples were taken from these samples for analysis of microbial biomass, enzyme activity, and microbial communities, and stored at 4 °C and −80 °C, respectively. To avoid cross-contamination of microorganisms between samples, the sampling tools used for each sample were sterilized with alcohol. Another soil subsample was air-dried for soil chemical analysis.

2.3. Soil Properties Analysis

SOC was determined using an elemental analyzer (EA1108, Carlo Erba, Turin, Italy). For soil microbial biomass carbon (MBC), a chloroform fumigation extraction method with K2SO4 solution was employed. The same amount of soil was extracted without fumigation [25]. From this, 10 mL of the filtrate was used to determine organic carbon content, and the remaining filtrate was similarly freeze-dried, polished and sieved through a 0.15 mm mesh for δ13C value analysis [26]. The organic C in the non-fumigated extracted solution was regarded as DOC. The values of δ13C in the SOC, MBC and DOC were measured by a MAT 253 isotope ratio mass spectrometer (LC-Isolink-IRMS, Thermo Fisher Scientific, United States of America). Soil NO3 and NH4+ were extracted from fresh soil samples using calcium chloride and measured by a Flowing Analyzer. Soil available phosphorus (AP) was extracted by NaHCO3 and determined according to the Olsen method. Soil pH was measured by pH monitoring with a dry soil to water ratio of 1:5. The activities of two C-acquiring enzymes (β-1,4-glucosidase, BG; cellulase, CES) and N-acquiring enzymes (Urease; N-acetyl-β-glucosaminidase, NAG) were assessed by ELISA kit (catalog number was RE9482-48T, RE9338-48T and RE9432-48T, respectively) provided by the Shanghai Hengyuan Biological Technology Co. Ltd. (Shanghai, China). The soil samples of three collected stages were used to determine the SOC, DOC, MBC, NO3, NH4+ and enzyme activities. And the last collected soil samples were used to determine the values of δ13C in the SOC, MBC and DOC.

2.4. High-Throughput Sequencing

According to temporal variation in SOC, enzyme activities, NO3 and NH4+ over time, the last collected soil samples were used to determine the microbial community. Fifteen samples of microbial genomic DNA were extracted from 0.5 g fresh soil using the PowerSoil™ DNA Isolation Kit following the manufacturer’s instructions. The quality and concentration of DNA was assessed by agarose gel electrophoresis and a NanoDrop spectrophotometer [27]. Primers 515 F (5′-GTGCCAGCMGCCGCGG-3′) and 806 R (5′-GGACTACHVGGGTWTCTAAT-3′) were used for amplification of the bacterial 16S rRNA targeting the V3–V4 region [28]. These amplified PCR products were sequenced on the Illumina MiSeq PE300 platform (San Diego, CA, USA).
The DNA sequences were analyzed through the quantitative insights into microbial ecology (QIIME1) pipeline. To obtain high-quality sequences, the low-quality regions with a quality score < 20 were removed using Pear (v0.9.6), including ambiguous nucleotides, sequencing lengths of less than 150 bp, or not matching the primer and barcode. Vsearch (v2.7.1) was used to cluster the high-quality sequences into operational taxonomic units (OTUs) at the 97% similarity level. The Silva database was used to assign bacterial taxonomy. Finally, 8966 OTUs for the bacteria were obtained.

2.5. Bioinformatic Analyses of Sequencing Data

The co-occurrence network was constructed for bacterial communities at the genus level using the “igraph” R package (R x64 4.1.0) based on the Spearman correlation method (|r| ≥ 0.7, and FDR-adjusted p < 0.05). Only genera with a mean relative abundance in the top 200 and occurring in ≥50% of all samples (fifteen samples) were selected to construct the network. Gephi (0.9.2) was used to visualize the network images. Moreover, to construct network for each sample, a symmetric unweighted matrix was computed using the “subgraph function” in the igraph package. To understand the effect of controlled-release fertilizer on bacterial interactions, the network topological characteristics were extracted, including node number, edge number (positive and negative correlations) and average degree. In a network structure, degree is a core indicator for measuring the connectivity of a node, which is used to describe the number of direct connections between a single node and other nodes. The negative correlation of a network structure is an indicator used to describe the negative association between different nodes in the network. Robustness is one of the indicators characterizing the stability of a network [29]. To determine the stability of the microbial networks, the network robustness index was calculated. The network robustness index is performed by simulating the extinction of 50% taxa and calculating the proportion of remaining species (half robustness) [30].

2.6. Calculations

The carbon fraction derived from the straw in all SOC, non-fumigated solution (DOC) and fumigated solution pools (Fm) was calculated according to Poll et al. [31] and Wild et al. [32]:
Fm = (13C atom%sm13C atom%c)/(13C atom%m13C atom%c) × 100%
where Fm represents the proportion of carbon derived from wheat straw in the soil amended with wheat straw, i.e., the contribution ratio of straw carbon to the soil organic carbon pool; 13C atomsm is the 13C abundance of the soil amended with wheat straw; 13C atomc is the 13C abundance of the soil without wheat straw amendment; 13C atomm is the 13C abundance of the initially added wheat straw.
The amount of straw-derived carbon (13Cpool) in each C pool was calculated according to Wild et al. [32] and Blaud et al. [33]:
13Cpool = Cpool × Fm/100
where Cpool is the amount of SOC, non-fumigated solution (DOC) and fumigated solution pools.
The amount of straw-derived carbon (13Cpool) in MBC and DOC pools was calculated as follows Li et al. [34]:
MB13C = 13Cfumigated13Cnon-fumigated
DO13C = 13Cnon-fumigated

2.7. Statistical Analysis

Structural equation modeling (SEM) was used to evaluate the direct and indirect relationships between N fertilizer, microbial indicators and soil organic carbon. The goodness of fit for the model was judged by the Chi-square test (χ2-test, 0 < χ2/df < 2, p > 0.05), root mean square error of approximation (RMSEA, RMSEA ≤ 0.05, 0.10 < p ≤ 1.00) and Bollen–Stine bootstrap test (0.10 < Bootstrap p ≤ 1.00). All SEM analyses were conducted using IBM SPSS Amos 23 (Armonk, NY, USA). A one-way analysis of variance was performed to assess the effects of N fertilizer on soil properties and microbial indicators using IBM SPSS Statistics 23. Nonmetric multidimensional scaling (NMDS) was used to investigate the community dissimilarities among different treatments. The stress value is an important indicator for evaluating the quality of model fitting. When stress is <0.2, NMDS reproduces an adequate depiction of the groups.

3. Results

3.1. Soil Organic Matter and Nitrogen

The results of the field experiments showed that there was no significant difference in the content of SOM between the CR and the UR treatment (Figure 1a, Table S1). For the increment in organic carbon, CR treatment is significantly higher than that in the UR treatment (Figure 1b, Table S1). For content of NO3 and NH4+, CR treatment showed significantly higher content of NO3 in 2023 compared with UR treatment (Figure 1c, Table S1), and CR treatment showed significantly higher content of NH4+ in 2022 compared with UR treatment (Figure 1d, Table S1).
In the soil incubation experiment, it was observed that the SOC in all treatments exhibited an increasing trend during the incubation time (Figure 2a, Table S2). At 90 d, a significant difference was observed, with the CR showing the highest DOC value (Figure 2b, Table S2). The MBC in CR was significantly higher than that in UR at the incubation time of 30 and 90 d (Figure 2c, Table S2). At the incubation time of 90 d, significant differences in SO13C and MB13C were detected among CK, UR and CR (p < 0.01), with the highest values found in CR (Figure 2d–f, Table S2). NO3, NH4+ and SIN in UR were significantly higher than those in CR at the incubation time of 30 and 60 d (Figure 3a,b, Table S3). However, NO3 and SIN in CR were significantly higher than those in UR at the incubation time of 90 d (Figure 3c, Table S3).

3.2. Extracellular Enzyme Activity Targeting Soil Carbon and Nitrogen

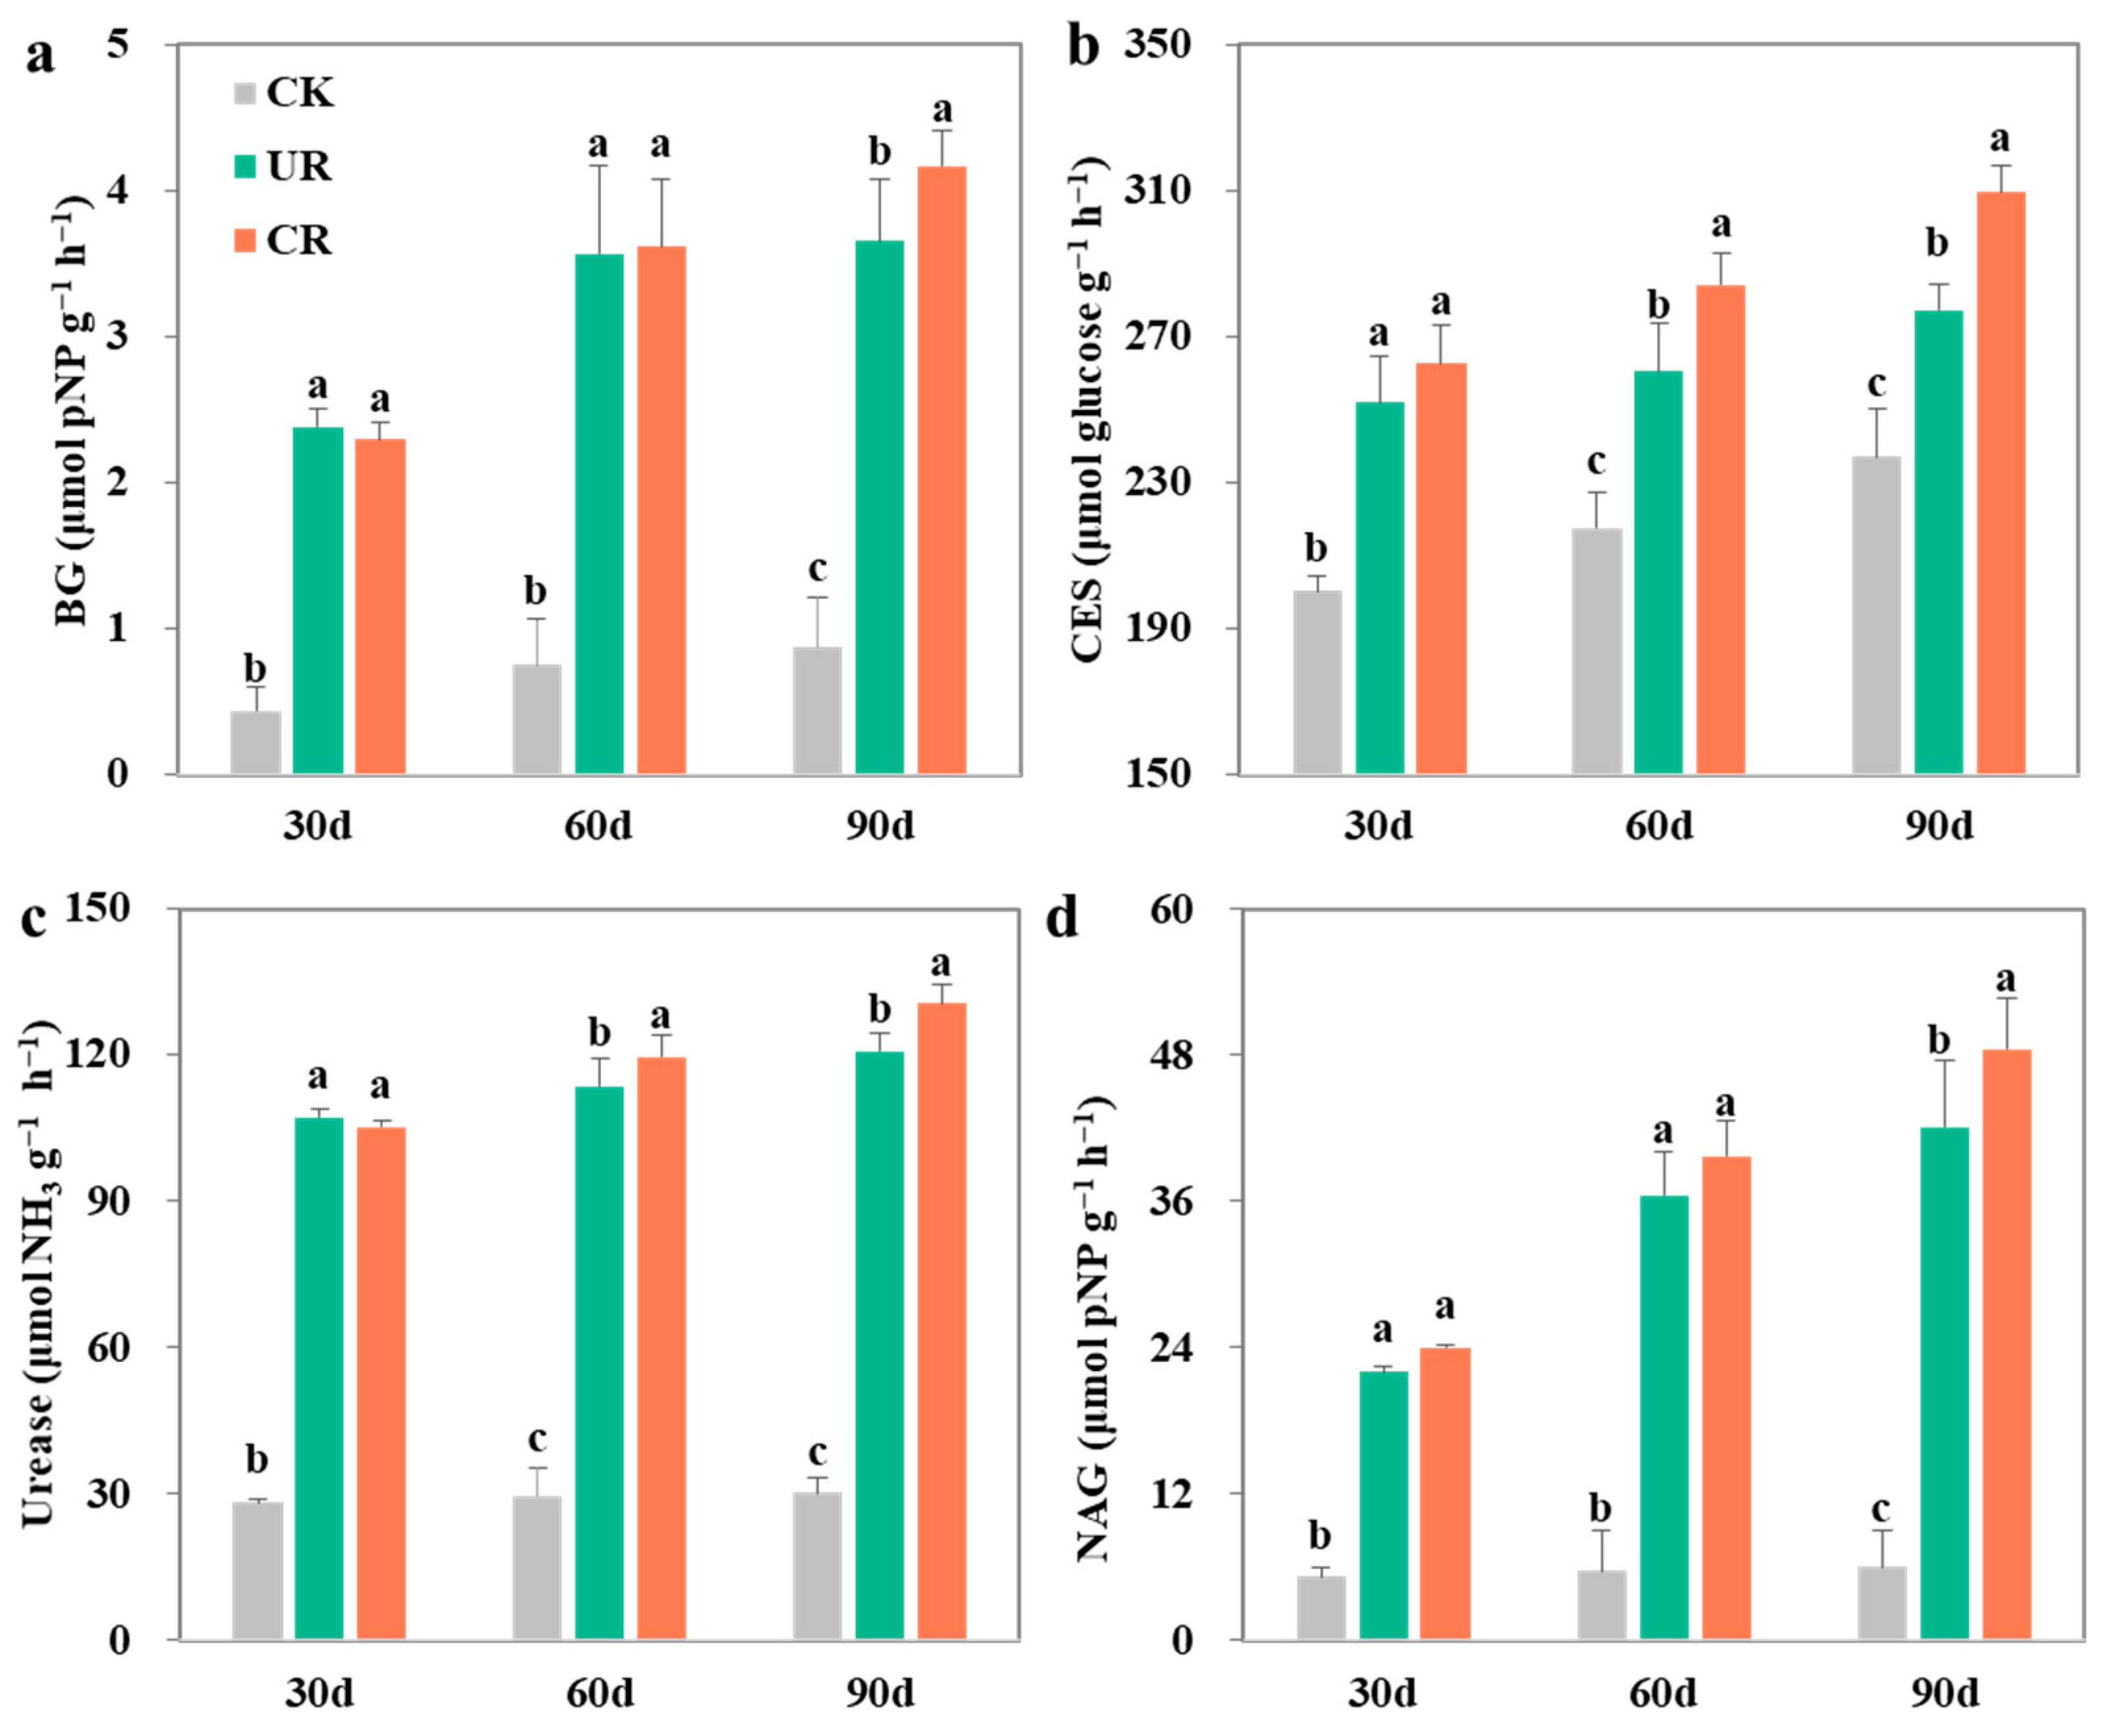
The activities of BG and CES showed an increasing trend in three treatments during the whole incubation time, with the significantly lowest values observed in CK (Figure 4a,b). And a significant difference was observed between UR and CR at the incubation time of 90 d, with the highest value found in CR (Figure 4a,b, Table S4). The activities of urease and NAG showed similar trends as BG and CES (Figure 4c,d, Table S4). The activities of urease in CR were significantly higher than UR at the incubation time of 60 and 90 d. The activities of NAG in CR were significantly higher than UR at the incubation time of 90 d.

3.3. Soil Bacterial Community Composition and Interactions

An NMDS test showed that the bacterial community composition was significantly affected by the type of nitrogen fertilizer (Figure 5d). CR and UR both caused significant changes in the bacterial community’s structure. Bacteroidota and Proteobacteria were the dominant bacterial phyla for CK, with relative abundance ranging from 31% to 40% and 25% to 46% in each soil sample (Figure 5a, Table S4). Bacteroidota (25–44%) and Firmicutes (11–38%) were the dominant phyla for UR and CR. UR significantly decreased the species richness (Chao1 index) and Shannon diversity of the bacterial community, while there were no significant differences between CK and CR (Figure 5b,c, Figure S1). Moreover, the results showed that CR significantly increased the relative abundance of straw decomposition agents (Bacillus and Streptomyces) in the bacterial communities (Figure 5e,f).
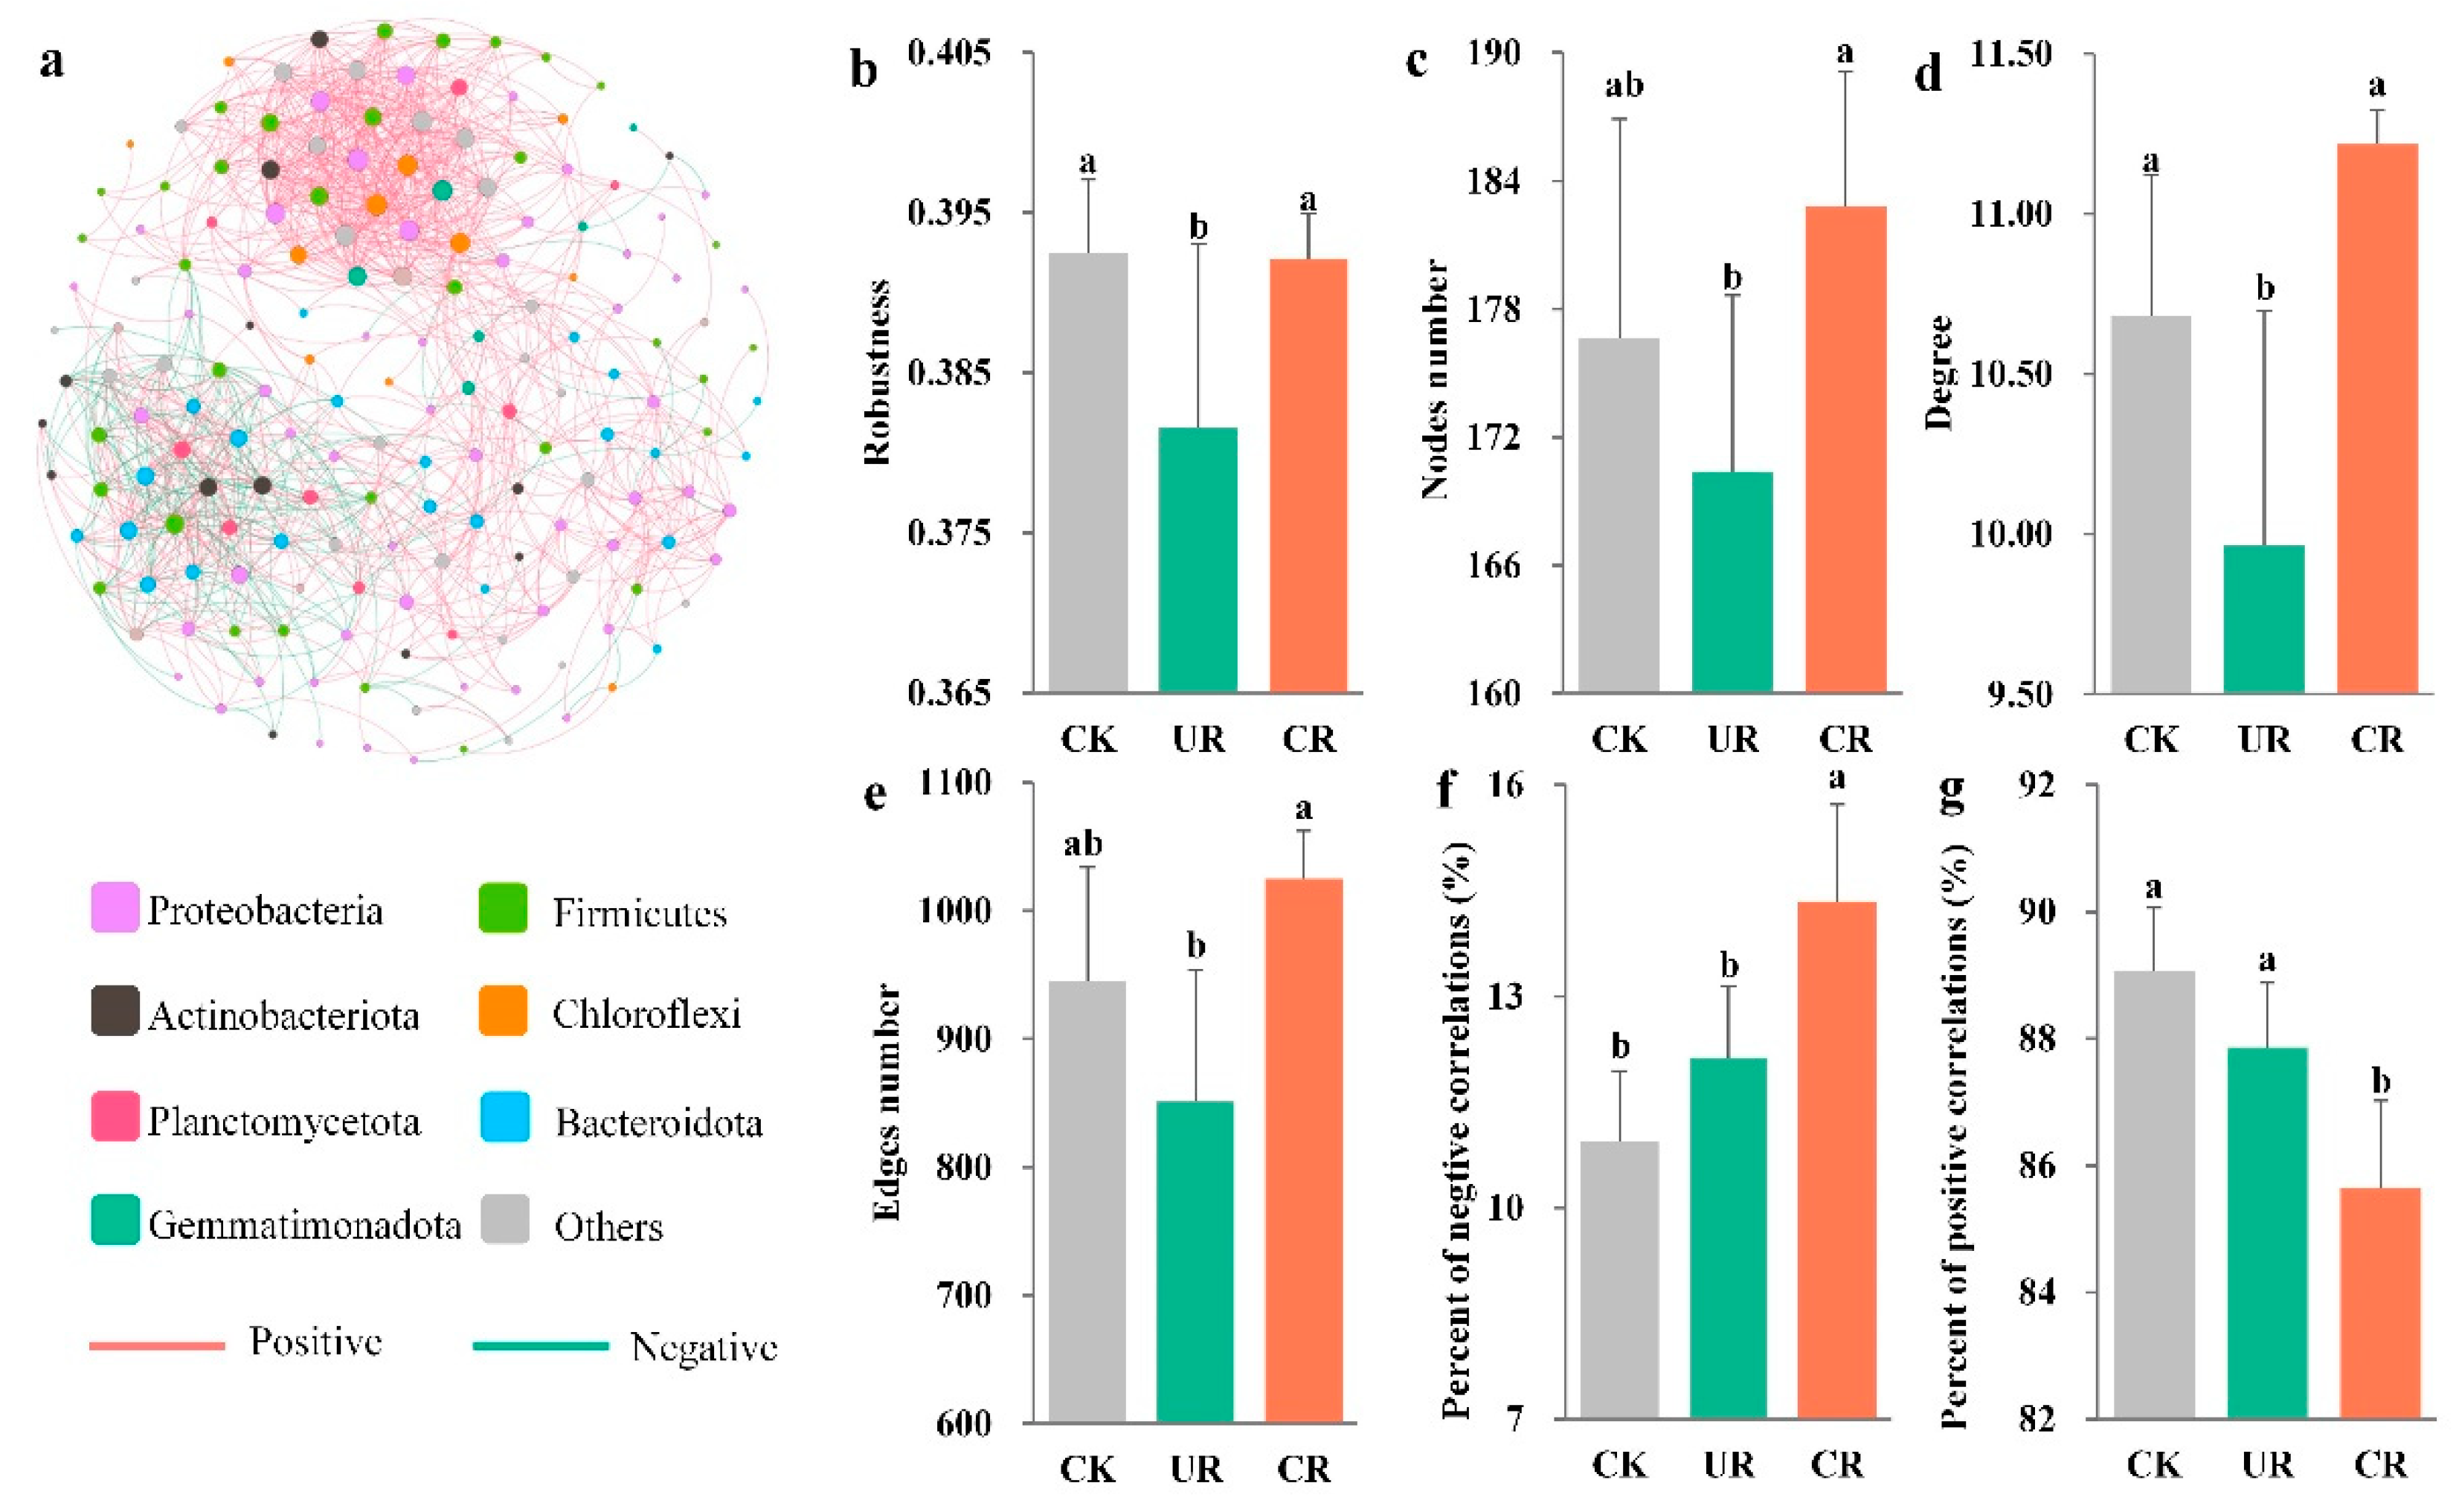
The co-occurrence network analysis suggested that the number of nodes and edges, and degree in CR showed no significant differences compared with those in CK, whereas they were significantly higher in CR compared with UR (Figure 6a–d). Additionally, CR significantly increased the proportion of negative correlations of network (Figure 6e,f). Regarding the stability of bacterial networks, UR significantly decreased the half robustness of bacterial networks, and there were no significant differences between CK and CR (Figure 6g).

3.4. The Impacts of Bacterial Community on Soil Organic Carbon

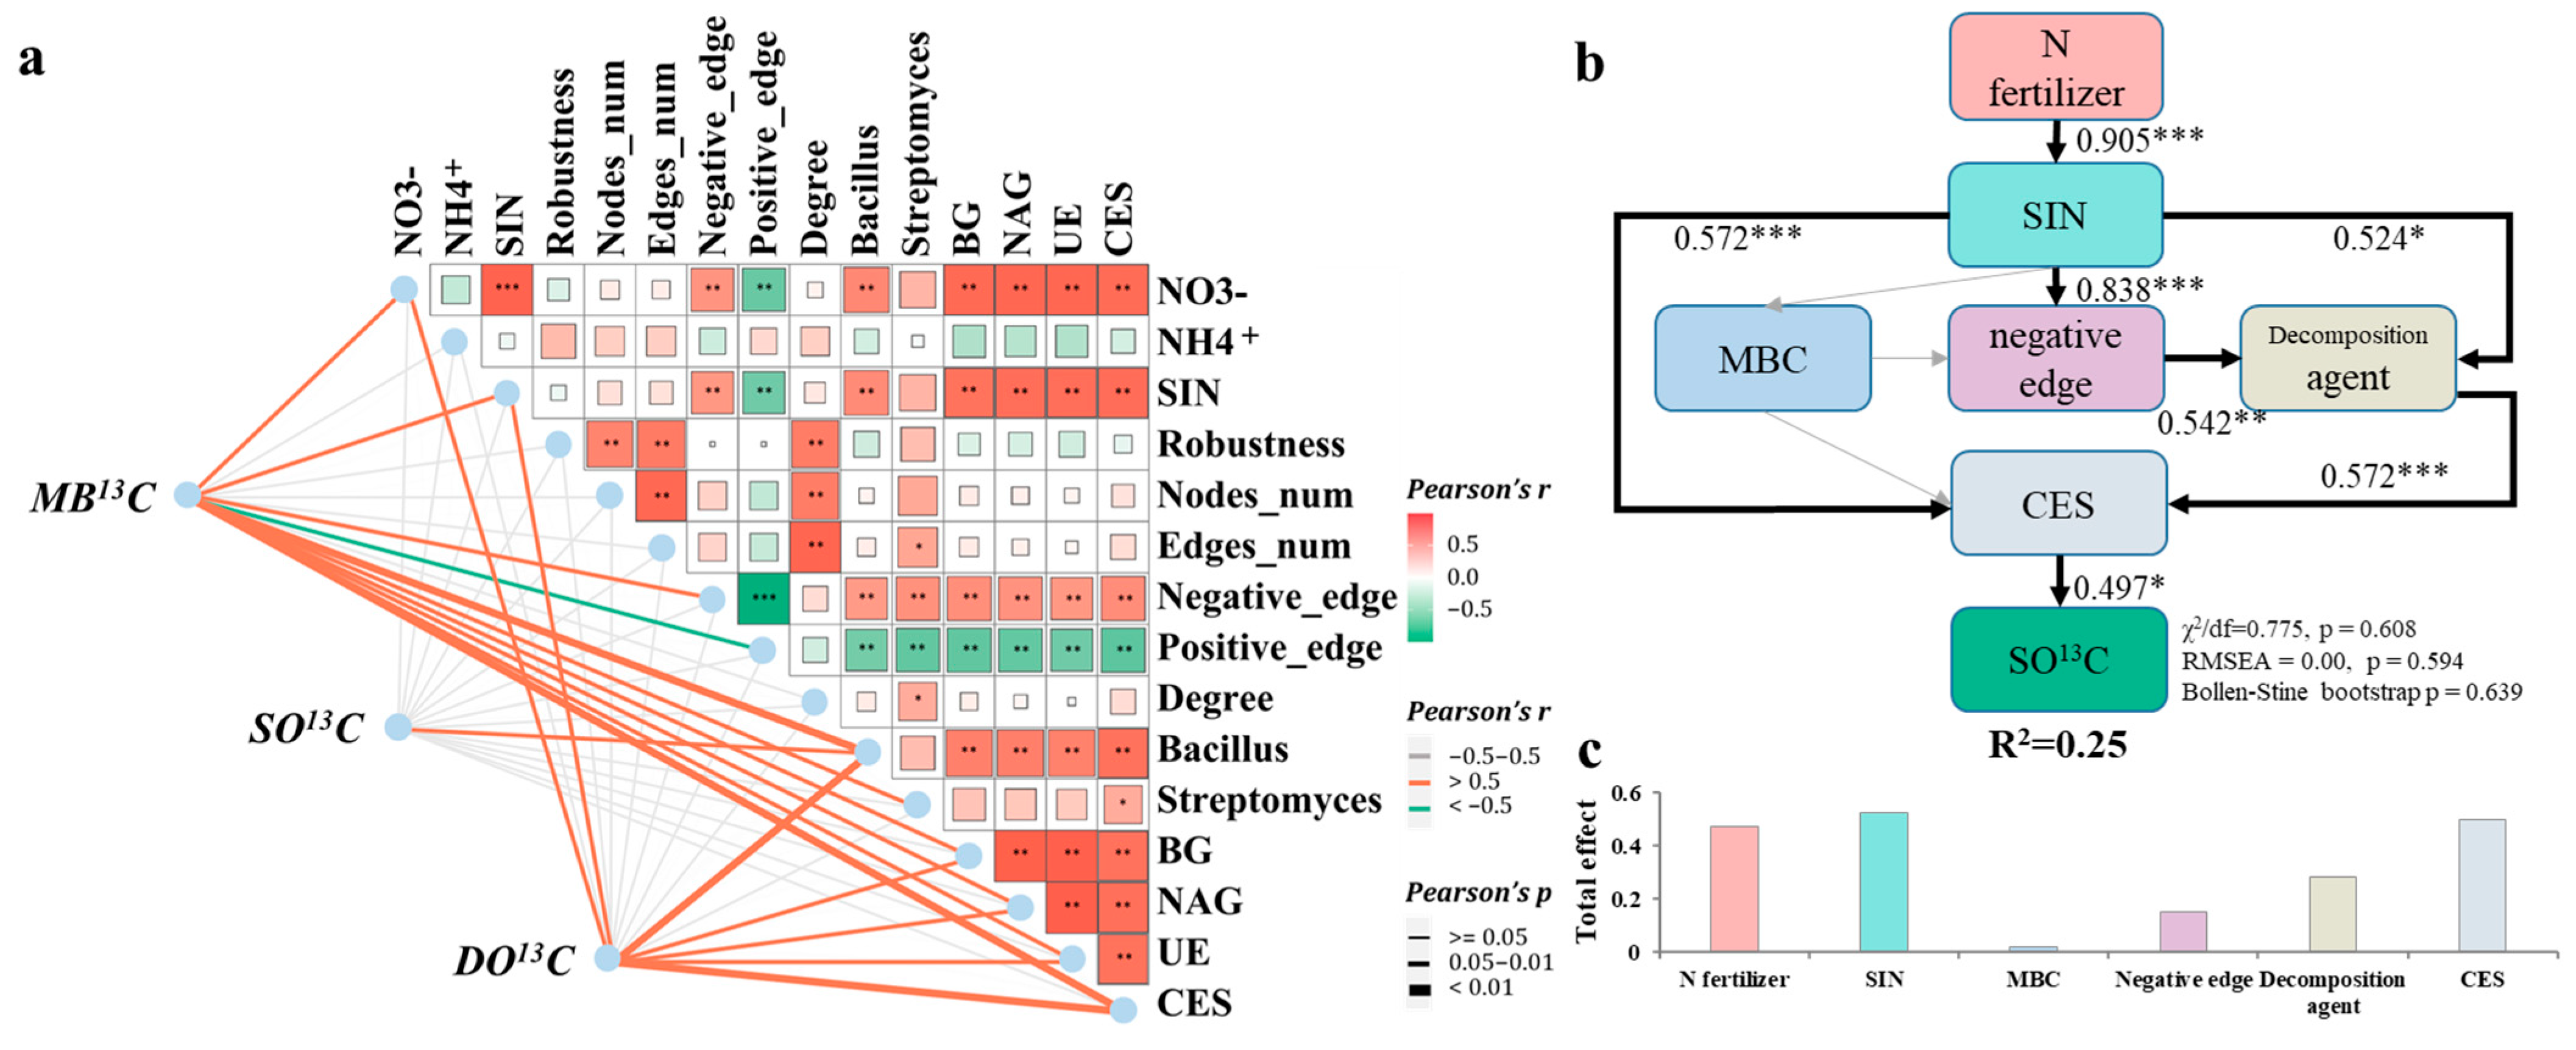
According to Pearson’s analysis, Bacillus was significantly correlated with SO13C. NO3, Bacillus, BG, CES, NAG and UE showed positive relationships with both MB13C and DO13C. And Pearson’s test was employed to analyze the relationship between the bacterial community and enzyme activities. The results showed that the proportion of negative correlations and Bacillus were both positively correlated with the activities of all enzymes (BG, CES, NAG and UE) (Figure 7a).
SEM linking the treatments, bacterial community, decomposition agent, enzyme activities and SO13C was performed on the data (Figure 7b,c, χ2/df = 0.775 with p = 0.608, bootstrap p = 0.639, RMESEA = 0.000 with p = 0.594). Our SEMs explained 25% of the variance in the SO13C. SEM further predicted that the relative abundance of straw decomposition agent, as a major property of the bacterial community, drove the changes in the CES, and SO13C was directly influenced by the CES (Figure 7b,c).

4. Discussion

4.1. Response of SOC Stocks to N Fertilization

Soil nutrients serve as crucial regulators for decomposition of crop residues and SOM, which is largely responsible for soil carbon dynamics in agroecosystems. In the present study, the results of the incubation experiment further indicated that application of N fertilizer was conducive to promoting the fixation of straw in soil and transformation to soil organic carbon. Under the conditions of this study, the controlled-release fertilizer sequestrated more organic residues derived from straw that were decomposed to storage in soil compared to the no-fertilizer and urea-fertilizer treatments. Some researchers reported that controlled-release fertilizer significantly contributed to the increment in enzyme activities, mainly due to the increased NO3 content [35]. These might be important factors to improve straw degradation and cause changes in SOC. However, some previous studies showed conflicting results regarding the response of SOC to N fertilizer under straw returning. Liu et al. [36] and Yan et al. [37] found that application of N fertilizer did not show a contribution to SOC sequestration. This is because high nutrient availability is conducive to accelerating the decomposition of straw residues and SOM by narrowing the C-to-N ratio [36,37]. Notably, the experimental site of this study is coastal saline–alkali land with high salinity, which can directly inhibit soil microbial growth activity and abundance, ultimately leading to a decreased rate of mineralization of organic nitrogen [38,39]. As a result, low soil nitrogen leads to restriction of microbial nitrogen demand in the process of straw decomposition. Therefore, an input of nitrogen fertilizer is required to offset retention of soil inorganic nitrogen by soil microorganisms, alleviate the deficiency of microbial nitrogen demand during the process of straw decomposition [40] and inhibit the decomposition of SOC, ultimately increasing soil organic carbon [41,42].

4.2. Controlled-Release Fertilizer Strengthens the Stability and Interaction of Soil Bacterial Community

Input of controlled-release fertilizer significantly enhances the stability of soil bacterial networks by intensifying the interactions of the soil bacterial community, which is consistent with our first hypothesis. The results of this study are highly consistent with the research findings of Barberán et al. [43] and Meng et al. [44] regarding the impacts of controlled-release fertilizer on the complexity of soil microbial networks and nitrogen supply. Our results clearly indicate that soil with controlled-release fertilizer exhibits more complex characteristics in the topological structure of the bacterial network, specifically manifested as a significant increase in the number of edges, negative edges and nodes, compared with urea fertilizer. Particularly crucial is that there exists a close connection between the stability of the bacterial network and the proportion of negative correlations. Ecological modeling indicated that negative associations could promote stability of communities [45,46]. Most studies have indicated that the input of controlled-release fertilizer can create unique environments and influence microbial assembly [47]. The application of controlled-release fertilizer not only provides a continuous and stable nutrient source for the growth and reproduction of microorganisms, but it also stimulates the competitive interactions at the bacterial species level. As a result, competition interactions prompt bacterial species to continuously optimize their utilization strategies for limited resources, thereby significantly improving the resource-use efficiency of the entire soil ecosystem [48,49]. And not only microbial biomass; this study found that bacterial diversity with controlled-release fertilizer was clearly higher than treatment with the urea fertilizer. Some studies have revealed that microbial community diversity has the potential to strengthen competition interactions and functional redundancy among bacterial species, which are the key factors for enhancing the stability of the microbial network [50,51].

4.3. Controlled-Release Fertilizer Increases SOC by Strengthening the Functions of Straw Decomposition Agent

Compared with urea and no N fertilizer, controlled-release fertilizer increased the SOC by enhancing the function of straw decomposition agents to boost enzyme activities, which is consistent with our second hypothesis. According to Pearson’s analysis, SO13C and DO13C were positively correlated with the relative abundance of Bacillus, which is linked to straw decomposition and possesses strong enzyme-mediated hydrolytic activities of cellulose [52]. This result showed that Bacillus mainly secretes cellulase and β-1,4-glucosidase to promote the decomposition of straw cellulose. This finding agrees with Siu-Rodas et al. [53], who reported that bacteria of the genus Bacillus could produce the highest cellulase activity. And Wang et al. [54] reported that Streptomyces is mainly responsible for the secretion of N-acetyl-β-glucosaminidase, which is a key link in promoting the degradation of chitin [55]. However, this study did not show a significant relationship between Streptomyces and activity of N-acetyl-β-glucosaminidase. SEM results further indicated that the straw decomposition agents were the most important biotic factor responsible for increasing cellulase activity, which indirectly increased the contribution of straw-derived C to SOC, consistent with the results of [56]. The straw decomposition agents used in this study have strong stress resistance and excellent salt tolerance. Therefore, compared with local microorganisms, it enriched rapidly and proliferated after the increase in metabolic substrates. In addition, the slow and incomplete release of nitrogen from the controlled-release fertilizer led to higher SIN contents in the soil, thus providing sufficient nutrients for the straw decomposition agents to secrete C-cycling enzyme activities (β-1,4-glucosidase and cellulase), which was congruent with the results of Zhou et al. [57]. We also noticed that the proportion of negative links in bacterial networks was significantly correlated to the relative abundance of the straw decomposition agents and activities of the C-cycling enzyme. A number of studies have found that competition interactions within microbial communities are considered critical for community functions [45,58], although this was poorly understood in straw decomposition agents. Therefore, the interaction between the controlled-release fertilizer and the straw decomposition agents increases the contribution of straw-derived C to SOC by a combination of biotic and SIN. In general, CR was beneficial to balancing the structure and function of bacterial communities by maintaining an appropriate level of soil nitrogen. This enhanced interactions among soil microorganisms and improved the enzyme activities for straw degradation through positive feedback, and thus facilitated the sequestration of straw carbon in the soil. Additionally, these biotic and abiotic properties explained a 25% variance in the SO13C. In addition to bacterial communities in soil, fungal communities are also major participants in straw decomposition. Compared with bacteria, they can secrete laccase and Lignin peroxidase that decompose lignin in straw [59,60]. However, in this study, the impact of changes in fungal communities on soil organic carbon was not investigated; this will be included in future research.

5. Conclusions

Consistent with our hypothesis, our research also indicates that controlled-release fertilizer would strengthen the stability of soil bacterial networks by increasing the negative correlations which will be confirmed by network analysis. Moreover, SEM results indicated that controlled-release fertilizers directly affect straw decomposition agents by changing the content of soil inorganic nitrogen. In turn, straw decomposition agents enhance the activity of enzymes related to soil carbon cycling, thus promoting the sequestration of straw-derived carbon in the soil. Compared with farmers’ usual practice of applying urea (basal fertilizer + topdressing), controlled-release fertilizers (CR) usually adopt a one-time fertilization strategy, which is superior to UR in terms of labor reduction. However, this study only explored the impact on soil ecology and did not investigate it from an economic perspective. Further studies are needed to reveal more detailed linkages among controlled-release fertilizers CR, economy and environment.

Supplementary Materials

The following supporting information can be downloaded at: https://www.mdpi.com/article/10.3390/agronomy15092053/s1, Figure S1: Effect of N fertilizer to Shannon-Wiener curves; Table S1: Effects of N fertilization on SOM, the ratio of SOM in 2023 to 2020, NH4+ and NO3 at the three sampling year. n = 3.; Table S2: Effects of N fertilization on changes of the soil carbon properties, including soil organic carbon (SOC), soil-dissolved organic carbon (DOC), microbial biomass carbon (MBC) at the three sampling stages, Straw-derived SOC (SO13C), Straw-derived DOC (DO13C) and Straw-derived MBC (MB13C); Table S3: Effects of N fertilization on changes of the soil nitrogen properties, including soil nitrate nitrogen (NO3), soil ammonium nitrogen (NH4+) and soil inorganic nitrogen (SIN); Table S4: Effects of N fertilization on composition of bacterial communities (means ± standard deviation).

Author Contributions

R.X., Writing—review and editing, Writing—original draft, Formal analysis, Methodology, Conceptualization. H.L., Writing—review and editing, Conceptualization, Funding acquisition, Supervision, Resources, Project administration. G.J., Conceptualization, Methodology, Data curation. Z.W., Writing—review and editing, Conceptualization. Q.L., Methodology, Data curation. Y.S., Writing—review and editing, Conceptualization. S.Y., Resources, Methodology. M.W., Methodology, Data curation. K.S., Methodology. All authors have read and agreed to the published version of the manuscript.

Funding

This work was funded by the National Key R&D Program of China (2023YFD2300100), the National Key R&D Program of China (2021YFD1900903), Agricultural Science and Technology Innovation Project of Shandong Academy of Agricultural Sciences (CXGC2024D04), Shandong Province Key R&D Program (2023TZXD088), Earmarked Fund for China Agriculture Research System (CARS-03), Shandong Province Key R&D Program (2024SFGC0405), Taishan Scholars Program (No. tsqn 202312289).

Data Availability Statement

Data are contained within the article.

Conflicts of Interest

The authors declare that they have no known competing financial interests or personal relationships that could have appeared to influence the work reported in this paper.

References

  1. Chabbi, A.; Lehmann, J.; Ciais, P.; Loescher, H.W.; Cotrufo, M.F.; Don, A.; SanClements, M.; Schipper, L.; Six, J.; Smith, P.; et al. Aligning agriculture and climate policy. Nat. Clim. Chang. 2017, 7, 307–309. [Google Scholar] [CrossRef]
  2. Lal, R. Crop residues as soil amendments and feedstock for bioethanol production. Waste Manag. 2008, 28, 747–758. [Google Scholar] [CrossRef]
  3. Kou, X.; Morrien, E.; Tian, Y.; Zhang, X.; Lu, C.; Xie, H.; Liang, W.; Li, Q.; Liang, C. Exogenous carbon turnover within the soil food web strengthens soil carbon sequestration through microbial necromass accumulation. Glob. Chang. Biol. 2003, 29, 4069–4080. [Google Scholar] [CrossRef]
  4. Yang, C.; Wang, X.; Li, J.; Zhang, G.; Shu, H.; Hu, W.; Han, H.; Liu, R.; Guo, Z. Straw return increases crop production by improving soil organic carbon sequestration and soil aggregation in a long-term wheat- cotton cropping system. J. Integr. Agric. 2024, 23, 669–679. [Google Scholar] [CrossRef]
  5. Chen, D.L.; Wang, X.X.; Carrion, V.J.; Yin, S.; Yue, Z.F.; Liao, Y.W.K.; Dong, Y.H.; Li, X.G. Acidic amelioration of soil amendments improves soil health by impacting rhizosphere microbial assemblies. Soil Biol. Biochem. 2022, 167, 108599. [Google Scholar] [CrossRef]
  6. Feng, J.; Yu, D.L.; Sinsabaugh, R.L.; Moorhead, D.L.; Andersen, M.N.; Smith, P.; Song, Y.T.; Li, X.Q.; Huang, Q.Y.; Liu, Y.R.; et al. Trade-offs in carbon-degrading enzyme activities limit long-term soil carbon sequestration with biochar addition. Biol. Rev. 2023, 98, 1184–1199. [Google Scholar] [CrossRef]
  7. Narayanan, M.; Ananth, C.; Ayyandurai, M.; Pugazhendhi, A.; Alshehri, M.A.; Ma, Y. Sustainable strategies for enhancing soil carbon sequestration and their beneficial impacts on soil fertility: A comprehensive review. Appl. Soil Ecol. 2024, 204, 105752. [Google Scholar] [CrossRef]
  8. Zhu, B.J.; Whalen, J.K.; Wu, J.T.; Yang, J.N.; Mao, X.R.; Wan, B.B.; Tian, S.Y.; Hu, F.; Chen, X.Y.; Liu, M.Q. Soil food web structure coordinated by soil omnivores sustains soil multifunctionality in moderate vermicompost amended fields. Soil Biol. Biochem. 2024, 192, 109391. [Google Scholar] [CrossRef]
  9. Zhang, H.K.; Fang, Y.Y.; Zhang, B.G.; Luo, Y.; Yi, X.Y.; Wu, J.S.; Chen, Y.C.; Sarker, T.C.; Cai, Y.J.; Chang, S.X. Land-use-driven change in soil labile carbon affects microbial community composition and function. Geoderma 2022, 426, 116056. [Google Scholar] [CrossRef]
  10. Meng, X.T.; Zhang, X.C.; Li, Y.N.; Jiao, Y.P.; Fan, L.C.; Jiang, Y.J.; Qu, C.Y.; Filimonenko, E.; Jiang, Y.H.; Tian, X.H.; et al. Nitrogen fertilizer builds soil organic carbon under straw return mainly via microbial necromass formation. Soil Biol. Biochem. 2024, 188, 109223. [Google Scholar] [CrossRef]
  11. Bandick, A.K.; Dick, R.P. Field management effects on soil enzyme activities. Soil Biol. Biochem. 1991, 31, 1471–1479. [Google Scholar] [CrossRef]
  12. Vanderstraeten, J.; Lamote, B.; da Fonseca, M.J.M.; De Groote, P.; Briers, Y. Conversion of the free Cellvibrio japonicus xyloglucan degradation system to the cellulosomal mode. Appl. Microbiol. Biotechnol. 2022, 106, 5495–5509. [Google Scholar] [CrossRef]
  13. Yang, Y.Z.; Wang, J.; Guo, H.N.; Cao, Y.H. The enzymatic characters of heterologous expressed novel β-1, 4-glucosidase originated from Aspergillus fresenii. 3 Biotech 2020, 10, 239. [Google Scholar] [CrossRef]
  14. Mori, T.; Aoyagi, R.; Kitayama, K.; Mo, J.M. Does the ratio of β-1,4-glucosidase to β-1,4-N-acetylglucosaminidase indicate the relative resource allocation of soil microbes to C and N acquisition? Soil Biol. Biochem. 2021, 160, 108363. [Google Scholar] [CrossRef]
  15. Fu, B.; Chen, L.; Huang, H.Y.; Qu, P.; Wei, Z.G. Impacts of crop residues on soil health: A review. Environ. Pollut. Bioavailab. 2021, 33, 164–173. [Google Scholar] [CrossRef]
  16. Han, J.X.; Song, X.Y.; Fu, H.Y.; Liu, C.G.; Yang, F.S. Effects of the decomposition agent application on the physicochemical properties and microbial community structure of wheat straw-returning soil. Environ. Technol. Innov. 2024, 35, 103668. [Google Scholar] [CrossRef]
  17. Gong, X.J.; Zou, H.T.; Qian, C.R.; Yu, Y.; Hao, Y.B.; Li, L.; Wang, Q.J.; Jiang, Y.B.; Ma, J.T. Construction of in situ degradation bacteria of corn straw and analysis of its degradation efficiency. Ann. Microbiol. 2020, 70, 62. [Google Scholar] [CrossRef]
  18. Mo, F.; Yang, D.; Wang, X.; Crowther, T.W.; Vinay, N.; Luo, Z.; Yu, K.; Sun, S.; Zhang, F.; Xiong, Y.; et al. Nutrient limitation of soil organic carbon stocks under straw return. Soil Biol. Biochem. 2024, 192, 109360. [Google Scholar] [CrossRef]
  19. Lyu, M.; Homyak, P.M.M.; Xie, J.; Penuelas, J.; Ryan, M.G.G.; Xiong, X.; Sardans, J.; Lin, W.; Wang, M.; Chen, G.; et al. Litter quality controls tradeoffs in soil carbon decomposition and replenishment in a subtropical forest. J. Ecol. 2023, 111, 2181–2193. [Google Scholar] [CrossRef]
  20. Shahbaz, M.; Kumar, A.; Kuzyakov, Y.; Börjesson, G.; Blagodatskaya, E. Priming effects induced by glucose and decaying plant residues on SOM decomposition: A three-source 13C/14C partitioning study. Soil Biol. Biochem. 2018, 121, 138–146. [Google Scholar] [CrossRef]
  21. Meng, F.; Dungait, J.A.J.; Xu, X.; Bol, R.; Zhang, X.; Wu, W. Coupled incorporation of maize (Zea mays L.) straw with nitrogen fertilizer increased soil organic carbon in Fluvic Cambisol. Geoderma 2017, 304, 19–27. [Google Scholar] [CrossRef]
  22. Xie, Y.Q.; Zhou, L.Y.; Dai, J.P.; Chen, J.; Yang, X.P.; Wang, X.W.; Wang, Z.F.; Feng, L. Effects of the C/N ratio on the microbial community and lignocellulose degradation, during branch waste composting. Bioprocess Biosyst. Eng. 2022, 45, 1163–1174. [Google Scholar] [CrossRef]
  23. Zhu, Z.K.; Zhou, J.; Shahbaz, M.; Tang, H.M.; Liu, S.L.; Zhang, W.J.; Yuan, H.Z.; Zhou, P.; Alharbi, H.; Wu, J.S.; et al. Microorganisms maintain C:N stoichiometric balance by regulating the priming effect in long-term fertilized soils. Appl. Soil Ecol. 2021, 167, 104033. [Google Scholar] [CrossRef]
  24. Gao, Y.X.; Feng, H.J.; Zhang, M.; Shao, Y.Q.; Wang, J.Q.; Liu, Y.L.; Li, C.L. Straw returning combined with controlled-release nitrogen fertilizer affected organic carbon storage and crop yield by changing humic acid composition and aggregate distribution. J. Clean. Prod. 2023, 415, 105045. [Google Scholar] [CrossRef]
  25. An, T.; Schaeffer, S.; Li, S.; Fu, S.; Pei, J.; Li, H.; Zhuang, J.; Radosevich, M.; Wang, J. Carbon fluxes from plants to soil and dynamics of microbial immobilization under plastic film mulching and fertilizer application using 13C pulse-labeling. Soil Biol. Biochem. 2015, 80, 53–61. [Google Scholar] [CrossRef]
  26. Vance, E.D.; Brookes, P.C.; Jenkinson, D.S. An extraction method for measuring soil microbial biomass C. Soil Biol. Biochem. 1987, 19, 703–707. [Google Scholar] [CrossRef]
  27. Liu, J.; Sui, Y.; Yu, Z.; Shi, Y.; Chu, H.; Jin, J.; Liu, X.; Wang, G. High throughput sequencing analysis of biogeographical distribution of bacterial communities in the black soils of northeast China. Soil Biol. Biochem. 2014, 70, 113–122. [Google Scholar] [CrossRef]
  28. Bates, S.T.; Berg-Lyons, D.; Caporaso, J.G.; Walters, W.A.; Knight, R.; Fierer, N. Examining the global distribution of dominant archaeal populations in soil. ISME J. 2011, 5, 908–917. [Google Scholar] [CrossRef]
  29. Donohue, I.; Petchey, O.L.; Montoya, J.M.; Jackson, A.L.; McNally, L.; Viana, M.; Healy, K.; Lurgi, M.; O’Connor, N.E.; Emmerson, M.C. On the dimensionality of ecological stability. Ecol. Lett. 2013, 16, 421–429. [Google Scholar] [CrossRef]
  30. Yuan, M.M.; Guo, X.; Wu, L.; Zhang, Y.; Xiao, N.; Ning, D.; Shi, Z.; Zhou, X.S.; Wu, L.Y.; Yang, Y.F.; et al. Climate warming enhances microbial network complexity and stability. Nat. Clim. Change 2021, 1, 343–348. [Google Scholar] [CrossRef]
  31. Poll, C.; Marhan, S.; Ingwersen, J.; Kandeler, E. Dynamics of litter carbon turnover and microbial abundance in a rye detritusphere. Soil Biol. Biochem. 2008, 40, 1306–1321. [Google Scholar] [CrossRef]
  32. Wild, B.; Schnecker, J.; Alves, R.J.E.; Barsukov, P.; Bárta, J.; Čapek, P.; Gentsch, N.; Gittel, A.; Guggenberger, G.; Lashchinskiy, N.; et al. Input of easily available organic C and N stimulates microbial decomposition of soil organic matter in arctic permafrost soil. Soil Biol. Biochem. 2014, 75, 143–151. [Google Scholar] [CrossRef]
  33. Blaud, A.; Lerch, T.Z.; Chevallier, T.; Nunan, N.; Chenu, C.; Brauman, A. Dynamics of bacterial communities in relation to soil aggregate formation during the decomposition of 13C-labelled rice straw. Appl. Soil Ecol. 2012, 53, 1–9. [Google Scholar] [CrossRef]
  34. Li, L.; Qiu, S.; Chen, Y.; Xu, X.; Zhao, X.; Christie, P.; Xu, M. Allocation of photosynthestically-fixed carbon in plant and soil during growth of reed (Phragmites australis) in two saline soils. Plant Soil. 2016, 404, 277–291. [Google Scholar] [CrossRef]
  35. Li, Z.; Qiu, L.; Zhang, T.; Zhang, L.; Wang, L.; Wu, L.; Wang, Y.; Zhang, Y.; Dong, J.; Li, W.; et al. Long-term application of controlled-release potassium chloride increases maize yield by affecting soil bacterial ecology, enzymatic activity and nutrient supply. Field Crops Res. 2023, 297, 108946. [Google Scholar] [CrossRef]
  36. Liu, X.J.A.; Finley, B.K.; Mau, R.L.; Schwartz, E.; Dijkstra, P.; Bowker, M.A.; Hungate, B.A. The soil priming effect: Consistent across ecosystems, elusive mechanisms. Soil Biol. Biochem. 2020, 140, 107617. [Google Scholar] [CrossRef]
  37. Yan, S.B.; Yin, L.M.; Dijkstra, F.A.; Wang, P.; Cheng, W.X. Priming effect on soil carbon decomposition by root exudate surrogates: A meta-analysis. Soil Biol. Biochem. 2023, 178, 108955. [Google Scholar] [CrossRef]
  38. Rath, K.M.; Murphy, D.N.; Rousk, J. The microbial community size, structure, and process rates along natural gradients of soil salinity. Soil Biol. Biochem. 2019, 138, 107607. [Google Scholar] [CrossRef]
  39. Zhang, W.W.; Wang, C.; Liu, M.L.; Yu, Y.C. Integrated reclamation of saline soil nitrogen transformation in the hyphosphere by earthworms and arbuscular mycorrhizal fungus. Appl. Soil Ecol. 2019, 135, 137–146. [Google Scholar] [CrossRef]
  40. Zhang, L.; Liu, J.; Xi, J.Z.; Pang, R.; Gunina, A.; Zhou, S.R. Competition for nitrogen between plants and microorganisms in grasslands: Effect of nitrogen application rate and plant acquisition strategy. Biol. Fertil. Soils 2024, 60, 227–236. [Google Scholar] [CrossRef]
  41. Kirkby, C.A.; Richardson, A.E.; Wade, L.J.; Passioura, J.B.; Batten, G.D.; Blanchard, C.; Kirkegaard, J.A. Nutrient availability limits carbon sequestration in arable soils. Soil Biol. Biochem. 2014, 68, 402–409. [Google Scholar] [CrossRef]
  42. Luo, X.; Zhang, L.; Lin, Y.; Wen, D.; Hou, E. Nitrogen availability mediates soil organic carbon cycling in response to phosphorus supply: A global meta-analysis. Soil Biol. Biochem. 2023, 185, 109158. [Google Scholar] [CrossRef]
  43. Barberán, A.; Bates, S.T.; Casamayor, E.O.; Fierer, N. Using network analysis to explore co-occurrence patterns in soil microbial communities. ISME J. 2012, 6, 343–351. [Google Scholar] [CrossRef]
  44. Meng, T.T.; Shi, J.J.; Zhang, X.Q.; Zhao, X.Q.; Zhang, D.J.; Chen, L.Y.; Lu, Z.Y.; Cheng, Y.C.; Hao, Y.H.; Zhao, X.Y.; et al. Slow-release nitrogen fertilizer application regulated rhizosphere microbial diversity to increase maize yield. Front. Plant Sci. 2024, 15, 1481465. [Google Scholar] [CrossRef]
  45. Coyte, K.Z.; Schluter, J.; Foster, K.R. The ecology of the microbiome: Networks, competition, and stability. Science 2015, 350, 663–666. [Google Scholar] [CrossRef]
  46. Gao, C.; Xu, L.; Montoya, L.; Madera, M.; Hollingsworth, J.; Chen, L.; Purdom, E.; Singan, V.; Vogel, J.; Hutmacher, R.B.; et al. Co-occurrence networks reveal more complexity than community composition in resistance and resilience of microbial communities. Nat. Commun. 2022, 13, 3867. [Google Scholar] [CrossRef] [PubMed]
  47. Meng, T.; Shi, J.; Zhang, X.; Ge, G.; Cheng, Y.; Rong, M.; Chen, L.; Zhao, X.; Wang, X.; Lu, Z. Slow-Release Nitrogen Fertilizer Promotes the Bacterial Diversity to Drive Soil Multifunctionality. Agronomy 2024, 14, 2712. [Google Scholar] [CrossRef]
  48. Ji, P.T.; Du, X.; Zhou, J.C.; Peng, Y.J.; Li, X.L.; Tao, P.J.; Zhang, Y.C. Network Analysis Reveals the Combination of Controlled-Release and Regular Urea Enhances Microbial Interactions and Improves Maize Yields. Front. Microbiol. 2022, 13, 825787. [Google Scholar] [CrossRef]
  49. Li, R.; Ren, C.; Wu, L.; Zhang, X.; Mao, X.; Fan, Z.; Cui, W.; Zhang, W.; Wei, G.; Shu, D. Fertilizing-induced alterations of microbial functional profiles in soil nitrogen cycling closely associate with crop yield. Environ. Res. 2023, 231, 116194. [Google Scholar] [CrossRef]
  50. Konopka, A.; Lindemann, S.; Fredrickson, J. Dynamics in microbial communities: Unraveling mechanisms to identify principles. ISME J. 2015, 9, 1488–1495. [Google Scholar] [CrossRef]
  51. Zheng, F.; Gao, J.; Tang, M.; Zhou, T.; Zhu, D.; Yang, X.; Chen, B. Urbanization reduces the stability of soil microbial community by reshaping the diversity and network complexity. Chemosphere 2024, 364, 143177. [Google Scholar] [CrossRef]
  52. Ren, W.; Li, P.; Wang, X.; Che, Y.; Long, H.; Zhang, X.; Cai, X.; Huang, A.; Zeng, Y.; Xie, Z. Cross-habitat distribution pattern of Bacillus communities and their capacities of producing industrial hydrolytic enzymes in Paracel Islands: Habitat-dependent differential contributions of the environment. J. Environ. Manag. 2022, 323, 116252. [Google Scholar] [CrossRef]
  53. Siu-Rodas, Y.; de los Angeles Calixto-Romo, M.; Guillen-Navarro, K.; Sanchez, J.E.; Alejandro Zamora-Briseno, J.; Amaya-Delgado, L. Bacillus subtilis with endocellulase and exocellulase activities isolated in the thermophilic phase from composting with coffee residues. Rev. Argent. Microbiol. 2018, 50, 234–243. [Google Scholar] [CrossRef]
  54. Wang, F.; Wang, X.; Yu, X.; Fu, L.; Liu, Y.; Ma, L.; Zhai, C. High-Level Expression of Endo-β-N-Acetylglucosaminidase H from Streptomyces plicatus in Pichia pastoris and Its Application for the Deglycosylation of Glycoproteins. PLoS ONE 2015, 10, e0120458. [Google Scholar]
  55. Zhang, Y.; Sun, C.; Wang, S.; Xie, H.; Jiang, N.; Chen, Z.; Wei, K.; Bao, X.; Song, X.; Bai, Z. Stover and biochar can improve soil microbial necromass carbon, and enzymatic transformation at the genetic level. Glob. Change Biol. Bioenergy 2022, 14, 1082–1096. [Google Scholar] [CrossRef]
  56. Wen, Y.; Ma, Y.; Wu, Z.; Yang, Y.; Yuan, X.; Chen, K.; Luo, Y.; He, Z.; Huang, X.; Deng, P.; et al. Enhancing rice ecological production: Synergistic effects of wheat-straw decomposition and microbial agents on soil health and yield. Front. Plant Sci. 2024, 15, 1368184. [Google Scholar] [CrossRef] [PubMed]
  57. Zhou, J.; Guan, D.W.; Zhou, B.K.; Zhao, B.S.; Ma, M.C.; Qin, J.; Jiang, X.; Chen, S.F.; Cao, F.M.; Shen, D.L.; et al. Influence of 34-years of fertilization on bacterial communities in an intensively cultivated black soil in northeast China. Soil Biol. Biochem. 2015, 90, 42–51. [Google Scholar] [CrossRef]
  58. De Vries, F.T.; Griffiths, R.I.; Bailey, M.; Craig, H.; Girlanda, M.; Gweon, H.S.; Hallin, S.; Kaisermann, A.; Keith, A.M.; Kretzschmar, M.; et al. Soil bacterial networks are less stable under drought than fungal networks. Nat. Commun. 2018, 9, 3033. [Google Scholar] [CrossRef]
  59. Borham, A.; Bkhit, M.; Wang, J.; Qian, X. Immobilization of fungal laccase onto red seaweed biomass as a novel support for efficient dye decolorization. Environ. Technol. Innov. 2025, 38, 104143. [Google Scholar] [CrossRef]
  60. Peng, Q.; Zheng, H.J.; Xu, H.X.; Cheng, S.Q.; Yu, C.H.; Wu, J.J.; Meng, K.; Xie, G.F. Response of soil fungi to textile dye contamination. Environ. Pollut. 2024, 359, 124577. [Google Scholar] [CrossRef]
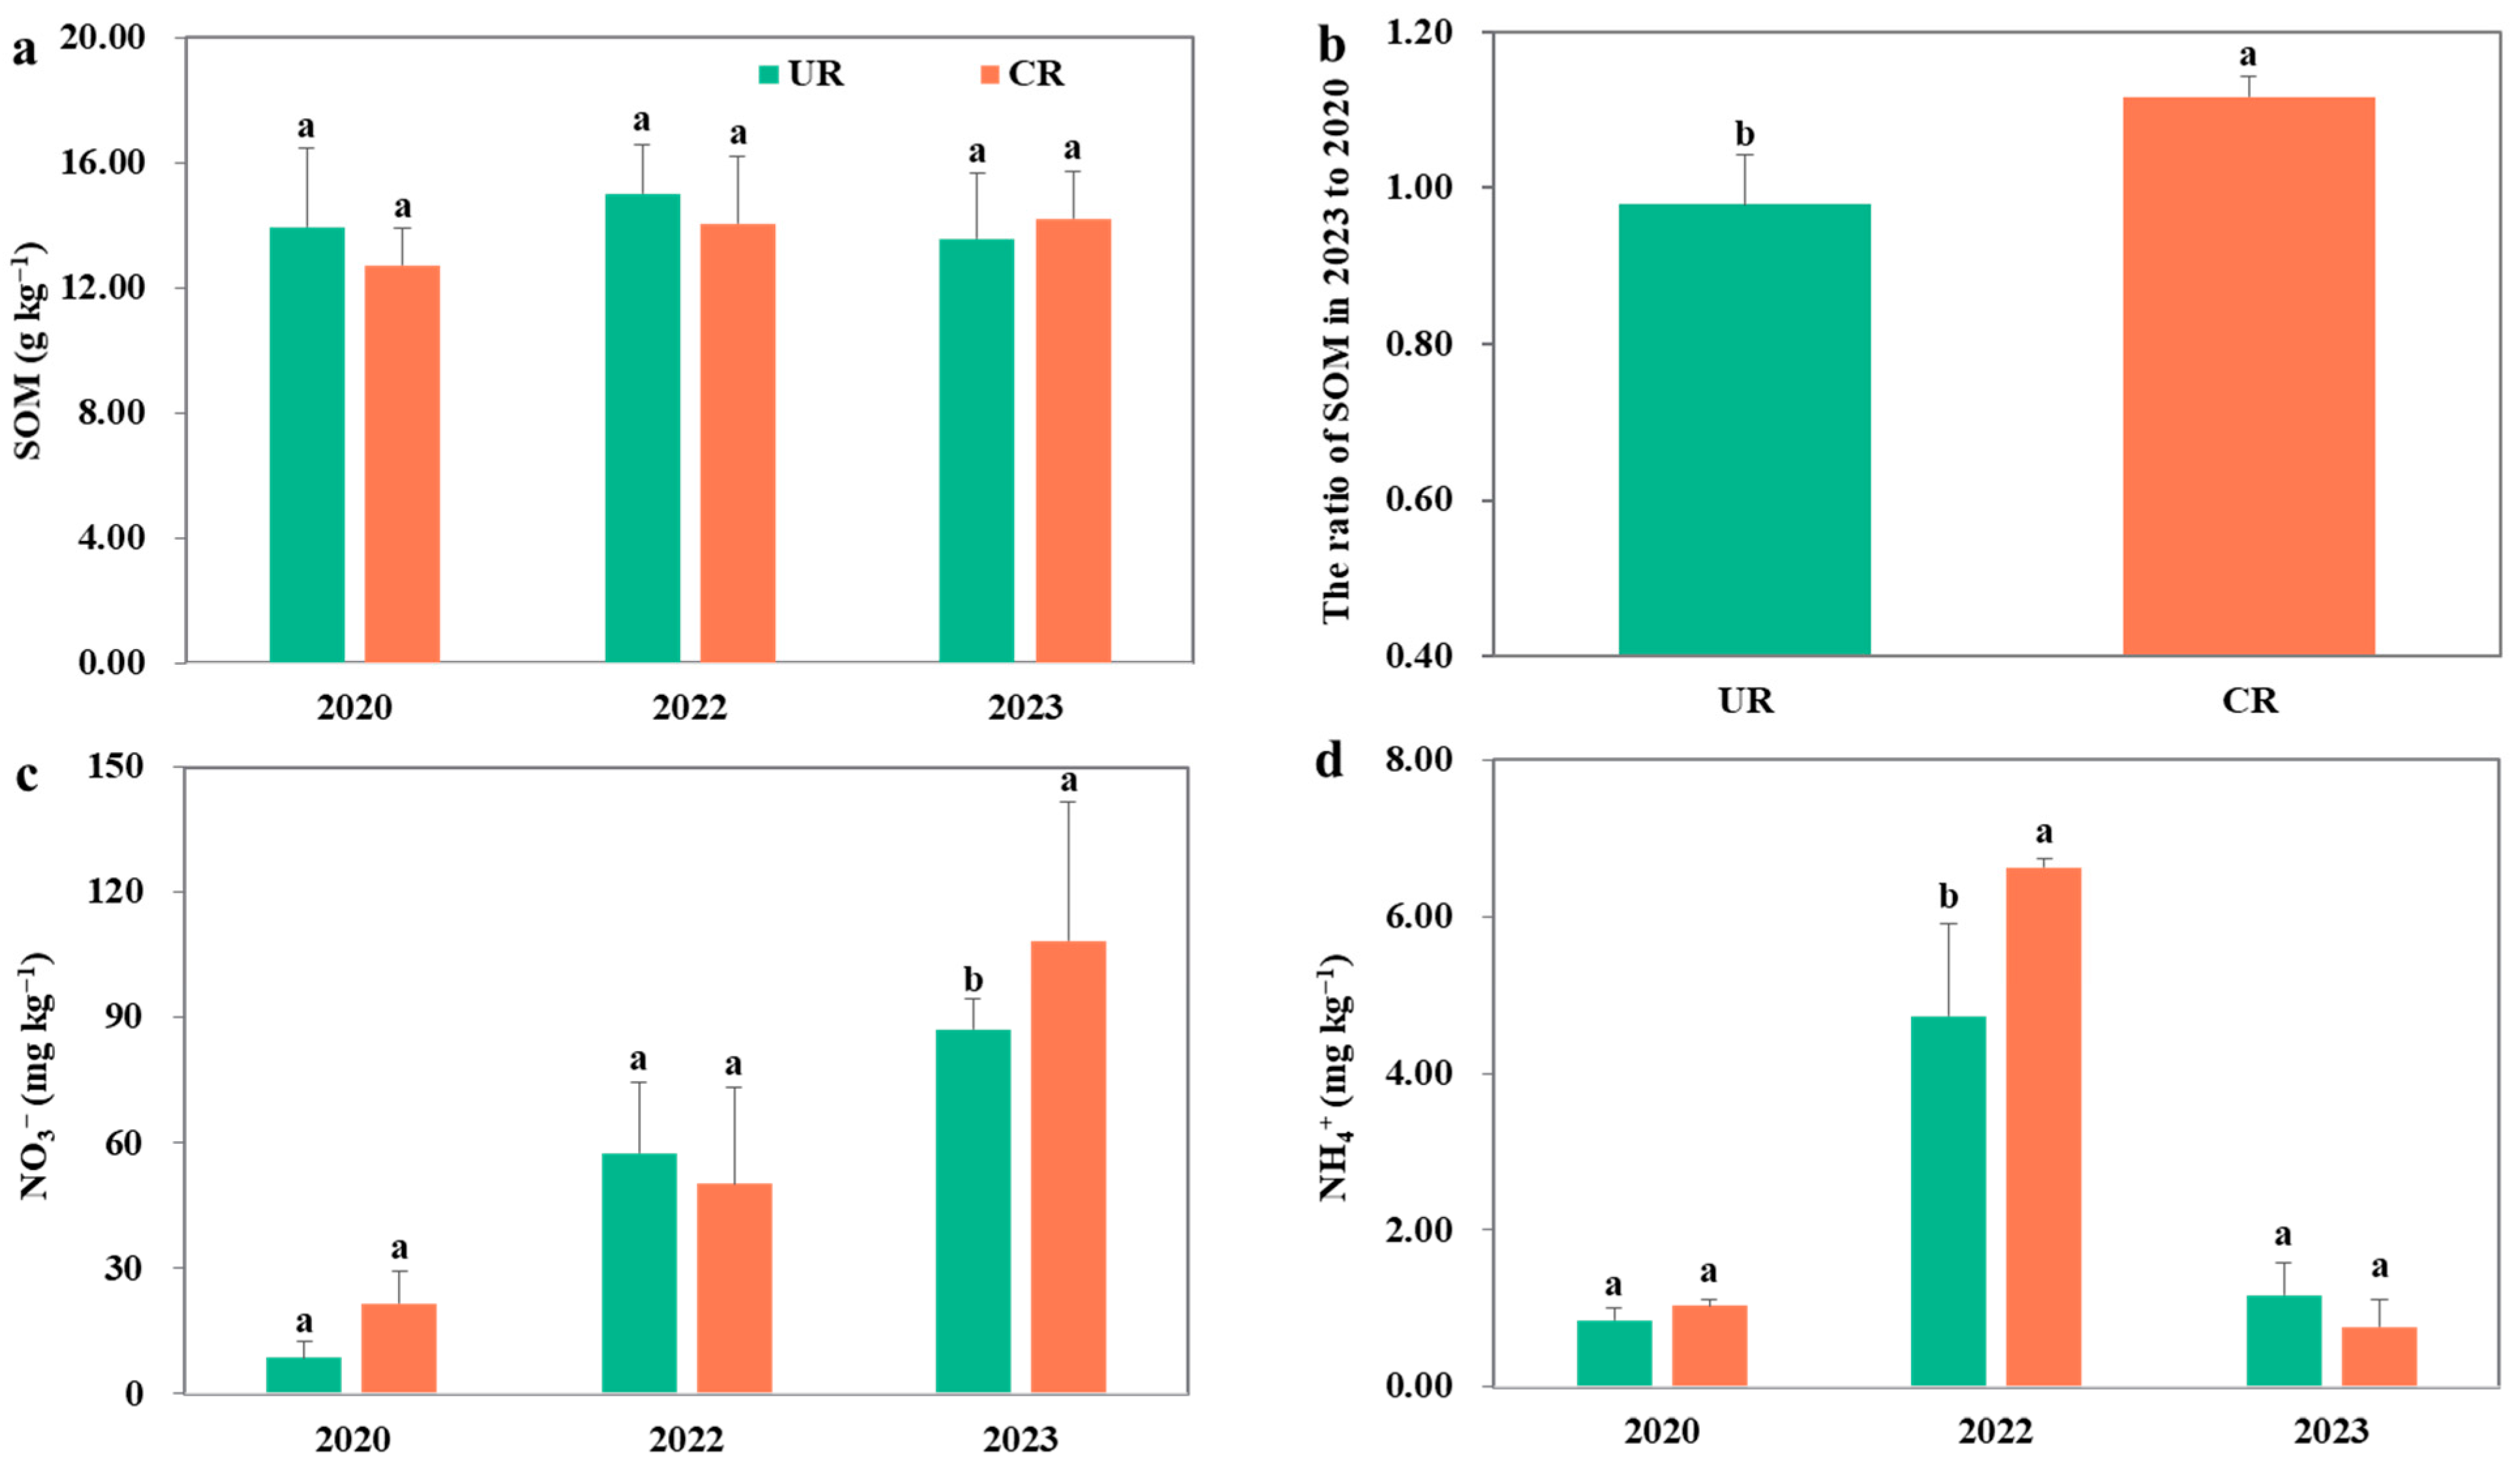
Figure 1. Soil organic matter (a), the ratio of SOM in 2023 to 2020 (b), NO3 (c) and NH4+ (d) in maize growing seasons under different fertilization treatments in field experiments. UR, treatment with urea; CR, treatment with controlled-release fertilizer. Different letters represent significant differences at p < 0.05 among treatments at the same sampling stage as determined by a Tukey’s test. n = 5, means ± standard deviation.
Agronomy 15 02053 g001
Figure 2. Soil organic carbon (SOC) (a), soil-dissolved organic carbon (DOC) (b) and microbial biomass carbon (MBC) (c) in different N fertilization treatments at the three sampling stages; straw-derived SOC (SO13C) (d), straw-derived DOC (DO13C) (e) and straw-derived MBC (MB13C) (f) in different N fertilization treatments at the last sampling stages (90 days). CK, treatment with no N fertilization; UR, treatment with urea; CR, treatment with controlled-release fertilizer. Different letters represent significant differences at p < 0.05 among treatments at the same sampling stage as determined by a Tukey’s test. n = 5, means ± standard deviation.
Agronomy 15 02053 g002
Figure 3. Soil nitrate nitrogen (NO3) (a), soil ammonium nitrogen (NH4+) (b) and soil inorganic nitrogen (SIN) (c) in different N fertilization treatments at the three sampling stages (30 days, 60 days, 90 days). CK, treatment with no N fertilization; UR, treatment with urea; CR, treatment with controlled-release fertilizer. Different letters represent significant differences at p < 0.05 among treatments at the same sampling stage as determined by a Tukey’s test. n = 5, means ± standard deviation.
Agronomy 15 02053 g003
Figure 4. β-1,4-glucosidase (BG) (a), cellulase (CES) (b), urease (c) and N-acetyl-β-glucosaminidase (NAG) (d) in different N fertilization treatments at the three sampling stages (30 days, 60 days, 90 days). CK, treatment with no N fertilization; UR, treatment with urea; CR, treatment with controlled-release fertilizer. Different letters represent significant differences at p < 0.05 among treatments at the same sampling stage as determined by a Tukey’s test. n = 5, means ± standard deviation.
Agronomy 15 02053 g004
Figure 5. Composition (a), Chao1 index (b), Shannon diversity (c) and β diversity (d) of bacterial communities; relative abundance of Bacillus (e) and Streptomyces (f) in bacterial communities. Nonmetric multidimensional scaling (NMDS) based on weighted Bray–Curtis distance metrics at the OTU level. CK, treatment with no N fertilization; UR, treatment with urea; CR, treatment with controlled-release fertilizer. Different letters represent significant differences at p < 0.05 among treatments at the same sampling stage as determined by a Tukey’s test. n = 5, means ± standard deviation.
Agronomy 15 02053 g005
Figure 6. The co-occurrence network of soil bacteria community at the genus level (a), and multiple indices were used to estimate the complexity (bg) of co-occurrence networks in different N fertilization treatments at the last sampling stage (90 days). CK, treatment with no N fertilization; UR, treatment with urea; CR, treatment with controlled-release fertilizer. In (a), Nodes represent individual genus, and the size of nodes represents the degree; edges represent significant Spearman correlations (r > 0.70, p < 0.05). Different letters represent significant differences at p < 0.05 among treatments at the same sampling stage as determined by a Tukey’s test. n = 5, means ± standard deviation.
Agronomy 15 02053 g006
Figure 7. Pearson’s correlation analysis (a), structural equation model (b) showing the relationships among organic carbon, soil properties and microbial indicators, and standardized total effects (c) on the SO13C derived from the structural equation models. MB13C, straw-derived microbial biomass carbon; SO13C, straw-derived soil organic carbon; DO13C, straw-derived soil-dissolved organic carbon; NO3, soil nitrite nitrogen; NH4+, soil ammonium nitrogen; SIN, soil inorganic nitrogen; BG, β-1,4-glucosidase (BG); CES, cellulase; UE, urease; NAG, N-acetyl-β-glucosaminidase. In (a), orange and green lines denote significant positive and negative relationships, respectively. The thickness of the line corresponded to the magnitude of the p-value. In (b), estimates of standardized regression coefficients for each pathway are indicated by arrows, with the thickness of the line segment corresponding to the magnitude of the coefficient. Black solid and gray arrows denote significant and insignificant relationships, respectively. *, ** and *** indicate statistical significance at p < 0.05, p < 0.01 and p < 0.001, respectively.
Agronomy 15 02053 g007
Disclaimer/Publisher’s Note: The statements, opinions and data contained in all publications are solely those of the individual author(s) and contributor(s) and not of MDPI and/or the editor(s). MDPI and/or the editor(s) disclaim responsibility for any injury to people or property resulting from any ideas, methods, instructions or products referred to in the content.