Article

Seasonal Patterns in Yield and Gas Emissions of Greenhouse Tomatoes Under Different Fertilization Levels with Irrigation–Aeration Coupling

1
Key Laboratory of Agricultural Soil and Water Engineering in Arid and Semiarid Areas, Ministry of Education, Northwest A&F University, Yangling 712100, China
2
College of Water Conservancy and Hydropower Engineering, Hohai University, Nanjing 210098, China
*
Authors to whom correspondence should be addressed.
Agronomy 2025, 15(9), 2026; https://doi.org/10.3390/agronomy15092026
Submission received: 25 July 2025 / Revised: 21 August 2025 / Accepted: 22 August 2025 / Published: 23 August 2025
(This article belongs to the Special Issue Advances in Tillage Methods to Improve the Yield and Quality of Crops)

Abstract

Optimizing aeration, fertilization, and irrigation is vital for improving greenhouse tomato production while mitigating soil greenhouse gas (GHG) emissions. This study investigated the combined effects of three aeration levels (A1: single Venturi, A2: double Venturi, CK: no aeration), two fertilization rates (F1: 180 kg/ha, F2: 240 kg/ha), and two irrigation levels (I1: 0.8 Epan, I2: 1.0 Epan) on tomato yield, CO2, N2O, and CH4 emissions, net GHG emissions, net global warming potential (NGWP), and GHG intensity (GHGI) across Spring–Summer and Autumn–Winter seasons. Results showed that aeration and fertilization significantly increased CO2 and N2O emissions but reduced CH4 emissions. Warmer conditions in Spring–Summer elevated all GHG emissions and yield compared to Autumn–Winter seasons. Tomato yield, net GHG emissions, NGWP, and GHGI were 12.05%, 24.3%, 14.46%, and 2.37% higher, respectively, in Spring–Summer. Combining the Maximal Information Coefficient and TOPSIS models, the optimal practice was A1-F1-I1 in Spring–Summer and A2-F1-I1 in Autumn–Winter seasons. These results provide a theoretical basis for selecting climate-smart management strategies that enhance yield and environmental sustainability in greenhouse tomato systems.

1. Introduction

Safeguarding food security, mitigating global climate change, and tackling environmental deterioration are now three critical challenges faced by nations around the world [1,2,3]. CO2, N2O, and CH4 are key greenhouse gases (GHGs) that have a significant impact on the climate and ecosystems. Their extended atmospheric lifetimes and distinctive radiative properties make them significant contributors to global warming [1]. The increase in GHG emissions leads to enhanced radiative forcing and global warming, driving extreme weather events, such as extreme temperatures, heavy precipitation, and more frequent droughts, posing severe threats to human life [2]. Since 1750, the atmospheric levels of these gases have steadily increased, reaching annual averages of 415.7 ppm for CO2, 1908 ppb for N2O, and 334.5 ppb for CH4 by 2021 [3]. Agri-ecosystems are a major source of GHG emissions and have a significant impact on global climate change [4,5]. Consequently, agriculture emerged as the second largest emitter of CO2, surpassed only by fossil fuel consumption [6]. In addition, agricultural N2O and CH4 emissions form 78% and 53% of global emissions from anthropogenic activities [2]. Therefore, reducing GHG emissions from cultivated soils remains a critical challenge and a pressing issue to be addressed.
Tomatoes are among the most commonly consumed vegetables worldwide [7,8]. They are increasingly cultivated in greenhouses in China during spring and autumn seasons, extending the crop’s growing season and ensuring a continuous supply to markets [9]. In greenhouse systems, managing irrigation and fertilization practices is essential for optimizing yields; however, these practices can also lead to higher greenhouse gas emissions and contribute to global warming [10,11]. Therefore, under the dual imperatives of addressing climate change and promoting green agriculture, a critical challenge lies in how to ensure crop yield while effectively reducing greenhouse gas emissions from protected agriculture and improving resource use efficiency. According to existing studies, optimizing farmland management practices in greenhouses—such as irrigation volume, irrigation methods, and fertilization rates—is essential for reducing greenhouse gas emissions, increasing soil organic matter content, and simultaneously improving crop yields [12,13,14].
Combining irrigation and fertilization enables the simultaneous delivery of water and nutrients, making it increasingly popular among farmers globally, particularly in greenhouse tomato cultivation [15]. Nitrogen (N) fertilizers are widely used to achieve high yields, as they play a vital role in crop productivity by enhancing photosynthetic capacity and sink development [16,17]. Additionally, nitrogen (N) fertilizers influence the turnover of soil carbon (C) and nitrogen (N) [18]. Overuse of inorganic N fertilizers can lead to increased soil N2O emissions by enhancing nitrification and denitrification processes [19]. While optimal yields often require additional N fertilizer, higher N application rates are associated with increased N2O emissions [20,21,22]. Studies indicate that N fertilizers are responsible for about 60% of global anthropogenic N2O emissions [23]. Furthermore, the use of N fertilizers impacts soil organic carbon (SOC) levels, which in turn affects CO2 and CH4 emissions [24,25]. A meta-analysis has shown that nitrogen application can enhance SOC storage in agricultural soils, potentially reducing CO2 emissions [13]. However, N fertilizers have also been associated with increased CO2 emissions due to soil acidification [26]. However, under protected cultivation, improper management practices, such as excessive fertilization and insufficient aeration, have led to soil degradation, low resource use efficiency, and increased greenhouse gas emissions, posing a serious threat to sustainable agricultural development.
In recent years, aerated irrigation has gained considerable interest as a practical approach to reduce inter-root hypoxia. This technique enhances crop yields, improves water use efficiency, boosts fruit quality, and helps to lower soil greenhouse gas (GHG) emissions [27,28,29,30,31,32]. Aerated irrigation supplies aerated water via underground drip irrigation pipes to the crop root zone, alleviating soil hypoxia or oxygen deficiency and enhancing the uptake of water and nutrients by crops. However, altering soil oxygen content also influences nitrifying and denitrifying bacteria, thus affecting soil N2O emissions [33]. Despite widespread use of aerated irrigation in crops like tomatoes and cucumbers [34,35,36,37], the combined effects of aerated irrigation, irrigation–fertilization, and GHG emissions have not been thoroughly quantified.
Temperature is another critical environmental factor affecting both crop yields and soil GHG emissions [38]. Studies indicate that rising temperatures significantly boost soil GHG emissions in forests [39], grasslands [40], and agricultural land [33,41,42]. For example, increased soil temperature has been shown to reduce wheat yield and N2O emissions while elevating CO2 emissions [43]. However, studies have shown that the combination of elevated soil temperature and nitrogen application does not significantly impact soil CO2 emissions [12], but soil N2O emissions increased by 26.2% [42]. These findings suggest that the considerable temperature fluctuations during different seasons in greenhouses necessitate taking temperature into account when evaluating crop yields and greenhouse gas (GHG) emissions. Furthermore, current research on the mutual effects of climatic differences and management measures between different seasons period of greenhouse tomatoes on yield and GHG emissions is limited.
Although a few studies have explored the integration of the Maximal Information Coefficient (MIC) and the Technique for Order Preference by Similarity to Ideal Solution (TOPSIS) in agricultural decision-making, their application in the context of irrigation–fertilization–aeration (IFA) regulation for greenhouse tomato systems remains limited. Most existing evaluation frameworks rely on traditional approaches, such as the Analytic Hierarchy Process (AHP) or entropy weighting methods, which, despite their practicality, often suffer from subjectivity and limited capacity to capture nonlinear relationships. In contrast, MIC effectively captures both linear and nonlinear associations between agricultural management practices and key response variables, including crop yield and greenhouse gas (GHG) emissions, while TOPSIS enables a comprehensive ranking of treatment combinations based on multiple performance metrics. This study represents a novel application of the MIC–TOPSIS integration in greenhouse agriculture, aiming to identify optimal IFA strategies that balance yield enhancement with GHG mitigation. By systematically quantifying the synergies and trade-offs among environmental and agronomic outcomes, our proposed framework provides a scientific and objective basis for developing adaptive and sustainable greenhouse crop management practices.
In conclusion, the integrated management of irrigation, fertilization, and aeration plays a crucial role in influencing greenhouse gas (GHG) emissions during greenhouse tomato cultivation. A well-regulated supply of water, nutrients, and oxygen is essential not only for achieving desirable crop yields but also for promoting the sustainability of agroecosystems. To investigate this, the present study conducted field monitoring during two representative cropping periods—Spring–Summer and Autumn–Winter—within the same year. Venturi injectors were used to aerate irrigation water at two oxygenation levels, combined with two fertilization regimes and three aeration intensities. The main objectives of the study were the following: (1) explore seasonal variations in environmental and soil conditions under different combinations of irrigation, fertilization, and aeration; (2) evaluate the impact of these practices on tomato productivity, GHG emissions, net GHG balance, net global warming potential (NGWP), and greenhouse gas intensity (GHGI); and (3) employ the Maximal Information Coefficient (MIC) and the Technique for Order Preference by Similarity to Ideal Solution (TOPSIS) to identify critical soil variables associated with GHG emissions and determine the optimal management strategy that enhances yield while reducing emissions. The findings offer strategic guidance for future studies in greenhouse crop management and provide a theoretical basis for simultaneously improving yield and environmental outcomes in greenhouse tomato production.

2. Materials and Methods

2.1. Experimental Location

The experiment was carried out in a greenhouse belonging to the Key Laboratory of Agricultural Soil and Water Engineering in Arid Zones at Northwest A&F University, spanning from March 2021 to January 2022. This controlled facility offered optimal conditions for investigating the impacts of different irrigation and fertilization strategies on tomato growth. The greenhouse is located at 34°20′ N, 108°24′ E, with an altitude of 521 m. The experimental period was divided into two distinct cropping seasons: Spring–Summer (March to July 2021) and Autumn–Winter (August 2021 to January 2022). The location of the site is illustrated in Figure 1. The soil in the greenhouse was classified as silty clay loam, comprising approximately 26% sand, 33% silt, and 41% clay by mass. Within the top 60 cm of the soil profile, the average field capacity was recorded at 32.1% volumetric water content, and the bulk density was measured at 1.35 g·cm−3. Before transplanting the tomato seedlings, the surface soil (0–20 cm) was analyzed, revealing the following nutrient contents: organic matter at 9.51 g·kg−1, total nitrogen at 1.86 g·kg−1, total phosphorus at 1.40 g·kg−1, and total potassium at 20.22 g·kg−1. Additionally, environmental data—including air temperature, relative humidity, and solar radiation—were monitored using an automatic weather station (HOBO logger, onset computer corporation, USA) installed within the greenhouse.

2.2. Experiment Design

In this research, tomato seedlings were planted in the greenhouse test plot on 26 March 2021, for the Spring–Summer seasons, with harvesting activities concluding on 15 July of that year. Similarly, for the Autumn–Winter seasons, tomato seedlings were transplanted on 26 August 2021, with harvesting concluding on 15 January 2022. The Spring–Summer seasons trial officially started on 2 April (7 days after irrigation). The Autumn–Winter seasons tests started on 9 September (14 days after irrigation). In total, the transplanting treatment was carried out directly above the drip head and 11 tomato plants were planted in each plot with 35 cm spacing between each tomato plant.
The experiment included two irrigation levels, designated as I1 and I2, which corresponded to 0.8 Epan and 1.0 Epan (where 0.8 and 1.0 represent the pan coefficients) [32]. Additionally, two fertilization levels were implemented: 180 kg/ha (F1) and 240 kg/ha (F2), F2 fertilization level reflects the typical fertilization practice adopted by local farmers. The study also examined three aeration conditions: single Venturi aeration (A1), double Venturi aeration (A2), and a control group with no aeration (CK). A completely randomized block design was employed in this study, comprising ten treatments, including A1F1I1, A1F2I1, A2F1I1, A2F2I1, A1F1I2, A1F2I2, A2F1I2, A2F2I2, CKF1I2, and CKF2I2, with each treatment replicated three times. In total, 30 plots were included in the experiment. Topping was performed when the plants had developed four trusses. Except for irrigation, nitrogen application, and aeration, all treatments received identical field management practices, including crop variety, sowing and harvest time, and pest and disease control. The irrigation amounts were calculated using the following formula [28]:
W = A × E p a n × k c p
where W represents the irrigation water volume (L); A denotes the plot area served by a single drip emitter (m2), which is 0.14 m2 (0.35 m × 0.4 m); and Kcp is the pan coefficient, set at 0.8 for I1 and 1.0 for I2, respectively.
Irrigation water was delivered using buckets connected to pumps. The total Epan for the Spring–Summer seasons was 213.28 mm, while the total Epan for the Autumn–Winter seasons was 119.9 mm. The aeration process employed a Mazzei Venturi meter (Model 287, produced by Mazzei Injector Company, LLC, USA). The field intakes for A1 and A2 were set at 17% and 34%, respectively, as determined by the exhaust method.
During the experiment, various basal fertilizers were applied manually before transplanting the seedlings. These included a biofertilizer derived from sheep waste (excluding nitrogen, phosphorus, and potassium), calcium superphosphate (with a minimum P2O5 mass fraction of 16%) at a rate of 150 kg/ha, and water-soluble potassium sulfate (with at least 52% potassium) at 240 kg/ha. The timing and application rate of nitrogen fertilizer were consistent between the Spring–Summer and Autumn–Winter seasons. Specific details regarding nitrogen fertilizer application are provided in Table 1.

2.3. Gas Sampling and Analysis

In this experiment, we employed “static dark box-gas chromatography” to measure the emission fluxes of CO2, N2O, and CH4 from the tomato soil throughout the reproductive period. The closed chambers, constructed from 2 mm thick steel plates, measured 25 cm × 25 cm × 40 cm. To enhance insulation, the outer surface was wrapped in sponge and tin foil. Prior to GHG measurements, the base frame, featuring a 3 cm deep groove, was positioned 5 cm below the soil surface to support the gas collection chamber. During the tomato growing period, gas sampling was conducted every 3 to 6 days, with additional samples taken one to two days after irrigation and more frequent sampling following fertilization events. Samples were taken immediately after confinement of the chamber, with gas sampling times of 10:00, 10:10, 10:20, and 10:30, with 30 mL of gas taken each time and analyzed for concentration on the same day. An electronic thermometer (TA288) placed on top of the chamber measured the internal temperature while gas samples were taken to calculate the emission flux. The concentrations of CO2, N2O, and CH4 were determined using a gas chromatograph (Agilent 7890A GC System, USA) equipped with an electron capture detector (ECD). The oven and detector were maintained at temperatures of 55 °C and 350 °C, respectively. Gas flux measurements were performed using the same chromatographic system from Agilent Technologies.
The gas emission fluxes were computed utilizing Equation (2) [44] with the selection of either linear (Equation (3)) or nonlinear regression (Equation (4)) methods being contingent upon the observed patterns of gas concentration changes within the headspace of the closed chambers.
F = ρ h 273 273 + T d c d t
where F represents the gas emission flux (CO2 and CH4: mg·m−2·h−1; N2O: μg·m−2·h−1); ρ denotes the gas density under standard conditions (g·cm−3); h indicates the chamber height (m); and dc/dt signifies the curve slope, determined by the changes in gas concentration (CO2 and CH4: mg·m−2·h−1; N2O: μg·m−2·h−1) in the chamber headspace over time (t, h).
c = a + b × t ( d c / d t = b )
where a, b, and d are constants and t indicates the average air temperature inside the chamber during the sampling period (°C). Other parameters have the same meaning as above.
c = a + b × t + d × t 2 ( d c / d t = b )
All parameters have the same meaning as above.
The cumulative emissions of soil CO2, N2O, and CH4 during the whole life cycle of tomato were calculated by Equation (5):
R = i = 1 n F i + F i + 1 2 × D × 24
where R represents the cumulative amounts of CO2, N2O, and CH4 (kg·ha−1); i indicates the consecutive sampling intervals; D denotes the number of days between two sampling intervals (d); and n signifies the total number of measurements.

2.4. Soil Sampling

In this study, soil oxygen (O2) content was measured following the method outlined by [45]. Soil measurements were conducted on the day following each irrigation event. The water-filled pore space (WFPS) in the soil was calculated based on water content measurements taken from depths of 0, 10, and 20 cm. These measurements were obtained using the aluminum box oven-drying method, as detailed in Equation (6).
WFPS = θ m · ρ b 1 ρ b / 2.65
where θm denotes the soil water content (%); ρb denotes the soil bulk density, equaling 2.65 g/cm3.
The soil NO3-N contents were quantified using the subsequent formula:
M = 1000 · C · V W
where M denotes the soil NO3-N content (mg/kg); C denotes the measured NO3-N in the solution sample (mg/L); V denotes the extract sample volume (0.05 L); W denotes the soil sample weight (5 g).
During gas sampling, soil temperature (T) at soil depths of 0, 5, 10 cm were measured with a bent-tube glass mercury thermometer (Wuqiang Hongxing Instrumentation Factory, Hebei Province) to determine the average temperature of the 0–10 cm soil layer.

2.5. Determination of the Tomato Yield

From each plot, the first and last two plants were excluded, and five uniformly growing plants were selected from the remaining for yield measurement. Each treatment consisted of three plots. Yields were calculated per plant and extrapolated to total yield. The tomatoes collected from these plots were precisely weighed using an electronic balance capable of measuring with an accuracy of 5 g.

2.6. Net GHG, NGWP, and GHGI

The net GHG, NGWP, and GHGI are widely recognized indicators for assessing the comparative capacity of GHGs to impact climate change. The duration of this experiment was short and the change in soil organic carbon was negligible [46]. The net GHG is calculated using the following Equation (8) [1,2]:
n G H G = 273 × R ( N 2 O ) + R ( CO 2 )
where R(N2O) denotes cumulative N2O amount (kg·ha−1); R(CO2) denotes cumulative CO2 amount (kg·ha−1).
The NGWP is calculated using the following Equation (9) [47]:
NGWP = 273 × R ( N 2 O ) + 27.9 × R ( CH 4 )
where R(N2O) denotes cumulative N2O amount (kg·ha−1); R(CH4) denotes cumulative CH4 amount (kg·ha−1).
The GHGI is calculated using the following Equation (10):
GHGI = NGWP Y
where Y denotes the crop yield (t·hm−2).

2.7. Statistical Analysis

Evaluation of the importance of feature parameters. To assess the degree of correlation between feature parameters, such as soil temperature, soil WFPS, soil O2 content, soil NO3-N content, and soil CO2 emissions, N2O emissions, and CH4 emissions, thereby determining the importance of these feature parameters in influencing soil CO2, N2O, and CH4 emissions. In this study, the Maximal Information Coefficient (MIC) was selected to measure the degree of linearity or nonlinearity between soil environmental indicators and soil GHG emissions. MIC is used to measure the degree of correlation between characteristic parameters and response variables. Compared to correlation coefficients, MIC values can effectively reflect the nonlinear relationship between characteristic parameters and response variables. The larger the MIC value, the higher the importance of the characteristic parameter to the response variable [48]. In this study, the MINE function package in Python 3.0 software was used to calculate the MIC values between the selected characteristic parameters and soil GHG emissions of CO2, N2O, and CH4. The MIC values were then used to evaluate the importance of the selected characteristic parameters, including soil temperature, soil WFPS, soil NO3-N content, and soil O2 content, in influencing the variations of GHG emissions.
The calculation methods and formulas of the overall assessment indices used in the Technique for Order Preference by Similarity to Ideal Solution (TOPSIS) method are provided in References [32,49].
Excel was utilized for organizing and conducting preliminary analyses of the experimental data. For more comprehensive statistical evaluation, SPSS 26.0 was employed for significance testing and analysis of variance (ANOVA) on the experimental results. The least-significant difference (LSD) method, with a significance level set at p < 0.05 *, was used to compare treatment effects. Furthermore, Pearson correlation analysis was performed using Origin 2019 to explore the relationships between gas fluxes and various soil parameters.

3. Results

3.1. Environmental Variables

During the Spring–Summer seasons, the daily solar radiation at the study site varied between 5.62 W/m2 and 147.21 W/m2, with an average intensity of 63.72 W/m2, whereas during the Autumn–Winter seasons, it ranged from 3.68 W/m2 to 87.84 W/m2, with an average intensity of 34.19 W/m2. On average, solar radiation during Spring–Summer was 1.87 times higher than in Autumn–Winter (Figure 2a,b). This seasonal variation aligns with the 7-year average (2015–2022) recorded at the Yangling weather station.
Daily average air temperatures during the Spring–Summer seasons increased over time, ranging from 14.26 °C to 32.27 °C, with an average intensity of 24.01 °C. In contrast, during the Autumn–Winter seasons, temperatures generally decreased throughout the season, ranging from 29 °C to 7.46 °C, with an average intensity of 16.75 °C. On average, the air temperature during Spring–Summer was 7.26 °C higher than in Autumn–Winter (Figure 2c,d).
The trends in daily average air humidity in the greenhouse were similar for both seasons, ranging from 40.97% to 94.27% during Spring–Summer, with an average intensity of 62.16% and from 49.17% to 96.31% in Autumn–Winter seasons, with an average intensity of 76.16%. The average air humidity during Autumn–Winter was 14% higher than that of Spring–Summer seasons (Figure 2e,f).

3.2. Soil Variables

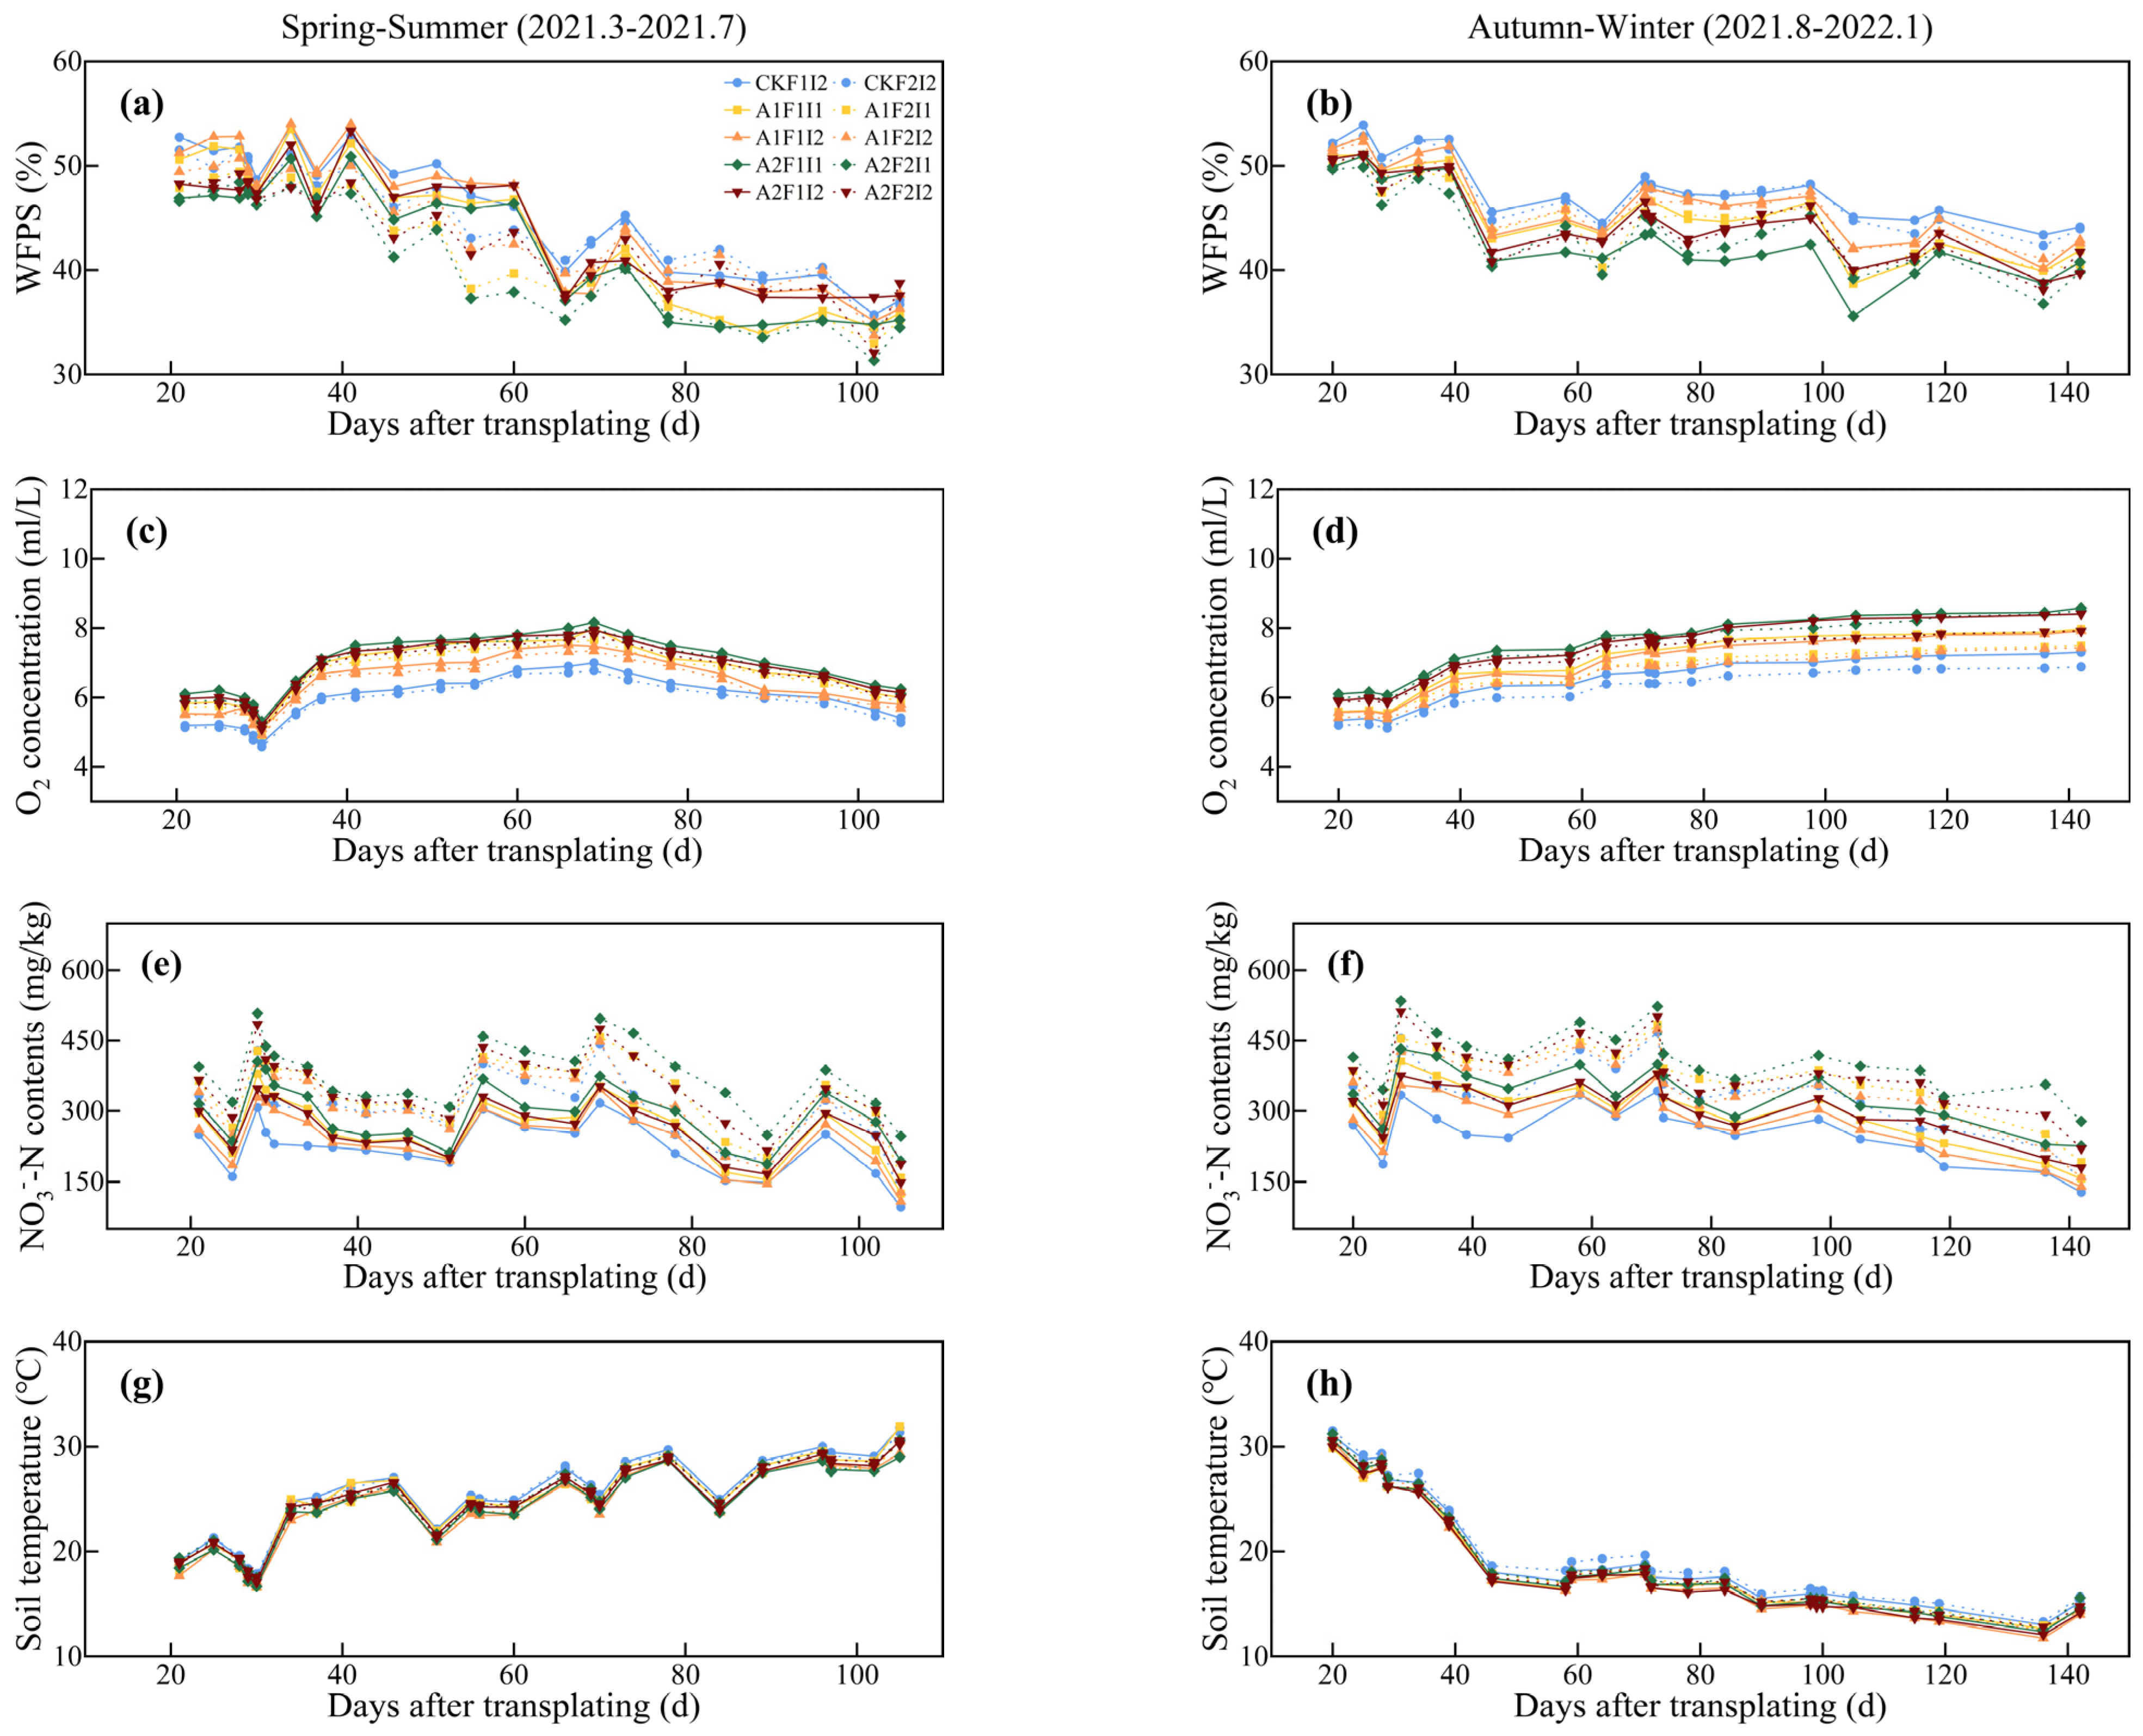
Soil water-filled porosity (WFPS). The water-filled pore space (WFPS) exhibited a fluctuating downward trend in Spring–Summer and Autumn–Winter seasons, ranging from 31.35–54.02% and 35.59–53.89%, respectively (Figure 3a,b). In addition, higher soil temperature and air temperature in Spring–Summer seasons promoted soil evaporation, resulting in a 3.95% decrease in WFPS compared to the Autumn–Winter seasons (Table 2). The WFPS values under the high fertilization treatments were generally smaller than the low fertilization treatments, with the F2 treatment reducing by 3.07% over the F1 treatment in Spring–Summer seasons, and by 0.55% in Autumn–Winter seasons (Table 2).
At the same fertilization level, WFPS significantly decreased as aeration levels increased (p < 0.01 **) (Table 2). Among them, A2 treatment was significantly reduced by 2.76% and 6.07% compared to A1 and CK treatments in Spring–Summer seasons, by 3.82% and 7.55% in Autumn–Winter seasons, respectively (p < 0.01 **) (Table 2). However, due to frequent irrigation in the greenhouse, WFPS remained consistently high throughout the experiment (Figure 3a,b).
Soil Oxygen concentration (soil O2 content). The soil O2 content during the Spring–Summer period exhibited an initial increase followed by a decrease, ranging from 4.58 mL/L to 8.16 mL/L. In contrast, the Autumn–Winter period saw a steady increase in soil O2 content, which ranged from 5.12 mL/L to 8.58 mL/L (Figure 3c,d). In addition, higher irrigation levels tended to reduce soil O2 content during the tomato growing season. The soil O2 content of I2 treatments were significantly lower than I1 treatments, with the I2 treatment being 6.47% lower than I1 in the Spring–Summer seasons and 5.26% in Autumn–Winter (Table 2). However, the soil O2 content had a significant increase as the aeration level increased; among them, the A2 treatments were higher by 4.93% and 16.02% than A1 and CK treatments in the Spring–Summer seasons, and 8.25% and 16.43% higher in A2 treatments than A1 and CK treatments in the Autumn–Winter seasons, respectively (p < 0.01 **) (Table 2).
Soil nitrate N content (soil NO3-N content). Soil NO3-N content showed a fluctuating downward trend in both the Spring–Summer seasons as well as in the Autumn–Winter seasons, ranging from 95.27 mg/kg to 507.9 mg/kg and from 127.58 mg/kg to 534.36 mg/kg (Figure 3e,f). Notably, four peaks in soil NO3-N content coincided with the four additional fertilizer applications (Figure 3e,f). The planting season significantly influenced soil NO3-N content, which was 9.79% lower during the Spring–Summer seasons compared to the Autumn–Winter seasons (p < 0.01 **). The increase in the length of tomato growth due to the air temperature in the Autumn–Winter seasons, caused the soil NO3-N content to be in a slowly decreasing trend in the later part of the Autumn–Winter seasons (Figure 3f). Aeration significantly affected soil NO3-N content, which increased with increasing aeration level by 10.83%, 23.03% for A2 treatment over A1, CK treatments in the Spring–Summer seasons, and by 10.61%, 22.57% in the Autumn–Winter seasons, respectively (Table 2). However, soil NO3-N content decreased significantly with increasing irrigation level, with I2 decreasing by 11.43% from the I1treatment in the Spring–Summer seasons, and by 3.43% in the Autumn–Winter seasons (p < 0.01 **) (Table 2).
Soil temperature (soil T). The seasonal fluctuation in soil temperature within the top 10 cm layer mirrored the trend observed in air temperature (Figure 3d,e,g,h). The Spring–Summer seasons showed a fluctuating upward trend with a range of 16.6 °C–31.9 °C and the Autumn–Winter seasons showed a fluctuating downward trend with a range of 10.7 °C−31.51 °C (Figure 3g,h). The average seasonal soil T during the Spring–Summer seasons was 5.71 °C higher than the Autumn–Winter seasons.

3.3. Soil CO2 Fluxes

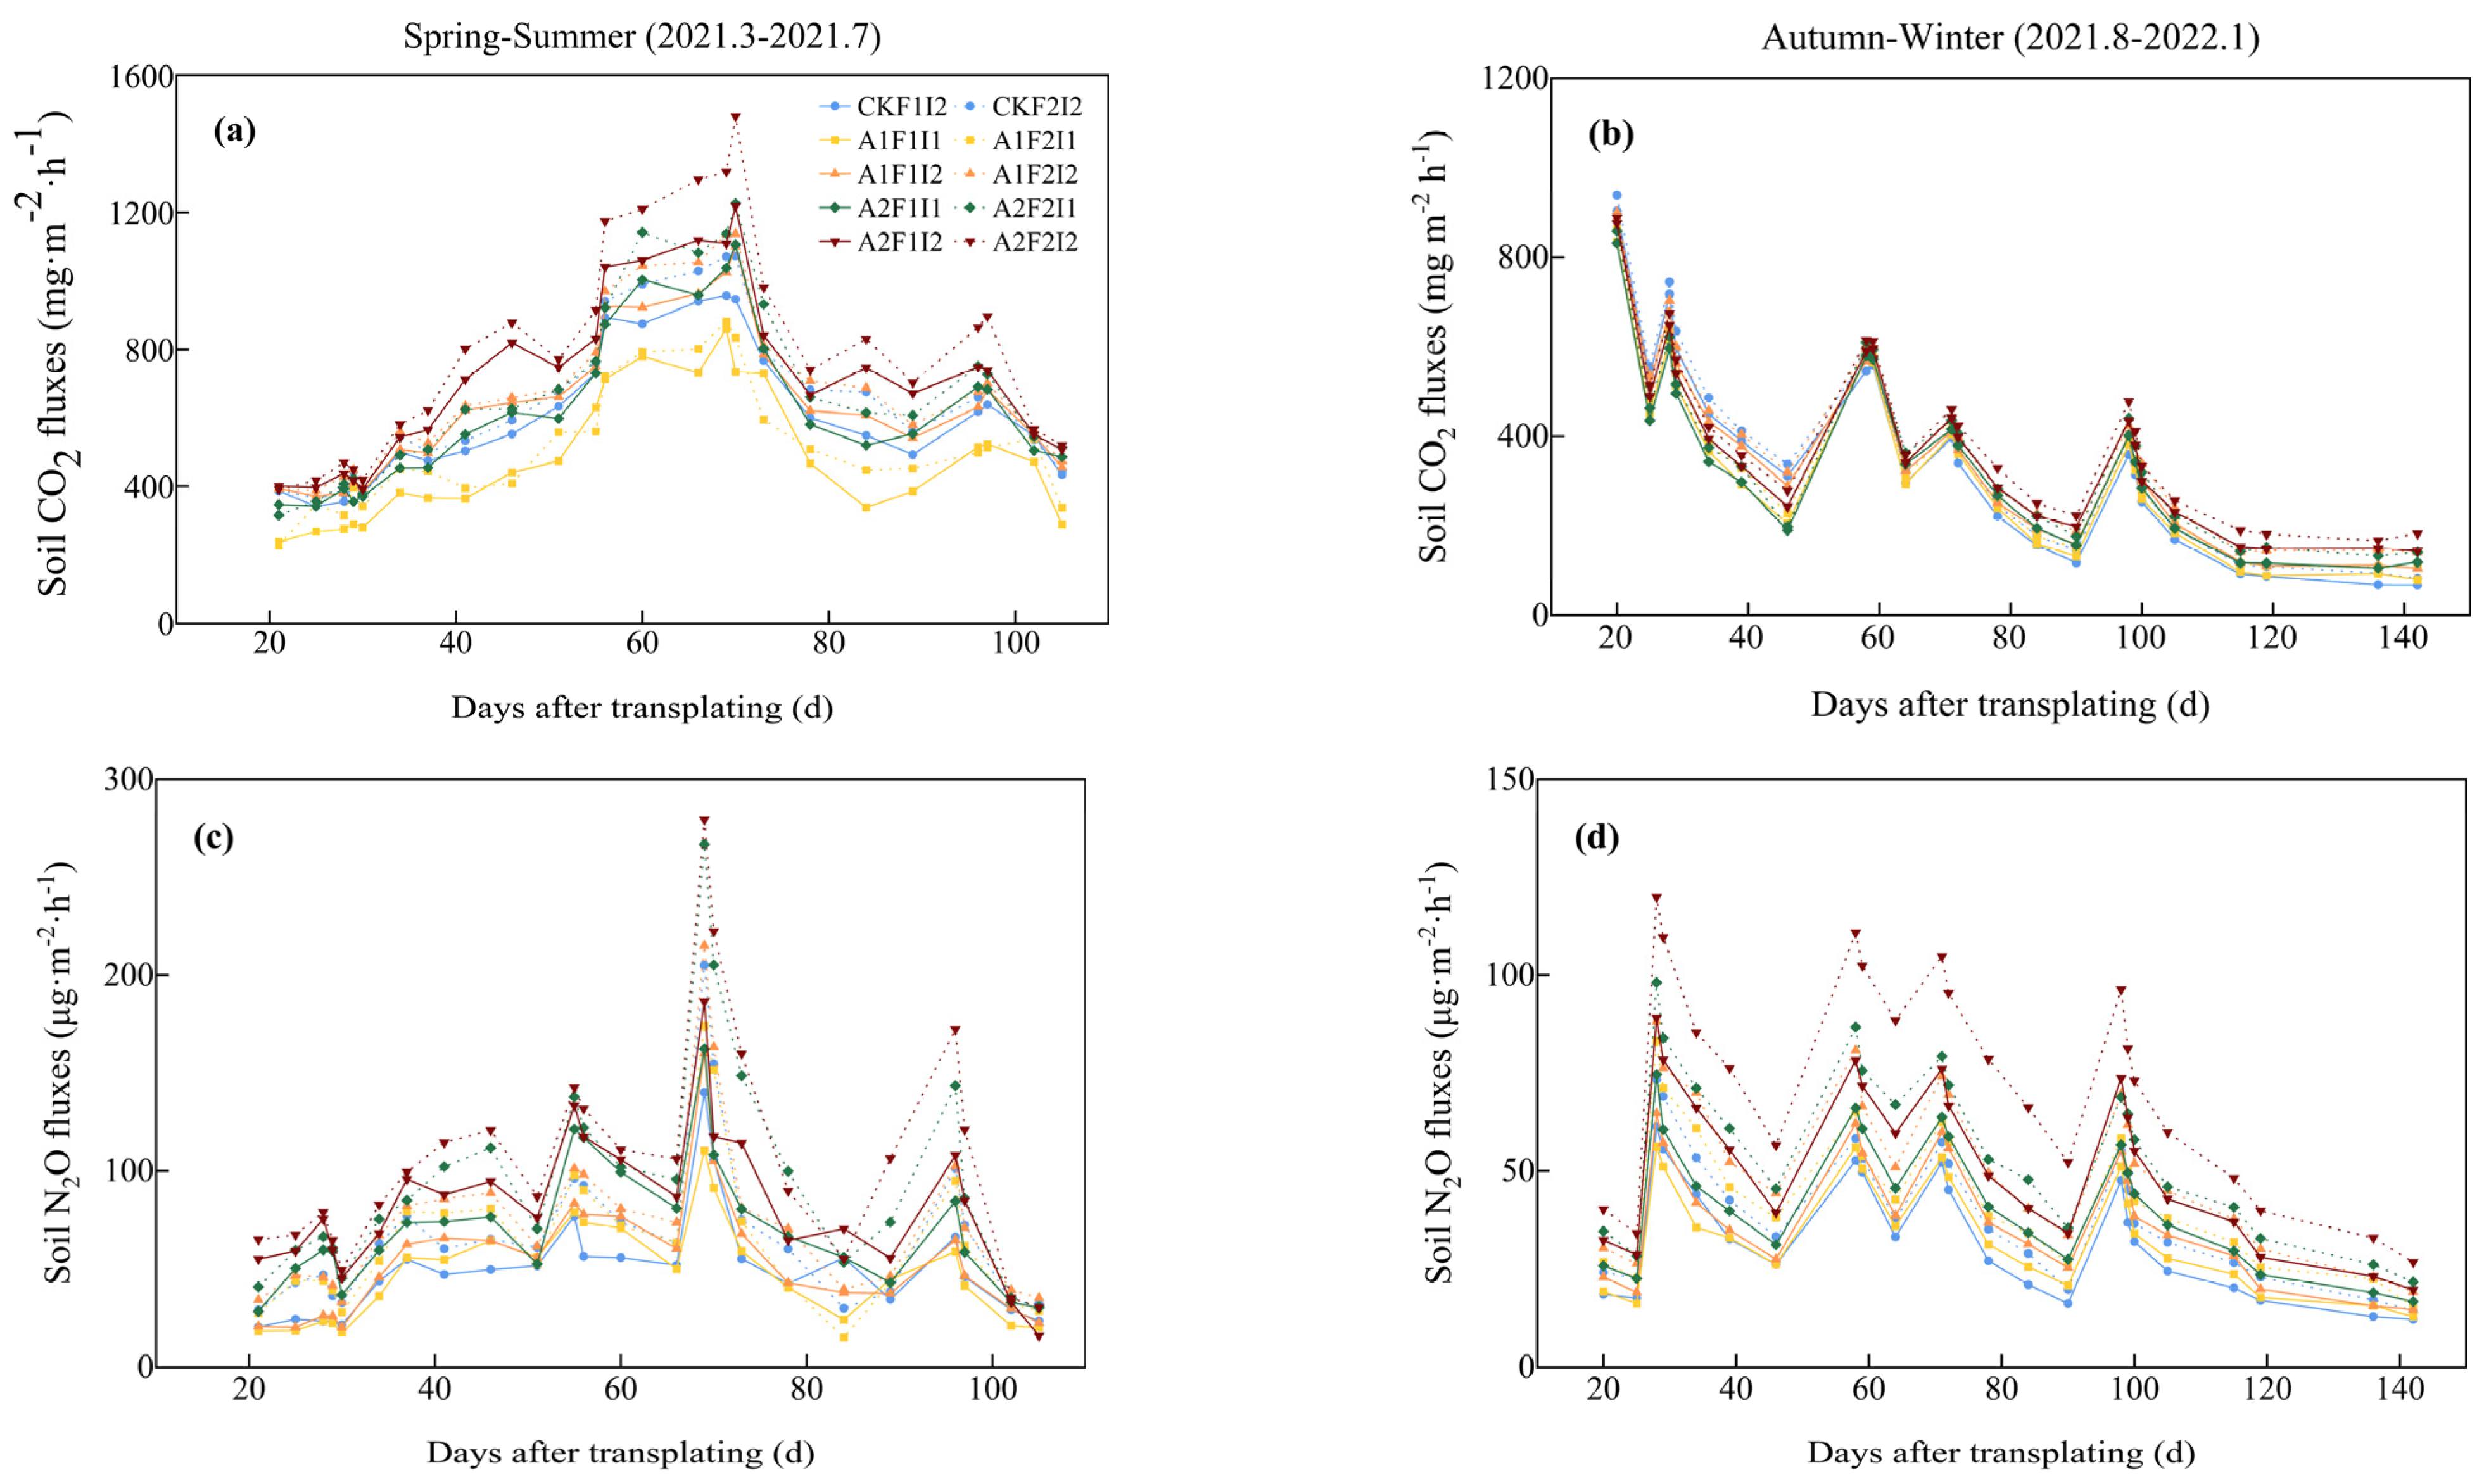
During the Spring–Summer seasons, soil CO2 fluxes followed a “V”-shaped trend—initially rising before declining—whereas in the Autumn–Winter seasons, the fluxes exhibited a seasonal variation that closely mirrored changes in soil temperature (Figure 4a,b). Specifically, CO2 fluxes ranged from 227.94 to 1480.26 mg·m−2·h−1 during the Spring–Summer seasons and from 67.75 to 938.92 mg·m−2·h−1 in the Autumn–Winter seasons. On average, the mean flux in the Spring–Summer seasons reached 641.78 mg·m−2·h−1, which was 77.62% higher than that observed in the Autumn–Winter seasons. Cumulatively, the Spring–Summer seasons recorded 1.37 × 10⁴ kg/ha of CO2 emissions—an increase of 24.69% (p < 0.05 *) compared to the Autumn–Winter seasons. Furthermore, significant interactive effects were observed among irrigation and fertilization, irrigation and aeration, fertilization and aeration, and the three-way combination of irrigation–fertilization–aeration on CO2 emissions across both seasons (Table 2).
Soil CO2 emissions significantly increased with higher levels of fertilization; a trend observed in both seasonal periods. Specifically, soil CO2 emissions rose by 8.34% in F2 treatments compared to F1 treatments in the Spring–Summer period and by 7.52% in the Autumn–Winter period (p < 0.05 *) (Table 2). Notably, emissions were 24.2% and 25.15% higher for the F1 and F2 treatments in the Spring–Summer period compared to the Autumn–Winter period. Additionally, soil CO2 emissions increased significantly with higher irrigation levels, with I2 treatments showing a 20.46% increase over I1 in the Spring–Summer period, and an 8.91% increase in the Autumn–Winter period (p < 0.05 *) (Table 2). In this context, soil CO2 emissions were also higher during the Spring–Summer period, being 29.4% and 16.99% greater for the I1 and I2 treatments, respectively, compared to the Autumn–Winter period. Aeration irrigation further enhanced soil CO2 emissions, with A2 treatments yielding 1.51 × 10⁴ kg/ha in the Spring–Summer period and 1.12 × 10⁴ kg/ha in the Autumn–Winter period. Notably, soil CO2 emissions for A2 treatments were significantly higher than those for A1 and CK treatments, by 22.37% and 11.88% in the Spring–Summer seasons, and by 3.66% and 2.93% in the Autumn–Winter period (p < 0.05 *) (Table 2). Additionally, the warmer conditions of the Spring–Summer seasons resulted in soil CO2 emissions being significantly higher for A2, A1, and CK treatments, with increases of 34.95%, 14.32%, and 24.15%, respectively, compared to the Autumn–Winter seasons (p < 0.01 **) (Table 2).
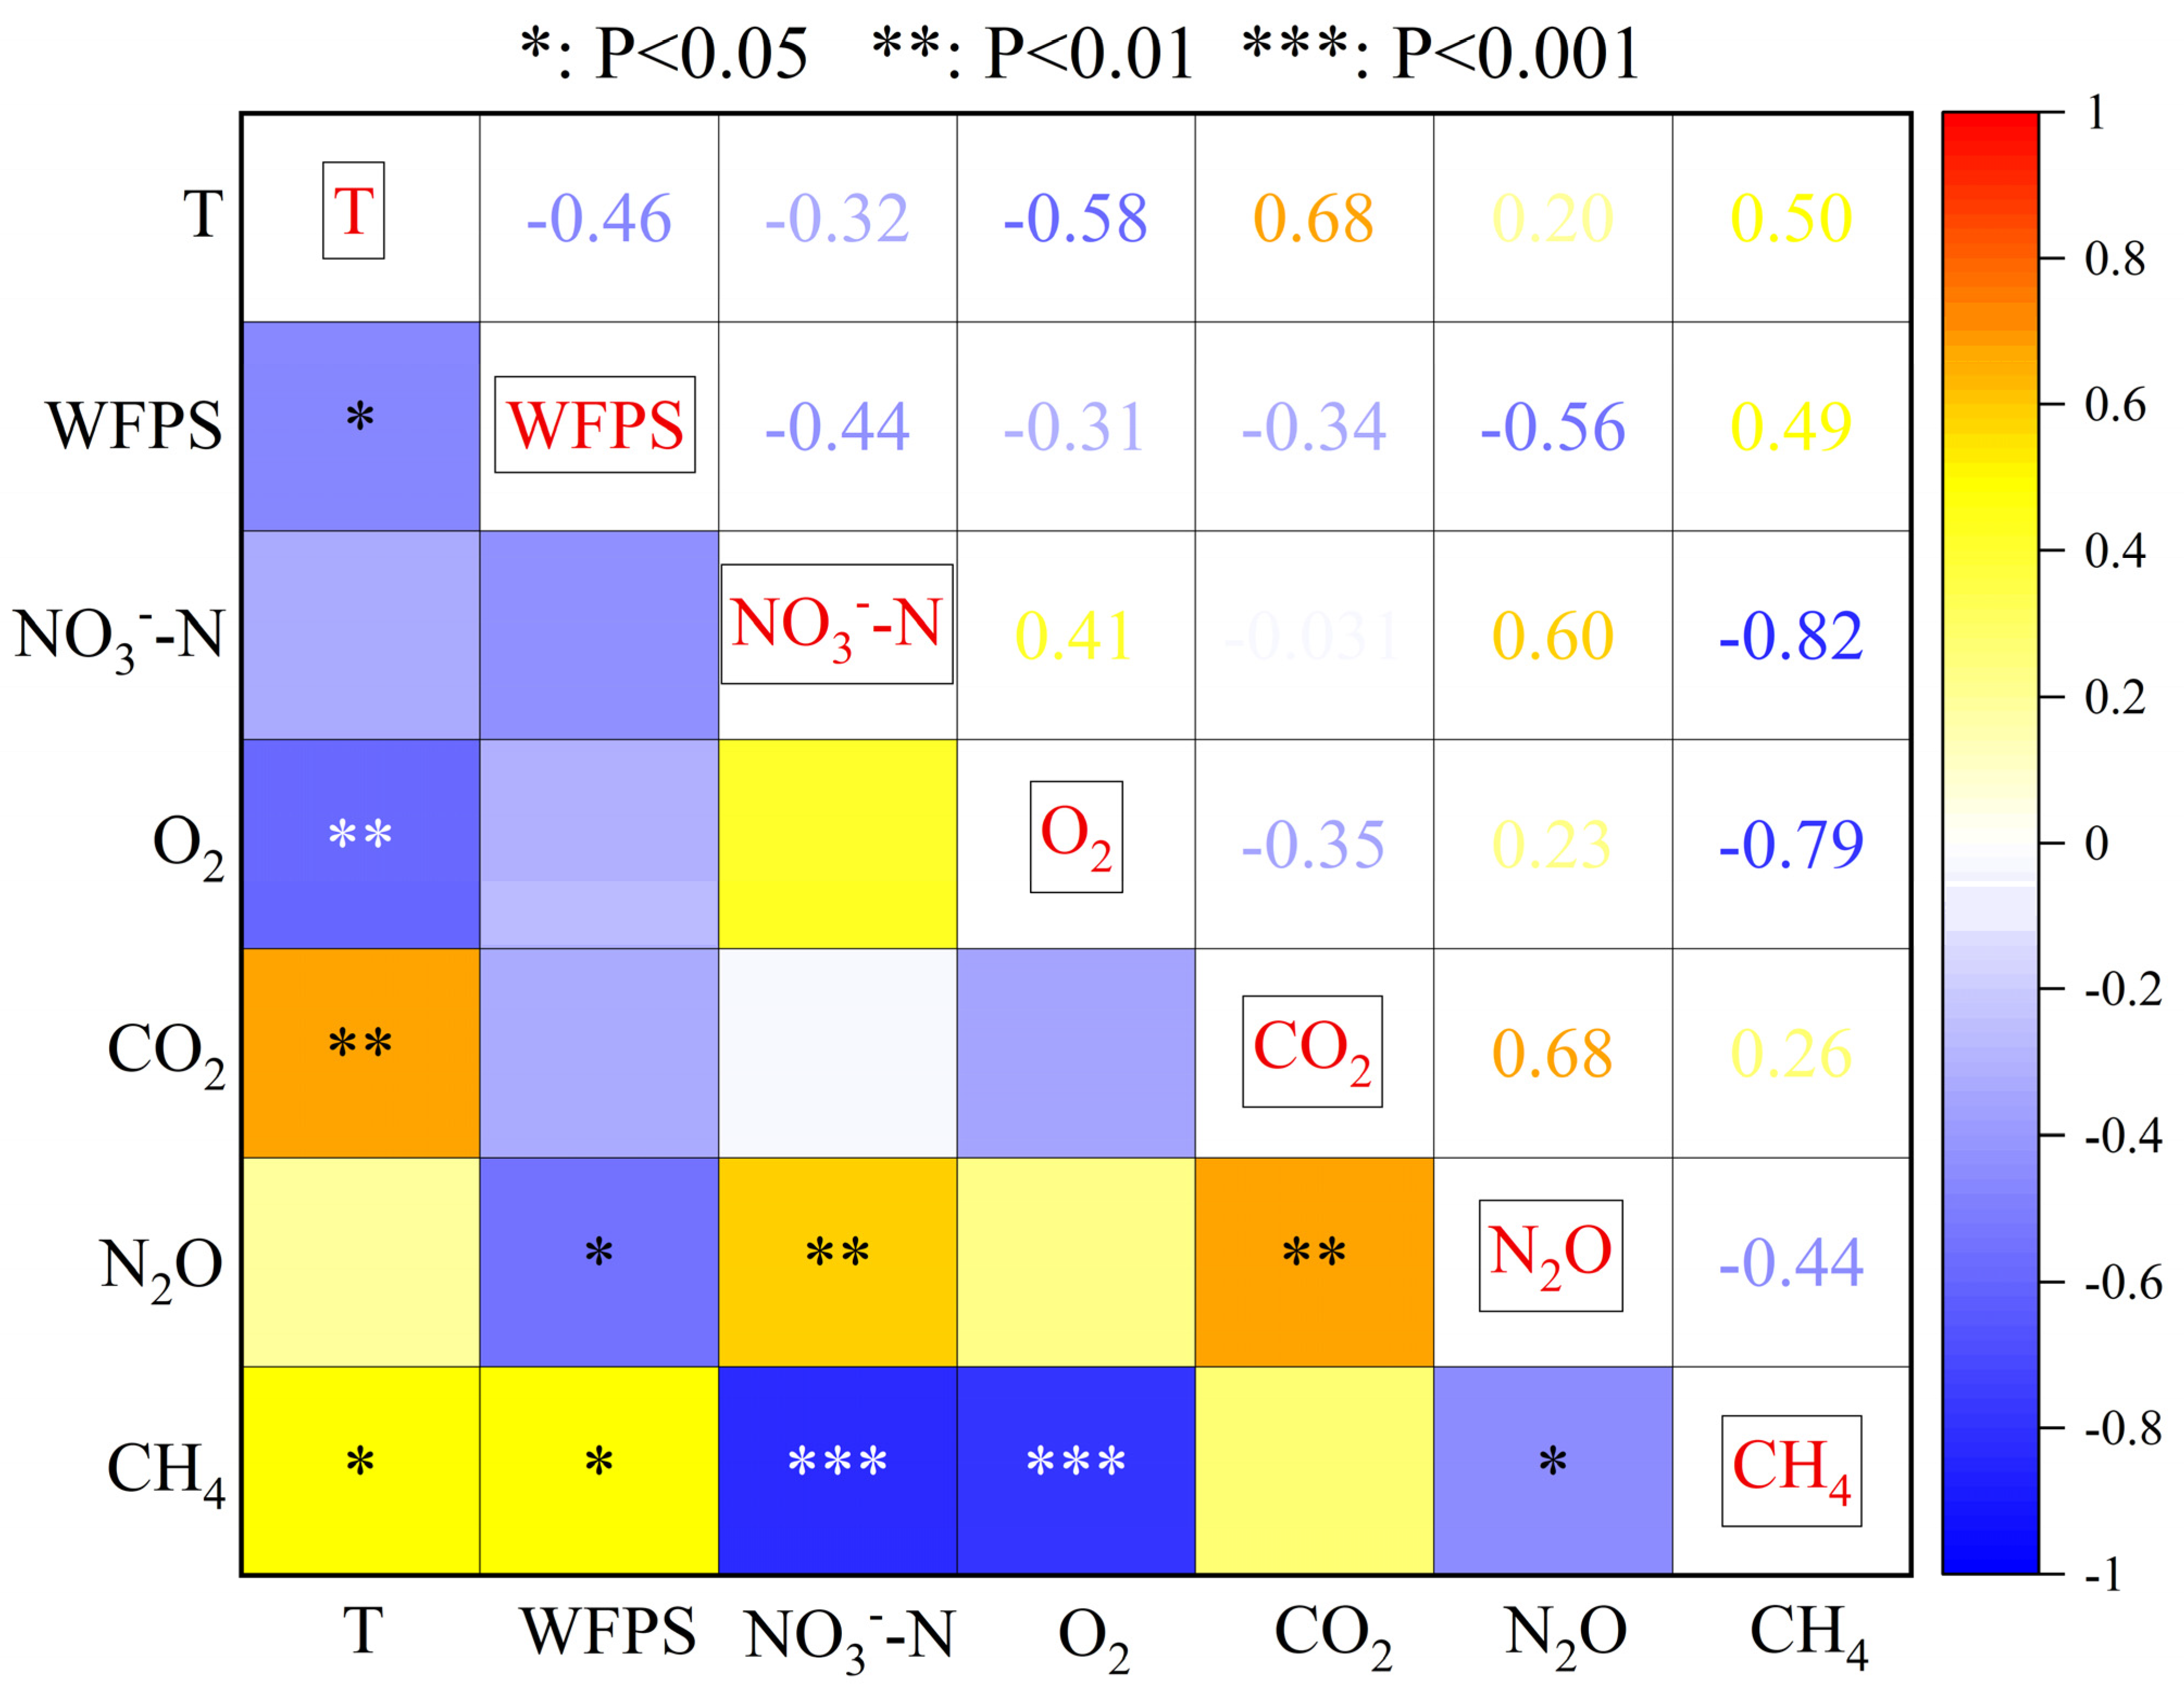
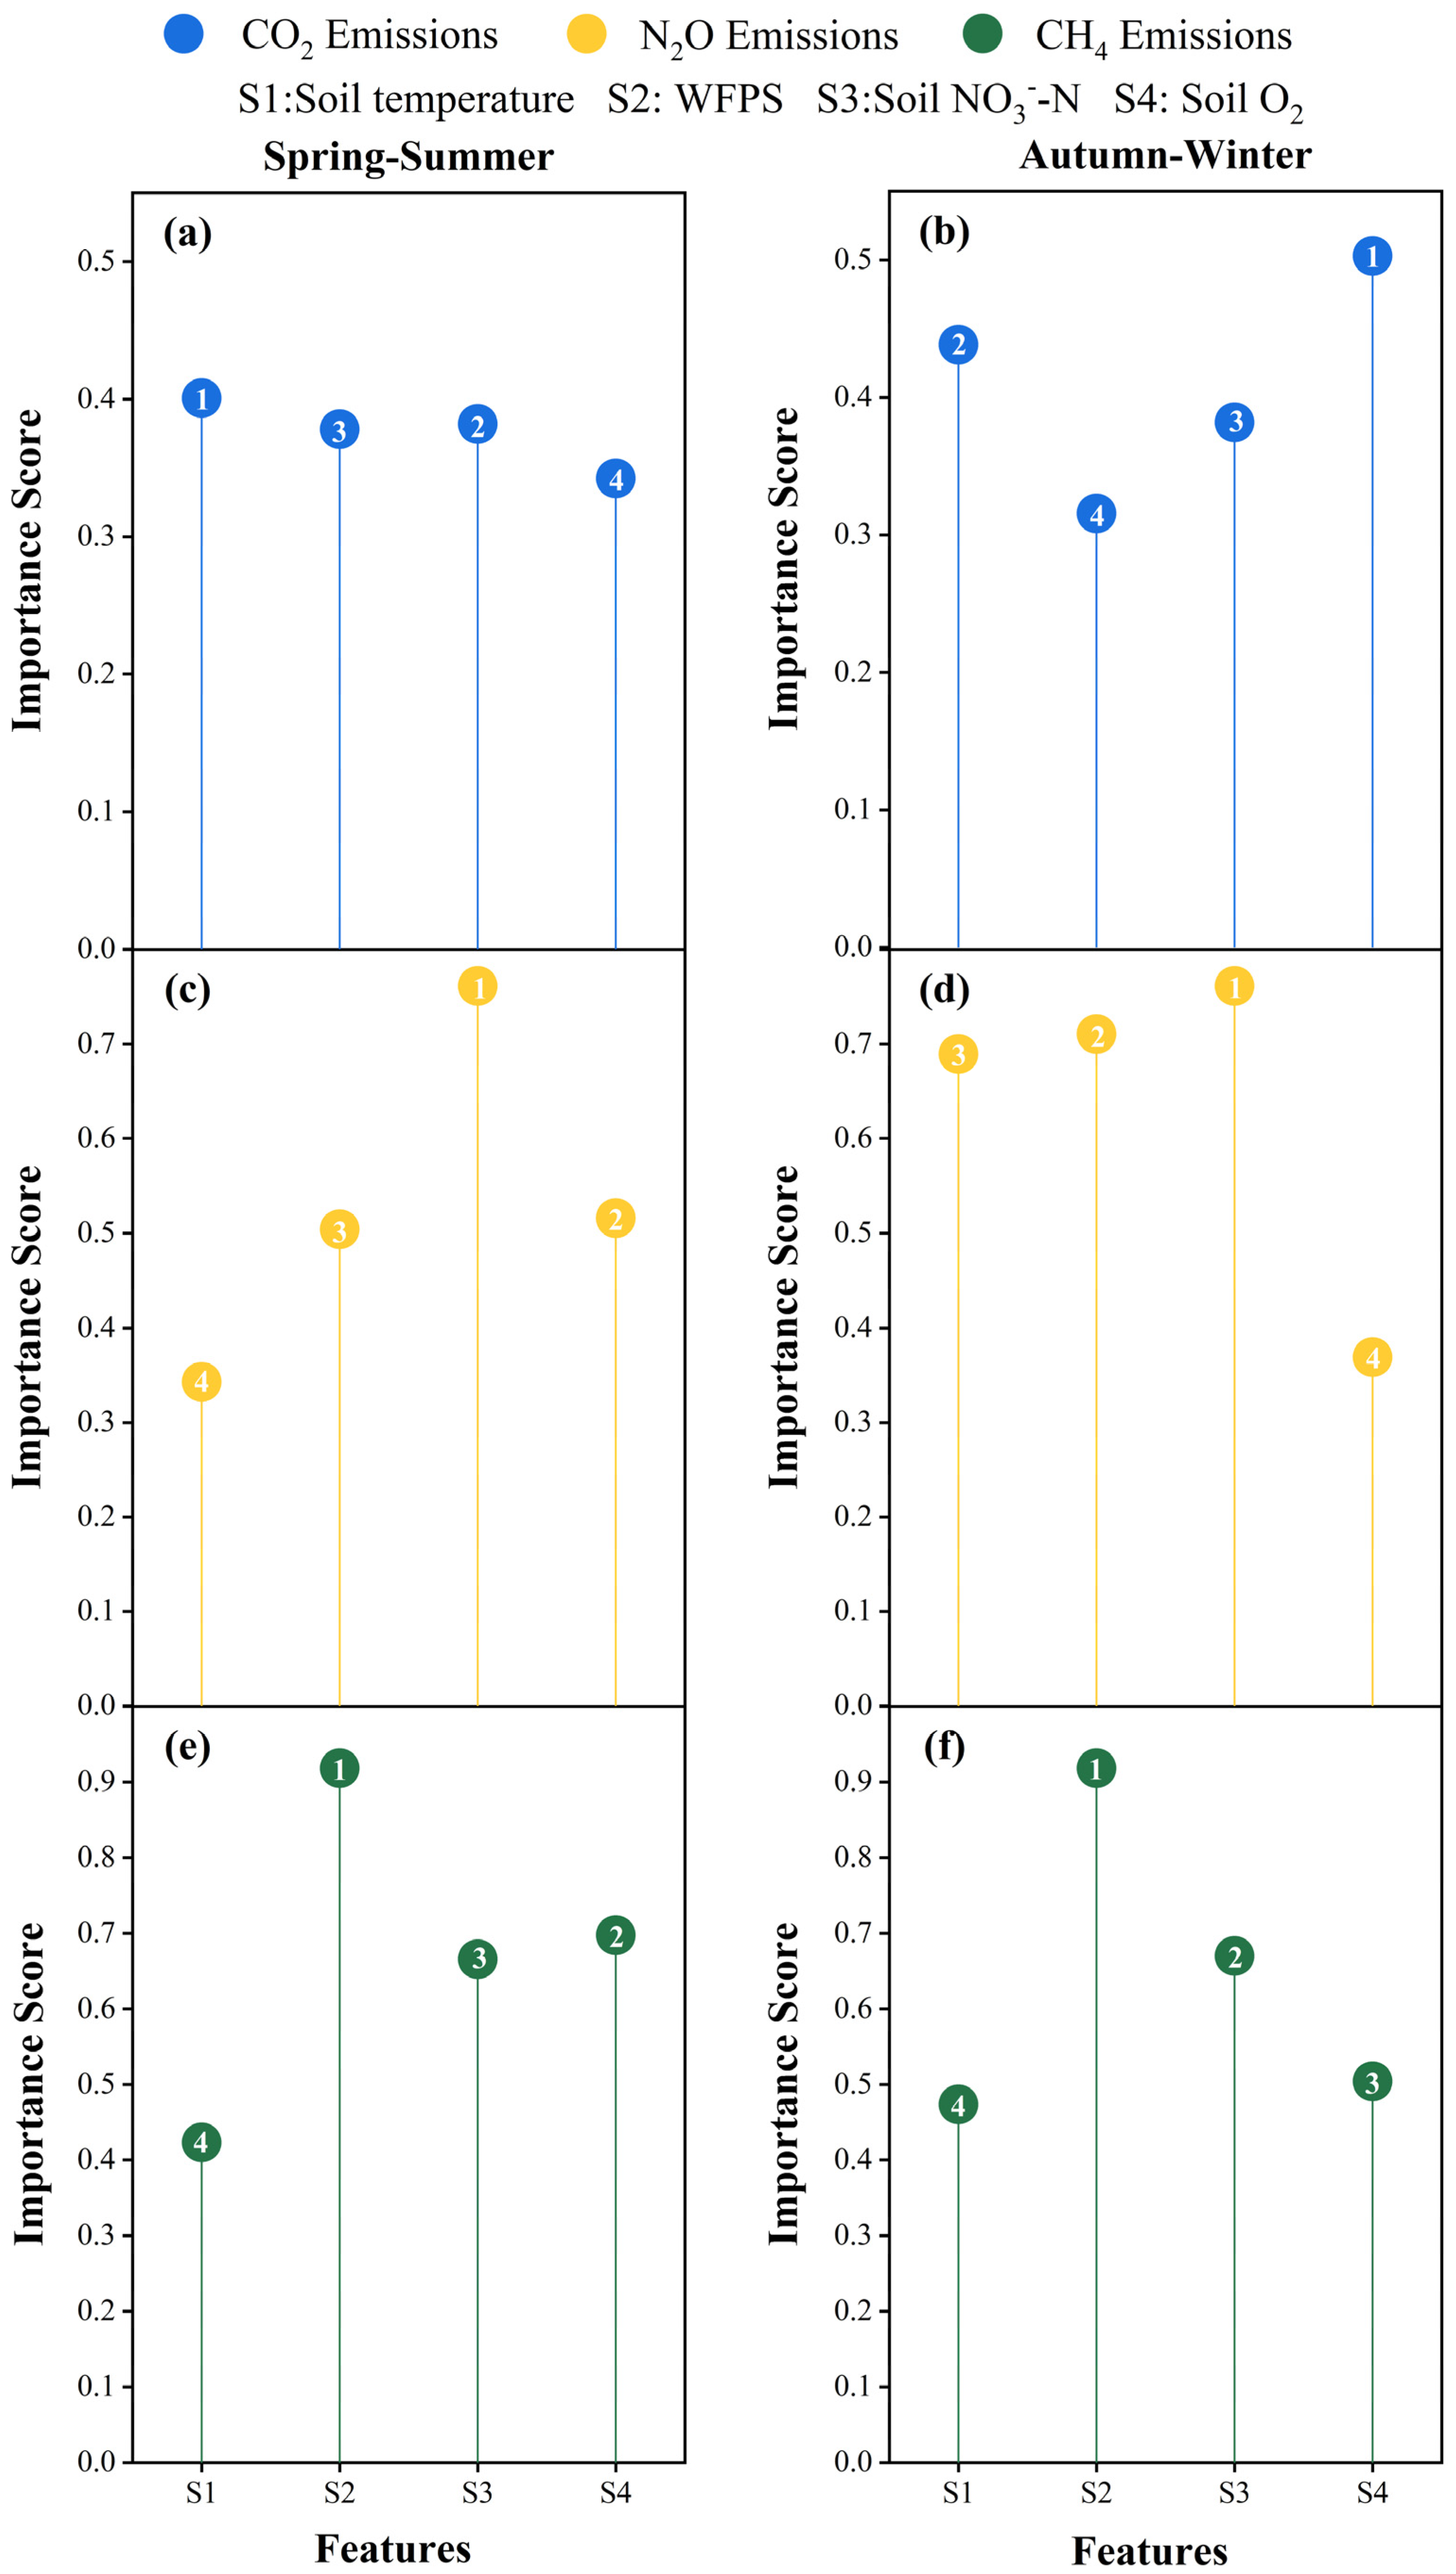
There was a significant positive correlation between soil CO2 emissions and soil temperature throughout the experimental period (p < 0.01 **). However, soil CO2 emissions showed a moderately negative but not significant correlation with WFPS, soil NO3-N content, and soil O2 content. In addition, there was a strong correlation between soil CO2 and soil N2O emissions (p < 0.01 **) (Figure 5). In order to further investigate the significance of the effects of soil temperature, WFPS, soil NO3-N content, and soil O2 content on soil CO2 emissions, soil temperature was defined as the characterizing variable S1, WFPS as the characterizing variable S2, soil NO3-N content as the characterizing variable S3, and soil O2 content as the characterizing variable S4; the maximal information coefficient (MIC) model was used to calculate the MIC values between the characterizing variables and CO2 emissions. The results showed that the MIC value of the characteristic variable S1 with soil CO2 emissions was the largest at 0.401 in the Spring–Summer seasons (Figure 6a). The MIC values of the characteristic variables S2, S3, and S4 with soil CO2 emissions were 0.378, 0.382, and 0.342, respectively, and the order of influence on soil CO2 emissions was S1 > S3 > S2 > S4 (Figure 6a). The MIC value of the characteristic variable S4 with soil CO2 emissions was the largest at 0.503 during the Autumn–Winter seasons (Figure 6b). The MIC values of the characteristic variables S1, S2, and S3 with soil CO2 emissions were 0.438, 0.316, and 0.382, respectively, and the order of influence on soil CO2 emissions was S4 > S1 > S3 > S2 (Figure 6b).

3.4. Soil N2O Fluxes

Soil N2O fluxes exhibited fluctuating trends during both the Spring–Summer and Autumn–Winter seasons, with rates ranging from 14.95 to 279.59 μg·m−2·h−1 in Spring–Summer and from 12.11 to 119.93 μg·m−2·h−1 in Autumn–Winter (Figure 4c,d). Peak fluxes occurred post-fertilization, gradually declining over time (Figure 4c,d). Cumulative N2O emissions during the Spring–Summer seasons reached 1.46 kg/ha, which was 12.22% higher than in the Autumn–Winter seasons (Table 2).
Fertilization levels significantly influenced soil N2O emissions, with emissions increasing with higher fertilization. Specifically, N2O emissions from the F2 treatment rose by 32.45% over the F1 treatment in Spring–Summer and by 33.98% in Autumn–Winter (p < 0.01 **). In addition, warmer Spring–Summer seasons possessed more soil N2O emissions, and soil N2O emissions from F2 and F1 treatments in Spring–Summer seasons increased by 12.96% and 11.66% compared to Autumn–Winter seasons (Table 2). Irrigation levels also affected emissions; N2O fluxes were generally higher in the I2 treatment compared to I1 (Figure 4a,b). Mean emissions from I2 treatments were 1.49 kg/ha in Spring–Summer and 1.34 kg/ha in Autumn–Winter, significantly exceeding those from I1 by 5.76% and 8.13%, respectively (p < 0.05 *) (Table 2). Moreover, emissions were 13.76% and 11.27% higher for I1 and I2 in Spring–Summer compared to Autumn–Winter (Table 2). Aerated irrigation notably enhanced soil N2O emissions, with emissions rising significantly as the level of aeration increased—a trend consistently observed during both the Spring–Summer and Autumn–Winter seasons (p < 0.01 **) (Table 2). Specifically, in the Spring–Summer seasons, the A2 treatment led to a 50.75% increase in soil N2O emissions compared to A1, and a 56.98% rise relative to the CK treatment (p < 0.01 **). Similarly, during the Autumn–Winter seasons, N2O emissions under the A2 treatment were 33.59% and 57.62% higher than those under the A1 and CK treatments, respectively (p < 0.01 **). Furthermore, when comparing across seasons, A2 treatment in the Spring–Summer period resulted in a 16.97% greater N2O emission than in the Autumn–Winter period (Table 2). In addition, significant interactive effects were found among irrigation–fertilization, irrigation–aeration, and fertilization–aeration combinations in both seasonal periods, all contributing notably to variations in soil N2O emissions.
Soil N2O emissions demonstrated a significant inverse relationship with water-filled pore space (WFPS) over the course of the experimental year (p < 0.05 *), while showing a strong positive association with soil NO3-N concentrations (p < 0.01 **) (Figure 5). To assess the relative influence of key environmental variables (S1, S2, S3, and S4) on soil N2O emissions, Maximal Information Coefficient (MIC) values were computed between each variable and the N2O fluxes. The results showed that the MIC value of the characteristic variable S3 with soil N2O emissions was the largest at 0.761 in the Spring–Summer seasons (Figure 6c). The MIC values of the characteristic variables S1, S2, and S4 with soil N2O emissions were 0.343, 0.504, and 0.516, respectively, and the order of influence on soil N2O emissions was S3 > S4 > S2 > S1 (Figure 6c). The MIC value of the characteristic variable S3 with soil N2O emissions was the largest at 0.761 during the Autumn–Winter seasons (Figure 6d). The MIC values of the characteristic variables S1, S2, and S4 with soil N2O emissions were 0.689, 0.711, and 0.369, respectively, and the order of influence on soil N2O emissions was S3 > S2 > S1 > S4 (Figure 6d).

3.5. Soil CH4 Fluxes

Soil CH4 fluxes displayed fluctuating trends in both seasons, predominantly showing negative emissions, indicating that the soil acted as a sink for atmospheric CH4, particularly during the cold Autumn–Winter seasons (Figure 4e,h). Especially during the cold Autumn–Winter seasons, the soil CH4 fluxes were all negative (Figure 4f). The fluxes ranged from −0.0843 to 0.0185 mg·m−2·h−1 in Spring–Summer and from −0.0530 to −0.0055 mg·m−2·h−1 in Autumn–Winter (Figure 4e,f). The Autumn–Winter seasons was more conducive to CH4 uptake, which was reduced by 23.11% during Spring–Summer (p < 0.05 *) (Table 2). Mean soil CH4 emissions were −0.57 kg/ha in Spring–Summer and −0.74 kg/ha in Autumn–Winter (Table 2). Moreover, in both the Spring–Summer and Autumn–Winter seasons, the interactions among irrigation–fertilization, and fertilization–aeration combinations had highly significant effects on soil CH4 emissions.
Increased fertilization levels led to higher CH4 uptake, significantly enhancing absorption in the F2 treatment by 39.5% over F1 in Spring–Summer and by 12.5% in Autumn–Winter (p < 0.01 **) (Table 2). Additionally, F2 and F1 treatments absorbed 16.29% and 32.49% less in Spring–Summer compared to Autumn–Winter, respectively (Table 2). In addition, increased irrigation level significantly promoted soil CH4 emissions and reduced soil CH4 uptake. The I2 treatment increased soil CH4 emissions by 39.19% compared to the I1 treatment during the Spring–Summer seasons, and by 19.81% during the Autumn–Winter seasons (p < 0.01 **). Low air temperatures promoted soil uptake of CH4 and reduced soil CH4 emissions. The I2 and I1 treatments increased soil CH4 emissions by 33.53% and 12.34% throughout the Spring–Summer seasons compared to the Autumn–Winter seasons (Table 2). Aerated irrigation reduced soil CH4 emissions and emissions decreased significantly with increasing levels of aeration (p < 0.01 **). Soil CH4 emissions were reduced by 25.87% for the A2 treatment compared to the A1 treatment during the Spring–Summer seasons and by 15.47% during the Autumn–Winter seasons. In addition, soil CH4 emissions in Spring–Summer were significantly lower than in Autumn–Winter, with reductions of 16.71%, 23.59%, and 69.62% for A2, A1, and CK treatments, respectively (Table 2).
Soil CH4 emissions correlated positively with soil temperature and WFPS (p < 0.05 *) and negatively with soil NO3-N content and soil O2 content (p < 0.001 ***) (Figure 5). A negative correlation also existed between CH4 and N2O emissions (p < 0.05 *) (Figure 5). The importance of the influence of the characteristic variables S1, S2, S3, and S4 on soil CH4 emissions was investigated and the MIC values between the characteristic variables and soil CH4 emissions were calculated. The results showed that the MIC value of the characteristic variable S2 with soil CH4 emissions was the largest at 0.918 in the Spring–Summer seasons (Figure 6e). The MIC values of the characteristic variables S1, S3, and S4 with soil CH4 emissions were 0.423, 0.666, and 0.698, respectively, and the order of influence on soil CH4 emissions was S2 > S4 > S3 > S1 (Figure 6e). The MIC value of the characteristic variable S2 with soil CH4 emissions was the largest at 0.918 during the Autumn–Winter seasons (Figure 6f). The MIC values of the characteristic variables S1, S3, and S4 with soil CH4 emissions were 0.474, 0.670, and 0.504, respectively, and the order of influence on soil CH4 emissions was S2 > S3 > S4 > S1 (Figure 6f).

3.6. Yield, Net GHG, NGWP, and GHGI

The range of tomato yield in the warm Spring–Summer seasons was 40.37 t/ha–55.52 t/ha, and the range of tomato yield in the Autumn–Winter seasons was 35.97 t/ha–48.13 t/ha. The mean yield of tomatoes was 4.99 t/ha (12.05%) higher in the Spring–Summer seasons than in the Autumn–Winter seasons (Table 3). Fertilization, irrigation, and aeration all significantly influenced tomato yield in both seasons. Tomato yield increased significantly with an increasing level of fertilization. Tomato yield increased by 11.97% in F2 treatment over F1 treatment in Spring–Summer seasons and by 5.17% in F2 treatment over F1 treatment in the Autumn–Winter seasons (p < 0.01 **). In addition, tomato yield response to fertilization had a significant seasonal pattern, with the F2 and F1 treatments increasing by 15.47% and 8.46%, respectively, in the Spring–Summer seasons compared to the Autumn–Winter seasons (p < 0.01 **) (Table 3). Irrigation levels had a significant impact on tomato yield, with higher irrigation resulting in greater productivity. During the Spring–Summer seasons, the I2 treatment increased yield by 11.86% compared to I1, while in the Autumn–Winter seasons, the increase was 2.34% (p < 0.05 *). In addition, I2 and I1 treatments in Spring–Summer seasons showed 15.94% and 6.08% higher than I2 and I1 treatments in Autumn–Winter seasons, respectively (Table 3). Aeration was effective in increasing tomato yield and significantly increased tomato yield with an increasing level of aeration. Tomato yield was significantly increased by 4.93% and 13.64% in A2 treatment over A1 and CK treatments in Spring–Summer seasons, and A2 treatment significantly increased by 12.08% and 20.17% over A1 and CK treatments in the Autumn–Winter seasons (p < 0.01 **). The A2, A1, and CK treatments during the warm Spring–Summer seasons increased tomato yield by 8.09%, 15.46%, and 14.3% than the A2, A1, and CK treatments during the Autumn–Winter seasons (Table 3). Moreover, in both the Spring–Summer and Autumn–Winter seasons, the interactions among irrigation–fertilization, irrigation–aeration, and fertilization–aeration combinations had highly significant effects on tomato yield.
During the Spring–Summer seasons, the average net GHG emissions reached 1.41 × 10⁴ kg/ha, which was 2749.85 kg/ha (24.3%) higher than that in the Autumn–Winter seasons (p < 0.05 *) (Table 3). Both irrigation and fertilization exerted significant influences on net GHG emissions, with notable interaction effects observed in both seasonal periods (Table 3). Specifically, the I2 irrigation regime led to a 20.01% increase in net GHG emissions compared to I1 during the Spring–Summer seasons, and an 8.88% increase during the Autumn–Winter seasons (p < 0.05 *). Enhanced fertilization levels also significantly elevated net GHG outputs, with F2 treatments yielding an 8.96% and 8.26% increase over F1 during the Spring–Summer and Autumn–Winter seasons, respectively. Aeration treatments exhibited a strong effect on net GHG emissions, which rose substantially with higher aeration levels. Compared to A1 and CK treatments, A2 treatments increased emissions by 23.12% and 12.93% in the Spring–Summer seasons, and by 4.53% and 4.27% in the Autumn–Winter seasons (Table 3). Additionally, Table 3 reveals that the NGWP and GHGI were 14.46% and 2.37% higher, respectively, in the Spring–Summer seasons compared to the Autumn–Winter seasons. Irrigation, fertilization, and aeration were all found to have highly significant effects on both NGWP and GHGI across seasons. NGWP increased with higher levels of fertilization and irrigation: F2 treatment resulted in increases of 32.16% and 35.46% over F1, while I2 treatment led to increases of 8.31% and 10.22% over I1 in the Spring–Summer and Autumn–Winter seasons, respectively (p < 0.05 *). Moreover, aeration irrigation markedly promoted NGWP, with A2 treatments raising it by 51.99% and 54.25% over A1 and CK in the Spring–Summer seasons, and by 34.84% and 57.06% in the Autumn–Winter seasons (Table 3).
Efficiency evaluation models for combined irrigation, fertilization, and aeration treatments were established, incorporating yield, net GHG, NGWP, and GHGI of greenhouse tomatoes. The TOPSIS method calculated the comprehensive evaluation index for the 10 treatments, detailed in Table 4. The comprehensive evaluation revealed that, during the Spring–Summer seasons, A2-F2-I2 emerged as the least favorable combined treatment scenario, with Ci values of 0.113, whereas A1-F1-I1 was identified as the most optimal one with Ci values of 0.891. During the Autumn–Winter seasons, the combined treatment scenario A2-F2-I2 was identified as the least favorable, with a Ci value of 0.102, whereas A2-F1-I1 was deemed the most optimal, exhibiting a Ci value of 0.916. This indicates that combining A1, F1, I1 and A2, F1, I1 were optimal for improving the yield and reducing net GHG, NGWP, GHGI in the Spring–Summer seasons and Autumn–Winter seasons, respectively, under mulched drip irrigation.

4. Discussion

4.1. Soil CO2 Emissions

Soil CO2 emissions are governed by a combination of environmental and edaphic conditions. Numerous studies, including [39], have reported significant increases in soil CO2 fluxes under global warming scenarios across diverse ecosystems—a trend consistent with our findings. In this study, soil temperature exhibited a strong positive correlation with CO2 emissions (p < 0.01 **) (Figure 5). On average, soil CO2 emissions were 24.69% higher during the Spring–Summer seasons than in the Autumn–Winter seasons (Table 2). This increase corresponded with seasonal differences in air and soil temperatures, which were 7.26 °C and 5.71 °C higher, respectively, during the Spring–Summer period (Table 2; Figure 2c,d). Nevertheless, the seasonal fluctuation in greenhouse soil CO2 emissions was less pronounced than that observed in forest ecosystems [39]. Interestingly, some studies, such as [12], found no significant temperature-related variation in CO2 emissions within wheat–soybean rotations. These discrepancies highlight the crop and system specific responses of soil respiration to thermal shifts, stressing the importance of incorporating seasonal dynamics for accurate GHG emission assessments.
In addition, the three greenhouse farm management practices of aeration, fertilization, and irrigation significantly affected the soil CO2 emissions. Our findings indicated that soil CO2 emissions were significantly higher (p < 0.05 *) in the A2 treatment compared to A1 and CK treatments, with increases of 22.37%, 3.66% in the Spring–Summer seasons, and 11.88%, 2.93% in the Autumn–Winter seasons. This result aligns with previous studies [28,33,41]. The primary factor influencing soil CO2 emissions was the soil O2 content (Figure 6a,b), which increased with higher aeration levels (Figure 3). An increase in soil oxygen availability improved the rhizosphere environment, thereby promoting microbial proliferation and enhancing enzymatic activity [50], both of which contributed to the rise in soil CO2 emissions. Furthermore, elevated fertilization levels were associated with increased CO2 emissions, as evidenced by the observed trends in Figure 4a,b. This increase may be attributed to nitrogen application alleviating plant nitrogen deficiency, promoting root growth and above-ground biomass [36,51], and leading to higher nitrogen inputs into the soil. This, in turn, stimulates microbial activity and promotes soil CO2 emissions [28,33,41]. Furthermore, nitrogen addition increased soil microbial abundance and enzyme activity, stimulating the mineralization of soil organic matter [46]. Increased irrigation levels also facilitated soil CO2 emissions, as they elevated microbial activity and accelerated the mineralization and decomposition of soil organic carbon [28,41]. In conclusion, aeration, fertilization, and irrigation promoted soil CO2 emissions of greenhouse tomato, especially during the warm Spring–Summer seasons.

4.2. Soil N2O Emissions

Soil N2O emissions primarily originate from nitrification under aerobic conditions and denitrification under anaerobic conditions [46]. In this study, aeration, fertilization, and irrigation exhibited strong regulatory effects on soil N2O emissions. Notably, N2O emissions increased significantly with higher fertilization levels (Table 2). The soil NO3-N showed a negative correlation with WFPS (Figure 5), and the increased level of fertilization depleted water consumption, leading to a decrease in soil water content, which is also consistent with the previous study by [52]. Furthermore, soil NO3-N content emerged as the most critical factor influencing soil N2O emissions (Figure 6c,d). A highly significant relationship (p < 0.01 **) was observed between soil NO3-N content and soil N2O emissions (Figure 5), consistent with earlier research [4,19,33]. It had been shown that increased NO3-N content and elevated NO2-N availability promote N2O emissions [28]. Increased irrigation levels also significantly increased soil N2O emissions. Additionally, higher irrigation levels significantly boosted soil N2O emissions; the emissions from the I2 treatment were 5.76% and 8.13% higher than those from the I1 treatment during the Spring–Summer and Autumn–Winter seasons, respectively (Table 2). Increasing irrigation levels elevated soil water-filled pore space (WFPS) (Figure 3a,b) and soil moisture, which facilitated denitrification processes mediated by nitrifying bacteria [53], thereby promoting soil N2O emissions. However, this finding contrasts with the results reported by [54] who observed a decline in soil N2O emissions with increased irrigation levels. This discrepancy may be attributed to differences in soil texture, climatic conditions, or other agricultural management practices. In addition, increasing the soil O2 content increased soil N2O emissions, which in this study, were 50.75% and 56.98% higher in the A2 treatment than in the A1, CK treatment in the Spring–Summer seasons, and 33.59% and 57.62% higher in the Autumn–Winter seasons (Table 2); this result is consistent with the findings of [28,33]. In addition, soil CO2 and N2O emissions were found to exhibit a strong correlation (p < 0.01 **) in this study (Figure 5). This phenomenon may be attributed to the fact that soil respiration consumes oxygen, thereby accelerating the formation of an anaerobic microenvironment conducive to denitrification, which in turn, enhances soil N2O production and emission [55]. This is consistent with previous findings indicating that denitrification is a major pathway for N2O generation under oxygen-limited conditions [56]. Elevated soil temperatures during the warm Spring–Summer seasons also promoted soil N2O emissions, which increased by 12.22% during the Spring–Summer seasons compared to the Autumn–Winter seasons. In contrast, studies by [57,58] indicated that warmer and drier conditions might slow the decomposition of soil organic carbon and alter the communities of nitrifying and denitrifying bacteria, leading to reduced CO2 and N2O emissions from the soil. To mitigate GHG emissions, reducing fertilization levels, aeration, and moderating irrigation practices present viable strategies.

4.3. Soil CH4 Emissions

The soil CH4 emissions are primarily in anaerobic environments. Organic acids, CO2 and H2 produced by microbial metabolism are used by methanogenic and methane-oxidizing bacteria to produce CH4. This process predominantly occurs in soils with high moisture content and limited aeration. Numerous studies have confirmed that dryland agricultural soils often act as sinks for CH4 due to their aerobic conditions and low methanogenic activity [59]. In this study, unlike the consistent positive emissions of CO2 and N2O throughout the two growing seasons, soil CH4 showed no clear variation pattern and functioned as a sink for atmospheric CH4 fluxes most of the time (Figure 4e,f). This indicates that under the mildly aerobic conditions of the study area, the soil had strong methane oxidation potential and effectively absorbed atmospheric CH4, contributing to ecological mitigation of methane emissions. Moreover, seasonal variation had no significant effect on CH4 emissions, but both CH4 emission and uptake were influenced by irrigation, fertilization, and soil physicochemical properties, with irrigation exerting a particularly significant impact. The WFPS was a key factor influencing soil CH4 emission (Figure 6e,f), which showed a positive correlation with soil CH4 emission (p < 0.05 *), and this was consistent with the results of [41]. The reason for this result is due to the fact that under anaerobic conditions, methanogenic bacteria decompose carbonaceous organic matter in the soil into CH4 [60]. In addition, aeration reduces soil CH4 emissions, and soil CH4 emissions decrease significantly with increasing levels of aeration (Table 2). Aerating improves soil aeration, increases soil O2 content, and methane oxidizing bacteria oxidize CH4, which in turn, reduces soil CH4 emissions [41]. Our study corroborated this, revealing a highly significant relationship (p < 0.001 ***) between soil CH4 emissions and soil O2 content (Figure 5). Therefore, moderate aeration and lower soil moisture conditions are conducive to enhancing the soil’s CH4 uptake potential. Fertilization also plays a crucial role in affecting soil physicochemical properties, which subsequently influence soil CH4 emissions. In our study, higher levels of fertilization were associated with reduced soil CH4 emissions, consistent with findings from [60]. This reduction may result from increased activity of methane-oxidizing bacteria, which enhances the oxidation of inter-root CH4 within crops, thereby decreasing overall soil CH4 emissions. A significant interaction between aeration and fertilization was observed, indicating that CH4 uptake rates may be enhanced or suppressed under certain coupling levels.

4.4. Impact of the Coupling of Irrigation, Fertilization, and Aeration on Yield, Net GHG, NGWP, and GHGI

The four factors considered in this study—aeration, fertilization, irrigation, and growing season—not only influence the emissions of greenhouse gases (GHGs) such as N2O, CO2, and CH4, but also significantly impact crop yield by modifying key soil environmental conditions, including water availability, nutrient supply, aeration status, and thermal regime [33,38]. In this study, the highest tomato yield was achieved under the treatment combining high levels of aeration, fertilization, and irrigation (A2F2I2), which significantly exceeded the yield of the control treatment (CKF1I2) by 35.7% (p < 0.01 **) (Table 3). This finding aligns with previous studies [32,35,37]. The improved aeration, fertilization, and irrigation practices enhanced the soil environment, increased nutrient availability, and promoted nitrogen uptake by plants, ultimately boosting yield [61]. Furthermore, tomato yield was found to be 12.05% (p < 0.05 *) higher during the Spring–Summer seasons compared to the Autumn–Winter seasons. However, net GHG, NGWP, GHGI also increased by 24.3%, 14.46%, and 2.37% (Table 3). Therefore, for the cultivation of tomatoes in greenhouse systems, finding a balance between yields and GHG emissions to minimize the negative impacts on the environment is the key to this study.
To achieve economic benefits for farmers while simultaneously reducing GHG emissions, effective field management practices are essential. In this study, the TOPSIS (Technique for Order Preference by Similarity to Ideal Solution) method was employed to identify the optimal irrigation combinations. As a robust multi-criteria decision-making tool, TOPSIS is particularly effective in evaluating the relative advantages and disadvantages of various alternatives. It has been widely applied to the assessment of irrigation strategies under different fertilization and aeration conditions, as well as in evaluating water-saving practices [62]. In our previous research, we also utilized the TOPSIS approach to comprehensively assess the performance of greenhouse tomato cultivation during the Spring–Summer season, enabling the selection of optimal irrigation, fertilization, and aeration combinations that jointly enhanced the yield, fruit quality, and water productivity coefficient (WPC) [32]. In this study, the TOPSIS method analysis showed that A1F1I1 was the optimal combination for the Spring–Summer seasons, and A2F1I1 was the optimal combination for the Autumn–Winter seasons, and these combinations of experimental were able to balance the increase in greenhouse tomato yield and the reduction in GHG emissions.

5. Conclusions

In this study, we systematically evaluated the effects of different levels of aeration, fertilization, and irrigation on tomato yield, GHG emissions, net GHG emissions, NGWP, and GHGI under greenhouse conditions across Spring–Summer and Autumn–Winter seasons. The results demonstrated the following:
(1)
Seasonal interactions among aeration, fertilization, and irrigation significantly influenced soil GHG emissions. Specifically, higher levels of aeration, fertilization, and irrigation increased CO2 and N2O emissions, while enhanced aeration and fertilization reduced CH4 emissions. Compared to the Autumn–Winter seasons, Spring–Summer CO2, N2O, and CH4 emissions rose by 24.69%, 12.22%, and 23.11%, respectively (p < 0.05 *).
(2)
All three management practices notably improved tomato yields but also intensified GHG-related environmental impacts. In Spring–Summer seasons, tomato yield, net GHG emissions, net global warming potential (NGWP), and greenhouse gas intensity (GHGI) were 12.05%, 24.3%, 14.46%, and 2.37% higher than in Autumn–Winter seasons, respectively (p < 0.05 *).
(3)
Considering both economic and environmental benefits, our analysis, which integrated the MIC and TOPSIS models, identified the A1F1I1 treatment (Aeration level, single aeration (A1); fertilization level, 180 kg/ha (F1); irrigation level, 0.8 Epan (I1)) as the optimal combination for the Spring–Summer seasons and the A2F1I1 treatment (Aeration level, double aeration (A2); fertilization level, 180 kg/ha (F1); irrigation level, 0.8 Epan (I1)) as the ideal combination for the Autumn–Winter seasons.
These findings offer a robust scientific foundation and theoretical reference for future research aimed at enhancing greenhouse tomato yields while simultaneously reducing emissions.

Author Contributions

Conceptualization, Y.S.; Methodology, Y.S., H.Z., H.C. and J.X.; Software, H.Z.; Investigation, Z.L.; Data curation, Z.L.; Writing—original draft, Y.S.; Writing—review & editing, H.C. and J.X.; Supervision, H.Z., H.C. and J.X.; Funding acquisition, H.C. All authors have read and agreed to the published version of the manuscript.

Funding

This work was supported by the National Natural Science Foundation of China (52179046, 52309062), Special project of scientific and technological innovation of Xinjiang Research Institute of Arid Area Agriculture (XJHQNY-2025-3-03).

Data Availability Statement

The datasets used during the current study are available from the corresponding author on reasonable request.

Acknowledgments

Special thanks to the anonymous reviewers and the editor for their extensive work on editing the language of the manuscript and useful suggestions for improving the quality of the manuscript.

Conflicts of Interest

The authors declare no conflict of interest.

References

  1. IPCC. AR5 Climate Change 2013: The Physical Science Basis. Available online: https://www.ipcc.ch/report/ar5/wg1/ (accessed on 28 September 2024).
  2. IPCC. Climate Change 2021: The Physical Science Basis. Available online: https://www.ipcc.ch/report/ar6/wg1/downloads/report/IPCC_AR6_WGI_SummaryVolume.pdf (accessed on 28 September 2024).
  3. WMO Greenhouse Gas Bulletin (GHG Bulletin): The State of Greenhouse Gases in the Atmosphere Based on Global Observations Through 2017. India Environment Portal|News, Reports, Documents, Blogs, Data, Analysis on Environment & Development|India, South Asia. Available online: https://wmo.int/publication-series/wmo-greenhouse-gas-bulletin-no14-state-of-greenhouse-gases-atmosphere-based-global-observations (accessed on 29 September 2024).
  4. Chi, Y.; Yang, P.; Ren, S.; Yang, J. Finding the Optimal Fertilizer Type and Rate to Balance Yield and Soil GHG Emissions under Reclaimed Water Irrigation. Sci. Total Environ. 2020, 729, 138954. [Google Scholar] [CrossRef]
  5. Shakoor, A.; Dar, A.A.; Arif, M.S.; Farooq, T.H.; Yasmeen, T.; Shahzad, S.M.; Tufail, M.A.; Ahmed, W.; Albasher, G.; Ashraf, M. Do Soil Conservation Practices Exceed Their Relevance as a Countermeasure to Greenhouse Gases Emissions and Increase Crop Productivity in Agriculture? Sci. Total Environ. 2022, 805, 150337. [Google Scholar] [CrossRef]
  6. Smith, P.; Martino, D.; Cai, Z.; Gwary, D.; Janzen, H.; Kumar, P.; McCarl, B.; Ogle, S.; O’Mara, F.; Rice, C.; et al. Greenhouse Gas Mitigation in Agriculture. Philos. Trans. R. Soc. B Biol. Sci. 2007, 363, 789–813. [Google Scholar] [CrossRef]
  7. Chang, T.; Zhang, Y.; Zhang, Z.; Shao, X.; Wang, W.; Zhang, J.; Yang, X.; Xu, H. Effects of Irrigation Regimes on Soil NO3-N, Electrical Conductivity and Crop Yield in Plastic Greenhouse. Int. J. Agric. Biol. Eng. 2019, 12, 109–115. [Google Scholar] [CrossRef]
  8. Hao, S.; Cao, H.; Wang, H.; Pan, X. Effects of Water Stress at Different Growth Stages on Comprehensive Fruit Quality and Yield in Different Bunches of Tomatoes in Greenhouses. Int. J. Agric. Biol. Eng. 2019, 12, 67–76. [Google Scholar] [CrossRef]
  9. He, J.; Tian, J. Model of coupling water with fertilizer and optimum combination scheme of rice cultivated in aerobic soil with drip irrigation under plastic film. Trans. CSAE 2015, 31, 77–82. (In Chinese) [Google Scholar]
  10. He, F.; Chen, Q.; Jiang, R. Yield and Nitrogen Balance of Greenhouse Tomato (Lycopevsicum esculentum Mill.) with Conventional and Site-Specific Nitrogen Management in Northern China. Nutr. Cycl. Agroecosystems 2007, 77, 1–14. [Google Scholar] [CrossRef]
  11. Zhao, C.; Hu, C.; Huang, W.; Sun, X.; Tan, Q.; Di, H. A Lysimeter Study of Nitrate Leaching and Optimum Nitrogen Application Rates for Intensively Irrigated Vegetable Production Systems in Central China. J. Soils Sediments 2010, 10, 9–17. [Google Scholar] [CrossRef]
  12. Liu, L.; Hu, C.; Yang, P.; Ju, Z.; Olesen, J.E.; Tang, J. Effects of Experimental Warming and Nitrogen Addition on Soil Respiration and CH4 Fluxes from Crop Rotations of Winter Wheat–Soybean/Fallow. Agric. For. Meteorol. 2015, 207, 38–47. [Google Scholar] [CrossRef]
  13. Lu, M.; Zhou, X.; Luo, Y.; Yang, Y.; Fang, C.; Chen, J.; Li, B. Minor Stimulation of Soil Carbon Storage by Nitrogen Addition: A Meta-Analysis. Agric. Ecosyst. Environ. 2011, 140, 234–244. [Google Scholar] [CrossRef]
  14. Trost, B.; Prochnow, A.; Drastig, K.; Meyer-Aurich, A.; Ellmer, F.; Baumecker, M. Irrigation, Soil Organic Carbon and N2O Emissions. A Review. Agron. Sustain. Dev. 2013, 33, 733–749. [Google Scholar] [CrossRef]
  15. Rasool, G.; Guo, X.; Wang, Z.; Ali, M.U.; Chen, S.; Zhang, S.; Wu, Q.; Ullah, M.S. Coupling Fertigation and Buried Straw Layer Improves Fertilizer Use Efficiency, Fruit Yield, and Quality of Greenhouse Tomato. Agric. Water Manag. 2020, 239, 106239. [Google Scholar] [CrossRef]
  16. Below, F.E. Nitrogen Metabolism and Crop Productivity. In Handbook of Plant and Crop Physiology; CRC Press: Boca Raton, FL, USA, 2002; pp. 385–406. [Google Scholar]
  17. Zhu, X.; Ros, G.H.; Xu, M.; Cai, Z.; Sun, N.; Duan, Y.; de Vries, W. Long-Term Impacts of Mineral and Organic Fertilizer Inputs on Nitrogen Use Efficiency for Different Cropping Systems and Site Conditions in Southern China. Eur. J. Agron. 2023, 146, 126797. [Google Scholar] [CrossRef]
  18. Luo, Y.; Field, C.B.; Jackson, R.B. Does Nitrogen Constrain Carbon Cycling, or Does Carbon Input Stimulate Nitrogen Cycling? Ecology 2006, 87, 3–4. [Google Scholar] [CrossRef]
  19. Zhou, Z.; Liao, K.; Zhu, Q.; Lai, X.; Yang, J.; Huang, J. Determining the Hot Spots and Hot Moments of Soil N2O Emissions and Mineral N Leaching in a Mixed Landscape under Subtropical Monsoon Climatic Conditions. Geoderma 2022, 420, 115896. [Google Scholar] [CrossRef]
  20. Bouwman, A.F.; Boumans, L.J.M.; Batjes, N.H. Emissions of N2O and NO from Fertilized Fields: Summary of Available Measurement Data. Glob. Biogeochem. Cycle 2002, 16, 1058. [Google Scholar] [CrossRef]
  21. Eagle, A.J.; Olander, L.P.; Locklier, K.L.; Heffernan, J.B.; Bernhardt, E.S. Fertilizer Management and Environmental Factors Drive N2O and NO3 Losses in Corn: A Meta-Analysis. Soil Sci. Soc. Am. J. 2017, 81, 1191–1202. [Google Scholar] [CrossRef]
  22. Halvorson, A.D.; Del Grosso, S.J.; Reule, C.A. Nitrogen, Tillage, and Crop Rotation Effects on Nitrous Oxide Emissions from Irrigated Cropping Systems. J. Environ. Qual. 2008, 37, 1337–1344. [Google Scholar] [CrossRef]
  23. Sun, W.; Huang, Y. Synthetic Fertilizer Management for China’s Cereal Crops Has Reduced N2O Emissions since the Early 2000s. Environ. Pollut. 2012, 160, 24–27. [Google Scholar] [CrossRef]
  24. Campbell, C.A.; Zentner, R.P.; Liang, B.C.; Roloff, G.; Gregorich, E.C.; Blomert, B. Organic C Accumulation in Soil over 30 Years in Semiarid Southwestern Saskatchewan—Effect of Crop Rotations and Fertilizers. Can. J. Soil Sci. 2000, 80, 179–192. [Google Scholar] [CrossRef]
  25. Recous, S.; Robin, D.; Darwis, D.; Mary, B. Soil Inorganic N Availability: Effect on Maize Residue Decomposition. Soil Biol. Biochem. 1995, 27, 1529–1538. [Google Scholar] [CrossRef]
  26. Zamanian, K.; Zarebanadkouki, M.; Kuzyakov, Y. Nitrogen Fertilization Raises CO2 Efflux from Inorganic Carbon: A Global Assessment. Glob. Change Biol. 2018, 24, 2810–2817. [Google Scholar] [CrossRef]
  27. Abuarab, M.; Mostafa, E.; Ibrahim, M. Effect of Air Injection under Subsurface Drip Irrigation on Yield and Water Use Efficiency of Corn in a Sandy Clay Loam Soil. J. Adv. Res. 2013, 4, 493–499. [Google Scholar] [CrossRef]
  28. Hou, H.; Chen, H.; Cai, H.; Yang, F.; Li, D.; Wang, F. CO2 and N2O Emissions from Lou Soils of Greenhouse Tomato Fields Under Aerated Irrigation. Atmos. Environ. 2016, 132, 69–76. [Google Scholar] [CrossRef]
  29. Ityel, E.; Ben-Gal, A.; Silberbush, M.; Lazarovitch, N. Increased Root Zone Oxygen by a Capillary Barrier Is Beneficial to Bell Pepper Irrigated with Brackish Water in an Arid Region. Agric. Water Manag. 2014, 131, 108–114. [Google Scholar] [CrossRef]
  30. Li, Y.; Niu, W.; Xu, J.; Wang, J.; Zhang, M.; Lv, W. Root Morphology of Greenhouse Produced Muskmelon under Sub-Surface Drip Irrigation with Supplemental Soil Aeration. Sci. Hortic. 2016, 201, 287–294. [Google Scholar] [CrossRef]
  31. Shahien, M.M.; Abuarab, M.E.; Magdy, E. Root Aeration Improves Yield and Water Use Efficiency of Irrigated Potato in Sandy Clay Loam Soil. Egypts Pres. Spec. Counc. Educ. Sci. Res. 2014, 2, 310–320. [Google Scholar] [CrossRef]
  32. Sun, Y.; Duan, L.; Zhong, H.; Cai, H.; Xu, J.; Li, Z. Effects of Irrigation-Fertilization-Aeration Coupling on Yield and Quality of Greenhouse Tomatoes. Agric. Water Manag. 2024, 299, 108893. [Google Scholar] [CrossRef]
  33. Du, Y.-D.; Gu, X.-B.; Wang, J.-W.; Niu, W.-Q. Yield and Gas Exchange of Greenhouse Tomato at Different Nitrogen Levels Under Aerated Irrigation. Sci. Total Environ. 2019, 668, 1156–1164. [Google Scholar] [CrossRef]
  34. Cui, B.-J.; Niu, W.-Q.; Du, Y.-D.; Zhang, Q. Response of Yield and Nitrogen Use Efficiency to Aerated Irrigation and N Application Rate in Greenhouse Cucumber. Sci. Hortic. 2020, 265, 109220. [Google Scholar] [CrossRef]
  35. Du, Y.-D.; Zhang, Q.; Cui, B.-J.; Sun, J.; Wang, Z.; Ma, L.-H.; Niu, W.-Q. Aerated Irrigation Improves Tomato Yield and Nitrogen Use Efficiency While Reducing Nitrogen Application Rate. Agric. Water Manag. 2020, 235, 106152. [Google Scholar] [CrossRef]
  36. Du, Y.-D.; Niu, W.-Q.; Gu, X.-B.; Zhang, Q.; Cui, B.-J.; Zhao, Y. Crop Yield and Water Use Efficiency under Aerated Irrigation: A Meta-Analysis. Agric. Water Manag. 2018, 210, 158–164. [Google Scholar] [CrossRef]
  37. Ouyang, Z.; Tian, J.; Yan, X.; Shen, H. Effects of Different Concentrations of Dissolved Oxygen on the Growth, Photosynthesis, Yield and Quality of Greenhouse Tomatoes and Changes in Soil Microorganisms. Agric. Water Manag. 2021, 245, 106579. [Google Scholar] [CrossRef]
  38. Wang, G.; Luo, Z.; Wang, E.; Zhang, W. Reducing Greenhouse Gas Emissions While Maintaining Yield in the Croplands of Huang-Huai-Hai Plain, China. Agric. For. Meteorol. 2018, 260–261, 80–94. [Google Scholar] [CrossRef]
  39. Zou, J.; Tobin, B.; Luo, Y.; Osborne, B. Differential Responses of Soil CO2 and N2O Fluxes to Experimental Warming. Agric. For. Meteorol. 2018, 259, 11–22. [Google Scholar] [CrossRef]
  40. Graham, S.L.; Hunt, J.E.; Millard, P.; McSeveny, T.; Tylianakis, J.M.; Whitehead, D. Effects of Soil Warming and Nitrogen Addition on Soil Respiration in a New Zealand Tussock Grassland. PLoS ONE 2014, 9, e91204. [Google Scholar] [CrossRef]
  41. Chen, H.; Hou, H.; Hu, H.; Shang, Z.; Zhu, Y.; Cai, H.; Qaisar, S. Aeration of Different Irrigation Levels Affects Net Global Warming Potential and Carbon Footprint for Greenhouse Tomato Systems. Sci. Hortic. 2018, 242, 10–19. [Google Scholar] [CrossRef]
  42. Chen, X.; Wang, G.; Zhang, T.; Mao, T.; Wei, D.; Song, C.; Hu, Z.; Huang, K. Effects of Warming and Nitrogen Fertilization on GHG Flux in an Alpine Swamp Meadow of a Permafrost Region. Sci. Total Environ. 2017, 601–602, 1389–1399. [Google Scholar] [CrossRef]
  43. Li, J.; Dong, W.; Oenema, O.; Chen, T.; Hu, C.; Yuan, H.; Zhao, L. Irrigation Reduces the Negative Effect of Global Warming on Winter Wheat Yield and Greenhouse Gas Intensity. Sci. Total Environ. 2019, 646, 290–299. [Google Scholar] [CrossRef]
  44. Chen, H.; Hou, H.; Wang, X.; Zhu, Y.; Saddique, Q.; Wang, Y.; Cai, H. The Effects of Aeration and Irrigation Regimes on Soil CO2 and N2O Emissions in a Greenhouse Tomato Production System. J. Integr. Agric. 2018, 17, 449–460. [Google Scholar] [CrossRef]
  45. Zhu, Y.; Cai, H.; Song, L.; Hou, H.; Chen, H. Effects of climatic factors and soil parameters on soil respiration under oxygation conditions. Trans. Chin. Soc. Agric. Mach. 2016, 47, 223–232, (In Chinese with English Summary). [Google Scholar]
  46. Wang, X.; Wang, R.; Zhao, Z.; Cai, H. Enhanced Nitrogen Fertilizer Combined with Straw Incorporation Can Reduce Global Warming Potential with Higher Carbon Sequestration in a Summer Maize-Winter Wheat Rotation System. Agric. Ecosyst. Environ. 2024, 365, 108913. [Google Scholar] [CrossRef]
  47. Zhang, A.; Cheng, G.; Hussain, Q.; Zhang, M.; Feng, H.; Dyck, M.; Sun, B.; Zhao, Y.; Chen, H.; Chen, J.; et al. Contrasting Effects of Straw and Straw–Derived Biochar Application on Net Global Warming Potential in the Loess Plateau of China. Field Crops Res. 2017, 205, 45–54. [Google Scholar] [CrossRef]
  48. Chen, Z.; Sun, S.; Wang, Y.; Wang, Q.; Zhang, X. Temporal Convolution-Network-Based Models for Modeling Maize Evapotranspiration under Mulched Drip Irrigation. Comput. Electron. Agric. 2020, 169, 105206. [Google Scholar] [CrossRef]
  49. Wang, H.; Wang, X.; Bi, L.; Wang, Y.; Fan, J.; Zhang, F.; Hou, X.; Cheng, M.; Hu, W.; Wu, L.; et al. Multi-Objective Optimization of Water and Fertilizer Management for Potato Production in Sandy Areas of Northern China Based on TOPSIS. Field Crops Res. 2019, 240, 55–68. [Google Scholar] [CrossRef]
  50. Zhu, Y.; Dyck, M.; Cai, H.; Song, L.; Chen, H. The Effects of Aerated Irrigation on Soil Respiration, Oxygen, and Porosity. J. Integr. Agric. 2019, 18, 2854–2868. [Google Scholar] [CrossRef]
  51. Kara, B.; Mujdeci, M. Influence of Late-Season Nitrogen Application on Chlorophyll Content and Leaf Area Index in Wheat. Sci. Res. Essays 2010, 5, 2299–2303. [Google Scholar]
  52. Gu, X.-B.; Li, Y.-N.; Du, Y.-D. Optimized Nitrogen Fertilizer Application Improves Yield, Water and Nitrogen Use Efficiencies of Winter Rapeseed Cultivated under Continuous Ridges with Film Mulching. Ind. Crops Prod. 2017, 109, 233–240. [Google Scholar] [CrossRef]
  53. Silva, C.C.; Guido, M.L.; Ceballos, J.M.; Marsch, R.; Dendooven, L. Production of Carbon Dioxide and Nitrous Oxide in Alkaline Saline Soil of Texcoco at Different Water Contents Amended with Urea: A Laboratory Study. Soil Biol. Biochem. 2008, 40, 1813–1822. [Google Scholar] [CrossRef]
  54. Han, B.; Ye, X.; Li, W.; Zhang, X.; Zhang, Y.; Lin, X.; Zou, H. The Effects of Different Irrigation Regimes on Nitrous Oxide Emissions and Influencing Factors in Greenhouse Tomato Fields. J. Soils Sediments 2017, 17, 2457–2468. [Google Scholar] [CrossRef]
  55. Weier, K.L.; Doran, J.W.; Power, J.F. Walters Denitrification and the Dinitrogen/Nitrous Oxide Ratio as Affected by Soil Water, Available Carbon, and Nitrate. Soil Sci. Soc. Am. J. 1993, 57, 66–72. [Google Scholar] [CrossRef]
  56. Kool, D.M.; Dolfing, J.; Wrage, N.; Van Groenigen, J.W. Nitrifier Denitrification as a Distinct and Significant Source of Nitrous Oxide from Soil. Soil Biol. Biochem. 2011, 43, 174–178. [Google Scholar] [CrossRef]
  57. Trnka, M.; Kersebaum, K.C.; Eitzinger, J.; Hayes, M.; Hlavinka, P.; Svoboda, M.; Dubrovský, M.; Semerádová, D.; Wardlow, B.; Pokorný, E.; et al. Consequences of Climate Change for the Soil Climate in Central Europe and the Central Plains of the United States. Clim. Change 2013, 120, 405–418. [Google Scholar] [CrossRef]
  58. Xu, X.; Ran, Y.; Li, Y.; Zhang, Q.; Liu, Y.; Pan, H.; Guan, X.; Li, J.; Shi, J.; Dong, L.; et al. Warmer and Drier Conditions Alter the Nitrifier and Denitrifier Communities and Reduce N2O Emissions in Fertilized Vegetable Soils. Agric. Ecosyst. Environ. 2016, 231, 133–142. [Google Scholar] [CrossRef]
  59. Dalal, R.C.; Allen, D.E.; Livesley, S.J.; Richards, G. Magnitude and Biophysical Regulators of Methane Emission and Consumption in the Australian Agricultural, Forest, and Submerged Landscapes: A Review. Plant Soil 2008, 309, 43–76. [Google Scholar] [CrossRef]
  60. Linquist, B.A.; Adviento-Borbe, M.A.; Pittelkow, C.M.; van Kessel, C.; van Groenigen, K.J. Fertilizer Management Practices and Greenhouse Gas Emissions from Rice Systems: A Quantitative Review and Analysis. Field Crops Res. 2012, 135, 10–21. [Google Scholar] [CrossRef]
  61. Du, Y.; Niu, W.; Zhang, Q.; Cui, B.; Gu, X.; Guo, L.; Liang, B. Effects of Nitrogen on Soil Microbial Abundance, Enzyme Activity, and Nitrogen Use Efficiency in Greenhouse Celery Under Aerated Irrigation. Soil Sci. Soc. Am. J. 2018, 82, 606–613. [Google Scholar] [CrossRef]
  62. Gong, X.; Li, X.; Qiu, R.; Bo, G.; Ping, Y.; Xin, Q.; Ge, J. Ventilation and Irrigation Management Strategy for Tomato Cultivated in Greenhouses. Agric. Water Manag. 2022, 273, 107908. [Google Scholar] [CrossRef]
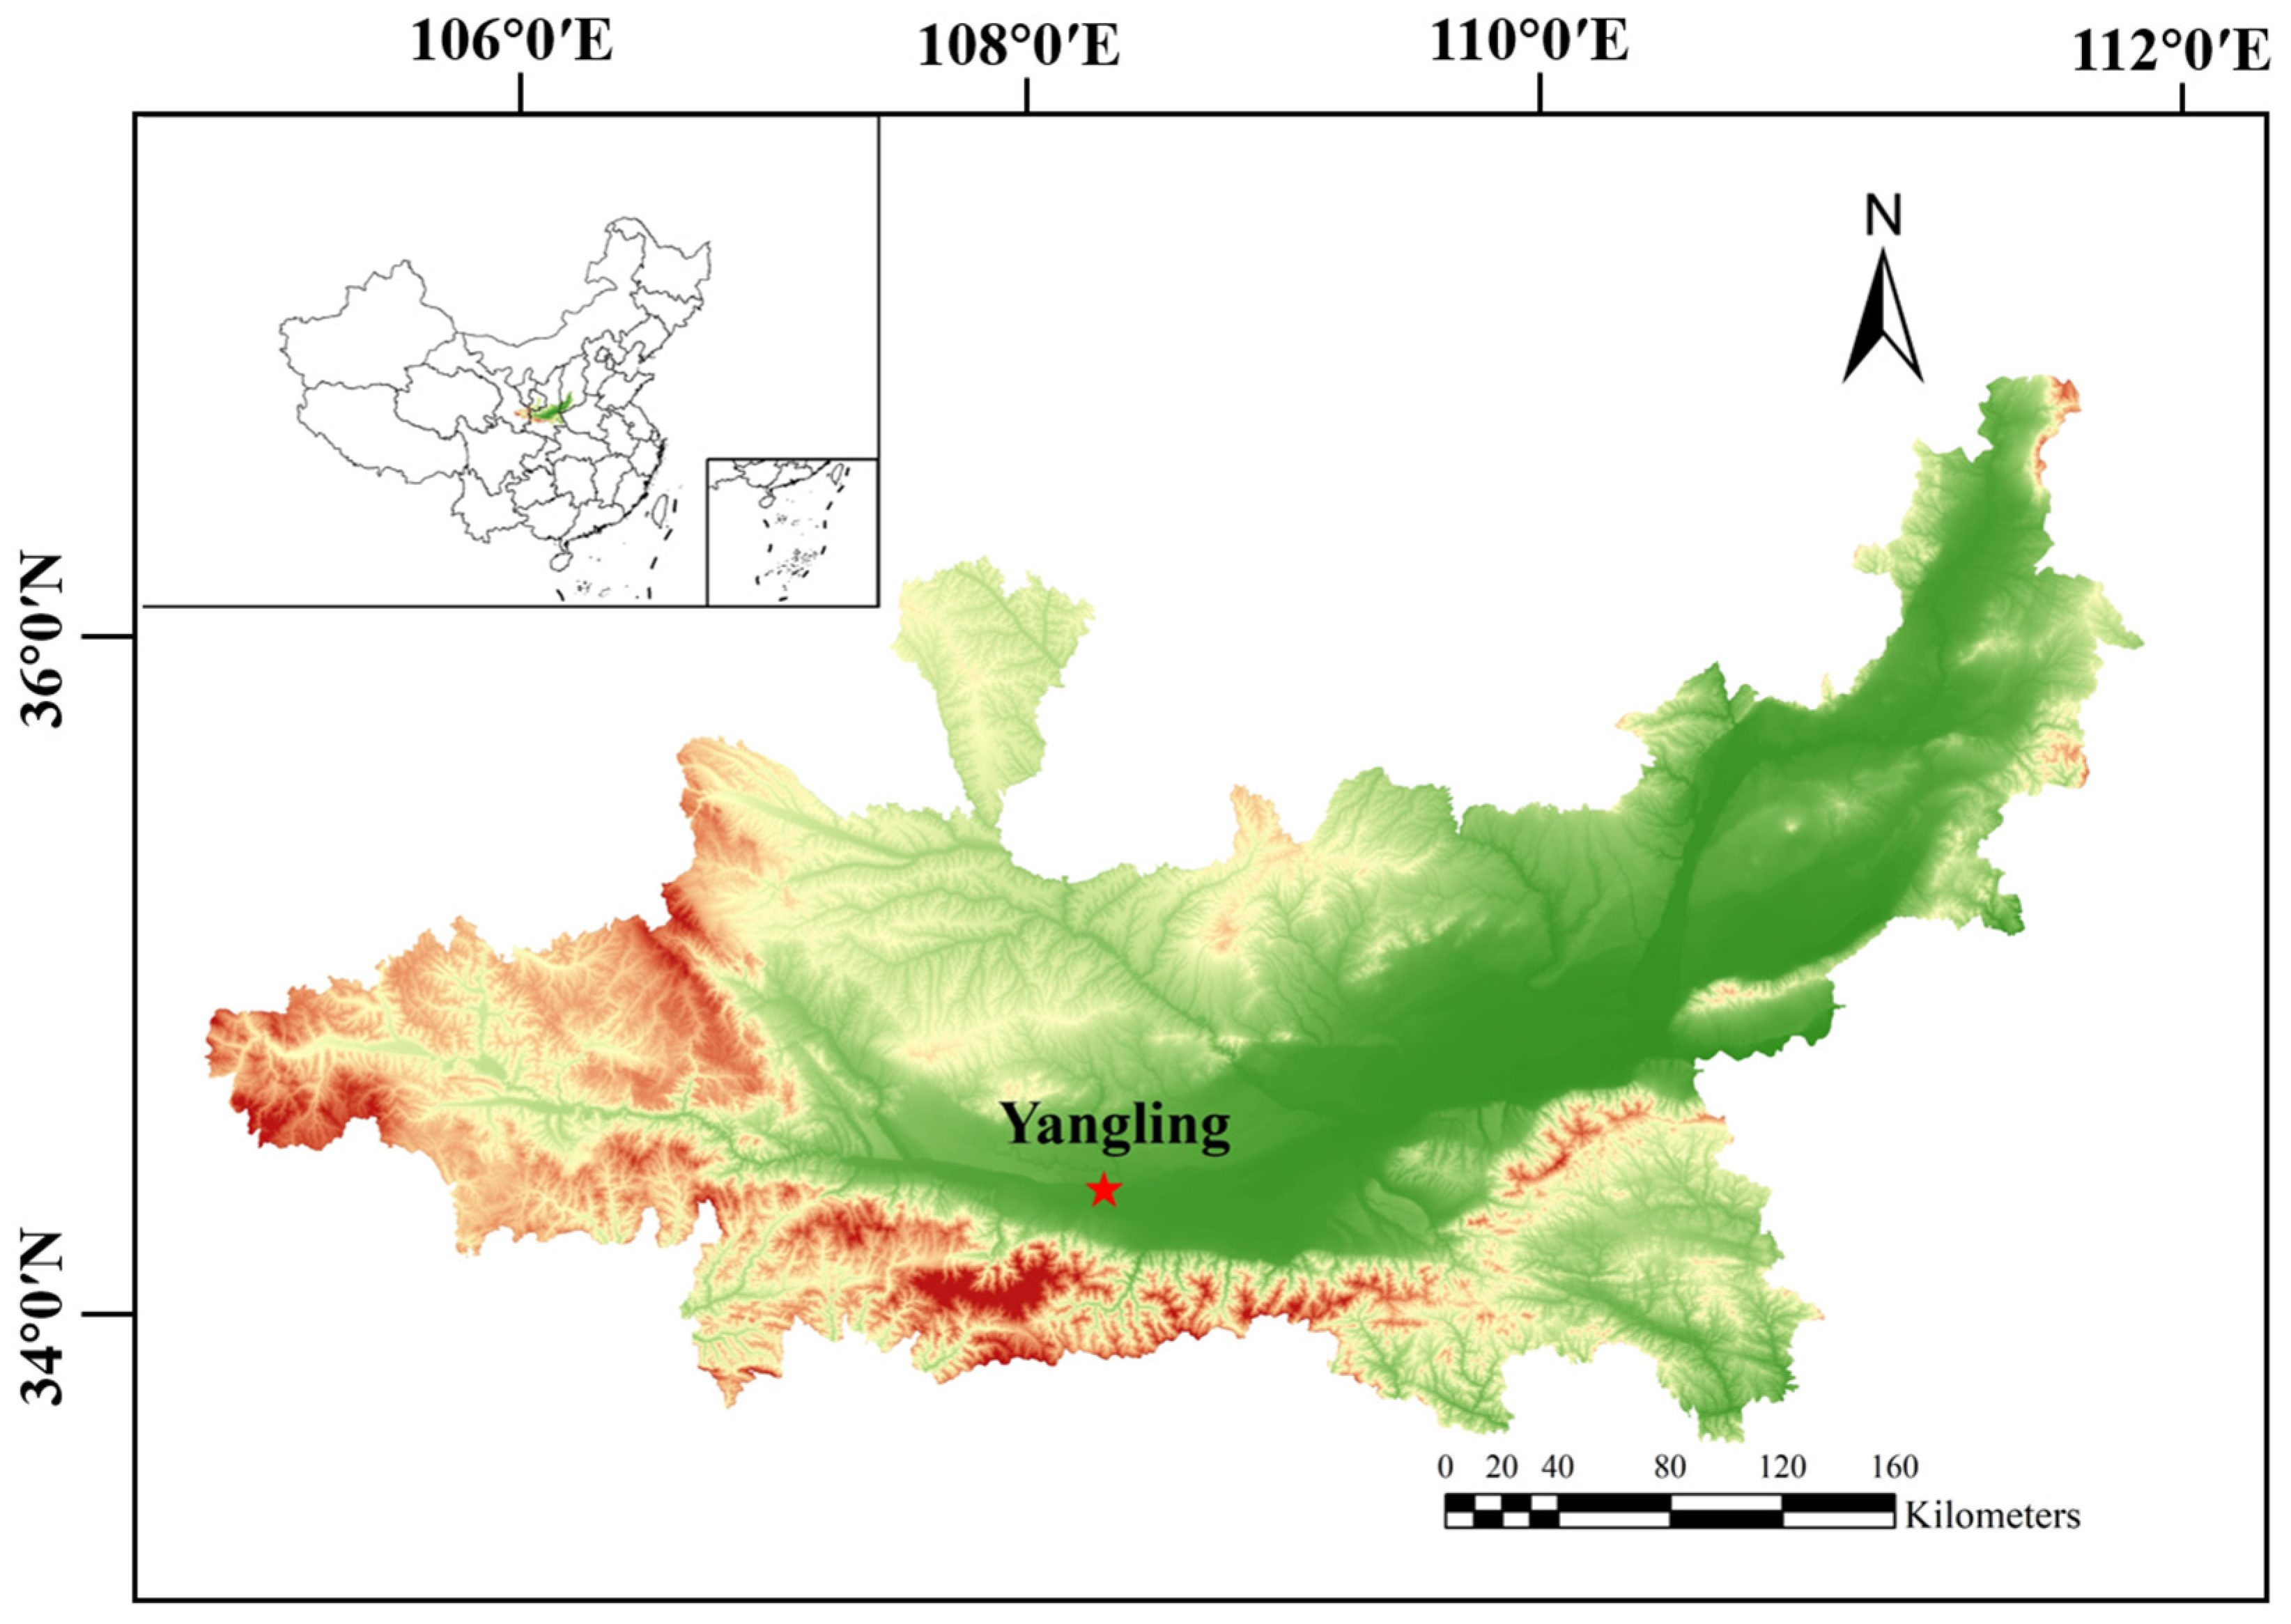
Figure 1. The map of this test study area.
Agronomy 15 02026 g001
Figure 2. Seasonal variation in (a) solar radiation (c) air temperature (e) air humidity during the Spring–Winter tomato cultivation period in 2021 and corresponding values of these variables, (b,d,f), during the Autumn–Winter tomato cultivation period in 2021–2022 at Yangling, China.
Agronomy 15 02026 g002
Figure 3. Seasonal variation in (a) soil water-filled pore space (WFPS), (c) soil oxygen concentration, (e) soil NO3-N content, (g) soil temperature during the Spring–Summer tomato cultivation period in 2021 and corresponding values of these variables, (b,d,f,h), during the Autumn–Winter tomato cultivation period in 2021–2022 at Yangling, China. A, F, and I represent the effects of aeration, fertilization, and irrigation on each index, respectively. I1: Kcp = 0.8. I2: Kcp = 1.0. F1 = 180 kg/ha. F2 = 240 kg/ha, respectively.
Agronomy 15 02026 g003
Figure 4. Seasonal variation in (a) soil CO2 fluxes, (c) soil N2O fluxes, (e) soil CH4 fluxes during the Spring–Summer tomato cultivation period in 2021 and corresponding values of these variables, (b,d,f) during the Autumn–Winter tomato cultivation period in 2021–2022 at Yangling, China. A, F, and I represent the effects of aeration, fertilization, and irrigation on each index, respectively. I1: Kcp = 0.8. I2: Kcp = 1.0. F1 = 180 kg/ha. F2 = 240 kg/ha, respectively.
Agronomy 15 02026 g004aAgronomy 15 02026 g004b
Figure 5. The Pearson’s correlation coefficients between soil CO2 emissions, soil N2O emissions, soil CH4 emission, and soil variables of soil temperature (T), soil water-filled pore space (WFPS), soil NO3-N content (NO3-N), and soil O2 content (O2). Note: The lower triangle shows the correlation between the two correlated variables; * represented significant levels 0.05; ** represented significant levels of 0.01; *** represented significant levels of 0.001, respectively. The upper triangle gives the number of the correlation coefficient between any two variables.
Agronomy 15 02026 g005
Figure 6. Maximal Information Coefficient (MIC) between feature variables and soil CO2 emissions (a), soil N2O emissions (c), soil CH4 emissions (e) during the Spring–Summer tomato cultivation period in 2021 and corresponding values of these variables, (b,d,f) during the Autumn–Winter tomato cultivation period in 2021–2022. Feature variables include S1, soil temperature S2, soil water-filled pore space (WFPS); S3, soil NO3-N content; and S4, soil O2 content, respectively.
Agronomy 15 02026 g006
Table 1. Fertilization scale.
Fertilization LevelBase Fertilization27 d54 d68 d87 d
F2 (240 kg ha−1)30%10%20%20%20%
F1 (180 kg ha−1)30%10%20%20%20%
Table 2. Mean soil temperature, soil water–filled pore space (WFPS), soil NO3-N content, soil O2 content, cumulative CO2 emissions, cumulative N2O emissions, and cumulative CH4 emissions of different irrigation, fertilization, and aeration treatments during the Spring–Summer and Autumn–Winter tomato cultivation period.
SeasonTreatmentsSoil
Temperature
(°C)
Soil
WFPS
(%)
Soil NO3-N
Content (mg/kg)
Soil
O2
Content (mL/L)
Cumulative
CO2
Emissions
(kg·hm−2)
Cumulative
N2O
Emissions
(kg·hm−2)
Cumulative
CH4
Emissions
(kg·hm−2)
Spring

Summer
II124.47 a42.27 c320.04 b6.78 b1.22 × 104 b1.41 ab−0.74 c
I224.73 a44.54 b283.47 c6.34 c1.47 × 104 a1.49 a−0.45 a
FF124.58 a44.31 b258.89 d6.59 c1.31 × 104 b1.26 c−0.47 a
F224.67 a42.95 c337.30 b6.45 c1.42 × 104 a1.67 a−0.66 b
AA124.4 b43.81 c291.26 c6.51 c1.23 × 104 c1.22 c−0.57 c
A224.53 ab42.6 d322.79 b6.83 b1.51 × 104 a1.84 a−0.72 d
CK25.27 a45.35 b262.38 d5.89 d1.35 × 104 b1.17 c−0.26 a
Mean/24.6643.69296.596.481.36 × 1041.44−0.55
Autumn

Winter
II118.85 b44.25 b353.84 a7.22 a1.04 × 104 d1.24 c−0.84 d
I218.96 b46.21 a314.84 b6.84 b1.13 × 104 c1.34 b−0.68 b
FF118.68 b45.55 a292.59 c7.13 a1.06 × 104 d1.11 d−0.70 b
F219.15 b45.30 a368.28 a6.85 b1.14 × 104 c1.49 b−0.79 c
AA118.70 d45.76 b323.03 b6.86 b1.08 × 104 f1.18 c−0.74 d
A218.77 d44.01 c357.31 a7.42 a1.12 × 104 d1.58 b−0.86 e
CK19.63 c47.60 a291.51 c6.38 c1.09 × 104 e1.00 d−0.51 b
Mean/18.9645.53328.776.961.09 × 1041.28−0.73
Note: The different lowercase letters in the same treatment, such as I, F, or A treatment, indicate significant differences (p < 0.05 *) and (p < 0.01 **) between study seasons. I represent I1 and I2 irrigation treatments; F represent F1 and F2 fertilization; A represent A1, A2, and CK aeration treatment, respectively.
Table 3. Effect of different irrigation, fertilization, and aeration treatments on tomato yield, greenhouse gas intensity (GHGI), net GHG emissions (NGHG), and net global warming potential (NGWP) during the Spring–Summer seasons and Autumn–Winter seasons of tomato plants in greenhouse.
TreatmentsSpring–SummerAutumn–Winter
Yield
(t/ha)
GHGI
(kg/ha)
net GHG
(kg/ha)
NGWP
(kg/ha)
Yield
(t/ha)
GHGI
(kg/ha)
net GHG
(kg/ha)
NGWP
(kg/ha)
CKF1I240.37 g6.68 f13,224.98 h269.59 h35.97 g6.44 fg10,708.04 h231.78 f
CKF2I244.96 e7.94 d14,396.33 e356.90 e38.68 f7.38 de11,569.04 d285.48 de
A1F1I140.08 g6.32 g10,393.18 j253.41 h38.49 f6.18 g10,124.19 j237.97 f
A1F2I144.85 e7.32 e11,144.41 i328.32 f40.08 e7.88 cd10,834.35 g315.75 d
A1F1I246.59 d6.29 g14,068.02 f293.13 g40.14 e6.81 f11,253.21 f273.40 e
A1 F2I253.30 b7.44 e15,065.69 c396.79 d41.37 d9.13 b12,232.35 b377.84 c
A2F1I141.86 f8.85 c13,674.98 g370.64 e40.77 de7.33 e10,547.37 i298.68 de
A2F2I146.52 d10.90 a15,027.46 d507.23 b44.03 c9.29 b11,475.06 e409.05 b
A2F1I250.03 c9.26 b15,962.88 b463.31 c46.49 b8.16 c11,712.52 c379.65 bc
A2F2I255.52 a10.65 a17,719.18 a591.57 a48.13 a11.16 a12,722.46 a537.39 a
Significance
I***************
F****************
A****************
I × F*ns**ns******
I × A**ns******ns****
F × A**************
I × F × Ans***nsnsns**ns
Note: Different lowercase letters indicate significant differences between treatments. I, F, and A represent the effects of irrigation, fertilization, and aeration on each index, respectively; × stands for the interaction effect; I × F and I × A are the interaction effect of irrigation and fertilization, irrigation, and aeration on each index, respectively; F × A is the interaction effect of fertilization and aeration on each index; I × F × A is the interaction effect of irrigation, fertilization, and aeration on each index. * and ** are the marked levels of 0.05 and 0.01, “ns” indicates that I, F, and A have no significant effect on the respective indices, respectively.
Table 4. The ranking of irrigation schedule calculated using TOPSIS for drip-irrigated tomato grown in greenhouse under different irrigation, fertilization, and aeration.
TreatmentsSpring–SummerAutumn–Winter
D+D−CiRankD+D−CiRank
CKF1I20.240.700.7430.150.730.832
CKF2I20.38 0.50 0.57 50.32 0.55 0.63 6
A1F1I10.110.850.8910.170.650.793
A1F2I10.170.710.8120.250.570.705
A1F1I20.290.670.7040.250.620.724
A1F2I20.420.490.5470.540.310.379
A2FII10.400.480.5460.070.810.921
A2F2I10.680.240.2690.470.360.438
A2F1I20.590.280.3280.420.410.507
A2F2I20.840.110.11100.810.090.1010
Note: D+ and D− represented positive and negative Euclidean distance, respectively; Ci represented comprehensive evaluation index.
Disclaimer/Publisher’s Note: The statements, opinions and data contained in all publications are solely those of the individual author(s) and contributor(s) and not of MDPI and/or the editor(s). MDPI and/or the editor(s) disclaim responsibility for any injury to people or property resulting from any ideas, methods, instructions or products referred to in the content.