Article

Effects of Groundwater Depth on Soil Water and Salinity Dynamics in the Hetao Irrigation District: Insights from Laboratory Experiments and HYDRUS-1D Simulations

1
College of Water Conservancy and Civil Engineering, Inner Mongolia Agricultural University, Hohhot 010018, China
2
Ordos Water Conservancy Development Center, Ordos Municipal Water Conservancy Bureau, Ordos 017000, China
3
Polytechnic Institute of Coimbra, Coimbra Agriculture School, CERNAS—Research Center for Natural Resources, Environment and Society, Bencanta, 3045-601 Coimbra, Portugal
4
Inner Mongolia Key Laboratory of Molecular Biology, College of Basic Medical Science, Inner Mongolia Medical University, Hohhot 010059, China
5
School of Materials Science and Engineering, Beihang University, Beijing 100191, China
*
Authors to whom correspondence should be addressed.
Agronomy 2025, 15(9), 2025; https://doi.org/10.3390/agronomy15092025
Submission received: 4 May 2025 / Revised: 15 August 2025 / Accepted: 18 August 2025 / Published: 23 August 2025
(This article belongs to the Section Farming Sustainability)

Abstract

The management of groundwater depth (GWD) in alluvial soils under irrigation in arid climates is critical for soil and water conservation, given its influence on salt dynamics and water availability for crops. GWD is influenced by the interaction of irrigation water supply and drainage system design and operation. Controlling GWD is a significant issue in the Hetao Irrigation District due to continuous irrigation, arid climate, and high risks of soil salinization, which concerns farmers and water management authorities. To address this issue, a study was conducted based on open-air laboratory experimentation to rigorously assess the effects of GWD on soil salt dynamics and capillary rise contribution to maize cultivation under level basin irrigation. Data collected served as the basis for parameterizing and calibrating the HYDRUS-1D model, facilitating simulation of soil water and salt dynamics to enhance understanding of GWD effects ranging from 1.25 m to 2.25 m. It was concluded that during calibration and validation, the model demonstrated strong performance; SWC simulations achieved R2 > 0.69, RMSE < 0.03 cm3 cm−3, and NSE approaching 1; and EC simulations yielded R2 ≥ 0.74 with RMSE < 0.22 S cm−1. Additionally, the simulated bottom boundary moisture flux closely matched the measured values. The most favorable GWD range should be between 1.75 m and 2.0 m, minimizing the negative impacts of irrigation-induced soil salinity while maximizing water use efficiency and crop productivity. A higher GWD causes crop water stress, while a lower value results in a greater risk of soil salinity. This study anticipates future field application in Hetao to assess drainage system effectiveness and variability in salinity and productivity effects.

1. Introduction

The Hetao Irrigation District (Hetao) is in Inner Mongolia, China, in the upper reaches of the Yellow River, with an irrigation area of about 570,000 ha. It has a continental monsoon climate, a semi-arid area with an average annual precipitation of about 200 mm, and only irrigated agriculture is feasible. The irrigation is supplied directly from the Yellow River, with a collective canal network conveyance system managed by the Water User’s Association at the division level [1]. Basin irrigation is the major on-farm irrigation method, with the main crops being maize, sunflower, and wheat. The irrigation scheduling is determined by the rotational functioning of the conveyance network, resulting in high applied irrigation depths with high time intervals between the irrigation events. The water table is shallow, which allows contributions by capillary rises to supplement the crop water requirements [2].
Hetao faces major challenges due to the process of adapting to global changes, namely, the reduction in water supply for irrigation determined by the Yellow River Commission [3]. This required a major effort to improve water management practices and the implementation of modern hydraulic and irrigation technologies, as well as the control of the soil salinization risks, to achieve a sustainable improvement [4].
Soil salinity is a severe problem, limiting crop productivity on 64% of total cultivated land due to natural soil salinization and salt accumulation caused by irrigation [5,6]. This problem is related to the dynamics of soil water conditioned by irrigation and drainage, which controls the groundwater depth (GWD) through the drainage ditches [7]. Improving agricultural water management, aiming at high water and land productivity, requires in-depth knowledge of the relationship between irrigation, GWD, and soil salt dynamics [8,9,10,11]. Although many studies have examined GWD effects on soil moisture, salinity, and crop water use, most were conducted under uncontrolled field conditions, where groundwater levels fluctuate with seasonal irrigation schedules and natural hydrological processes. This makes it challenging to isolate the specific regulatory role of GWD. In addition, although the HYDRUS-1D model has been widely applied to simulate water–salt dynamics in irrigated agriculture, model validation under controlled groundwater table conditions, especially in arid and semi-arid irrigated regions such as the Hetao Irrigation District, remains very limited. Furthermore, few studies have quantitatively identified the optimal GWD that simultaneously minimizes salt accumulation and maximizes water use efficiency for maize production in this region. Addressing these gaps is critical for developing precise groundwater management strategies that can balance water conservation and salinity control under the constraints of reduced irrigation water supply [12,13].
Water and salt soil dynamics in the presence of a shallow groundwater table are very variable over time, determined by variations in water potential in the soil profile [14]. After the irrigation events, there are descending flows, and when the matrix potential in the root zone decreases due to root water absorption by the plants, there are ascending flows from groundwater [2,15]. The open-air laboratory study of this process enables rigorous measurement of these flows, which enhances understanding of the dynamics involved. The laboratorial results are very dependent on the experimental conditions, namely, the characteristics of the sampled soil and the monitoring accuracy. However, water and salt fluxes within the soil are difficult to measure. The model simulation results can complement, analyze, and extrapolate empirical results from laboratorial experiments. Therefore, modeling this process enables in-depth laboratory observations and analyses, as well as the extrapolation of findings to other soil types or groundwater dynamics (GWD), thereby providing detailed information on water and salt dynamics in each specific context. On the other hand, the relationship between modeling and laboratory trials is synergic because models require input parameters that could be obtained accurately in the laboratory trials and develop their correlation functions with soil characteristics. An example of modeling suitable for Hetao is the HIDRUS-1D model [16]. It simulates the one-dimensional water movement in multi-layered unsaturated soils and predicts crop evapotranspiration, deep percolation, and soil water and salt dynamics, having already been successfully applied [12,17]. At present, simulations using the HYDRUS-1D model to assess soil salt accumulation and crop water use under varying groundwater table depths are mostly conducted under uncontrolled field conditions. However, model validation under controlled water table conditions in open-field experiments—particularly in arid and semi-arid irrigated regions—remains limited.
The primary objective of this study is to analyze the regulatory mechanisms of GWD on soil water–salt dynamics and maize water consumption in the Hetao Irrigation District, with the aim of providing a scientific basis for optimizing water–salt management and crop production in arid and semi-arid irrigated agricultural regions. Specifically, (a) open-air laboratory experiments were conducted under controlled GWDs ranging from 1.25 m to 2.25 m to quantify soil water movement and salt transport patterns and clarify the contribution of groundwater capillary rise to crop water use; (b) based on the HYDRUS-1D model, experimental data were used to parameterize soil hydraulic properties and simulate the water–salt dynamics under different GWDs, thereby revealing the coupled interactions among irrigation, groundwater, and salinity; and (c) the impact of GWD on the risk of soil salinization was evaluated, and an optimal GWD threshold that balances water conservation and salt control was proposed, offering practical guidance for irrigation management in shallow groundwater systems.

2. Materials and Methods

2.1. Study Area

This study was conducted at the Shuguang Experimental Station in Bayannur City, HID, Inner Mongolia, China (40°46′ N, 107°24′ E, altitude 1039 m). The experimental station has excellent irrigation conditions and a temperate continental climate. The region is in a temperate continental arid-semi-arid climate zone, characterized by dry weather, scarce precipitation, intense evaporation, and long, cold winters. The growing season average temperature over the last 40 years has been 19.1 °C, and the average annual precipitation has been 133 mm. The China National Meteorological Information Centre (https://data.cma.cn/, accessed on 2 March 2025) provided the meteorological data and reference crop evapotranspiration in the experimental area from 1980 to 2019. These are shown in Figure 1. Groundwater depth at the experimental station during the maize growing season ranges from 2.20 m to 3.40 m. In this study, irrigation was conducted using groundwater that had a mineralization degree of 1.1 g L−1. The experiment was conducted under the current agricultural production conditions in the HID, using standard measuring pits (equipped with underground observation rooms), two sets of large-scale weighing-type automatic evaporation meters, and large rain shelters. Indoor and pit tests were conducted, with five measuring pits plus bottom plates, all equipped with Mariotte bottles that could accurately control the depth of groundwater (GWD), measure the upward replenishment of groundwater (G_up), and measure the amount of groundwater replenished by irrigation (G_irr). Water was added for compaction after the pits were backfilled with the HID representative soil. Yellow River irrigation silt, a type of soil known as chestnut calcium soil, was used in the experimental area. The particle size distribution was classified as loamy sand according to the United States Soil Texture Classification (dry method granulometer, HELOS&RODOS, Germany’s new Partec company, Munich, Germany), with an average soil bulk density of 1.51 g cm−3 and a pH value of approximately 8.0 at a depth of 0–120 cm. The study location closely resembles a typical irrigation district salinization area. Table 1 lists the soil textures in the experimental area.

2.2. Experimental Methods

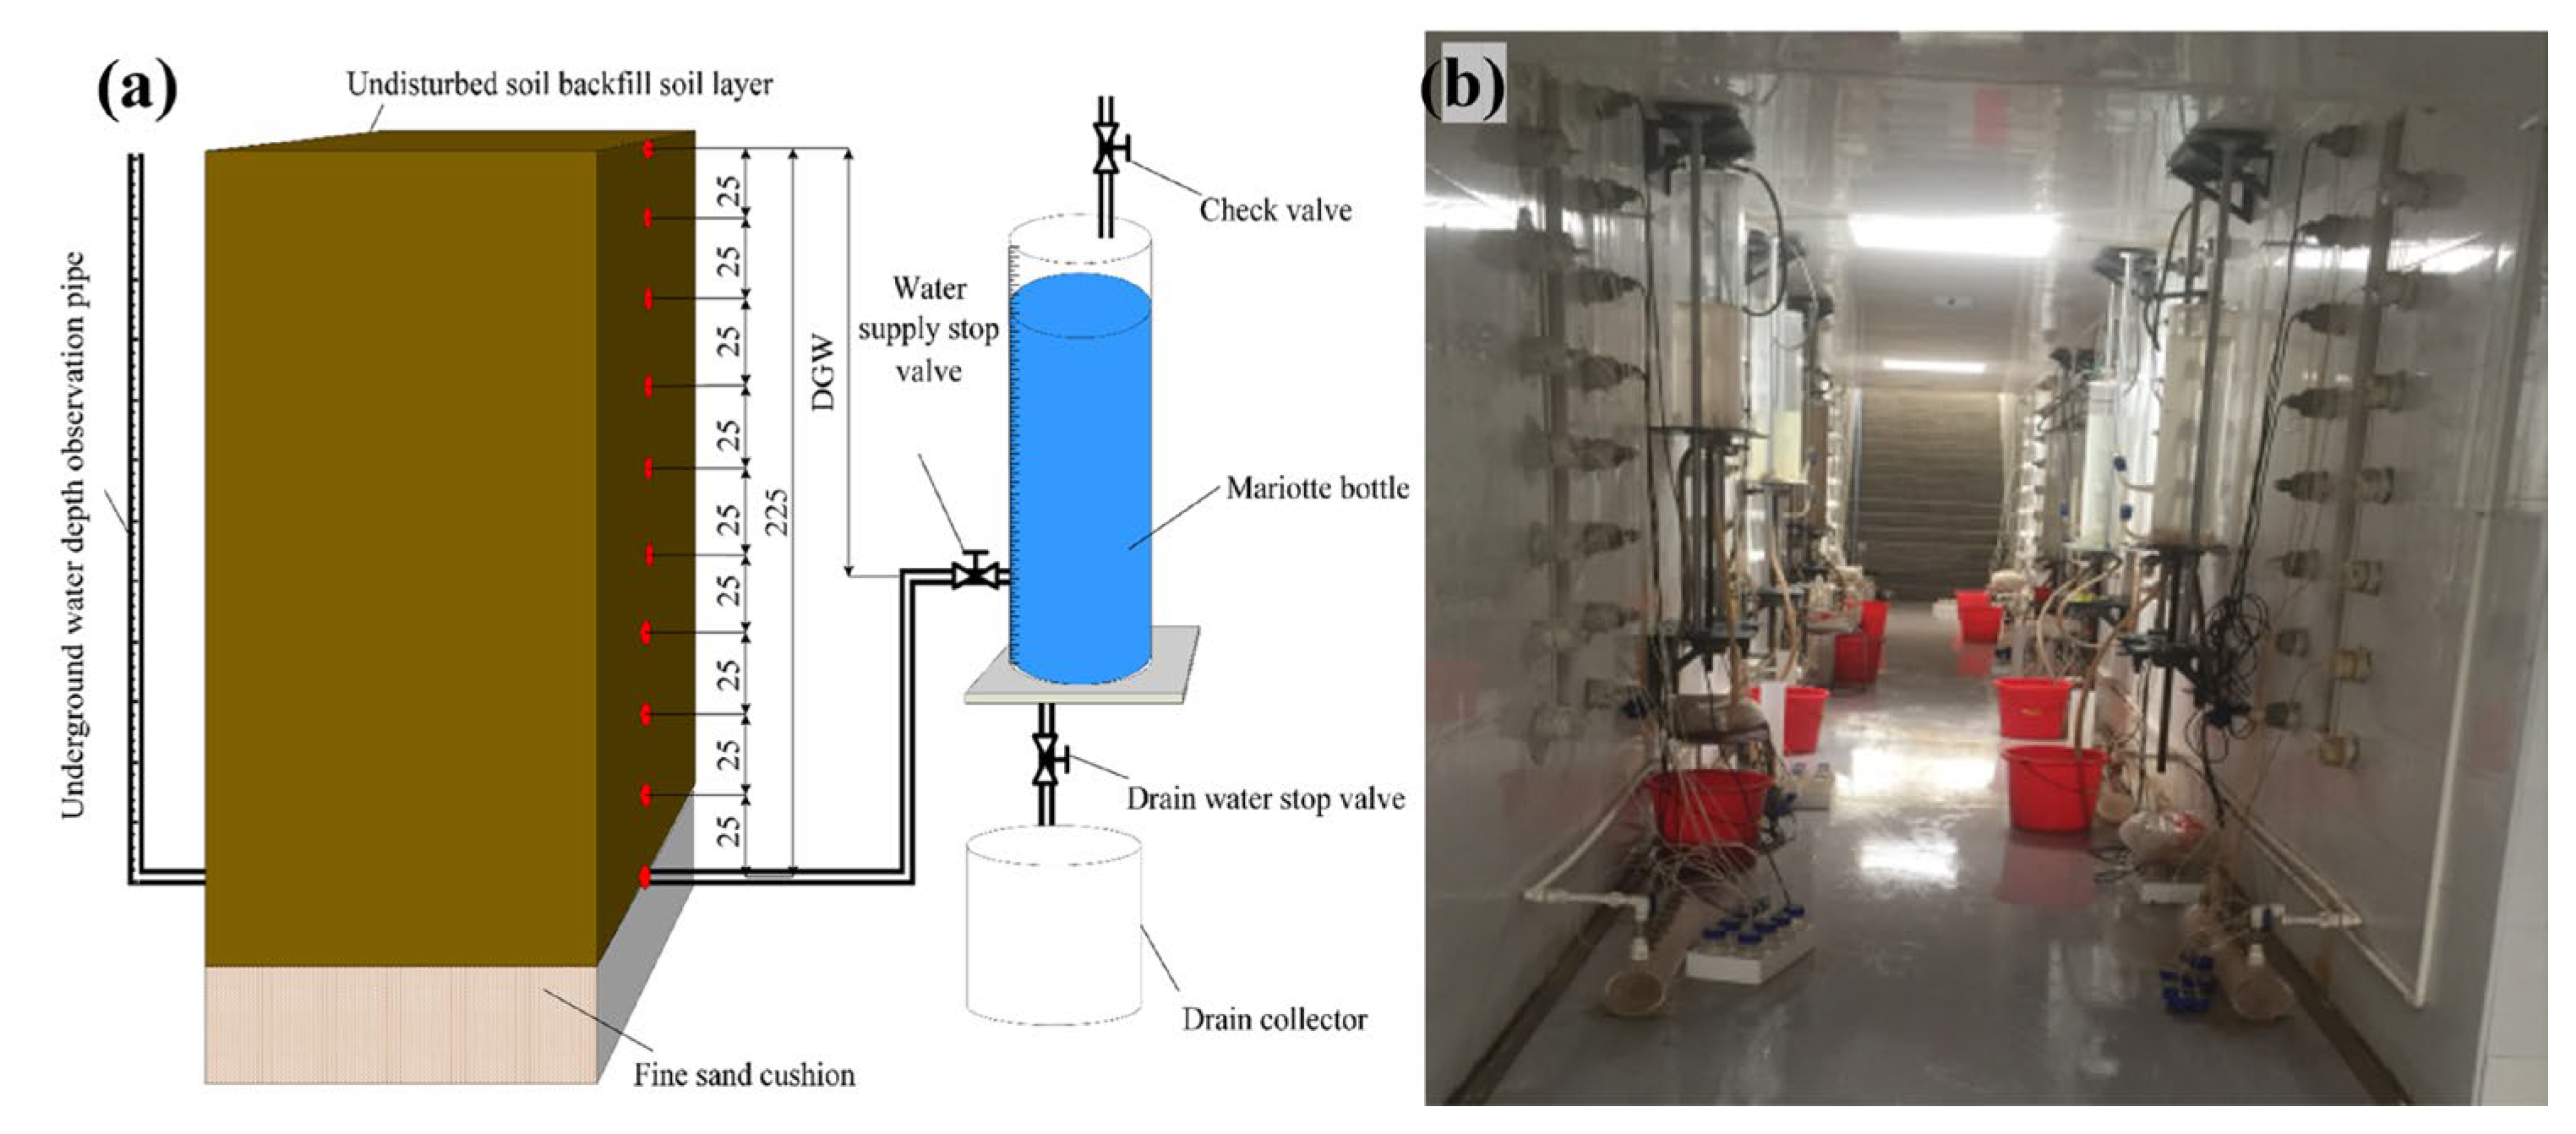
The local maize variety Ximon No. 6 (Inner Mongolia Ximon Seed Industry Co., Ltd., Bayannur, Inner Mongolia, China) was selected for this study, with five different GWD values of 1.25 m, 1.50 m, 1.75 m, 2.00 m, and 2.25 m. Before sowing, which took place after the GWD was restored to the predetermined level, Mariotte bottles were filled with water. Sowing was conducted on 6 May 2020 and harvesting occurred on 29 September 2020 (147 days after sowing). Manual sowing was performed using a handheld seeder according to the local sowing depth. All experimental plots were covered with an ordinary plastic film, and a base fertilizer (di-ammonium phosphate and urea in a ratio of 5:1) was applied before sowing. Two top dressings were applied during the growing period using urea at an application rate of 450 kg/hm2. The planting density was 75,800 hm−2. Irrigation was conducted according to the arrival date of water from the Yellow River and the local irrigation method (basin irrigation). In this study, a single irrigation depth was set, with a total of four irrigations during the maize growing period, divided into the initial, crop development, mid-season, and late-season stages. The experimental area’s irrigation schedule is displayed in Table 2. The amount of irrigation was precisely controlled in this study using a water meter with an accuracy of 0.01 m3, and Table 3 displays the division of maize growth stages in 2020. Six groups of test pits, each measuring 2.0 m by 3.3 m and totaling 6.6 m2, are set up. They were lined with cement-concrete walls to stop lateral seepage and comprised a 0.3 m gravel–sand drainage layer on top of 2.3 m of undisturbed soil with an average bulk density of 1.51 grammes per cubic centimeter. The groundwater control structure and open-air laboratory layout for groundwater depth control are depicted in Figure 2 and Figure 3.

2.3. Measurement Items

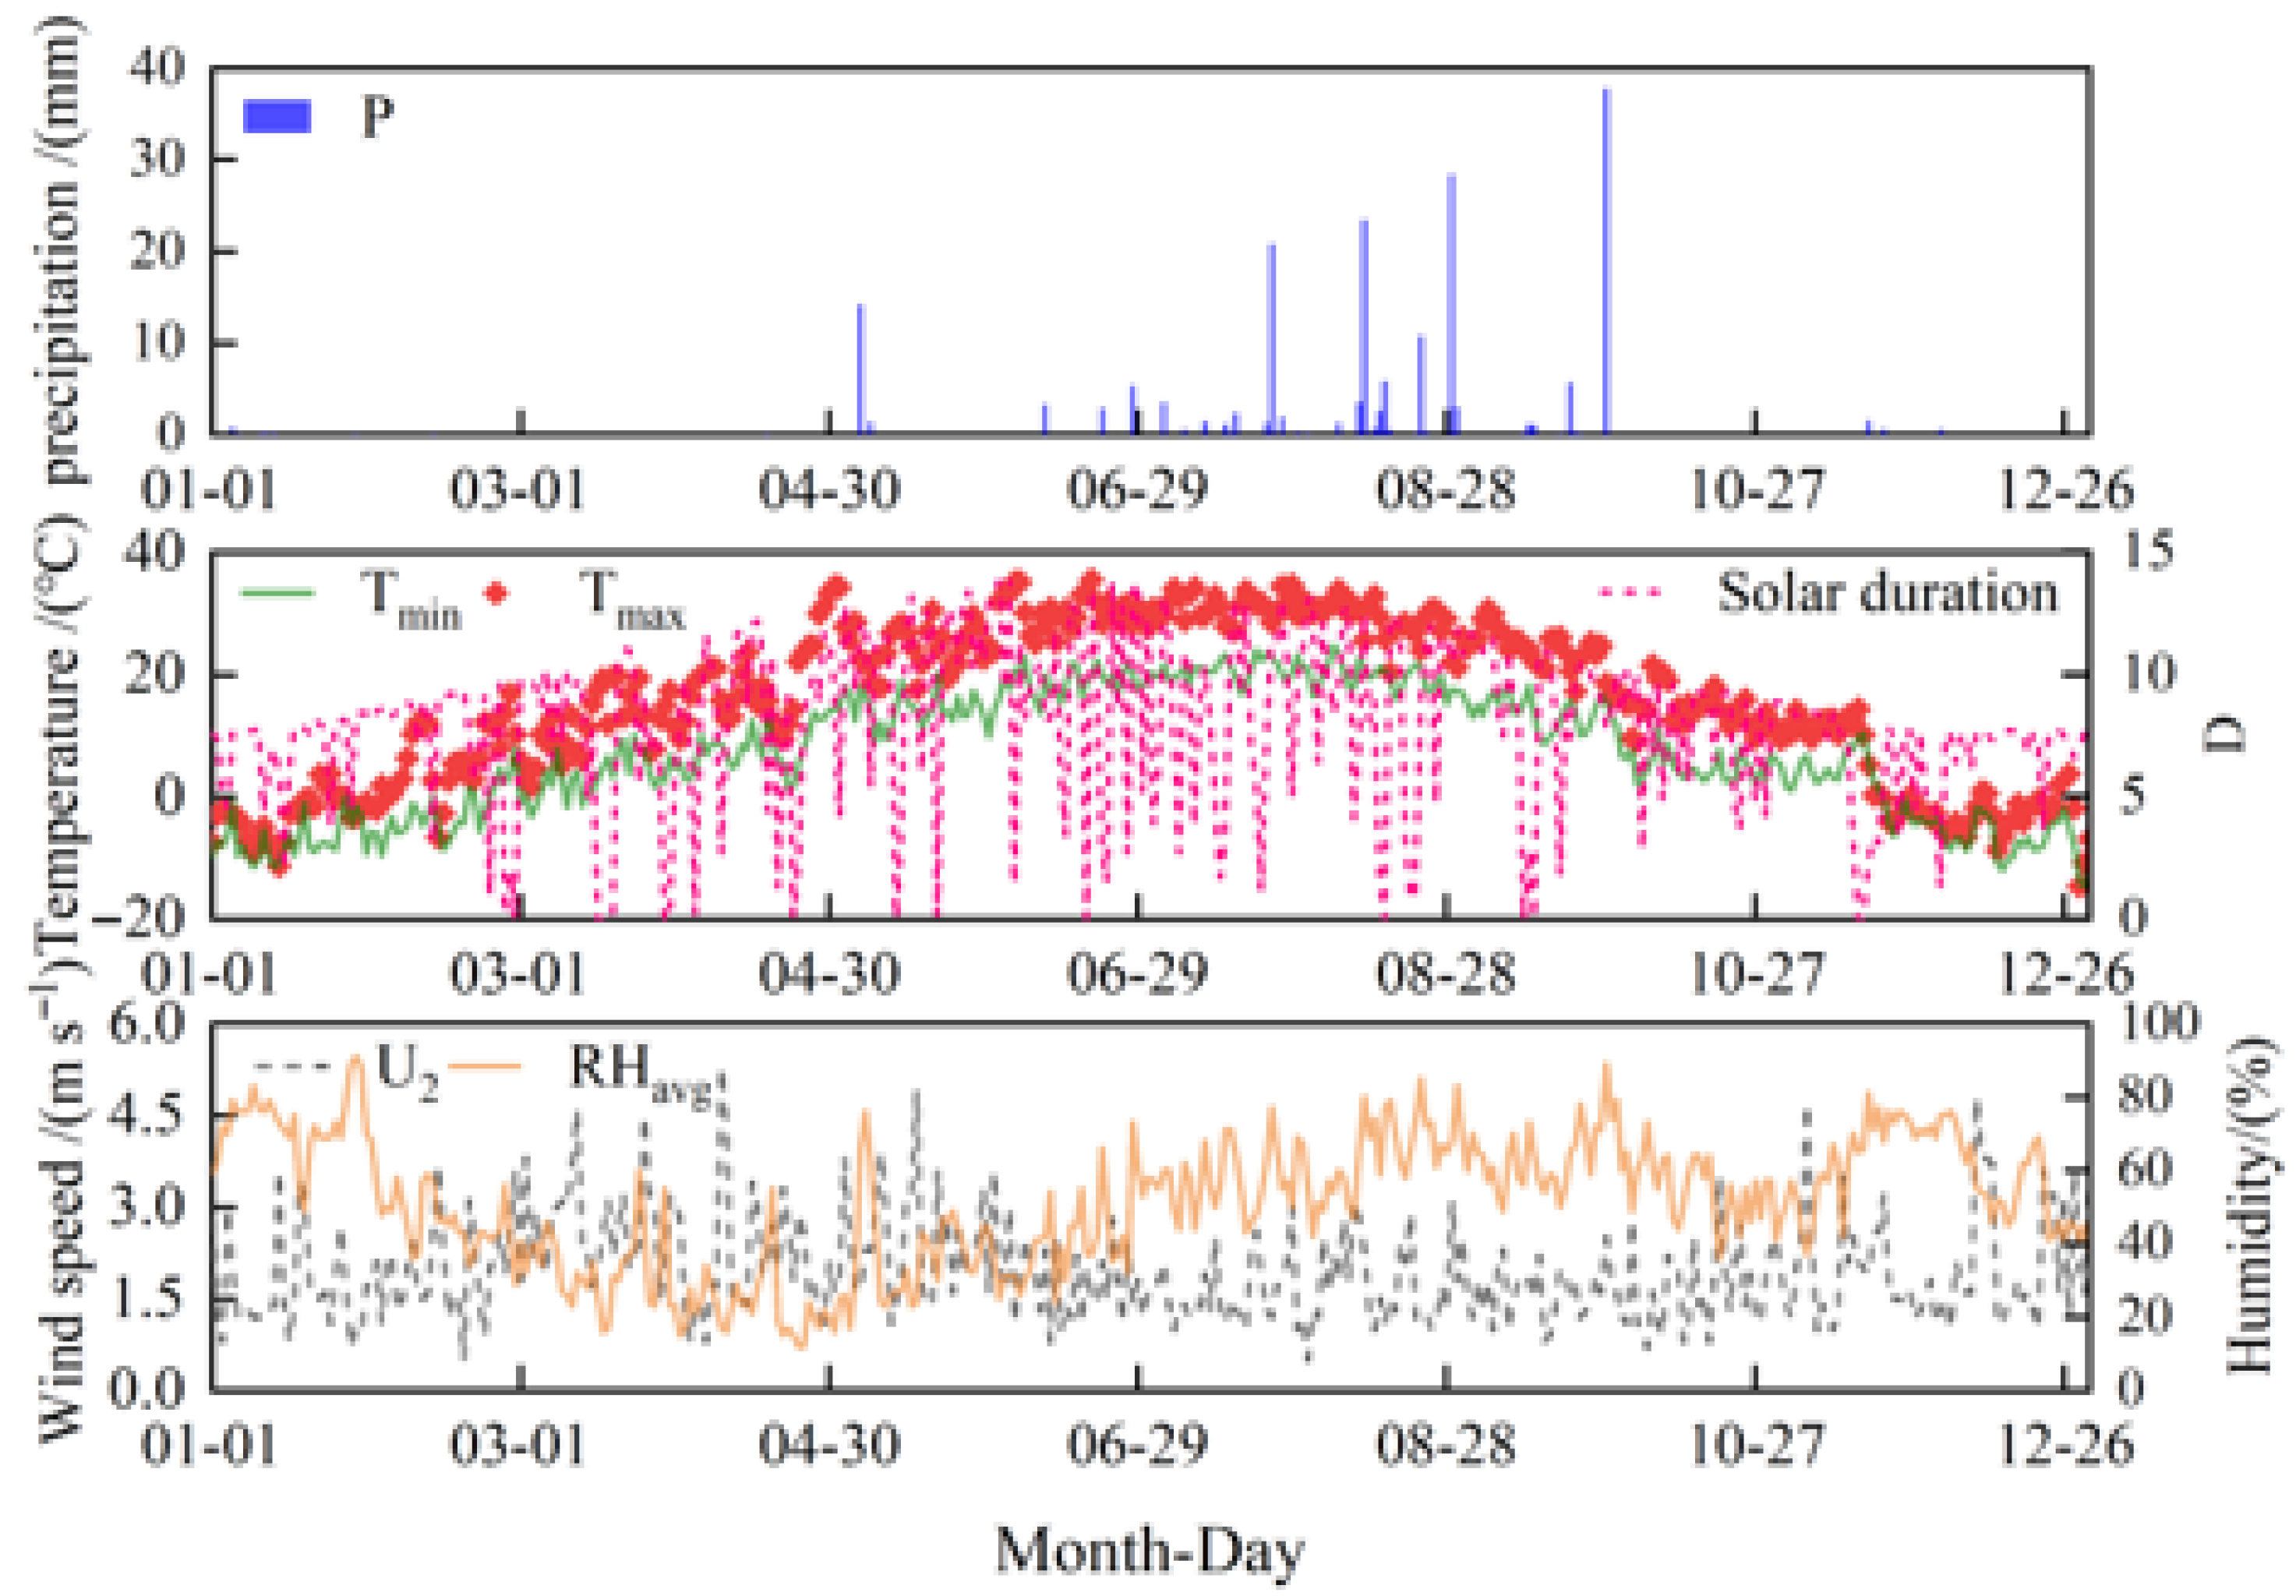
Meteorological data were collected from a HOBO automatic weather station installed near the experimental plot for real-time monitoring; these included temperature, relative humidity, precipitation, and wind speed, as shown in Figure 4. A water and salt automatic monitoring device (model: Fleb-30c; moisture content accuracy: ±4%) made by Shenyang Weitu Technology Corporation was installed in each treatment plot to track the salinity and moisture content of the soil. The scale readings of the Mariotte bottles and the drainage volume in the drainage collector beneath the drainage outlet in the underground observation room were used to measure G_up and G_irr every day at 8:00 and 20:00, respectively.
Maize growth indicators and yield maize biomass were monitored at different growth stages. Maize plant height, leaf area index (LAI), and stem thickness were measured using a box ruler and Vernier caliper. After measuring the yield of all the maize in each treatment plot at maturity, the crop was dried to a consistent mass for testing maize seeds and measuring yield. The maize was then put in an oven set to 65 °C. The leaf area index was calculated using the following equation:
LA = 0.75 a b
where LA is the leaf area (cm2), a is the leaf length (cm), and b is the leaf width (cm). The calculation of maize LAI is as follows:
LAI = i = 1 N LA N I w R w
where Iw denotes the row spacing in centimeters (cm), Rw represents the plant spacing in centimeters (cm), and N represents the number of maize plants.
The soil water storage was calculated as follows:
SWS = 10 i = 1 7 h i θ i
where SWS is the soil water storage (mm); hi is the depth of each calculated soil layer; and θi is the soil volumetric water content (cm−3 cm−3) in the sampled soil layers of 0–10, 10–20, 20–40, 40–60, 60–80, 80–100, and 100–120 cm, giving a total of seven layers.
Salinity enters the soil profile as a solute with irrigation water or rises from shallow groundwater levels through soil capillary action. The equation for calculating soil salinity content is as follows:
Salt c e l l = 0.64 W c e l l × E C 1 : 5
where Saltcell represents soil salinity content (g m−2); Wcell denotes the volume conversion unit, with 1 mm soil water = 1 L per square meter (L m−2); 0.64 is the global conversion factor to convert 1 dS m−1 to 0.64 g L−1.

2.4. Model Setup

2.4.1. HYDRUS-1D Model Description

This study separated the 1.2 m soil depth into 121 nodes spaced 1 cm apart to use the HYDRUS-1D model to compute field evapotranspiration, crop root water uptake, and salt flux in the plough layer under varying groundwater levels. The water movement model’s upper boundary conditions were set as atmospheric boundaries, such as irrigation depth, precipitation, and meteorological parameters, and the variable time-step method was used to simulate water movement in the soil. As illustrated in Figure 5, the bottom boundary was set as a variable pressure head boundary due to the possible impact of groundwater level fluctuations.
Based on the Richards equation, the HYDRUS-1D model predicts deep percolation, recharge, and evapotranspiration by simulating one-dimensional water movement in multi-layered, variably saturated soils. The mathematical model description is as follows [16]:
θ t = z K ( h ) h z - 1 S ( h )
where h is the water pressure head (cm), θ is the volumetric water content (cm3 cm−3), t is the time in days, z is the vertical coordinate (cm), K is the soil’s unsaturated hydraulic conductivity function (cm d−1), and S(h) is the source/sink ratio (cm3 cm−3 d−1). Assuming that Equations (6)–(8) can adequately describe the hydraulic properties of soil, the van Genuchten parametric functions were chosen to solve Equation (6) [19]:
θ ( h ) = θ r + θ s θ r ( 1 + α h n ) m   h < 0   θ s         h 0
K ( h ) = K s S e l 1 ( 1 S e 1 / m ) m 2
S e = θ θ r θ s θ r
where θr and θs denote the residual and saturated water content (cm3 cm−3), respectively; Se is effective water content; Ks is the saturated hydraulic conductivity (cm d−1); α is related to the air entry pressure; n is related to pore size distribution and is constrained to be >1; α and n are only fitting parameters; m is equal to (1 − 1/n); and l is a pore connectivity parameter assumed to be 0.5 [20].

2.4.2. Soil Solute Transport Model

In transient flow in porous media with variable saturation, the one-dimensional convective dispersion solute transport partial differential equation is as follows [21]:
(   θ c ) t = θ z (   θ D c z ) - ( q c ) z + S N
where SN represents the salinity absorbed by plants, c is the salt concentration (g cm−3), q is the volumetric flux density (cm d−1), and D is the hydrodynamic dispersion coefficient (cm2 d−1).

2.4.3. Root Water Uptake Module

Equation (10) specifies S(h) in terms of a water stress factor and a potential uptake rate [22]. It is defined as the amount of water that is drawn out of a unit volume of soil over a unit period of time as a result of root water uptake:
S ( h ) = α ( h ) β ( z ) T p
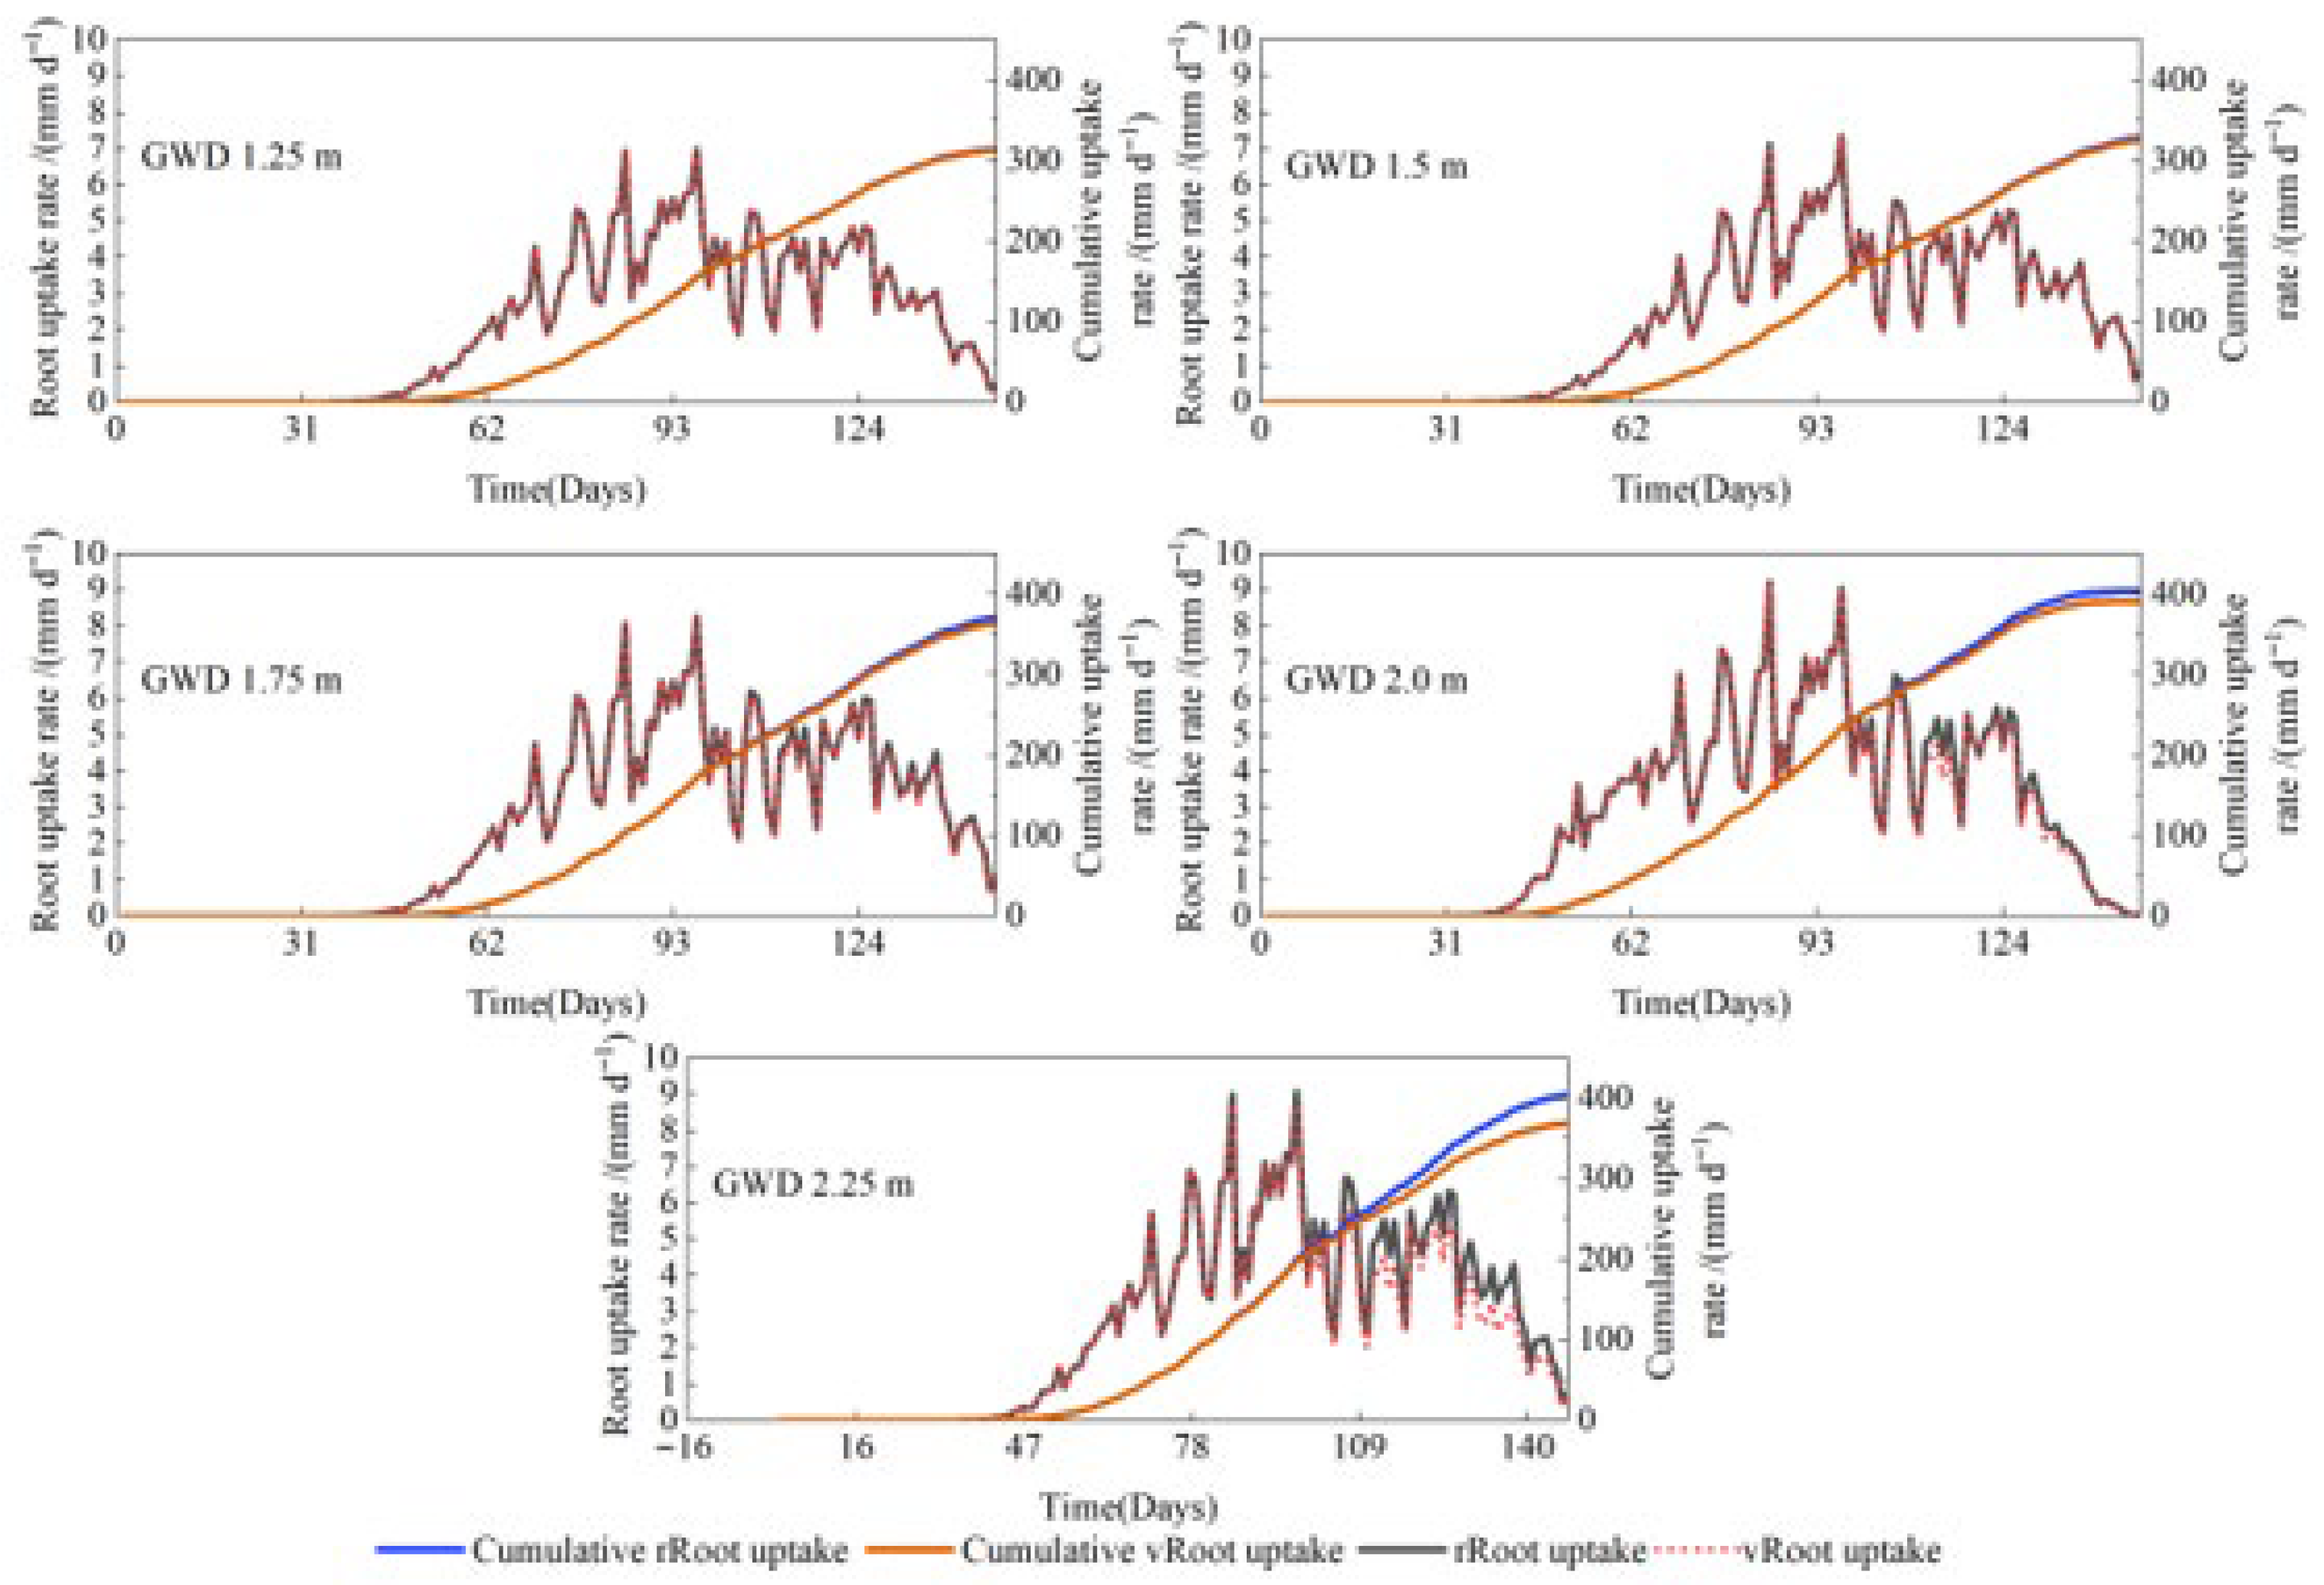
where Tp is the potential root water uptake rate, which can be expressed as Formula (17), β(z) is the normalized water uptake distribution (cm−1), and α(h) is a prescribed dimensionless response function of the soil water pressure head (0 ≤ α ≤ 1) that accounts for the effects of water stress on root water uptake. The parameters of the Feddes model are taken from our earlier study [23]. The study uses rRoot to represent the root system’s potential water uptake rate and vRoot to represent the actual water uptake rate.

2.4.4. The Evapotranspiration Module

The reference evapotranspiration (ETo) is determined by the HYDRUS-1D model using the FAO Penman method [24]:
ET o = 0.408 Δ ( R n G ) + γ 900 T + 273 u 2 ( e s e a ) Δ + γ ( 1 + 0.34 u 2 )
where ∆ is the slope of the vapor pressure curve (kPa °C−1), Rn is the net radiation at the crop surface (MJ m−2 d−1), G is the soil heat flux density (MJ m−2 d−1), γ is the psychrometric constant (kPa °C−1), T is the mean air temperature (°C), u2 is the wind speed at a height of 2 m, es is the saturation vapor pressure (kPa), and ea is the actual vapor pressure (kPa).
When crops only partly cover the soil surface, ETo is partitioned into potential evaporation (Ep, mm d−1) and potential transpiration (Tp, mm d−1).
E p = ET c exp ( λ LAI )
T p = ET c E p
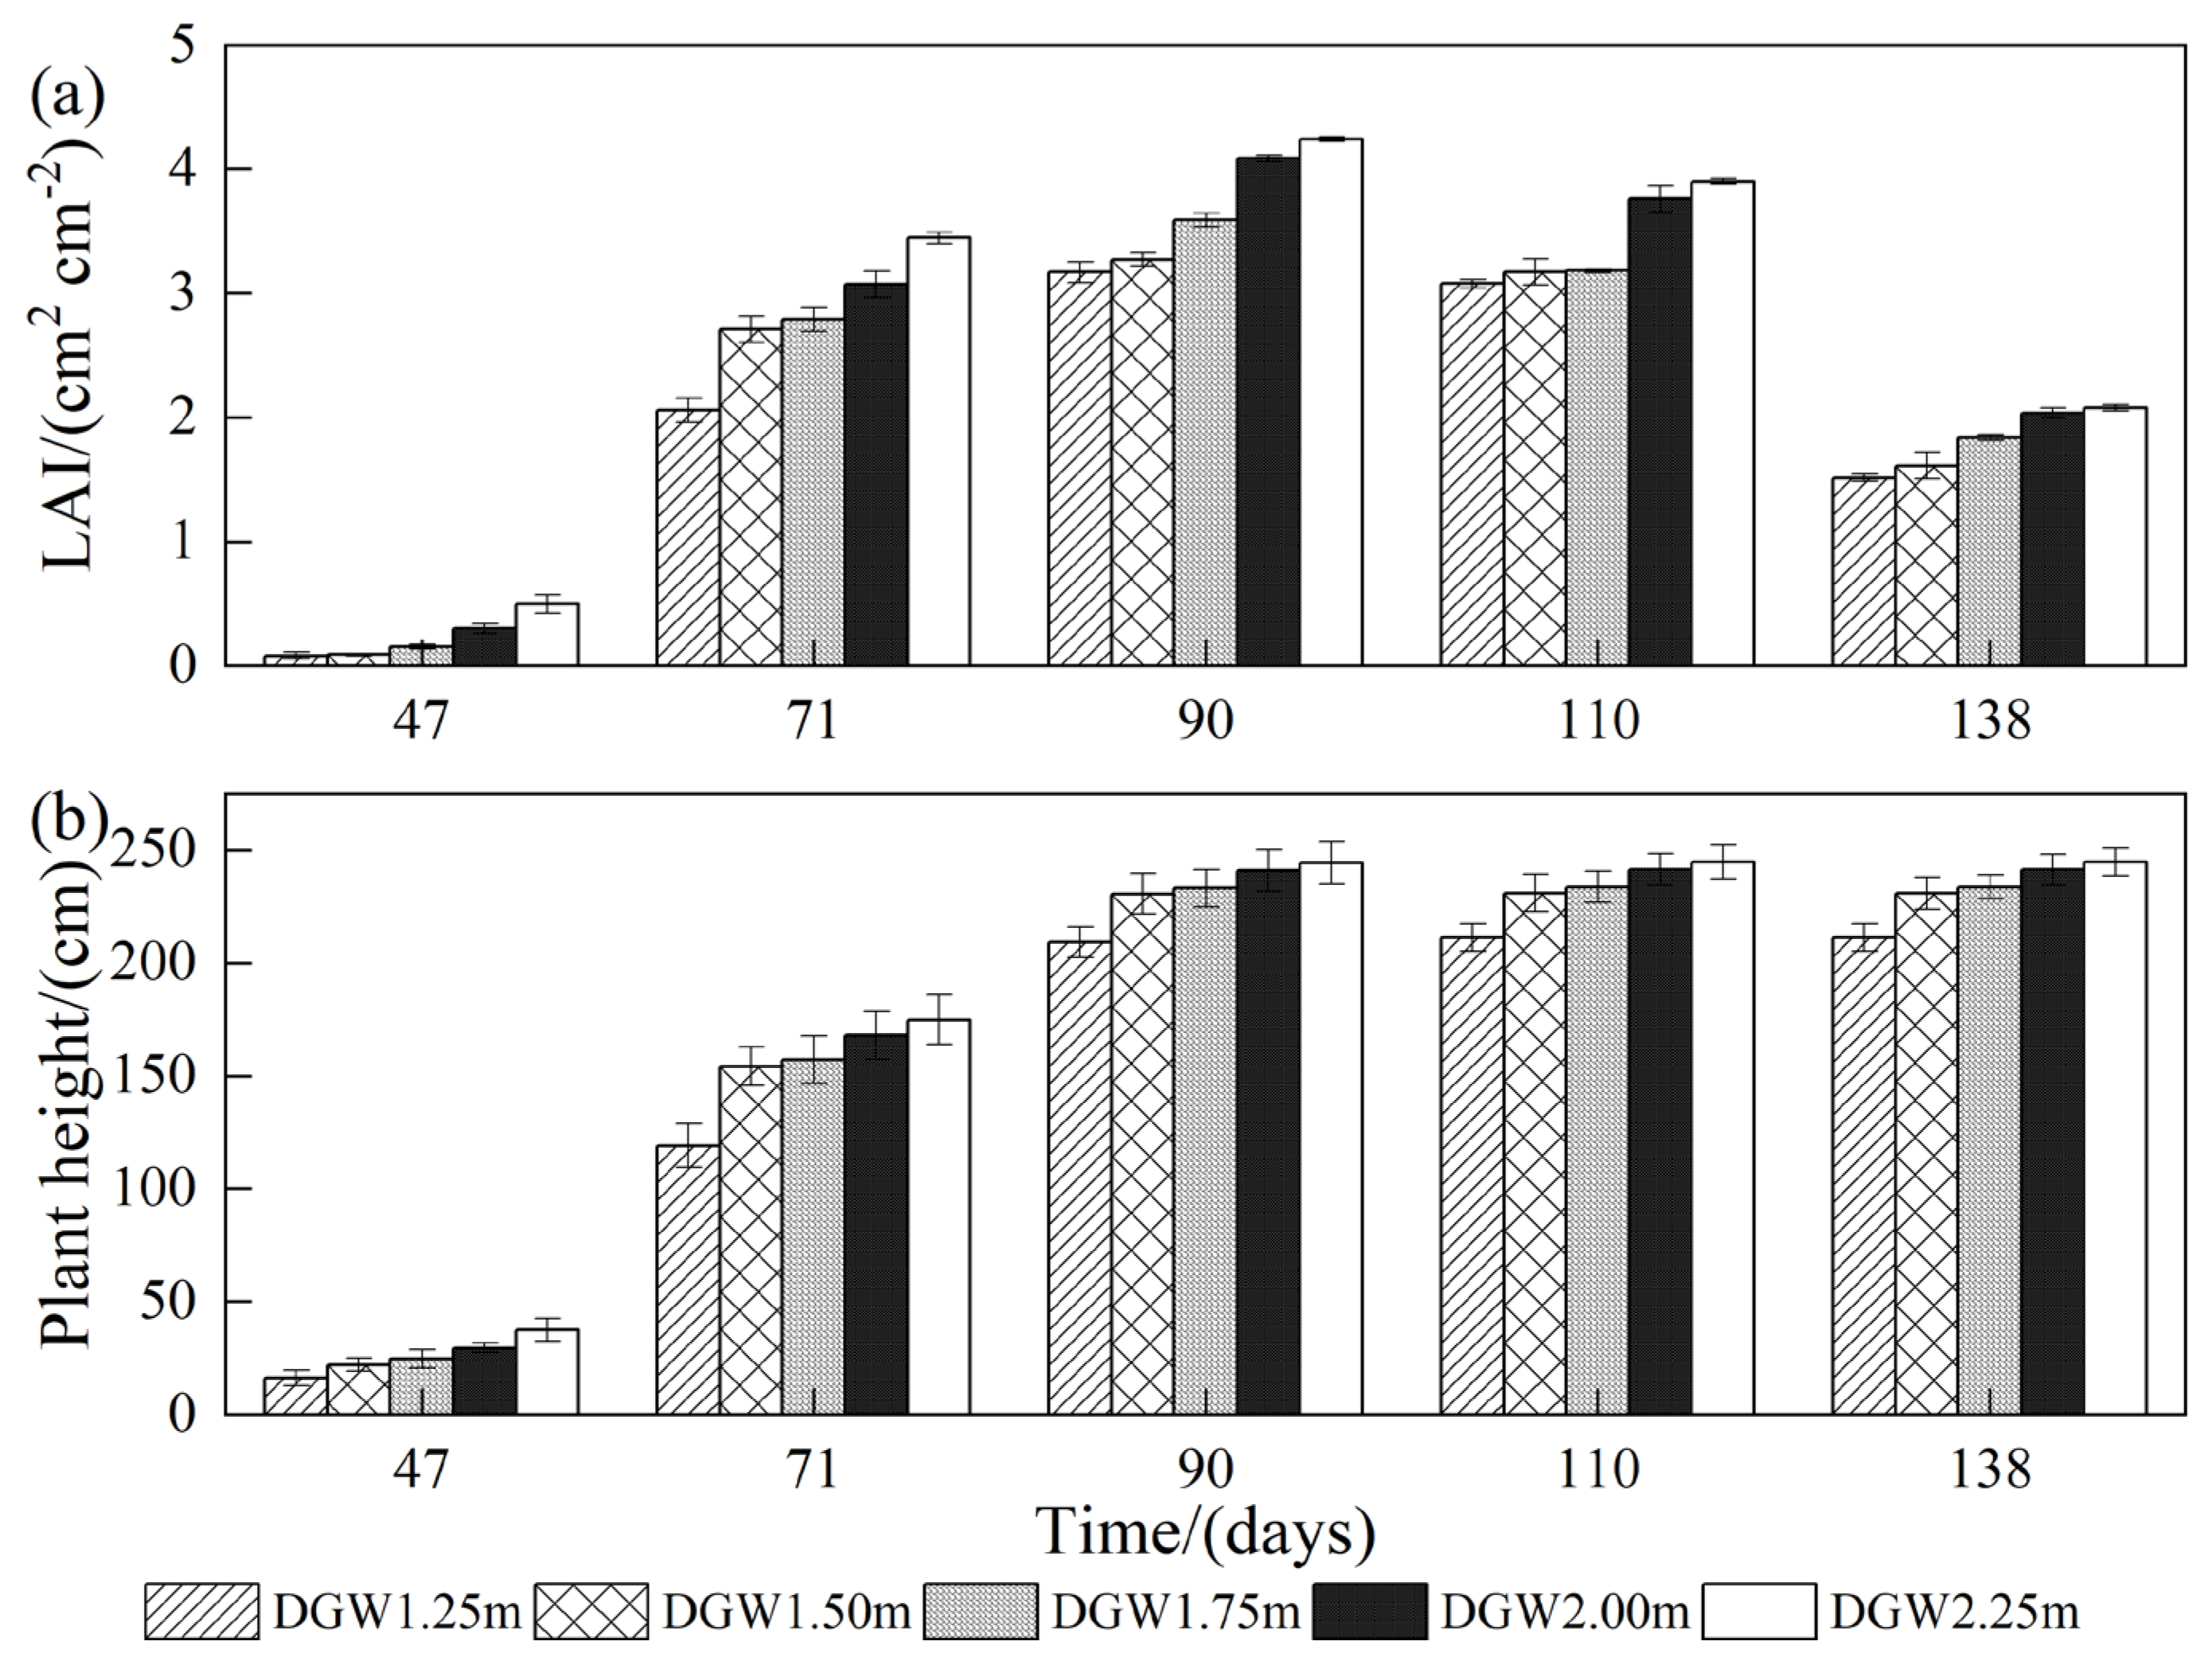
where LAI stands for leaf area index (cm2 cm−2), Figure 6 displays the leaf area index and plant height of maize leaves, λ is the constant for radiation extinction by the canopy, and ETc is the crop evapotranspiration under standard conditions, which is calculated using the equation below:
ET c = ET o K c
where Kc is the crop coefficient was derived from Allen et al. [24].

2.4.5. Statistical Evaluation

To evaluate the accuracy of the model simulation of observed data, this study used a combination of goodness-of-fit indicators to assess the model’s performance. This study evaluated the model’s performance using a variety of goodness-of-fit indicators to determine how accurately the model simulated the observed data. The regression coefficient (b0) from linear regression through the origin, the coefficient of determination (R2) from ordinary least squares regression, the root mean square error (RMSE), the ratio of RMSE to the mean of observed data (NRMSE), and the model efficiency (NSE) are some examples of specific indicators [25]. The work of Liu et al. [26] provides a thorough explanation of the statistical indicators. The predicted values are usually statistically equivalent to the field measurements when the b0 value is 1. The model’s ability to explain the variance of the observed values is indicated by an R2 value near 1. Accurate model predictions and minimal estimation errors are indicated by RMSE and NRMSE values near zero. The range of the NSE value is −∞ to 1 (optimal). An NSE value near zero signifies a dependable overall outcome since the simulated value is near the observed value’s average.

3. Results

3.1. Calibration and Validation of Hydraulic Parameters

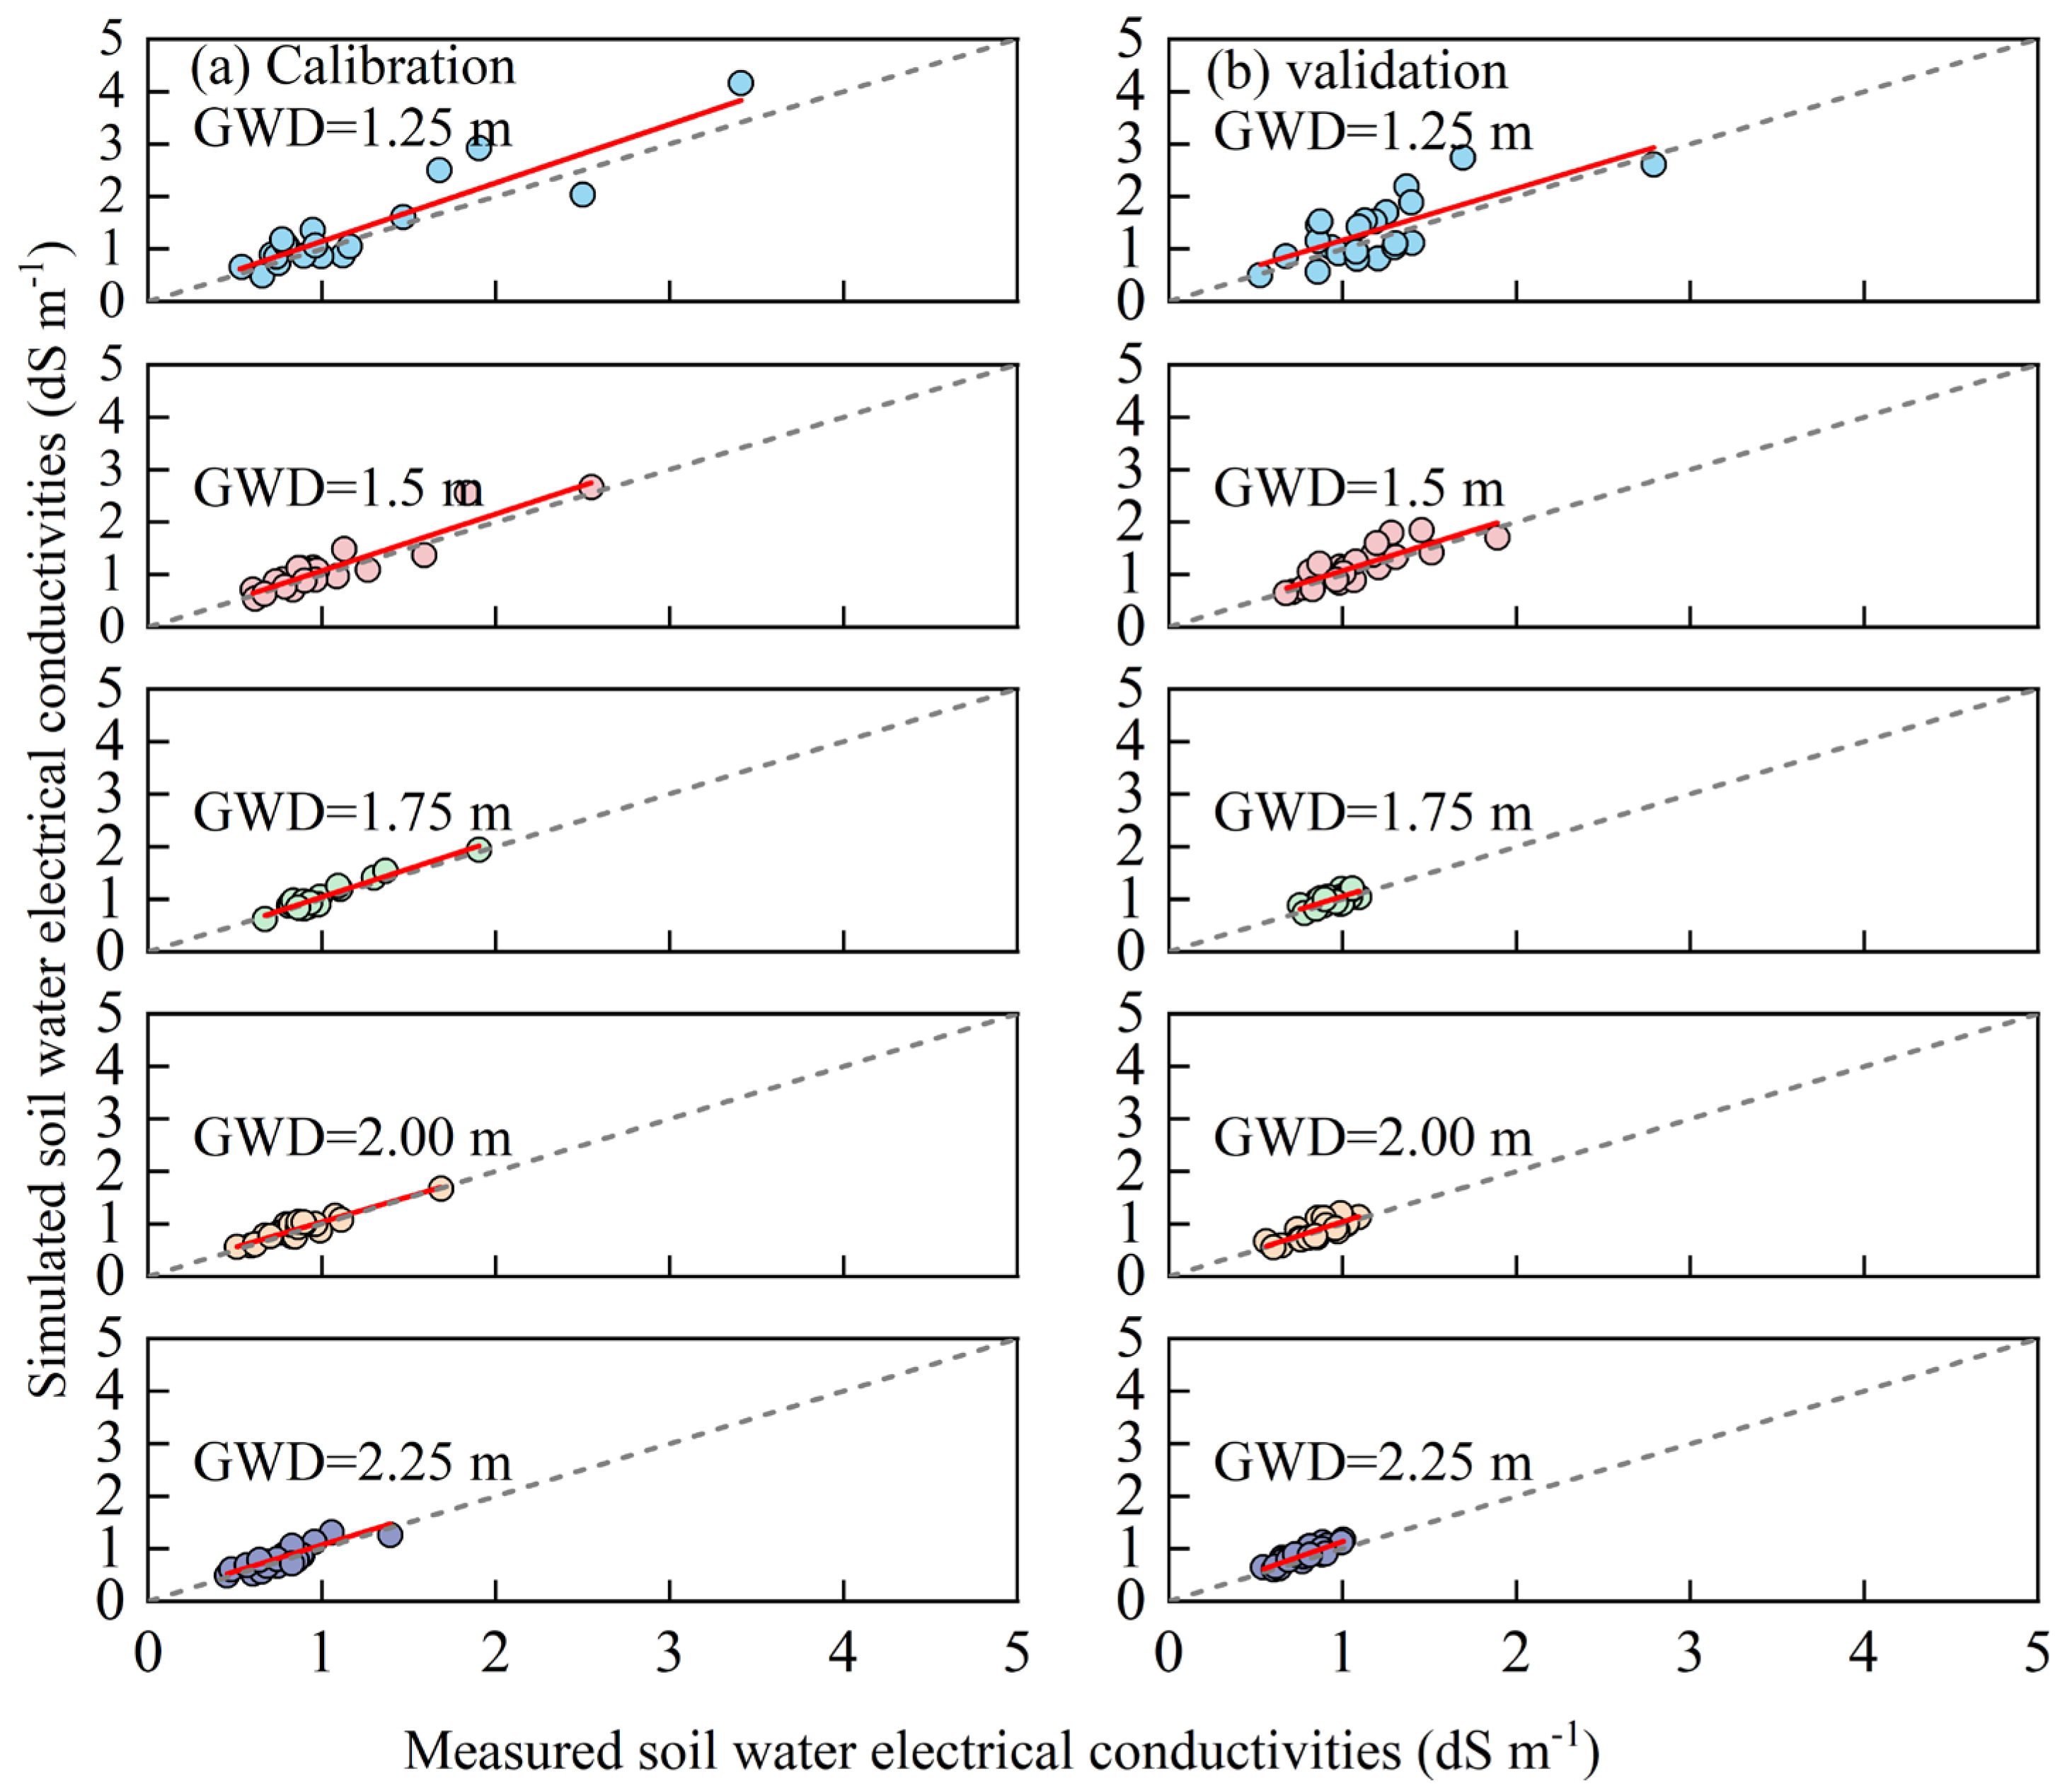
The calibration period and verification period of the HYDRUS-1D model are, respectively, the first 70 days and 71 days after maize sowing, at least when it is harvested. The fitting of the simulated and observed values of the soil moisture content and soil water flux are shown in Figure 7a,b, respectively. The fitting results of the EC simulated values and observed values are shown in Figure 8a,b, respectively. The soil hydraulic and solute transport parameters input into the model in this study were recalibrated based on the research findings from the same experimental area by Ramos et al. (2023) [27]; the hydraulic parameters of the different groundwater treatments and different soil depths were calibrated and verified, as shown in Table 4.
Table 5 shows that the R2 values for the SWC simulation are above 0.69, the RMSE values are below 0.03 cm3 cm−3 during the calibration and validation period, and the Nash–Sutcliffe efficiency (NSE) and b0 values are within 1. Due to the hysteresis effect of the soil moisture flux at the bottom boundary of the soil caused by water movement in the soil, the fitted R2 values are relatively low, but the values of RMSE and NRMSE are small, with average values of 0.12 mm and 2.54 mm, respectively. The NSE and b0 values are also within a range of 1. In Table 5, it can be observed that the surface soil is significantly influenced by the upper boundary and is subject to sampling errors. Therefore, the R2 value for fitting the soil moisture content of the surface soil is only 0.69, and the simulation error of soil electrical conductivity (EC) values is greater than that of the SWC values. During the model calibration period, the minimum R2 value is 0.74, with an RMSE value of 0.09 S·cm−1 and average NSE and b0 values of 0.54 and 1.05, respectively. The average NRMSE value is 0.15 dS cm−1. The simulated values of the SWC, bottom boundary soil moisture flux, and EC are consistent with the measured values. During model validation, the optimized hydraulic parameters for the SWC and EC data were used as inputs, and the bottom boundary soil moisture flux was used for validation.

3.2. Influence of Different GWDs on Crop Evapotranspiration Patterns

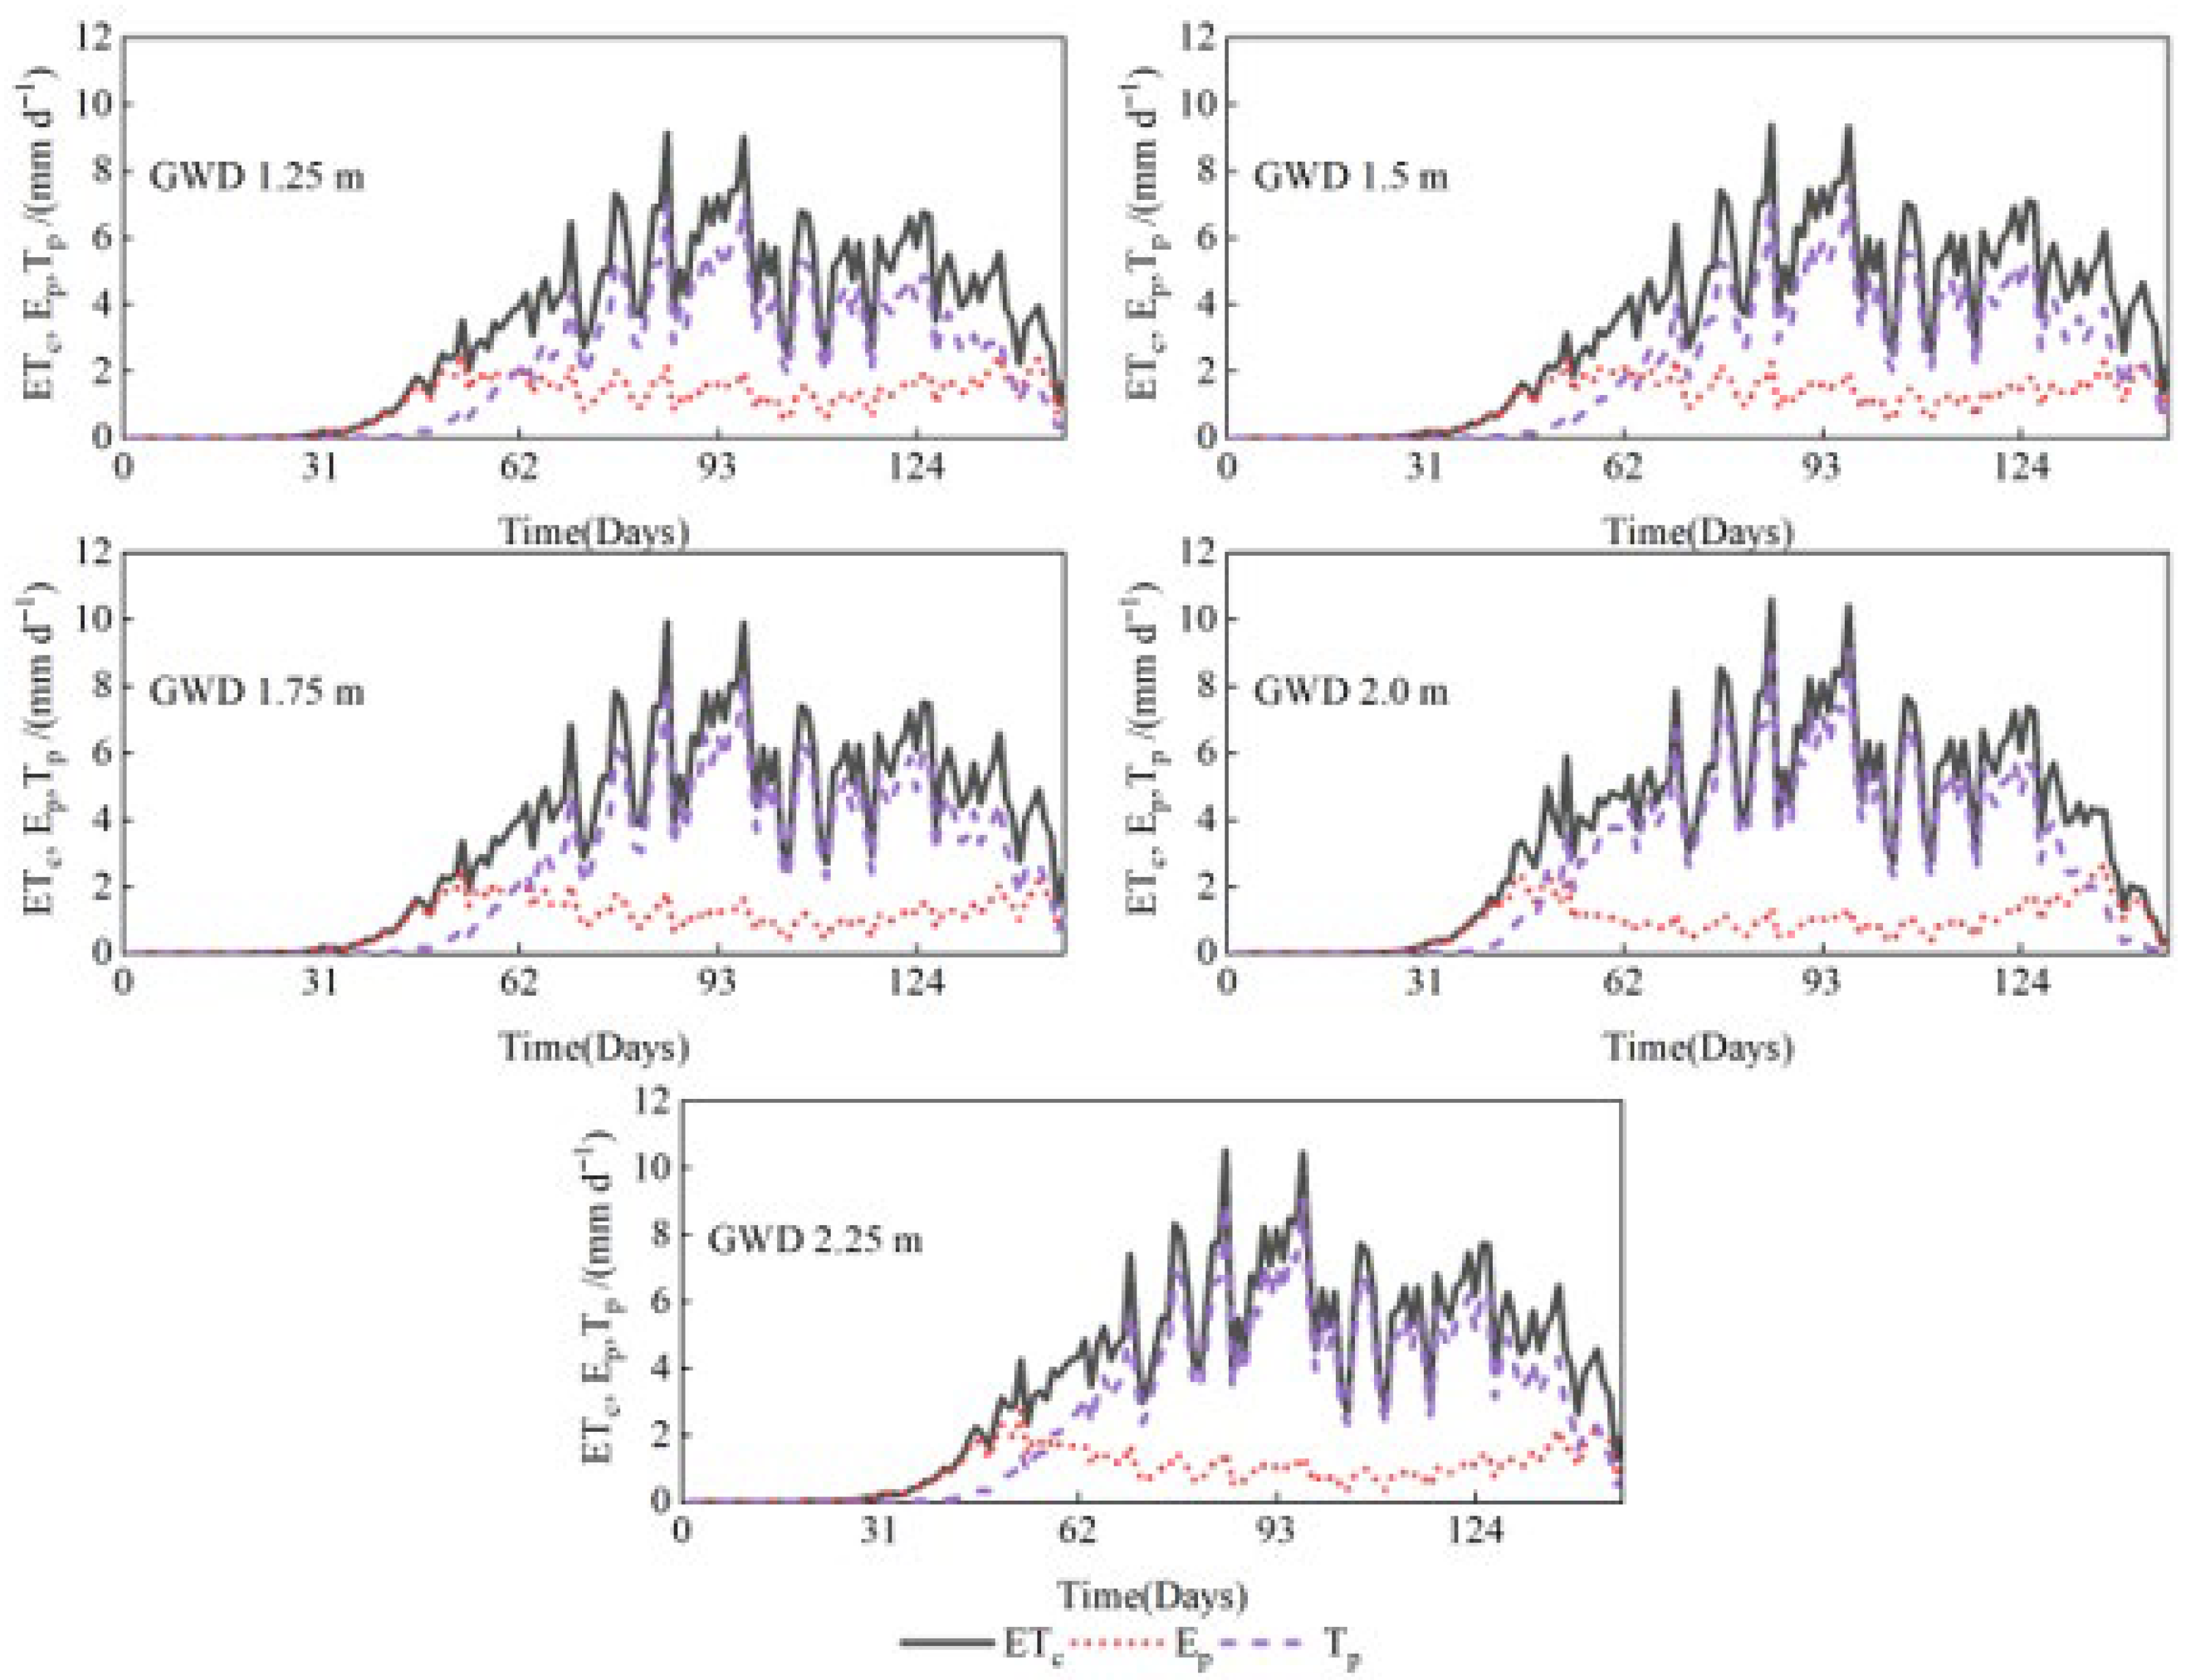
Through HYDRUS-1D simulation, it was found that the interplant transpiration and interrow evaporation rates in maize fields varied with maize growth and development and changes in microclimate. The maximum transpiration and evaporation rates occurred during the mid-season of maize growth. The distribution of interrow evaporation (Ep) during maize growth stages is shown in Figure 9. The maximum soil evaporation rate was observed between the crop development and mid-season stages of maize growth.
Before the crop development stage of maize, as the groundwater depth increased from 1.25 m to 2.0 m, both LAI and plant height increased accordingly. The proportion of total transpiration (Tp) and evapotranspiration (ETp) by maize increased from 65.9% to 75.7%, while the potential soil evaporation loss decreased from 34.1% to 25.0%. When the groundwater depth exceeded 2 m, maize could not effectively utilize groundwater during the crop development and mid-season stages, leading to water stress in the absence of irrigation. LAI decreased, and at a groundwater depth of 2.25 m compared to 2 m, the Ep increased by 3.9%. However, due to minimal salt stress on maize growth, there was no reduction in crop transpiration, and the potential crop water consumption remained consistent with the treatment at a groundwater depth of 2 m. Additionally, the simulation results showed that different groundwater depths had varying effects on changes and distribution of interrow evapotranspiration. As the groundwater depth increased, total interrow evapotranspiration generally increased, with more allocated to Tp. However, when the groundwater depth exceeded 2 m, maize utilized less transpiration water, resulting in greater evaporation losses.

3.3. Effects on Root Water Uptake Rate Patterns

Using HYDRUS-1D to simulate the root water uptake of maize at different growth stages under various groundwater depths, the results are shown in Figure 10. Regardless of the groundwater depth treatment, the ranking of root water uptake of maize at different growth stages is from smallest to largest: initial, crop development, late season, and mid-season. The root water uptake rate of maize mainly increases from the crop development stage onwards. As the groundwater depth increases, while the stress on crop water uptake decreases, the distribution proportion of root water uptake at different growth stages is also influenced by the groundwater depth.
When the groundwater depth increases from 1.25 m to 2.00 m, the root water uptake rates of crop development and mid-season increase with the increase in irrigation water depth. When the groundwater depth is 2 m, compared to the groundwater depths of 1.25 m, 1.50 m, and 1.75 m, the root water uptake of crop development increases by 150%, 161%, and 207%, respectively, and that of mid-season increases by 13.4%, 26.7%, and 28.7%, respectively. When the groundwater depth increases to 2 m, the root water uptake rates of crop development and mid-season no longer increase, but the root water uptake of mid-season decreases when the groundwater depth is 2.25 m. The root water uptake of late season increases by 15.9% compared to when the groundwater depth is 2 m. In this study, the maximum root water uptake of maize occurs when the groundwater depth is 2 m, reaching 391 mm. When the groundwater depth increases to 2.25 m, the root water uptake rate decreases by 6.3% compared to the maximum value. The maize’s ability to absorb water is affected by salinity stress. Groundwater depths between 1.75 m and 2.0 m can still supply water for maize growth, while groundwater depths greater than 2 m may reduce the upward capillary water in the soil available for root uptake, leading to stress on root water uptake.

3.4. Impacts of Groundwater Depth on Soil Salinity Dynamics and Salt Migration

Because of water absorption by crop roots and soil evaporation, the salt content rose again 15 days after irrigation and accumulated in the surface layer. The increase was primarily manifested in a decrease in the desalination rate of the 10–40 cm soil layer with decreasing GWD, as well as a decrease in the salination rate of the salination layer in all treatments. Compared to GWDs 1.25 m, 1.50 m, and 1.75 m, the salinization rate of GWDs 2.00 m and 2.25 m was lower 15 days after irrigation. Salt is more likely to build up in the surface layer because shallow GWD has a stronger capillary replenishment effect than deep GWD. The salinization rate following harvest had a generally positive correlation with GWD compared to the rate prior to sowing; rates for GWDs 1.25 m, 1.50 m, and 1.75 m within the 100 cm soil layer were 40.9%, 26.0%, and 11.1% higher, respectively, than rates for GWD 2.00 m. The salinization rates of GWDs 2.00 m and 2.25 m did not differ significantly, as far as we could tell.
The simulation results of the HYDRUS-1D model on the bottom boundary flux and soil salinity under different groundwater depth treatments in farmland are illustrated in Figure 11. Due to various factors, such as the capillary rise of groundwater and field evapotranspiration, the process of salt transport between soils under different groundwater depths varies. The results indicate that as groundwater depth increases, the migration of soil salt to the root zone decreases. The migration of salt to the crop root zone at GWD 2.25 is 51.2% less than that at GWD 1.25. Furthermore, the simulation results show that when the groundwater depth exceeds 2 m and maize is no longer irrigated during the late season, the migration of salt from groundwater to the root zone decreases significantly. The upward migration of salt at GWD 2.00 and 2.25 during the late season of maize is reduced by 38.8% and 44.2%, respectively, compared to GWD 1.75. However, when the groundwater depth exceeds 2 m, soil salt cannot effectively exchange with groundwater salt under the current irrigation level.

3.5. Effects of Groundwater Depth on Soil Water and Salt Storage in the Maize Root Zone

The groundwater table depth exerts a significant regulatory effect on water and salt dynamics in the maize root zone, as illustrated in Figure 12. Analysis of soil water storage dynamics reveals that under shallow groundwater conditions (DGW1.25 treatment), soil water storage in the root zone decreased by only 2.7% from the crop development stage to the mid-season. In contrast, under deep groundwater conditions (DGW2.25 treatment), soil water storage declined by 6.5%, failing to recover to initial levels by the late-season stage, with a 27.4% reduction compared to the initial stage. These results indicate that groundwater tables < 1.50 m can sustain root water uptake through capillary rise, whereas tables ≥ 1.75 m significantly increase water stress risks.
Salt storage dynamics exhibit an opposing trend. Under shallow groundwater conditions (DGW1.25 treatment), evaporation-driven salt accumulation elevated salt storage from an initial 9.2 kg ha−1 to 32.6 kg ha−1. When groundwater tables were ≥1.50 m, the increase in root-zone soil salinity during the crop development to mid-season stages was 19.2% lower than that of the DGW1.25 treatment. For the DGW2.25 treatment, weakened capillary action resulted in a slower salt accumulation rate, with salt storage increasing by 104.6%, from 5.8 to 11.9 kg ha−1 by mid-season. However, insufficient water storage under deep groundwater conditions exacerbated drought stress, posing a greater limitation on crop yield. Thus, optimizing groundwater table management requires balancing the trade-offs between water availability and salt accumulation risks.

4. Discussion

Owing to the strong evaporation intensity in summer in the HID, the interaction between groundwater and soil water is intense, causing salt to migrate with the water and aggravating soil salinization. Therefore, GWD and mineralization are the main causes of soil salinization [12], which severely restricts agricultural production in the HID. The results indicated that a shallow GWD increased soil evaporation, leading to an increase in crop transpiration, which is consistent with previous results [28].
The groundwater and deep seepage in this study were consistent with those reported in previous studies [29,30]. We found that groundwater recharge was negatively correlated with GWD; at the same GWD, groundwater recharge increased when the atmospheric temperature increased, that is, when the crop was in its vigorous growth stage (July and August). At the same irrigation level, deep seepage was negatively correlated with GWD. Therefore, an appropriate GWD can not only reasonably utilize groundwater recharge and reduce deep seepage caused by irrigation but also provide a satisfactory water-absorbing environment for crop root systems. Thus, groundwater recharge is affected by the GWD, crop growth period, atmospheric temperature, and humidity.
Irrigation can effectively leach salts from shallow GWD, reducing salt stress on crops and increasing irrigation production efficiency, which is consistent with previous results [31]. However, when GDW is too shallow, increasing the amount of irrigation required to reduce salt stress can lead to wastage of water resources. When the amount of irrigation stays the same, crop yield is affected by stress during the growth period, and WUE is reduced. In addition, shallow GWD can cause oxygen deficiency in crop root systems, leading to reduced crop yields [30]. However, research also indicates that if human-induced groundwater depletion outpaces the growth rate of deep roots, transpiration will sharply decrease [32]. Luo and Sophocleous (2010) demonstrated that the contribution of groundwater to crop water use is as high as 75% at a groundwater depth of 1.0 m but decreases to as low as 3% at a depth of 3.0 m [33]. Simulation studies have also shown that transpiration rates exponentially decline with increasing groundwater depth [12]. This study, through HYDRUS-1D simulation, similarly concludes that when groundwater depth exceeds 2 m, maize utilization of groundwater during irrigation intervals decreases. To ensure crop water needs, groundwater depth should be scientifically regulated according to crop planting structure.
Previous studies have demonstrated that groundwater can serve as a potential water source for crops in arid and semi-arid regions. Research by Hou et al. [12] showed that when the groundwater table depth increased from 1.12 m to 1.57 m, irrigation water demand rose by 69.5%. In the present study, when the groundwater table depth exceeded 1.5 m, soil water storage decreased significantly. This indicates that while controlling soil salinization, it is also essential to balance the relationship between crop water requirements and groundwater table depth. Owing to the experimental conditions, we used groundwater irrigation with a groundwater mineralization degree of 1.1 g L−1, which is higher than that (0.58 g L−1) employed in Yellow River irrigation, facilitating soil salt accumulation [34]. Therefore, for an irrigation water mineralization degree of 1.1 g L−1, to ensure water-saving and prevent soil salinization, we recommend GWD values of 1.5–2.0 m for maize growth and development in the HID, which is consistent with the findings of previous research [35].

5. Conclusions

This study is based on in situ pit experiments to measure groundwater depth, combined with the HYDRUS-1D model, to investigate the relationship between groundwater depth and soil moisture salinity during crop growth processes in the HID, as well as the influence of groundwater on maize growth and yield. During the maize growing season, both the upward capillary water movement and irrigation supply are negatively correlated with groundwater depth. The water use efficiency (WUE) is higher when the groundwater depth exceeds 1.75 m compared to when groundwater is shallow. When groundwater depth is less than 1.75 m, salt stress has a more significant impact on crops. The water uptake rate of roots during crop development and mid-growth stages increases with increasing groundwater depth. Compared to depths of 1.25, 1.50, and 1.75 m, the water uptake rate at a depth of 2 m increases by 150%, 161%, and 207%, respectively. At the mid-season stage, water uptake decreases at a depth of 2.25 m, while at 2 m, it increases by 15.8% at the end of the season. Beyond a depth of 2 m, absorption rates decrease by 6.2%. When groundwater depth exceeds 2 m, evaporation losses increase. When groundwater depth is too shallow, groundwater replenishment and soil evaporation increase, exacerbating stress on crops due to salinity and alkali. Meanwhile, the groundwater depth less than 1.5 m reduced root-zone water loss by 2.7% but increased salt accumulation by 255%, whereas the groundwater depth exceeding 2.0 m showed higher water loss but lower salt buildup. Therefore, to reduce resource waste and salt stress on crops, it is recommended that the optimal groundwater depth for maize growth and development in the HID be 1.5 to 2.0 m. The findings of this study provide practical guidance for optimizing groundwater management in arid and semi-arid irrigated regions. Future research should focus on long-term field monitoring and large-scale validation to support adaptive groundwater depth management under changing environmental and agricultural conditions.

Author Contributions

Z.F.: writing—original draft and visualization, L.D.: data curation and resources, Q.M.: writing—review and editing, methodology, and formal analysis, J.M.G.: writing—review and editing; methodology; formal analysis, H.S.: funding acquisition and methodology, Y.L.: formal analysis, W.F.: formal analysis and methodology. All authors have read and agreed to the published version of the manuscript.

Funding

This research was jointly supported by the National Natural Science Foundation of China (U2443210), the National Key Research and Development Program of China (2021YFD1900602–06), and National Sustainable Development Agenda Innovation Demonstration Zone Construction Key Project of Ordos City (No. ZD20232301). We also acknowledge the support granted to F.W. by the China Scholarship Council (CSC, No. 202308150179). Additionally, we appreciate the support from Coimbra Agriculture School (ESAC) and the Applied Research Institute of the Polytechnic University of Coimbra (IPC).

Data Availability Statement

The data are contained within the manuscript.

Conflicts of Interest

The authors declare no conflict of interest.

References

  1. Qu, Z.; Yang, X.; Huang, Y. Analysis and assessment of water-saving project of Hetao Irrigation District in Inner Mongolia. Nongye Jixie Xuebao/Trans. Chin. Soc. Agric. Mach. 2015, 46, 70–76, 112. [Google Scholar] [CrossRef]
  2. Xu, X.; Huang, G.; Sun, C.; Pereira, L.S.; Ramos, T.B.; Huang, Q.; Hao, Y. Assessing the effects of water table depth on water use, soil salinity and wheat yield: Searching for a target depth for irrigated areas in the upper Yellow River basin. Agric. Water Manag. 2013, 125, 46–60. [Google Scholar] [CrossRef]
  3. Shao, W.; Yang, D.; Hu, H.; Sanbongi, K. Water Resources Allocation Considering the Water Use Flexible Limit to Water Shortage—A Case Study in the Yellow River Basin of China. Water Resour. Manag. 2009, 23, 869–880. [Google Scholar] [CrossRef]
  4. Xiong, L.; Xu, X.; Engel, B.; Huang, Q.; Huo, Z.; Xiong, Y.; Han, W.; Huang, G. Modeling agro-hydrological processes and analyzing water use in a super-large irrigation district (Hetao) of arid upper Yellow River basin. J. Hydrol. 2021, 603, 127014. [Google Scholar] [CrossRef]
  5. Feng, Z.-Z.; Wang, X.-K.; Feng, Z.-W. Soil N and salinity leaching after the autumn irrigation and its impact on groundwater in Hetao Irrigation District, China. Agric. Water Manag. 2005, 71, 131–143. [Google Scholar] [CrossRef]
  6. Cao, Z.; Zhu, T.; Cai, X. Hydro-agro-economic optimization for irrigated farming in an arid region: The Hetao Irrigation District, Inner Mongolia. Agric. Water Manag. 2023, 277, 108095. [Google Scholar] [CrossRef]
  7. Xu, X.; Huang, G.; Qu, Z.; Pereira, L.S. Assessing the groundwater dynamics and impacts of water saving in the Hetao Irrigation District, Yellow River basin. Agric. Water Manag. 2010, 98, 301–313. [Google Scholar] [CrossRef]
  8. Chen, S.; Mao, X.; Shukla, M.K. Influence of coarse-textured soil layers under crop root zone on soil water and salt dynamics and crop yield in shallow groundwater areas. Soil Sci. Soc. Am. J. 2021, 85, 1479–1495. [Google Scholar] [CrossRef]
  9. Zheng, N.Z.; Guo, M.S.; Yue, W.F.; Teng, Y.G.; Zhai, Y.Z.; Yang, J.; Zuo, R. Evaluating the impact of flood irrigation on spatial variabilities of soil salinity and groundwater quality in an arid irrigated region. Hydrol. Res. 2021, 52, 229–240. [Google Scholar] [CrossRef]
  10. Zhang, R.; Wu, J.W.; Yang, Y.; Peng, X.; Li, C.S.; Zhao, Q. A method to determine optimum ecological groundwater table depth in semi-arid areas. Ecol. Indic. 2022, 139, 108915. [Google Scholar] [CrossRef]
  11. Yuan, C.F.; Pan, Y.X.; Jing, S.Y. Simulation soil water-salt dynamic and groundwater depth of spring maize based on SWAP model in salinized irrigation district. Comput. Electron. Agric. 2025, 231, 109992. [Google Scholar] [CrossRef]
  12. Hou, L.; Zhou, Y.; Bao, H.; Wenninger, J. Simulation of maize (Zea mays L.) water use with the HYDRUS-1D model in the semi-arid Hailiutu River catchment, Northwest China. Hydrol. Sci. J. 2017, 62, 93–103. [Google Scholar] [CrossRef]
  13. Zhang, T.; Zou, Y.; Kisekka, I.; Biswas, A.; Cai, H. Comparison of different irrigation methods to synergistically improve maize’s yield, water productivity and economic benefits in an arid irrigation area. Agric. Water Manag. 2021, 243, 106497. [Google Scholar] [CrossRef]
  14. Min, L.; Shen, Y.; Pei, H. Estimating groundwater recharge using deep vadose zone data under typical irrigated cropland in the piedmont region of the North China Plain. J. Hydrol. 2015, 527, 305–315. [Google Scholar] [CrossRef]
  15. Xu, X.; Sun, C.; Neng, F.; Fu, J.; Huang, G. AHC: An integrated numerical model for simulating agroecosystem processes—Model description and application. Ecol. Model. 2018, 390, 23–39. [Google Scholar] [CrossRef]
  16. Šimůnek, J.; Genuchten, M.T.; Šejna, M. Recent Developments and Applications of the HYDRUS Computer Software Packages. Vadose Zone J. 2016, 15, e20310. [Google Scholar] [CrossRef]
  17. Zhou, H.; Zhao, W.z. Modeling soil water balance and irrigation strategies in a flood-irrigated wheat-maize rotation system. A case in dry climate, China. Agric. Water Manag. 2019, 221, 286–302. [Google Scholar] [CrossRef]
  18. Dai, L.; Miao, Q.; Shi, H.; Feng, Z.; Li, Y.; Liu, Y.; Xu, Y.; Xu, R.; Feng, W. Influence of Groundwater Depth on Salt Migration and Maize Growth in the Typical Irrigation Area. Agronomy 2025, 15, 1021. [Google Scholar] [CrossRef]
  19. van Genuchten, M.T. A Closed-form Equation for Predicting the Hydraulic Conductivity of Unsaturated Soils. Soil Sci. Soc. Am. J. 1980, 44, 892–898. [Google Scholar] [CrossRef]
  20. Lebeau, M.; Konrad, J.-M. A new capillary and thin film flow model for predicting the hydraulic conductivity of unsaturated porous media. Water Resour. Res. 2010, 46, W12554. [Google Scholar] [CrossRef]
  21. Šimůnek, J.; van Genuchten, M.T.; Šejna, M. Development and Applications of the HYDRUS and STANMOD Software Packages and Related Codes. Vadose Zone J. 2008, 7, 587–600. [Google Scholar] [CrossRef]
  22. Feddes, R.A.; Kowalik, P.J.; Zaradny, H. Simulation of Field Water Use and Crop Yield; Wageningen Centre for Agricultural Publishing and Documentation: Wageningen, The Netherlands, 1978. [Google Scholar]
  23. Yu, J.; Wu, Y.; Xu, L.; Peng, J.; Chen, G.; Shen, X.; Lan, R.; Zhao, C.; Zhangzhong, L. Evaluating the Hydrus-1D Model Optimized by Remote Sensing Data for Soil Moisture Simulations in the Maize Root Zone. Remote Sens 2022, 14, 6079. [Google Scholar] [CrossRef]
  24. Allen, R.G.; Pereira, L.S.; Raes, D.; Smith, M. Crop evapotranspiration: Guidelines for computing crop water requirements. Fao Rome 1998, 300, D05109. [Google Scholar]
  25. Nash, J.E.; Sutcliffe, J.V. River flow forecasting through conceptual models part I—A discussion of principles. J. Hydrol. 1970, 10, 282–290. [Google Scholar] [CrossRef]
  26. Liu, M.; Shi, H.; Paredes, P.; Ramos, T.B.; Dai, L.; Feng, Z.; Pereira, L.S. Estimating and partitioning maize evapotranspiration as affected by salinity using weighing lysimeters and the SIMDualKc model. Agric. Water Manag. 2022, 261, 107362. [Google Scholar] [CrossRef]
  27. Ramos, T.B.; Liu, M.; Paredes, P.; Shi, H.; Feng, Z.; Lei, H.; Pereira, L.S. Salts dynamics in maize irrigation in the Hetao plateau using static water table lysimeters and HYDRUS-1D with focus on the autumn leaching irrigation. Agric. Water Manag. 2023, 283, 108306. [Google Scholar] [CrossRef]
  28. Li, X.; Zhang, C.; Huo, Z.; Adeloye, A.J. A sustainable irrigation water management framework coupling water-salt processes simulation and uncertain optimization in an arid area. Agric. Water Manag. 2020, 231, 105594. [Google Scholar] [CrossRef]
  29. Zhang, Y.; Wang, J.; Gong, S.; Xu, D.; Sui, J.; Wu, Z.; Mo, Y. Effects of film mulching on evapotranspiration, yield and water use efficiency of a maize field with drip irrigation in Northeastern China. Agric. Water Manag. 2018, 205, 90–99. [Google Scholar] [CrossRef]
  30. Zhao, Y.; Li, F.; Wang, Y.; Jiang, R. Evaluating the Effect of Groundwater Table on Summer Maize Growth Using the AquaCrop Model. Environ. Model. Assess. 2020, 25, 343–353. [Google Scholar] [CrossRef]
  31. Huo, Z.; Feng, S.; Huang, G.; Zheng, Y.; Wang, Y.; Guo, P. Effect of groundwater level depth and irrigation amount on water fluxes at the groundwater table and water use of wheat. Irrig. Drain. 2012, 61, 348–356. [Google Scholar] [CrossRef]
  32. Soylu, M.E.; Istanbulluoglu, E.; Lenters, J.D.; Wang, T. Quantifying the impact of groundwater depth on evapotranspiration in a semi-arid grassland region. Hydrol. Earth Syst. Sci. 2011, 15, 787–806. [Google Scholar] [CrossRef]
  33. Luo, Y.; Sophocleous, M. Seasonal groundwater contribution to crop-water use assessed with lysimeter observations and model simulations. J. Hydrol. 2010, 389, 325–335. [Google Scholar] [CrossRef]
  34. Chang, X.; Gao, Z.; Wang, S.; Chen, H. Modelling long-term soil salinity dynamics using SaltMod in Hetao Irrigation District, China. Comput. Electron. Agric. 2019, 156, 447–458. [Google Scholar] [CrossRef]
  35. Wang, G.S.; Shi, H.B.; Li, X.Y.; Yan, J.W.; Miao, Q.F.; Li, Z.; Akae, T. A Study on Water and Salt Transport, and Balance Analysis in Sand Dune-Wasteland-Lake Systems of Hetao Oases, Upper Reaches of the Yellow River Basin. Water 2020, 12, 3454. [Google Scholar] [CrossRef]
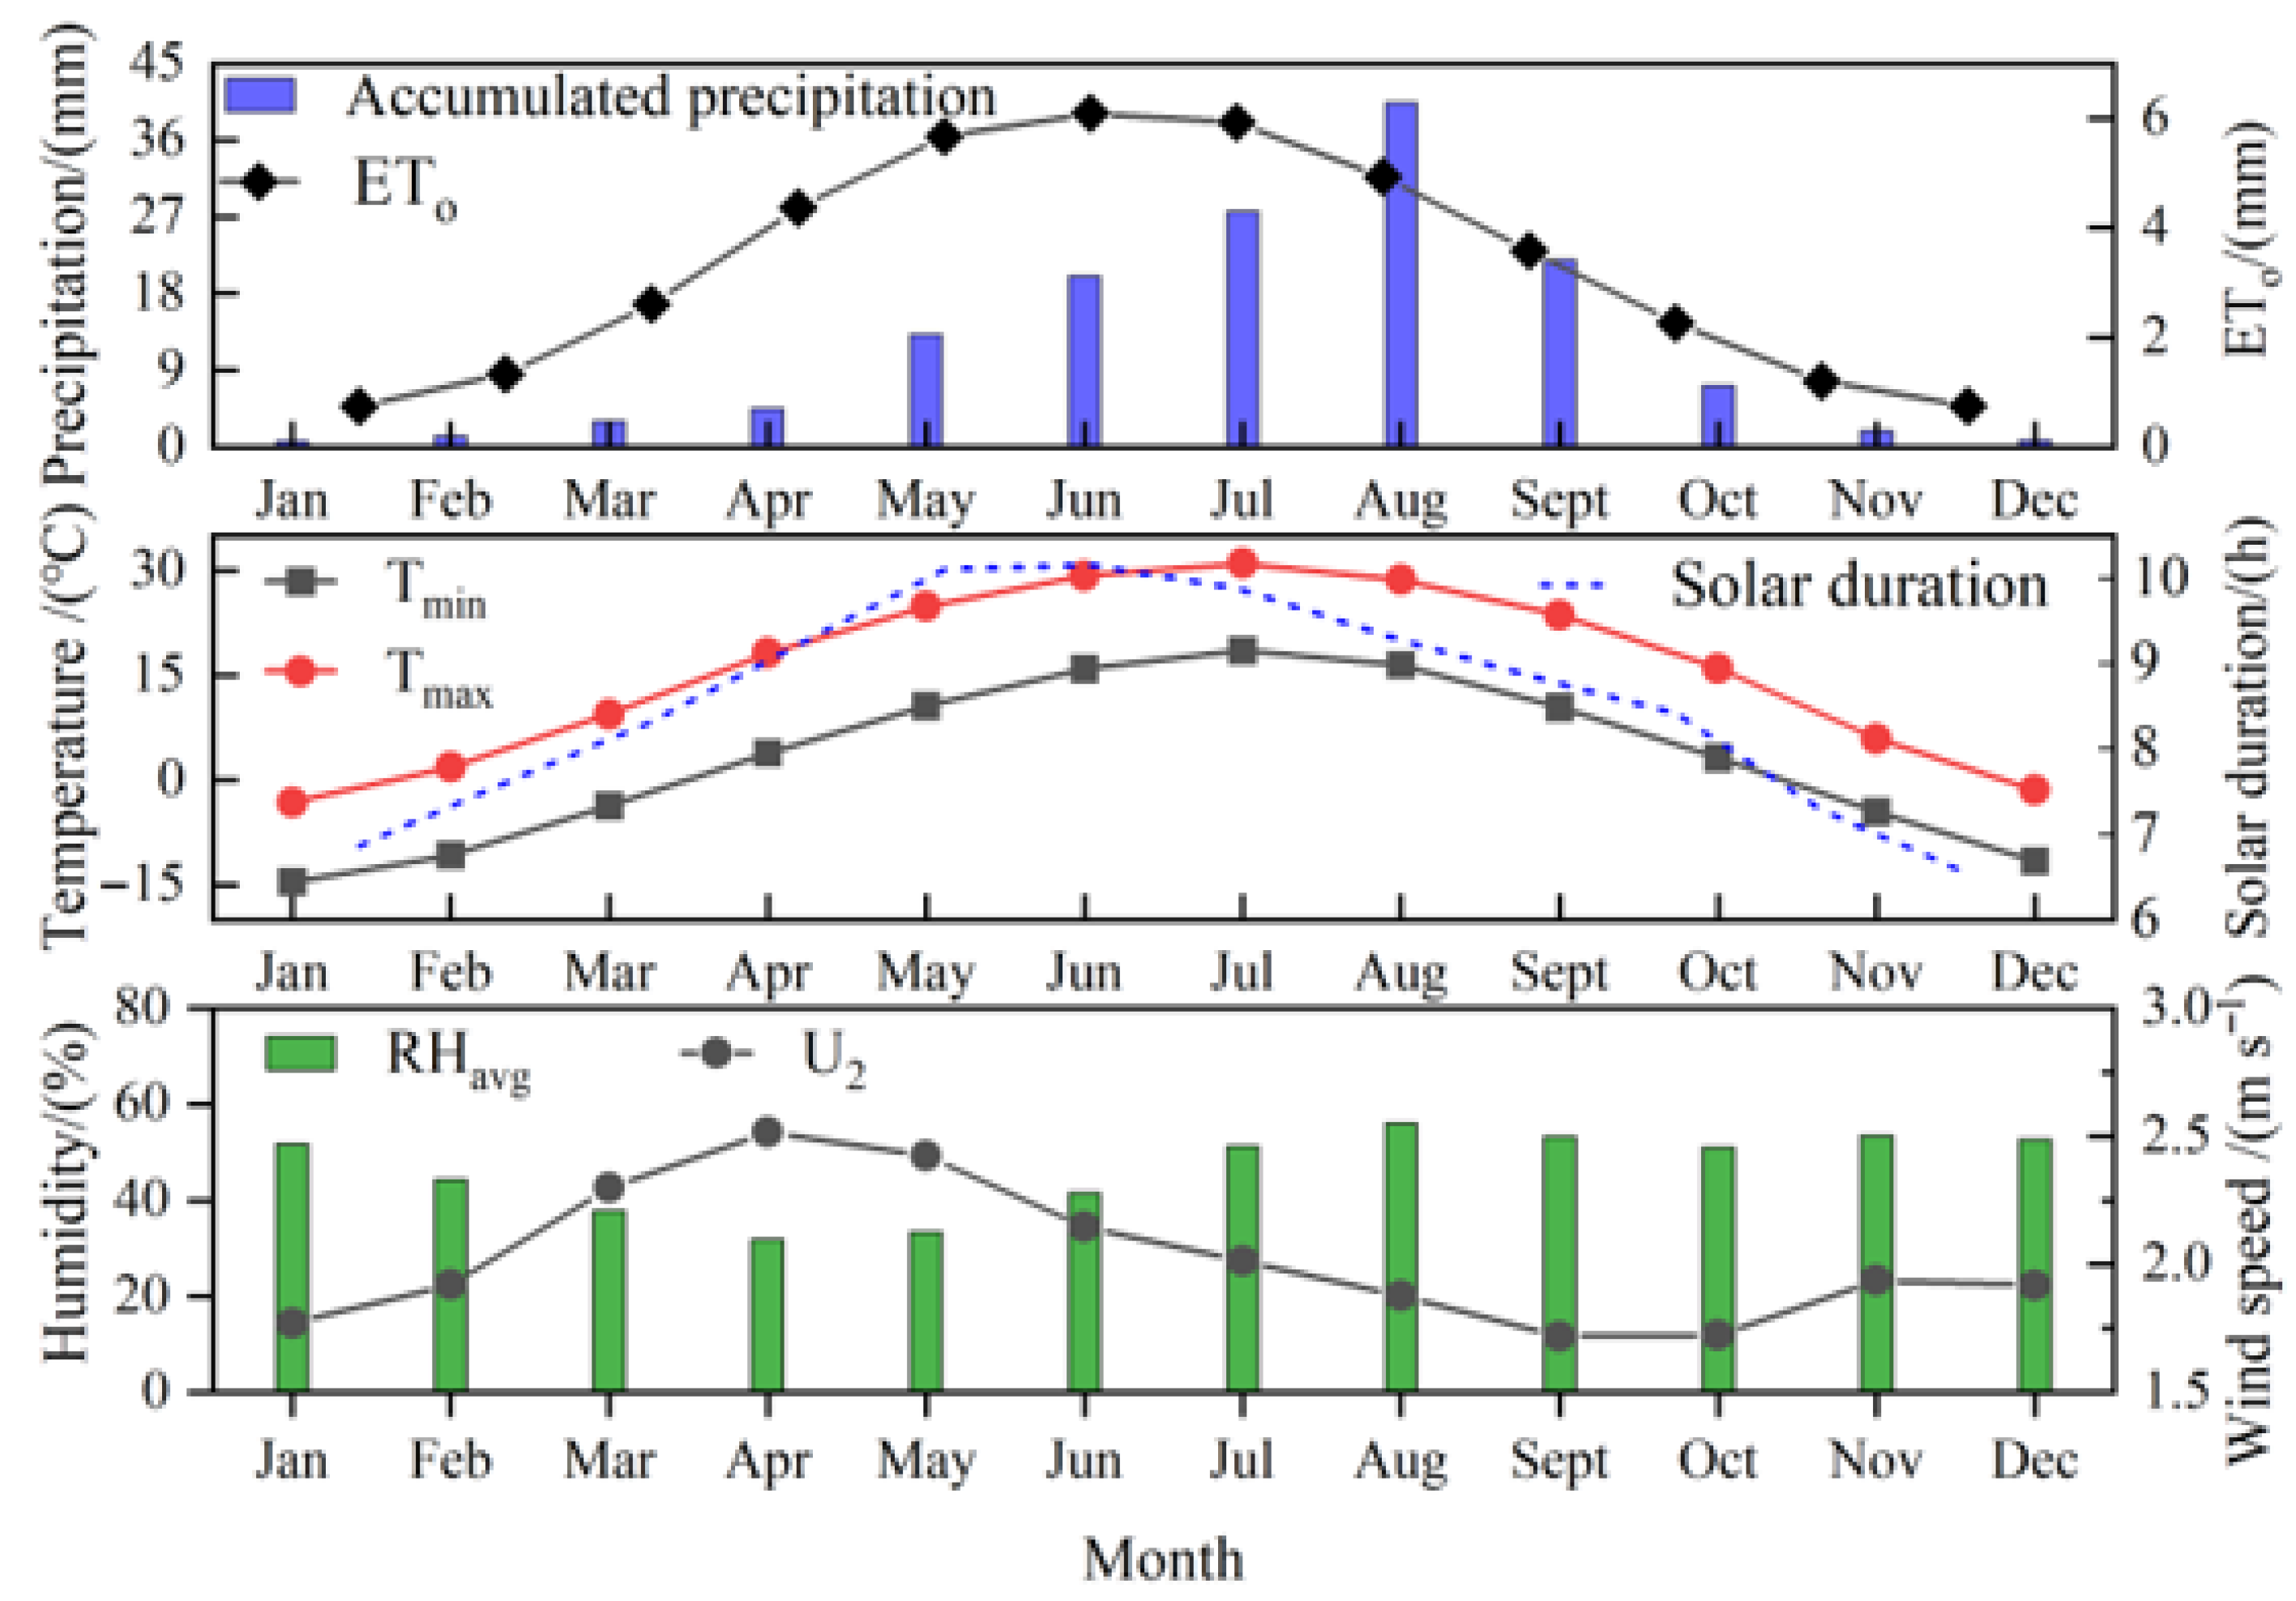
Figure 1. Distribution of monthly meteorological data in the study area from 1980 to 2019 (Tmax and Tmin, maximum and minimum surface air temperatures, respectively; RHavg, mean relative humidity; U2, wind speed at 2 m height).
Agronomy 15 02025 g001
Figure 2. (a) Schematic diagram of the water table lysimeters; (b) actual scene of the basement of the water table lysimeters [18].
Agronomy 15 02025 g002
Figure 3. View of open-air laboratory in the middle of maize growth.
Agronomy 15 02025 g003
Figure 4. Weather data for the study period in 2020 (P, precipitation, Tmax and Tmin, maximum and minimum surface air temperatures, respectively; RHavg, mean relative humidity; U2, wind speed at 2 m height).
Agronomy 15 02025 g004
Figure 5. Illustration of boundary conditions in the HYDRUS-1D model.
Agronomy 15 02025 g005
Figure 6. (a) Comparison between simulated and observed soil moisture content. (b) Comparison between simulated and observed soil moisture flux at the model’s bottom boundary.
Agronomy 15 02025 g006
Figure 7. Comparison between simulated and observed soil EC values at different groundwater depths.
Agronomy 15 02025 g007
Figure 8. (a) Leaf area index and (b) plant height distribution of maize during the growth period, based on open-air laboratory data.
Agronomy 15 02025 g008
Figure 9. Simulated values of potential crop evapotranspiration, potential transpiration, and potential evaporation during growth season using HYDRUS-1D.
Agronomy 15 02025 g009
Figure 10. Simulated daily rate and cumulative root water uptake by maize.
Agronomy 15 02025 g010
Figure 11. Simulated values of bottom boundary salt flux under different groundwater depths (GWD) using HYDRUS-1D. (+) values indicate salt entering the arable soil from groundwater through capillary action, while (−) values indicate salt leaching from the arable soil into groundwater.
Agronomy 15 02025 g011
Figure 12. (a) Soil water distribution and (b) salt storage in the maize root zone under different groundwater table depths across growth stages simulated with HYDRUS-1D.
Agronomy 15 02025 g012
Table 1. Main physical properties of soil in different soil layers.
Soil Layer
(cm)
Bulk Density
(g/cm3)
Particle Size Distribution %Soil Texture
>0.05 mm0.002–0.05
mm
<0.002 mm
0–101.46 17.27 75.15 7.58Silty loam
10–201.44 15.03 76.20 8.77Silty loam
20–401.52 20.60 73.236.17Silty loam
40–601.56 26.0466.447.52Silty loam
60–801.53 22.4170.726.87Silty loam
80–1001.53 22.5170.676.82Silty loam
100–1201.55 24.4567.488.07Silty loam
Table 2. Irrigation schedule of maize growing season.
Irrigation Depth/(mm)Total Irrigation Depth/(mm)
26 June 202017 July 20201 August 2020 30 August 2020
54727254252
Table 3. Maize growth stage division.
InitialCrop DevelopmentMid-SeasonLate Season
6 May–29 May30 May–9 July10 July–22 August23 August–29 September
Table 4. The hydraulic parameters and solute transport parameters after calibration.
Groundwater DepthDepth (m)θr (cm3 cm−3)θs (cm3 cm−3)α (cm−1)η (−)Ks (−)l (−)λ (−)
GWD 1.25 m0.0–0.40.0670.4350.0132.514000.550
0.4–2.350.0670.4350.0131.2600.5150
2.35–2.60.0450.430.1452.68712.80.530
GWD 1.50 m0.0–0.40.0670.4350.00934000.550
0.4–2.350.0670.4350.0131.2600.5150
2.35–2.60.0450.4350.1452.68712.80.530
GWD 1.75 m0.0–040.0670.4350.00934000.550
0.4–2.350.0670.4350.0131.2700.5150
2.35–2.60.0450.4350.1452.68712.80.530
GWD 2.00 m0.0–0.40.0670.4350.0082.544000.550
0.4–2.350.0670.4350.0191.35600.5150
2.35–2.60.0450.4350.1452.68712.80.530
GWD 2.25 m0.0–0.40.0670.4350.0072.544000.550
0.4–2.350.0670.4350.0131.2600.5150
2.35–2.60.0450.4350.1452.68712.80.530
θr, residual water content; θs, saturated water content; α and η, empirical shape parameters; l, pore connectivity/tortuosity parameter; Ks, saturated hydraulic conductivity; λ, is the longitudinal dispersivity.
Table 5. Goodness-of-fit test indicators relative to model calibration and validation.
StageProjectStatisticGWD 1.25GWD 1.5GWD1.75GWD 2.0GWD 2.25
CalibrationSoil water contentsR20.690.820.880.930.89
RMSE0.030.020.020.010.02
NRMSE0.110.060.070.910.03
NSE0.460.140.650.760.84
b00.980.961.031.020.82
Bottom fluxR20.720.690.670.720.59
RMSE0.210.110.170.050.03
NRMSE3.562.932.562.021.21
NSE0.420.300.150.110.32
b00.910.600.710.960.71
Soil bulk electrical
conductivity
R20.740.810.870.780.75
RMSE0.090.150.120.090.09
NRMSE0.340.080.110.120.09
NSE0.210.320.790.820.58
b00.991.120.991.101.05
ValidationSoil water contentsR20.690.780.860.980.98
RMSE0.010.020.010.010.01
NRMSE0.050.080.041.660.02
NSE−0.13−0.160.780.970.97
b01.021.051.010.990.99
Bottom fluxR20.620.680.360.420.29
RMSE0.190.130.140.080.09
NRMSE4.073.042.291.721.95
NSE0.60.490.12−0.09−0.25
b00.880.80.690.920.6
Soil bulk electrical
conductivity
R20.620.730.610.630.79
RMSE0.010.220.060.110.12
NRMSE0.350.20.060.130.16
NSE−0.010.770.920.740.63
b01.141.081.011.041.09
Disclaimer/Publisher’s Note: The statements, opinions and data contained in all publications are solely those of the individual author(s) and contributor(s) and not of MDPI and/or the editor(s). MDPI and/or the editor(s) disclaim responsibility for any injury to people or property resulting from any ideas, methods, instructions or products referred to in the content.