Abstract
To improve the separation efficiency of chili seeds, heat treatment on the adhesion between the seeds, peel, and embryo seat was studied. This study was conducted to explore the separation effect of heat treatment on chili seeds based on different temperature conditions. Firstly, the physical properties and thermal properties parameters of the materials (chili seed, peel, and embryo seats) were measured. These physical data were imported into ANSYS 2022 software to carry out a thermal steady-state simulation experiment. And the effects on seed activity were studied with different temperature conditions. The results indicated that it can effectively reduce the adhesion force between seeds, fruit peels, and embryo seats at 120 °C for 60 s. The maximum thermal stresses of the chili peel, seed, and embryo seat were 3.687 MPa, 0.878 MPa, and 0.662 MPa, respectively. At the same time, the germination rate of seeds under this treatment condition remained above 80%, ensuring the high activity of the seeds. This study provided a theoretical basis for the separation technology of chili seeds, and it was expected to bring practical guidance for the efficient utilization and extraction of chili seeds.
1. Introduction
Chili is part of the Solanaceae family with edible and medicinal values, and it is widely planted in China. Chili seeds can become edible oil and flour containing fiber and protein after processing [1,2]. Therefore, the application of chili seeds has significant benefits [3,4]. However, at present, most chili seeds are still separated manually with low efficiency, requiring a large amount of labor [5,6]. As shown in Figure 1, the separation of chili seeds generally includes the following steps: crushing chili peppers, salvaging peels, and separating seeds. Manual seed harvesting is time-consuming and labor-intensive, which seriously restricts the development of the chili industry. Therefore, it is imperative to conduct research on the mechanized seed extraction of chili peppers in China.
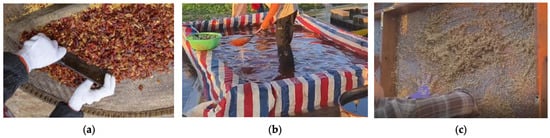
Figure 1.
The process of manually separating seeds: (a) crushing chili peppers, (b) salvaging peels, and (c) separating seeds.
Some scholars have already made some efforts in this research field. To obtain high-quality chili seeds for subsequent planting, it is crucial to ensure the high activity of chili seeds. However, most of the current separation methods are directly crushing and separating the chili pepper [7]. These methods cannot effectively separate the chili seed from the embryo and peel. Many scholars improved the separation efficiency of tomato seeds using heat treatment [8]. When threshing high-moisture rice, they reduced the number of broken leaves produced by combined harvesters through drying [9]. This heating method really improves the removal rate of the grain.
Computational Fluid Dynamics (CFD) is an efficient numerical method used to simulate complex physical phenomena [10,11]. CFD has been widely applied in multiple industrial and technological fields [12,13,14,15]. Most scholars analyze the conditions of the plant seed drying environment by CFD numerical methods, such as rice, wheat, corn, peanuts, and soybeans [16,17,18,19,20,21,22,23,24,25]. The thermal steady-state simulation was conducted on agricultural materials such as chili peppers with CFD. And it is necessary to measure the physical characteristics of crops, thermal properties parameters, and interactions between the environment and contact surfaces [26]. For most inherent physical properties, precise instruments can be directly used for measurement, such as three-dimensional dimensions, density, Poisson’s ratio, shear modulus, etc. [27]. For thermal property parameters, relevant physical parameters are quantitatively measured through thermal imaging and calculated using formulas. There may be some deviation in the calculated parameters, so model evaluation should be conducted [28].
Appropriate thermal conditions can improve separation efficiency and increase the utilization rate of recovered seeds [29,30]. Currently, Steady-state-Thermal of ANSYS 2022 software is used for simulation analysis of grain thermal stability. The goal of this study is to improve the separation efficiency of chili seeds, so heat treatment on the adhesion between the seeds, peel, and embryo seat was studied. The thermal steady-state simulation experiment was conducted to analyze thermal stress. The measured physical properties were imported into ANSYS 2022, and the thermal steady-state model was established. Suitable heating conditions were found to reduce the adhesion force, not affecting the activity of chili seeds. This could provide guidance for the development of separation technology for chili seeds.
2. Materials and Methods
2.1. Test Materials
The mature chili grown in the mountainous areas of Guizhou were used in this study. They usually have smooth skin and a deep red color, and the seeds are long and narrow, as shown in Figure 2. A total of 100 chili seeds were selected randomly for the experiment. Their three-dimensional sizes (L × W × T) were measured by a vernier caliper with an accuracy of 0.01 mm in Table 1. And the density of each part was measured using the soaking method with 10 g of seeds, peels, and embryonic seats, respectively. The experiment was repeated three times, and the results were shown in Table 2.
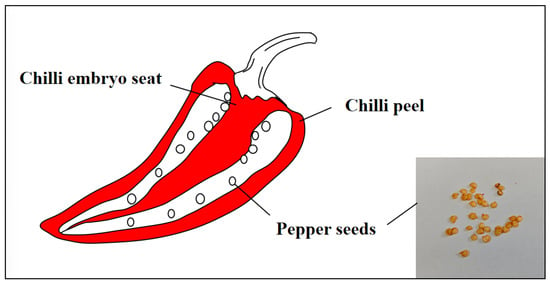
Figure 2.
Main components of chili pepper fruit.

Table 1.
Three-dimensional sizes of chili seeds.
Table 2.
Density of various parts of chili pepper.
2.2. Measurement Methods for Physical Parameters
2.2.1. Measurement of Poisson’s Ratio and Elastic Modulus
As shown in Figure 3, the TA.XTPLUS texture analyzer (Stable Micro Systems, Godalming, Surrey, UK) was used to conduct compression tests [31]. During the test, the chili peels were placed horizontally on a flat plate. Then a circular probe with a diameter of 8 mm was used to apply pressure along the thickness direction of the peel. This operation was stopped after loading at a rate of 0.10 mm/s for 8 s. After five repeated experiments, an electronic vernier caliper with an accuracy of 0.01 mm was used to measure the deformation of the fruit peel in the thickness and width directions.
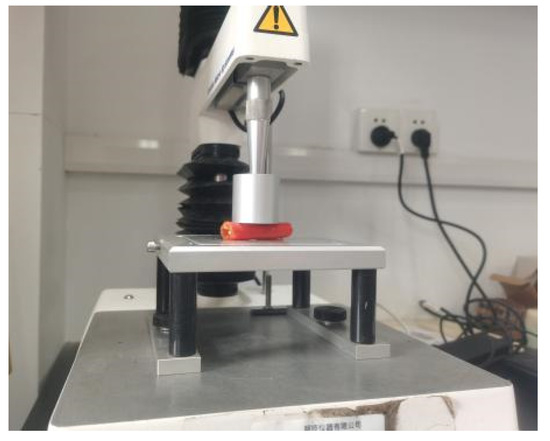
Figure 3.
TA.XTPLUS texture analyzer for compression test of chili peel.
2.2.2. Measurement of Thermal Expansion Coefficient
As shown in Figure 4, the TMA (PerkinElmer Pyris Diamond DMTA, PerkinElmer, Inc., Waltham, MA, USA) instrument was selected to measure the coefficient of thermal expansion [32]. Before the experiment, the samples including chili peels, seeds, and embryo seats were prepared and cut into small pieces that meet testing requirements. The surface of the sample was cleaned with ethanol or acetone to remove impurities and oil stains. Then they were dried to ensure purity.
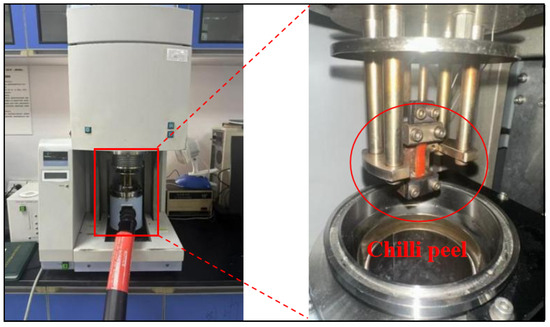
Figure 4.
TMA instrument for tensile test of chili peel.
Before the experiment, the TMA instrument power supply was turned on until the self-test was to be completed. A suitable probe was selected based on the characteristics of the sample, and the preset parameters were set. The displacement and stress changes in the sample in real time were obtained with different temperatures. After the test was completed, the test was stopped, and samples were carefully taken after the furnace was cooled to a safe temperature. At the same time, the data were recorded.
2.2.3. Measurement of Water Absorption Rate
The water absorption of materials is closely related to the study of viscosity in CFD simulations. By analyzing the water absorption characteristics, more accurate surface characteristic parameters and boundary conditions can be provided for CFD simulation. Before the experiment, 5 g of seeds, peels, and embryo seats were taken from fresh chili peppers. The samples were then completely immersed in distilled water. A temperature control device was used to ensure a constant temperature of 25 °C, as shown in Figure 5. The wet weight after soaking was measured with a precision balance, and the test was repeated 3 times.
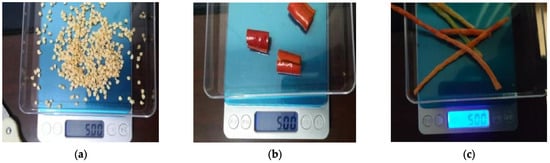
Figure 5.
The initial dry weight of test samples: (a) chili seeds, (b) chili peel, and (c) chili embryo seat.
2.3. Measurement Methods of Thermal Properties Parameters
2.3.1. Measurement of Specific Heat Capacity
According to the law of conservation of heat, the specific heat capacity of the seeds, peels, and embryo seat of chili peppers was inversely derived [33]. Firstly, 10 mL of water was weighed, and the initial temperature of the water was recorded. The sample was heated to a specified temperature and was quickly put into the water in the container. Then the temperature of the water mixed with the sample was recorded. The specific experimental process was shown in Figure 6.
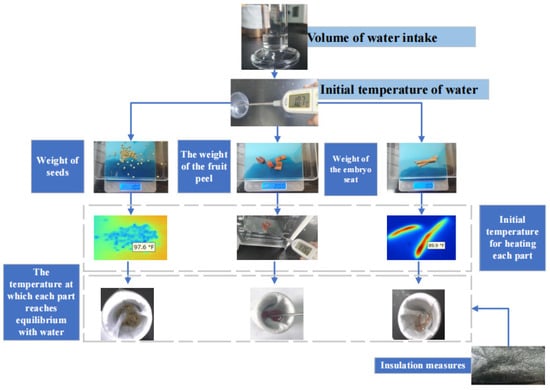
Figure 6.
Specific experimental process.
2.3.2. Measurement of Thermal Conductivity
Thermal conductivity is a key factor in analyzing the effect of temperature on crops. Before the test, the chili peel was cut into thin slices to obtain a smooth surface. One side of the sample was heated with a heating plate, and an infrared thermal imaging device was used to detect the temperature distribution of the chili peel. A transient heat conduction model was adopted in this experiment, which was used to deduce the material’s thermal conductivity. At this point, the heat conduction equation is as follows:
In the formula, —density; —specific heat capacity; —thermal conductivity; —thermal diffusivity; —the rate of change in temperature over time; and —the spatial gradient of temperature.
Based on experimental data, generate a spatial image of the temperature variation over time and perform numerical fitting using the heat conduction equation [34]. The least squares method is used to fit the difference between the theoretical model and the actual data in order to calculate the thermal diffusivity and further derive the thermal conductivity. For thermal diffusivity, the one-dimensional heat conduction formula can be used:
In the formula, —temperature changes with space and time. This equation describes the process of heat propagation inside chili seeds. Temperature data of chili seeds at different locations and time points were obtained through thermal imaging. Firstly, temperature data , where is location and is time, indicate the measured temperature at different locations and times. Secondly, the temperature is measured every 10 s. The position can be different points, such as several positions measured by a thermal imager. Next, define the boundary conditions and initial conditions. Usually, the following conditions can be set. Initial condition: At the initial time t = 0, the temperature of the chili seeds is T (assuming uniform temperature); the other end is an adiabatic boundary. Discretize the partial differential equation using the finite difference method to obtain an approximate computational model.
Then, the least squares method was used for fitting, and the temperature data of chili seeds at different time points were measured through experiments . The next goal is to fit these experimental data through numerical models to determine the thermal diffusivity in the model. Construct an objective function using the least squares method . To measure the difference between theoretical profiles and experimental data. The objective function can be defined as follows:
In the formula, —theoretical temperature calculated based on the thermal diffusion equation and the current thermal diffusion rate; —temperature data obtained from experiments.
To minimize the objective function, was used to simulate numerical optimization algorithms . And the genetic algorithm (GA) was utilized to gradually approach the optimal solution. The algorithm parameters were set as follows: PopulationSize_Data = 20, MaxGenerations_Data = 50, CrossoverFraction_Data = 0.7, and MigrationFraction_Data = 0.2.
3. Results
3.1. Results for Physical Parameters
3.1.1. Poisson’s Ratio and Elastic Modulus
Based on the load displacement data recorded, the elastic modulus, Poisson’s ratio, and shear modulus of the chili peel were calculated using the following formula. The chili seeds and embryo seats were also applicable. The data are shown in Table 3.
Table 3.
Poisson’s ratio, elastic modulus, and shear modulus of chili seeds, peels, and embryo seat.
In the formula, —Poisson’s ratio of chili peel; —the deformation of the chili peel in the width direction; —the deformation in the thickness direction of the chili peel; —load the width of the front chili peel; —the width of the chili peel after loading; —the thickness of the pepper seeds before loading; —the thickness of the pepper seeds after loading; —elastic modulus of chili peel; —axial compressive stress of the chili peel; —axial strain of the chili peel; —the maximum yield force of the chili peel under axial compression; —contact area of the chili peel; and —shear modulus of the chili peel.
3.1.2. Thermal Expansion Coefficient
According to the TMA instrument, the relation graph was drawn between elongation and temperature (Figure 7). Then the relative elongation of the sample was calculated according to the formula, as shown in Table 4.
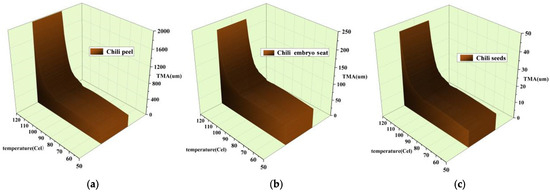
Figure 7.
The relationship between elongation and temperature: (a) Line chili peel, (b) line chili embryo seat, and (c) thread chili seeds.
Table 4.
Thermal expansion coefficient of chili pepper.
In the formula, —linear expansion coefficient per hour; —initial length; and Δ—the change in relative elongation of the sample when the temperature rises from t1 to t2.
3.1.3. Water Absorption Rate
The specific data is shown in Figure 8. Then, the water absorption rate was calculated using the following formula.
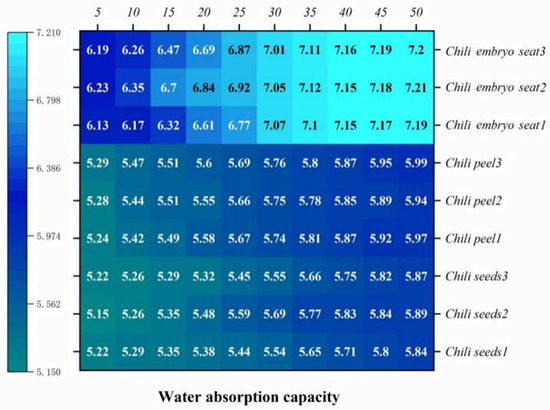
Figure 8.
The wet weight and heat map after immersion.
In the formula, —dry weight; —wet weight; and —it is the time interval between two points in time.
3.2. Results for Thermal Properties Parameters
3.2.1. Specific Heat Capacity
Based on the specific heat capacity of water (4.18 J/g °C), the heat absorbed by the sample was calculated, and the specific heat capacity was obtained (Table 5).
Table 5.
Specific heat capacity of each part.
In the formula, —the quality of water; —the quality of the sample; —the final common temperature; —the initial temperature of water; and —the initial temperature of the sample.
3.2.2. Thermal Conductivity
As shown in Figure 9, the temperature distribution of the chili peel was obtained using an infrared thermal imaging device. Finally, the thermal conductivity was derived from Formula (10), as shown in Table 6.
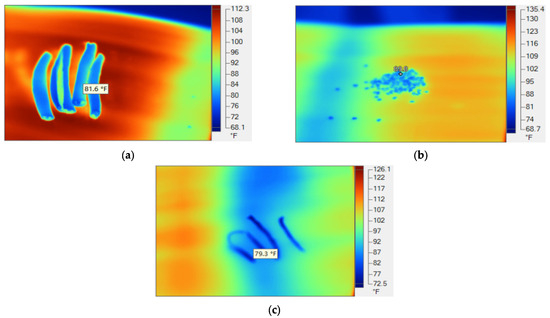
Figure 9.
Thermal imaging of materials: (a) chili peel, (b) chili seeds, and (c) chili embryo seats.
Table 6.
Thermal conductivity of various parts.
3.3. Thermal Property Parameter Model Analysis
To further verify the specific heat capacity and thermal conductivity, Fourier’s law is applied to evaluate the test data. And it was used for temperature changes () and heat flux () to regress the thermal conductivity or specific heat capacity. It was assumed that when the system eventually reaches a steady-state, the calculated thermal conductivity can be compared with experimental data to verify the rationality of this steady-state assumption. The experimental data can be fitted to a simple model for the initial estimation of thermal conductivity. When the time is long, the steady-state assumption is closer to the actual situation. The regressed thermal conductivity () is as follows:
In the formula, —the cross-sectional area of an object; —distance of heat conduction.
Regression analysis can be used to verify whether the inferred thermal conductivity matches the actual data.
In the formula, m—the quality of the object.
Coefficient of determination (R2) and the Mean Absolute Error (MAE) can be used to evaluate the ability of regression models to validate the inferred thermal conductivity and specific heat capacity [35]. The equation is as follows:
In the formula, is the i-day value simulated by the model; I standard values are calculated using the P-M model; is the average value; is the value; V is the average value; N is the sample size of the test set; and the intimate relationship R2 ratio of 1 indicates the degree of fit between the model and the data. An MAE close to 0 indicates a small model error.
By Fourier’s law regression simulation, the error range of applying the steady-state assumption under transient conditions can be evaluated. If the relative error is not large, it can indicate the effectiveness of the steady-state assumption under the experimental conditions. R2 and MAE were used to evaluate the ability of regression models to validate the inferred thermal conductivity and specific heat capacity. Evaluation of thermal conductivity model is as follows: (thread chili seeds R2 = 0.767–0.854, MAE = 0.341–0.589, line chili peel R2 = 0.744–0.861, MAE = 0.289–0.415, line chili embryo seat R2 = 0.772–0.875, and MAE = 0.265–0.384). The specific evaluation is shown in Figure 10. It can be seen that the experimental data is relatively stable within a certain range and can be used as parameters for a subsequent thermal stress analysis. The specific evaluation data are shown in Table 7 and Table 8 below.
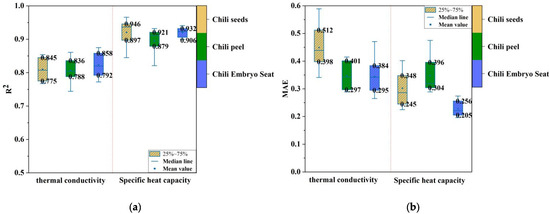
Figure 10.
The specific evaluations of (a) R2 assessment, (b) MAE assessment.
Table 7.
R2 evaluated data.
Table 8.
MAE evaluated data.
3.4. Activity Verification of Chili Seeds Under Different Temperature Conditions
The fresh chili peppers were cut into sections, and the seeds were taken out. The seeds were then placed in a cup filled with water; full seeds were selected according to the suspension state. As shown in Figure 11, a Heating and Drying Oven (Henan Huafeng Instrument Co., Ltd., Zhengzhou, China) was applied in the experiment (DHG-9053a). The heat time was set for 50 s, 55 s, and 60 s separately. And the temperature gradient was between 60 °C and 120 °C. After heat treatment, 50 seeds were selected from each group for cultivation. The seed germination was observed to verify the effect of temperature on seed activity after two weeks (Figure 12).
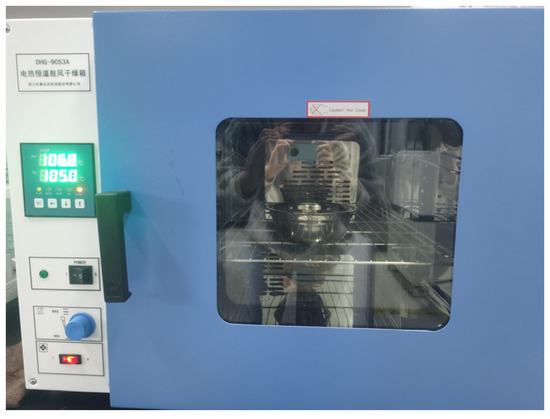
Figure 11.
Heating and Drying Oven.
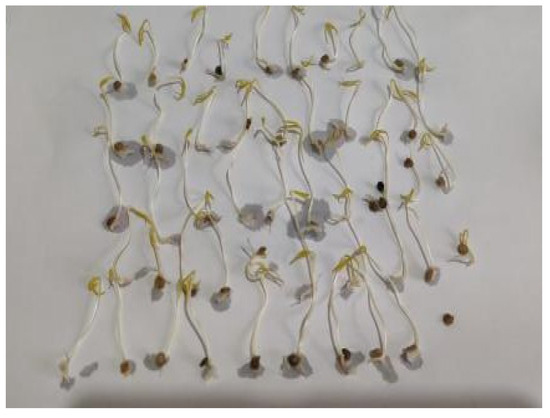
Figure 12.
Picture of germinated seeds.
Under different conditions, the thermal stress of chili seeds, peels, and embryo seats will increase with the increase in temperature and heating time. The normal germination rate of chili pepper seeds will be seriously affected, as shown in Figure 13. It was found that when the heat temperature was 120 °C and heat time was 60 s, the normal germination rate of chili seeds dropped to 84%.
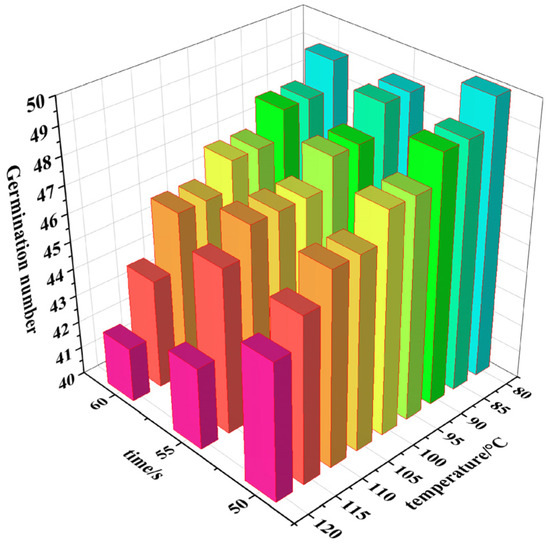
Figure 13.
The germination number of seeds under different temperature conditions.
3.5. The Thermal Steady-State Simulation Test
To further analyze the influence of thermal stress, a thermal steady-state simulation was carried out with ANSYS Fluent 2022 software. Firstly, 3D models of the materials were built. And they were imported into the steady-state thermal geometry structure. The physical parameters were set, including some parameters measured in the above experiments, as shown in Table 9. Then the mesh was divided, and the temperature boundary condition was set (the initial temperature was 22 °C).
Table 9.
Setting physical parameters in ANSYS Fluent 2022.
It was found that as the temperature increased, the thermal stress increased. And with a heat temperature of 120 °C, the thermal stress of the chili peel, chili embryo seat, and chili seed reached 3.687 MPa, 0.662 MPa, and 0.878 MPa, respectively. The stickiness between the chili seeds and the skin and embryo seat was smaller, which greatly improved the separation effect for subsequent crushing processing. Figure 14 showed the variation in thermal stress at 120 °C without affecting the seed germination rate. The same applies to the skin and embryo of chili peppers. Therefore, the temperature of 120 °C was advantageous for seed crushing and separation.
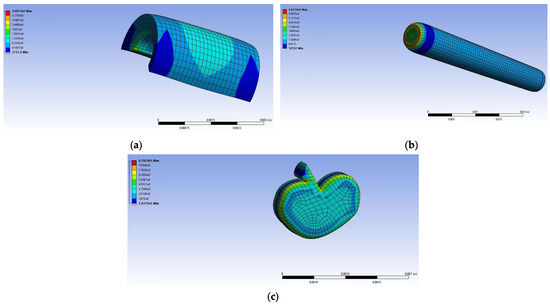
Figure 14.
Thermal stress analysis for the (a) chili peel, (b) chili embryo seat, and (c) chili seeds.
4. Discussion
After the initial crushing of the chili pepper, the embryo seat of the peel is easy to adhere, which is not conducive to the subsequent seed separation and extraction. Based on previous research by the research group [36], the impurity rate was 11.31% for the extraction of chili seeds. According to the literature [37,38], heat treatment can soften the pulp, reduce the internal adhesion of the pulp, and is conducive to crushing and separation. In this study, to reduce adhesion between materials, the chili pepper was heated. We will elaborate on the efficacy of our approach by analyzing the thermal stress observed in our results. At a heat temperature of 120 °C, the thermal stress of the chili peel, chili embryo seat, and chili seed was smaller, which significantly reduced the adhesion between the pepper materials. Therefore, with the heating pretreatment, the separation effect of pepper seeds was greatly improved by mechanical crushing and separation. However, high temperature treatment affected the germination rate and also brought on some seed loss. The high germination rate under heat conditions (≥80%) demonstrates the method’s reliability in simulating fire-induced germination.
The wide range of germination responses to heat was evidenced within Cistaceae, and it depends on the differential role of fire within this plant family [39]. In our study, it was also found that with the heat temperature of 120 °C and heat time of 60 s, the normal germination rate of chili seeds dropped to 84%. And the result revealed that a temperature of 120 °C was advantageous for seed crushing and separation without affecting the seed germination rate. Jiang et al. verified this conclusion by the extraction of pectin with heat from the seeds and peel of a watermelon [40].
In the future, the effect of heat treatment on chili seed separation will be further studied. Subsequent segmented heating is considered, using different temperatures for multiple heating cycles [41]. The core idea is to reduce the damage of high temperature to seeds while ensuring effective separation between chili seeds and peels.
5. Conclusions
According to different temperature conditions, the separation effect of heat treatment on the adhesion between the seeds, peel, and embryo seat was studied. To ensure the accuracy of simulation experiments, the physical parameters of chili seeds, peels, and embryo seats were measured. The experiment was conducted, and it was found that the normal germination rate of chili seeds dropped to 84% when the heat temperature was 120 °C and heat time was 60 s. Thermal stress analyses of chili seeds, peels, and embryo seats were simulated using the ANSYS Fluent 2022. The results showed that at a temperature of 120 °C, the thermal stresses of the peel, seed, and embryo seat were 3.687 MPa, 0.878 MPa, and 0.662 MPa, respectively. And the separation efficiency of chili seeds was significantly improved. Therefore, the research has important practical significance and provides a theoretical basis and technical support for the separation technology and extraction of chili seeds.
Author Contributions
Conceptualization, X.W. and J.B.; methodology, X.W.; software, X.P.; validation, X.W., X.P. and J.B.; formal analysis, J.B.; investigation, X.P.; resources, X.W.; data curation, X.W.; writing—original draft preparation, X.W.; writing—review and editing, X.P.; visualization, J.B.; supervision, J.B.; project administration, X.W.; funding acquisition, X.W. All authors have read and agreed to the published version of the manuscript.
Funding
This study was supported by National Key R&D Program of China (No. 2022YFD2002403), Talent Development Fund of Shihezi University in 2025—“Group Team” Aid Xinjiang Team (No. CZ002562), the Priority Academic Program Development of Jiangsu Higher Education Institutions (No. PAPD-2023), and Project of the Agricultural Engineering Faculty of Jiangsu University (No. NZXB20200104).
Institutional Review Board Statement
Not applicable.
Informed Consent Statement
Not applicable.
Data Availability Statement
The original contributions presented in this study are included in the article. Further inquiries can be directed to the corresponding author.
Conflicts of Interest
The authors declare no conflicts of interest.
References
- Duan, Y.; Han, W.; Guo, P.; Wei, X. YOLOv8-GDCI: Research on the Phytophthora Blight Detection Method of Different Parts of Chili Based on Improved YOLOv8 Model. Agronomy 2024, 14, 2734. [Google Scholar] [CrossRef]
- Zhang, D.; Sun, X.; Battino, M.; Wei, X.; Shi, J.; Zhao, L.; Zou, X. A comparative overview on chili pepper (capsicum genus) and sichuan pepper (zanthoxylum genus): From pungent spices to pharma-foods. Trends Food Sci. Technol. 2021, 117, 148–162. [Google Scholar] [CrossRef]
- Kim, D.; Park, H.; Cho, I.H. The effect of roasting on capsaicinoids, volatile compounds, and fatty acids in Capsicum annuum L.(red pepper) seeds. Food Sci. Biotechnol. 2022, 31, 211–220. [Google Scholar] [CrossRef]
- Cvetković, T.; Ranilović, J.; Jokić, S. Quality of Pepper Seed By-Products: A Review. Foods 2022, 11, 748. [Google Scholar] [CrossRef]
- Shayfull, Z.; Fathullah, M.; Shuaib, N.A.; Nasir, S.M. Design and Development of Dried Chilies Seed Separating Machine. Int. J. Basic Appl. Sci. 2011, 11, 7–10. [Google Scholar]
- Ghazali, A.; Sharun, S.M.; Abdullah, S.H.Y.S.; Yap, F.A.; Ariffin, N.H. Automatic chili seeds remover for household and small-medium enterprises as an alternative of hand cutting method. AIP Conf. Proc. 2021, 2347, 020174. [Google Scholar]
- Hassan, M.F.; Sebari, M.M.; Ali, M.H. Design and Development of Dried Chili Seeds Separator Machine. J. Des. Sustain. Environ. 2020, 2, 1–7. [Google Scholar]
- Hermanto, M.B.; Susilo, B.; Lutfi, M.; Damayanti, R.; Yanti, Y.; Irshafiyah, I. The influence of seed separation techniques and drying temperature in a dehumidified drying machine for tomato seed production. Adv. Food Sci. Sustain. Agric. Agroind. Eng. (AFSSAAE) 2024, 7, 67–77. [Google Scholar] [CrossRef]
- Wang, M.; Tang, Z.; Zhang, B.; Li, Y. Differences in breaking behavior of rice leaves under microwave and naturally drying processes. Int. J. Agric. Biol. Eng. 2022, 15, 89–100. [Google Scholar] [CrossRef]
- Yu, H.; Yu, H.; Zhang, B.; Chen, M.; Liu, Y.; Sui, Y. Quantitative perturbation analysis of plant factory LED heat dissipation on crop microclimate. Horticulturae 2023, 9, 660. [Google Scholar] [CrossRef]
- Liu, Z.; Chen, J.; Guo, J.; Qiu, B. Numerical Simulation and Validation of Droplet Deposition on Tomato Leaf Surface Under Air-Assisted Spraying. Agronomy 2024, 14, 1661. [Google Scholar] [CrossRef]
- Ou, M.; Zhang, Y.; Wu, M.; Wang, C.; Dai, S.; Wang, M.; Jiang, L. Development and Experiment of an Air-Assisted Sprayer for Vineyard Pesticide Application. Agriculture 2024, 14, 2279. [Google Scholar] [CrossRef]
- Tang, P.; Li, H.; Issaka, Z.; Chen, C. Impact forces on the drive spoon of a large cannon irrigation sprinkler: Simple theory, CFD numerical simulation and validation. Biosyst. Eng. 2017, 159, 1–9. [Google Scholar] [CrossRef]
- Xu, L.; Li, Y.; Chai, X.; Wang, G.; Liang, Z.; Li, Y.; Li, B. Numerical simulation of gas–solid two-phase flow to predict the cleaning performance of rice combine harvesters. Biosyst. Eng. 2020, 190, 11–24. [Google Scholar] [CrossRef]
- Khan, S.A.; Taj, F.; Habib, S.; Shawl, F.; Dar, A.H.; Dwivedi, M. CFD Analysis of Drying of Cereal, Fruits, and Vegetables. In Advanced Computational Techniques for Heat and Mass Transfer in Food Processing; CRC Press: Boca Raton, FL, USA, 2022; pp. 235–246. [Google Scholar]
- ElGamal, R.A.; Kishk, S.S.; ElMasry, G.M. Validation of CFD models for the deep-bed drying of rice using thermal imaging. Biosyst. Eng. 2017, 161, 135–144. [Google Scholar] [CrossRef]
- Elgamal, R.; Ronsse, F.; Radwan, S.M.; Pieters, J.G. Coupling CFD and diffusion models for analyzing the convective drying behavior of a single rice kernel. Dry. Technol. 2014, 32, 311–320. [Google Scholar] [CrossRef]
- Chen, P.; Fan, M.; Zhu, W.; Liu, Y.; Jiang, M.; Wang, Y.; Wang, X. Numerical simulation of hot air drying of wheat grain piles based on CFD-DEM and experimental research. Dry. Technol. 2024, 42, 199–211. [Google Scholar] [CrossRef]
- Coradi, P.C.; Lemes, Â.F.C. Experimental prototype of silo-dryer-aerator of grains using Computational Fluid Dynamics (CFD) system. Acta Sci. Technol. 2019, 41, e36949. [Google Scholar] [CrossRef]
- Liu, W.; Chen, G.; Zheng, D.; Ge, M.; Liu, C. Effects of the broken kernel on heat and moisture transfer in fixed-bed corn drying using particle-resolved CFD model. Agriculture 2023, 13, 1470. [Google Scholar] [CrossRef]
- Sanghi, A.; Ambrose, R.K.; Maier, D. CFD simulation of corn drying in a natural convection solar dryer. Dry. Technol. 2018, 36, 859–870. [Google Scholar] [CrossRef]
- McIntyre, J.S.; Butts, C.L.; Read, Q.D. Computational fluid dynamics modeled air speed through in-shell peanuts in drying wagons compared to measured air speed. Appl. Eng. Agric. 2022, 38, 489–508. [Google Scholar] [CrossRef]
- Xu, H.; Zhang, P.; Hu, Z.; Mao, E.; Yan, J.; Yang, H. Analysis of dust diffusion from a self-propelled peanut combine using computational fluid dynamics. Biosyst. Eng. 2022, 215, 104–114. [Google Scholar] [CrossRef]
- Hou, Z.; Duan, X.; Zhao, Y.; Ren, G.; Li, L.; Cao, W.; Liu, W. Three-dimensional simulation of green soybean infrared-assisted spouted bed drying. J. Sci. Food Agric. 2024, 104, 3206–3215. [Google Scholar] [CrossRef]
- Park, H.W.; Yoon, W.B. Prediction of the intermittent drying behavior of soybeans [Glycine max (L.)] using novel multilayered mass transfer simulation with an image analysis. Dry. Technol. 2019, 37, 1228–1238. [Google Scholar] [CrossRef]
- Lu, F.Y.; Ma, X.; Tan, S.Y.; Chen, L.T.; Zeng, L.C.; An, P. Simulative calibration and experiment on main contact parameters of discrete elements for rice bud seeds. Trans. Chin. Soc. Agric. Eng. 2018, 49, 93–99. [Google Scholar]
- Du, C.; Han, D.; Song, Z.; Chen, Y.; Chen, X.; Wang, X. Calibration of contact parameters for complex shaped fruits based on discrete element method: The case of pod pepper (Capsicum annuum). Biosyst. Eng. 2023, 226, 43–54. [Google Scholar] [CrossRef]
- Zhang, J.; Kaiser, E.; Zhang, H.; Marcelis, L.F.; Vialet-Chabrand, S. A simple new method to determine leaf specific heat capacity. Plant Methods 2025, 21, 6. [Google Scholar] [CrossRef] [PubMed]
- Liu, W.; Chen, G.; Zheng, D.; Ge, M.; Liu, C. Numerical and experimental investigation of flow and heat transfer in a fixed bed of non-spherical grains using the DEM-CFD method. J. Food Process Eng. 2023, 46, e14362. [Google Scholar] [CrossRef]
- Chen, P.; Wang, X.; Fan, M.; Tian, G.; Zhu, W.; Zhu, Y.; Jin, Y. Simulation study of moisture and heat migration during hot air drying of corn with stacked structures based on CFD-DEM. J. Stored Prod. Res. 2025, 112, 102627. [Google Scholar] [CrossRef]
- Namazu, T.; Fujii, T.; Takahashi, M.; Tanaka, M.; Inoue, S. A Simple Experimental Technique for Measuring the Poisson’s Ratio of Microstructures. J. Microelectromech. Syst. 2013, 22, 625–636. [Google Scholar] [CrossRef]
- Hubbard, A.M.; Ren, Y.; Sarvestani, A.; Picu, C.R.; Varshney, V.; Nepal, D. Thermomechanical analysis (TMA) of vitrimers. Polym. Test. 2023, 118, 107877. [Google Scholar] [CrossRef]
- Shamsaei, M.; Carter, A.; Vaillancourt, M. A review on the heat transfer in asphalt pavements and urban heat island mitigation methods. Constr. Build. Mater. 2022, 359, 129350. [Google Scholar] [CrossRef]
- Liu, X.; Gui, N.; Yang, X.; Tu, J.; Jiang, S. A DEM-embedded finite element method for simulation of the transient heat conduction process in the pebble bed. Powder Technol. 2021, 377, 607–620. [Google Scholar] [CrossRef]
- Alrebdi, T.A.; Wudil, Y.S.; Ahmad, U.F.; Yakasai, F.A.; Mohammed, J.; Kallas, F.H. Predicting the thermal conductivity of Bi2Te3-based thermoelectric energy materials: A machine learning approach. Int. J. Therm. Sci. 2022, 181, 107784. [Google Scholar] [CrossRef]
- Bai, J.; Chen, X.; Fang, W.; Fang, H.; Wang, X. Design and Parameter Optimization of Fresh Chili Seed Extractor. Agriculture 2025, 15, 1336. [Google Scholar] [CrossRef]
- Zhang, M.; Qiu, Z.; Zheng, Z.; Qiao, X. Effects of Different Heat Treatment Conditions and Breaking Methods on the Quality of Garlic Puree. Food Res. Dev. 2019, 40, 62–67+90. [Google Scholar]
- Zhang, Q.; Zhao, M.; Zhang, Y.; Meng, X.; Wang, Y.; Xu, Y.; Li, S. Effect of Different Treatment Sequences on Juice Yield and Quality of Blackcurrant Juice. Food Res. Dev. 2024, 45, 1–6. [Google Scholar]
- Luna, B.; Chamorro, D.; Pérez, B. Effect of heat on seed germination and viability in species of Cistaceae. Plant Ecol. Divers. 2019, 12, 151–158. [Google Scholar] [CrossRef]
- Jiang, L.N.; Shang, J.J.; He, L.B.; Dan, J.M. Comparisons of microwave-assisted and conventional heating extraction of pectin from seed watermelon peel. Adv. Mater. Res. 2012, 550, 1801–1806. [Google Scholar] [CrossRef]
- Luo, D.; Zhu, Y.; Wang, M.; Hu, X.; Wu, J. Effects of pretreatment on characteristics and qualities of Chinesejujube drying by segmented intermittent microwave coupled with hot air. Trans. Chin. Soc. Agric. Eng. 2017, 33, 261–267. [Google Scholar]
Disclaimer/Publisher’s Note: The statements, opinions and data contained in all publications are solely those of the individual author(s) and contributor(s) and not of MDPI and/or the editor(s). MDPI and/or the editor(s) disclaim responsibility for any injury to people or property resulting from any ideas, methods, instructions or products referred to in the content. |
© 2025 by the authors. Licensee MDPI, Basel, Switzerland. This article is an open access article distributed under the terms and conditions of the Creative Commons Attribution (CC BY) license (https://creativecommons.org/licenses/by/4.0/).