Abstract
Improved irrigation guidelines are needed to maximize crop water use efficiency. Combining field data with simulation models can provide information for better irrigation management. The objective of the present study was to evaluate the effects of two flood irrigation treatments on fiber yield (FY) and quality during the 2023 and 2024 growing seasons in Maricopa, Arizona, USA. Two irrigation treatments, denoted as F100% and F80%, were arranged in a randomized complete block design with three replicates. Then, AquaCrop was used to simulate cotton yield (YTot), water use (ETobs), and total soil water content (WCTot) for the two irrigation treatments. Six statistical metrics, including the coefficient of determination (R2), the normalized root-mean-square error (NRMSE), the mean absolute error (MAE), simulation error (Se), the index of agreement (Dindex), and the Nash–Sutcliffe efficiency coefficient (NSE), were employed to assess model performance. The results of the field trial demonstrated that reducing the irrigation rate to 80% of ETc negatively impacted cotton FY and ET water productivity (ETWP); the FY declined by 45.2% (ETWP = 0.097 kg·ha−1) in 2023 and by 38.1% (ETWP = 0.133 kg·ha−1) in 2024. Conversely, F100% produced a more uniform and stronger fiber than F80%, with the uniformity index (UI) and fiber strength (STR) measuring 81.7% and 29.5 g tex−1 in 2023 and 82.2% and 30.0 g tex−1 in 2024, indicating that UI and STR were well correlated with soil water during both growing seasons. AquaCrop showed an excellent performance in simulating cotton CC during the two growing seasons. The R2, NRMSE, Dindex, and NSE were between 0.97 and 0.99, 8.45% and 14.36%, 0.98 and 0.99, and 0.96 and 0.98, respectively. Moreover, the AquaCrop model accurately simulated YTot during these seasons, with R2, NRMSE, Dindex, and NSE for pooled yield data of 0.93, 8.05%, 0.95, and 0.78, respectively. The model consistently overestimated YTot, ETobs, and WCTot, but within an acceptable Se (Se < 15%) during both growing seasons, except for WCTot under the 80% treatment in 2023 (Se = 26.4%). Consequently, AquaCrop can be considered an effective tool for irrigation management and yield prediction in arid climates such as Arizona.
1. Introduction
Cotton (Gossypium hirsutum L.) represents a crucial economic crop cultivated primarily in subtropical and dry tropical regions [1] across more than 90 countries worldwide [2]. It serves as a common fiber crop, providing essential raw materials for the textiles industry [3]. In the USA, the third-largest cotton producer globally, about 40% of cotton is grown under irrigated conditions. It is considered a major summer crop within the Arizona low desert, contributing notably to economic revenue and employment within the agricultural sector. The Arizona cultivated area was estimated to be 44,515 ha in 2024, with an annual production value approximating $32 million for both Pima and upland cotton [4]. Cotton is commonly cultivated on raised beds with flood irrigation [5], mainly due to the existing infrastructure for conveying irrigation water from the Colorado River to farmers through irrigation canals.
Like many arid regions around the world, agroecosystems in Arizona are vulnerable to water stress. Water limitations in Arizona are due to the ongoing drought in the Colorado River basin, depletion of groundwater storage and reservoir water supplies, and increased distribution of water for industrial and municipal needs [6,7,8,9,10]. Reduced water allocations are now mandated for most of the water districts in Arizona due to the severe drought in the southwestern U.S., which imposes substantial challenges for cotton producers in the state. Moreover, climate change, which is projected to substantially impact cotton production in central Arizona [11], accelerates the risk of water scarcity [12].
To date, many irrigation strategies and technologies have been proposed to enhance irrigation management and promote the efficient use of water resources [13,14]. The application of deficit irrigation strategies at certain crop growth stages with low sensitivity to water stress can improve on-farm management practices by reducing irrigation water use, decreasing evaporation losses, minimizing energy consumption, and increasing economic returns from investment in irrigation water supplies [15,16,17]. Crop growth simulation models such as CWUModel, HYDRUS (2D/3D), SALTMED, DSSAT, SWAP/WOFOST, APSIM, CropSyst, DAISY, and HERMES [18,19,20,21,22], the ORYZA 2000 model [23], and the STIRPAT model [24] have been demonstrated as powerful tools to provide a scientific irrigation scheduling for agricultural water [14]. These models can help to simulate crop growth under various conditions for optimizing irrigation. Moreover, crop models can assess the impact of water stress on crop yields. However, the majority of these models require highly detailed, accurate input data and advanced modeling skills for their calibration and simulation [25]. AquaCrop, a water-driven model, was developed by the Food and Agriculture Organization (FAO) to simulate crop growth as a function of weather and irrigation. In comparison with most other models, it has a relatively limited number of input parameters, achieving a balance between output accuracy and simplicity.
Many studies have evaluated AquaCrop in simulating crop development and yield for many crops such as wheat [26,27], maize [28], soybean [29], rice [15,30,31], sunflower [32], pea [33], and potato [34]. Meanwhile, several studies have evaluated the model’s performance for cotton. For instance, Farahani et al. [35] parameterized and assessed the model for cotton under full and deficit irrigation with a drip system in north Syria. García-Vila et al. [36] simulated cotton yield response to irrigation water with a drip system in southern Spain. They then obtained optimum applied irrigation using an economic optimization procedure. Voloudakis et al. [37] evaluated the performance of AquaCrop in predicting cotton yield response to climate change in seven areas of Greece under drip irrigation conditions. Tsakmakis et al. [38] evaluated AquaCrop simulations of cotton growth under deficit irrigation with sprinkler and drip-line systems. Thorp [39] compared three computer simulation models for cotton irrigation scheduling, including AquaCrop-OSPy, under an overhead lateral-move sprinkler irrigation system with advanced geospatial technologies for site-specific irrigation applications within the georeferenced plot boundaries at Maricopa, Arizona. Considering that none of the previous studies have assessed the model under full and deficit flood irrigation or even under arid climate conditions in Arizona, the aims of the current study were as follows: (1) evaluate the effect of two flood irrigation treatments on fiber yield and quality and (2) simulate cotton yield, water use, and total soil water content under full and deficit flood irrigation for two growing seasons in central Arizona, USA.
2. Materials and Methods
2.1. Area of the Study
The field experiments were conducted during the 2023 and 2024 cotton-growing seasons at the Maricopa Agricultural Center (MAC), the University of Arizona, USA (33.07° N lat; 111.97° W long; 362 m a.s.l.), as shown in Figure 1. The experimental site has arid climate conditions: a hot summer, with daily observed maximum, minimum, and average air temperatures exceeding 46 °C, 32 °C, and 37 °C, respectively, during the growing season in July [40]. Two irrigation treatments based on furrow flood irrigation (F), denoted as F100% and F80%, respectively, were randomly distributed in a randomized complete block design (RCBD) with three replicates (R). Cotton was planted on April 13 and April 23 in 2023 and 2024, respectively. At the beginning of November, cotton was machine-harvested using a four-row mobile cotton picker, which collects the cotton harvest data quickly, easily, and accurately with one-button operation (https://www.system-scale.com/products/agriculture-scales, Last accessed on 4 April 2025). Yield samples were collected from each plot, bagged, and weighed separately. Then, a 150 g yield sample from each plot was bagged and transferred to the Maricopa ginning facility to separate cottonseed, fiber, and trash. After ginning, 10 g of cotton fiber was collected from each plot and sent to Cotton Incorporated (Cary, NC, USA) for fiber quality analysis. Four evaluation indices, including micronaire (MIC, unitless), uniformity index (UI, mm mm−1), upper half mean length (UHML, mm), and fiber strength (STR, HVI g tex−1), were used to assess fiber quality.
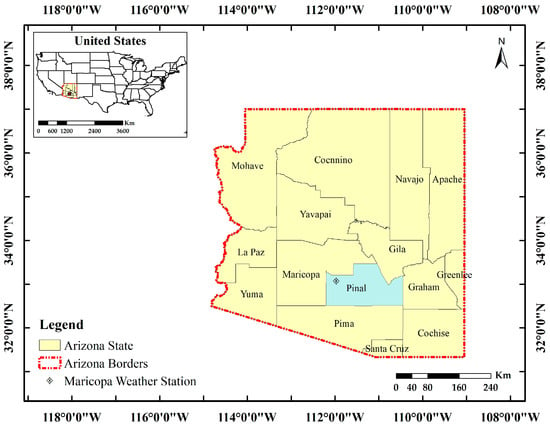
Figure 1.
Geographic location of the study area.
The general systematic framework adopted for the current study is summarized in Figure 2.
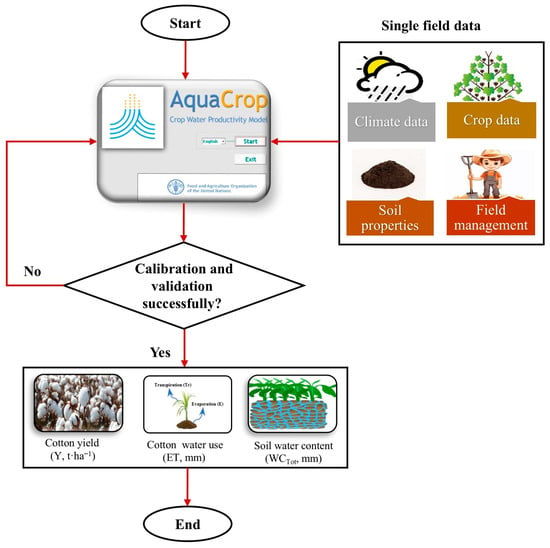
Figure 2.
General systematic framework adopted for the current study.
2.2. Soil Water and Irrigation Monitoring
Over the two growing seasons, soil water and irrigation were monitored weekly using a calibrated neutron probe (503 ELITE Hydroprobe), a subsurface measurement device designed to measure soil moisture and aid in irrigation scheduling (https://www.instrotek.com/products/503-elite-hydroprobe, Last accessed on 25 March 2025). In May 2023 and 2024, a 2.10 m-long, 51 mm diameter galvanized steel access tube was installed in the middle of each plot, sufficient to disclose any deep percolation (Figure 3).
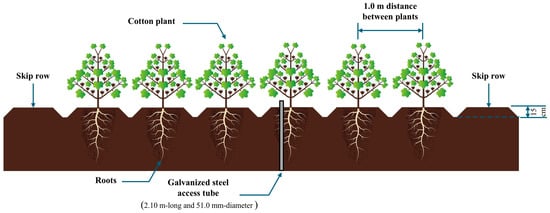
Figure 3.
Experimental plot set up.
During the installation of the access tubes, soil samples were collected from each plot (0.0–1.8 m below the soil surface, every 0.3 m) for soil chemical and physical properties as summarized in Table 1.

Table 1.
Soil properties of the experimental field.
The neutron probe data were collected for each 0.3 m layer of the soil profile to a depth of 1.8 m. For F100% (full irrigation), cotton was flood-irrigated when the average fraction (p) of total available soil water (TAW) reached 65%, refilling the soil root zone to the field capacity (FC). For the deficit irrigation treatment (F80%), irrigation occurred on the same day as F100%, but the duration of irrigation application was reduced to 80% of F100%. This approach maintains comparable phenological timing and avoids confounding differences in irrigation frequency across treatments. It also reflects on-farm practice, where growers commonly reduce application depth (or set time) rather than running entirely independent schedules for each management unit. The last irrigation application was by mid- and late August, with 17 and 14 total irrigation events in 2023 and 2024, respectively.
2.3. Cotton Water Use
At the beginning of the cotton season, crop evapotranspiration (ETc) was estimated for the first 4–5 weeks of crop establishment using the FAO56 dual crop coefficient procedures that separate Kc into soil evaporation and plant transpiration (basal) coefficients [41]:
where ETc,i is crop evapotranspiration on day i (mm), Kcb,i and Ke,i are the basal crop coefficient and soil evaporation coefficient on day i, respectively (unitless), and ETo,i is the grass reference crop evapotranspiration calculated using the FAO56 standardized Penman-Monteith equation on day i (mm).
ETc,i = ETo,i (Kcb,i + Ke,i)
The daily meteorological data, such as maximum, minimum, mean air temperature, and effective precipitation (Tmax, Tmin, Tave, and Pr, respectively), were collected from the Arizona Meteorological Network (AZMET, Maricopa, AZ, https://cals.arizona.edu/AZMET/06.htm, Last accessed on 25 May 2025), about 20 m from the experimental field. ETo was computed using the Penman-Monteith equation [41], as follows (Figure 4):
where ETo is the reference evapotranspiration (mm day−1), Rn is the net radiation at the crop surface (M·Jm−2·day−1), G is the soil heat flux density (MJ·m−2·day−1), T is the mean daily air temperature at 2 m height (°C), u2 is the wind speed at 2 m height (m·s−1), es is the saturation vapor pressure (kPa), ea is the actual vapor pressure (kPa), es − ea is the saturation vapor pressure deficit (kPa), ∆ is the slope vapor pressure curve (kPa·°C−1), and γ is the psychrometric constant (kPa·°C−1).
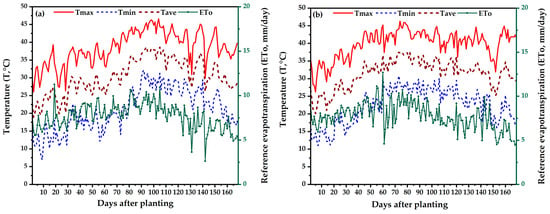
Figure 4.
Daily maximum, minimum, average temperature, and reference evapotranspiration patterns (Tmax, Tmin, Tave, ETo) during the cotton growing seasons of 2023 (a) and 2024 (b).
In May 2023 and 2024, observed cotton evapotranspiration (ETobs) was estimated using the soil water balance method, as follows [41]:
where I, Pr, Cr, DPi, and Roff are irrigation, precipitation, capillary rise, deep percolation, and runoff, respectively. ∆SWS is the average change in soil water storage (all units in mm).
ETobs = I + Pr − Cr − Dp + Roff + ∆SWS
Pr was collected from the AZMET weather station, 20 m from the experimental field. The CR was assumed as zero because of the deep groundwater table in Pinal County (https://www.azwater.gov/hydrology/depth-water-data, Last accessed on 25 May 2024). The DP was assumed to be zero because the measured soil water storage within the root zone did not exceed FC storage during the growing seasons. Roff was negligible because of basin bunds (blocked furrows) and controlled irrigation during the two seasons. ∆SWS was determined weekly using a calibrated neutron probe (503 ELITE Hydroprobe).
ET water productivity (ETWP, kg m3) was estimated as follows:
where FY is cotton fiber yield (kg ha−1) and WET is the water evapotranspired in m3 ha−1 during the growing season.
2.4. AquaCrop: Theory and Description
The AquaCrop model follows the Doorenbos and Kassam concept of “yield response to water” that was presented in FAO Irrigation and Drainage Paper No. 33 [42].
where Yact and Ymax are the actual and maximum yield, and ETact and ETmax are the actual and maximum evapotranspiration, respectively. Ky is a factor that represents the proportion between the relative reductions in both yield and evapotranspiration.
The final crop yield (Y, t·ha−1) in AquaCrop is determined as follows [43]:
where B and HIo are the cumulative dry biomass (t·ha−1) and reference harvest index, respectively. FHI is the adjustment factor of the reference harvest index due to stress.
AquaCrop can execute the simulations in two modes: (1) calendar days (CDay) and (2) growing degree-days (GDDay). In the current study, the GDDay mode was used to execute simulations, where canopy development was adjusted to the temperature regime of distinctive years.
2.5. Model Calibration and Validation
The AquaCrop model was calibrated using the 2023 experimental data, while the validation was conducted using the 2024 data. The default values of the non-conservative cotton parameters were used initially and then adjusted during the model calibration process (Table 2).

Table 2.
AquaCrop-calibrated cotton parameters.
For crop response to stress parameters, the sensitivity to water stress was considered by setting the lower and upper thresholds of canopy expansion (pexp, lower and pexp, upper), the upper threshold of stomatal closure (psto, upper), and early canopy senescence (psen, upper). Similarly, sensitivity to temperature stress was considered by setting the base (Tbase) and upper temperature (Tupper), and then the calibration was performed. The thresholds of response to water and temperature stresses are shown in Table 2.
Before model calibration, crop development parameters from day 1 after planting to: emergence, maximum canopy cover (CCx), flowering, senescence, maturity, and duration of flowering were estimated based on field observations (Table 2).
Cotton canopy cover curves, including the initial and maximum canopy cover (CCo and CCx), were estimated following the approach of Elshikha et al. [44]. Normalized water productivity (WP*) and H0 were calibrated until a good match between the observed and simulated Y was achieved.
The trial-and-error approach was used to minimize the differences between the simulated and observed data, whereas a specific input parameter was selected as a reference variable. Then, only those parameters that most affected the reference variable were adjusted. Finally, these steps were frequently repeated until the closest match between simulated and observed data was found.
2.6. Evaluation Metrics
Six statistical metrics, namely, the coefficient of determination (R2), the normalized root-mean-squared error (NRMSE), the mean absolute error (MAE), simulation error (Se), the index of agreement (Dindex), and the Nash–Sutcliffe efficiency coefficient (NSE) were used to assess AquaCrop performance.
where Obsi is the observed value, Simi is the simulated value, and n is the number of values. Obs− and Sim− are the means of observed and simulated values, respectively. The R2 close to 1.0 indicates a good match between the simulated and observed datasets. The NRMSE value ranges between 0 and ∞. The simulation is excellent if the estimation results of NRMSE 10% and good if the result ranges between 10 and 20%. A result from 20 to 30% indicates fair performance, while NRMSE > 30% indicates poor performance [45]. The MAE reflects the difference between the mean absolute value of the Sim and the Obs value. The lower the MAE value, the greater the simulation accuracy. The Se between ±15 is acceptable [46]. The R2 values reflect the strength of the simulated datasets. The Dindex values vary between 0.0 and 1.0. The Dindex = 1.0 reflects perfect agreement among the simulated and observed datasets.
3. Results and Discussion
3.1. Results of the In-Field Experiments
3.1.1. Yield-Water Relation
The results, including the fiber yield (FY, kg·ha−1), ETobs (mm), and ETWP (kg·m−3) during 2023 and 2024, are listed in Table 3. Cotton yields responded consistently to irrigation treatments during the two growing seasons, whereas the highest fiber yields were recorded under the F100% (1694 kg·ha−1 and 1456 kg·ha−1). However, decreasing the irrigation rate to 80% of ETc negatively affected cotton yield, and the FY declined by 45.2% (798 kg·ha−1) and 38.1% (1049 kg·ha−1) during 2023 and 2024, respectively (Table 3). A continuous water supply enhances the water absorption capacity of cotton roots, mitigates periodic stress, alleviates soil water stress caused by drought, and reduces yield losses due to root degradation [47]. In contrast, water stress reduces plant growth and development due to reduced turgor pressure [48], crucial for cell elongation. Moreover, it decreases node production [49,50]. Both vegetative and reproductive growth are inhibited under water stress, resulting in fewer fruiting sites and thus, accelerating maturation and lowering yields [51]. The yield reductions for water-stressed cotton were in the same range of 7.23–49.4%, as reported under moderate water stress by Cetin et al. [52] and Hu et al. [53]. Moreover, the results aligned with previous studies, which reported that plots receiving more irrigation water had higher yields than those under medium and low irrigation amounts [53,54,55].

Table 3.
Average cotton water use, fiber yield, water productivity, and fiber quality indices during 2023–2024.
Compared to F100%, there was a notable reduction in ETobs of 14.3% and 14.0% under the F80% treatments during 2023 and 2024, respectively. This resulted from soil evaporation (Es) reduction due to the drying soil surface, accompanied by a decrease in transpiration (T). As a C3 crop, cotton exposed to water stress tends to close its stomata to preserve the inner moisture content, reducing ETobs.
Despite the elevated temperatures during 2024 compared to 2023, the cotton yields increased by 3.66% (F100%) and 10.7% (F80%), while ETobs decreased by 4.09% and 3.80% for the F100% and F80% treatments, respectively. Subsequently, the highest ET WP value was recorded during the same season (0.184 kg·ha−1 under F100% in 2024). This was likely due to the notable cotton vegetative growth during 2023. Because the available sprayer during 2023 exceeded the plot dimensions (4–8 rows, 4.06–8.13 m), challenges were found in applying growth regulators to inhibit vegetative growth. The resulting larger cotton plants typically had more fruiting sites; however, the excessive vegetative growth likely limited light permeation to lower branches and reduced boll retention. More energy and resources are put into growing vegetative parts instead of reproductive parts [56,57]. In addition, excess vegetative growth leads to floral buds or bolls shedding from lower nodes and thus lower cotton yields [58,59,60]. Meanwhile, inadequate growth regulators in 2023 led to lower water productivity under the two irrigation treatments, whereas ETWP was 0.152 kg·m−3 under F100% and 0.097 kg·m−3 under F80% in 2023 (Table 3). As cotton plants develop more leaves and branches, their transpiration rate increases, leading to higher water consumption and lower water productivity.
3.1.2. Fiber Quality
Table 3 presents the effect of irrigation treatments on fiber quality indices, including micronaire (MIC, unitless), upper half mean length (UHML, mm), uniformity index (UI, mm mm−1), and fiber strength (STR, g tex−1) during the two growing seasons. The MIC decreased as irrigation decreased during 2023 (4.97 for F100% and 4.36 for F80%) and 2024 (3.72 for F100% and 3.31 for F80%). Previous studies reported conflicting responses of MIC to water stress, demonstrating that the MIC value may decrease [61], increase [62], or be unaffected [63] by irrigation increases. Our results are in agreement with Snowden et al. [64] who observed an increase in MIC with the increase in irrigation level. Moreover, our findings highlighted that MIC responses vary based on the growing environment [65], whereas a longer cotton season (2023) resulted in higher MIC values (F100% = 4.97 and F80% = 4.36). These findings are consistent with those obtained by Dağdelen et al. [66] and Pettigrew [67].
F100% improved UHML during 2023 and 2024, as compared to F80% (Table 3). This might be a result of the increased irrigation amount, which assists in preserving a higher amount of soil moisture [68], thus mitigating water stress [69]. Cotton fiber is foremost cellulose; thus, a reduction in carbon assimilation will rebate fiber growth [70]. Moreover, the plant water level affects fiber elongation as cell expansion is mainly driven by turgor [70,71]. Our results agreed with Balkcom et al. [72], Darawsheh [73], Ertek and Kanber [74], and Lascano et al. [75].
Similarly, F100% produced a more uniform and stronger fiber than F80% (Table 3), indicating UI and STR were well correlated with soil water during the two growing seasons. Similar findings were reported by Johnson et al. [76]; Pettigrew [67]; Yilmaz et al. [77].
3.2. Calibrated Cotton Parameters
The calibrated cotton parameters were notably changed under the two irrigation treatments, as listed in Table 2. Based on our field observations, the cotton growing cycle was not consistent with the default AquaCrop parameters. This was mainly because of the difference in climate and water conditions where the default cotton file was developed. Therefore, the growing cycle was adjusted from 1956 GDDay to 2162 GDDay and 1991 GDDay under F100% and F80%, respectively. Also, other growth stages were calibrated based on field observations for flood treatments, as summarized in Table 2. The CCx were 84% and 78% under the F100% and F80%, respectively. These values reached nearly the middle of the flowering stage. The maximum rooting length (Zn) changed from 1.60 m to 1.70 m, while the minimum rooting length (Zx) was unchanged (0.30 m) under the F100% and F80%, respectively. These results aligned with Elsadek [78] and Elsadek et al. [15], who reported that under water deficit conditions, plants tend to extend their roots to obtain more water and nutrients. The base and upper-temperature thresholds for Arizona cotton are 12.7 °C and 30 °C, respectively [79]. Thus, the default T Base was increased by 0.7 °C while the default Tupper was decreased by 5.0 °C during the calibration process. The Ks values varied between 0.20 and 0.75, reflecting a moderate tolerance to moderate sensitivity to water stress under the two irrigation treatments. The WP* value was set as 15 g·m−2, which was in the recommended range of 15–20 g·m−2 for C3 crops, including cotton [80]. A similar value of 15 g·m−2 was obtained by García-Vila et al. [36], Masasi et al. [81], and Tsakmakis et al. [38], who assessed AquaCrop simulations for full and deficit irrigated cotton. The calibrated HI0 varied slightly under the two flood treatments (F100% = 33.0% and F80% = 31.0%), which might be a result of the randomized in-field variations. These were consistent with Farahani et al. [35] and Masasi et al. [81], who reported HI0 values of 30 and 35 for cotton under full and deficit irrigation conditions.
3.3. Model Performance
3.3.1. Canopy Cover
Statistical metrics for simulating cotton canopy cover (CC, %) under the two irrigation treatments during 2023 and 2024 are summarized in Table 4. AquaCrop showed an excellent performance in simulating cotton CC during the two growing seasons. The R2, NRMSE, Dindex, and NSE were between 0.97 and 0.99, 8.45% and 14.36%, 0.98 and 0.99, 0.96 and 0.98, respectively (Table 4).

Table 4.
Statistical criteria for simulating cotton canopy cover (CC, %) by AquaCrop during 2023–2024.
For the 2023–2024 growing seasons, vegetative growth was hampered by deficit irrigation under F80% treatments, as evidenced by reductions in CC when compared with the full irrigation treatments (Figure 5 and Figure 6). In addition to water stress, cotton was more vulnerable to heat stress under deficit irrigation treatments (F80%), resulting in a negative effect on the cotton leaf area and lowering CC. Similar observations were reported for field crops, including cotton, under deficit irrigation and arid climate conditions, e.g., Elsadek et al. [15]; Elsadek [16]; Guo et al. [82]; Meng et al. [83]; Wei et al. [84]; Yang et al. [85].
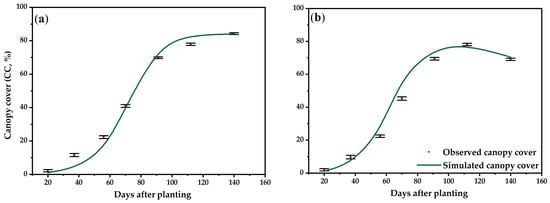
Figure 5.
Observed and simulated cotton canopy cover (CC, %) for the 2023 cotton growing season. Flood 100%, 2023 (a) and 80%, 2023 (b). Average values are presented. The error bar indicates standard deviation (SD) among the three replicates.
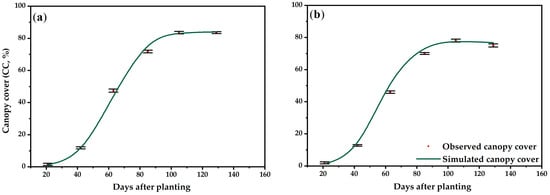
Figure 6.
Observed and simulated cotton canopy cover (CC, %) for the 2024 cotton growing season. Flood 100%, 2024 (a) and 80%, 2024 (b). Average values are presented. The error bars indicate standard deviation (SD) among the three replicates.
3.3.2. Cotton Yield
The correlation and regression equation between observed and simulated total cotton yields [fiber, cottonseed, and trash] (YTot, t·ha−1) for the 2023 and 2024 pooled data are shown in Figure 7. Overall, the evaluation metrics indicated an excellent performance of AquaCrop in simulating cotton yields during the two growing seasons. The R2, NRMSE, Dindex, and NSE for pooled yield data were 0.93, 8.05%, 0.95, and 0.78, respectively. The model simulated cotton yields with MAE 0.05–0.41 t·ha−1 and Se 1.61–14.6%, indicating a general tendency to overestimate cotton yields under the two irrigation treatments during 2023 and 2024 (Table 5).
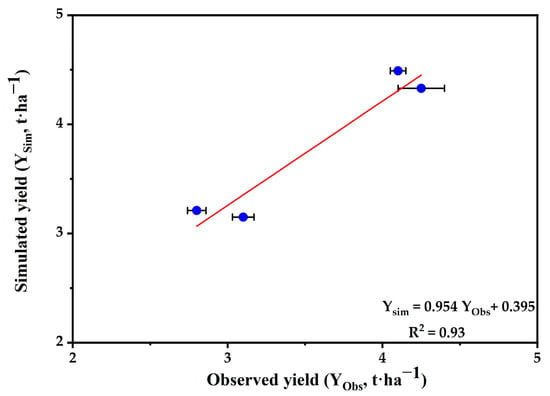
Figure 7.
The correlation (R2) and regression equation between observed (Obs) and simulated (Sim) total cotton yields (Y, t·ha−1) for the 2023 and 2024 pooled data on average. R2 > 0.5 indicates a good correlation between Obs and Sim values. The error bars indicate standard deviation (SD) among the three replicates.

Table 5.
Statistical criteria and regression equation between observed and simulated total cotton yields (YTot, t·ha−1) by AquaCrop during 2023–2024.
Based on our analysis, the highest deviations were recorded during 2023, whereas Se was 14.6% close to the maximum limit (15%) recommended by Brisson et al. [46] for the crop simulation models. This was due to excess vegetative growth in 2023, resulting in lower cotton yields [58,59,60] and thus increased simulation errors, especially for the F80% treatment. Our statistical results aligned with many peer-reviewed studies that simulated cotton yields under full and deficit irrigation using AquaCrop (e.g., Farahani et al. [35], García-Vila et al. [36], Masasi et al. [81], and Tsakmakis et al. [38]).
3.3.3. Water Use
For the 2023 and 2024 seasons, observed and simulated cotton evapotranspiration are shown in Figure 8 and Figure 9. AquaCrop simulated ETobs acceptably under the two irrigation treatments during the two growing seasons, whereas NRMSE ranged between 21.52 and 25.01 (Table 6) with R2 values between 0.61 and 0.72 (Figure 8 and Figure 9) under the two irrigation treatments during the growing seasons. Yet, there was a general tendency for AquaCrop to overestimate the ETobs under F100% and F80% consistently. MAE values were 23.58–50.08 mm, with acceptable Se between 2.87% and 6.07%, reflecting a good match between ETobs and ETSim under two irrigation treatments in 2023 and 2024. This overestimation might be a result of errors in estimating the adjusted basal crop coefficients (KcTr,x) by the model. The KcTr,x is extremely correlated to the canopy cover curve, thus less influenced by water stress and leading to overestimation of plant transpiration. Similarly, Es is underestimated because it is also dependent on the canopy cover curve. However, the cumulative ET during the growing season could be simulated quite well, as the overestimated T is compensated by the underestimation of Es. Therefore, it is recommended to revise the ET partition in AquaCrop using the proposed approaches in FAO56 [86].
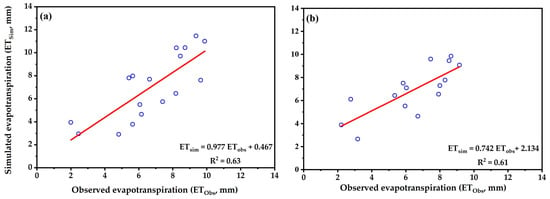
Figure 8.
Observed and simulated cotton evapotranspiration (ET, mm) for the 2023 cotton growing season. Flood 100%, 2023 (a) and 80%, 2023 (b). R2 > 0.5 indicates a good correlation between observed (Obs) and simulated (Sim) cotton evapotranspiration.
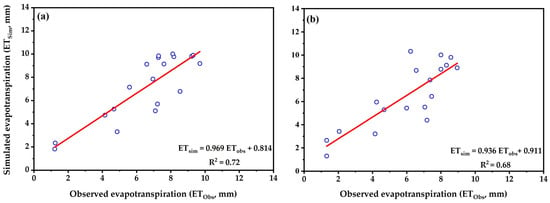
Figure 9.
Observed and simulated cotton evapotranspiration (ET, mm) for the 2024 cotton growing season. Flood 100%, 2024 (a) and 80%, 2024 (b). R2 > 0.5 indicates a good correlation between observed (Obs) and simulated (Sim) cotton evapotranspiration.

Table 6.
Statistical indicators in simulating total yield (YTot, t·ha−1), water use (ETobs, mm), and total water content (WCTot, mm) during 2023 and 2024.
Compared with 2024, the highest simulation errors of 5.22% under F100% and 6.07% under F80% might be a result of the extensive vegetation growth, which was not considered by AquaCrop. Under extensive vegetation growth, cotton plants develop more leaves and branches, and their transpiration rate increases, leading to higher water consumption. Similar ET simulation errors were reported by Farahani et al. [35] for cotton (2.1% to 10.2%), Heng et al. [87], and Raja et al. [88] for maize (0.9% to 8.4%).
3.3.4. Total Soil Water Content
AquaCrop performed well in simulating total water content (WCTot, mm) in the soil profile of 1.70 m during the two growing seasons, except for the F80% in 2023, in which the model performance was poor (Table 6 and Figure 10 and Figure 11). The average NRMSE ranged between 7.25 and 27.92 under the two irrigation treatments during 2023–2024 (Table 6).
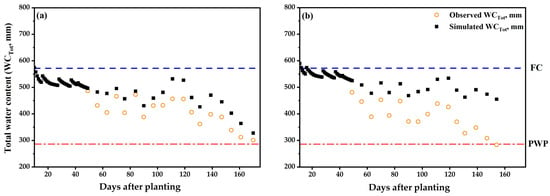
Figure 10.
Observed and simulated total water content (WCTot, mm) in the soil profile of 1.70 m during the 2023 cotton growing season. Flood 100%, 2023 (a) and 80%, 2023 (b). FC and PWP refer to field capacity and permanent wilting point, respectively.
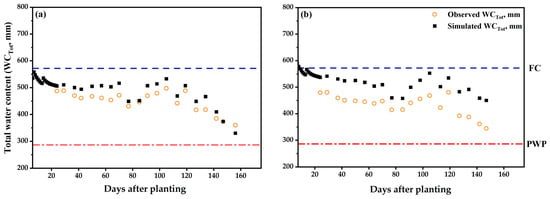
Figure 11.
Observed and simulated total water content (WCTot, mm) in the soil profile of 1.70 m during the 2024 cotton growing season. Flood 100%, 2024 (a); and 80%, 2024 (b). FC and PWP refer to field capacity and permanent wilting point, respectively.
For the two growing seasons, the model consistently simulated the trend of soil wetting and drying cycles due to irrigation events, yet the simulated values deviated from the observed values. The model showed a general tendency to overestimate WCTot, whereas MAE ranged between 26.75 mm and 103.09 mm in 2023 and 2024. The Se on average were between 5.97% and 26.38% during the two growing seasons. The deviation exceeded 15%, as recommended by Brisson et al. [46] for crop simulation models, reflecting a poor match between the observed and simulated WCTot under the F80% treatment in 2023 (Table 6).
The highest simulation errors during 2023 might be a result of the extensive vegetation growth, which was not considered by AquaCrop. Under extensive vegetation growth, cotton plants develop more leaves and branches, and their transpiration rate increases, leading to higher water consumption and lower WCTot. Another potential reason is the overestimated transpiration due to the errors in estimating adjusted basal crop coefficients, accompanied by the underestimation of soil evaporation. Additionally, the inexact simulation of root expansion, whereas the model simulates root development as an empirical formula in time and maximum effective rooting depth. Therefore, it is recommended to add some parameters to the estimation of root distribution in AquaCrop, like root density or specific root depth [89]. Similar overestimations of WCTot were reported for different crops, such as cotton [35,89,90], Maize [86], and soybeans [91] using the AquaCrop model.
3.4. Recommendations and Outlooks
While the study provides valuable insights into cotton water use and yield under full irrigation and a moderate deficit level that farmers in the region could realistically adopt, future studies on a broader range of irrigation levels would facilitate a more comprehensive assessment of cotton response to water scarcity. Moreover, future studies addressing the effectiveness of adopting deficit irrigation strategies with different irrigation systems are recommended. Factors such as irrigation system costs, labor requirements, energy use, and potential market price fluctuations can influence the profitability and practical adoption of deficit irrigation strategies. Thus, incorporating such economic analyses in future studies would provide a more comprehensive evaluation, enabling growers and policymakers to make informed decisions that balance water conservation goals with economic sustainability.
On the other hand, AquaCrop consistently overestimated yields, water use, and WCTot, with some discrepancies under the 80% treatment. This might be due to the extensive vegetative growth, which was not considered by the AquaCrop model. Moreover, the overestimated transpiration was due to the errors in estimating adjusted basal crop coefficients, accompanied by the underestimation of soil evaporation. Therefore, it is recommended to revise the ET partition in AquaCrop using the proposed approaches in FAO56. Additionally, there was an inexact simulation of root expansion, where the model simulates root development as an empirical formula with time and maximum effective rooting depth. Therefore, adding some parameters to the estimation of root distribution in AquaCrop, like root density or specific root depth, could improve the model’s accuracy.
4. Conclusions
This study was conducted to evaluate the effect of two flood irrigation treatments on fiber yield and quality under arid climate conditions in Maricopa, Pinal County, Arizona, USA. Then, the feasibility of AquaCrop in simulating cotton yield, water use, and total soil water content (WCTot) was assessed under full and deficit flood irrigation during the 2023 and 2024 growing seasons. Results demonstrate that decreasing the irrigation rate to 80% of cotton evapotranspiration (ETc) negatively affected cotton fiber yield and ET water productivity (ETWP). Moreover, the inhibited vegetative growth under water stress resulted in fewer fruiting sites, thus accelerating maturation and lowering yields. Therefore, maintaining a 100% ETc water supply under flood irrigation is recommended to enhance the water absorption of cotton roots, mitigate periodic stress, alleviate soil water stress caused by drought, reduce yield losses, and thus increase ETWP. Meanwhile, AquaCrop consistently overestimated yields, water use, and WCTot, with acceptable model performance overall, except for WCTot under the 80% treatment in 2023. This was possibly due to model limitations in accounting for vegetative growth, root expansion, and soil evaporation. Considering the model’s limitations and its overall performance, our results highlighted the potential of using AquaCrop for irrigation management and climate impact projections under arid climate conditions, particularly in Arizona.
Author Contributions
Conceptualization, E.A.E. and D.E.M.E.; methodology, E.A.E., S.A. and D.E.M.E.; software, E.A.E.; validation, E.A.E., R.N., D.J.H., K.R.T. and D.E.M.E.; investigation, E.A.E., S.A., P.W., R.N., D.J.H. and D.E.M.E.; data curation, E.A.E., S.A., P.W., R.N., D.J.H., K.R.T. and D.E.M.E.; writing—original draft preparation, E.A.E.; writing—review and editing, E.A.E., S.A., P.W., R.N., D.J.H., C.W., E.O., K.R.T. and D.E.M.E.; visualization, E.A.E.; supervision, D.E.M.E.; project administration, D.E.M.E.; funding acquisition, C.W., E.O., K.R.T. and D.E.M.E. All authors have read and agreed to the published version of the manuscript.
Funding
This research was funded by the Agricultural Research Service of the U.S. Department of Agriculture and carried out in collaboration with the Arid Land Agricultural Research Center. Additionally, it was supported by the University of Arizona Cooperative Extension Service, The University of Arizona, Tucson, AZ 85721, USA. We greatly appreciate their support for irrigation research in arid regions such as Arizona.
Data Availability Statement
The original contributions presented in this study are included in the article. Further inquiries can be directed to the corresponding author(s).
Acknowledgments
The authors would like to acknowledge Alvin Onyango, Chayton Olivieri, Barbra Bruno, Jay Subramani, Laura Olivieri, Amber Hennigar, Emily Loper, Paige Hennigar, and Oterias Hammann for their assistance with data collection. We greatly appreciate the Agricultural Research Service of the U.S. Department of Agriculture, the Arid Land Agricultural Research Center, and the University of Arizona Cooperative Extension Service for supporting irrigation research in arid regions such as Arizona.
Conflicts of Interest
The authors declare that they have no known competing financial interests or personal relationships that could have appeared to influence the work reported in this study.
References
- Fang, D.D. General Description of Cotton. In Cotton Fiber: Physics, Chemistry and Biology; Fang, D.D., Ed.; Springer International Publishing: Cham, Switzerland, 2018; pp. 1–11. ISBN 978-3-030-00871-0. [Google Scholar]
- Qin, H.; Tang, Y.; Li, X.; Qiu, Y.; Wang, J.; Han, Y.; Wang, G.; Xiong, S.; Xin, M.; Du, W.; et al. A 5-Year Field Study to Assess Interannual Variability and Determinants of Cotton Fiber Quality in Intercropping Systems. Eur. J. Agron. 2025, 171, 127817. [Google Scholar] [CrossRef]
- Chakravarthy, V.S.K.; Reddy, T.P.; Reddy, V.D.; Rao, K.V. Current Status of Genetic Engineering in Cotton (Gossypium hirsutum L): An Assessment. Crit. Rev. Biotechnol. 2014, 34, 144–160. [Google Scholar] [CrossRef] [PubMed]
- USDA-NASS 2024 State Agriculture Overview: Arizona. Available online: https://www.nass.usda.gov/Quick_Stats/Ag_Overview/stateOverview.php?state=ARIZONA (accessed on 4 April 2025).
- Elshikha, D.M.; Attalah, S.; Waller, P.M.; Hunsaker, D.J.; Thorp, K.R.; Williams, C. Guayule Germination and Growth under Subsurface Gravity Drip and Furrow Irrigation in Arizona. In Proceedings of the 2023 ASABE Annual International Meeting, Omaha, NE, USA, 9–12 July 2023; pp. 1–19. [Google Scholar]
- Attalah, S.; Elsadek, E.A.; Waller, P.; Hunsaker, D.; Thorp, K.; Bautista, E.; Williams, C.; Wall, G.; Orr, E.; Elshikha, D.E. Evaluating the Performance of OpenET Models for Alfalfa in Arizona. In Proceedings of the 2024 ASABE Annual International Meeting, Anaheim, CA, USA, 28–31 July 2024; American Society of Agricultural and Biological Engineers: St. Joseph, MI, USA, 2024; p. 1. [Google Scholar]
- Holdren, G.C.; Turner, K. Characteristics of Lake Mead, Arizona–Nevada. Lake Reserv. Manag. 2010, 26, 230–239. [Google Scholar] [CrossRef]
- Prein, A.F.; Holland, G.J.; Rasmussen, R.M.; Clark, M.P.; Tye, M.R. Running Dry: The U.S. Southwest’s Drift into a Drier Climate State. Geophys. Res. Lett. 2016, 43, 1272–1279. [Google Scholar] [CrossRef]
- Castle, S.L.; Reager, J.T.; Thomas, B.F.; Purdy, A.J.; Lo, M.-H.; Famiglietti, J.S.; Tang, Q. Remote Detection of Water Management Impacts on Evapotranspiration in the Colorado River Basin. Geophys. Res. Lett. 2016, 43, 5089–5097. [Google Scholar] [CrossRef]
- Bennett, K.E.; Talsma, C.; Boero, R. Concurrent Changes in Extreme Hydroclimate Events in the Colorado River Basin. Water 2021, 13, 978. [Google Scholar] [CrossRef]
- Ayankojo, I.T.; Thorp, K.R.; Morgan, K.; Kothari, K.; Ale, S. Assessing the Impacts of Future Climate on Cotton Production in the Arizona Low Desert. Trans. ASABE 2020, 63, 1087–1098. [Google Scholar] [CrossRef]
- Elsadek, E.A.; Zhang, K.; Hamoud, Y.A.; Mousa, A.; Awad, A.; Abdallah, M.; Shaghaleh, H.; Hamad, A.A.A.; Jamil, M.T.; Elbeltagi, A. Impacts of Climate Change on Rice Yields in the Nile River Delta of Egypt: A Large-Scale Projection Analysis Based on CMIP6. Agric. Water Manag. 2024, 292, 108673. [Google Scholar] [CrossRef]
- Elnemr, M.K.; El-Sheikha, A.M.; Elsadek, E.A. Determination of Optimal Location of Soil Moisture Sensing Devices for Trickle Irrigation Systems. Misr J. Agric. Eng. 2019, 36, 157–174. [Google Scholar] [CrossRef]
- Tsakmakis, I.D.; Zoidou, M.; Gikas, G.D.; Sylaios, G.K. Impact of Irrigation Technologies and Strategies on Cotton Water Footprint Using AquaCrop and CROPWAT Models. Environ. Process. 2018, 5, 181–199. [Google Scholar] [CrossRef]
- Elsadek, E.; Zhang, K.; Mousa, A.; Ezaz, G.T.; Tola, T.L.; Shaghaleh, H.; Hamad, A.A.A.; Alhaj Hamoud, Y. Study on the In-Field Water Balance of Direct-Seeded Rice with Various Irrigation Regimes under Arid Climatic Conditions in Egypt Using the AquaCrop Model. Agronomy 2023, 13, 609. [Google Scholar] [CrossRef]
- Elsadek, E.A. Study on the In-Field Water Balance and the Projected Impacts of Climate Change on Rice Yields in the Nile River Delta. Ph.D. Thesis, Hohai University, Nanjing, China, 2023. [Google Scholar]
- Ragab, R. A Note on Water Use Efficiency and Water Productivity. Available online: http://www.water4crops.org/water-use-efficiency-water-productivity-terminology/ (accessed on 25 May 2022).
- De Miguel, Á.; Kallache, M.; García-Calvo, E. The Water Footprint of Agriculture in Duero River Basin. Sustainability 2015, 7, 6759–6780. [Google Scholar] [CrossRef]
- Karandish, F.; Šimůnek, J. An Application of the Water Footprint Assessment to Optimize Production of Crops Irrigated with Saline Water: A Scenario Assessment with HYDRUS. Agric. Water Manag. 2018, 208, 67–82. [Google Scholar] [CrossRef]
- Karandish, F.; Šimůnek, J. A Comparison of the HYDRUS (2D/3D) and SALTMED Models to Investigate the Influence of Various Water-Saving Irrigation Strategies on the Maize Water Footprint. Agric. Water Manag. 2019, 213, 809–820. [Google Scholar] [CrossRef]
- Kersebaum, K.; Kroes, J.; Gobin, A.; Takáč, J.; Hlavinka, P.; Trnka, M.; Ventrella, D.; Giglio, L.; Ferrise, R.; Moriondo, M.; et al. Assessing Uncertainties of Water Footprints Using an Ensemble of Crop Growth Models on Winter Wheat. Water 2016, 8, 571. [Google Scholar] [CrossRef]
- Thorp, K.R.; Hunsaker, D.J.; Bronson, K.F.; Andrade-Sanchez, P.; Barnes, E.M. Cotton Irrigation Scheduling Using a Crop Growth Model and FAO-56 Methods: Field and Simulation Studies. Trans. ASABE 2017, 60, 2023–2039. [Google Scholar] [CrossRef]
- Zheng, J.; Wang, W.; Ding, Y.; Liu, G.; Xing, W.; Cao, X.; Chen, D. Assessment of Climate Change Impact on the Water Footprint in Rice Production: Historical Simulation and Future Projections at Two Representative Rice Cropping Sites of China. Sci. Total Environ. 2020, 709, 136190. [Google Scholar] [CrossRef]
- Jin, C.; Huang, K.; Yu, Y.; Zhang, Y. Analysis of Influencing Factors of Water Footprint Based on the STIRPAT Model: Evidence from the Beijing Agricultural Sector. Water 2016, 8, 513. [Google Scholar] [CrossRef]
- Etedali, H.R.; Gorginpaveh, F.; Kakvand, P.; Elbeltagi, A.; Collins, B. Evaluation of Meteorological Datasets in Estimating the Water Footprint Components of Wheat and Maize (Case Study: Qazvin, Iran). AIMS Agric. Food 2024, 9, 84–107. [Google Scholar] [CrossRef]
- Andarzian, B.; Bannayan, M.; Steduto, P.; Mazraeh, H.; Barati, M.E.; Barati, M.A.; Rahnama, A. Validation and Testing of the AquaCrop Model under Full and Deficit Irrigated Wheat Production in Iran. Agric. Water Manag. 2011, 100, 1–8. [Google Scholar] [CrossRef]
- Iqbal, M.A.; Shen, Y.; Stricevic, R.; Pei, H.; Sun, H.; Amiri, E.; Penas, A.; del Rio, S. Evaluation of the FAO AquaCrop Model for Winter Wheat on the North China Plain under Deficit Irrigation from Field Experiment to Regional Yield Simulation. Agric. Water Manag. 2014, 135, 61–72. [Google Scholar] [CrossRef]
- Greaves, G.; Wang, Y.-M. Assessment of FAO AquaCrop Model for Simulating Maize Growth and Productivity under Deficit Irrigation in a Tropical Environment. Water 2016, 8, 557. [Google Scholar] [CrossRef]
- Paredes, P.; Wei, Z.; Liu, Y.; Xu, D.; Xin, Y.; Zhang, B.; Pereira, L.S. Performance Assessment of the FAO AquaCrop Model for Soil Water, Soil Evaporation, Biomass and Yield of Soybeans in North China Plain. Agric. Water Manag. 2015, 152, 57–71. [Google Scholar] [CrossRef]
- Maniruzzaman, M.; Talukder, M.S.U.; Khan, M.H.; Biswas, J.C.; Nemes, A. Validation of the AquaCrop Model for Irrigated Rice Production under Varied Water Regimes in Bangladesh. Agric. Water Manag. 2015, 159, 331–340. [Google Scholar] [CrossRef]
- Xu, J.; Bai, W.; Li, Y.; Wang, H.; Yang, S.; Wei, Z. Modeling Rice Development and Field Water Balance Using AquaCrop Model under Drying-Wetting Cycle Condition in Eastern China. Agric. Water Manag. 2019, 213, 289–297. [Google Scholar] [CrossRef]
- Stricevic, R.; Cosic, M.; Djurovic, N.; Pejic, B.; Maksimovic, L. Assessment of the FAO AquaCrop Model in the Simulation of Rainfed and Supplementally Irrigated Maize, Sugar Beet and Sunflower. Agric. Water Manag. 2011, 98, 1615–1621. [Google Scholar] [CrossRef]
- Paredes, P.; Torres, M.O. Parameterization of AquaCrop Model for Vining Pea Biomass and Yield Predictions and Assessing Impacts of Irrigation Strategies Considering Various Sowing Dates. Irrig. Sci. 2017, 35, 27–41. [Google Scholar] [CrossRef]
- Razzaghi, F.; Zhou, Z.; Andersen, M.N.; Plauborg, F. Simulation of Potato Yield in Temperate Condition by the AquaCrop Model. Agric. Water Manag. 2017, 191, 113–123. [Google Scholar] [CrossRef]
- Farahani, H.J.; Izzi, G.; Oweis, T.Y. Parameterization and Evaluation of the AquaCrop Model for Full and Deficit Irrigated Cotton. Agron. J. 2009, 101, 469–476. [Google Scholar] [CrossRef]
- García-Vila, M.; Fereres, E.; Mateos, L.; Orgaz, F.; Steduto, P. Deficit Irrigation Optimization of Cotton with AquaCrop. Agron. J. 2009, 101, 477–487. [Google Scholar] [CrossRef]
- Voloudakis, D.; Karamanos, A.; Economou, G.; Kalivas, D.; Vahamidis, P.; Kotoulas, V.; Kapsomenakis, J.; Zerefos, C. Prediction of Climate Change Impacts on Cotton Yields in Greece under Eight Climatic Models Using the AquaCrop Crop Simulation Model and Discriminant Function Analysis. Agric. Water Manag. 2015, 147, 116–128. [Google Scholar] [CrossRef]
- Tsakmakis, I.D.; Kokkos, N.P.; Gikas, G.D.; Pisinaras, V.; Hatzigiannakis, E.; Arampatzis, G.; Sylaios, G.K. Evaluation of AquaCrop Model Simulations of Cotton Growth under Deficit Irrigation with an Emphasis on Root Growth and Water Extraction Patterns. Agric. Water Manag. 2019, 213, 419–432. [Google Scholar] [CrossRef]
- Thorp, K.R. Combining Soil Water Content Data with Computer Simulation Models for Improved Irrigation Scheduling. J. ASABE 2023, 66, 1265–1279. [Google Scholar] [CrossRef]
- Elshikha, D.E.; Attalah, S.; Elsadek, E.A.; Waller, P.; Thorp, K.; Sanyal, D.; Bautista, E.; Norton, R.; Hunsaker, D.; Williams, C.; et al. The Impact of Gravity Drip and Flood Irrigation on Development, Water Productivity, and Fiber Yield of Cotton in Semi-Arid Conditions of Arizona. In Proceedings of the 2024 ASABE Annual International Meeting, Anaheim, CA, USA, 28–31 July 2024; American Society of Agricultural and Biological Engineers: St. Joseph, MI, USA, 2024; pp. 1–16. [Google Scholar]
- Allen, R.G.; Pereira, L.S.; Raes, D.; Smith, M. Crop Evapotranspiration-Guidelines for Computing Crop Water Requirements—FAO Irrigation and Drainage Paper 56; FAO: Rome, Italy, 1998. [Google Scholar]
- Doorenbos, J.; Kassam, A.H. Yield Response to Water. Irrigation and Drainage Paper 33; FAO: Rome, Italy, 1979. [Google Scholar]
- Raes, D.; Steduto, P.; Hsiao, T.; Fereres, E. Crop Water Productivity. Calculation Procedures and Calibration Guidance. AquaCrop Version 4.0; FAO, Land and Water Development Division: Rome, Italy, 2012. [Google Scholar]
- Elshikha, D.E.M.; Waller, P.M.; Hunsaker, D.J.; Dierig, D.; Wang, G.; Cruz, V.M.V.; Thorp, K.R.; Katterman, M.E.; Bronson, K.F.; Wall, G.W. Growth, Water Use, and Crop Coefficients of Direct-Seeded Guayule with Furrow and Subsurface Drip Irrigation in Arizona. Ind. Crops Prod. 2021, 170, 113819. [Google Scholar] [CrossRef]
- Jamieson, P.D.; Porter, J.R.; Wilson, D.R. A Test of the Computer Simulation Model ARCWHEAT1 on Wheat Crops Grown in New Zealand. Field Crop. Res. 1991, 27, 337–350. [Google Scholar] [CrossRef]
- Brisson, N.; Ruget, F.; Gate, P.; Lorgeou, J.; Nicoullaud, B.; Tayot, X.; Plenet, D.; Jeuffroy, M.-H.; Bouthier, A.; Ripoche, D.; et al. STICS: A Generic Model for Simulating Crops and Their Water and Nitrogen Balances. II. Model Validation for Wheat and Maize. Agronomie 2002, 22, 69–92. [Google Scholar] [CrossRef]
- Loka, D.A.; Oosterhuis, D.M.; Ritchie, G.L. Water-Deficit Stress in Cotton. Stress Physiol. Cott. 2011, 7, 37–72. [Google Scholar]
- Hsiao, T.C. Plant Responses to Water Stress. Annu. Rev. Plant Physiol. 1973, 24, 519–570. [Google Scholar] [CrossRef]
- Meeks, C.D.; Snider, J.L.; Porter, W.M.; Vellidis, G.; Hawkins, G.; Rowland, D. Assessing the Utility of Primed Acclimation for Improving Water Savings in Cotton Using a Sensor-Based Irrigation Scheduling System. Crop Sci. 2017, 57, 2117–2129. [Google Scholar] [CrossRef]
- Pace, P.F.; Cralle, H.T.; El-Halawany, S.H.M.; Cothren, J.T.; Senseman, S.A. Drought-Induced Changes in Shoot and Root Growth of Young Cotton Plants. J. Cott. Sci. 1999, 3, 183–187. [Google Scholar]
- Hearn, A.B. Water Relationships in Cotton. Outlook Agric. 1980, 10, 159–166. [Google Scholar] [CrossRef]
- Cetin, K.; Emine, K.; Remzi, E.; Kudret, B. Yield and Fiber Quality Properties of Cotton (Gossypium hirsutum L.) under Water Stress and Non-Stress Conditions. Afr. J. Biotechnol. 2011, 10, 12575–12583. [Google Scholar] [CrossRef]
- Hu, W.; Snider, J.L.; Wang, H.; Zhou, Z.; Chastain, D.R.; Whitaker, J.; Perry, C.D.; Bourland, F.M. Water-Induced Variation in Yield and Quality Can Be Explained by Altered Yield Component Contributions in Field-Grown Cotton. Field Crop. Res. 2018, 224, 139–147. [Google Scholar] [CrossRef]
- Feng, L.; Bufon, V.B.; Mills, C.I.; Hequet, E.; Bordovsky, J.P.; Keeling, W.; Boman, R.; Bednarz, C.W. Effects of Irrigation and Plant Density on Cotton Within-Boll Yield Components. Agron. J. 2010, 102, 1032–1036. [Google Scholar] [CrossRef]
- Jia, Y.; Yang, B.; Han, Y.; Wang, G.; Su, T.; Li, X.; Lei, Y.; Zhi, X.; Xiong, S.; Xin, M.; et al. Enhanced Cotton Yield and Fiber Quality by Optimizing Irrigation Amount and Frequency in Arid Areas of Northwest China. Agronomy 2024, 14, 266. [Google Scholar] [CrossRef]
- Echer, F.R.; Rosolem, C.A. Plant Growth Regulation: A Method for Fine-Tuning Mepiquat Chloride Rates in Cotton. Pesqui. Agropecuária Trop. 2017, 47, 286–295. [Google Scholar] [CrossRef]
- Trevisan, R.G.; Vilanova Júnior, N.S.; Eitelwein, M.T.; Molin, J.P. Management of Plant Growth Regulators in Cotton Using Active Crop Canopy Sensors. Agriculture 2018, 8, 101. [Google Scholar] [CrossRef]
- Cetin, O.; Bilgel, L. Effects of Different Irrigation Methods on Shedding and Yield of Cotton. Agric. Water Manag. 2002, 54, 1–15. [Google Scholar] [CrossRef]
- Ritchie, G.L. Ground-Based and Aerial Remote Sensing Methods for Estimating Cotton Growth, Water Stress, and Defoliation. Ph.D. Thesis, University of Georgia, Georgia, USA, 2007. [Google Scholar]
- Constable, G.A.; Bange, M.P. The Yield Potential of Cotton (Gossypium hirsutum L.). Field Crop. Res. 2015, 182, 98–106. [Google Scholar] [CrossRef]
- Davidonis, G.H.; Johnson, A.; Landivar, J.; Hinojosa, O. Influence of Low-Weight Seeds and Motes on the Fiber Properties of Other Cotton Seeds. Field Crop. Res. 1996, 48, 141–153. [Google Scholar] [CrossRef]
- Bradow, J.M.; Davidonis, G.H. Quantitation of Fiber Quality and the Cotton Production-Processing Interface: A Physiologist’s Perspective. J. Cott. Sci 2000, 4, 34–64. [Google Scholar]
- Booker, J.D.; Bordovsky, J.; Lascano, R.J.; Segarra, E. Variable Rate Irrigation on Cotton Lint Yield and Fiber Quality. In Proceedings of the Beltwide Cotton Conferences, San Antonio, TX, USA, 3–6 January 2006; pp. 1768–1776. [Google Scholar]
- Snowden, C.; Ritchie, G.; Cave, J.; Keeling, W.; Rajan, N. Multiple Irrigation Levels Affect Boll Distribution, Yield, and Fiber Micronaire in Cotton. Agron. J. 2013, 105, 1536–1544. [Google Scholar] [CrossRef]
- Wang, R.; Ji, S.; Zhang, P.; Meng, Y.; Wang, Y.; Chen, B.; Zhou, Z. Drought Effects on Cotton Yield and Fiber Quality on Different Fruiting Branches. Crop Sci. 2016, 56, 1265–1276. [Google Scholar] [CrossRef]
- Dağdelen, N.; Başal, H.; Yılmaz, E.; Gürbüz, T.; Akçay, S. Different Drip Irrigation Regimes Affect Cotton Yield, Water Use Efficiency and Fiber Quality in Western Turkey. Agric. Water Manag. 2009, 96, 111–120. [Google Scholar] [CrossRef]
- Pettigrew, W.T. Moisture Deficit Effects on Cotton Lint Yield, Yield Components, and Boll Distribution. Agron. J. 2004, 96, 377–383. [Google Scholar] [CrossRef]
- Meshkat, M.C.; Warner, R.R.; Workman, S. Evaporation Reduction Potential in an Undisturbed Soil Irrigated with Surface Drip and Sand Tube Irrigation. Trans. ASAE 2000, 43, 79–86. [Google Scholar] [CrossRef]
- Bucks, D.A.; Allen, S.G.; Roth, R.L.; Gardner, B.R. Short Staple Cotton under Micro and Level-Basin Irrigation Methods. Irrig. Sci. 1988, 9, 161–176. [Google Scholar] [CrossRef]
- Constable, G.A.; Bange, M.P. Producing and Preserving Fiber Quality: From the Seed to the Bale. In Proceedings of the Nature’s High-Tech Fiber-World Cotton Research Conference 4, Lubbock, TX, USA, 10–14 September 2007. [Google Scholar]
- Hearn, A.B. Response of Cotton to Nitrogen and Water in a Tropical Environment. III. Fibre Quality. J. Agric. Sci. 1976, 86, 257–269. [Google Scholar] [CrossRef]
- Balkcom, K.S.; Reeves, D.W.; Shaw, J.N.; Burmester, C.H.; Curtis, L.M. Cotton Yield and Fiber Quality from Irrigated Tillage Systems in the Tennessee Valley. Agron. J. 2006, 98, 596–602. [Google Scholar] [CrossRef]
- Darawsheh, M.K. Cotton Fiber Quality Parameters Response to Cultivation System as Influenced by Limited and Normal Irrigation. J. Food, Agric. Environ. 2010, 8, 527–530. [Google Scholar]
- Ertek, A.; Kanber, R. Effects of Different Irrigation Programs on the Quality Properties of Drip-Irrigated Cotton. KSU J. Sci. 2002, 5, 118–130. [Google Scholar]
- Lascano, R.J.; Hicks, S.K.; Baumhardt, R. Cotton Lint Yield and Fiber Quality as a Function of Irrigation Level and Termination Dates in the Texas High Plains: 1996–1998. In Proceedings of the 1999 Beltwide Cotton Conferences, Orlando, FL, USA, 3–7 January 1999; pp. 570–571. [Google Scholar]
- Johnson, R.M.; Downer, R.G.; Bradow, J.M.; Bauer, P.J.; Sadler, E.J. Variability in Cotton Fiber Yield, Fiber Quality, and Soil Properties in a Southeastern Coastal Plain. Agron. J. 2002, 94, 1305–1316. [Google Scholar] [CrossRef]
- Yilmaz, E.; Gürbüz, T.; Dağdelen, N.; Wzorek, M. Impacts of Different Irrigation Water Levels on the Yield, Water Use Efficiency, and Fiber Quality Properties of Cotton (Gossypium hirsutum L.) Irrigated by Drip Systems. Euro-Mediterr. J. Environ. Integr. 2021, 6, 53. [Google Scholar] [CrossRef]
- Elsadek, E. Use of Automatic Control to Improve the Performance of Field Irrigation Systems. Master’s Thesis, Damietta University, Damietta, Egypt, 2018. [Google Scholar]
- Brown, P.W. Heat Units. Available online: https://repository.arizona.edu/handle/10150/299154 (accessed on 17 April 2025).
- Raes, D.; Steduto, P.; Hsiao, T.C.; Fereres, E. Crop Water Productivity, Calculation Procedures and Calibration Guidance, AquaCrop Version 3.0; FAO, Land and Water Development Division: Rome, Italy, 2009. [Google Scholar]
- Masasi, B.; Taghvaeian, S.; Gowda, P.H.; Marek, G.; Boman, R. Validation and Application of AquaCrop for Irrigated Cotton in the Southern Great Plains of US. Irrig. Sci. 2020, 38, 593–607. [Google Scholar] [CrossRef]
- Guo, R.; Lin, T.; Tian, L.; Cui, J.P.; Xu, H.J. Effect of Regulated Deficit Irrigation on Photosynthesis and Chlorophyll Fluorescence Characteristics in Flowering and Boll-Forming Stages of Island Cotton. Agric. Res. Arid Areas 2015, 33, 130–134. [Google Scholar]
- Meng, Z.; Bian, X.; Liu, A.; Pang, H.; Wang, H. Effect of Regulated Deficit Irrigation on Growth and Development Characteristics in Cotton and Its Yield and Fiber Quality. Cott. Sci. 2008, 20, 39–44. [Google Scholar]
- Wei, C.; Ma, Y.; Zhang, S. Study on Deficit Irrigation Technology for Cotton Border Irrigation in Arid Area-Taking Yuli County as an Example. Water Sav. Irrig. 2012, 8, 4–8. [Google Scholar]
- Yang, B.-F.; Yang, G.-Z.; Feng, L.; Han, Y.-C.; Lei, Y.-P.; Fan, Z.-Y.; Wang, Z.-B.; Li, Y.-B. Effects of Deficit Irrigation on Cotton Growth and Water Use Efficiency: A Review. Ying Yong Sheng Tai Xue Bao = J. Appl. Ecol. 2021, 32, 1112–1118. [Google Scholar] [CrossRef]
- Paredes, P.; de Melo-Abreu, J.P.; Alves, I.; Pereira, L.S. Assessing the Performance of the FAO AquaCrop Model to Estimate Maize Yields and Water Use under Full and Deficit Irrigation with Focus on Model Parameterization. Agric. Water Manag. 2014, 144, 81–97. [Google Scholar] [CrossRef]
- Heng, L.K.; Hsiao, T.; Evett, S.; Howell, T.; Steduto, P. Validating the FAO AquaCrop Model for Irrigated and Water Deficient Field Maize. Agron. J. 2009, 101, 488–498. [Google Scholar] [CrossRef]
- Raja, W.; Kanth, R.H.; Singh, P. Validating the AquaCrop Model for Maize under Different Sowing Dates. Water Policy 2018, 20, 826–840. [Google Scholar] [CrossRef]
- Tan, S.; Wang, Q.; Zhang, J.; Chen, Y.; Shan, Y.; Xu, D. Performance of AquaCrop Model for Cotton Growth Simulation under Film-Mulched Drip Irrigation in Southern Xinjiang, China. Agric. Water Manag. 2018, 196, 99–113. [Google Scholar] [CrossRef]
- Du, Y.; Fu, Q.; Ai, P.; Ma, Y.; Pan, Y. Modeling Comprehensive Deficit Irrigation Strategies for Drip-Irrigated Cotton Using AquaCrop. Agriculture 2024, 14, 1269. [Google Scholar] [CrossRef]
- Adeboye, O.B.; Schultz, B.; Adekalu, K.O.; Prasad, K.C. Performance Evaluation of AquaCrop in Simulating Soil Water Storage, Yield, and Water Productivity of Rainfed Soybeans (Glycine max L. Merr) in Ile-Ife, Nigeria. Agric. Water Manag. 2019, 213, 1130–1146. [Google Scholar] [CrossRef]
Disclaimer/Publisher’s Note: The statements, opinions and data contained in all publications are solely those of the individual author(s) and contributor(s) and not of MDPI and/or the editor(s). MDPI and/or the editor(s) disclaim responsibility for any injury to people or property resulting from any ideas, methods, instructions or products referred to in the content. |
© 2025 by the authors. Licensee MDPI, Basel, Switzerland. This article is an open access article distributed under the terms and conditions of the Creative Commons Attribution (CC BY) license (https://creativecommons.org/licenses/by/4.0/).