Article

Response of the End of the Growing Season to Extreme Climatic Events in the Semi-Arid Grassland of Inner Mongolia

1
State Key Laboratory of Severe Weather Science and Technology (LaSW), Chinese Academy of Meteorological Sciences, Beijing 100081, China
2
Joint Eco-Meteorological Laboratory of Chinese Academy of Meteorological Sciences, Zhengzhou University, Zhengzhou 450001, China
3
Collaborative Innovation Center on Forecast Meteorological Disaster Warning and Assessment, Nanjing University of Information Science & Technology, Nanjing 210044, China
*
Author to whom correspondence should be addressed.
Agronomy 2025, 15(9), 2018; https://doi.org/10.3390/agronomy15092018
Submission received: 20 July 2025 / Revised: 20 August 2025 / Accepted: 21 August 2025 / Published: 22 August 2025
(This article belongs to the Section Grassland and Pasture Science)

Abstract

Climate change impacts on vegetation phenology, especially under extreme climate events, remain inadequately understood. Based on the Fraction of Photosynthetically Active Radiation (FPAR) from MODIS, this study extracted and investigated the end of the growing season (EOS) dynamics in semi-arid grassland of Inner Mongolia from 2003 to 2020. The relationship between the EOS and extreme climate events was examined, and the coincidence rate (CR) between these events and EOS standardized anomaly (EOSSA) was quantified. The results showed that the EOS exhibited a significant delaying trend (1.48 days/year, p < 0.05) after 2011, with its spatial distribution patterns strongly correlated with climatic gradients. Compound dry–warm events exhibited the widest spatial extent and highest frequency among all compound extreme climate events (CECEs). The impact of extreme climate events on EOSSA varied depending on climatic background. Extreme dry delayed EOSSA in colder regions but advanced it in warmer regions. CECEs exerted a stronger regulatory effect on EOSSA. Compound dry–warm events showed high CR with EOSSA (CR > 0.4), which was higher under low temperature gradients but decreased under high gradients. The result enhances our understanding of how semi-arid grassland respond to extreme climate events, aiding the improvement of phenology models.

1. Introduction

According to the Sixth Assessment Report (AR6) of the Intergovernmental Panel on Climate Change (IPCC), continued global warming has resulted in the intensification of extreme climate events in terms of their intensity, frequency, and duration [1]. At both national and global scales, observational evidence from the past three decades demonstrated a pronounced increase in the occurrence of compound dry–warm and wet–warm events, accompanied by a marked decline in compound dry–cold and wet–cold events [2,3,4]. Climate projections further indicate that by the end of the 21st century, most terrestrial regions will experience substantial increases in extreme warm, extreme dry, and compound dry–warm events [5,6]. Global-scale climate change triggers extensive regional disparities [7,8]. The regulatory effect of extreme climate events on ecosystems is contingent upon regional climatic conditions [9]. For instance, extreme precipitation enhances carbon accumulation in arid ecosystems but suppresses carbon sequestration in humid ecosystems [10]. Extreme warm (cold) events have a promoting (inhibiting) effect on vegetation growth in the eastern Tibetan Plateau, but a slightly inhibiting (promoting) effect in the western region [11]. Hence, a systematic analysis of the impacts of different types of extreme climate events on regional vegetation dynamics is crucial for enhancing our understanding of extreme climate risks and accelerating the sustainable development of regional and global vegetation ecosystems [12,13].
Vegetation phenology, which refers to the timing of periodic plant developmental stages, is highly sensitive to climate change [14]. It not only reflects sudden changes in local and short-term weather conditions but also indicates the global and long-term cumulative impacts of environmental factors. Therefore, vegetation phenology is considered a comprehensive indicator of ecosystem responses to climate change [15]. Climate change significantly influences surface energy, carbon balance, and regional climate by regulating the start of the growing season (SOS) and the end of the growing season (EOS) of vegetation [16,17]. Studies have demonstrated that extreme climate events substantially disrupt vegetation phenology [18,19,20,21]. For instance, in years with extreme warm, the budburst date of white ash trees (Fraxinus americana) in the United States was advanced by an average of 21 days compared to non-extreme heat years [22]. Research indicates that the impact of extreme climate events on vegetation phenology is more direct and severe than that of mean climate change [23]. The explanatory power of extreme climate events for EOS changes in Central Asia is nearly double that of mean climate indices [24]. The complexity and severity of the impacts of extreme climate events on vegetation phenology necessitate a deeper understanding of their effects on phenology in regions that are extremely sensitive to climate change [3]. Furthermore, investigating the mechanisms by which extreme climate events affect vegetation phenology will enhance our understanding of phenological patterns under ongoing climate change [20,24]. Nevertheless, current understanding of the mechanisms governing vegetation phenological responses to extreme climate events remains limited [25,26]. Previous studies have predominantly focused on climate-driven responses of the SOS [27,28], the dynamics of the EOS have received comparatively less scientific attention [28,29,30,31]. The EOS exhibits more complex response mechanisms to climate change than SOS, being particularly constrained by multiple environmental factors including water availability and nutrient cycling [32]. This complexity establishes EOS as a critical challenge in understanding ecosystem-climate feedbacks. Importantly, empirical evidence demonstrates that EOS variations contribute more substantially than SOS to growing season length modifications in temperate ecosystems [33]. Consequently, systematic investigation of the EOS responses to extreme climate events is essential for advancing our mechanistic understanding of terrestrial ecosystem responses to global change [34].
Conventional researches have predominantly focused on the impacts of mean climatic factors or individual extreme climate events on vegetation phenology [18,35,36,37], while the responses of vegetation phenology to compound extreme climate events have received relatively limited attention [38]. Characterized by the co-occurrence of multiple climatic drivers and/or hazard types (e.g., dry coupled with extreme warm), compound extreme events pose more complex and severe threats to both natural ecosystems and human society compared to individual extreme events [39,40,41]. Therefore, it is urgently needed to clarify the extent to which different types of extreme climate events influence vegetation phenology across specific climate zones. Existing studies have shown that temperate grasslands are particularly vulnerable to compound dry–warm events [42], and that vegetation phenology in semi-arid ecosystems exhibits the highest sensitivity to hydroclimatic events [23,43].
Accordingly, this study focused on the semi-arid grassland of Inner Mongolia to address two key questions: (1) Which types of extreme climate events—whether single including extreme dry, extreme warm, extreme wet and extreme cold, or compound events such as extreme dry–warm, extreme wet–warm, extreme dry–cold and extreme wet–cold —exert the most significant influence on the EOS? (2) How does the regulatory effect of extreme climate events on the EOS vary across different climatic backgrounds? The findings aimed to improve understanding and assessment of the impacts of extreme climate events on vegetation phenology, providing a scientific basis for mitigating adverse effects and formulating ecological conservation strategies in semi-arid regions of Inner Mongolia.

2. Materials and Methods

2.1. Study Area

The Inner Mongolia region of China features a typical temperate grassland vegetation ecosystem [44,45], with meadow steppe, typical steppe, and desert steppe accounting for 13%, 28%, and 12% of the total area, respectively [46]. Among these, the temperate typical steppe extends from east to west across the central part of Inner Mongolia and is characterized by a semi-arid climate with mean annual temperature and precipitation are 3.2 °C and 200–400 mm, respectively [19,47] (Figure 1a,b). In the study area of Xilingol League (115°13′–117°06′ E, 43°02′–44°52′ N) is predominantly characterized by following constructive species: Stipa krylovii Roshev., Leymus chinensis (Trin.) Tzvelev, Cleistogenes squarrosa (Trin.) Keng, Artemisia frigida Eichw., Allium anisopodium Ledeb and Allium tenuissimum L. (http://www.worldfloraonline.org, (accessed on 15 April 2025)). The elevation shows a spatial distribution pattern where it is lower in the eastern and western parts and higher in the southern and northern parts, ranging from 800 to 1600 m (Figure 1c). During the period from 2001 to 2022, the mean growing season temperature (GS TEM) gradually increased from east to west (Figure 1d), while the mean growing season precipitation (GS PRE) decreased from east to west (Figure 1e). Additionally, the GS PRE exhibited a spatial distribution pattern with higher precipitation in the south than in the north.

2.2. Data Sources

The land use classification data for Xilingol League were obtained from the European Space Agency (ESA) World Cover 10 m 2020 v100 product, which provided a global land cover map at 10 m resolution for the year 2020 based on Sentinel-1 and Sentinel-2 data. This product was accessed via the Google Earth Engine (GEE) platform (https://developers.google.cn, (accessed on 15 July 2023)). Meteorological data were sourced from the National Earth System Science Data Center, part of the National Science and Technology Infrastructure Platform (http://www.geodata.cn, (accessed on 10 December 2023)), and the Ecosystem Cloud Service Platform (https://em.cams.cma.cn, (accessed on 25 July 2025)), including monthly mean temperature and precipitation data from 2001 to 2022 with a spatial resolution of 0.0083° (approximately 1 km). The 1–month Standardized Precipitation Evapotranspiration Index (SPEI-1) for 2001–2020 was also acquired to characterize meteorological drought, offering a spatial resolution of 1 km [48].
In addition, the Fraction of Photosynthetically Active Radiation (FPAR) data from the Moderate Resolution Imaging Spectroradiometer (MODIS) were obtained via the GEE platform. The FPAR is a biophysical parameter that reflects the photosynthetic activity of vegetation and is closely associated with vegetation growth, carbon assimilation, and other ecological processes [49]. Compared to conventional vegetation indices (e.g., NDVI, EVI) [50], the FPAR offers more detailed biophysical insights into vegetation dynamics, making it a valuable dataset for phenological comparisons across diverse ecosystems [51]. This study aimed to apply the FPAR for monitoring vegetation phenology in the semi-arid grasslands of Inner Mongolia. The dataset spans from 2003 to 2022, with a spatial resolution of 500 m and a temporal resolution of 4 days. Given its structural link to photosynthetic capacity, the FPAR was used in this study to retrieve the EOS, following the extraction methodology outlined in Liu et al. [52]. Based on the above data sources and research objectives, the following research framework is designed (Figure 2). The following sections provide a detailed explanation of each step.

2.3. Data Analyses

2.3.1. Identification of Extreme Climate Events

A systematic analysis was conducted of the spatiotemporal characteristics of single extreme climate events (SECEs) and compound extreme climate events (CECEs) and their impacts on the EOS in the study area from 2001 to 2020. SECEs were defined as the occurrence of only one type of extreme event within the same month, whereas CECEs were defined as the simultaneous occurrence of multiple types of extreme events within the same month. Common types of SECEs include extreme warm (characterized by monthly maximum temperature), extreme cold (characterized by monthly minimum temperature), extreme wet (characterized by monthly accumulated precipitation), and extreme dry (characterized by the 1–month SPEI).
In this study, extreme climate events were identified using standardized anomaly. First, the monthly series data (during the growing season, from April to October) for each pixel were detrended to remove the influence of long-term trends [21]. Subsequently, the standardized anomaly of monthly climate variables for each pixel were calculated, using the following formula [11,21,53]:
S A i , j = X i , j mean ( X i ) std ( X i )
where SAi,j is the standardized anomaly, Xi,j represents the climate variable in month i of year j, mean(Xi) is the long-term mean value of the climate variable for month i, and std(Xi) is the standard deviation (σ) for month i.
(1)
SECEs: Extreme warm events: SAi,j of monthly maximum temperature exceeded 1.25σ; Extreme cold events: SAi,j of monthly minimum temperature below −1.25σ; Extreme wet events: SAi,j of monthly precipitation exceeded 1.5σ; Extreme dry events: SAi,j of the 1–month SPEI below −1.5σ (Table 1).
(2)
CECEs: Defined as the co-occurrence of two types of extreme events within the same month. Compound dry–warm event was identified when both extreme warm and extreme dry event occurred concurrently; Compound wet–warm event was identified when extreme warm and extreme wet event occurred concurrently; compound dry–cold event was defined when extreme dry and extreme cold event occurred concurrently; Compound wet–cold event was recognized when extreme wet and extreme cold event occurred concurrently.
CECEs = 1 , X < x 0 and Y > y 0 0 , o t h e r s
where X and Y represent the indicators for extreme dry and extreme warm, with thresholds of x0 and y0, respectively.
Similarly, an advanced EOS was defined as the EOS standardized anomaly (EOSSA) lower than −1.5σ, while a delayed EOS was defined as the EOSSA higher than 1.5σ.
To assess the differences in the intensity of the impacts between SECEs and CECEs on the EOSSA, we compared the discrepancies in the EOSSA under CECEs with those under SECEs.

2.3.2. Coincidence Rate

The coincidence rate (CR) analysis was used to assess the extreme climate events and EOSSA occurring simultaneously. In this study, the CR was defined as the ratio of the number of coinciding extreme climate events and EOSSA to the total number of extreme climate events during the period 2003–2020. A higher CR value indicated greater sensitivity of the EOS to extreme climate events. Eight types of extreme climate events were considered in relation to both delayed and advanced EOSSA. The CR ranges from 0 to 1, reflecting the degree of alignment between extreme climate events and EOSSA.
To test whether the observed associations between EOSSA and extreme climate events were not due to random chance, a permutation test was conducted. While keeping the EOSSA time series unchanged, the sequence of extreme climate events was randomly shuffled, and the CR between the shuffled extreme events and EOSSA was recalculated. This process was repeated 1000 times. The CR derived from the original (unshuffled) extreme event sequence was then compared to the distribution of CR from the shuffled sequences using a t-test (p < 0.05). Results showed that the CR calculated from the original sequence was significantly higher than that from the shuffled sequences. This provided evidence that the association between EOSSA and extreme climate events was not random [54].
CR = a b
In the formula, a represents the number of times an extreme climate event coincided with an EOSSA, and b represents the total number of occurrences of extreme climate events.

3. Results

3.1. Spatiotemporal Characteristics of the EOS

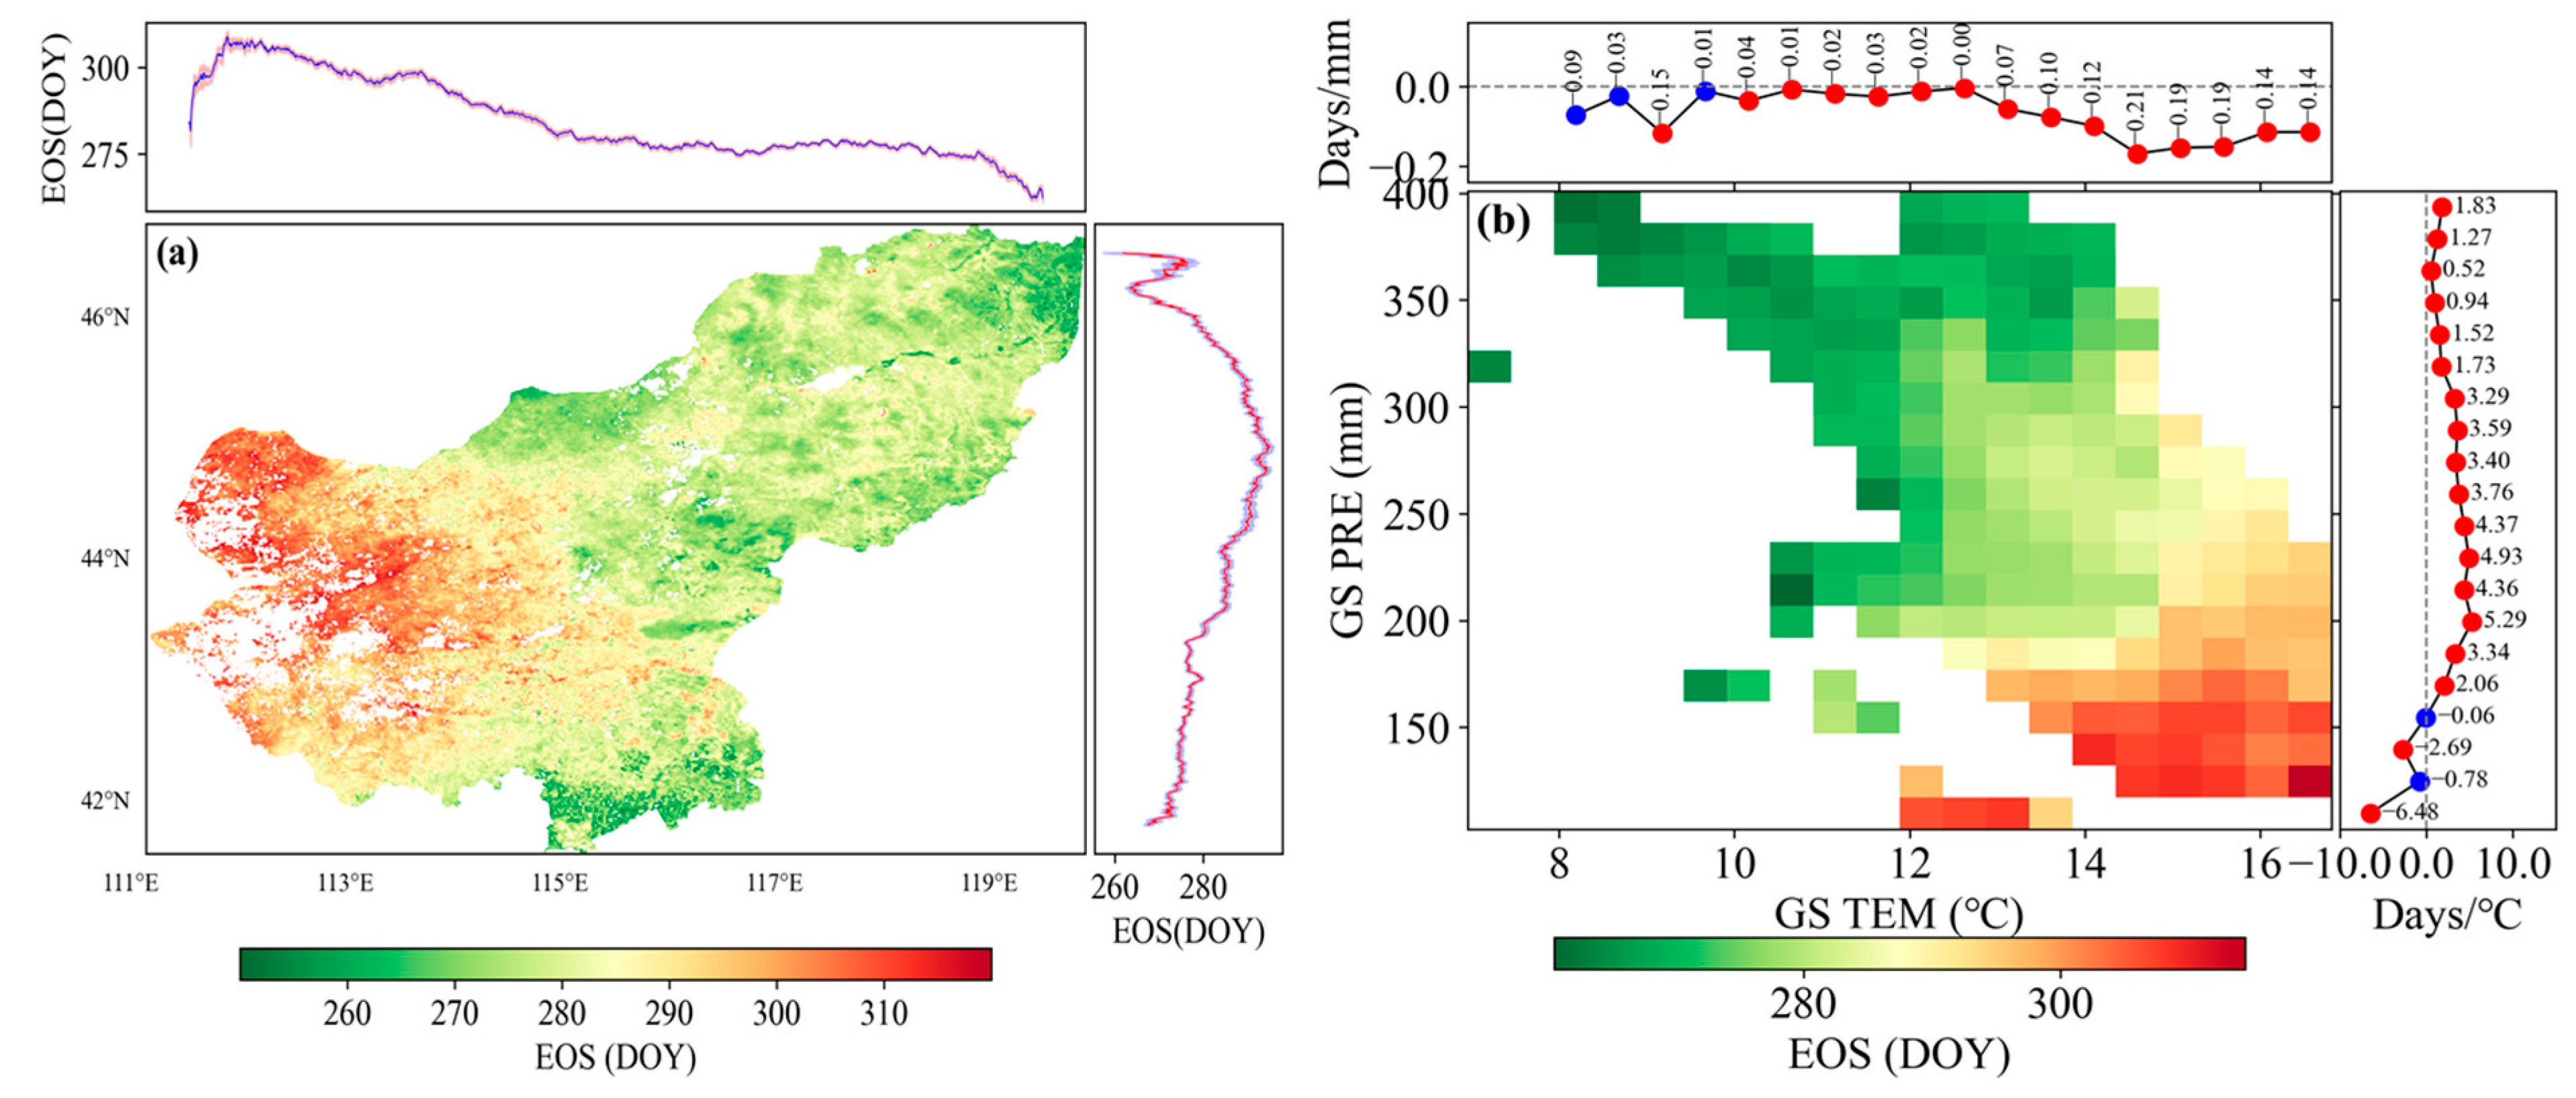
The spatial distribution characteristics of the EOS for semi-arid grassland in Xilingol League, Inner Mongolia, were shown in Figure 3a. The results indicated strong spatial heterogeneity in the mean EOS from 2003–2022, with a notable westward delay in the mean EOS from east to west along the longitudinal gradient. In the eastern and southeastern edges of Xilingol League, the mean EOS initiated in mid-to-late September, while in the western regions, it did not occur until late October, making it the latest to experience EOS. From latitudinal perspective, the mean EOS occurred earlier in both northern and southern areas.
The spatial variation in the mean EOS was closely associated with the mean temperature and cumulative precipitation during the growing season (Figure 3b). The spatial distribution of the mean EOS indicated that under climatic conditions with higher temperatures and lower precipitation during the growing season, the EOS generally occurs later. Conversely, under conditions of lower temperatures and higher precipitation, the EOS tended to occur earlier. Therefore, the spatial distribution of the mean EOS was closely linked to the temperature and precipitation.
Under a lower temperature gradient, a weak advancing effect of precipitation on the EOS was typically observed. However, under a higher temperature gradient, the EOS exhibited enhanced sensitivity to precipitation variability. A delaying effect of temperature on the EOS was generally observed. As the precipitation gradient decreases, the regulatory effect of temperature on the EOS shifted from a positive response to a negative one, ultimately leading to an earlier EOS.
The EOS for semi-arid grassland areas in Xilingol League from 2003–2022 showed an insignificantly delayed trend with notable interannual variability. Using ±1.25 standard deviations of the EOS standardized anomaly as the threshold, the EOS was anomalously delayed in 2019 and 2022, while it was anomalously advanced in 2014 and 2018 (Figure 4a). Furthermore, during 2003–2022, the EOS exhibited a non-significant delaying trend at a rate of 0.35 days/year (p > 0.05). Notably, the period after 2010 demonstrated a statistically significant delay of 1.48 days/year (p < 0.05) (Figure 4b).
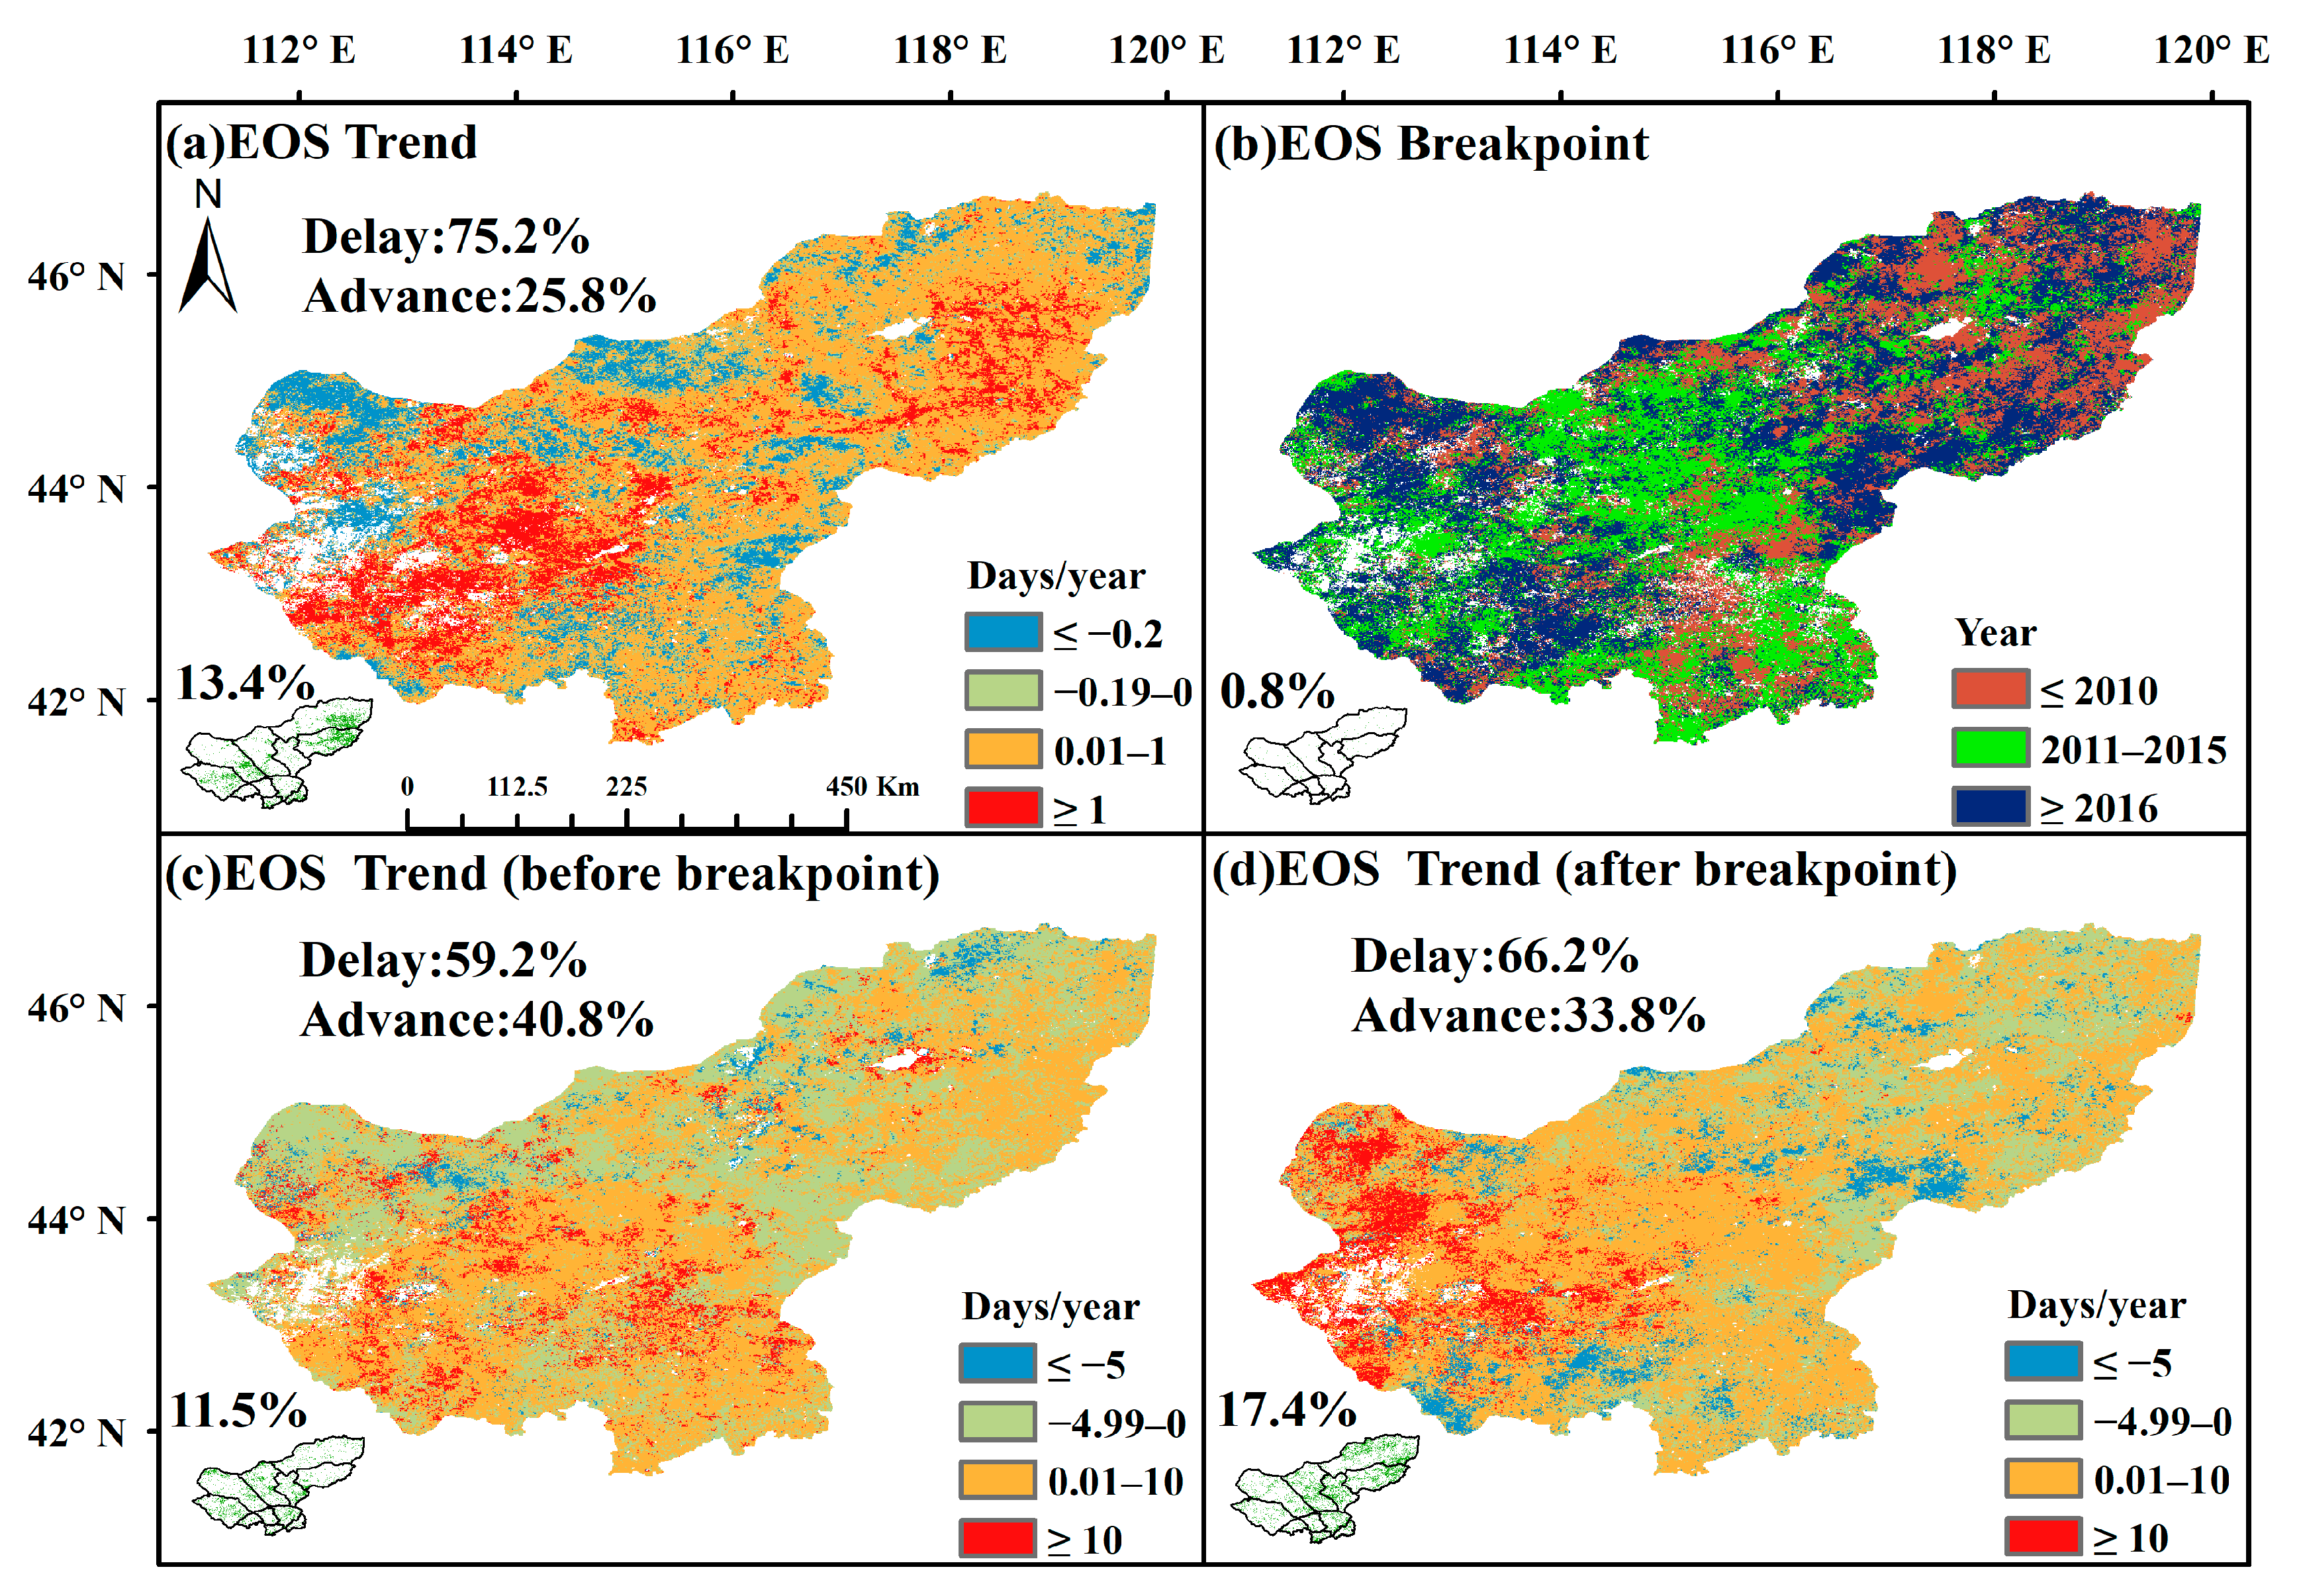
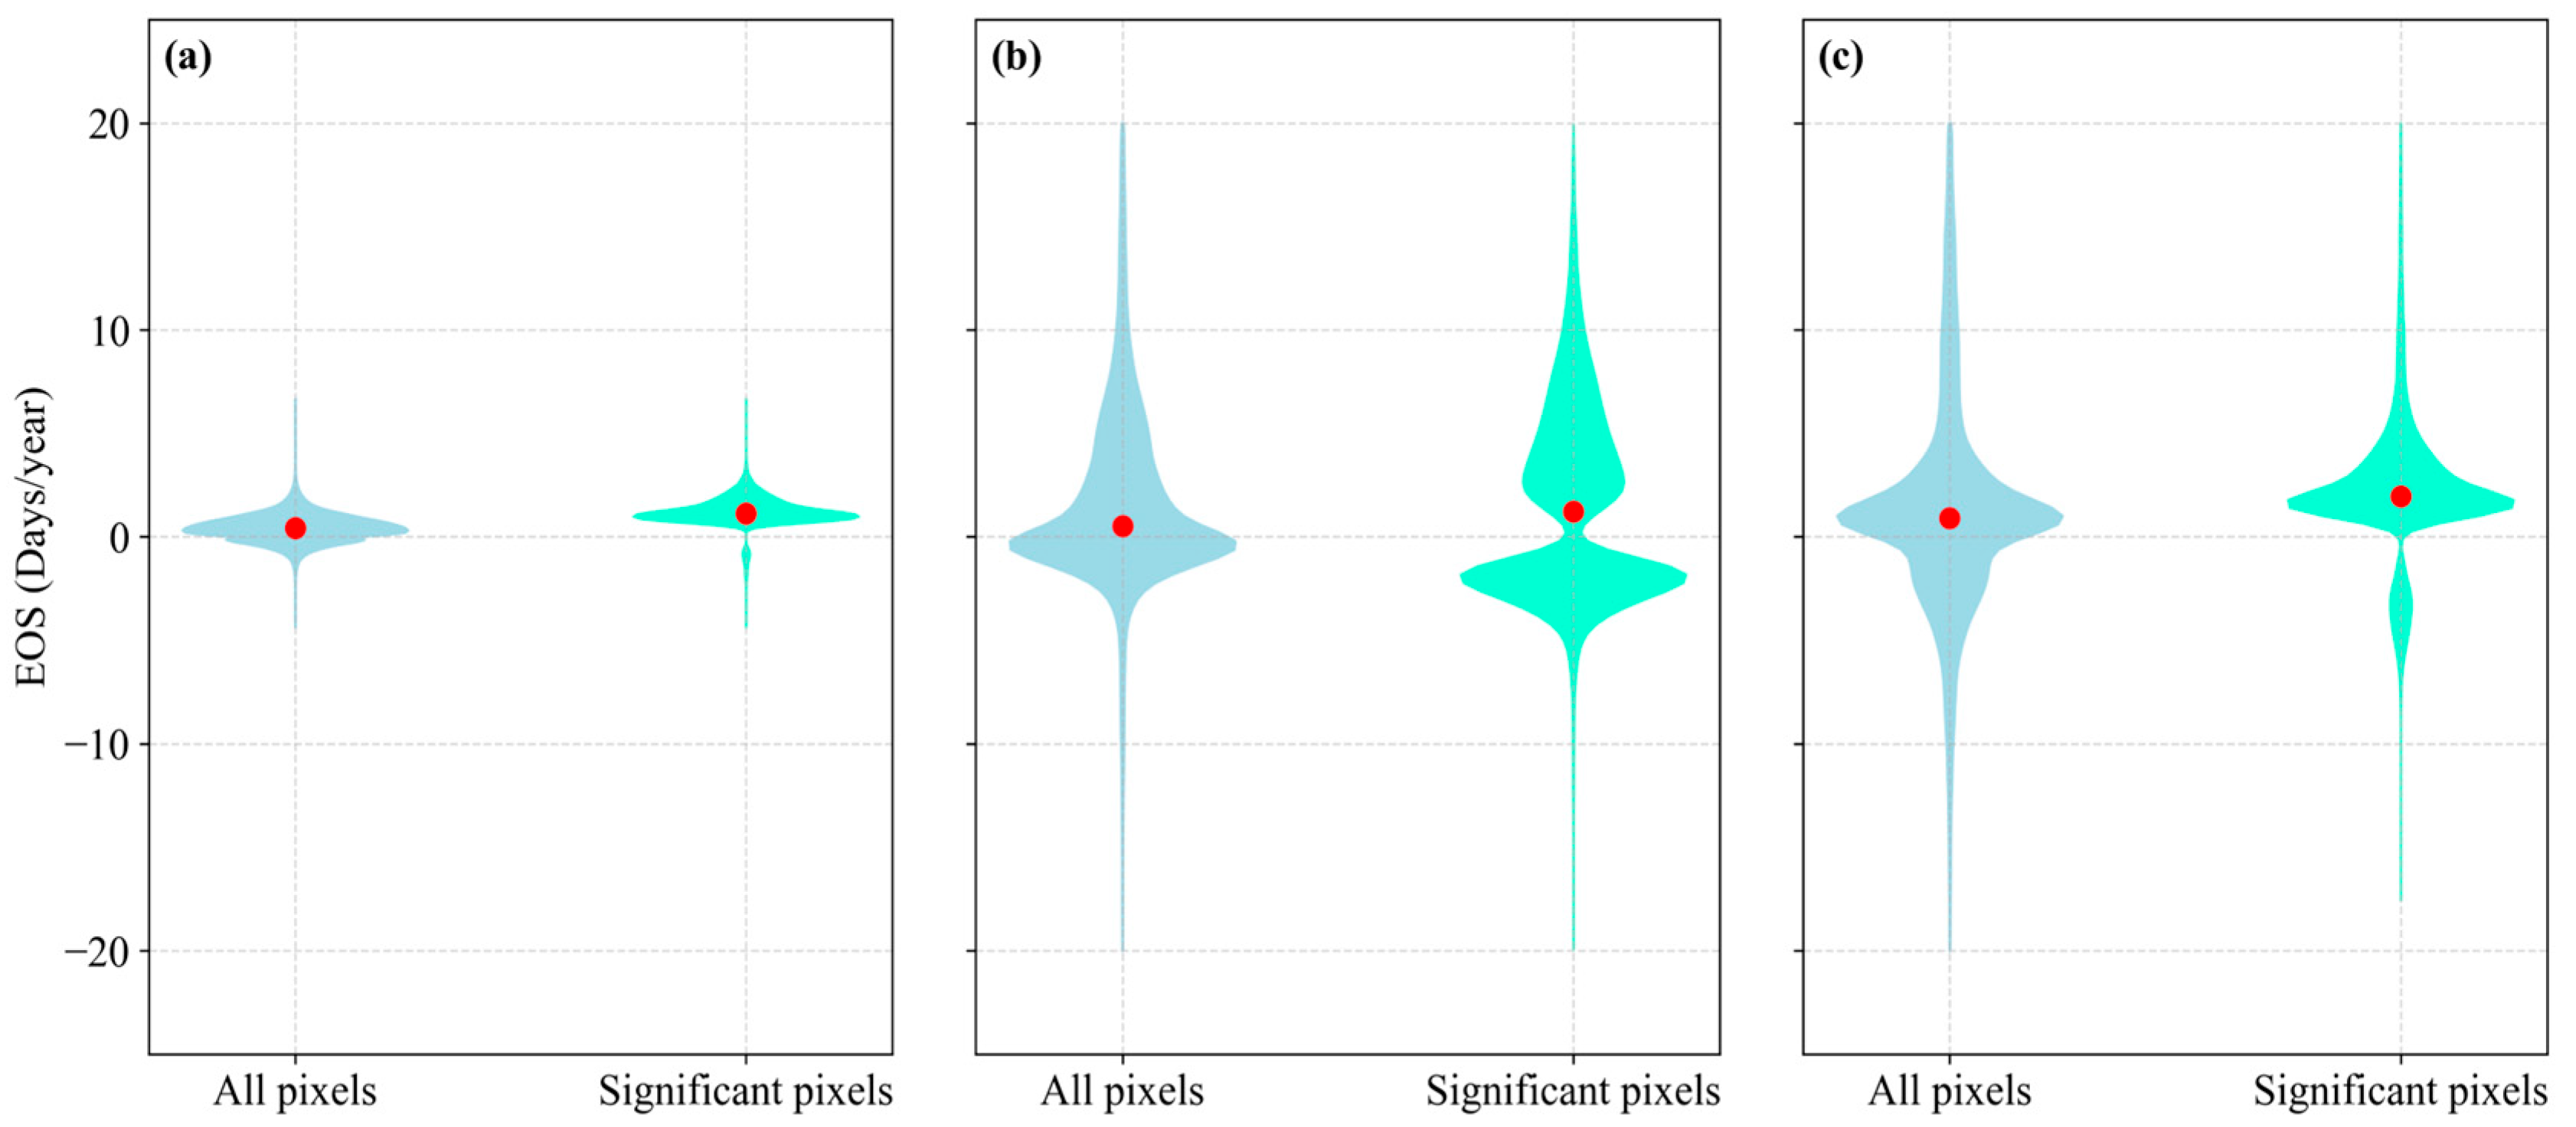
The EOS for semi-arid grassland vegetation mainly showed a delaying trend, with 75.2% of the area exhibiting a delay and 25.8% an advance. Among these, 13.4% of the pixels showed a statistically significant trend in the EOS change (p < 0.05) (Figure 5a). The significant trends were predominantly delayed (Figure 6). Furthermore, abrupt changes in the EOS were identified across the study area. A relatively high proportion of pixels experienced an abrupt change between 2011 and 2015, particularly in the central part of the study area (Figure 5b). Both before and after the abrupt change, the EOS primarily delayed (Figure 5c,d). However, before the change point, the proportions of pixels showing significant advancing and delaying trends were nearly equal (Figure 6b). After the abrupt change, the proportion of pixels with significant EOS changes increased to 17.4% (p < 0.05), and these changes were predominantly delayed (Figure 6c). In summary, the study area exhibited strong spatial heterogeneity and staged changes in the EOS. After 2010, a delayed trend of the EOS has become more pronounced.

3.2. Spatiotemporal Characteristics of Extreme Climate Events

The study area exhibited strong spatial heterogeneity in the changing rates of annual mean temperature and precipitation from 2001–2022, with both variables showing a predominant increasing trend (Figure 7). A particularly significant increase in precipitation was observed in the eastern region (p < 0.05). The temperature rise reached 0.36 °C per decade, while the precipitation increase amounted to 31.4 mm per decade. Overall, the climatic characteristics during the study period were primarily characterized by a warming and wetting trend.
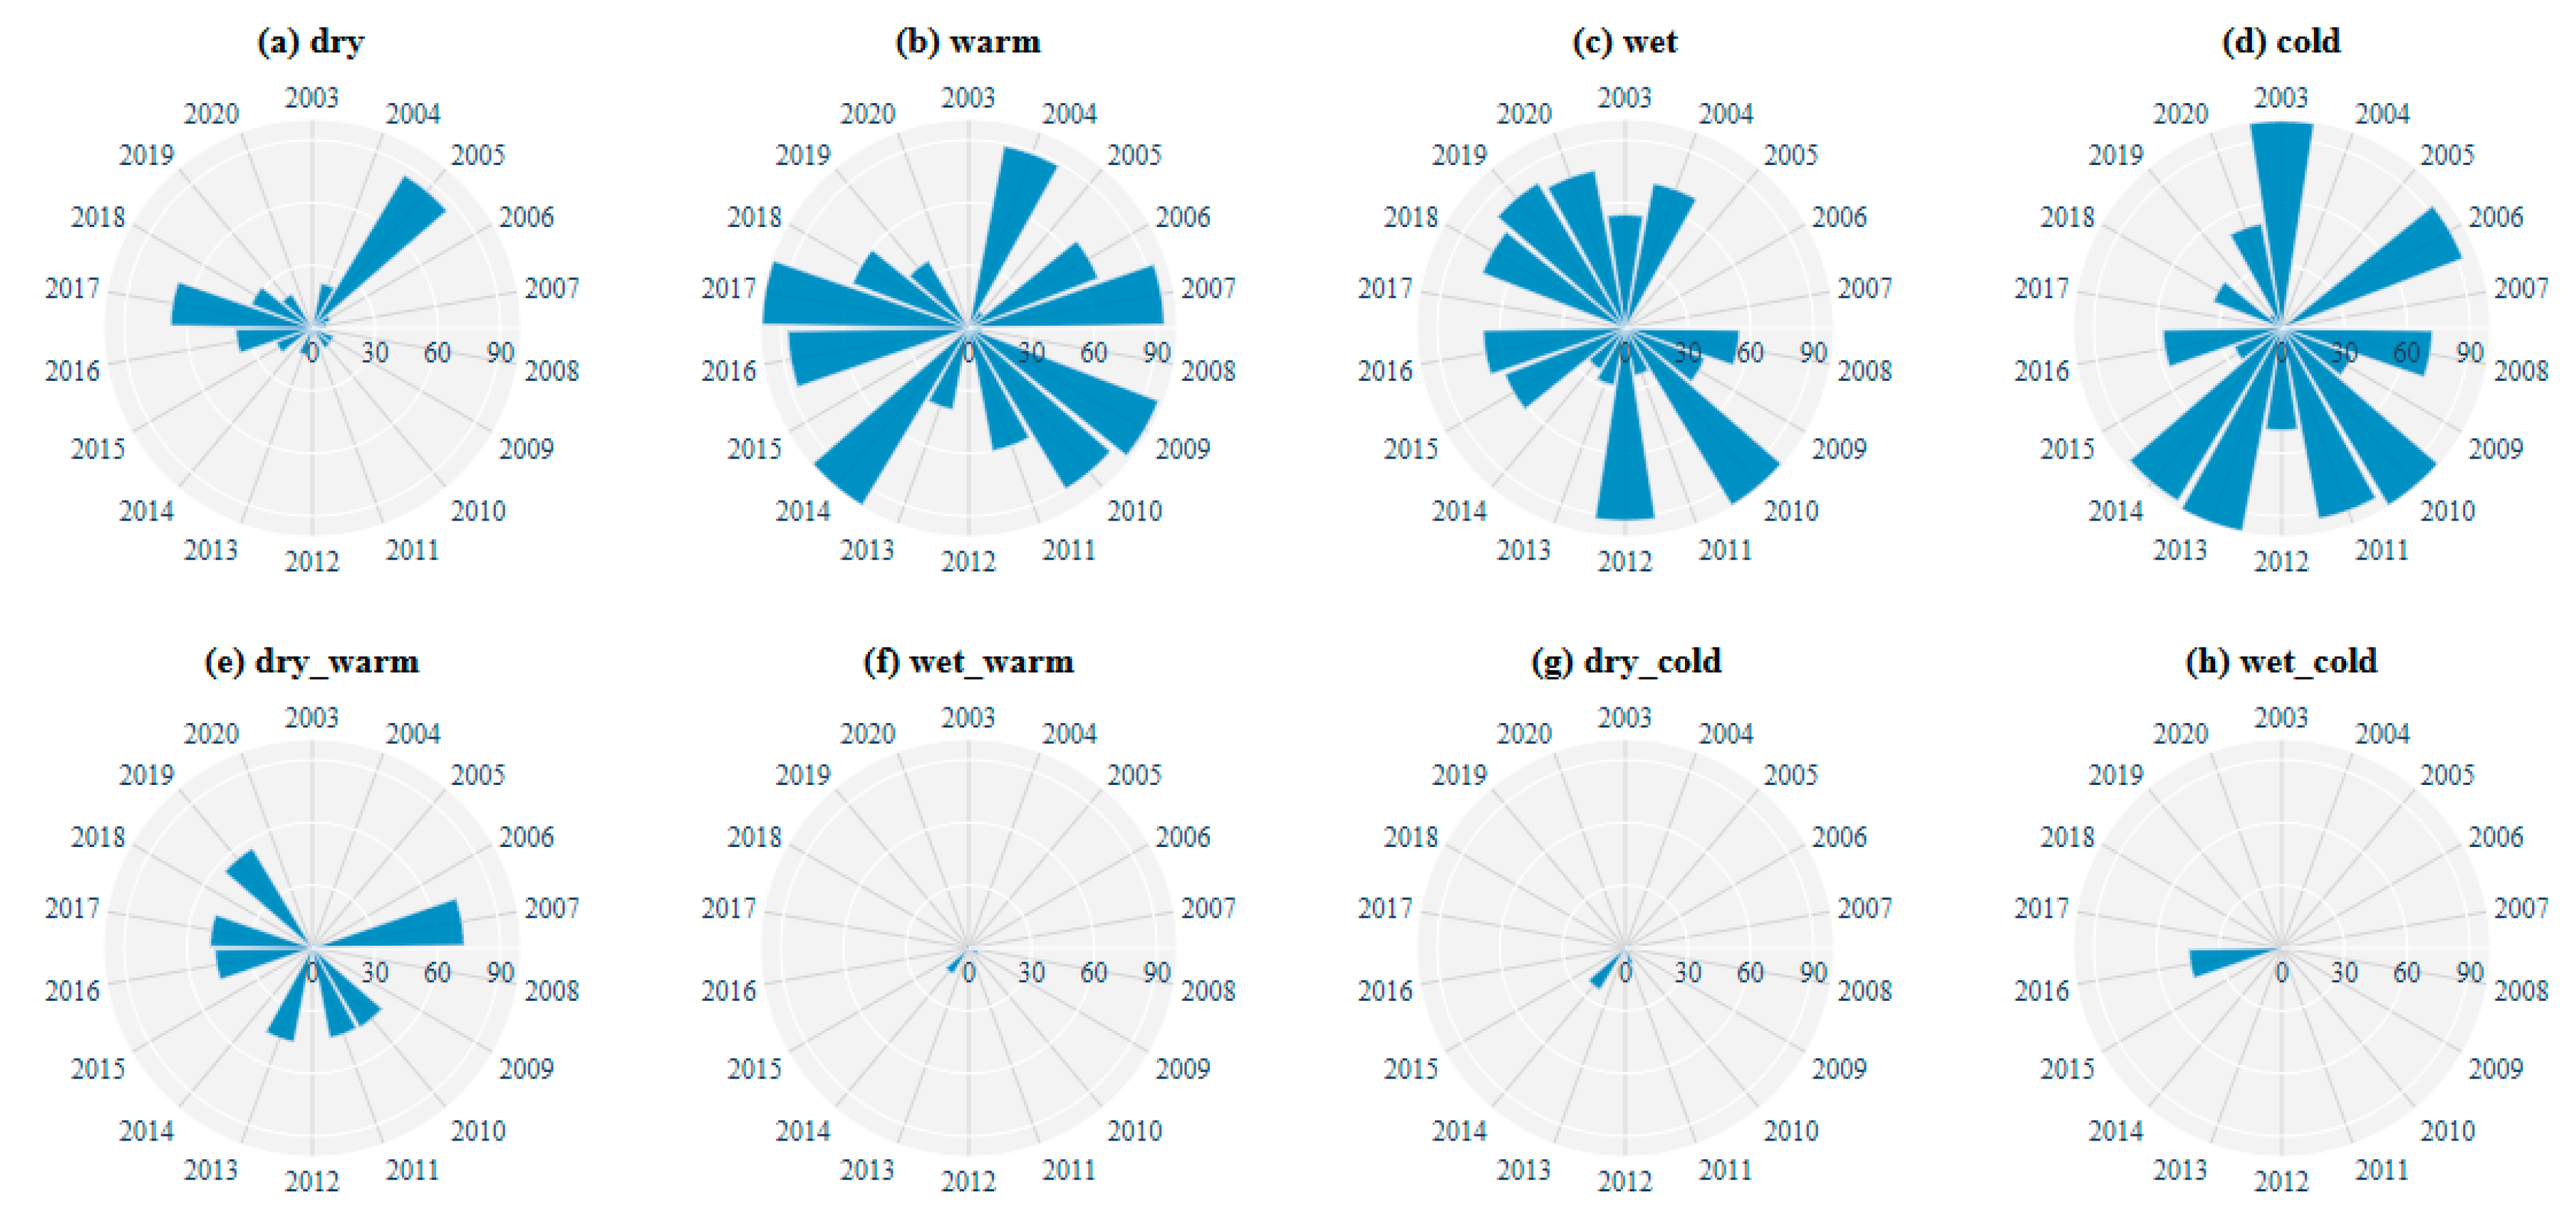
Based on the monthly climatic data, the analysis of annual frequency and areal coverage of extreme climate events in the study area were revealed (Figure 8a–d). Notably, extensive extreme dry events occurred in 2005 and 2017, affecting over 80% and 60% of the study area respectively. Extreme warm events showed particularly widespread impacts, with areal coverage exceeding 90% in multiple years (2004, 2007, 2009, 2010, 2014, 2016, and 2017). Similarly, extreme wet events covered over 90% of the area in 2010 and 2012, and exceeded 60% coverage in several other years (2004, 2015, 2016, 2018, 2019, and 2020). Extreme cold events were most prevalent during 2003–2014, with coverage surpassing 90% in 2003, 2006, 2010, 2011, 2013 and 2014. Temporal analysis showed that extreme warm events exhibited both the highest frequency and greatest spatial extent during 2003–2020, while extreme cold events were frequent prior to 2015 but decreased markedly thereafter. Conversely, extreme wet events showed a significant increase in both frequency and coverage after 2015. Distinct characteristics of CECEs were exhibited (Figure 8e–h), with compound dry–warm events being by far the most prevalent type. These events occurred in 2007, 2010, 2011, 2013, 2016, 2017 and 2019, each time affecting over 40% of the study area, with particularly extensive coverage exceeding 70% in 2007.
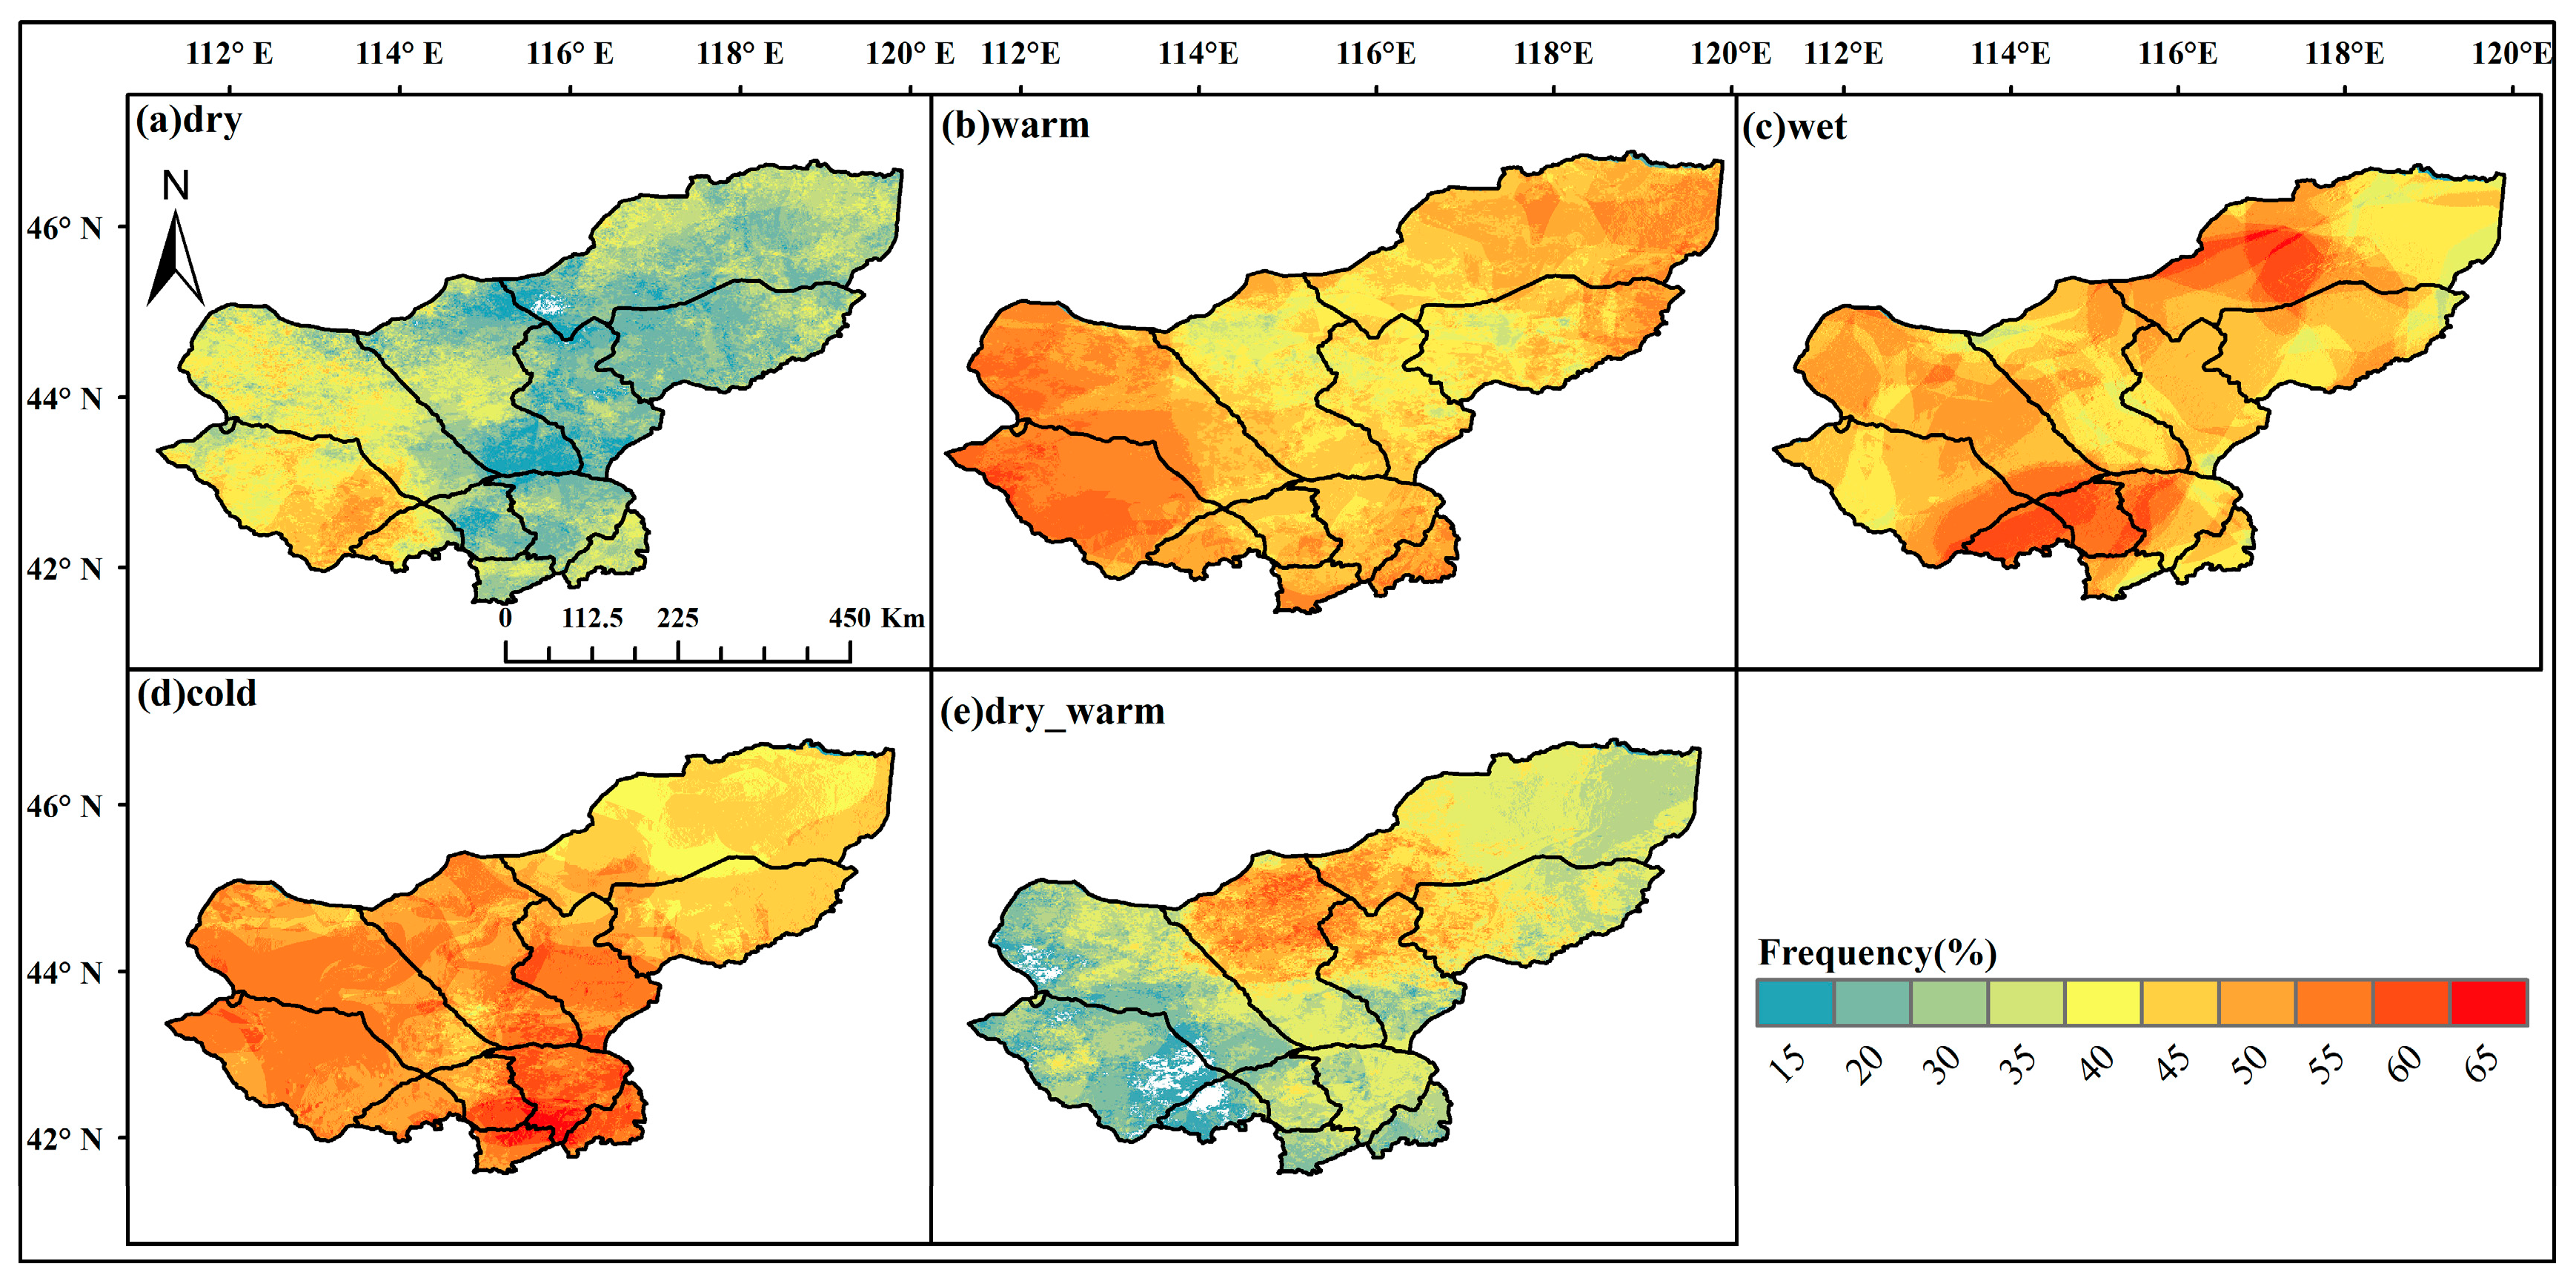
Spatially, extreme warm events were most frequent overall, occurring in more than 50% of years across both eastern and western portions of the study area (Figure 9a–d). Extreme dry showed particular concentration in the western region (>40%), while extreme wet events were most common in the south (>60%). Extreme cold events displayed no clear spatial pattern. Among compound events, dry–warm combinations were most frequent in central-eastern areas (>30%) (Figure 9e).
In summary, the annual frequency and area coverage of single extreme climate events were greater than those of compound extreme climate events (except for compound dry–warm events). Compound dry–warm events were the primary type of compound extreme climate event in the study area. During 2015–2020, there has been a reduction in extreme cold events and an increase in extreme wet events, indicating a trend towards a warming and wetting climate.

3.3. Spatial Patterns of EOSSA Under Extreme Climate Events

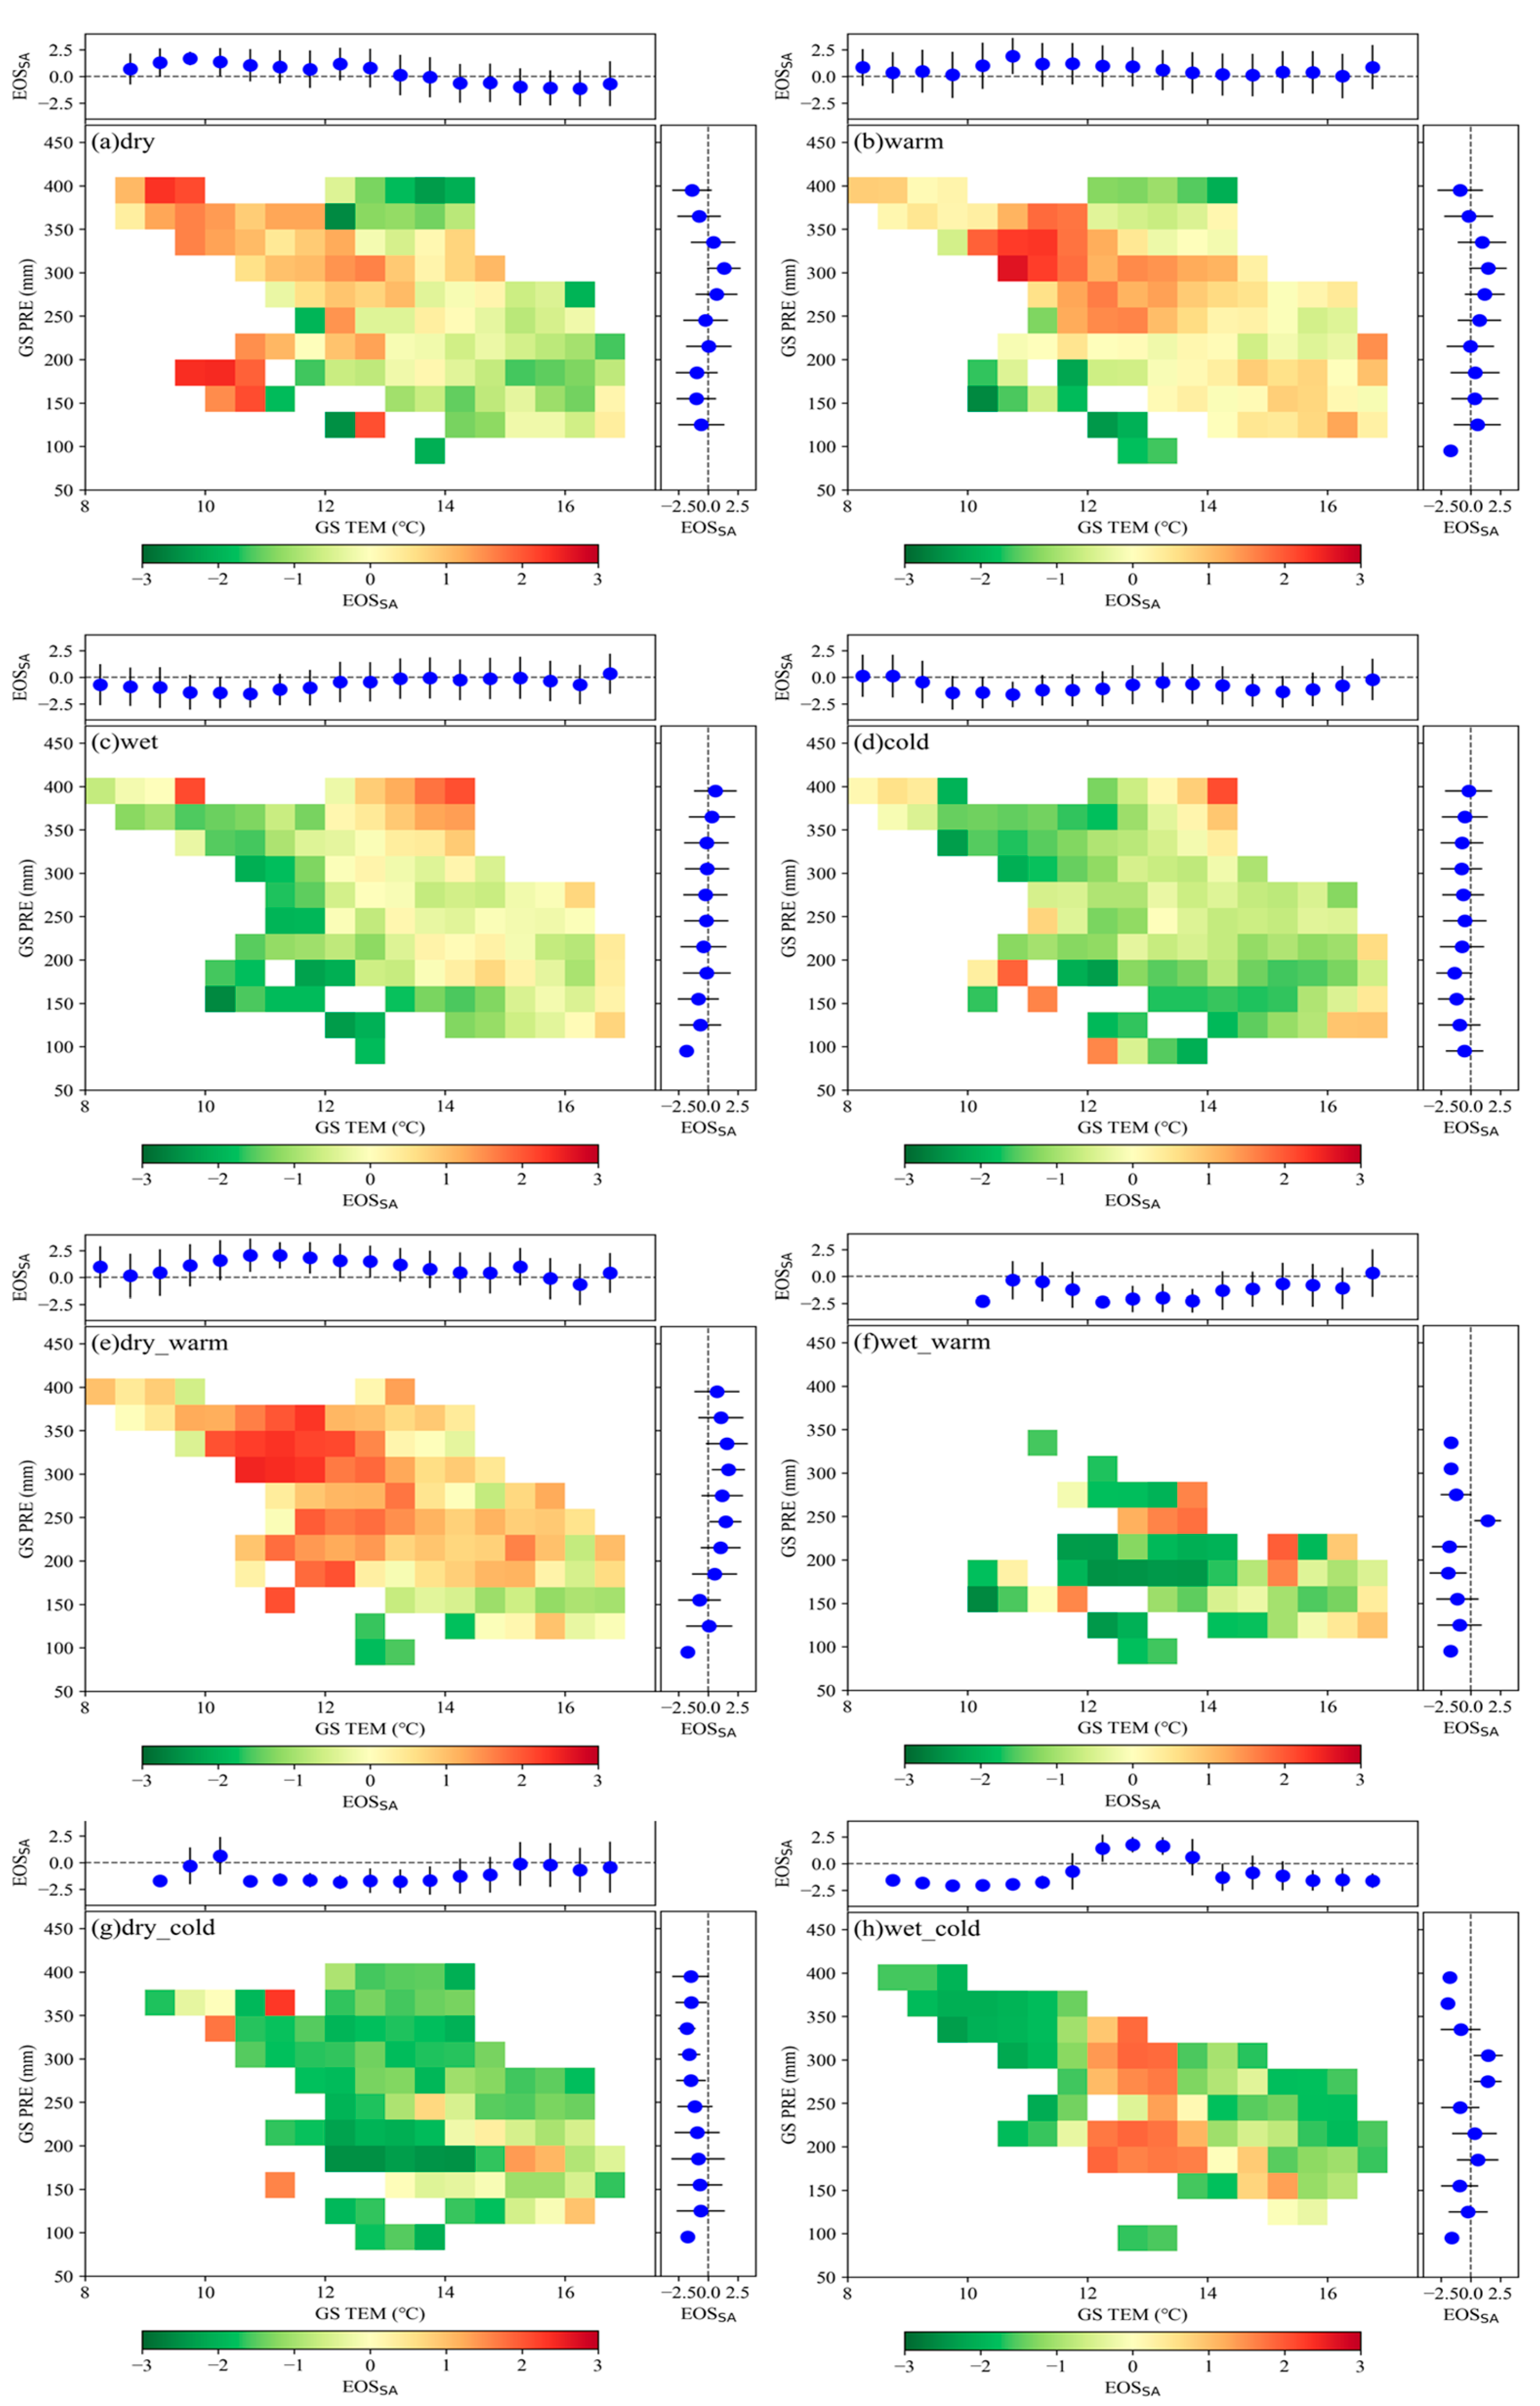
This section presented the spatial patterns of advanced (negative) and delayed (positive) EOSSA under various extreme climate events, along with their variations across temperature and precipitation gradients (Figure 10 and Figure 11). Under extreme dry conditions, the spatial heterogeneity of EOSSA was significant. In the western part of Xilingol League, extreme dry events mainly led to an advanced EOSSA, with anomalies exceeding two standard deviations. In contrast, in the eastern region, extreme dry events primarily resulted in a delayed EOSSA (Figure 10a). As the temperature gradient increased, the EOSSA shifted from positive to negative. In areas with lower precipitation, negative anomalies dominated (Figure 11a). This indicated that the impact of extreme dry on the EOSSA was modulated by the climatic background. In relatively cooler regions (eastern), extreme dry delayed EOSSA, whereas in warmer regions (western), it advanced EOSSA. Extreme warm, extreme wet, and extreme cold events occurred over broader areas. Under extreme warm conditions, the spatial pattern of EOSSA was highly heterogeneous (Figure 10b). In the eastern part of Xilingol League, extreme warm events mainly delayed EOSSA, while in the central region, they advanced it. In the western region, the effect of extreme warm on EOSSA was less clear. Across temperature and precipitation gradients, extreme warm primarily delayed EOSSA, without a clear spatial pattern (Figure 11b). Under extreme wet conditions, EOSSA were spatially heterogeneous and predominantly advanced (Figure 10c). In areas with lower mean temperatures (<13 °C), EOSSA advanced, and similarly, in areas with lower precipitation (<200 mm), EOSSA also advanced (Figure 11c). In other temperature and precipitation ranges, the impact of extreme wet events on EOSSA was minimal. Under extreme cold conditions, EOSSA were mainly advanced across the study area, especially in the central and western parts of Xilingol League, where the advance was most pronounced (Figure 10d). With increasing temperature and precipitation gradients, the advancement of EOSSA became more evident (Figure 11d). Moreover, the magnitude of the advanced EOSSA under extreme cold conditions was greater than that under extreme wet conditions.
Under compound dry–warm events, EOSSA was predominantly delayed across the study area (Figure 10e), with delays exceeding two standard deviations in the eastern region. In the western region, the area affected by compound dry–warm events decreased, and in some areas, EOSSA advanced. With increasing temperature gradient, the EOSSA response shifted from delay to slight advance, while with increasing precipitation gradient, the response shifted from advance to delay (Figure 11e). This suggested that there were threshold values in temperature and precipitation gradients that determine the direction of EOSSA under compound dry–warm events. Compound wet–warm and compound dry–cold events primarily led to advanced EOSSA (Figure 10f,g), and this advancement did not change significantly with temperature or precipitation gradients (Figure 11f,g). Under compound wet–cold events, the spatial heterogeneity of EOSSA was strong (Figure 10h). With variations in temperature and precipitation gradients, it was observed that under optimal climatic conditions, EOSSA was delayed. However, when temperature or precipitation exceeded or fell below optimal levels, EOSSA was generally advanced (Figure 11h). This suggested that the regulatory mechanisms of compound wet–cold events on the EOSSA were more complex.
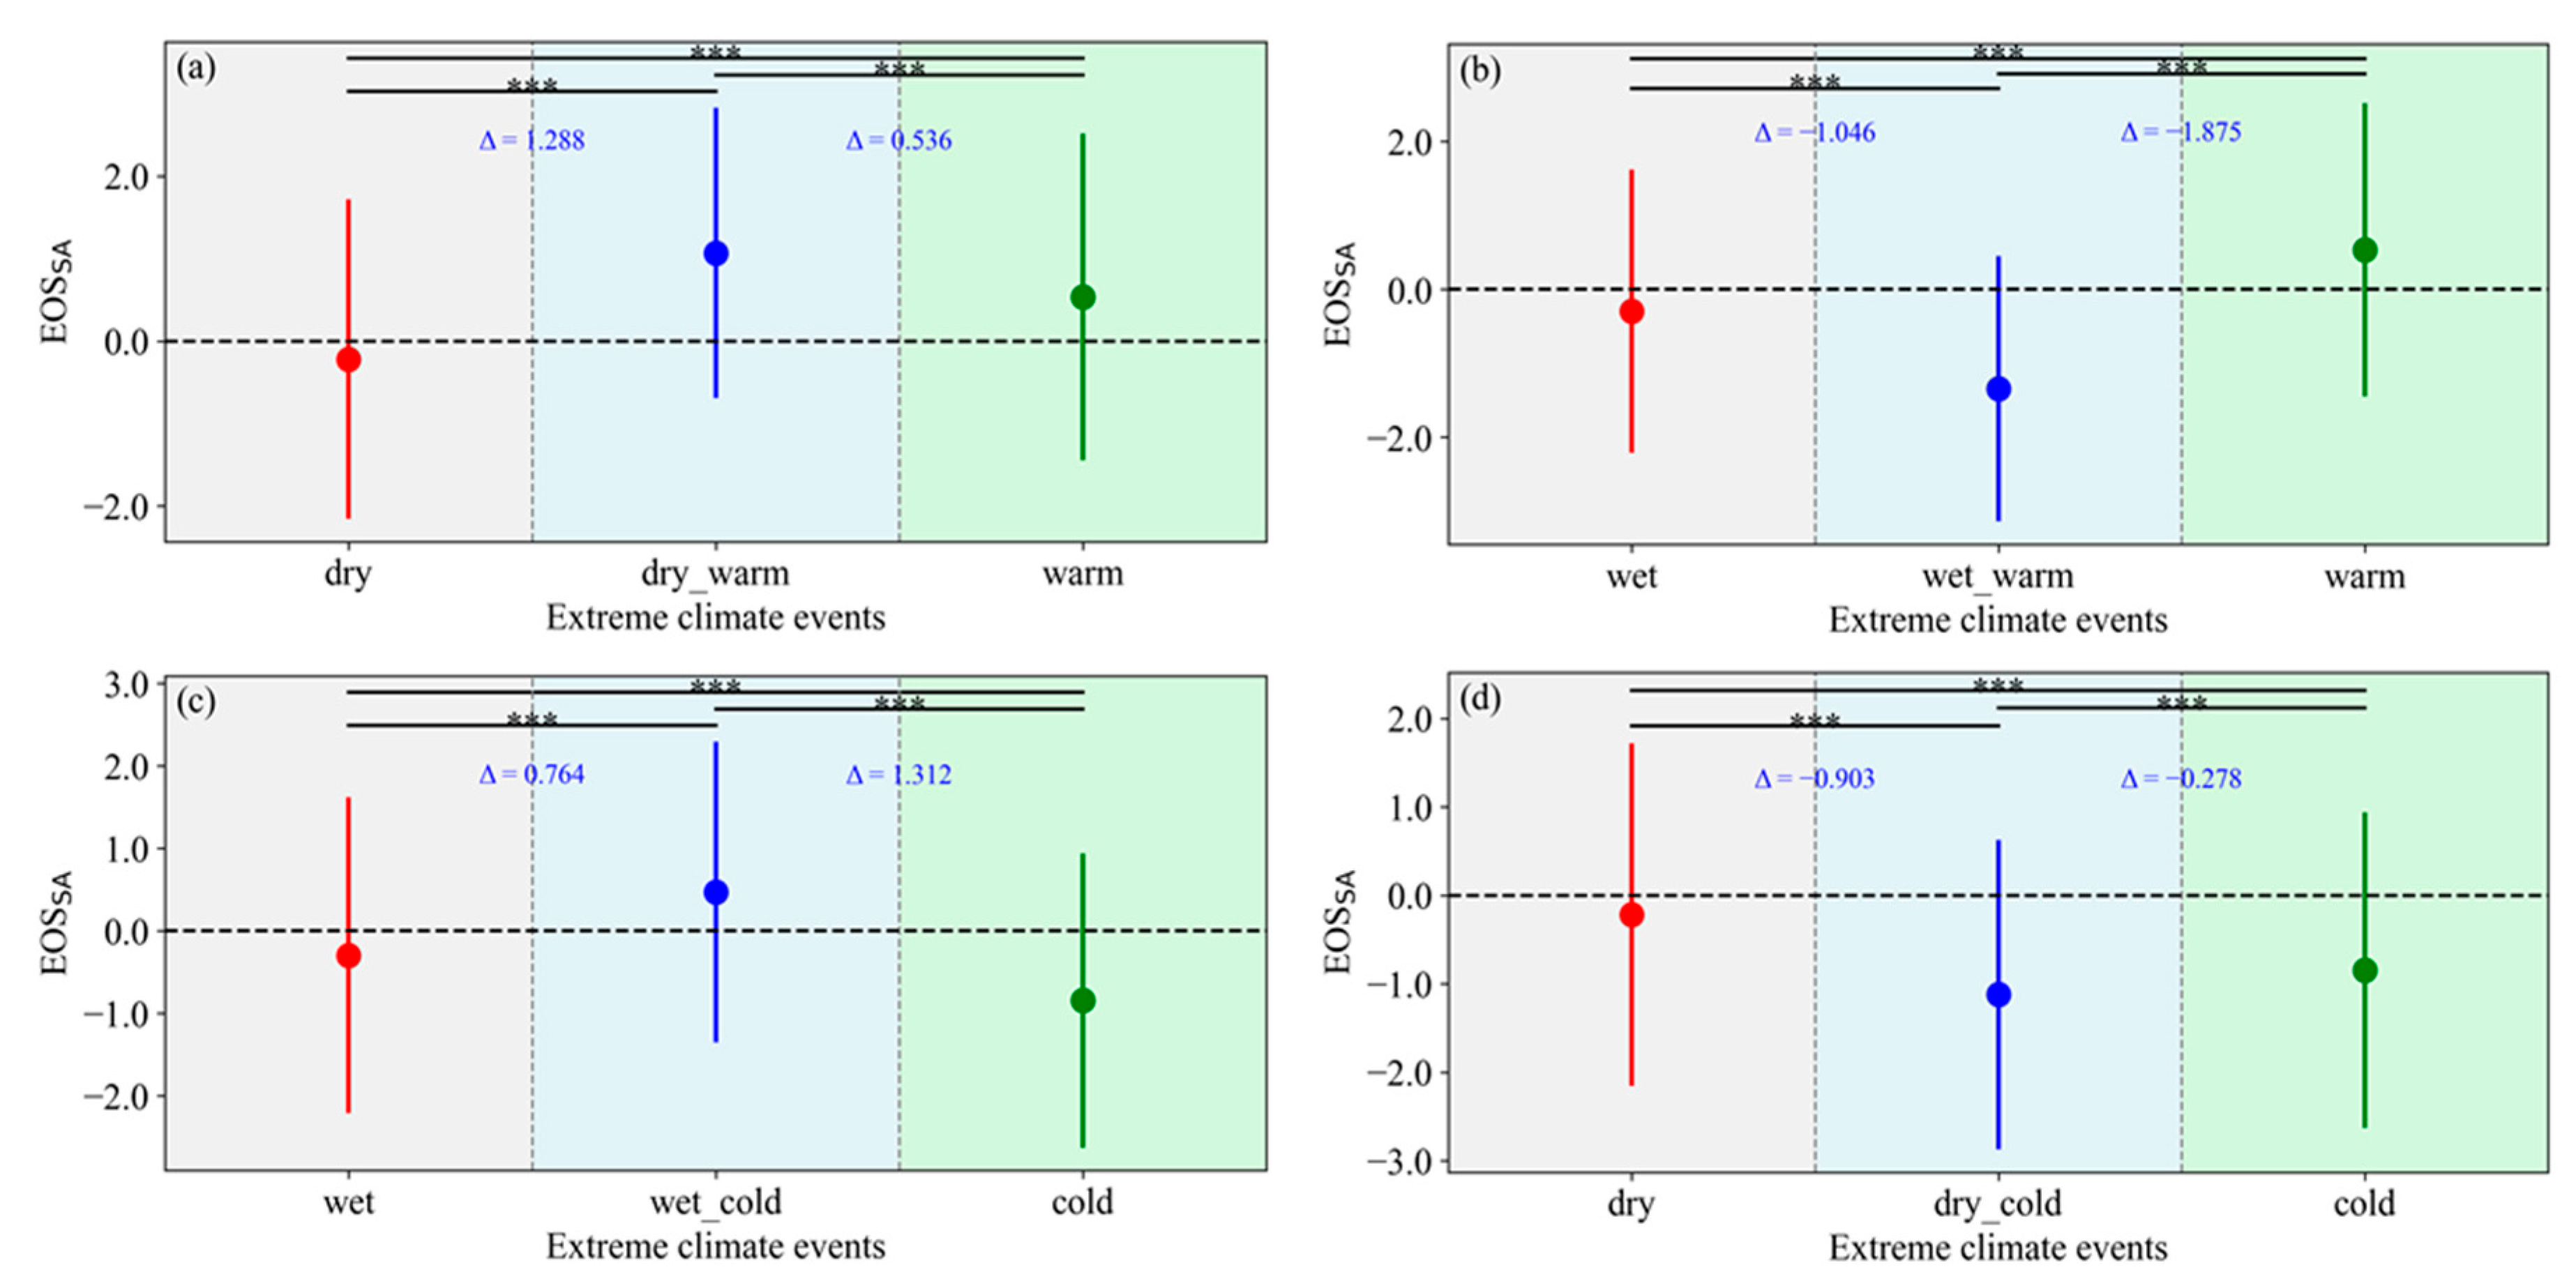
Furthermore, the overall impacts of different types of extreme climate events on the EOS in the study area were analyzed, with a focus on comparing the effects of SECEs and CECEs (Figure 12). The results indicated that extreme climate events caused substantial variation in the EOSSA. Specifically, extreme dry events primarily advanced the EOS, while extreme warm events tend to delay it (Figure 12a). Notably, compound dry–warm events exhibited a stronger delaying effect on the EOS than extreme warm events alone, suggesting that the combined impact of dry and warm exerts a greater influence on vegetation phenology than either single event. In addition, both extreme wet and extreme cold events predominantly led to earlier EOS, with extreme cold events showed a stronger advancing effect (Figure 12b,c). Moreover, compound wet–warm events demonstrated a more pronounced advancing effect on the EOS compared to extreme wet events alone, indicating an enhanced impact when extreme warm was superimposed on extreme wet conditions. Similarly, compound dry–cold events advanced the EOS more significantly than extreme cold events alone (Figure 12d). Overall, these findings highlighted that CECEs had a stronger influence on the EOS than SECEs, underscoring the importance of considering interactions between multiple climatic stressors in ecological and climate change studies.

3.4. Coincidence Rate Between EOSSA and Extreme Climate Events

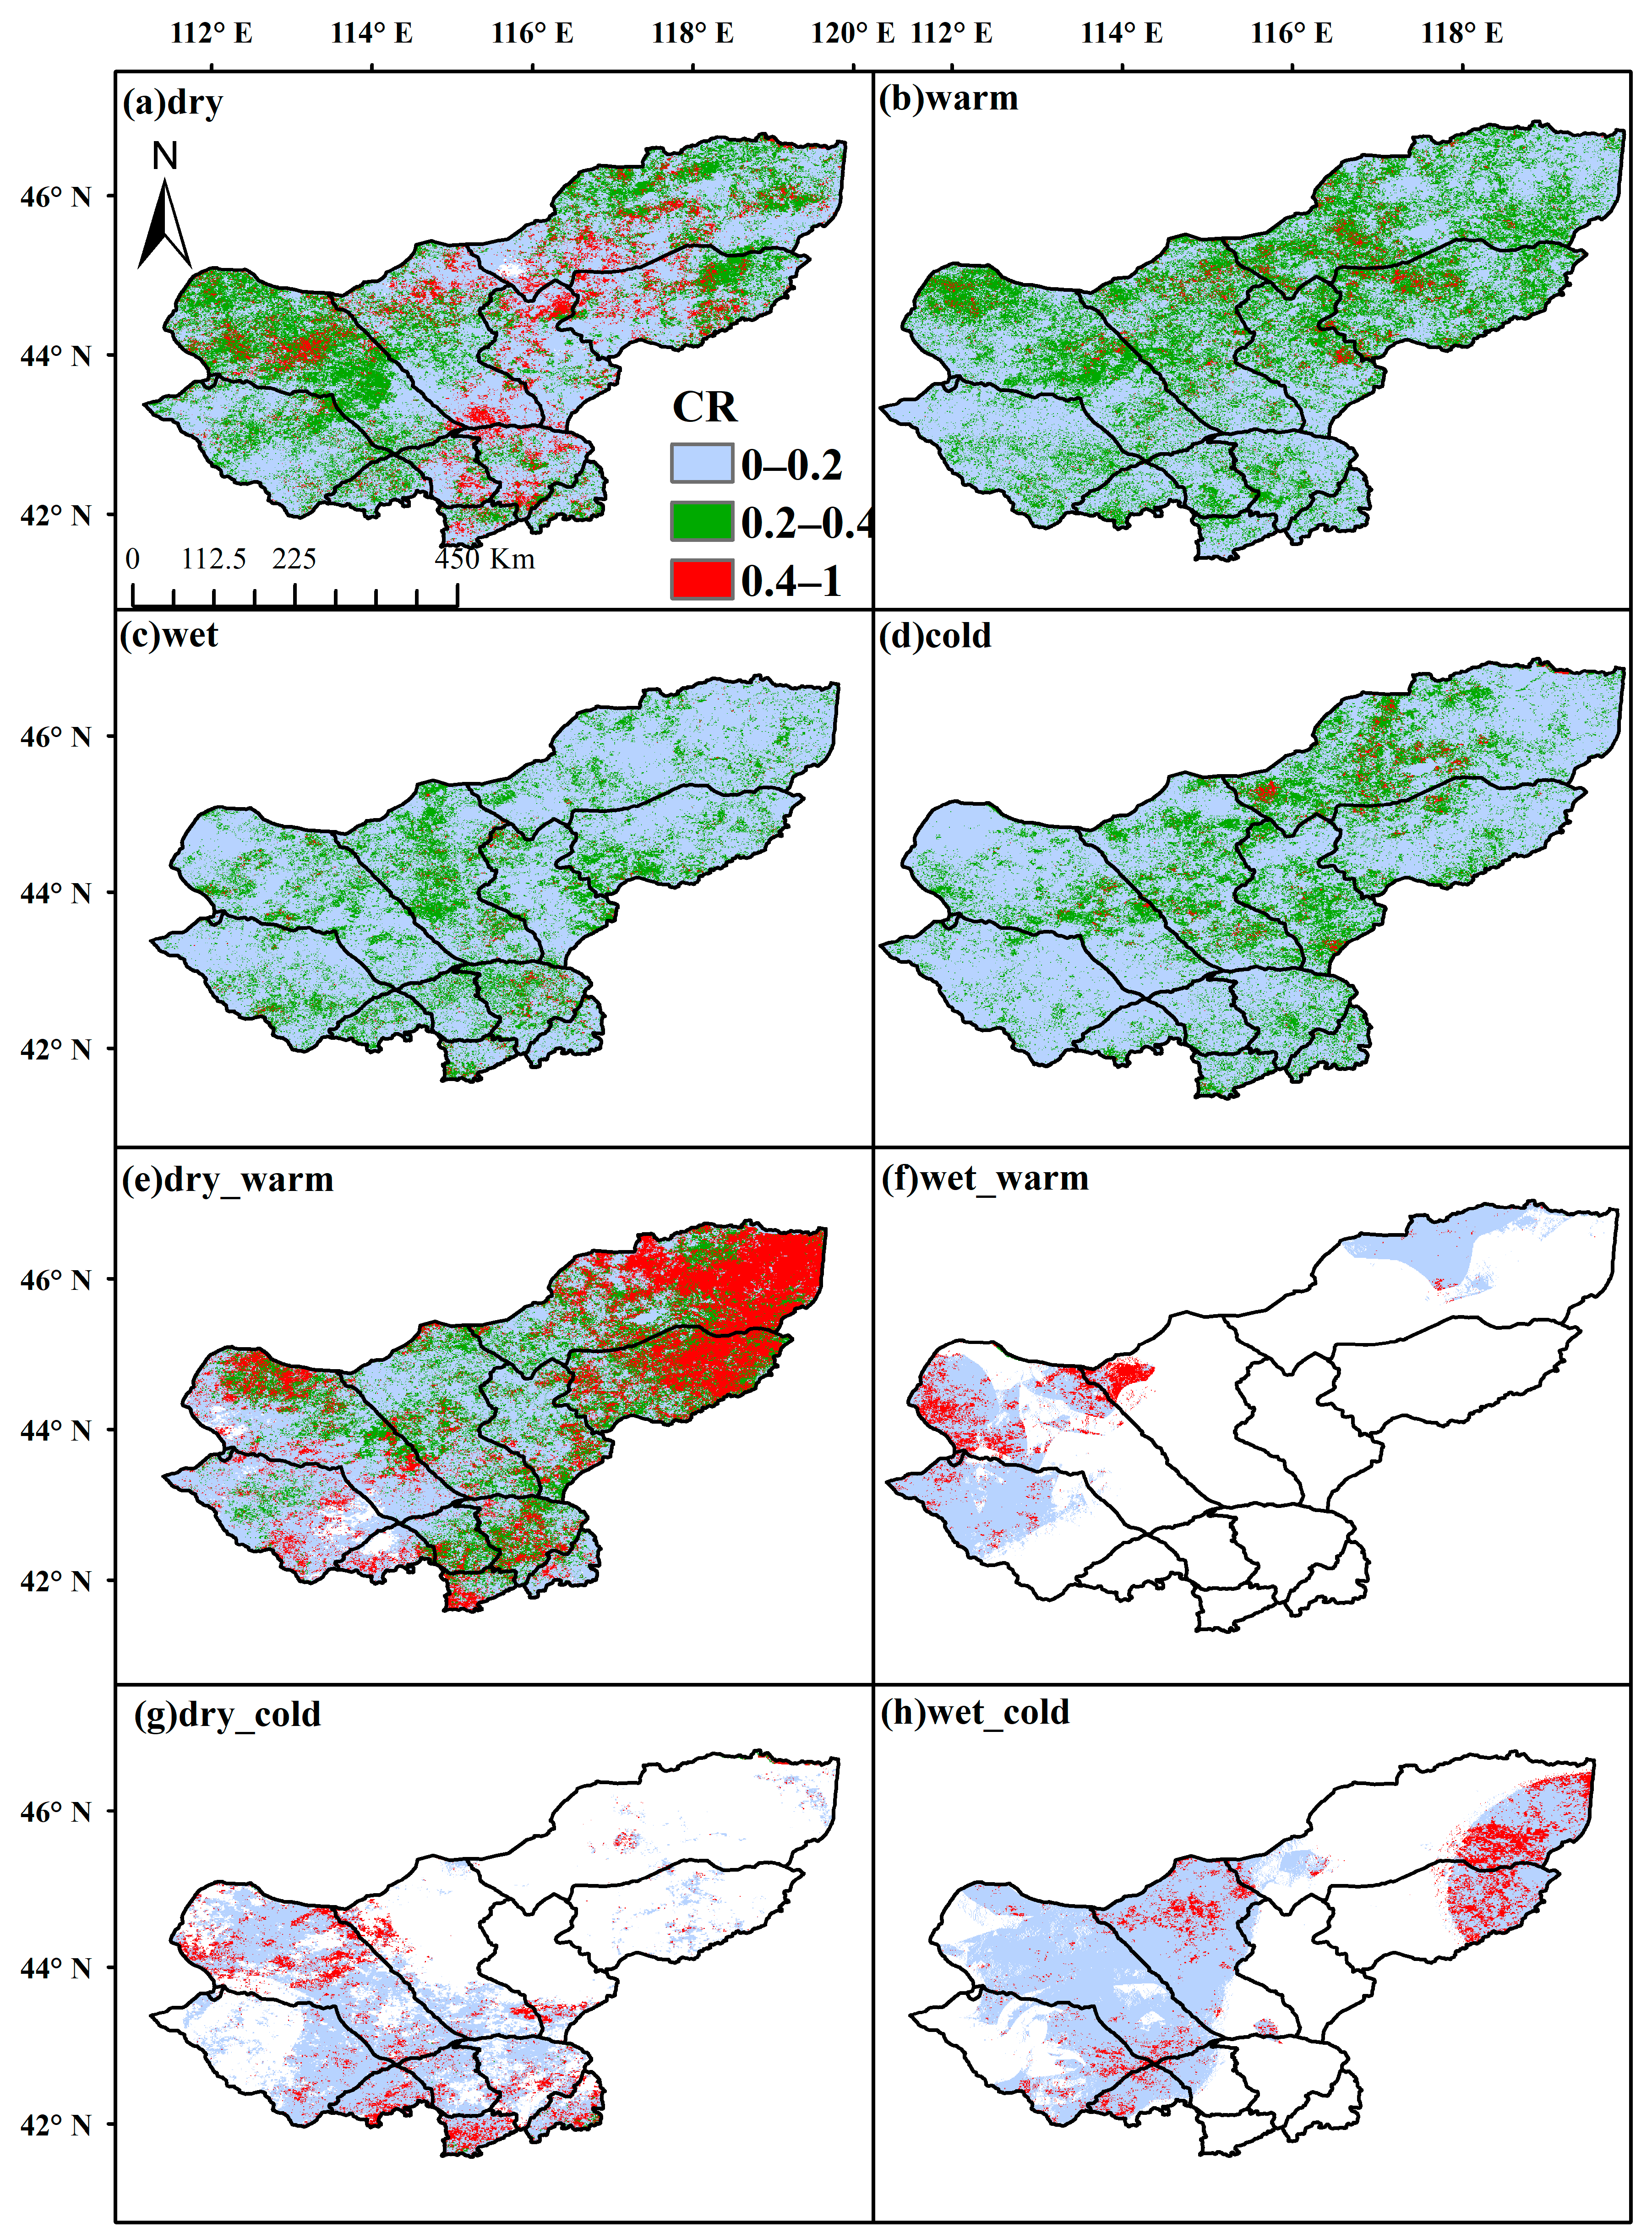
This section further analyzed the CR between extreme climate events (SECEs, CECEs) and EOSSA (Figure 13). The results showed that among SECEs, extreme dry events had the highest coincidence rate with EOSSA, followed by extreme warm events (Figure 13a–b). This indicated that EOSSA was more sensitive to extreme dry and extreme warm conditions. In the central part of the study area, the CR between extreme dry and EOSSA exceeded 0.4. In contrast, the CR between extreme wet or extreme cold events and EOSSA were relatively lower (Figure 13c,d). Unlike SECEs, CECEs showed higher CR with EOSSA. In particular, for compound dry–warm events, in the eastern part of the study area, the occurrence of such events almost always led to EOSSA, resulting in a very higher CR (Figure 13e). Additionally, compound wet–warm, compound dry–cold, and compound wet–cold events also exhibited relatively higher CR with EOSSA.
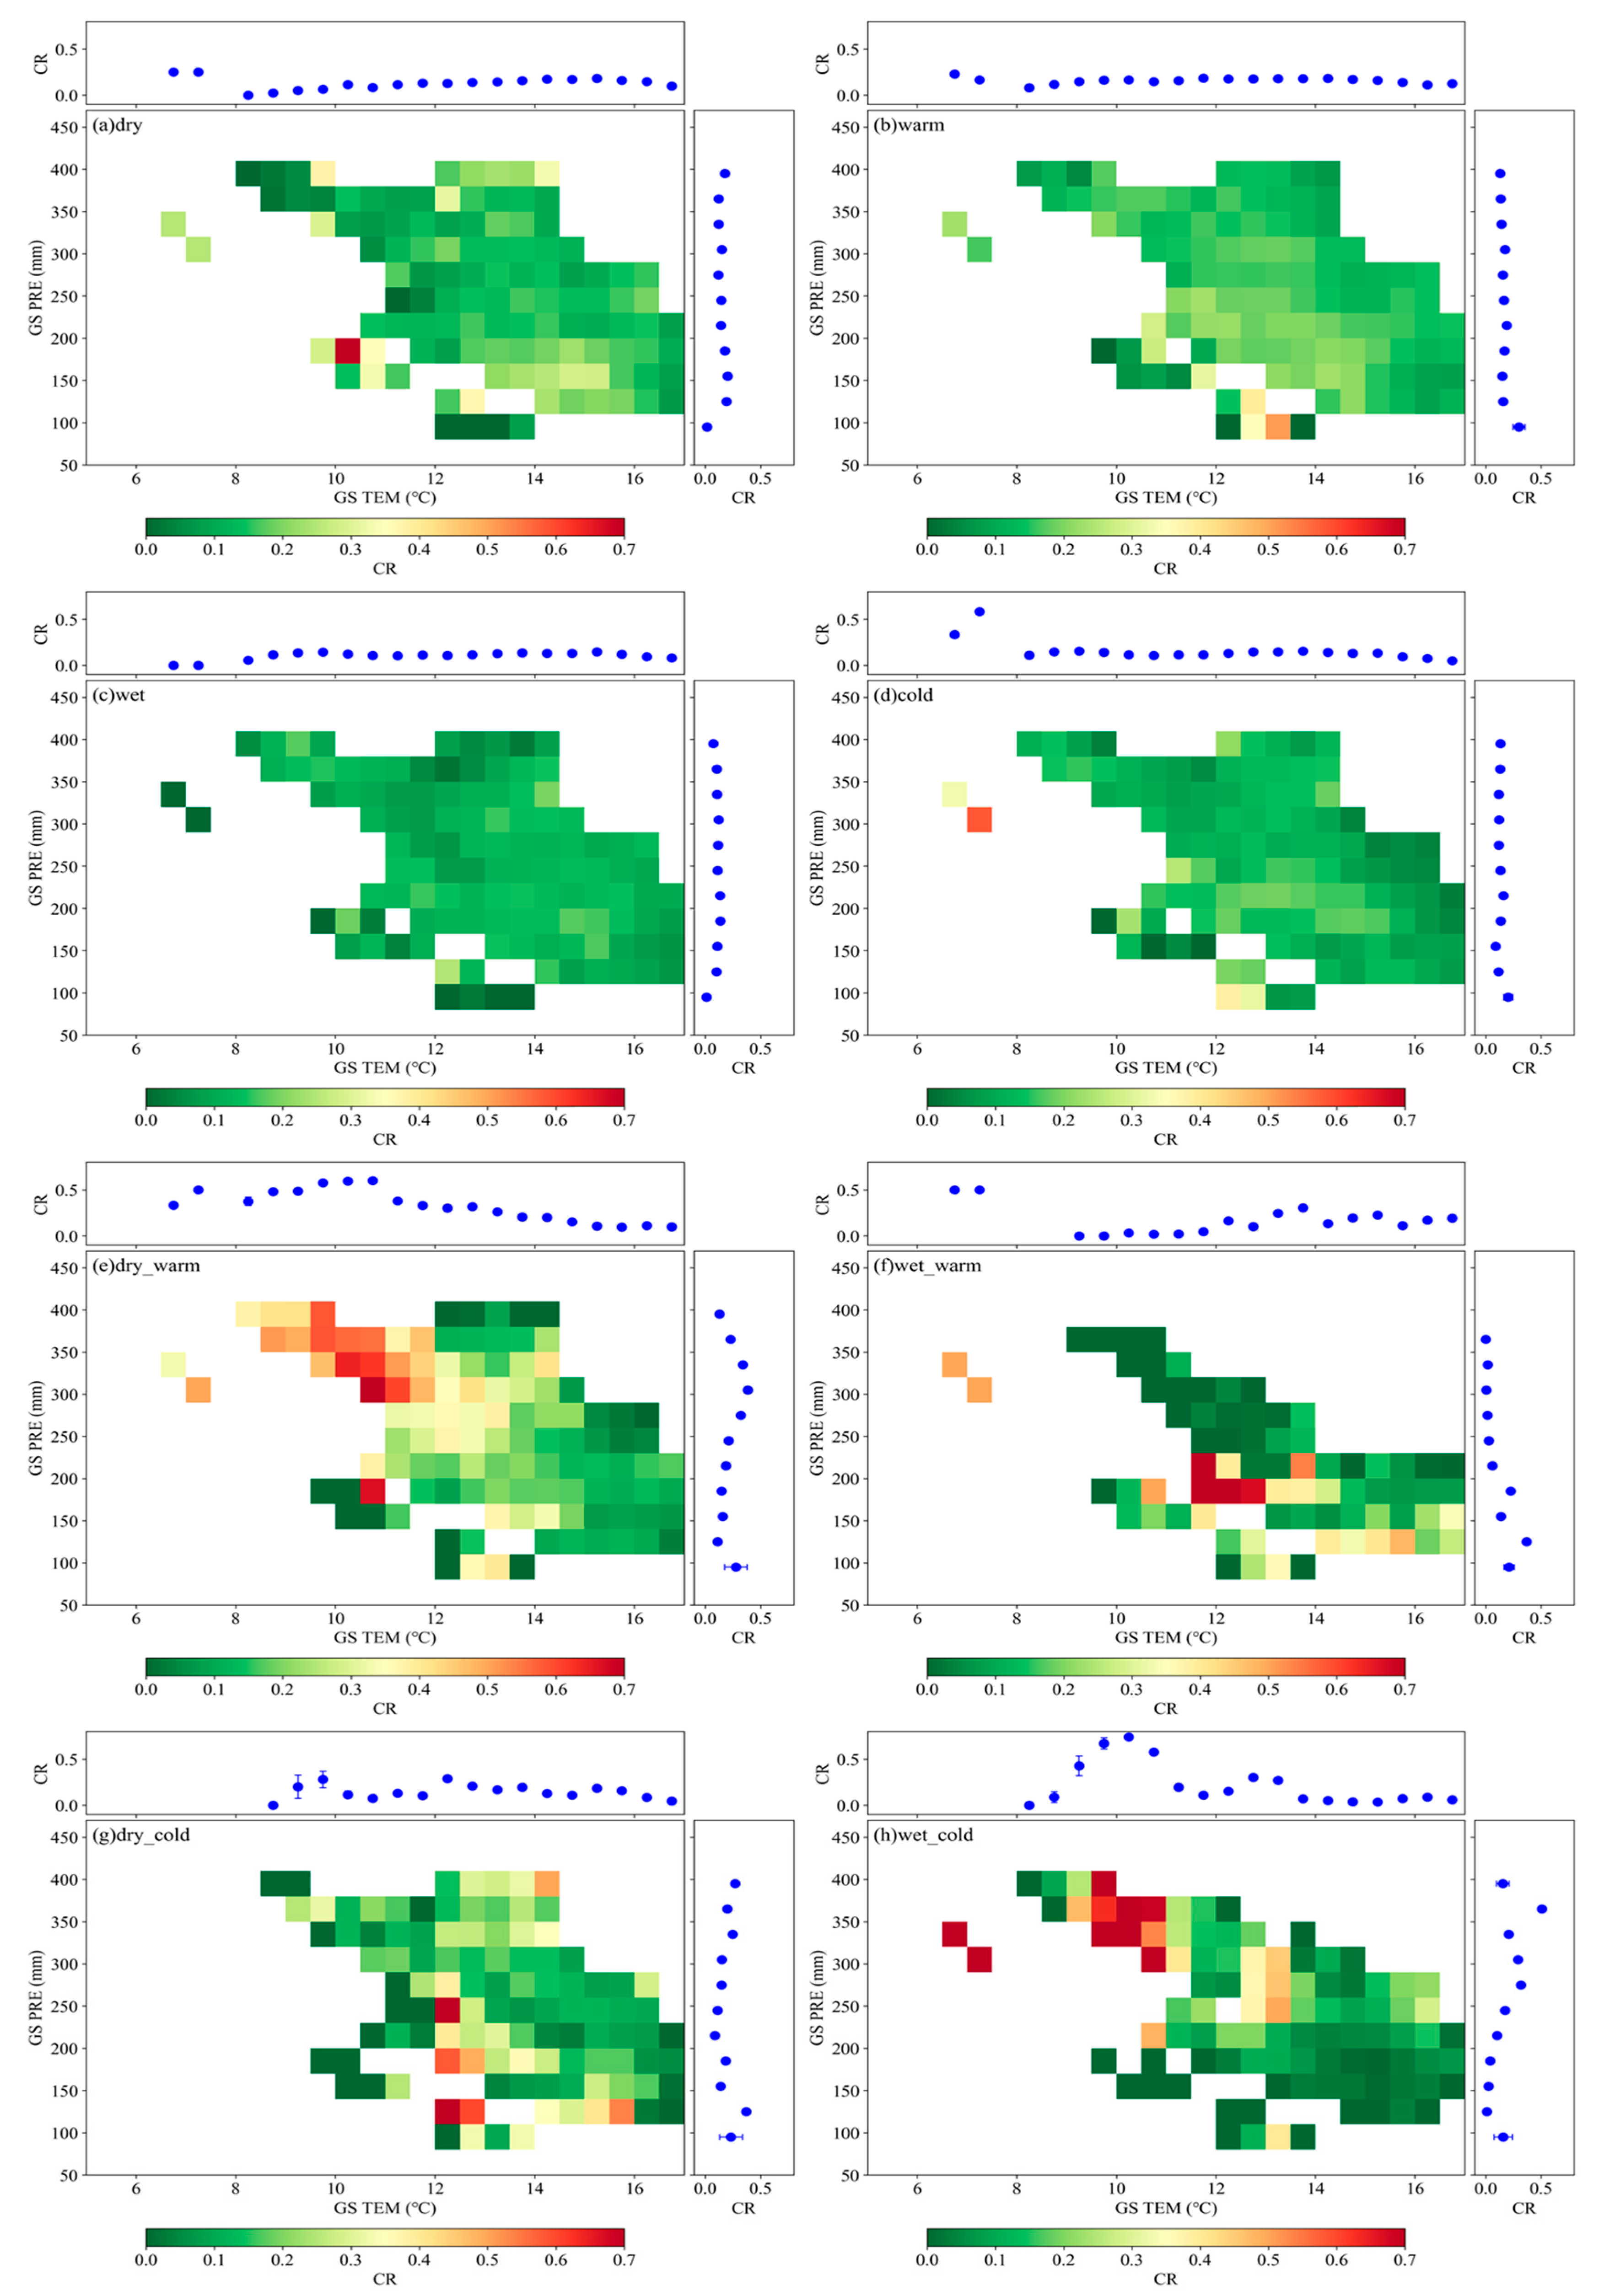
Further analysis was conducted on how the CR between extreme climate events and EOSSA varied along temperature and precipitation gradients (Figure 14). It was found that for SECEs, the CR remains generally lower across growing season temperature and precipitation gradients, without clear spatial patterns or trends. In contrast, for CECEs, the CR between compound dry–warm events and EOSSA decreased with increasing growing season temperature gradient (Figure 14e).

4. Discussion

The vegetation phenology changes and their responses to climate change in temperate grasslands (Inner Mongolia) and alpine grasslands (Tibetan Plateau) have received considerable attention [19,55,56]. Our study revealed that during 2003–2022, the EOS trend in semi-arid grassland of Inner Mongolia exhibited strong spatial heterogeneity, with an overall trend towards delayed. This finding aligned with previous studies indicating a delayed trend of the temperate grasslands in China from 1982 to 2015 [57]. In contrast, other studies have reported an advancing trend in the EOS with grassland vegetation in Inner Mongolia from 1982 to 2015 [19,58]. These results suggest that the inconsistencies in the EOS trends may be attributed to methodological differences in phenological extraction approaches and variations across study regions. From east to west in Inner Mongolia, temperatures gradually increase while precipitation decreases, leading to a transition from meadow steppe through typical steppe to desert steppe [44,45]. Climate background played a crucial role in determining the spatial patterns of phenological phases in northern grasslands [15,52,59]. The timing of the EOS progressively delayed from east to west, which may be attributed to lower temperature stress in the eastern region that triggers earlier EOS, while a combination of higher autumn temperatures and water limitations in the western region led to later EOS [60]. The spatial distribution of temperature and precipitation in Inner Mongolia differed significantly from that of the Tibetan Plateau [19]. Differences in climatic background may be a primary factor contributing to the divergent responses of vegetation phenology to extreme climate events between these two regions [20].
The regulatory effect of extreme dry events on EOSSA varied with climatic background, which was consistent with previous studies [9,26]. Under lower temperature gradients, extreme dry events ted to a delay EOS, whereas under higher temperature gradients, they advanced it. There may exist a temperature threshold that determined the direction of EOSSA induced by extreme dry. When the mean growing season temperature was approximately below 13 °C, extreme dry led to a delayed EOS (Figure 11a). Extreme cold events generally advanced EOS, in agreement with earlier findings [26]. This response can be attributed to two mechanisms. First, the occurrence of extreme cold events coincided with an increased risk of frost, which imposed greater physiological stress on plant growth and consequently led to an earlier EOS [61]. Second, under lower temperature and shorter photoperiod conditions, increased levels of abscisic acid in leaves promoted earlier EOS [62]. In the study area, extreme warm events generally delayed EOS, while extreme wet events ted to advance it, which aligned with previous studies [19]. The delaying effect of extreme warm on the EOS was particularly pronounced in the eastern part of the study area. Vegetation phenology was not only dependent on long-term mean temperature changes but was also significantly influenced by the occurrence of extreme temperature events [3]. In the semi-arid grassland of Inner Mongolia, extreme wet events showed a negative correlation with the EOS. This may be due to soil water saturation following extreme precipitation events, which limited root aeration and hampered the plant’s ability to carry out effective respiration [63].
Extreme dry events often co-occur with extreme warm events [64,65], which was the primary reason why compound dry–warm events occurred more frequently and over larger areas compared to other types of compound extremes in the study region. The direction of EOSSA induced by compound dry–warm events was spatially heterogeneous. Unlike extreme dry events, the impacts of compound dry–warm events on the EOS were jointly regulated by background temperature and precipitation conditions. As the temperature gradient increases, the delaying effect of compound dry–warm events on the EOS gradually weakens. Conversely, as the precipitation gradient decreases, the effect of these events shifted from delaying to advancing EOS, with the transition occurring at approximately 150 mm of growing season precipitation. Similar results have been obtained from warming and watering manipulation experiments [66]. In the eastern part of the study area, warm availability was the primary limiting factor. During compound dry–warm events, the increased temperature partially compensated for the thermal deficit, thereby delaying the EOS. In other words, in regions with relatively weak water limitation, vegetation enhanced its temperature sensitivity to maximize thermal resource use efficiency [67]. In contrast, in the central and western parts of the study area, the advanced EOS under compound dry–warm events may be attributed to severely reduced soil water availability [68,69,70]. The CR between EOSSA and compound dry–warm events was high under lower temperature gradients but decreased under higher temperature gradients. This suggested that in the western part of the study area, where water availability was chronically limited, vegetation exhibited low sensitivity to extreme dry and compound dry–warm events [26]. The physiological and ecological mechanisms underlying the impacts of extreme climate events on vegetation phenology require further in situ controlled experiments [38]. Future research should focus on two aspects. First, it is necessary to assess the risks of compound dry–warm events of varying intensities on EOSSA in grassland vegetation in order to reveal the spatiotemporal patterns of vegetation vulnerability [42,71]. Second, current phenological models are predominantly empirical in nature, failing to account for the impacts of extreme climatic conditions [25]. Studies demonstrated that extreme climate events significantly compromise the simulation accuracy of phenological models [22]. Consequently, under current and projected climate scenarios characterized by increasing frequency of extreme events, it is imperative to incorporate the underlying processes of extreme climate impacts to enhance the predictive precision of phenological models [38].

5. Conclusions

Understanding how vegetation respond to climate extremes is crucial for identifying ecological sensitive regions under future climate change. This study revealed that the EOS of semi-arid grassland in Xilingol League exhibited a delaying trend from 2003 to 2022, particularly after 2011, when it significantly delayed at a rate of 1.48 days per year. Compound dry–warm events occurred more frequently and over larger areas compared to other types of CECEs. Analysis of the impacts of SECEs and CECEs on EOSSA in semi-arid grasslands indicated that extreme climate events significantly affected the EOS, with CECEs exerting a stronger influence than SECEs. The regulatory effects of extreme climate events on the EOS were closely related to the temperature and precipitation background. Moreover, the directions of the impact of extreme dry and compound dry–warm events on the EOS were more prominently regulated by the temperature and precipitation conditions. Additionally, the CR analysis method was used to quantify the CR of EOSSA and extreme climate events. Under lower temperature conditions, the EOSSA in semi-arid grassland was more sensitive to extreme dry and compound dry–warm events, leading to earlier EOSSA. Our study provides valuable insights into the mechanisms by which extreme climate events affect the EOS in semi-arid grassland of Inner Mongolia, especially under varying hydrothermal conditions.

Author Contributions

E.L.: writing—review and editing; writing—original draft, software, methodology, formal analysis, data curation, conceptualization. G.Z.: writing—review and editing, supervision, funding acquisition, data curation. All authors have read and agreed to the published version of the manuscript.

Funding

This research was funded by the National Natural Science Foundation of China (42130514).

Data Availability Statement

Data will be made available on request.

Acknowledgments

The authors sincerely appreciate the anonymous reviewer and editors’ valuable comments and suggestions for improving the manuscript.

Conflicts of Interest

The authors declare that they have no known competing financial interests or personal relationship.

References

  1. IPCC. Climate change 2021. In The Physical Science Basis; Cambridge University Press: Cambridge, UK, 2021. [Google Scholar]
  2. Wu, Y.; Miao, C.; Sun, Y.; Fan, X. Global observations and CMIP6 simulations of compound extremes of monthly temperature and precipitation. GeoHealth 2021, 5, e2021GH000390. [Google Scholar] [CrossRef] [PubMed]
  3. Ying, H.; Zhang, H.; Zhao, J.; Shan, Y.; Zhang, Z.; Guo, X.; Rihan, W.; Deng, G. Effects of spring and summer extreme climate events on the autumn phenology of different vegetation types of Inner Mongolia, China, from 1982 to 2015. Ecol. Indic. 2020, 111, 105974. [Google Scholar] [CrossRef]
  4. Wu, X.; Hao, Z.; Hao, F.; Zhang, X. Variations of compound precipitation and temperature extremes in China during 1961–2014. Sci. Total Environ. 2019, 663, 731–737. [Google Scholar] [CrossRef]
  5. Luca, P.D.; Donat, M.G. Projected changes in hot, dry, and compound hot-dry extremes over global land regions. Geophys. Res. Lett. 2023, 50, e2022GL102493. [Google Scholar] [CrossRef]
  6. Meng, Y.; Hao, Z.; Feng, S.; Zhang, X.; Hao, F. Increase in compound dry-warm and wet-warm events under global warming in CMIP6 models. Glob. Planet. Change 2022, 210, 103773. [Google Scholar] [CrossRef]
  7. Chauhan, A.S.; Singh, S.; Maurya, R.K.S.; Danodia, A. Spatio-temporal analysis of rainfall in relation to monsoon teleconnections and agriculture at Regional Scale in Haryana, India. Environ. Sci. Pollut. Res. 2022, 30, 116781–116803. [Google Scholar] [CrossRef]
  8. Abhilash; Satpathi, A.; Harshangkumar, T.; Subramani, T.; Jaisankar, I.; Shahi, N.K. Climatological and Hydrological Extremes of the Andaman and Nicobar Islands, India, and Its Database for Public Users. Atmos 2025, 16, 301. [Google Scholar] [CrossRef]
  9. Javed, T.; Li, Y.; Feng, K.; Ayantobo, O.O.; Ahmad, S.; Chen, X.; Rashid, S.; Suon, S. Monitoring responses of vegetation phenology and productivity to extreme climatic conditions using remote sensing across different sub-regions of China. Environ. Sci. Pollut. Res. 2020, 28, 3644–3659. [Google Scholar] [CrossRef]
  10. Piao, S.L.; Zhang, X.P.; Chen, A.P.; Liu, Q.; Lian, X.; Wang, X.H.; Peng, S.S.; Wu, X.C. The impacts of climate extremes on the terrestrial carbon cycle: A review. Sci. China Earth Sci. 2019, 62, 1551–1563. [Google Scholar] [CrossRef]
  11. Liu, D.; Wang, T.; Yang, T.; Yan, Z.; Liu, Y.; Zhao, Y.; Piao, S. Deciphering impacts of climate extremes on Tibetan grasslands in the last fifteen years. Sci. Bull. 2019, 64, 446–454. [Google Scholar] [CrossRef]
  12. Lu, Q.; Zhang, Y.; Song, B.; Shao, H.; Tian, X.; Liu, S. The responses of ecological indicators to compound extreme climate indices in Southwestern China. Ecol. Indic. 2023, 157, 111253. [Google Scholar] [CrossRef]
  13. Chauhan, A.S.; Rani, A.; Dahiya, P.; Maurya, R.K.S.; Danodia, A. Understanding the influence of teleconnections on Indian summer monsoon rainfall and agricultural productivity: A case study of Haryana, India (1980–2023). J. Water Clim. Change 2024, 15, 5793–5816. [Google Scholar] [CrossRef]
  14. IPCC. Climate change 2013. In The Physical Science Basis: Working Group Ⅰ Contribution to the Firth Assessment Report of the Intergovernmental Panel on Climate Change; Cambridge University Press: Cambridge, UK, 2013. [Google Scholar]
  15. Ren, S.L.; Chen, X.Q.; Pan, C.C. Temperature-precipitation background affects spatial heterogeneity of spring phenology responses to climate change in northern grasslands (30° N–55° N). Agric. For. Meteorol. 2022, 315, 108816. [Google Scholar] [CrossRef]
  16. Zhang, R.; Zhao, X.Y.; Zuo, X.A.; Degen, A.A.; Li, Y.L.; Liu, X.P.; Luo, Y.Y.; Qu, H.; Lian, J.; Wang, R.X. Drought-induced shift from a carbon sink to a carbon source in the grasslands of Inner Mongolia, China. Catena 2020, 195, 104845. [Google Scholar] [CrossRef]
  17. Du, Q.; Liu, H.; Li, Y.; Xu, L.; Diloksumpun, S. The effect of phenology on the carbon exchange process in grassland and maize cropland ecosystems across a semiarid area of China. Sci. Total Environ. 2019, 695, 133868. [Google Scholar] [CrossRef]
  18. He, Z.B.; Du, J.; Chen, L.F.; Zhu, X.; Lin, P.F.; Zhao, M.M.; Fang, S. Impacts of recent climate extremes on spring phenology in arid-mountain ecosystems in China. Agric. For. Meteorol. 2018, 260, 31–40. [Google Scholar] [CrossRef]
  19. Zhao, Z.; Wang, X.; Li, R.; Luo, W.; Wu, C. Impacts of climate extremes on autumn phenology in contrasting temperate and alpine grasslands in China. Agric. For. Meteorol. 2023, 336, 109495. [Google Scholar] [CrossRef]
  20. Jentsch, A.; Kreyling, J.; Boettcher-Treschkow, J.; Beierkuhnlein, C. Beyond gradual warming: Extreme weather events alter flower phenology of European grassland and heath species. Glob. Change Biol. 2009, 15, 837–849. [Google Scholar] [CrossRef]
  21. Zhong, R.; Yan, K.; Gao, S.; Yang, K.; Zhao, S.; Ma, X.; Zhu, P.; Fan, L.; Yin, G. Response of grassland growing season length to extreme climatic events on the Qinghai-Tibetan Plateau. Sci. Total Environ. 2024, 909, 168488. [Google Scholar] [CrossRef]
  22. Carter, J.M.; Orive, M.E.; Gerhart, L.M.; Stern, J.H.; Marchin, R.M.; Nagel, J.; Ward, J.K. Warmest extreme year in U.S. history alters thermal requirements for tree phenology. Oecologia 2017, 183, 1197–1210. [Google Scholar] [CrossRef]
  23. Ma, X.L.; Huete, A.; Moran, S.; Ponce-Campos, G.; Eamus, D. Abrupt shifts in phenology and vegetation productivity under climate extremes. J. Geophys. Res. Biogeosciences 2015, 120, 2036–2052. [Google Scholar] [CrossRef]
  24. Gao, X.; Tao, Z.; Dai, J. Significant influences of extreme climate on autumn phenology in Central Asia grassland. Ecol. Indic. 2023, 155, 111056. [Google Scholar] [CrossRef]
  25. Li, P.; Liu, Z.L.; Zhou, X.L.; Xie, B.G.; Li, Z.W.; Luo, Y.P.; Zhu, Q.A.; Peng, C.H. Combined control of multiple extreme climate stressors on autumn vegetation phenology on the Tibetan Plateau under past and future climate change. Agric. For. Meteorol. 2021, 308, 108571. [Google Scholar] [CrossRef]
  26. Wang, M.; Li, P.; Peng, C.H.; Xiao, J.F.; Zhou, X.L.; Luo, Y.P.; Zhang, C.C. Divergent responses of autumn vegetation phenology to climate extremes over northern middle and high latitudes. Glob. Ecol. Biogeogr. 2022, 31, 2281–2296. [Google Scholar] [CrossRef]
  27. Richardson, A.D.; Keenan, T.F.; Migliavacca, M.; Ryu, Y.; Sonnentag, O.; Toomey, M. Climate change, phenology, and phenological control of vegetation feedbacks to the climate system. Agric. For. Meteorol. 2013, 169, 156–173. [Google Scholar] [CrossRef]
  28. Gallinat, A.S.; Primack, R.B.; Wagner, D.L. Autumn, the neglected season in climate change research. Trends Ecol. Evol. 2015, 30, 169–176. [Google Scholar] [CrossRef]
  29. Sun, Q.L.; Li, B.L.; Zhou, G.Y.; Jiang, Y.H.; Yuan, Y.C. Delayed autumn leaf senescence date prolongs the growing season length of herbaceous plants on the Qinghai–Tibetan Plateau. Agric. For. Meteorol. 2020, 284, 107896. [Google Scholar] [CrossRef]
  30. Guo, J.; Yang, X.C.; Niu, J.M.; Jin, Y.X.; Xu, B.; Shen, G.; Zhang, W.B.; Zhao, F.; Zhang, Y.J. Remote sensing monitoring of green-up dates in the Xilingol grasslands of northern China and their correlations with meteorological factors. Int. J. Remote Sens. 2018, 40, 2190–2211. [Google Scholar] [CrossRef]
  31. Zhu, W.; Jiang, N.; Chen, G.; Zhang, D.; Zheng, Z.; Fan, D. Divergent shifts and responses of plant autumn phenology to climate change on the Qinghai-Tibetan Plateau. Agric. For. Meteorol. 2017, 239, 166–175. [Google Scholar] [CrossRef]
  32. Zhang, Y.; Huang, J.G.; Wang, M.; Wang, W.; Yang, F. Soil nitrogen drives inverse acclimation of xylem growth cessation to rising temperature in Northern Hemisphere conifers. Proc. Natl. Acad. Sci. USA 2025, 122, e2421834122. [Google Scholar] [CrossRef]
  33. Ma, P.F.; Zhao, J.X.; Zhang, H.Z.; Zhang, L.; Luo, T.X. Increased precipitation leads to earlier green-up and later senescence in Tibetan alpine grassland regardless of warming. Sci. Total Environ. 2023, 871, 162000. [Google Scholar] [CrossRef]
  34. Li, P.; Peng, C.H.; Wang, M.; Luo, Y.P.; Li, M.X.; Zhang, K.R.; Zhang, D.L.; Zhu, Q.A. Dynamics of vegetation autumn phenology and its response to multiple environmental factors from 1982 to 2012 on Qinghai-Tibetan Plateau in China. Sci. Total Environ. 2018, 637–638, 855–864. [Google Scholar] [CrossRef]
  35. Fang, W.; Huang, S.; Huang, Q.; Huang, G.; Wang, H.; Leng, G.; Wang, L.; Li, P.; Ma, L. Bivariate probabilistic quantification of drought impacts on terrestrial vegetation dynamics in mainland China. J. Hydrol. 2019, 577, 123980. [Google Scholar] [CrossRef]
  36. Mo, Y.; Zhang, X.; Liu, Z.; Zhang, J.; Hao, F.; Fu, Y. Effects of climate extremes on spring phenology of temperate vegetation in China. Remote Sens. 2023, 15, 686. [Google Scholar] [CrossRef]
  37. Bao, G.; Jin, H.; Tong, S.Q.; Chen, J.Q.; Huang, X.J.; Bao, Y.H.; Shao, C.L.; Mandakh, U.; Chopping, M.; Du, L.T. Autumn phenology and its covariation with climate, spring phenology and annual peak growth on the Mongolian Plateau. Agric. For. Meteorol. 2021, 298, 108312. [Google Scholar] [CrossRef]
  38. Zhang, J.; Li, M.; Hao, F.; Zhang, X.; Wu, Z.; Fu, Y. Response of vegetation phenology to extreme climate and its mechanism. Acta Geogr. Sin. 2023, 78, 2241–2255. [Google Scholar] [CrossRef]
  39. Hao, Z.; Hao, F.; Xia, Y.; Feng, S.; Sun, C.; Zhang, X.; Fu, Y.; Hao, Y.; Zhang, Y.; Meng, Y. Compound droughts and hot extremes: Characteristics, drivers, changes, and impacts. Earth-Sci. Rev. 2022, 235, 104241. [Google Scholar] [CrossRef]
  40. Hoover, D.L.; Hajek, O.L.; Smith, M.D.; Wilkins, K.; Ingrid, J.S.; Knapp, A.K. Compound hydroclimatic extremes in a semi-arid grassland: Drought, deluge, and the carbon cycle. Glob. Change Biol. 2022, 28, 2611–2621. [Google Scholar] [CrossRef]
  41. Liu, Z.; Jiao, L.; Lian, X. Impacts of increasing compound hot-dry events on vegetation under the warming-wetting trend in Northwest China. Geogr. Sustain. 2025, 6, 100222. [Google Scholar] [CrossRef]
  42. Hao, Y.; Hao, Z.; Fu, Y.; Feng, S.; Zhang, X.; Wu, X.; Hao, F. Probabilistic assessments of the impacts of compound dry and hot events on global vegetation during growing seasons. Environ. Res. Lett. 2021, 16, 074055. [Google Scholar] [CrossRef]
  43. Guo, M.D.; Wu, C.Y.; Peng, J.; Lu, L.L.; Li, S.H. Identifying contributions of climatic and atmospheric changes to autumn phenology over mid-high latitudes of Northern Hemisphere. Glob. Planet. Change 2021, 197, 103396. [Google Scholar] [CrossRef]
  44. Piao, S.; Mohammat, A.; Fang, J.; Cai, Q.; Feng, J. NDVI-based increase in growth of temperate grasslands and its responses to climate changes in China. Glob. Environ. Change 2006, 16, 340–348. [Google Scholar] [CrossRef]
  45. Piao, S.L.; Fang, J.Y.; Zhou, L.M.; Ciais, P.; Zhu, B. Variations in satellite-derived phenology in China’s temperate vegetation. Glob. Change Biol. 2006, 12, 672–685. [Google Scholar] [CrossRef]
  46. Sha, Z.; Zhong, J.; Bai, Y.; Tan, X.; Li, J. Spatio-temporal patterns of satellite-derived grassland vegetation phenology from 1998 to 2012 in Inner Mongolia, China. J. Arid Land 2016, 8, 462–477. [Google Scholar] [CrossRef]
  47. Ren, S.L.; Chen, X.; An, S. Assessing plant senescence reflectance index-retrieved vegetation phenology and its spatiotemporal response to climate change in the Inner Mongolian Grassland. Int. J. Biometeorol. 2017, 61, 601–612. [Google Scholar] [CrossRef]
  48. Xia, H.M.; Zhao, X.Y.; Jiao, W.Z.; Song, H.Q.; Yang, J.; Zhao, W.; Qin, Y.C. HSPEI: A 1-km spatial resolution SPEI Dataset across Chinese Mainland from 2001 to 2022. Geosci. Data J. 2024, 11, 479–494. [Google Scholar] [CrossRef]
  49. Verstraete, M.M.; Gobron, N.; Aussedat, O.; Robustelli, M.; Pinty, B.; Widlowski, J.-L.; Taberner, M. An automatic procedure to identify key vegetation phenology events using the JRC-FAPAR products. Adv. Space Res. 2008, 41, 1773–1783. [Google Scholar] [CrossRef]
  50. Tan, B.; Morisette, J.T.; Wolfe, R.E.; Gao, F.; Ederer, G.A.; Nightingale, J.; Pedelty, J.A. An Enhanced TIMESAT Algorithm for Estimating Vegetation Phenology Metrics From MODIS Data. IEEE J. Sel. Top. Appl. Earth Obs. Remote Sens. 2011, 4, 361–371. [Google Scholar] [CrossRef]
  51. Garrity, S.R.; Bohrer, G.; Maurer, K.D.; Mueller, K.L.; Vogel, C.S.; Curtis, P.S. A comparison of multiple phenology data sources for estimating seasonal transitions in deciduous forest carbon exchange. Agric. For. Meteorol. 2011, 151, 1741–1752. [Google Scholar] [CrossRef]
  52. Liu, E.; Zhou, G.; Lv, X.; Song, X. Precipitation controls the time-lag and cumulative effects of hydrothermal factors on the end of the growing season in a semi-arid region of China. Front. Plant Sci. 2024, 15, 1483452. [Google Scholar] [CrossRef]
  53. Liu, Y.; Liu, W.; Li, Y.; Ye, T.; Chen, S.; Li, Z.; Sun, R. Concurrent Precipitation Extremes Modulate the Response of Rice Transplanting Date to Preseason Temperature Extremes in China. Earth’s Future 2023, 11, e2022EF002888. [Google Scholar] [CrossRef]
  54. Zhang, Y.; Hong, S.; Liu, D.; Piao, S. Susceptibility of vegetation low-growth to climate extremes on Tibetan Plateau. Agric. For. Meteorol. 2023, 331, 109323. [Google Scholar] [CrossRef]
  55. Qin, G.; Adu, B.; Li, C.; Wu, J. Diverse responses of phenology in multi-grassland to environmental factors on Qinghai-Tibetan Plateau in China. Theor. Appl. Climatol. 2022, 148, 931–942. [Google Scholar] [CrossRef]
  56. Yuan, Z.H.; Tong, S.Q.; Bao, G.; Chen, J.Q.; Yin, S.; Li, F.; Sa, C.L.; Bao, Y.H. Spatiotemporal variation of autumn phenology responses to preseason drought and temperature in alpine and temperate grasslands in China. Sci. Total Environ. 2022, 859, 160373. [Google Scholar] [CrossRef] [PubMed]
  57. Ma, R.; Shen, X.; Zhang, J.; Xia, C.; Liu, Y.; Wu, L.; Wang, Y.; Jiang, M.; Lu, X. Variation of vegetation autumn phenology and its climatic drivers in temperate grasslands of China. Int. J. Appl. Earth Obs. Geoinf. 2022, 114, 103064. [Google Scholar] [CrossRef]
  58. Lyu, D.; Bao, G.; Tong, S.; Lei, J. Response of phenological vegetation wilting period to multi-scale drying-wetting changes in Xilingol. In China Environmental Science; Lyu, D., Bao, G., Tong, S., Lei, J., Eds.; Chinese Research Academy of Environmental Sciences: Beijing, China, 2022; Volume 42, pp. 323–335. [Google Scholar]
  59. Bai, W.; Wang, H.; Lin, S. Magnitude and direction of green-up date in response to drought depend on background climate over Mongolian grassland. Sci. Total Environ. 2023, 902, 166051. [Google Scholar] [CrossRef] [PubMed]
  60. Ren, S.L.; Yi, S.H.; Peichl, M.; Wang, X.Y. Diverse responses of vegetation phenology to climate change in different grasslands in Inner Mongolia during 2000–2016. Remote Sens. 2018, 10, 17. [Google Scholar] [CrossRef]
  61. Frank, D.; Reichstein, M.; Bahn, M.; Thonicke, K.; Frank, D.; Mahecha, M.D.; Smith, P.; van der Velde, M.; Vicca, S.; Babst, F.; et al. Effects of climate extremes on the terrestrial carbon cycle: Concepts, processes and potential future impacts. Glob. Change Biol. 2015, 21, 2861–2880. [Google Scholar] [CrossRef]
  62. Zhang, S.; Dai, J.; Ge, Q. Responses of autumn phenology to climate change and the correlations of plant hormone regulation. Sci. Rep. 2020, 10, 9039. [Google Scholar] [CrossRef]
  63. Zeppel, M.J.B.; Wilks, J.V.; Lewis, J.D. Impacts of extreme precipitation and seasonal changes in precipitation on plants. Biogeosciences 2014, 11, 3083–3093. [Google Scholar] [CrossRef]
  64. Xu, W.; Yuan, W.; Wu, D.; Zhang, Y.; Shen, R.; Xia, X.; Ciais, P.; Liu, J. Impacts of record-breaking compound heatwave and drought events in 2022 China on vegetation growth. Agric. For. Meteorol. 2024, 344, 109799. [Google Scholar] [CrossRef]
  65. Wu, X.; Jiang, D. Probabilistic impacts of compound dry and hot events on global gross primary production. Environ. Res. Lett. 2022, 17, 034049. [Google Scholar] [CrossRef]
  66. Ganjurjav, H.; Gornish, E.S.; Hu, G.Z.; Schwartz, M.W.; Wan, Y.F.; Li, Y.; Gao, Q.Z. Warming and precipitation addition interact to affect plant spring phenology in alpine meadows on the central Qinghai-Tibetan Plateau. Agric. For. Meteorol. 2020, 287, 107943. [Google Scholar] [CrossRef]
  67. Shen, M.G.; Piao, S.L.; Cong, N.; Zhang, G.X.; Jassens, I.A. Precipitation impacts on vegetation spring phenology on the Tibetan Plateau. Glob. Change Biol. 2015, 21, 3647–3656. [Google Scholar] [CrossRef] [PubMed]
  68. Cui, X.; Xu, G.; He, X.; Luo, D. Influences of seasonal soil moisture and temperature on vegetation phenology in the Qilian mountains. Remote Sens. 2022, 14, 3645. [Google Scholar] [CrossRef]
  69. Wang, X.; Wu, C.; Liu, Y.; Peñuelas, J.; Peng, J. Earlier leaf senescence dates are constrained by soil moisture. Glob. Change Biol. 2022, 29, 1557–1573. [Google Scholar] [CrossRef]
  70. Luo, M.; Meng, F.H.; Sa, C.L.; Duan, Y.C.; Bao, Y.; Liu, T.; De Maeyer, P. Response of vegetation phenology to soil moisture dynamics in the Mongolian Plateau. Catena 2021, 206, 105505. [Google Scholar] [CrossRef]
  71. Li, H.W.; Li, Y.P.; Huang, G.H.; Sun, J. Quantifying effects of compound dry-hot extremes on vegetation in Xinjiang (China) using a vine-copula conditional probability model. Agric. For. Meteorol. 2021, 311, 108658. [Google Scholar] [CrossRef]
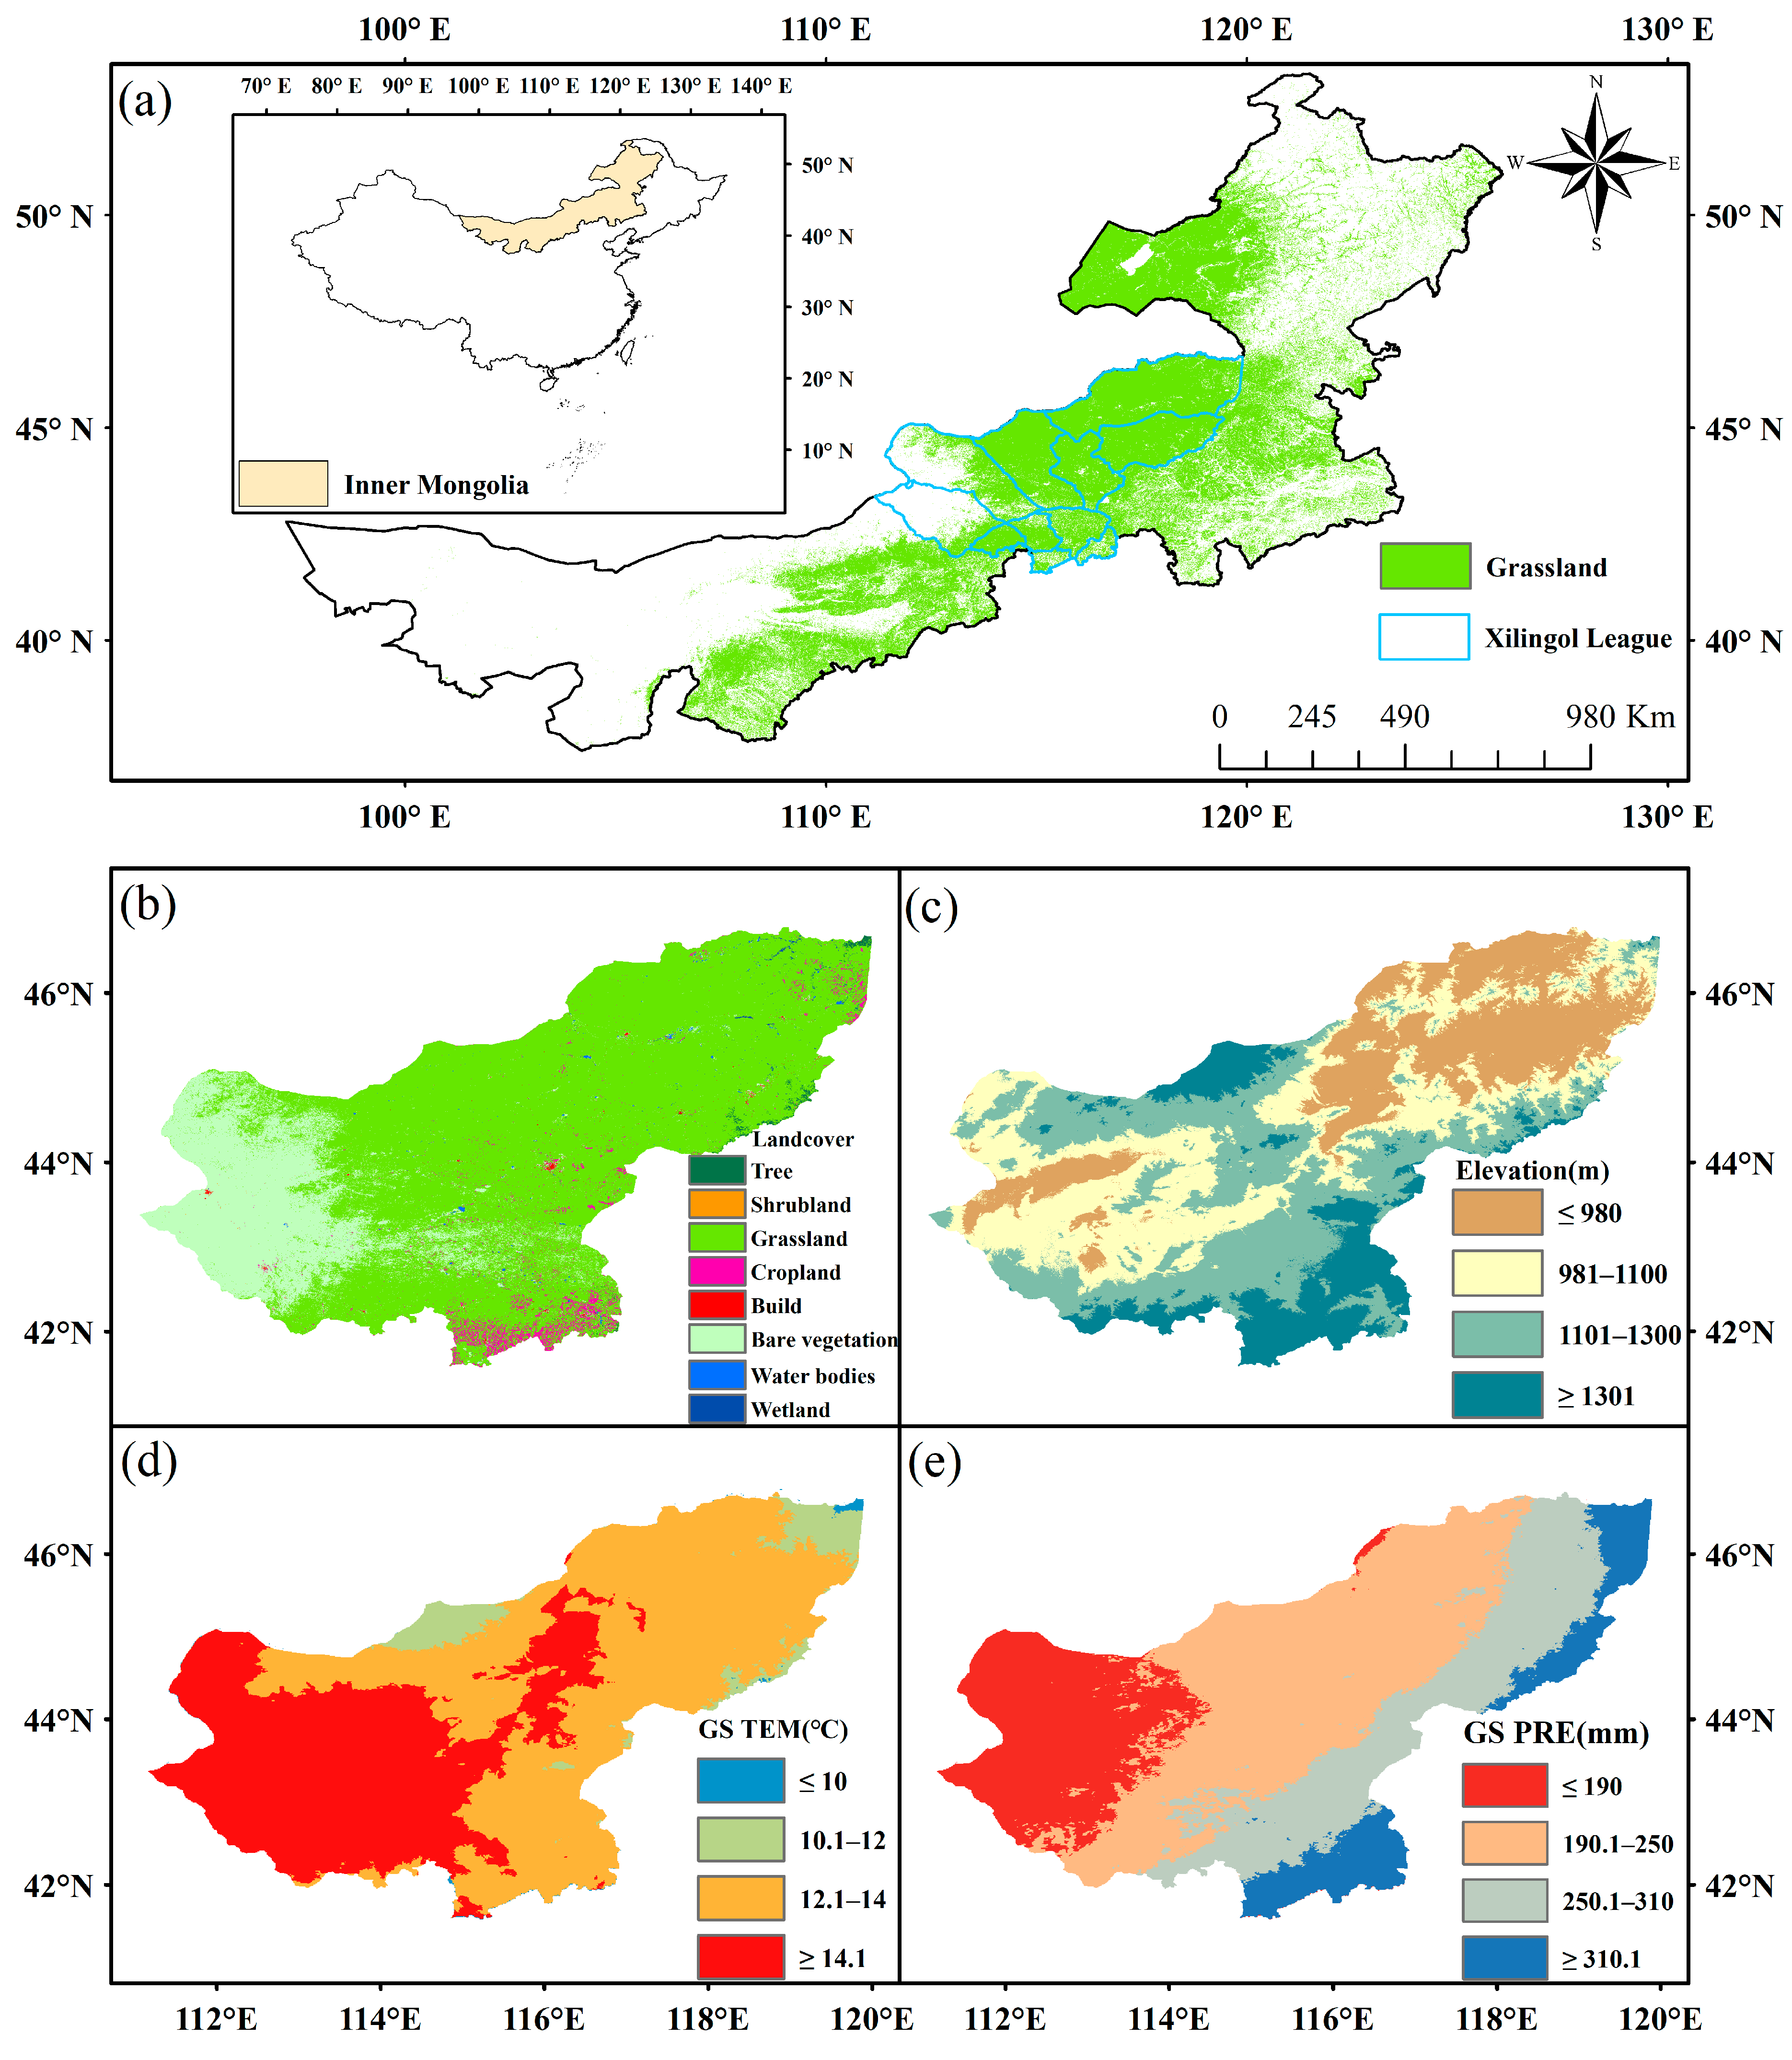
Figure 1. Geographical and climatic characteristics of Xilingol League. (a) Geographic location of Xilingol League indicating by blue bounding. (b) Landcover obtaining from the European Space Agency (ESA) World Cover 10 m 2020 v100 product. (c) Elevation. (d) Mean growing season temperature (4–10 month) (GS TEM) during 2001–2022. (e) Mean growing season precipitation (4–10 month) (GS PRE) during 2001–2022.
Agronomy 15 02018 g001
Figure 2. The methodological framework of this study. SECEs and CECEs present single extreme climate events and compound extreme climate events, respectively.
Agronomy 15 02018 g002
Figure 3. The spatial distribution of EOS and its response to climatic gradients in semi-arid grassland vegetation of Inner Mongolia. (a) The spatial distribution of EOS (Days of Year, DOY) from 2003 to 2022. The top and right panels in (a) respectively illustrated the variation of EOS with longitude and latitude. (b) The distribution of EOS in the climate space defined by growing season (4–10 month) temperature (GS TEM) and precipitation (GS PRE). The top panel in (b) showed the variation trend of EOS with every 15 mm increase in GS PRE, while the right panel showed the variation trend of EOS with every 2 °C increase in GS TEM. Blue dots of the panels in (b) indicated the trend of EOS was not statistically significant (p > 0.05), and red dots indicated the trend of EOS statistically significant (p < 0.05).
Agronomy 15 02018 g003
Figure 4. Interannual variation characteristics of the EOS from 2003–2022. (a) Interannual EOS standardized anomaly (EOSSA), the blue and red dashed lines represent the thresholds of 1.25σ and −1.25σ, respectively. (b) The trends of EOS across different periods. The green dotted line represents the EOS trend during 2003–2022, the blue dotted line indicates the EOS trend during 2003–2011, and the red dotted line shows the EOS trend during 2011–2022.
Agronomy 15 02018 g004
Figure 5. Spatial distribution of changes in the EOS from 2003–2022. (a) Interannual trends in the EOS during 2003–2022. (b) Abrupt change years for the EOS. (c) Trends before the abrupt change in the EOS. (d) Trends after the abrupt change in the EOS. The green pixels in the lower-left panel of each subplot represent areas where either the EOS trend or the breakpoint year passed statistical significance testing (p < 0.05), with the percentage of significant pixels explicitly provided.
Agronomy 15 02018 g005
Figure 6. Violin plots of the EOS trend distributions. (a) Distributions of the EOS trends during 2003–2022. (b) Distributions of the EOS trends before the breakpoint year. (c) Distributions of the EOS trends after the breakpoint year. The red dots indicate the mean trend of EOS. Significant pixels indicating EOS trends with statistical significance (p < 0.05), corresponding to results shown in Figure 5.
Agronomy 15 02018 g006
Figure 7. Spatial distribution of the changing rates of annual mean temperature (TEM) and precipitation (PRE) from 2001 to 2022. (a) Changing rate of TEM. (b) Changing rate of PRE. The green pixels in the top-left panel of each subplot indicate that the trend passed the significance test (p < 0.05). The data was obtained from the Ecosystem Cloud Service Platform (https://em.cams.cma.cn, (accessed on 25 July 2025)).
Agronomy 15 02018 g007
Figure 8. Annual percentage coverage (%) of extreme climate events in the study area. (ad) Represent extreme dry, extreme warm, extreme wet, and extreme cold events, respectively. (eh) Represent compound dry–warm, compound wet–warm, compound dry–cold, and compound wet–cold events, respectively.
Agronomy 15 02018 g008
Figure 9. Frequency of extreme climate events in the study area from 2001 to 2020. (ad) Represent extreme dry, extreme warm, extreme wet, and extreme cold events, respectively. (e) Represents compound dry–warm events.
Agronomy 15 02018 g009
Figure 10. Spatial distribution of the EOS standardized anomaly (EOSSA) under extreme climate events. (ad) Extreme dry, warm, wet, and cold events, respectively. (eh) Compound dry–warm, wet–warm, dry–cold, and wet–cold events, respectively.
Agronomy 15 02018 g010
Figure 11. Distribution of relationships between the EOS standardized anomaly (EOSSA) and extreme climate events along growing season temperature (GS TEM) and growing season precipitation (GS PRE) gradients under different extreme climate events. (ad) Extreme dry, warm, wet, and cold events, respectively. (eh) Compound dry–warm, wet–warm, dry–cold, and wet–cold events, respectively. The scatter plots in the top and right panels of each subfigure display the EOSSA relative to GS TEM and GS PRE, respectively.
Agronomy 15 02018 g011
Figure 12. Regulatory effects of compound extreme climate events on the EOS standardized anomaly (EOSSA). (a) Differences in EOSSA between compound dry–warm events and extreme dry or warm events. (b) Differences in EOSSA between compound wet–warm events and extreme wet or warm events. (c) Differences in EOSSA between compound wet–cold events and extreme wet or cold events. (d) Differences in EOSSA between compound dry–cold events and extreme dry or cold events. ∆ indicates differences in the EOSSA caused by single versus compound extreme climate events. *** indicates the significance of EOSSA among extreme climate events.
Agronomy 15 02018 g012
Figure 13. Spatial distribution of coincidence rates (CR) between the EOS standardized anomaly (EOSSA) and extreme climate events. (ad) Extreme dry, warm, wet, and cold events, respectively. (eh) Compound dry–warm, wet–warm, dry–cold, and wet–cold events, respectively.
Agronomy 15 02018 g013
Figure 14. Distribution of coincidence rates (CR) between the EOS standardized anomaly (EOSSA) and extreme climate events along growing season temperature (GS TEM) and growing season precipitation (GS PRE) gradients. (ad) extreme dry, warm, wet, and cold events, respectively. (eh) compound dry–warm, wet–warm, dry–cold, and wet–cold events, respectively. The scatter plots in the top and right panels of each subfigure display the CR relative to GS TEM and GS PRE, respectively.
Agronomy 15 02018 g014
Table 1. Threshold settings for extreme climate event identification.
SECEsThresholdCECEsThreshold
drySPEISA < −1.5dry–warmSPEISA < −1.5 & TmaxSA > 1.25
warmTmaxSA > 1.25dry–coldSPEISA < −1.5 & TminSA < −1.25
wetPRESA > 1.5wet–coldPRESA > 1.5 & TminSA < −1.25
coldTminSA < −1.25wet–warmPRESA > 1.5 & TmaxSA > 1.25
Disclaimer/Publisher’s Note: The statements, opinions and data contained in all publications are solely those of the individual author(s) and contributor(s) and not of MDPI and/or the editor(s). MDPI and/or the editor(s) disclaim responsibility for any injury to people or property resulting from any ideas, methods, instructions or products referred to in the content.