Article

Physiological and Transcriptomic Mechanisms of Exogenous Salicylic Acid-Induced Resistance to Ear Rot in Maize

1
College of Agronomy, Gansu Agricultural University, Lanzhou 730070, China
2
State Key Laboratory of Aridland Crop Science, Gansu Agricultural University, Lanzhou 730070, China
*
Author to whom correspondence should be addressed.
Agronomy 2025, 15(8), 2002; https://doi.org/10.3390/agronomy15082002
Submission received: 1 July 2025 / Revised: 13 August 2025 / Accepted: 18 August 2025 / Published: 20 August 2025
(This article belongs to the Section Pest and Disease Management)

Abstract

Maize ear rot is an important fungal disease in maize production, mainly caused by pathogens such as Fusarium graminearum, which seriously affects the yield and quality of maize. This study investigated the changes in the activity of defense-related enzymes in maize grains and their transcriptome response characteristics after exogenous SA treatment under Fusarium graminearum stress. The results showed that treatment with 0.01 mmol/L salicylic acid (SA) significantly inhibited the growth of Fusarium graminearum hyphae, while enhancing the activities of phenylalanine ammonia-lyase (PAL), superoxide dismutase (SOD), β-1,3-glucanase (β-1,3-GA), and polyphenol oxidase (PPO) in maize grains, and reducing the content of malondialdehyde (MDA), effectively alleviating the damage of Fusarium graminearum to the maize grain membrane system. Transcriptome analysis identified multiple key genes involved in SA-mediated disease resistance pathways, including disease-related proteins (PR10), acidic terpenoids, aspartic proteases, proteins containing BTB/POZ and MATH domains (BPM4), and PPT3 transporters. This study reveals the physiological and molecular mechanisms by which exogenous SA enhances maize resistance to ear rot, providing an important theoretical basis for further understanding the regulatory network of SA in plant disease resistance.

1. Introduction

Maize (Zea mays L.), as an important grain, feed, and industrial raw material crop, has a direct impact on national food security, animal husbandry development, and the extension of the maize deep-processing industry chain [1,2]. In recent years, with the continuous expansion of the maize planting area, disease problems have become increasingly serious and have become the main bottleneck restricting the sustainable development of the maize industry [3]. Among them, ear rot disease caused by fungi is common in maize production areas worldwide, especially during the maize harvest period. This disease causes ear rot and deterioration, resulting in serious yield losses and significantly reducing grain quality. More seriously, fungal toxins such as deoxynivalenol and fumonisin produced by pathogens pose a potential threat to human and animal health [4]. At present, the prevention and control of ear rot mainly rely on chemical agents and agronomic measures, but there are problems such as unstable control effects, high environmental risks, and high economic costs. Therefore, developing safe, efficient, and sustainable new strategies for the prevention and control of ear rot has important theoretical and practical significance.
SA is a phenolic compound with important physiological functions. As a key endogenous signaling molecule in plants, it plays a central regulatory role in plant defense responses and systemic acquired resistance (SAR) [5]. In recent years, extensive studies have shown that SA plays a crucial role in plant disease resistance and defense. Chen et al. [6], found that exogenous SA treatment can enhance disease resistance by regulating the metabolism of Panax notoginseng plants, reducing the content of metabolites such as D-(+)-trehalose and linoleic acid that are beneficial for the growth of root rot pathogens. Yang [7] reported that SA treatment significantly improved the resistance of Mango seedlings to leaf blight. In the prevention and control of Cucumber gray mold, Qu [8] confirmed that SA could enhance plant resistance by activating the defense enzyme system. In addition, a study by Yi showed that SA treatment could enhance the resistance of maize to Curvularia leaf spot [9]. These studies provide important references for the application of SA in the prevention and control of maize ear rot.
The composition of pathogens causing maize ear rot shows significant regional variations. Among numerous pathogens, Fusarium graminearum, as the dominant strain of the Fusarium graminearum species complex (FGSC), is not only widely distributed but also has strong pathogenicity [10,11,12,13,14,15]. However, currently there is relatively insufficient research on the molecular mechanism of maize ear rot caused by Fusarium graminearum. For this purpose, this study selected maize ear rot-resistant inbred line K0743 and highly susceptible inbred line K0742 as experimental materials. K0742 and K0743 are susceptible and resistant inbred lines previously screened and identified by the laboratory. K0742 was developed through continuous multi-generation selfing and selection from the self-selected material 1411-h1-1-1-1, while K0743 was bred through successive generations of selfing from the self-selected material [(19×19TB1438)-(2)]-2-1-Y2-3-4 (rot)-2-P2-1. At 4 days after silking (DAS), Fusarium graminearum suspension was inoculated using a seed wound inoculation method and treated with SA six hours later. By measuring physiological indicators related to disease resistance at different time points and combining transcriptome sequencing analysis, this study aims to investigate the regulatory effect of exogenous SA on maize ear rot resistance. The goal was to elucidate the molecular mechanism of SA-induced maize ear rot resistance and provide a theoretical basis and technical support for the green prevention and control of maize ear rot.

2. Materials and Methods

2.1. Test Materials

This experiment selected high ear rot-resistant maize inbred line K0743 and highly susceptible inbred line K0742 as experimental materials, and Fusarium graminearum was used as the pathogenic strain. The maize material was provided by Gansu Province and Heheng Maize Research Institute and was planted in the experimental base of the institute. K0742 and K0743 were planted in 15 rows each, with a row spacing of 60 cm and plant spacing of 30 cm, leaving 10 seedlings in each row. Normal management measures were adopted in the experimental field.
SA: white crystalline solid, purity ≥ 99%, purchased from Gansu Yuanxin Biotechnology Co., Ltd. (Lanzhou, China).
SA inhibitor: 1-aminobenzotriazole (ABT), solid, purchased from Gansu Aiweier Scientific Instrument Co., Ltd. (Lanzhou, China).
Fusarium graminearum: The strains of Fusarium graminearum used in the experiment were isolated, identified, and preserved by the Maize Research Group of the School of Agriculture, Gansu Agricultural University. After single spore isolation and purification, the strain was stored in potato glucose agar (PDA) italic medium and kept in a refrigerator at 4 °C for future use (Figure 1).

2.2. Test Methods

2.2.1. Determination of Colony Area

In the preliminary pre-trial experiments, we initially tested low concentrations such as 0.001 and 0.005 mmol/L. Although these concentrations demonstrated certain inhibitory effects, the outcomes were not yet pronounced. To further elucidate the inhibitory efficacy of salicylic acid, we selected four higher concentrations (0.01, 0.05, 0.1, and 0.5 mmol/L) [16] for subsequent experiments. The specific experimental procedure was as follows: first, the base PDA medium was prepared, sterilized, and cooled to an appropriate temperature. Then, under sterile conditions, different concentrations of salicylic acid solution (0.01, 0.05, 0.1, and 0.5 mmol/L) were added separately, with a control group treated with an equivalent amount of sterile water. After inoculating Fusarium graminearum discs with a diameter of 8 mm in the ultra-clean bench, the culture dishes were placed in a constant temperature incubator at 25 °C for dark culture. The colony area was measured using the Supcre series colony counting/screening/antibacterial circle measuring instrument (manufactured by Xunshu Technology Co., Ltd., Hangzhou, China, in March 2019) after 24 h and 48 h, respectively. Five plates were processed for each treatment, and three repeated experiments were conducted to compare the colony area sizes between different treatments and screen for the optimal concentration of SA that inhibits the growth of Fusarium graminearum.

2.2.2. Inoculation Methods and Field Resistance Determination

Fusarium graminearum inoculation was conducted on the susceptible maize inbred line K0742 at 4 days after pollination (4 DAP). According to agricultural industry standards, Fusarium graminearum conidia induction medium is used to induce the generation of conidia. Subsequently, a spore suspension with a concentration of 2 × 10⁶ spores/mL was prepared using sterile water. Inoculation was carried out using the kernel wounding method on the middle and upper portions of the maize ears. Each ear was inoculated with 2 ml, while the control group was injected with an equal amount of sterile water. After 6 h of inoculation, different concentrations of solutions were injected, with SA concentrations of (0.01, 0.05, 0.1, and 0.5) mmol/L and ABT concentrations of (0.01, 0.1, 0.5, and 1 mmol/L) [16], for a total of 8 treatment groups, and the control treatment was performed by injecting an equal volume of sterile water at the same inoculation site. Each treatment group consisted of 5 plants, with 3 replicates set up. The inoculation and injection of the solution were completed during the morning or cloudy period.
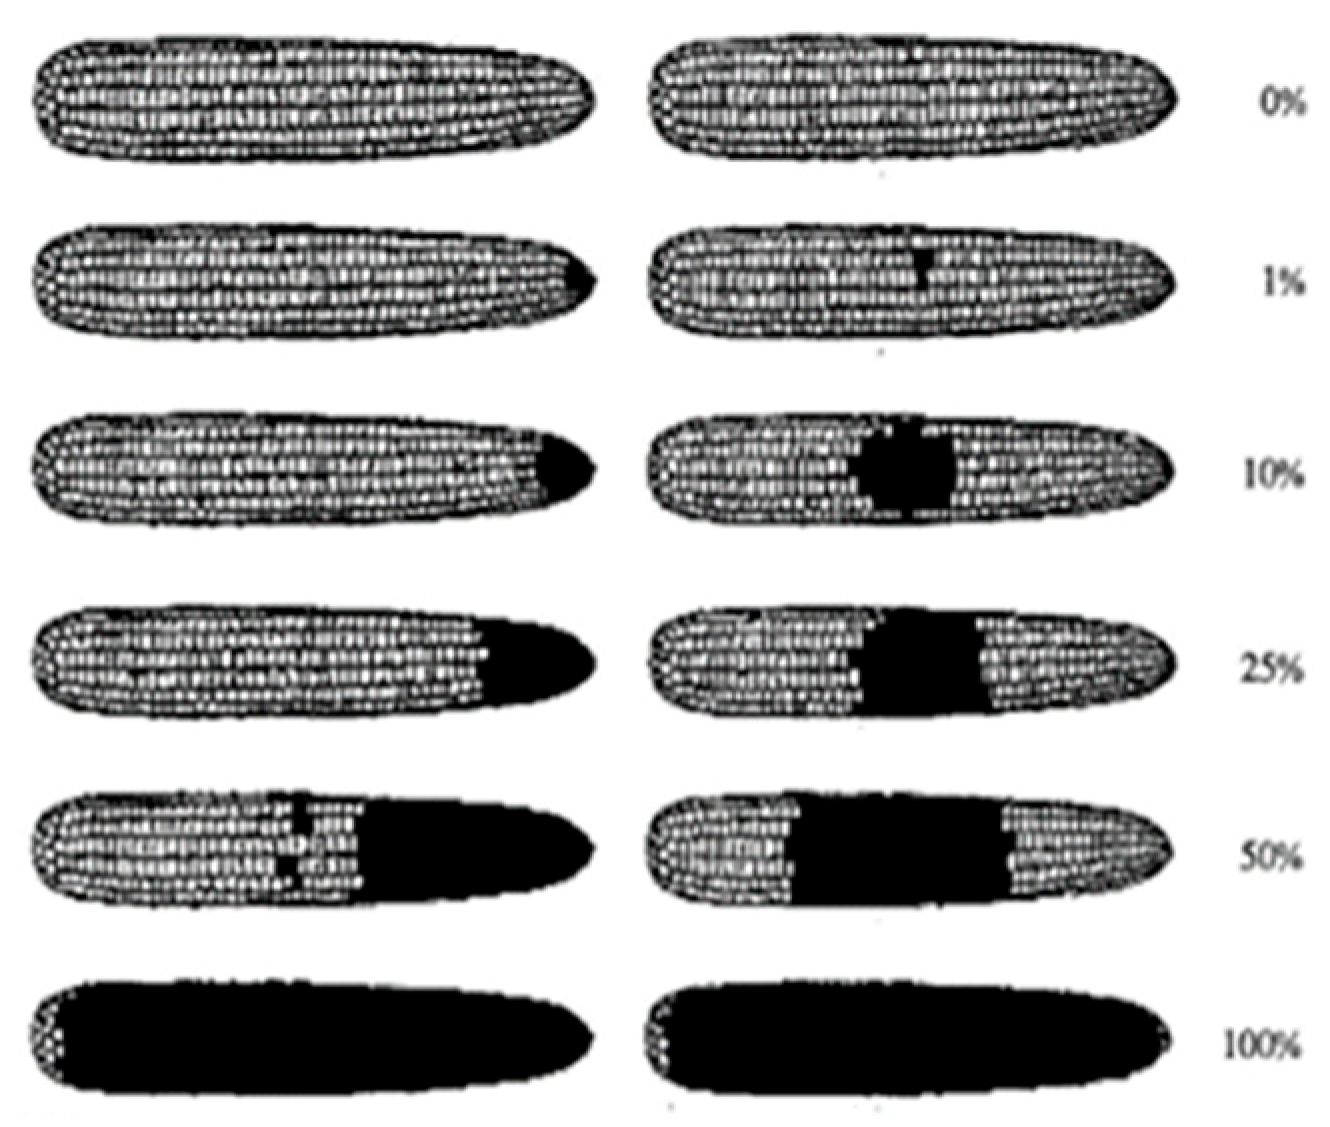
After the maize kernels matured, according to the “Technical Specification for Identification of maize Disease and Insect Resistance in the Agricultural Industry of the People’s Republic of China Part 8: Fusarium Ear Rot”, the disease level of the plants was calculated and resistance evaluation was carried out (Figure 2, Supplementary Materials Tables S1 and S2).

2.2.3. Sample Preparation and Enzyme Activity Determination

Inoculation was carried out on the fourth day after pollination of maize female ears, followed by treatment with either the optimal SA (SA) concentration (0.01 mmol/L) determined through preliminary colony area assays or sterile water control six hours post-inoculation (hpi). A total of six treatment combinations were designed for the experiment: susceptible inbred line inoculation + SA treatment (GJ-SA), susceptible inbred line inoculation + sterile water control (GJ-CK), susceptible inbred line non-inoculation + sterile water control (GW-CK), resistant inbred line inoculation + SA treatment (KJ-SA), resistant inbred line inoculation + sterile water control (KJ-CK), and resistant inbred line non-inoculation + sterile water control (KW-CK). Each treatment involved inoculating 15 maize ear samples, with three biological replicates. Samples were collected at five time points: 0, 1, 3, 5, and 7 days after treatment. The determination of MDA content refers to the methods of Chen et al. [18]. PAL activity was determined using the phenylalanine colorimetric method [19]. The determination of SOD activity, PPO activity, and β-1,3-GA activity were carried out using the superoxide dismutase activity detection kit (item number: BC0170), polyphenol oxidase activity detection kit (item number: BC0195), and β-1,3-GA activity detection kit (item number: BC0365) developed by Beijing Soleibao Technology Co., Ltd. (Beijing, China).

2.2.4. Transcriptomic Analysis

Based on the previous determination results of disease-resistant-related defense enzymes (the activities of PAL, SOD, PPO, β-1, 3-GA and the content of MDA mostly reached the peak on the fifth day), in this study, samples on the fifth day were selected for transcriptome sequencing analysis.
Total RNA Extraction, Library Construction
Total RNA was extracted from 18 maize kernel samples using TRIzol (Life technologies, Carlsbad, CA, USA) method. Subsequently, RNA purity was detected using a NanoDrop 2000 spectrophotometer (Thermo Fisher Scientific, Wilmington, DE, USA) (OD260/280 ratio range of 1.9–2.0), and RNA integrity was evaluated using an Agilent 2100 Bioanalyzer (Lab Chip GX chip) (Agilent Technologies, CA, USA) (RIN value > 7.0). Qualified samples were enriched with Oligo (dT) magnetic beads for mRNA, and the NEB Next Ultra RNA Library Prep Kit (New England Biolabs, Ipswich, MA, USA) was used for library construction. After quality testing with Agilent 2100 Bioanalyzer, the constructed library was subjected to high-throughput sequencing using PE150 mode on the Illumina NovaSeq 6000 platform (Illumina, San Diego, CA, USA). The raw sequencing data underwent strict quality control processing to obtain clean data for subsequent bioinformatics analysis.
Sequence Alignment and Analysis of Differentially Expressed Genes
Firstly, the clean reads were aligned with the reference genome B73 (Zm_B73_REFERENCE_NAM_4.0) using HISAT2 (v2.1.0) software. Subsequently, transcript assembly and gene expression levels were calculated using StringTie (v1.3.4), and the expression levels were standardized using FPKM (Fragments Per Kilobase of transcript per Million mapped reads) method. Differential expression gene analysis was conducted using the DESeq-EBSeq software package (1.39.0), and statistical tests were performed based on the negative binomial distribution model. The screening criteria for differentially expressed genes were set as: fold change (FC) ≥ 2 with an adjusted p-value < 0.05.
GO Function and KEGG Pathway Enrichment Analysis
Functional annotation of differentially expressed genes was performed using InterProScan software (5.34–73.0). Based on the Blast2 GO (v5.2.5) platform, differentially expressed genes were systematically annotated at three levels: molecular function, cellular component, and biological process. Meanwhile, differential genes were annotated for pathways using the KEGG (Kyoto Encyclopedia of Genes and Genomes) database (Release 94.1), and pathway enrichment analysis was performed using KOBAS (v3.0) software. The signal transduction pathways (such as the MAPK signaling pathway, plant pathogen interaction pathway, etc.) and metabolic pathways (such as phenylpropanoid metabolism, flavonoid biosynthesis, etc.) related to plant disease resistance were focused on in order to reveal the key signaling pathways through which SA regulates maize resistance to ear rot.
Differentially Expressed Genes Validation by RT-qPCR
Based on the results of transcriptome analysis, 5 differentially expressed genes were randomly selected for expression validation. Firstly, specific primers were designed using Primer Premier 5.0 software (Supplementary Table S3). Subsequently, the RNA samples from 18 maize materials were reverse-transcribed into cDNA using the Acori reverse transcription kit. The qPCR reaction was performed using the SYBR Green method on a Quant Studio 6 Flex real-time fluorescence quantitative PCR instrument, with 3 replicates set for each sample. The relative expression level of genes was calculated using the 2−ΔΔCt method, with GAPDH as the internal reference gene. Finally, the reliability of the sequencing results was verified by comparing the expression trends between qPCR results and transcriptome data.
Weighted Gene Co-Expression Network Analysis (WGCNA)
The transcriptome expression profile information obtained through RNA sequencing technology was used. With the screening criteria of an FPKM value ≥1, module similarity coefficient >2, and the number of genes contained in the module ≥30, the weighted gene co-expression network was constructed using the WGCNA software package (https://dp.biocloud.net/rna_ref.html#/zh/personal/differentialMining/customer/wgcna?id=8a828b8293ba51690193bf3c56730156, 19 August 2025). Phenotypic association assessment was conducted on the generated co-expression modules, and the functional gene sets within the modules were extracted. The visual presentation of the gene interaction network of the core module was realized through the Cytoscape software system (3.10.1). Based on the gene connectivity index, the core regulatory genes within the module were located and identified.

2.2.5. Data Processing

Excel 2019 was used for data organization and preliminary statistical analysis, and SPSS 22.0 (IBM, Amonk, NY, USA) was used for data statistical analysis. The data are presented as mean ± standard error (Mean ± SE), with one-way analysis of variance (ANOVA) used for inter-group comparisons and the LSD method used for multiple comparisons. The significance test level p was set at 0.05 (two-sided test).

3. Results

3.1. The Effect of Exogenous SA Treatment on the Occurrence of Maize Ear Rot

3.1.1. The Effect of Exogenous SA on the Mycelial Growth of Fusarium graminearum

Exogenous SA treatment showed a significant inhibitory effect on the mycelial growth of Fusarium graminearum (Figure 3). At 24 h, the colony areas of different concentrations of SA were significantly smaller than those of CK (adding an equal amount of sterile water to the culture medium). Among them, when the concentration of SA was 0.01 mmol/L, the colony area was the smallest, significantly reducing by 33.86% compared with CK (p < 0.05) (Figure 3A,C). At 48 h, the colony area of the SA treatment group was still significantly smaller than that of CK. Among them, the colony area of the 0.01 mmol/L SA treatment group was the smallest, which decreased by 36.01% compared with CK, and the difference was significant (p < 0.05) (Figure 3B,D). Throughout the observation period, SA at a concentration of 0.01 mmol/L consistently showed the best inhibitory effect, which is the optimal concentration for inhibiting the growth of Fusarium graminearum.

3.1.2. The Effect of Exogenous SA on Maize Ear Rot Resistance

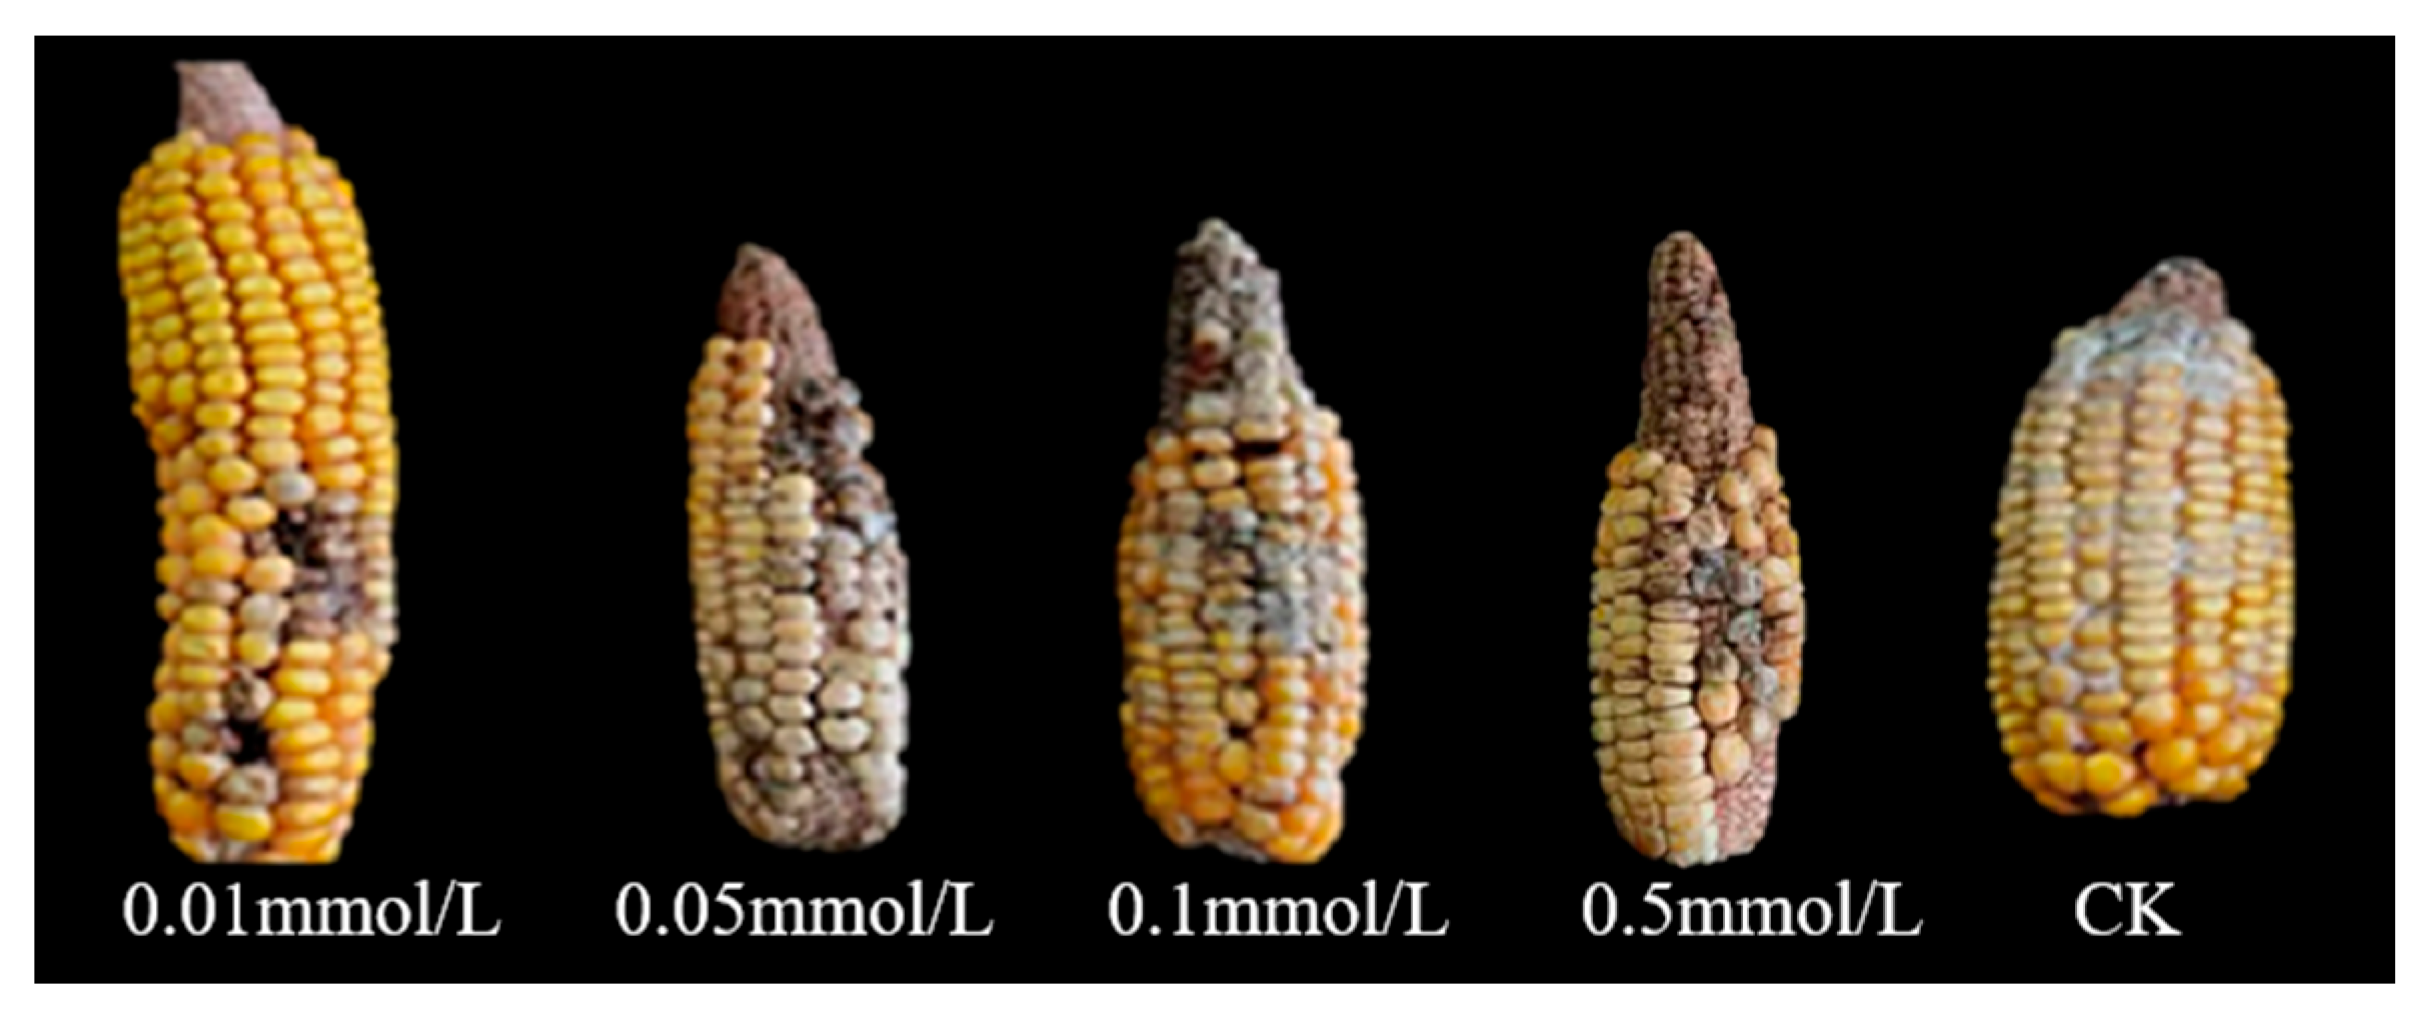
In the susceptible inbred line K0742, the disease severity index of the control group CK (injected with an equal volume of sterile water) was 6.33, with a resistance rating of susceptible (S). When the salicylic acid concentration was 0.1 mmol/L, both the disease severity index and resistance rating remained consistent with those of the CK group. When the concentration of SA decreased to 0.05 mmol/L, the disease level rose to 7.67, which was higher than that of the control group, and the resistance evaluation was high susceptibility (HS). However, when the concentration of SA further decreased to 0.01 mmol/L, the disease level dropped to the lowest, which was 2.33, and the resistance evaluation was disease resistance (R). According to analysis of the disease level of inbred lines, an appropriate concentration of SA can effectively inhibit the growth of Fusarium graminearum, thereby improving the resistance of maize ear rot. In addition, an SA concentration of 0.01 mmol/L is the optimal concentration for inhibiting the growth of Fusarium graminearum, which is consistent with the concentration screened by colony area. (Figure 4, Supplementary Materials Table S4).

3.1.3. Effects of SA Inhibitors on Resistance to Maize Ear Rot

In the susceptible inbred line K0742, the control group CK (injected with an equal amount of sterile water) showed a disease severity rating of 6.33, with a resistance evaluation of susceptible (S). The average disease severity ratings under different ABT concentrations were all higher than that of the CK group. Especially when the ABT concentration was 0.1 mmol/L and 0.5 mmol/L, the average disease level reached its peak (9.0), and the resistance evaluation was high susceptibility (HS). When the ABT concentration was 1 mmol/L and 0.01 mmol/L, the average disease levels were 7.67 and 7.00, respectively, and the resistance evaluations were highly susceptible (HS) and susceptible (S), respectively. The above results indicate that using specific concentrations of ABT treatment may reduce the resistance of maize to ear rot (Figure 5, Supplementary Materials Table S5).

3.2. The Effect of SA Treatment on Disease Resistance-Related Indicators in Maize Kernels

As shown in Figure 6, the activity changes of the four disease resistance-related enzymes were significant and have similar trends. Among them, the SOD activity reached its peak on the fifth day. The SOD activity of the GJ-SA treatment group was 10.24% higher than that of the GJ-CK control group, and the KJ-SA treatment group was 43.75% higher than that of the KJ-CK control group (Figure 6A). The PAL activity reached its peak at day 0. The enzyme activity of two maize inbred lines treated with SA after inoculation was significantly higher than that of the control group. The PAL activity of the GJ-SA treatment group increased by 23.03% compared to GJ-CK, and the KJ-SA treatment group increased by 39.47% compared to KJ-CK (Figure 6B). In addition, SA treatment resulted in a peak of β-1,3-GA activity in maize kernels after 1 day of treatment. The GJ-SA treatment group increased by 22.01% compared to the GJ-CK control group, and the KJ-SA treatment group increased by 21.60% compared to the KJ-CK control group (Figure 6C). The PPO activity reached its peak on the fifth day of treatment, with the KJ-SA treatment group being 67.40% higher than the KJ-CK control group, and the GJ-SA treatment group being 66.85% higher than the GJ-CK control group (Figure 6D). After SA treatment, the MDA content in maize kernels showed a decreasing trend, and the degree of decrease varied among different treatments. On the seventh day of treatment, the MDA content in the GJ-SA and KJ-SA treatment groups reached its lowest value, decreasing by 79.5% and 87.33%, respectively, compared to the control group (Figure 6E). The SOD, PAL, PPO, and β-1,3-GA activities in the kernels of maize inbred line K0742 were generally lower than those in K0743, while its MDA content was higher than that of K0743, indicating that the disease-resistant material exhibits stronger stress resistance compared to the susceptible material.

3.3. Transcriptome Sequencing and Analysis

3.3.1. Quality Assessment of Sequencing Data

In this study, the Illumina high-throughput sequencing platform was used to perform transcriptome sequencing on 18 treated samples. As shown in Supplementary Materials Table S6, the average total number of pair-end reads obtained for each sample was greater than 19 million, the total number of bases was greater than 60 million, the base percentages of Q30 were all over 92.78%, and the GC content was stable between 49% and 51%. These high-quality sequencing data provide reliable assurance for subsequent differential gene expression analysis. By comparing with the reference genome (ZmB73-REFERENCE_NAM_4.0), the alignment efficiency of each sample ranged from 77.32% to 87.21%, indicating good experimental design and library quality.

3.3.2. Analysis of Differentially Expressed Genes

The results of transcriptome analysis showed that K0743 exhibited more significant differential gene expression compared to K0742 under ear rot stress and exogenous SA treatment. Specifically, K0743 detected 5319 upregulated and 4744 downregulated differentially expressed genes (DEGs) after inoculation with Fusarium graminearum, and 2772 upregulated and 2451 downregulated DEGs under SA treatment. In contrast, K0742 only detected 1172/1559 and 1395/1284 DEGs under the same conditions (Figure 7A). Through Venn diagram analysis, we identified 246 common genes associated with SA (FC > 2, p < 0.05). In the comparison between GJ-CK vs. GJ-SA and GJ-CK vs. GW-CK, 112 genes were downregulated and 134 genes were upregulated. In the comparison of KJ-CK vs. KJ-SA and KJ-CK vs. KW-CK, 134 genes were downregulated and 112 genes were upregulated. These genes may constitute a key regulatory network for SA-induced resistance (Figure 7B). The research results indicate that: (1) Disease-resistant materials enhance defense response through broader transcriptional regulation; (2) SA can specifically activate the expression of disease resistance-related genes; (3) Different materials share both SA response pathways and specific regulatory mechanisms. These findings provide important evidence for analyzing the molecular mechanisms of maize resistance to ear rot.

3.3.3. GO Enrichment Analysis

GO Enrichment Analysis of Two Inbred Lines Under Maize Ear Rot Stress
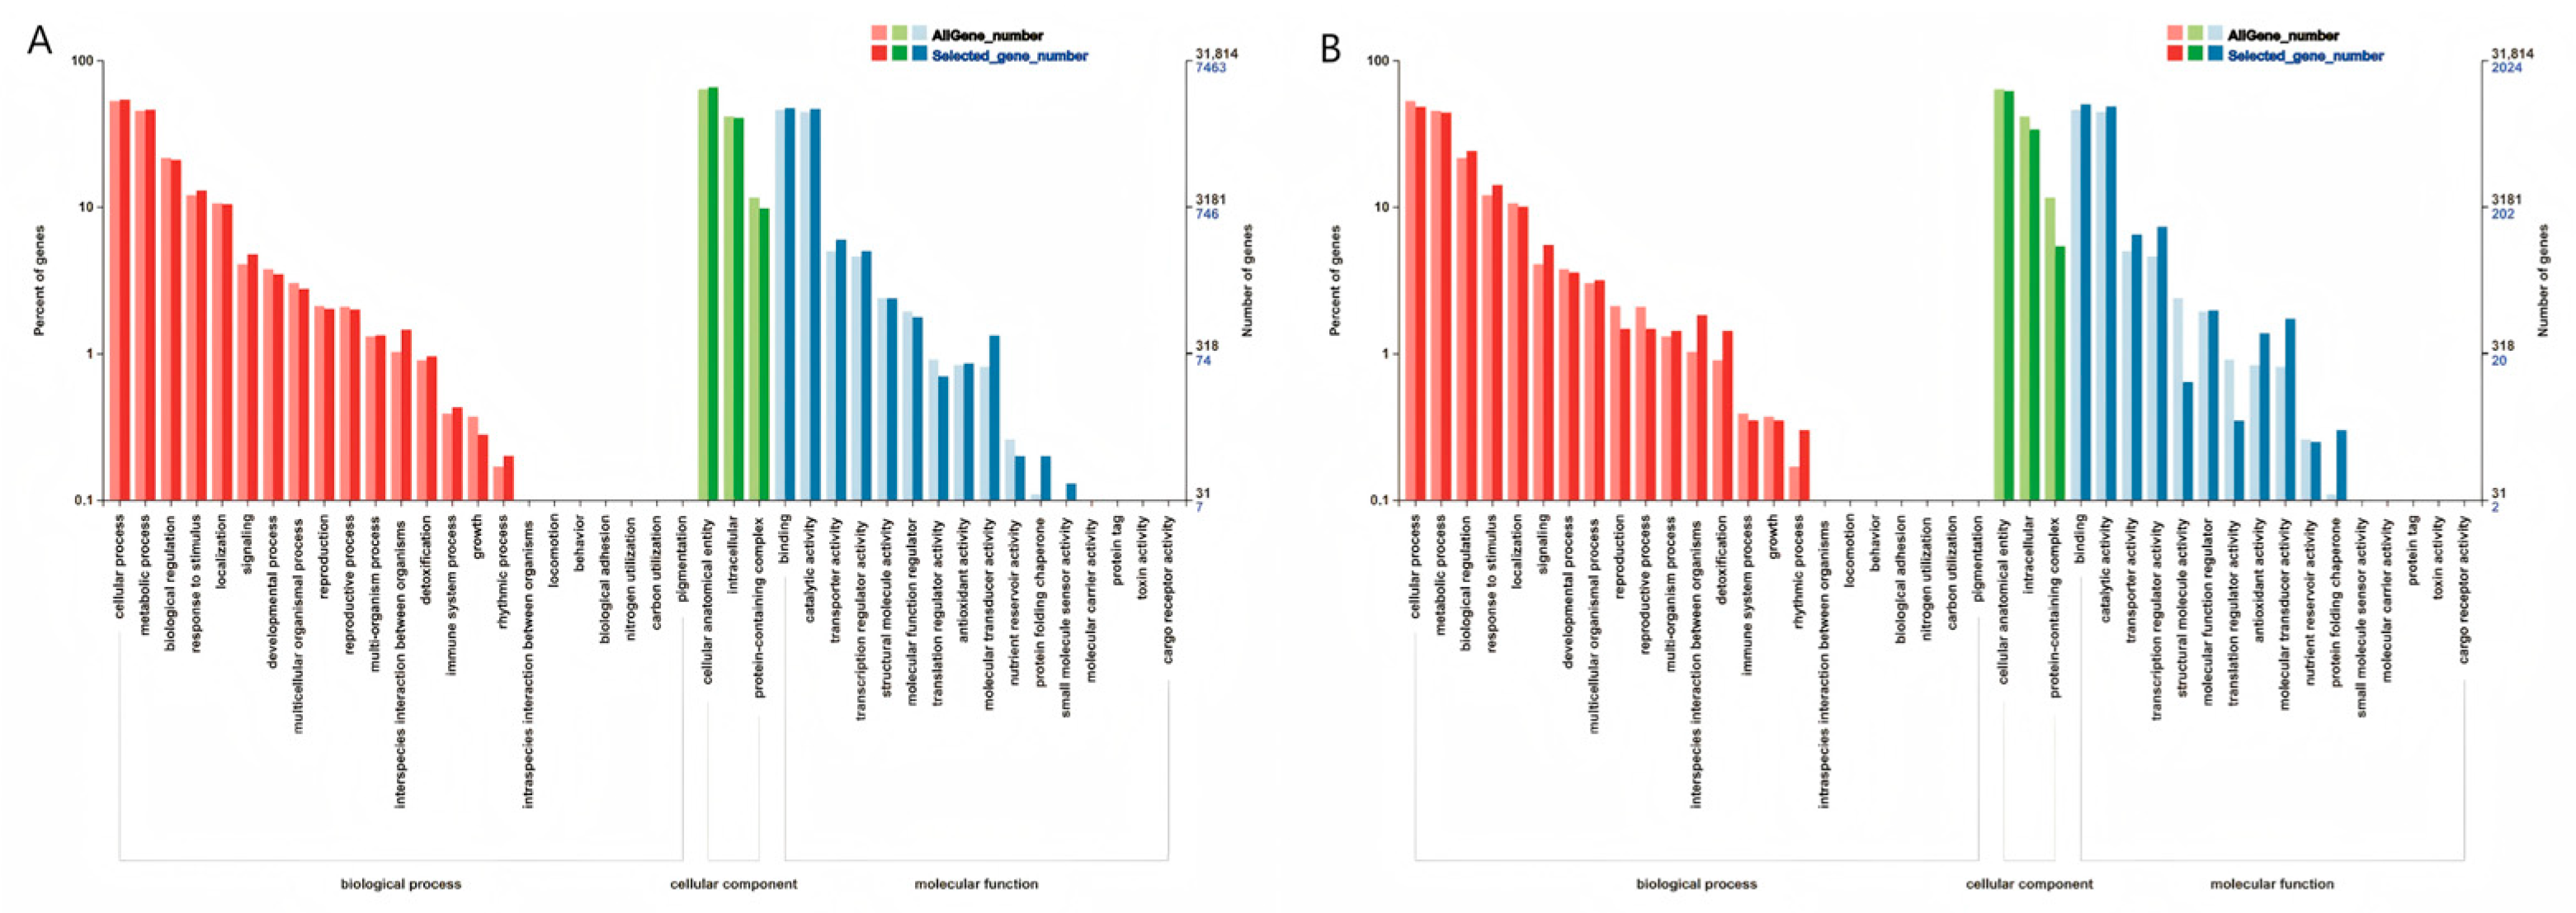
The results of GO enrichment analysis (Figure 8) showed that under the stress of Fusarium graminearum, the differentially expressed genes (DEGs) of K0743 and K0742 exhibited similar enrichment trends in the three functional categories, but there were significant differences in quantity. Specifically, the DEGs of the two inbred lines were significantly enriched in cellular processes, metabolic processes, and biological regulation at the biological process (BP) level; at the cellular component level, they were mainly enriched in cellular anatomical entities, intracellular structures, and protein containing complexes; at the molecular functional level, they were significantly enriched in binding, catalytic activity, and transporter activity. The number of enriched genes in each functional item of K0743 was significantly higher than that of K0742, with this difference being particularly significant in functional categories closely related to disease resistance, such as metabolic processes and catalytic activity.
GO Enrichment Analysis of Two Inbred Lines Under Exogenous SA Treatment
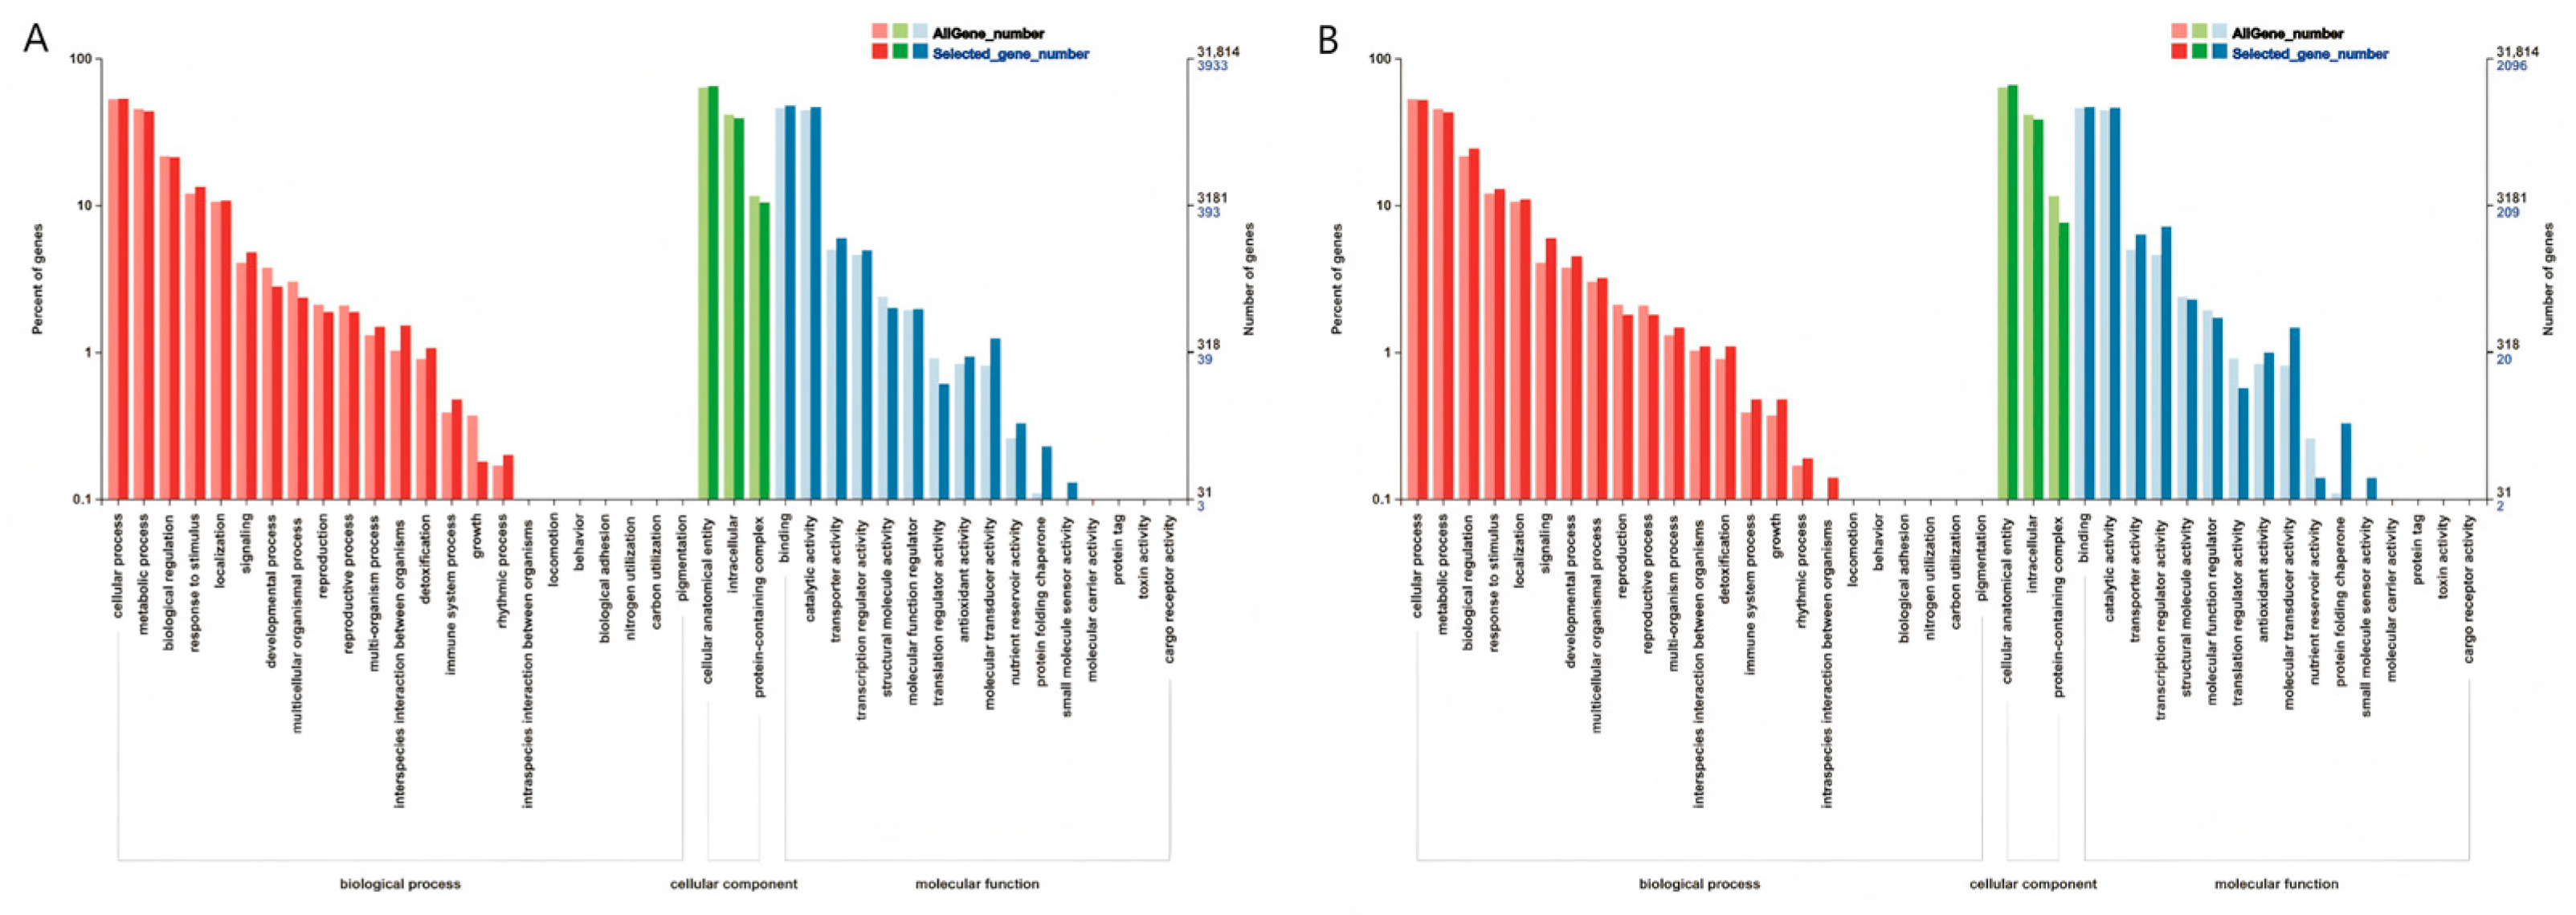
Under exogenous SA treatment conditions, the differentially expressed genes between K0743 and K0742 showed similar GO functional enrichment characteristics (Figure 9). At the BP level, DEGs were mainly enriched in key items such as cellular processes, metabolic processes, and biological regulation. In terms of cellular components, they included the structure and components of cells, and intracellular and protein-containing complexes; In terms of molecular functions, they included binding, catalytic activity, and transport activity. It is worth noting that although the two inbred lines were highly similar in terms of functional enrichment patterns, the K0743 had a higher number of enriched genes in each functional category than K0742. This difference may be related to the sensitivity of different inbred lines to exogenous SA, suggesting that disease-resistant materials may enhance their disease resistance through more efficient signal transduction and metabolic regulation.

3.3.4. Enrichment Analysis of Differentially Expressed Genes KEGG

KEGG Enrichment Analysis of Two Inbred Lines Under Fusarium graminearum Stress
The KEGG pathway enrichment analysis (Figure 10) revealed the different metabolic response characteristics of maize inbred lines with different resistance to ear rot stress. In the sensitive material K0742 (GJ-CK vs. GW-CK), differentially expressed genes were mainly enriched in basic defense pathways, such as plant hormone signaling transduction, plant pathogen interaction, the MAPK signaling pathway, and starch and sucrose metabolism. The disease resistant material K0743 (KJ-CK vs. KW-CK) was significantly enriched in more complex regulatory networks, such as plant hormone signal transduction, plant pathogen interactions, starch and sucrose metabolism, carbohydrate metabolism, glycolysis, or gluconeogenesis.
KEGG Enrichment Analysis of Two Inbred Lines Under Exogenous SA Treatment
The results of KEGG enrichment analysis showed (Figure 11) that the differentially expressed genes of K0742 (GJ-CK vs. GJ-SA) were significantly enriched in metabolic pathways such as plant hormone signaling transduction, plant pathogen interaction, and the MAPK signaling pathway. In contrast, the differentially expressed genes in K0743 (KJ-CK vs. KJ-SA) were mainly enriched in plant pathogen interactions, plant hormone signal transduction, carbon metabolism, and starch and sucrose metabolism. By comparing two inbred lines, it was found that after treatment with SA, the differentially expressed genes of K0743 were specifically enriched in pathways such as carbon fixation and fatty acid biosynthesis in photosynthetic organisms. The differentially expressed genes of K0742 were specifically enriched in processes such as fructose and mannose metabolism, as well as the pentose phosphate pathway. This difference reveals that susceptible and resistant materials may respond to pathogen infection through different metabolic regulatory mechanisms.

3.3.5. RT-qPCR Validation

To ensure the reliability of transcriptome data, in this study, the expression patterns of five randomly selected differentially expressed genes were verified by RT-qPCR technology (Figure 12). The results showed that the expression patterns of all detected genes were highly consistent with the transcriptome results, indicating that the transcriptome sequencing results were accurate and provided reliable evidence for the functional research of disease resistance-related genes in the future.

3.3.6. WGCNA Analysis

Construction of Gene Co-Expression Module
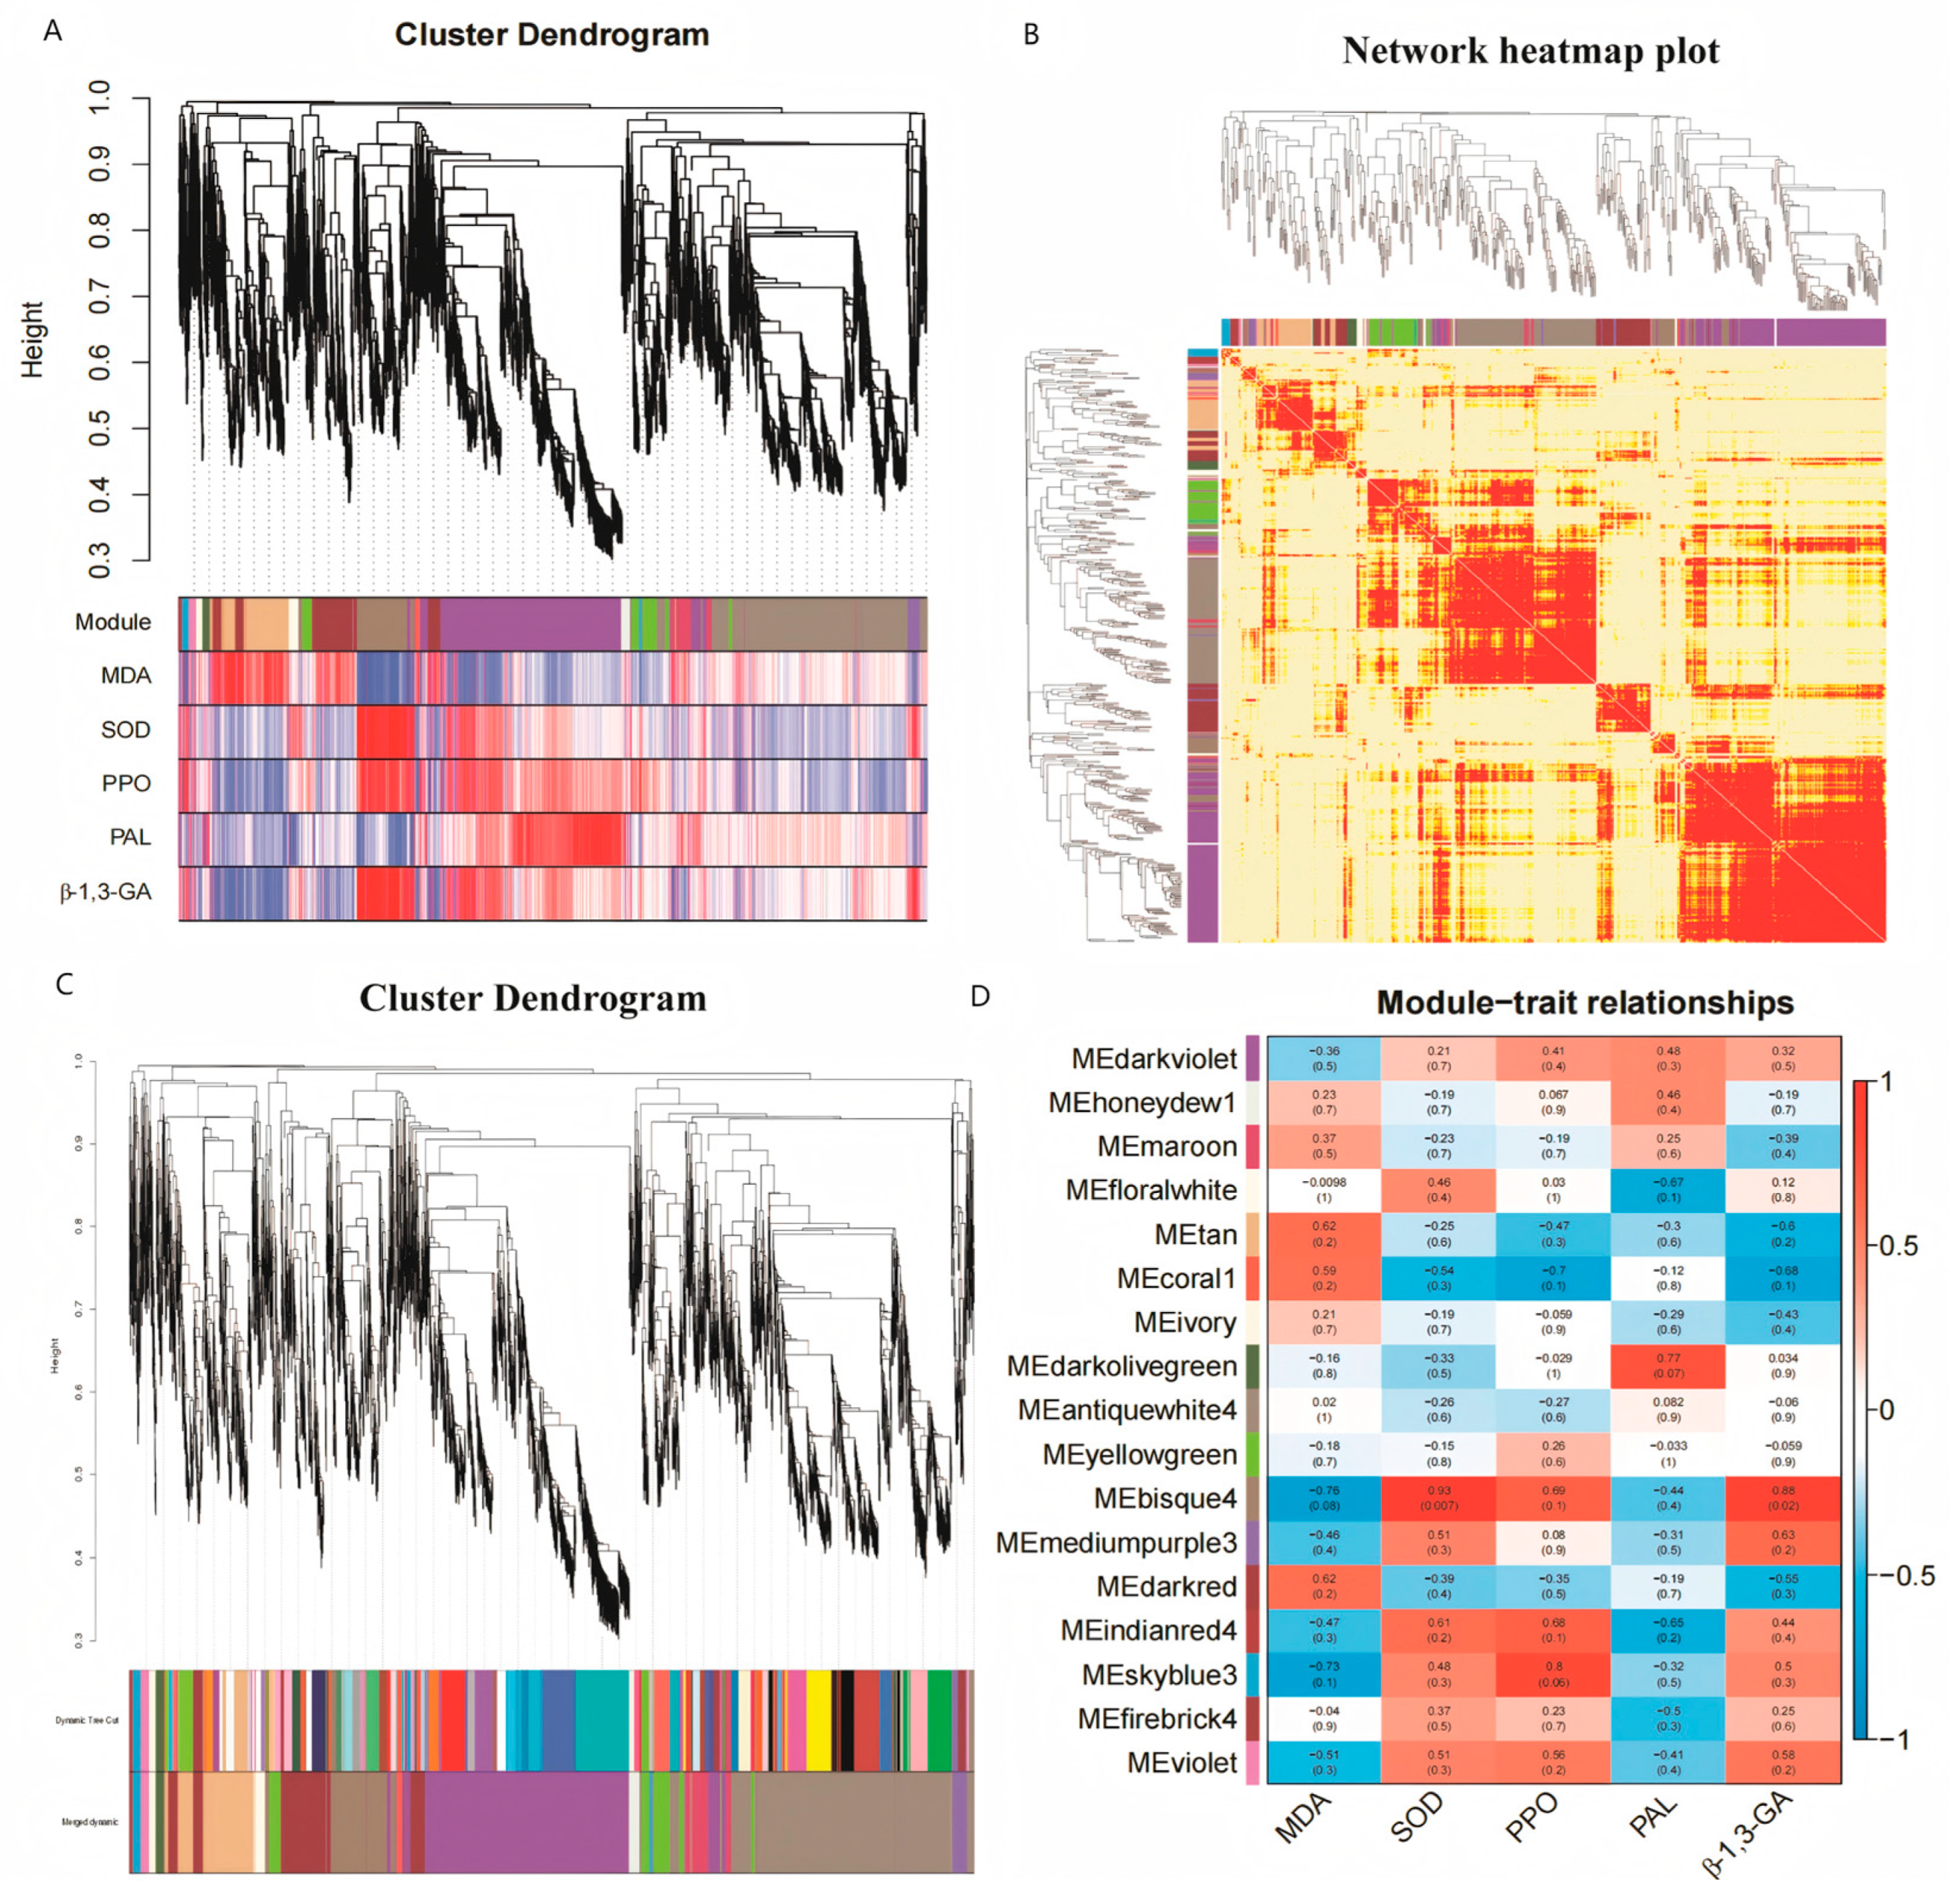
This study evaluated the association between 17 gene modules and phenotypic traits using a weighted gene co-expression network analysis (WGCNA) system. As shown in (Figure 13), physiological indicators related to disease resistance, including SOD activity and PPO activity, showed a significant positive correlation with the two modules of MEbisque4 (r = 0.93, p = 0.007) and MEskyblue3 (r = 0.8, p = 0.06). Subsequent research will focus on analyzing the gene composition of these two key modules and their regulatory mechanisms in maize resistance to ear rot.
Functional Analysis of Related Gene Modules
Based on WGCNA analysis, two key modules, MEbisque4 and MEskyblue3 were selected (Figure 14 and Figure 15). GO enrichment analysis showed that the BP of Bisuque4 module genes was mainly enriched in metabolic processes, cellular components, single organism processes, biological regulation, and response to stimuli. The enriched CC includes cells, cellular components, organelles, membrane components, organelle parts, and molecular complexes. The enriched MF includes binding, catalytic activity, transport activity, and nucleic acid binding transcription factor activity. The GO enrichment of the skyblue3 module is basically the same. KEGG pathway analysis further revealed its specificity: the MEbisque4 module was significantly enriched in plant pathogen interactions, protein processing in the endoplasmic reticulum, and plant hormone signaling pathways, including two disease resistance-related transcription factors (such as WRKY74); the MEskyblue3 module specifically participates in the biosynthesis of sesquiterpenes and triterpenoids, as well as the biosynthesis of isoalkanes, and contains two pathogenesis-related protein genes. These results suggest that these genes may participate in disease resistance responses by regulating defense signal transduction and secondary metabolism.
Gene Module Core Genes and Visualization Analysis
Based on Cytoscape software (3.10.1) for network topology analysis, we visualized the top 500 genes with weights in the bisque4 and skyblue3 modules (Figure 16) and identified 14 core gene nodes. By integrating gene annotation information (Supplementary Materials Table S7), five key genes that may be involved in SA signal-mediated disease resistance regulation were identified: (1) Defense-related proteins: PR protein (Zm00001d023811) and aspartic protease (Zm00001d012415); (2) Secondary metabolite synthesis: Terpenoid synthase (Zm00001d014134); (3) Protein ubiquitination degradation: BPM4 (Zm00001d026505); (4) Material transport: Phenolic compound transporter PPT3 (Zm00001d037659). These genes exhibit high connectivity (average connectivity ≥ 1.84/1.89) in the module network, and their encoded proteins are involved in plant defense responses, secondary metabolism, protein degradation regulation, and defense substance transport. They may collectively form the core components of the SA-induced maize ear rot resistance regulatory network.

4. Discussion

4.1. The Inhibitory Effect of Exogenous SA on Fusarium graminearum and Its Disease Resistance Effect

SA, as a key regulatory molecule in plant defense signaling pathways, plays a central role in inducing systemic acquired resistance (SAR). This study confirms that 0.01 mmol/L SA treatment can significantly inhibit the mycelial growth of Fusarium graminearum, and the disease index of maize ear rot is the lowest at this concentration. This finding is consistent with the research conclusion of Jia et al. [20] in dicotyledonous plants, and also has a similar mode of action to the SA inhibition of Soybean mold reported by Wang et al., (inhibition rate of 26.57%) [21]. The inhibitory effect of SA is closely related to its treatment duration. In solid media, salicylic acid treatment for 24 and 48 h significantly inhibited the growth of Fusarium graminearum hyphae, indicating that the fungus initiates a series of coping mechanisms within a short period of time. Furthermore, the longer the salicylic acid treatment duration, the more significant its inhibitory effect on fungal growth becomes, but it may also induce adaptive responses in the fungus [22]. Through reverse validation experiments with SA inhibitors, it was further confirmed that blocking the endogenous SA signaling pathway significantly reduces maize resistance to ear rot, which is in stark contrast to the disease resistance enhancement effect of the SA treatment group. The above results collectively indicate that: (1) SA functions through a dual mechanism of directly inhibiting the growth of pathogens and activating plant defense responses; (2) a concentration of 0.01 mmol/L SA is the most effective disease-resistant induction concentration under the conditions of this experiment; (3) The SA-mediated disease resistance pathway plays an important regulatory role in the maize Fusarium graminearum interaction system. This discovery provides direct experimental evidence for the application of SA in the prevention and control of maize ear rot.

4.2. Regulation of Exogenous SA on the Defense Enzyme System Related to Maize Ear Rot

This study reveals the regulatory mechanism of exogenous SA on the maize defense enzyme system. After treatment with 0.01 mmol/L SA, the activities of key defense enzymes in maize kernels showed regular changes: SOD, PPO, PAL, and β-1,3-GA activities mostly reached their peak on the fifth day. This result is consistent with the findings of Liu [23] et al. in barley and Xu [24] et al., in Cabbage, confirming the universal mechanism of SA enhancing plant resistance by reducing membrane lipid peroxidation damage. These indicators reflect the activation status of different defense pathways in maize against ear rot invasion. By integrating the dynamic changes of these five indicators and combining them with the disease index, the induction effect of SA can be more accurately reflected, providing a reliable basis for resistance analysis and application. The research results indicate that: (1) SA establishes systemic resistance by synergistically regulating multiple defense pathways, such as the antioxidant system, phenylpropane metabolism, and cell wall reinforcement; (2) There is a specific time window for defense response; (3) Genetic background significantly affects the induction effect of SA, and resistant materials exhibit stronger SA response ability. These findings not only deepen our understanding of the physiological mechanisms of SA-induced disease resistance but also provide an important theoretical basis for optimizing the application of SA in the prevention and control of maize ear rot.

4.3. Analysis of Key Disease Resistant Genes Regulated by the SA Signaling Pathway

This study identified multiple key disease resistance genes regulated by SA through transcriptome analysis, and their molecular mechanisms can be summarized in the following four aspects:
(1)
The defense function of the aspartate protease gene
As a core member of the proteolytic enzyme family, the catalytic activity of aspartic acid protease is determined by its conserved aspartic acid residues forming a catalytic dimer, which plays a crucial role in plant immunity [25]. This study found that SA treatment can significantly induce upregulation of gene expression. This is consistent with the research results that the PSI of potato St Asp can inhibit two physiological races of potato pathogenic fungi. Under acidic pH conditions, PSI may interact with negatively charged cell membranes, thereby possessing the ability to inhibit pathogen invasion [26].
These findings suggest that SA may enhance local defense responses and promote the transmission of systemic signals by activating such proteases, such as the accumulation of SA in distant tissues, thereby establishing systemic acquired resistance (SAR) and enhancing maize resistance to ear rot disease. In addition, aspartic protease enhances plant resistance to pathogens by inducing defense hormone signaling pathways [27].
(2)
The regulatory role of terpenoid metabolism genes
The induced accumulation of acidic terpenoids in maize has been confirmed to be one of the key mechanisms for plant disease resistance and defense. The biosynthesis of these compounds mainly occurs in specific tissues or organelles (such as chloroplasts or cytoplasm), and their synthesis pathways involve multi-enzyme cascade reactions and are strictly regulated by gene expression [28]. Existing research has shown that environmental stress (such as pathogen infection and mechanical damage) and plant hormones (such as JA and SA) can significantly regulate the synthesis and release of acidic terpenoid compounds [29]. This study found that SA can specifically activate the expression of the cytochrome P450 family gene ZmCYP71Z28 (Zm00001d014134). This finding is consistent with the research results of Ding [30] et al., who observed a significant upregulation of the cytochrome P450 family CYP71 member ZMCYP71Z28 (gene number Zm00001d014134) expression in ZX1-ZX4 maize lines infected with Fusarium graminearum, and its expression level was highest in the co-infection system. From the perspective of defense mechanisms, acidic terpenoids regulate the synthesis and signal transduction of signaling molecules such as SA, JA, and ethylene (ETH), thereby affecting the establishment of systemic acquired resistance [31]. These research results indicate that SA promotes the early synthesis of antibacterial substances in uninfected tissues by regulating terpenoid metabolic pathways, ultimately forming a systemic disease resistance and defense system.
(3)
Induced expression of disease-related proteins
Plants develop disease resistance by regulating the expression of disease-related protein genes to resist external infections. In this study, PR10 expression was significantly upregulated after SA induction, which is consistent with the findings of Cheng [32] et al., indicating that the PR10 protein serves as a defense protein for plants to resist adverse environmental stresses. In addition, the study by Zhao [33] et al., confirmed that plant hormones such as SA, JA, and abscisic acid, as endogenous elicitors, can induce the expression of PR10 in plants. The accumulation of PR proteins at the distal end is a typical characteristic of systemic acquired resistance (SAR). Studies have shown that SA establishes long-term immune memory through proteins such as PR10, further confirming the mechanism by which SA establishes systemic resistance by activating the PR protein pathway [34,35].
(4)
The regulatory network of signal transduction proteins
The BTB/POZ-MATH protein (Zm00001d026505) and PPT3 transporter protein (Zm00001d037659) jointly regulate plant disease resistance by participating in SA signal transduction and metabolic regulation pathways. Studies have shown that the BTB/POZ-MATH protein, as a component of E3 ubiquitin ligase, can mediate the ubiquitination and degradation of specific target proteins [36,37]. In the SA signaling pathway, this protein may relieve the inhibitory effect of NPR1 by recognizing and promoting the ubiquitination and degradation of NPR1 inhibitory proteins. As the core regulatory factor of the SA signaling pathway, the activity state of NPR1 is finely regulated by ubiquitination modification. This regulatory mechanism of the BTB/POZ-MATH protein may significantly enhance the expression of genes related to systemic acquired resistance (SAR) [38]. On the other hand, the PPT3 transporter participates in the biosynthesis of SA by regulating the shikimate pathway [39]. Evidence has shown that the phosphate transporter family, including PPT3, plays a crucial role in the establishment and maintenance of SAR. This protein may regulate the intracellular phosphate homeostasis, thereby affecting the biosynthesis and transport efficiency of SAR-related signaling molecules (such as SA), ultimately enhancing the overall disease resistance of plants [40].
This study revealed the molecular network mechanism of SA regulation of maize resistance to ear rot disease. At the upstream regulatory level, SA activates defense responses through dual pathways: Firstly, it regulates protein stability through BPM4; Secondly, by promoting SA synthesis through PPT3, it forms a positive feedback regulatory loop. The core defense mechanism consists of three collaborative modules: (1) Protease system activation-mediated cell membrane defense; (2) ZmCYP71Z28-driven biosynthesis of acidic terpenoids; (3) Direct antibacterial activity induced by the PR10 gene. The downstream defense exhibits a synergistic effect of multiple mechanisms, including the toxic effects of acidic terpenoids, the activity regulation of disease-related proteins (PR10), and the activation of protein hydrolysis defense systems, collectively inhibiting pathogen infection.
These genes together form the molecular basis for SA-induced maize resistance to ear rot, providing important targets for disease-resistant breeding. Especially, the expression characteristics of acidic terpenoids and the PR10 gene can serve as molecular markers for resistance identification (Figure 17).

5. Conclusions

The research results indicate that 0.01 mmol/L exogenous SA can significantly inhibit the mycelial growth of Fusarium graminearum, activate the maize defense system, and regulate multiple mechanisms of disease resistance gene expression. The synergistic effect of this “direct antibacterial action” and “induced plant systemic resistance” significantly enhances corn’s resistance level to ear rot. This study identified disease-resistant genes, laying the foundation for the subsequent cultivation of disease-resistant varieties and providing a theoretical basis for the development of green prevention and control technology for maize ear rot based on SA.

Supplementary Materials

The following supporting information can be downloaded at: https://www.mdpi.com/article/10.3390/agronomy15082002/s1, Table S1: Classification of disease levels for identification of maize resistance to ear rot disease; Table S2: Evaluation criteria for resistance of maize to Fusarium head blight; Table S3: RT-qPCR primer sequence; Table S4: Disease severity of K0742 under different concentrations of SA treatment; Table S5: Disease severity of K0742 treated with different concentrations of SA inhibitors; Table S6: Sequencing quality of each sample; Table S7: Annotations of core genes.

Author Contributions

Conceptualization, F.J.; validation, N.L.; formal analysis, N.L.; investigation, W.L.; resources, F.W.; data curation, W.L.; writing—original draft preparation, F.J.; writing—review and editing, F.J.; visualization, N.L. and W.L.; supervision, F.W.; project administration, F.W.; funding acquisition, F.W. All authors have read and agreed to the published version of the manuscript.

Funding

This research was supported by the Central Government Guiding Local Science and Technology Development Fund Program (25ZYJA002) and the Key Project of Natural Science Foundation of Gansu Province (No. 23JRRA1405).

Institutional Review Board Statement

Not applicable.

Informed Consent Statement

Not applicable.

Data Availability Statement

Data are contained within the article or Supplementary Materials.

Acknowledgments

We thank the reviewers for the critical review of the manuscripts, and Fang Wang for her guidance and revision.

Conflicts of Interest

The authors declare no conflicts of interest.

References

  1. Song, L.R. High-yield maize planting and pest control technology. Mod. Rural Sci. Technol. 2025, 20–21. [Google Scholar]
  2. Ping, C.Z.; Hong, M.; Wang, W.D.; Zhao, B.Y.N.M.L.; Mei, L.; Liu, P.F.; Zhao, W.Y.G. Effect of Tillage management modes on farmland physical properties in black soil region. Chin. Agric. Sci. Bull. 2020, 36, 83–89. [Google Scholar]
  3. Li, M. Control measures for common pests and diseases in maize cultivation. Hebei Agric. 2024, 63–64. [Google Scholar]
  4. Su, Y.J.; Liu, P.L.; Gao, K.K.; Song, J.F.; Yang, M.L.; Lu, H.W.; Qin, G.W.; Zhang, X.C. Research progress on ear rot in maize. Heilongjiang Agric. Sci. 2024, 103–113. [Google Scholar]
  5. Ding, X.Y.; Zhang, J.; Su, B.L.; Xu, H.F. Role of salicylic acid in plant disease resistance. Chin. Bull. Bot. 2001, 163–168. [Google Scholar]
  6. Chen, S.Q.; Wang, Z.P.; Shi, Y.Y.; Shang, Z.Y.; Zhu, S.S.; Yang, M. Exogenous salicylic acid regulates root metabolism in Panax notoginseng and influences the incidence of root rot disease. Chin. J. Biol. Control 2025, 41, 177–185. [Google Scholar] [CrossRef]
  7. Yang, Z.Z.; Xie, X.N.; Li, X.; Ouyang, Q.F. Effects of salicylic acid on the physiological function of mango seedlings under the stress of leaf blight. Shanxi Agric. Sci. 2024, 52, 130–135. [Google Scholar]
  8. Qu, Y.T.; Chen, P.; Gou, W.C.; Feng, X.D. Effect of exogenous salicylic acid on the activity of defense enzymes against gray mold in cucumber seedlings. Yan’an Univ. (Nat. Sci.) 2024, 43, 54–58. [Google Scholar] [CrossRef]
  9. Yi, C.B. Induce Resistance in Maize against Curvularia Leaf Spot Disease by Exogenous Chemicals. Master’s Thesis, Sichuan Agricultural University, Chengdu, China, 2005. [Google Scholar]
  10. Seifert, K.A.; Aoki, T.; Baayen, R.P.; Brayford, D.; Burgess, L.W.; Chulze, S.; Gams, W.; Geiser, D.; Gruyter, J.D.; Leslie, J.F.; et al. The name Fusarium moniliforme should no longer be used. Mycol. Res. 2003, 107, 643–644. [Google Scholar] [CrossRef]
  11. Qin, Z.H.; Ren, X.; Jiang, K.; Wu, X.F.; Yang, Z.H.; Wang, X.M. Identification of Fusarium species and F. graminearum species complex causing maize ear rot in China. J. Plant Prot. 2014, 41, 589–596. [Google Scholar] [CrossRef]
  12. Cheng, L.; Chen, J.B.; Zhang, Y.X.; Yang, D.D.; Tan, J. Research comparison of two dominant pathogens on maize ear rot. J. Yunnan Univ. (Nat. Sci. Ed.) 2022, 44, 647–654. [Google Scholar]
  13. Small, I.M.; Flett, B.C.; Marasas, W.F.O.; McLeod, A.; Stander, M.A.; Viljoen, A. Resistance in Maize Inbred Lines to Fusarium verticillioides and Fumonisin Accumulation in South Africa. Plant Dis. 2012, 96, 96. [Google Scholar] [CrossRef] [PubMed]
  14. Chai, H.Y.; Jia, J.; Bai, X.; Meng, L.M.; Zhang, W.; Jing, R.; Wu, R.B.; Su, Q.F. Identification of pathogenic fusarium spp. Causing maize ear rot and susceptibility of some strains to fungicides in jilin province. Sci. Agric. Sin. 2023, 56, 64–78. [Google Scholar]
  15. Ji, W.P.; Wang, P. Investigation on the occurrence of corn ear rot disease in Heilongjiang agricultural reclamation. Bull. Agric. Sci. Technol. 2021, 49–51. [Google Scholar]
  16. Wang, T. Study on Resistance Mechanism of Maize to Ustilago Maydis Induced by Exogenous Jasmonic Acid and Salicylic Acid. Master’s Thesis, Gansu Agricultural University, Lanzhou, China, 2022. [Google Scholar]
  17. NY/T 1248.8-2016; Technical Specification for Identification of Maize Resistance to Diseases and Insect Pests. China Agriculture Press: Beijing, China, 2016.
  18. Chen, G. Induced Resistence in Safflower against Safflower Rust Disease by Exogenous Chemicals. Master’s Thesis, Sichuan Agricultural University, Chengdu, China, 2009. [Google Scholar]
  19. Veronese, P.; Ruiz, M.T.; Coca, M.A.; Hernandez-Lopez, A.; Lee, H.; Ibeas, J.I.; Damsz, B.; Pardo, J.M.; Hasegawa, P.M.; Bressan, R.A.; et al. In Defense against Pathogens. Both Plant Sentinels and Foot Soldiers Need to Know the Enemy. Plant Physiol. 2003, 131, 1580–1590. [Google Scholar] [CrossRef]
  20. Jia, H.; Gong, X.D.; Gu, S.Q.; Han, J.M.; Dong, J.G. Study on the Role of Exogenous Salicylic Acid in Inducing Resistance to Big Blotch Disease in Maiz; Chinese Plant Protection Society: Beijing, China; College of Life Sciences, Hebei Agriculeure University: Baoding, China, 2014; pp. 1–3. [Google Scholar]
  21. Wang, C.C. Effect of Exogenous Salicylic Acid on Soybean Resistance to Root Rot Disease. Master’s Thesis, Nanjing Agricultural University, Nanjing, China, 2022. [Google Scholar]
  22. Wang, Y.Z.; Miller, J.D. Effects of Fusarium graminearum Metabolites on Wheat Tissue in Relation to Fusarium Head Blight Resistance. J. Phytopathol. 2010, 122, 118–125. [Google Scholar] [CrossRef]
  23. Liu, H.Y.; Si, E.J.; Guo, M.; Qi, T.T.; Wei, J.M.; Yao, L.R.; Wang, J.C.; Li, B.C.; Meng, Y.X.; Ma, X.L.; et al. Resistance of barley to Pyrenophora graminea induced by exogenous salicylic scid. Acta Phytopathol. Sin. 2022, 52, 658–668. [Google Scholar] [CrossRef]
  24. Xu, Q.Q. Effects of Salicylic Acid and Benzothiadiazole on Related Physiological Indicators for Cabbage Clubroot Resistence. Master’s Thesis, Southwest University, Chongqin, China, 2015. [Google Scholar]
  25. Ge, Q.D.; Zhang, S.N.; Hao, J.X.; Ma, W.H.; Lu, M.F.; Xu, L.P.; Gou, M.Y. Research progress of aspartic protease in plant immunity. Plant Physiol. 2023, 59, 1863–1869. [Google Scholar] [CrossRef]
  26. Guevara, G.M.; Almeida, C.; Mendieta, R.J.; Faro, C.J.; Veríssimo, P.; Pires, E.V.; Daleo, G.R. Molecular cloning of a potato leaf cDNA encoding an aspartic protease (StAsp) and its expression after P. infestans infection. Plant Physiol. Biochem. 2005, 43, 882–889. [Google Scholar] [CrossRef] [PubMed]
  27. Cheung, L.K.Y.; Dupuis, J.H.; Dee, D.R.; Bryksa, B.C.; Yada, R.Y. Roles of Plant-Specific Inserts in Plant Defense. Trends Plant Sci. 2020, 25, 682–694. [Google Scholar] [CrossRef]
  28. Liu, M.L.; Yu, H.W.; Li, J.; Dong, N.; Chen, B.W.; Xu, R.; Wu, J.X.; Chang, X.W.; Wang, J.T.; Peng, H.S.; et al. Cloning, expression, and functional analysis of the full-length cdna of acetyl-coa c-acetyltransferase (AACT) genes related to terpenoid synthesis in Platycodon grandiflorus. Protein Pept. Lett. 2022, 29, 1061–1071. [Google Scholar] [CrossRef]
  29. Xu, R.; Wu, J.X.; Zhang, Y.Z.; Jiang, L.Y.; Yao, J.C.; Zha, L.P.; Xie, J. Isolation, characterisation, and expression profiling of DXS and DXR genes in Atractylodes lancea. Genome 2023, 66, 150–164. [Google Scholar] [CrossRef]
  30. Ding, Y.; Weckwerth, P.R.; Poretsky, E.; Murphy, K.M.; Sims, J.; Saldivar, E.; Christensen, S.A.; Char, S.N.; Yang, B.; Tong, A.D.; et al. Genetic elucidation of interconnected antibiotic pathways mediating maize innate immunity. Nat. Plants 2020, 6, 1375–1388. [Google Scholar] [CrossRef]
  31. Guan, Y.Q.; He, X.; Wen, D.; Chen, S.M.; Chen, F.D.; Chen, F.; Jiang, Y.F. Fusarium oxysporum infection on root elicit aboveground terpene production and salicylic acid accumulation in Chrysanthemum morifolium. Plant Physiol. Biochem. 2022, 190, 11–23. [Google Scholar] [CrossRef] [PubMed]
  32. Cheng, P.; Jiang, L.Y.; Jin, L.M.; Wu, J.J.; Wang, J.S.; Xu, P.F.; Zhang, S.Z. Advances on Class 10 Pathogenesis-related Proteins. Soybean Sci. 2013, 32, 415–419. [Google Scholar]
  33. Zhao, Q.; Cui, M.J.; Han, S.Y.; Guo, T.D.; Du, P.; Liu, H.; Xu, J.; Huang, B.Y.; Dong, W.Z.; Zhang, X.Y. Plant Pathogenesis-Related Protein PR10 and Their Research Progress in Peanut. SAU 2024, 42, 1–10. [Google Scholar] [CrossRef]
  34. Zhao, S.Q.; Li, M.Y.; Ren, X.P.; Wang, C.Y.; Sun, X.B.; Sun, M.L.; Yu, X.M.; Wang, X.D. Enhancement of broad-spectrum disease resistance in wheat through key genes involved in systemic acquired resistance. Front. Plant Sci. 2024, 15, 1355178. [Google Scholar] [CrossRef]
  35. Saleem, M.; Fariduddin, Q.; Castroverde, C.D.M. Salicylic acid: A key regulator of redox signalling and plant immunity. Plant Physiol. Biochem. 2021, 168, 381–397. [Google Scholar] [CrossRef]
  36. Diop, A.; Pietrangeli, P.; Nardella, C.; Pennacchietti, V.; Pagano, L.; Toto, A.; Di Felice, M.; Di Matteo, S.; Marcocci, L.; Malagrinò, F. Biophysical Characterization of the Binding Mechanism between the MATH Domain of SPOP and Its Physiological Partners. Int. J. Mol. Sci. 2023, 24, 10138. [Google Scholar] [CrossRef]
  37. Stogios, P.J.; Downs, G.S.; Jauhal, J.J.; Nandra, S.K.; Privé, G.G. Sequence and structural analysis of BTB domain proteins. Genome Biol. 2005, 6, R82. [Google Scholar] [CrossRef]
  38. Orosa, B.; He, Q.; Mesmar, J.; Gilroy, E.M.; McLellan, H.; Yang, C.W.; Craig, A.; Bailey, M.; Zhang, C.J.; Moore, J.D.; et al. BTB-BACK domain protein POB1 suppresses immune cell death by targeting ubiquitin E3 ligase PUB17 for degradation. PLoS Genet 2017, 13, e1006540. [Google Scholar] [CrossRef] [PubMed]
  39. Wang, J.C.; Li, R.L.; Wang, J.L.; Shao, J.W.; Zhao, H.Y. Functional analysis of plastid phosphate transporter OsPPT family members in rice. Acta Agric. Zhejiangensis 2022, 34, 2329–2339. [Google Scholar]
  40. Shrader, C.W.; Foster, D.; Kharel, Y.; Huang, T.; Lynch, K.R.; Santos, W.L. Imidazole-based sphingosine-1-phosphate transporter Spns2 inhibitors. J. Med. Chem. 2023, 96, 129516. [Google Scholar] [CrossRef] [PubMed]
Figure 1. Morphological observation of Fusarium graminearum. (A): Hyphal morphology. (B): Conidial morphology; Observation and photography were performed using an upright/inverted integrated microscope (10 × 20 magnification); Images were subjected to basic contrast optimization using Image-Pro Plus software (5.1) (Media Cybernetics, Inc., Rockville, MD, USA); Scale bar: 200 μm.
Agronomy 15 02002 g001
Figure 2. Simulation diagram of disease severity classification on maize ears. (Level 0: No disease; Level 1: 0–1% of the ear area affected; Level 3: 2–10%; Level 5: 11–25%; Level 7: 26–50%; Level 9: 51–100%). The classification criteria refer to the “Agricultural Industry Standard of the People’s Republic of China NY/T 1248.8-2016 Technical Specification for Identification of Maize Resistance to Diseases and Pests” [17].
Agronomy 15 02002 g002
Figure 3. Effects of different SA concentrations on colony growth of Fusarium graminearum. (A,C): Colony area after 24 h treatment; (B,D): Colony area after 48 h treatment. CK represents the blank control (added with equal volume of sterile water). Colony areas were measured using a Supcre series colony counter/screening/zone inhibition analyzer. Different lowercase letters indicate significant differences among treatments (p < 0.05, LSD multiple comparison test, n = 3). Data are presented as mean ± SE.
Agronomy 15 02002 g003
Figure 4. Phenotypes of ear rot in maize inbred line K0742 treated with different SA concentrations at maturity stage. CK (blank control) refers to treatment with an equal volume of sterile water.
Agronomy 15 02002 g004
Figure 5. Phenotypes of ear rot in maize inbred line K0742 treated with different concentrations of SA inhibitor (ABT) at maturity stage. CK (control group): treated with equivalent amount of sterile water.
Agronomy 15 02002 g005
Figure 6. Effects of SA treatment on disease resistance-related indicators in maize kernels. (A): SOD activity; (B): PAL activity; (C): β-1,3-GA activity; (D): PPO activity; (E): MDA content. Different lowercase letters indicate significant differences among treatments at the same time point (p < 0.05, LSD multiple comparison test, n = 3). Data are presented as mean ± SE.
Agronomy 15 02002 g006
Figure 7. Statistics of differentially expressed genes (DEGs) in different inbred lines under SA treatment. (A): Bar chart showing the number of DEGs in different comparison groups; (B): Venn diagram of DEGs among different comparison groups. The figure was created using the Baimaike Cloud Platform and its clarity was enhanced with Adobe Illustrator 2025.
Agronomy 15 02002 g007
Figure 8. GO annotation analysis of DEGs in two inbred lines under ear rot stress. (A): K0743 (KJ-CK vs. KW-CK); (B): K0742 (GJ-CK vs. GW-CK). The figure was created using the Baimaike Cloud Platform and its clarity was enhanced with Adobe Illustrator 2025.
Agronomy 15 02002 g008
Figure 9. GO annotation analysis of DEGs in two inbred lines under SA treatment. (A): K0743 (KJ-CK vs. KJ-SA); (B): K0742 (GJ-CK vs. GJ-SA). The figure was created using the Baimaike Cloud Platform and its clarity was enhanced with Adobe Illustrator 2025.
Agronomy 15 02002 g009
Figure 10. KEGG pathway analysis of DEGs in two inbred lines under ear rot stress. (A): K0742 (GJ-CK vs. GW-CK); (B): K0743 (KJ-CK vs. KW-CK). The figure was created using the Baimaike Cloud Platform and its clarity was enhanced with Adobe Illustrator 2025.
Agronomy 15 02002 g010
Figure 11. KEGG pathway enrichment analysis of DEGs in two maize inbred lines under SA treatment. (A): K0742 (GJ-CK vs. GJ-SA); (B): K0743 (KJ-CK vs. KJ-SA). The figure was created using the Baimaike Cloud Platform and its clarity was enhanced with Adobe Illustrator 2025.
Agronomy 15 02002 g011
Figure 12. Validation of differentially expressed genes (DEGs) by quantitative real-time PCR (RT-qPCR). Bar graphs and line charts represent RT-qPCR and RNA-Seq results, respectively. The data were calculated using the 2−ΔΔCt method and presented as mean ± SE.
Agronomy 15 02002 g012
Figure 13. Module construction based on WGCNA. (A): gene network module (different colors represent distinct gene co-expression modules); (B): heatmap of gene co-expression network (the smaller the dissimilarity value, the darker the color. Genes within the same module exhibit darker colors, while those between modules appear lighter); (C): gene development tree and correlation heatmap (different colors represent distinct gene co-expression modules); (D): heatmap of the correlation between modules and traits (darker red indicates a higher correlation coefficient, meaning the module has a stronger positive correlation with the physiological trait. Conversely, darker blue represents a lower correlation coefficient, indicating a stronger negative correlation between the module and the physiological trait). The figure was created using the Baimaike Cloud Platform and its clarity was enhanced with Adobe Illustrator 2025.
Agronomy 15 02002 g013
Figure 14. GO and KEGG annotation analysis of the MEbisuque4 module. (A): GO classification; (B): KEGG classification. The figure was created using the Baimake Cloud Platform and its clarity was enhanced with Adobe Illustrator 2025.
Agronomy 15 02002 g014
Figure 15. GO and KEGG enrichment analysis of the MEskyblue3 module. (A): GO classification; (B): KEGG classification. The figure was created using the Baimaike Cloud Platform and its clarity was enhanced with Adobe Illustrator 2025.
Agronomy 15 02002 g015
Figure 16. Protein–protein interaction network analysis of hub genes in co-expression modules. (A): MEbisuque4 module; (B): MEskyblue3 module. Node size and color indicate gene connectivity levels. The figure was constructed using Cytoscape (version 3.10.1) and subsequently optimized for clarity with Adobe Illustrator 2025.
Agronomy 15 02002 g016
Figure 17. Interaction model of SA-mediated resistance to ear rot stress in maize. Red arrows indicate increased activity or upregulated gene expression; green arrows indicate decreased activity or downregulated gene expression; blue dashed arrow indicates unknown.
Agronomy 15 02002 g017
Disclaimer/Publisher’s Note: The statements, opinions and data contained in all publications are solely those of the individual author(s) and contributor(s) and not of MDPI and/or the editor(s). MDPI and/or the editor(s) disclaim responsibility for any injury to people or property resulting from any ideas, methods, instructions or products referred to in the content.