Article

Machine-Learning-Based Multi-Site Corn Yield Prediction Integrating Agronomic and Meteorological Data

1
College of Agriculture and Biological Science, Dali University, Dali 671003, China
2
Co-Innovation Center for Cangshan Mountain and Erhai Lake Integrated Protection and Green Development of Yunnan Province, Dali University, Dali 671003, China
3
Key Laboratory for Agroecology in Erhai Lake Watershed of the Department of Education of Yunnan Province, Dali University, Dali 671003, China
4
Yunnan Zufeng Seed Industry Co., Ltd., Dali 671003, China
*
Authors to whom correspondence should be addressed.
Agronomy 2025, 15(8), 1978; https://doi.org/10.3390/agronomy15081978 (registering DOI)
Submission received: 26 July 2025 / Revised: 14 August 2025 / Accepted: 14 August 2025 / Published: 16 August 2025
(This article belongs to the Section Precision and Digital Agriculture)

Abstract

Accurate maize yield forecasting under climate uncertainty remains a critical challenge for global food security, yet existing studies predominantly rely on single-model frameworks, limiting generalizability and actionable insights. This study selected three regions, specifically Dali, Lijiang, and Zhaotong, and collected data on 12 agronomic traits of 114 varieties, along with eight sets of meteorological data, covering the period from 2019 to 2023. We employed three machine learning models: Random Forest (RF), Support Vector Machine (SVM), and XGBoost. The results revealed a strong correlation between yield and multiple agronomic traits, particularly grain weight per spike (GWPS) and hundred-kernel weight (HKW). Notably, the XGBoost model emerged as the top performer across all three regions. The model achieved the lowest RMSE (0.22–191.13) and a good R2 (0.98–0.99), demonstrating exceptional predictive accuracy for yield-related traits. The comparative analysis revealed that XGBoost exhibited superior accuracy and stability compared to RF and SVM. Through feature importance analysis, four critical determinants of yield were identified: GWPS, shelling percentage (SP), growth period (GP), and plant height (PH). Furthermore, partial dependence plots (PDPs) provided deeper insights into the nonlinear interactive effects between GWPS, SP, GP, PH, and yield, offering a more comprehensive understanding of their complex relationships. This study presents an innovative, data-driven methodology designed to accurately forecast corn yield across diverse locations. This approach offers valuable scientific insights that can significantly enhance precision agricultural practices by enabling the precise tailoring of fertilizer usage and irrigation strategies. The results highlight the importance of integrating agronomic and meteorological data in yield forecasting, paving the way for development of agricultural decision-support systems in the context of future climate change scenarios. This study presents an innovative, data-driven methodology designed to accurately forecast corn yield across diverse locations. This approach offers valuable scientific insights that can significantly enhance precision agricultural practices by enabling the precise tailoring of fertilizer usage and irrigation strategies.

1. Introduction

Maize (Zea mays L.), one of the world’s top three cereal crops, plays a dual role as both a dietary staple for millions in Africa, Latin America, and South Asia and a vital feed source for livestock in Europe and North America. However, as global climate change intensifies and extreme weather events become more frequent, maize yield prediction has become increasingly fraught with uncertainties. These challenges present profound implications, posing significant risks to global food security [1]. Research has shown that rising temperatures and shifting precipitation patterns negatively impact maize yields in both Mexico and China [2,3]. Notably, between 1979 and 2016, climate change affected maize production’s spatial variability, with southern China bearing the brunt of these effects [3]. Furthermore, an analysis of the interactions among maize yield, fertilization, and climate reveals that, by 2099, fertilization under the pressures of climate change may lead to an average yield reduction of 10.5–18.5% [1]. These challenges not only exert pressure on farmers and agribusinesses but also call for more robust and strategic responses from policymakers to ensure sustainable agricultural adaptation and food system resilience.
Precise maize yield prediction models are increasingly critical, yet comparative analyses of multimodel integration strategies remain scarce despite their potential to synergize algorithmic strengths. Recent advances in deep learning highlight the transformative role of multimodal architectures and ensemble models in agricultural forecasting. For instance, Jácome-Galarza [4] demonstrated the superiority of multimodal frameworks (combining Convolutional Neural Network (CNN) and long-short term memory (LSTM)) over unimodal approaches, while Yewle et al. [5] achieved higher accuracy with the RicEns-Net ensemble model. Similarly, Danilevicz et al. [6] validated the efficacy of multimodal models for early-stage yield prediction. These advancements align with Kamilaris and Prenafeta-Boldú’s [7] systematic review, which underscores deep learning’s superiority over traditional methods.
However, the black-box nature of machine learning poses interpretability challenges. Tools like partial dependence plots (PDPs) mitigate this by visualizing predictor–target relationships [8,9,10]. Friedman’s PDPs provide global interpretability by visualizing input–output relationships and quantifying marginal effects through covariate control, enabling isolated feature impact analysis [11]. Among ML models, Random Forest (RF) has emerged as particularly effective for yield prediction. Croci et al. [12] and Baio et al. [13] identified RF as optimal for maize, while others applied it successfully to sugarcane [14,15] and global/regional crops [16]. RF’s versatility is further evidenced by Cheng et al. [17], who integrated multi-indicator analysis for county-level maize yield prediction in China. Beyond RF, Cai et al. [18] combined climate and satellite data for wheat yield prediction. Kang et al. [19] compared Lasso, SVR, RF, XGBoost, and DL models for U.S. Midwest maize. Furthermore, Technow et al. [20] achieved high accuracy (0.75–0.92) using GBLUP and BayesB. Zhang et al. [21] leveraged complex trait analysis and genomics for maize yield prediction. Meanwhile, Wang et al. [22] and Meng et al. [23] improved predictions via multi-source data integration and fertilizer-specific modeling. Notably, Wu et al. [24] boosted accuracy (0.32 to 0.43) through multi-omics and RF fusion. Additionally, Zhao et al. [25] developed hybrid adaptation strategies for climate resilience. These studies collectively demonstrate the effectiveness of diverse approaches in crop yield prediction and the transformative potential of integrating cutting-edge technologies and multidisciplinary methodologies in agricultural research.
Despite remarkable advancements in maize yield prediction research, critical limitations remain unresolved. The majorities of existing studies focus on single-model applications, a key research gap persists in the comparative analyses of multimodel integration strategies. To address this, our study aims to achieve the following through three machine learning models: (1) systematically compare multimodel integration strategies; (2) improve interpretability through PDPs; (3) combine agronomic traits with meteorological data. This approach provides practical value for optimizing agricultural production efficiency, strengthening food security governance, and informing evidence-based policymaking. By balancing predictive accuracy with explanatory transparency, our framework effectively narrows the divide between theoretical modeling and practical agricultural decision support systems, offering a robust foundation for actionable agricultural strategies.

2. Materials and Methods

2.1. Data Sources

The data was gathered from field trials carried out in Dali (100°35′ E, 25°48′ N), Lijiang (100°28′52″ E, 26°49′38″ N), and Zhaotong (103°42′ E, 27°19′ N) over the period from 2019 to 2023, including field trait investigations, variety evaluations, and partial meteorological data. The chosen locations—Dali, Lijiang, Zhaotong—form a comprehensive aridity gradient (dry–hot valley → humid subtropical → cool alpine). This diversity encapsulates the major soil types and contrasts the various cropping systems prevalent in Yunnan’s maize belt.

2.2. Experimental Design and Management

The experiment was designed with a randomized block design, incorporating three replicates, with maize varieties as experimental treatments. The maize varieties involved in the experiment are listed in Supplementary Table S1. Each plot covered an area of 20 square meters and was composed of five rows, with each row spaced 0.8 m. And planting density was maintained at 60,000 plants per hectare. Basal fertilizer was applied using (NH4)2SO4 and K2SO4 at a rate of 450 kg/ha. During the V6 stage, urea was applied at a rate of 300 kg/ha for the first top-dressing, and at the V14 stage a second top-dressing was conducted with urea (Yunnan Shuifu Yuntianhua Co., Ltd., Yunnan, China) at 225 kg/ha. Pest management included spraying for aphids and whiteflies at the V5 stage, and for rust prevention a fungicide containing triazole (Dongguan Ruidefeng Biotechnology Co., Ltd., Guangdong, China) and azoxystrobin (Mengzhou Guangnong Huize Biotechnology Co., Ltd., Henan, China) was applied before tasseling. Before silking, insecticides and fungicides were applied to prevent pests and diseases. After full maturity, yield measurement and variety assessment were conducted. Yield was calculated using the following formula:
Yield   ( kg / ha )   =   plot   yield   ( kg ) plot   area   ( m 2 )   ×   10 , 000
1 ha = 10,000 m2.

2.3. Data Analysis

Data preprocessing was performed using Microsoft Excel 2016, while statistical analysis and visualization were conducted in R (version 4.3.3). The data analysis workflow is illustrated in Figure 1. The analytical workflow utilized a comprehensive set of R packages, each serving a distinct purpose in the modeling process. The randomForest (version 4.7-1.2) package was employed for RF modeling [26], while the caret package facilitated hyperparameter optimization. The e1071 (version 1.7-16) package was utilized for implementing SVM [27]. Additionally, the xgboost (version 1.7.8.1) package was integrated to execute XGBoost algorithms [28]. Model performance was evaluated using key metrics, including the coefficient of determination (R2), root mean square error (RMSE), and mean absolute error (MAE). The meteorological data, including TEMP (mean temperature), DEWP (mean dew point), VISIB (mean visibility), WDSP (mean wind speed), MAX (maximum temperature), MIN (minimum temperature), RH (relative humidity), PRCP (precipitation amount), were obtained using the GSODR (version 4.1.3) package [29]. PDPs were generated using the pdp (version 0.8.2) package [9]. The dataset was partitioned into training and testing subsets in a 70:30 ratio. To enhance model robustness, a 10-fold cross-validation strategy was implemented for RF and XGBoost implementations [30]. This methodological framework effectively balances computational efficiency with statistical rigor, making it particularly suitable for agricultural yield prediction tasks. Below is the detailed parameter tuning procedure for RF and XGBoost models. Parameter optimization for RF was as follows: tunedRfModel = train (yield ~, data = trainTrain, method = “rf”, trControl = trainControl (method = “cv”, number = 10), tuneGrid = expand.grid (mtry = 1:30), importance = TRUE). Parameter optimization for XGBoost was as follows: xgb_cv <- xgb.cv (params = params, data = train_matrix, nrounds = 1000, nfold = 10, early_stopping_rounds = 10, print_every_n = 10, verbose = 0, maximize = FALSE). The optimal models obtained through this tuning process were subsequently employed for prediction.

3. Results

3.1. Correlation Analysis Between Maize’s Agronomic Traits and Yield

Maize yield exhibited significant correlations with various factors (Table 1). Among these, the strongest positive correlations were observed with grain weight per spike (GWPS) and hundred-kernel weight (HKW), exhibiting correlation coefficients of 0.68 and 0.67, respectively. These findings underscore that both GWPS and HKW had dominant influences on productivity. Additionally, the yield exhibited significant positive correlations with plant height (PH, r = 0.63 **) and a significant negative correlation with ear length (EL, r = −0.24 **). Notably, PH showed positive associations with both GWPS (r = 0.52 **) and HKW (r = 0.47 **), suggesting that taller plants may have enhanced grain filling efficiency. However, a significant negative correlation was observed between growth period (GP) and yield (r = −0.62 **), implying that extended maturation periods may potentially undermine productivity. Furthermore, bare tip length (BTL) displayed a moderate negative correlation with yield (r = −0.46 **), suggesting that excessive tip barrenness adversely affects yield optimization.

3.2. Yield Assessment by Different Models

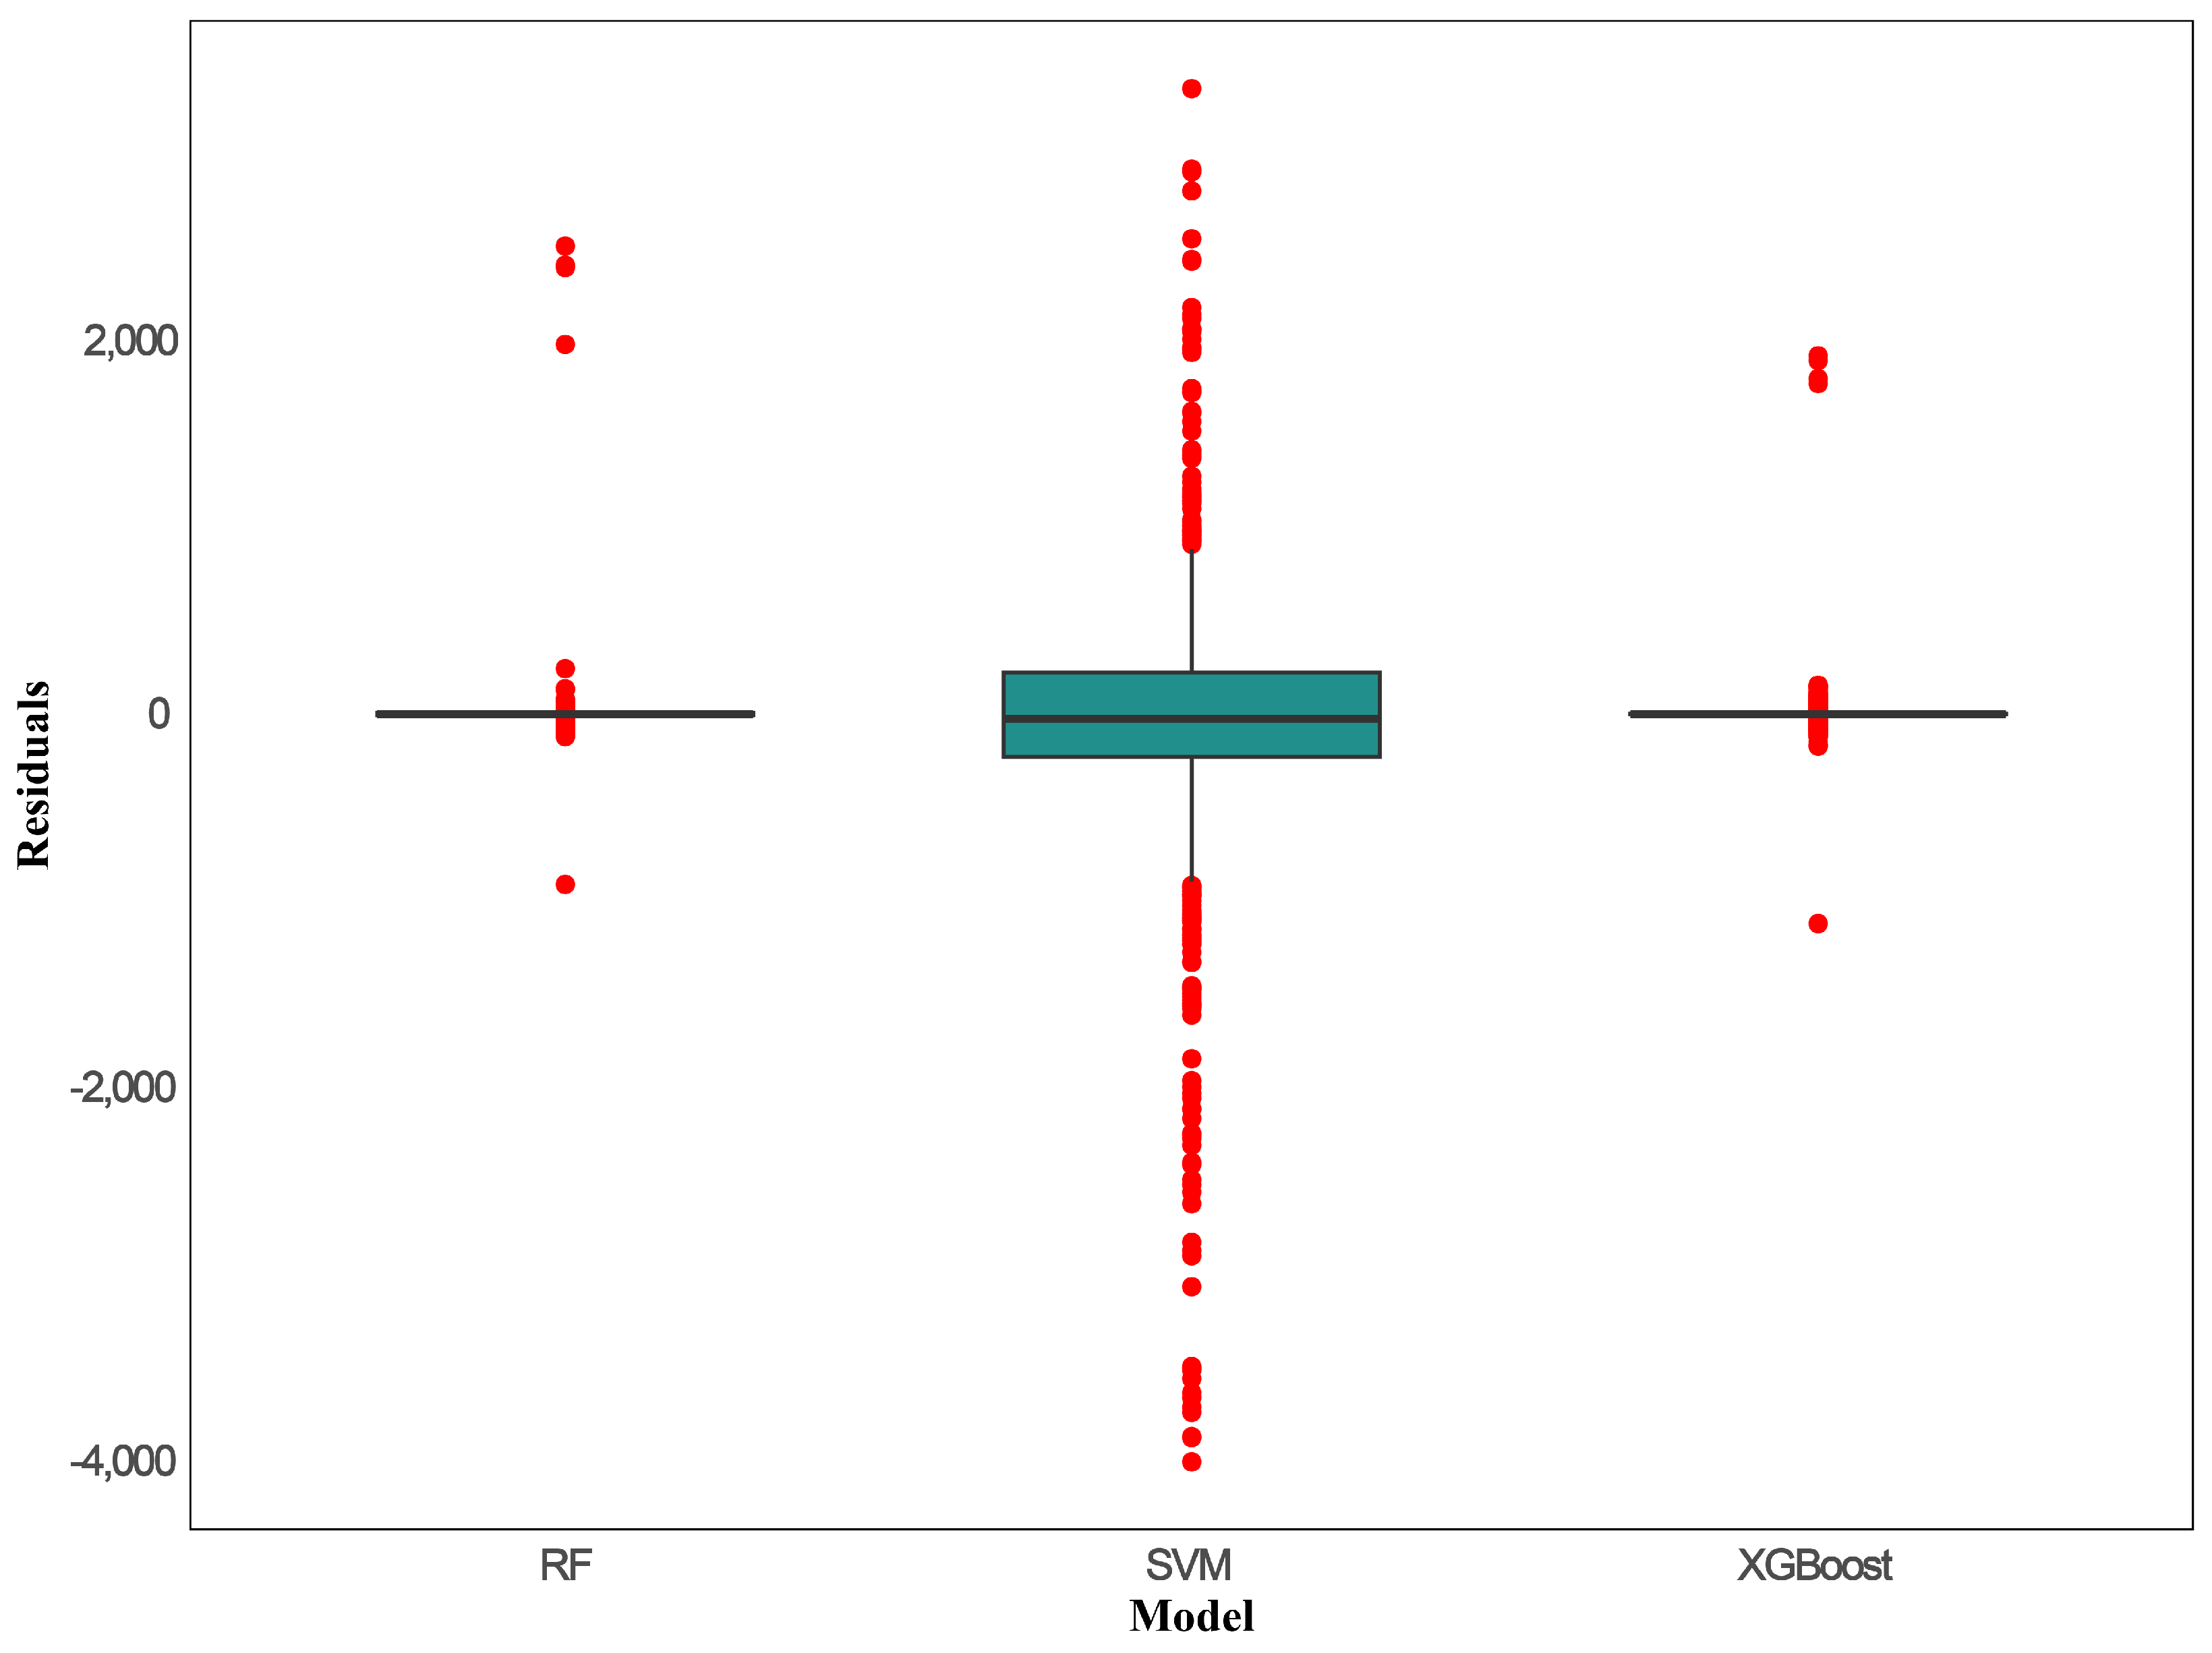
A comparative evaluation of model performance (RF, SVM, and XGBoost) across three regions, Dali, Lijiang, and Zhaotong, was conducted using testing datasets (Figure 2). The results revealed that the XGBoost model outperformed the others in term of predictive accuracy across all regions, highlighting its enhanced ability to capture complex nonlinear relationships within the data. In the Dali region (Figure 2a,d,g), the SVM model exhibited substantial deviations between the predicted and observed values (Figure 2d), whereas the XGBoost model achieved optimal alignment (Figure 2g), reflecting its superior performance in this region. In Lijiang (Figure 2b,e,h) and Zhaotong (Figure 2c,f,i), the XGBoost model exhibited consistent superiority over RF and SVM in terms of prediction accuracy. Notably, the predictions generated by SVM (Figure 2d–f) exhibited significant dispersion and systematic bias. XGBoost exhibited superior precision with consistent 1:1 line alignment, outperforming RF and SVM (Figure 2). XGBoost demonstrates superior predictive accuracy and stability compared to RF and SVM (Figure 3). This systematic advantage highlights XGBoost as the most robust algorithm for multi-regional yield forecasting tasks, especially for those demanding the high-fidelity modeling of agrometeorological interactions.

3.3. The Importance of Predictors in Maize Yield Prediction

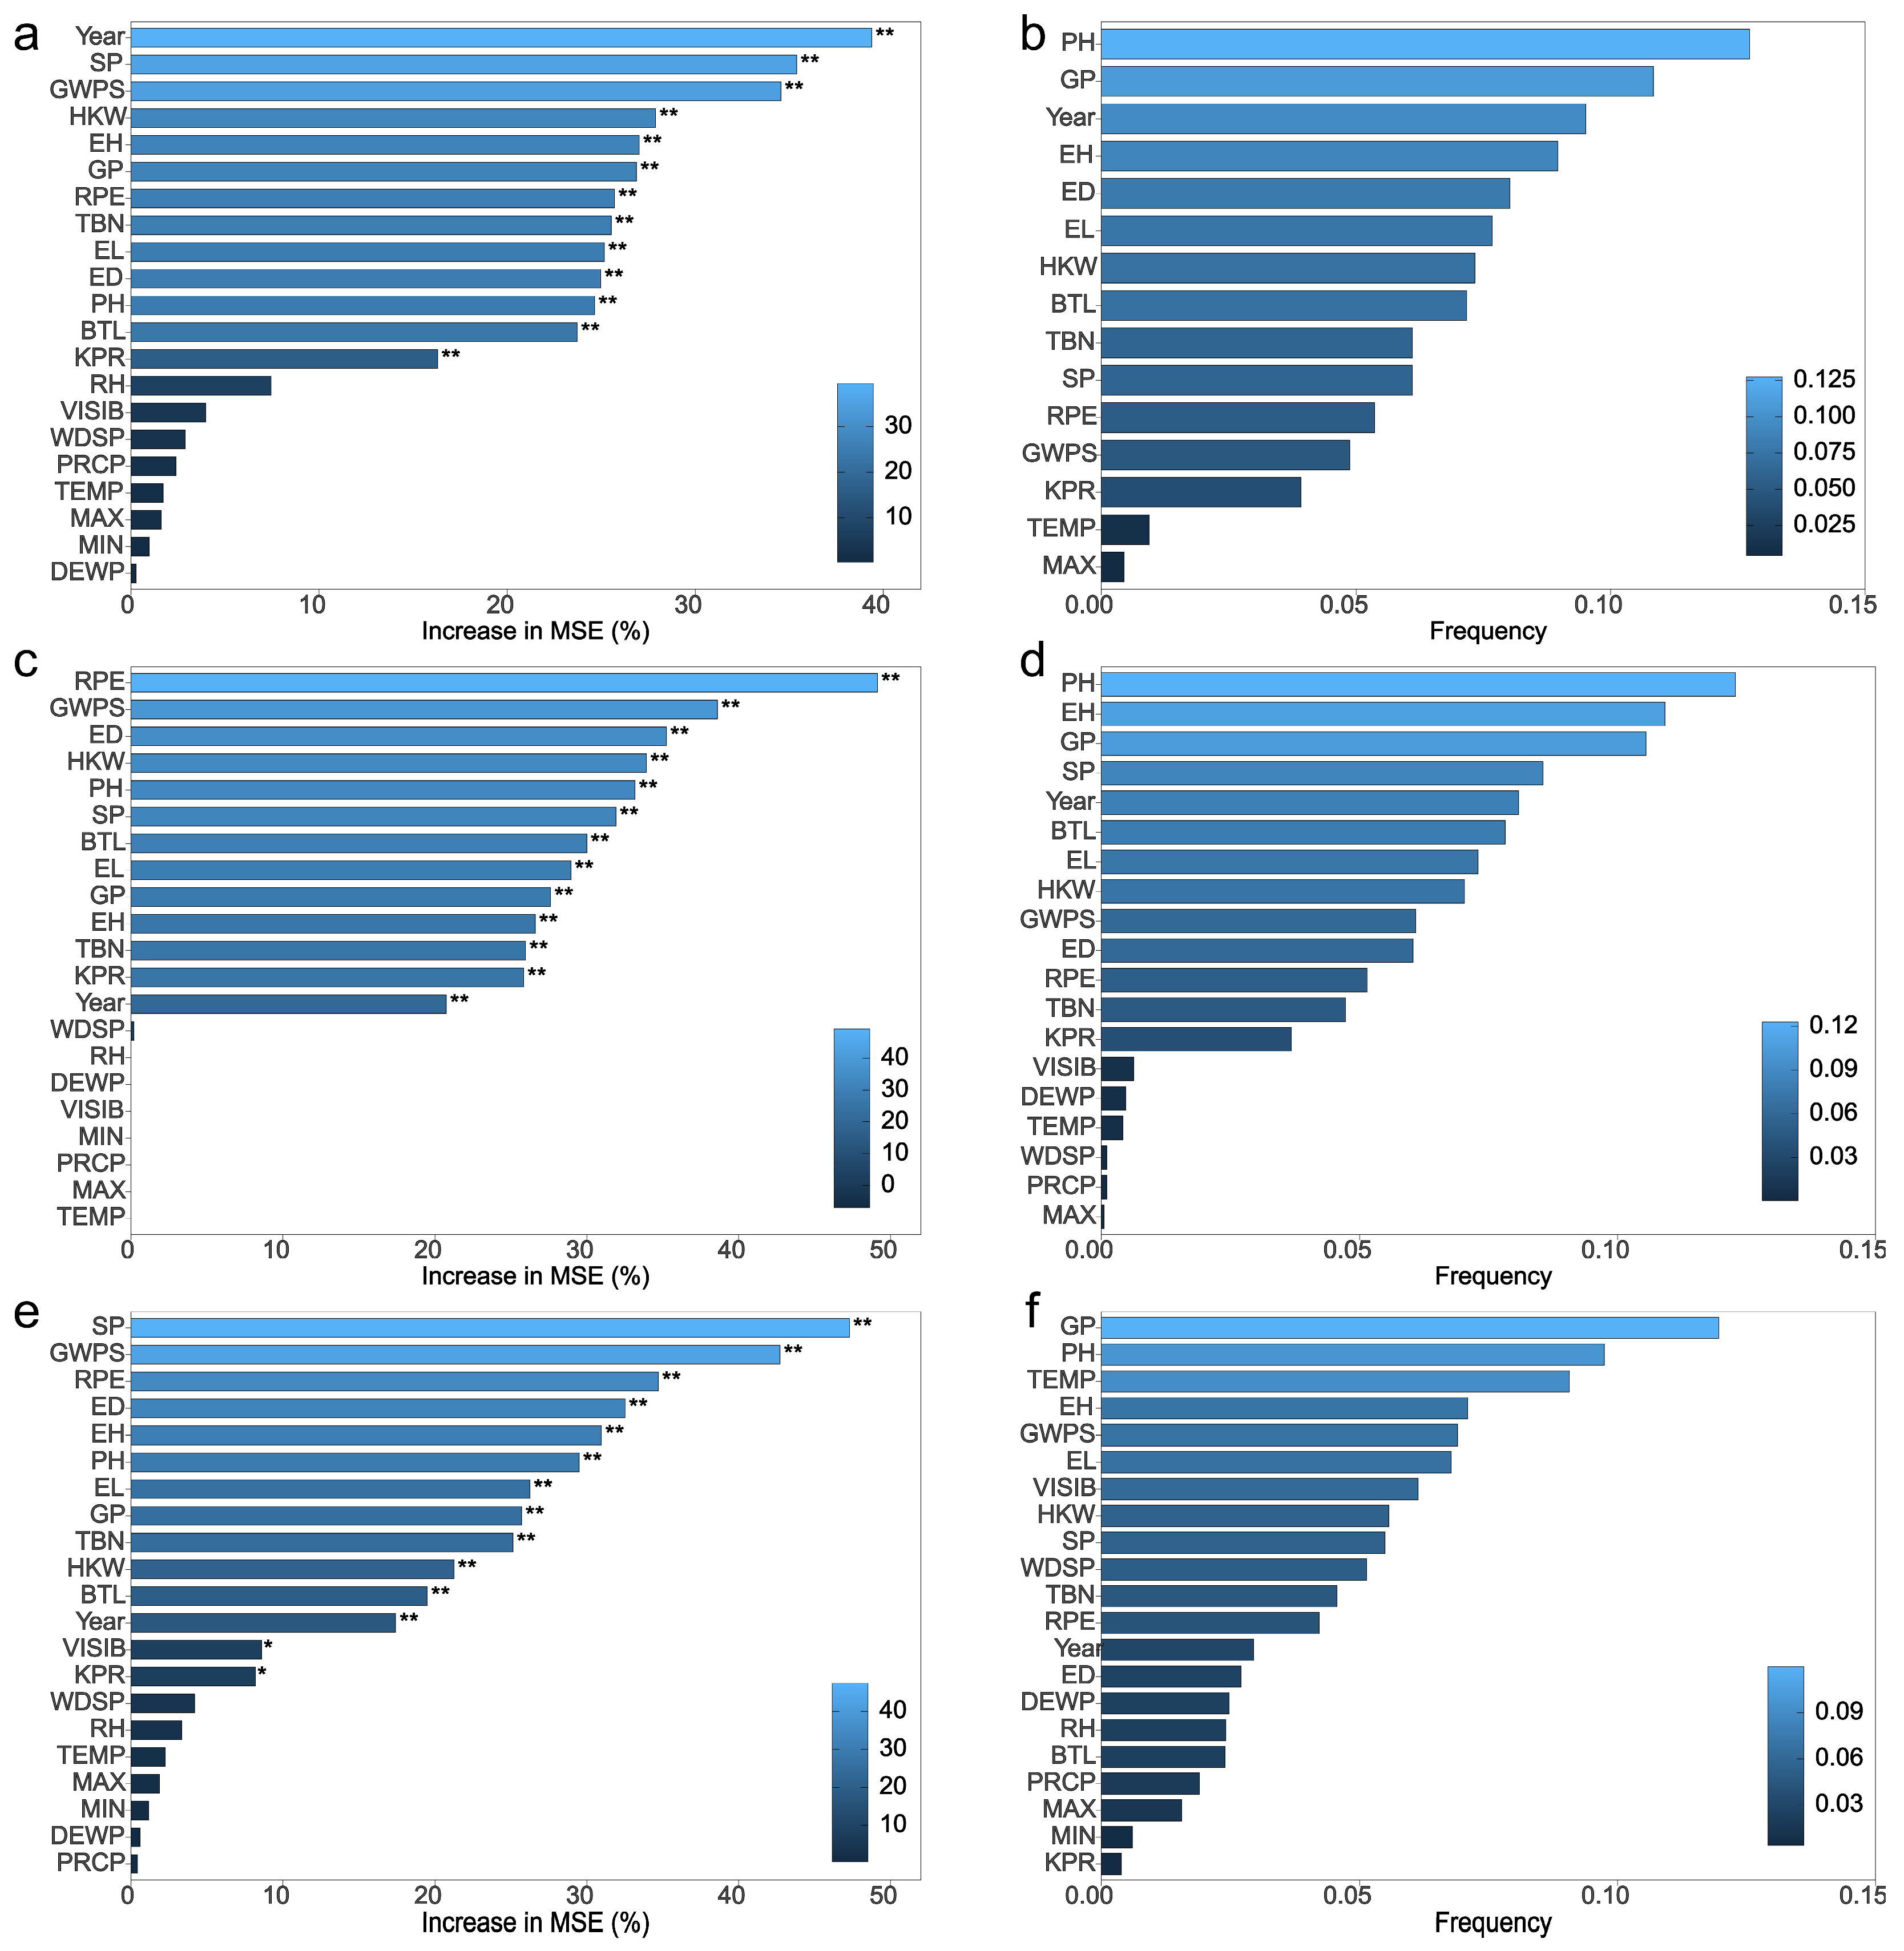
Variable importance plots were analyzed to assess the influence of predictors in both RF and XGBoost models (Figure 4). Significant differences in predictor importance were observed across regions and between the models. In the RF model (Figure 4a,c,e), GWPS, SP, and RPE emerged as the most dominant predictors, demonstrating the highest percentage increase in mean squared error (IncMSE%). Conversely, the XGBoost model (Figure 4b,d,f) highlighted GP and PH as the most critical factors for accurate yield prediction.
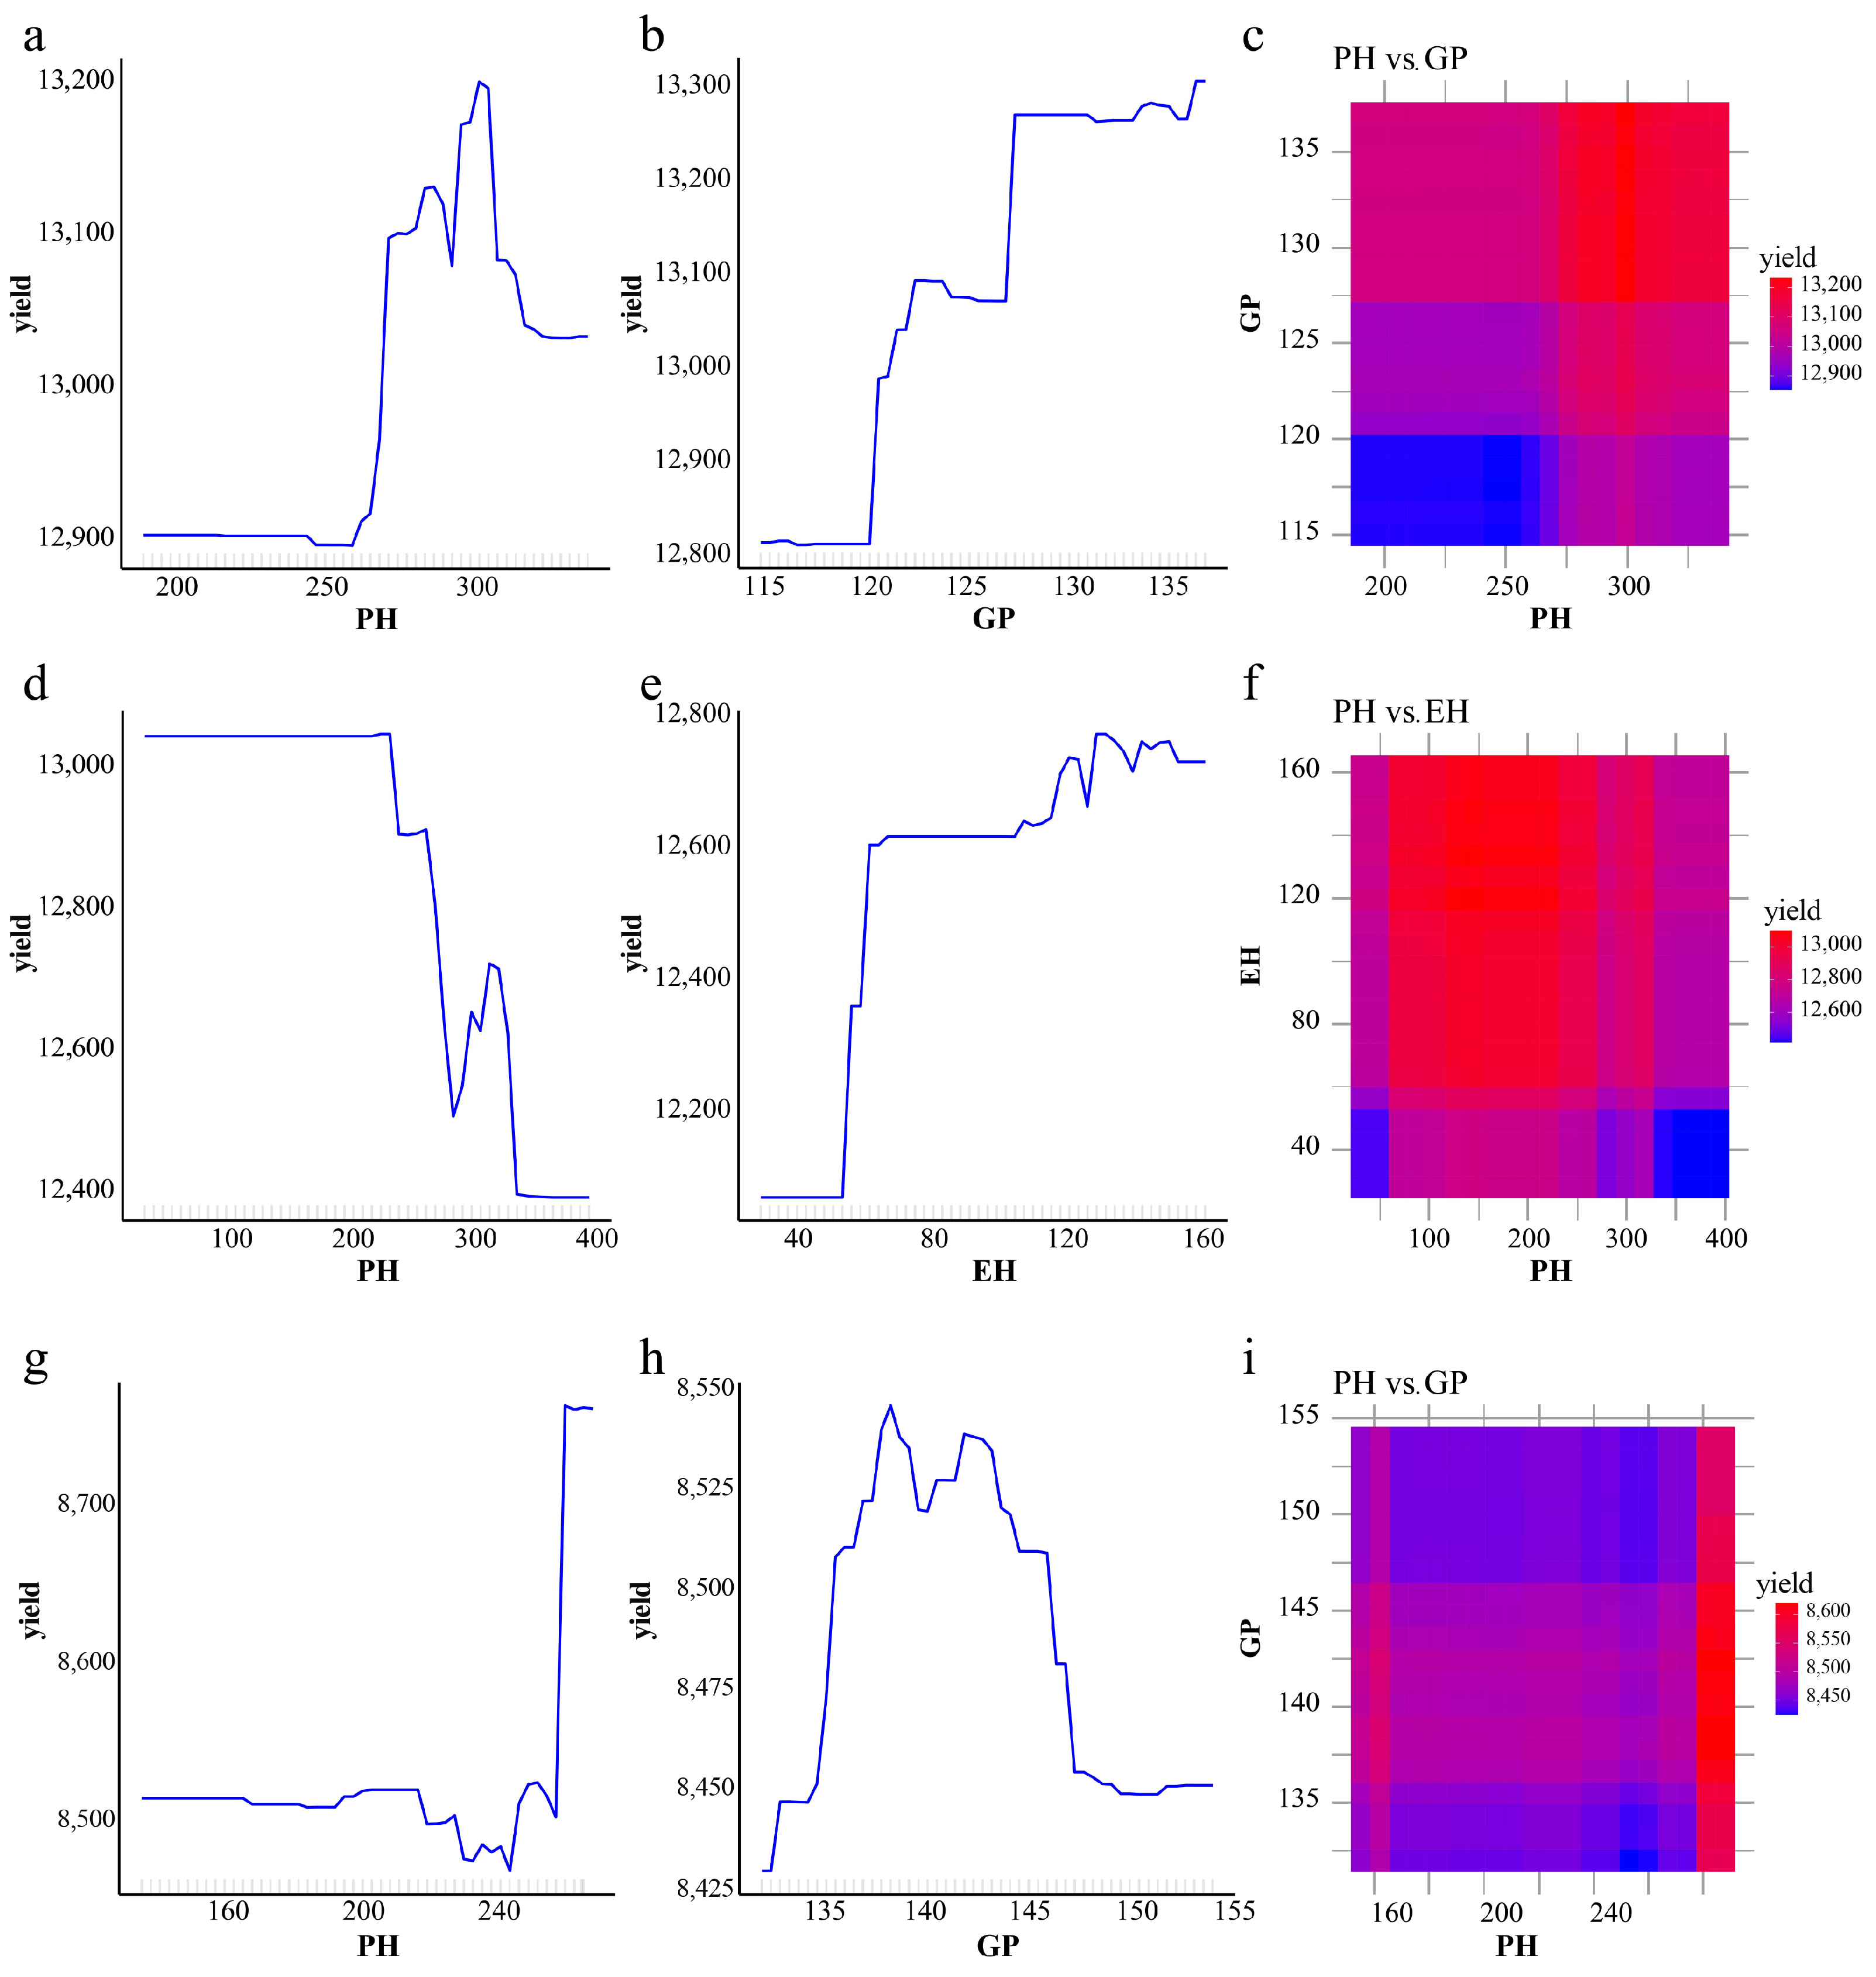
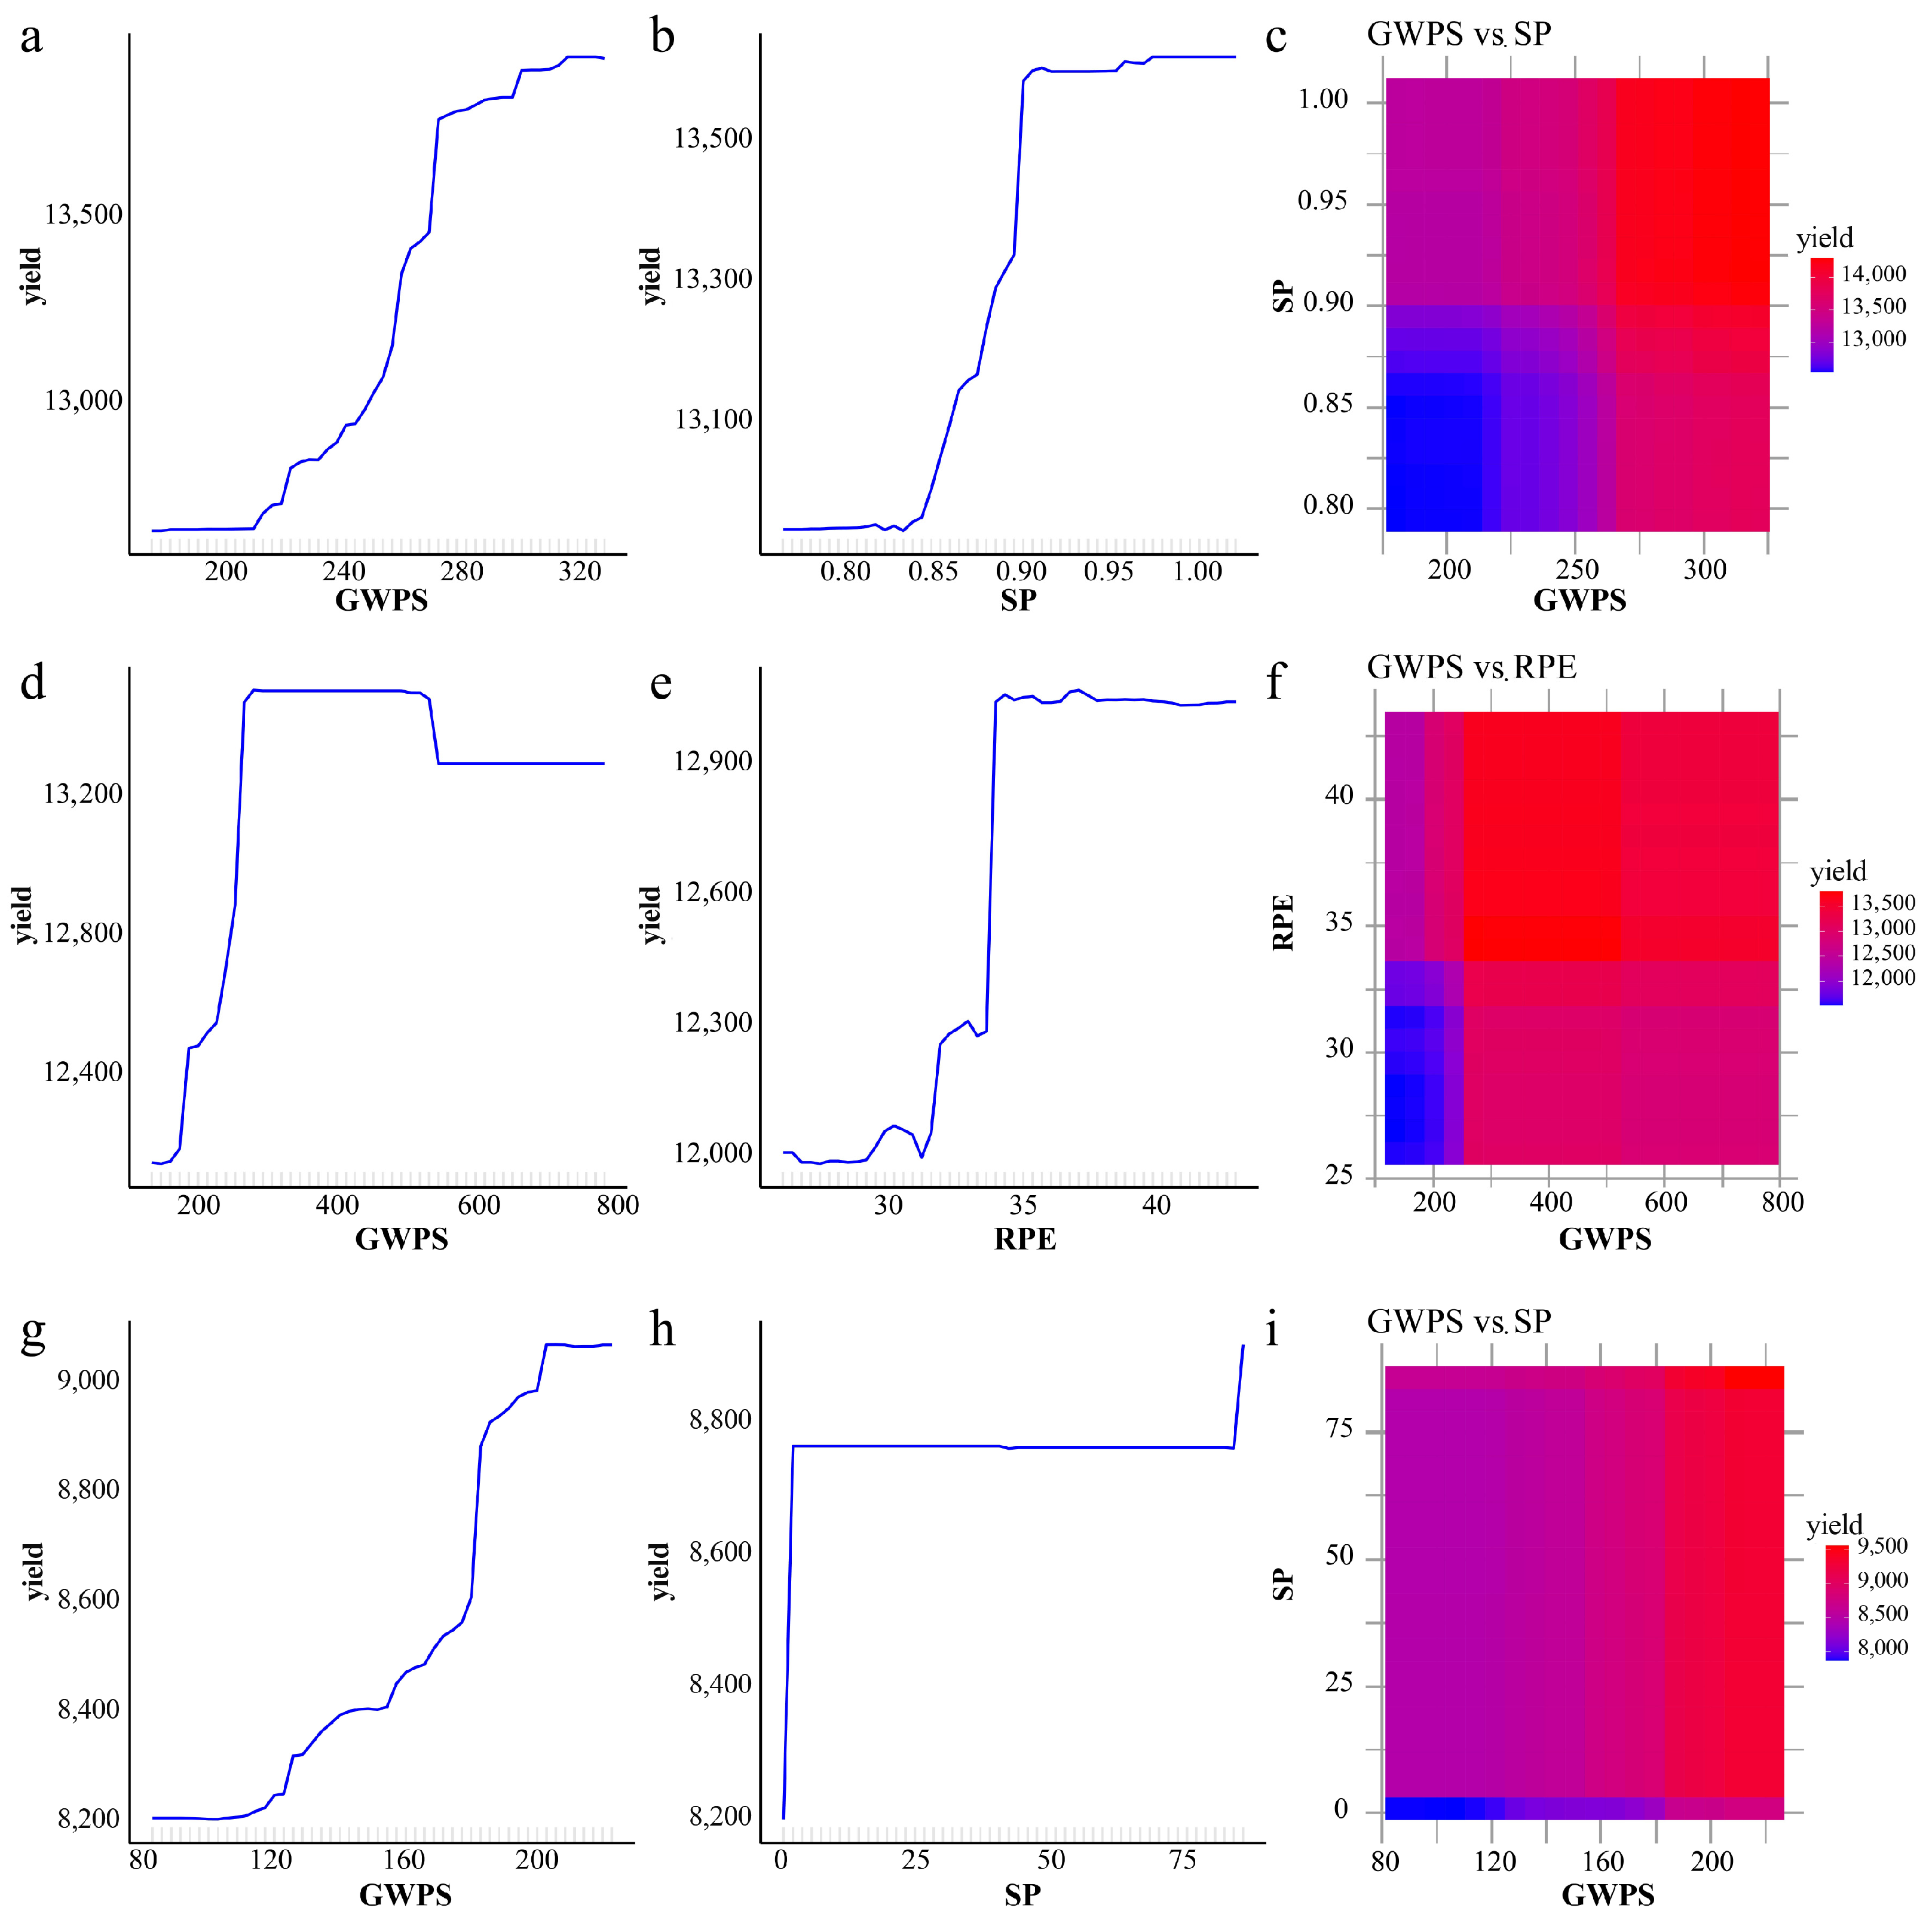
PDP analyses of key traits under XGBoost and RF models for three regions are illustrated in Figure 5 and Figure 6. As shown in Figure 5, the XGBoost model identified similar important features in predictions for different regions, Likewise, the RF model produces consistent findings, as depicted in Figure 6. Notably, minor variations were observed in their interaction strengths (Figure 5c,f,i). In the XGBoost analysis, PH and GP emerged as pivotal factors (Figure 5a,b,d,g,h), whereas the RF analysis identified GWPS and SP as critical yield determinants (Figure 5g,h and Figure 6a,b,d), consistent with the correlation analysis of the results presented in Table 1. These findings underscore the importance of maintaining all critical factors within their optimal physiological ranges to achieve yield optimization. Furthermore, this structured comparison not only emphasizes the consistency of both models in identifying key contributors but also reveals subtle differences in their prioritization of traits, offering valuable insights for refining agricultural strategies.

4. Discussion

In this study, the XGBoost model demonstrated superior predictive accuracy and stability compared to RF and SVM models, which are consistent with the findings reported by Kang et al. [19], Demir et al. [31], Sahin [32], Ramdani et al. [33], and Abbasi et al. [34]. This advantage can likely be attributed to XGBoost’s iterative bias-variance reduction mechanism [35]. Similarly, Babaie Sarijaloo et al. [36] reported the superior performance of XGBoost in estimating yield potential for untested inbred lines and tester combinations, which is attributed to its algorithmic robustness. Conversely, SVM underperformed in grain yield prediction [30], exhibiting a high degree of prediction variability. This limitation may be attributed to its inefficiency in handling large-scale datasets, especially when contrasted with XGBoost and RF [37].
While machine learning models perform well in yield prediction [38,39], their performance remains highly dependent on the quality and quantity of training data, particularly, reliable extrapolation contingent on similarity between new and training datasets [40]. The inherent black-box nature of these models further constrains their practical application in agriculture. To bridge this gap, PDP analysis was employed to illuminate the marginal effects of GWPS, SP, GP, and PH on yield. This approach not only enhances model interpretability but also aligns seamlessly with the explainable AI framework proposed by Hu et al. [10], offering a pathway toward more transparent and actionable agricultural insights.
In the analysis of correlations between agronomic trait and yield, GWPS and HKW showed the strongest associations with yield, which is consistent with the results reported by Rafiq et al. [41], Reddy et al. [42], and Lu et al. [43] that HKW is the key yield determinant. Additionally, PH and EL showed significant positive correlations with yield, corroborating the observations made by Nzuve et al. [44]. However, GP displayed a significant negative correlation with yield, which contrasts the findings of Zhao et al. [25], who reported that extended growth periods under regional warming trends could enhance productivity through field trials and crop modeling.
Feature importance analysis identified GWPS, SP, GP, and PH as key predictors of yield. These findings can direct breeding programs to (1) prioritize selection for higher GWPS and GP to enhance yield potential and (2) optimize SP and PH through planting density adjustments and early selection. Although meteorological factors did not rank prominently in feature importance, they indirectly influenced yield formation through dynamic regulation of GP [25]. Temperature, precipitation, or their interactions explained one-third of the observed yield variation [45]. Variations in precipitation and temperature [46], as well as low temperature and solar radiation levels [47], can significantly impact crop yield. Previous studies have consistently highlighted climate impacts on yield [1,2,3,48,49], with Shamsuddin et al. [50] demonstrating that the integration of historical weather data enhanced both predictive and explanatory power of models. Furthermore, Meng et al. [23] emphasized the critical role of incorporating multispectral and environmental data for more robust and reliable yield forecasting.
This study identifies GWPS and SP as critical indicators for high-yield breeding programs, and adjusting growth period may help mitigate yield loss risks under adverse environmental conditions [25]. Nevertheless, several limitations should be acknowledged. Firstly, the dataset is constrained by its geographical scope, being limited to three locations in Yunnan Province, and by its relatively short temporal span. To validate the generalizability of the model, it is necessary to expand geographic coverage and implement long-term climate monitoring. Secondly, this study excludes soil physicochemical properties and other latent factors. Thus, future research should integrate multi-omics data [24], climatic variables, and satellite observations [51] to refine predictive accuracy and provide a more comprehensive understanding of the factors influencing crop yield. By addressing these gaps, subsequent studies can further enhance the robustness and applicability of high-yield breeding strategies.

5. Conclusions

This study integrated agronomic traits and meteorological data to predict maize yields in three regions (Dali, Lijiang, and Zhaotong) using three machine learning models: RF, SVM, and XGBoost. The results demonstrated XGBoost model has superior predictive accuracy and stability, which achieved higher R2 value and lower RMSE across all regions, highlighting its distinct advantage in multi-site yield forecasting. Among the agronomic traits analyzed, GWPS and HKW exhibited the strongest correlations with yield, identifying grain weight as a critical yield determinant. Additionally, PH and EL showed significant positive correlations with yield, while GP displayed a negative correlation, suggesting prolonged maturation periods may reduce productivity. Feature importance analysis further identified GWPS, SP, GP, and PH as key predictors of yield. PDP analyses revealed nonlinear interactive effects between these traits and yield, significantly enhancing model interpretability. Collectively, these results not only demonstrate the robustness of XGBoost in yield prediction but also provide valuable insights into the complex relationships between agronomic traits and maize productivity. This study’s restricted dataset and geographic scope may lead to the danger of overfitting. Thus, future research should encompass a more extensive array of regions and include multi-year data. The integration of soil measurements and satellite remote sensing techniques is also recommended to enhance the model’s ability to be applied in diverse contexts.

Supplementary Materials

The following supporting information can be downloaded at: https://www.mdpi.com/article/10.3390/agronomy15081978/s1, Supplementary Table S1. Information of hybrid cultivars.

Author Contributions

C.M.—original draft, writing—review and editing, visualization, validation, methodology, investigation, formal analysis, data curation, project administration. Z.Y.: writing—review and editing, supervision, resources, conceptualization, project administration, funding acquisition. Q.Z.: writing—review and editing, investigation, project administration. C.L.: writing—review and editing, investigation, supervision, project administration. All authors have read and agreed to the published version of the manuscript.

Funding

This work was supported by the National Natural Science Foundation of China (No. 32401771), Yunnan Fundamental Research Projects (Nos. 202201AU070003, 202301AT070025), Xingdian Talent Support Program of Yunnan Province (No. XDYC-QNRC-2023-0016), Scientific Research Foundation of Education Department of Yunnan Province (Nos. 2025J0813, 2025Y1251), Doctoral Research Start-up Project of Dali University (No. KYBS2021068), and Research Development Fund of Dali University (No. KY2519104040). The funding bodies provided the financial support in carrying out the experiments, sample and data analysis, and MS writing.

Data Availability Statement

Data will be made available from the corresponding author upon request.

Acknowledgments

We would like to thank the Yunnan Zu Feng Seed Industry Co., Ltd., for their assistance in the investigation during the cropping periods.

Conflicts of Interest

Author Chaorui Liu was employed by the company Yunnan Zufeng Seed Industry Co., Ltd. The remaining authors declare that the research was conducted in the absence of any commercial or financial relationships that could be construed as a potential conflict of interest.

References

  1. Ocwa, A.; Harsanyi, E.; Széles, A.; Holb, I.J.; Szabó, S.; Rátonyi, T.; Mohammed, S. A bibliographic review of climate change and fertilization as the main drivers of maize yield: Implications for food security. Agric. Food Secur. 2023, 12, 14. [Google Scholar] [CrossRef]
  2. Ureta, C.; González, E.J.; Espinosa, A.; Trueba, A.; Piñeyro-Nelson, A.; Álvarez-Buylla, E.R. Maize yield in Mexico under climate change. Agric. Syst. 2020, 177, 102697. [Google Scholar] [CrossRef]
  3. Wu, J.-Z.; Zhang, J.; Ge, Z.-M.; Xing, L.-W.; Han, S.-Q.; Shen, C.; Kong, F.-T. Impact of climate change on maize yield in China from 1979 to 2016. J. Integr. Agric. 2021, 20, 289–299. [Google Scholar] [CrossRef]
  4. Jácome-Galarza, L.-R. Multimodal deep learning for crop yield prediction. In Doctoral Symposium on Information and Communication Technologies; Springer International Publishing: Berlin/Heidelberg, Germany, 2022; pp. 106–117. [Google Scholar]
  5. Yewle, A.D.; Mirzayeva, L.; Karakuş, O. Multi-modal Data Fusion and Deep Ensemble Learning for Accurate Crop Yield Prediction. arXiv 2025, arXiv:2502.06062. [Google Scholar] [CrossRef]
  6. Danilevicz, M.F.; Bayer, P.E.; Boussaid, F.; Bennamoun, M.; Edwards, D. Maize Yield Prediction at an Early Developmental Stage Using Multispectral Images and Genotype Data for Preliminary Hybrid Selection. Remote Sens. 2021, 13, 3976. [Google Scholar] [CrossRef]
  7. Kamilaris, A.; Prenafeta-Boldú, F.X. Deep learning in agriculture: A survey. Comput. Electron. Agric. 2018, 147, 70–90. [Google Scholar] [CrossRef]
  8. Shahhosseini, M.; Hu, G.; Archontoulis, S.V. Forecasting corn yield with machine learning ensembles. Front. Plant Sci. 2020, 11, 1120. [Google Scholar] [CrossRef] [PubMed]
  9. Asamoah, E.; Heuvelink, G.B.M.; Chairi, I.; Bindraban, P.S.; Logah, V. Random forest machine learning for maize yield and agronomic efficiency prediction in Ghana. Heliyon 2024, 10, e37065. [Google Scholar] [CrossRef]
  10. Hu, T.; Zhang, X.; Bohrer, G.; Liu, Y.; Zhou, Y.; Martin, J.; Li, Y.; Zhao, K. Crop yield prediction via explainable AI and interpretable machine learning: Dangers of black box models for evaluating climate change impacts on crop yield. Agric. For. Meteorol. 2023, 336, 109458. [Google Scholar] [CrossRef]
  11. Roy, T.; Das, P.; Jagirdar, R.; Shhabat, M.; Abdullah, M.S.; Kashem, A.; Rahman, R. Prediction of mechanical properties of eco-friendly concrete using machine learning algorithms and partial dependence plot analysis. Smart Constr. Sustain. Cities 2025, 3, 2. [Google Scholar] [CrossRef]
  12. Croci, M.; Impollonia, G.; Meroni, M.; Amaducci, S. Dynamic Maize Yield Predictions Using Machine Learning on Multi-Source Data. Remote Sens. 2023, 15, 100. [Google Scholar] [CrossRef]
  13. Baio, F.H.R.; Santana, D.C.; Teodoro, L.P.R.; Oliveira, I.C.d.; Gava, R.; de Oliveira, J.L.G.; Silva Junior, C.A.d.; Teodoro, P.E.; Shiratsuchi, L.S. Maize Yield Prediction with Machine Learning, Spectral Variables and Irrigation Management. Remote Sens. 2023, 15, 79. [Google Scholar] [CrossRef]
  14. Everingham, Y.; Sexton, J.; Skocaj, D.; Inman-Bamber, G. Accurate prediction of sugarcane yield using a random forest algorithm. Agron. Sustain. Dev. 2016, 36, 27. [Google Scholar] [CrossRef]
  15. Khanal, S.; Fulton, J.; Klopfenstein, A.; Douridas, N.; Shearer, S. Integration of high resolution remotely sensed data and machine learning techniques for spatial prediction of soil properties and corn yield. Comput. Electron. Agric. 2018, 153, 213–225. [Google Scholar] [CrossRef]
  16. Jeong, J.H.; Resop, J.P.; Mueller, N.D.; Fleisher, D.H.; Yun, K.; Butler, E.E.; Timlin, D.J.; Shim, K.-M.; Gerber, J.S.; Reddy, V.R. Random forests for global and regional crop yield predictions. PLoS ONE 2016, 11, e0156571. [Google Scholar] [CrossRef]
  17. Cheng, M.; Penuelas, J.; McCabe, M.F.; Atzberger, C.; Jiao, X.; Wu, W.; Jin, X. Combining multi-indicators with machine-learning algorithms for maize yield early prediction at the county-level in China. Agric. For. Meteorol. 2022, 323, 109057. [Google Scholar] [CrossRef]
  18. Cai, Y.; Guan, K.; Lobell, D.; Potgieter, A.B.; Wang, S.; Peng, J.; Xu, T.; Asseng, S.; Zhang, Y.; You, L.; et al. Integrating satellite and climate data to predict wheat yield in Australia using machine learning approaches. Agric. For. Meteorol. 2019, 274, 144–159. [Google Scholar] [CrossRef]
  19. Kang, Y.; Ozdogan, M.; Zhu, X.; Ye, Z.; Hain, C.; Anderson, M. Comparative assessment of environmental variables and machine learning algorithms for maize yield prediction in the US Midwest. Environ. Res. Lett. 2020, 15, 064005. [Google Scholar] [CrossRef]
  20. Technow, F.; Schrag, T.A.; Schipprack, W.; Bauer, E.; Simianer, H.; Melchinger, A.E. Genome Properties and Prospects of Genomic Prediction of Hybrid Performance in a Breeding Program of Maize. Genetics 2014, 197, 1343–1355. [Google Scholar] [CrossRef]
  21. Zhang, M.; Cui, Y.; Liu, Y.-H.; Xu, W.; Sze, S.-H.; Murray, S.C.; Xu, S.; Zhang, H.-B. Accurate prediction of maize grain yield using its contributing genes for gene-based breeding. Genomics 2020, 112, 225–236. [Google Scholar] [CrossRef]
  22. Wang, Y.; Zhang, Z.; Feng, L.; Du, Q.; Runge, T. Combining Multi-Source Data and Machine Learning Approaches to Predict Winter Wheat Yield in the Conterminous United States. Remote Sens. 2020, 12, 1232. [Google Scholar] [CrossRef]
  23. Meng, L.; Liu, H.L.; Ustin, S.; Zhang, X. Predicting Maize Yield at the Plot Scale of Different Fertilizer Systems by Multi-Source Data and Machine Learning Methods. Remote Sens. 2021, 13, 3760. [Google Scholar] [CrossRef]
  24. Wu, C.; Luo, J.; Xiao, Y. Multi-omics assists genomic prediction of maize yield with machine learning approaches. Mol. Breed. 2024, 44, 14. [Google Scholar] [CrossRef] [PubMed]
  25. Zhao, J.; Liu, Z.; Lv, S.; Lin, X.; Li, T.; Yang, X. Changing maize hybrids helps adapt to climate change in Northeast China: Revealed by field experiment and crop modelling. Agric. For. Meteorol. 2023, 342, 109693. [Google Scholar] [CrossRef]
  26. RColorBrewer, S.; Liaw, M.A. Package ‘Randomforest’; University of California, Berkeley: Berkeley, CA, USA, 2018. [Google Scholar]
  27. Meyer, D.; Wien, F. Support vector machines. R News 2001, 1, 23–26. [Google Scholar]
  28. Chen, T.; He, T.; Benesty, M.; Khotilovich, V. Package ‘xgboost’. R Version 2019, 90, 40. [Google Scholar]
  29. Sparks, A.H.; Hengl, T.; Nelson, A. GSODR: Global summary daily weather data in R. J. Open Source Softw. 2017, 2, 177. [Google Scholar] [CrossRef]
  30. Azrai, M.; Aqil, M.; Andayani, N.; Efendi, R.; Suarni; Suwardi; Jihad, M.; Zainuddin, B.; Salim; Bahtiar; et al. Optimizing ensembles machine learning, genetic algorithms, and multivariate modeling for enhanced prediction of maize yield and stress tolerance index. Front. Sustain. Food Syst. 2024, 8, 1334421. [Google Scholar] [CrossRef]
  31. Demir, S.; Şahin, E.K. Liquefaction prediction with robust machine learning algorithms (SVM, RF, and XGBoost) supported by genetic algorithm-based feature selection and parameter optimization from the perspective of data processing. Environ. Earth Sci. 2022, 81, 459. [Google Scholar] [CrossRef]
  32. Sahin, E.K. Implementation of free and open-source semi-automatic feature engineering tool in landslide susceptibility mapping using the machine-learning algorithms RF, SVM, and XGBoost. Stoch. Environ. Res. Risk Assess. 2023, 37, 1067–1092. [Google Scholar] [CrossRef]
  33. Ramdani, F.; Furqon, M.T. The simplicity of XGBoost algorithm versus the complexity of Random Forest, Support Vector Machine, and Neural Networks algorithms in urban forest classification. F1000Research 2022, 11, 1069. [Google Scholar] [CrossRef]
  34. Abbasi, M.; Váz, P.; Silva, J.; Martins, P. Machine Learning Approaches for Predicting Maize Biomass Yield: Leveraging Feature Engineering and Comprehensive Data Integration. Sustainability 2025, 17, 256. [Google Scholar] [CrossRef]
  35. Chen, S.; Liu, W.; Feng, P.; Ye, T.; Ma, Y.; Zhang, Z. Improving spatial disaggregation of crop yield by incorporating machine learning with multisource data: A case study of Chinese maize yield. Remote Sens. 2022, 14, 2340. [Google Scholar] [CrossRef]
  36. Babaie Sarijaloo, F.; Porta, M.; Taslimi, B.; Pardalos, P.M. Yield performance estimation of corn hybrids using machine learning algorithms. Artif. Intell. Agric. 2021, 5, 82–89. [Google Scholar] [CrossRef]
  37. Singh, R.; Biswas, M.; Pal, M. Cloud detection using sentinel 2 imageries: A comparison of XGBoost, RF, SVM, and CNN algorithms. Geocarto Int. 2022, 38, 1–32. [Google Scholar] [CrossRef]
  38. Sharifi, A. Yield prediction with machine learning algorithms and satellite images. J. Sci. Food Agric. 2021, 101, 891–896. [Google Scholar] [CrossRef]
  39. Morales, A.; Villalobos, F.J. Using machine learning for crop yield prediction in the past or the future. Front. Plant Sci. 2023, 14, 1128388. [Google Scholar] [CrossRef] [PubMed]
  40. Meyer, H.; Pebesma, E. Predicting into unknown space? Estimating the area of applicability of spatial prediction models. Methods Ecol. Evol. 2021, 12, 1620–1633. [Google Scholar] [CrossRef]
  41. Rafiq, C.M.; Rafique, M.; Hussain, A.; Altaf, M. Studies on heritability, correlation and path analysis in maize (Zea mays L.). J. Agric. Res. 2010, 48, 35–38. [Google Scholar]
  42. Reddy, S.G.M.; Lal, G.M.; Krishna, T.V.; Reddy, Y.V.S.; Sandeep, N. Correlation and path coefficient analysis for grain yield components in maize (Zea mays L.). Int. J. Plant Soil Sci. 2022, 34, 24–36. [Google Scholar] [CrossRef]
  43. Lu, X.; Zhou, Z.; Yuan, Z.; Zhang, C.; Hao, Z.; Wang, Z.; Li, M.; Zhang, D.; Yong, H.; Han, J. Genetic dissection of the general combining ability of yield-related traits in maize. Front. Plant Sci. 2020, 11, 788. [Google Scholar] [CrossRef] [PubMed]
  44. Nzuve, F.; Githiri, S.; Mukunya, D.; Gethi, J. Genetic variability and correlation studies of grain yield and related agronomic traits in maize. J. Agric. Sci. 2014, 6, 166. [Google Scholar] [CrossRef]
  45. Ray, D.K.; Gerber, J.S.; MacDonald, G.K.; West, P.C. Climate variation explains a third of global crop yield variability. Nat. Commun. 2015, 6, 5989. [Google Scholar] [CrossRef]
  46. Kukal, M.S.; Irmak, S. Climate-Driven Crop Yield and Yield Variability and Climate Change Impacts on the U.S. Great Plains Agricultural Production. Sci. Rep. 2018, 8, 3450. [Google Scholar] [CrossRef]
  47. Khaki, S.; Wang, L. Crop yield prediction using deep neural networks. Front. Plant Sci. 2019, 10, 621. [Google Scholar] [CrossRef]
  48. Cairns, J.E.; Hellin, J.; Sonder, K.; Araus, J.L.; MacRobert, J.F.; Thierfelder, C.; Prasanna, B.M. Adapting maize production to climate change in sub-Saharan Africa. Food Secur. 2013, 5, 345–360. [Google Scholar] [CrossRef]
  49. Li, X.; Takahashi, T.; Suzuki, N.; Kaiser, H.M. The impact of climate change on maize yields in the United States and China. Agric. Syst. 2011, 104, 348–353. [Google Scholar] [CrossRef]
  50. Shamsuddin, D.; Danilevicz, M.F.; Al-Mamun, H.A.; Bennamoun, M.; Edwards, D. Multimodal Deep Learning Integration of Image, Weather, and Phenotypic Data Under Temporal Effects for Early Prediction of Maize Yield. Remote Sens. 2024, 16, 4043. [Google Scholar] [CrossRef]
  51. Chen, X.; Feng, L.; Yao, R.; Wu, X.; Sun, J.; Gong, W. Prediction of Maize Yield at the City Level in China Using Multi-Source Data. Remote Sens. 2021, 13, 146. [Google Scholar] [CrossRef]
Figure 1. Data analysis workflow diagram.
Agronomy 15 01978 g001
Figure 2. Model performance across regions. Panels (ac), (df), and (gi) correspond to predictions by FR, SVM, and XGBoost models, respectively. Within each model group, panels (a,d,g) display results for Dali, (b,e,h) for Lijiang, and (c,f,i) for Zhaotong. Solid lines denote the 1:1 reference, while dashed lines show linear regressions between observed and predicted values on test datasets.
Agronomy 15 01978 g002
Figure 3. Boxplots of prediction errors for three different models in yield prediction. (The red dotted line represents the zero-error baseline, while the gray shaded area indicates the error range).
Agronomy 15 01978 g003
Figure 4. Variable importance plots across models. Panels (a,c,e) correspond to RF; panels (b,d,f) correspond to XGBoost. Regional distributions: (a,b) (Dali); (c,d) (Lijiang); (e,f) (Zhaotong). Predictor importance was quantified by the percentage increase in mean squared error (IncMSE%), where larger values signify a stronger impact. Significance levels are denoted as follows: * p < 0.05, ** p < 0.01. TEMP (mean temperature), DEWP (mean dew point), VISIB (mean visibility), WDSP (mean wind speed), MAX (maximum temperature), MIN (minimum temperature), RH (relative humidity), PRCP (precipitation amount).
Agronomy 15 01978 g004
Figure 5. PDP analysis of important traits under XGBoost models across three regions: (ac) correspond to Dali region; (df) Lijiang region; (gi) Zhaotong region. Subplots (a,b,d,e,g,h) demonstrate marginal effects of key traits on yield, while subplots (c,f,i) display interaction effects between important traits on yield.
Agronomy 15 01978 g005
Figure 6. PDP analysis of important traits under RF models across three regions. (ac) Dali region; (df) Lijiang region; (gi) Zhaotong region. Subplots (a,b,d,e,g,h) demonstrate marginal effects of key traits on yield, while subplots (c,f,i) display interaction effects between important traits on yield.
Agronomy 15 01978 g006
Table 1. Pearson correlation analysis between maize yield and yield components.
GPPHEHTBNELEDBTLKPRRPEHKWSPGWPSYield
GP1
PH−0.51 **1
EH0.33 **0.10 *1
TBN−0.16 **0.21 **0.15 **1
EL0.32 **−0.25 **0.06−0.10 *1
ED−0.15 **0.16 **0.15 **0.02−0.061
BTL−0.46 **0.28 **−0.15 **0.12 *−0.18 **0.091
KPR0.080.02−0.030.05−0.030.22 **−0.11 *1
RPE0.090.090.070.020.38 **0.03−0.18 **0.031
HKW−0.51 **0.47 **−0.17 **0.02−0.14 **0.27 **0.35 **−0.28 **−0.061
SP−0.37 **0.39 **−0.16 **0.23 **−0.12 *0.070.05−0.010.13 *0.37 **1
GWPS−0.51 **0.52 **−0.16 **0.21 **−0.12 *0.28 **0.25 **0.060.060.59 **0.43 **1
Yield−0.62 **0.63 **−0.12 *0.12 *−0.24 **0.34 **0.31 **0.020.12 *0.67 **0.56 **0.68 **1
* and ** indicate that the correlation is significant at the 0.05 and 0.01 levels, respectively. GWPS: grain weight per spike; GP: growth period; PH: plant height; EH: ear height; ED: ear diameter; HKW: 100-kernel weight; BTL: bare top length; EL: ear length; KPR: kernels per row; SP: shelling percentage; RPE: rows per ear; TBN: tassel branch number.
Disclaimer/Publisher’s Note: The statements, opinions and data contained in all publications are solely those of the individual author(s) and contributor(s) and not of MDPI and/or the editor(s). MDPI and/or the editor(s) disclaim responsibility for any injury to people or property resulting from any ideas, methods, instructions or products referred to in the content.