Article

Preparation of a Bacterial Consortium for Straw Degradation and Optimization of Conditions for Its Return to the Field

1
Key Laboratory of Regional Environment and Eco-Restoration, Ministry of Education, Shenyang University, Shenyang 110044, China
2
Department of Environmental and Biological Engineering, Shenyang Institute of Science and Technology, Shenyang 110167, China
*
Author to whom correspondence should be addressed.
Agronomy 2025, 15(8), 1947; https://doi.org/10.3390/agronomy15081947
Submission received: 15 July 2025 / Revised: 9 August 2025 / Accepted: 10 August 2025 / Published: 13 August 2025
(This article belongs to the Section Agricultural Biosystem and Biological Engineering)

Abstract

The yield of corn straw is huge, and returning straw to the field is an efficient utilization measure. The challenge in this approach is how to efficiently degrade the straw returned to the field. The study of efficient straw-degrading bacteria and their application conditions is an important approach. Therefore, after enrichment, separation, screening, and strain identification, three strains (X−2, X−4, and X−6) of highly efficient cellulose-degrading bacteria were obtained, namely Pseudomonas aeruginosa PA14, Brevibacillus parabrevis M3, and Bacillus cereus PgBE247. Based on antagonistic experiment results in which the strains were observed to not be antagonistic to each other, they were combined to prepare a bacterial consortium (M−1) for straw degradation. The CMCase, FPA, and β-Gase of the M−1 consortium were 28.46 U/mL, 30.93 U/mL, and 27.94 U/mL, respectively, higher than the values for single bacteria. On the 35th day, the degradation rate of corn straw by M−1 reached 79.81% in liquid medium, significantly increased by 72.06% (p < 0.01) compared to the sterile control (CK), and was significantly higher than single bacteria (p < 0.05). The straw degradation rate of M−1 was the highest at 69.69% in the simulated straw return, significantly increased by 59.84% compared to CK (p < 0.05), and increased by 18.32%, 11.59%, and 14.92% compared to the straw degradation rates of X−2, X−4, and X−6, respectively. The response surface condition optimization verification results showed that the straw degradation rate was 72.15 ± 1.21% when the amount of bacterial suspension was 25%, corn straw dosage was 9 g, initial pH was 7, and reaction temperature was 30 °C. Overall, this study revealed a new bacterial consortium for corn straw decomposition and optimized the conditions for its return to the field, providing a theoretical basis for subsequent studies.

1. Introduction

Crop straw (including corn straw) is defined by the Food and Agriculture Organization of the United Nations (FAO) as the dry matter residue left after crop harvest, mainly composed of plant stems, leaves, and shells (Figure 1), and is an important biomass resource in agricultural ecosystems. The latest forecast for global corn production was approximately 1.22 × 10⁹ t in 2024, per the FAO. Using the straw coefficient method (grass to grain ratio) [1], the production of corn straw was 1.55 × 10⁹ t. Corn straw is a common woody cellulose biomass [2], which is a complex biopolymer typically composed of 35~50% cellulose, 20~35% hemicellulose, and 10~30% lignin [3]. Straw is often burned as agricultural waste, causing serious air pollution problems. As an important biomass resource, return of corn straw to the field can improve soil properties [4], increase nutrient elements [5], increase crop yields [6], improve microbial community structure [7], and increase organic carbon content [8].
The key to returning straw to the field is how to efficiently degrade straw in a short period of time. Microbial degradation is a commonly used method. For example, the weight loss rate of corn straw fermented by Coprinus comatus reached 23.65% [9]. Bacillus toyonensis strain LC3B1, which exhibited significant cellulose-degrading activity, achieved a degradation rate of 28.15 ± 1.56% for corn cob flour [10]. A single bacterial strain can usually only produce one cellulase, hemi-cellulase, or lignin enzyme, with a certain degree of singularity, while a complex bacterial consortium can simultaneously produce all three enzymes mentioned above, exerting synergistic effects through the interaction of different enzymes [11]. Therefore, the preparation of an efficient corn straw-degrading bacterial consortium can further improve the degradation efficiency of corn straw. This is because a microbial consortium can increase the interaction among microorganisms to compensate for the shortcomings of single strains [12,13]. Previous studies have shown that the cold-tolerant bacterial consortium LHWA was constructed using Bacillus cereus, Acinetobacter baumannii, Penicillium cinerea, and cyanobacteria; under cultivation conditions below 4 °C, after 30 days of liquid fermentation, the weight loss rate of corn straw was 55.52% [14]. The microbial consortium MC1 effectively degraded 83~88% of corn straw [15]. It can be seen that bacterial consortia have a better effect on straw degradation than single bacteria. This study screened straw-degrading bacteria from a mixture of farmland soil and decaying straw and compounded them to obtain an efficient straw-degrading bacterial consortium. At present, research on the degradation of corn straw mainly adopts straw fermentation degradation [16,17], and there are also studies on the degradation of straw in powder form [18,19,20]. Alternatively, straw can be placed in nylon mesh bags or gauze bags and buried in soil for degradation [21,22,23,24]. This study used flowerpots to simulate the degradation of straw by a bacterial consortium for later return to the field (Figure 1). The corn straw was cut into 2~3 cm small sections to preserve its original appearance. The straw was mixed into farmland soil and used as the main carbon source.

2. Materials and Methods

2.1. Soil and Straw

The corn straw and soil samples required for the experiment were collected from a corn field near Chuangxin Road in Hunnan District, Shenyang City (123°25′24″ N, 41°39′54″ E), which has been planted with corn for a long time and therefore possesses representative straw and soil. A simple treatment was performed on the collected straw: surface dirt and soil was removed, straw leaves and roots were peeled off, only the straw stem was kept, and it was cut into pieces of 2~3 cm with a guillotine to maintain the original shape of the straw stem. Then, it was air-dried naturally for subsequent experiments. Soil samples from farmland (0~20 cm depth) were sieved to remove large stones and biomass residues such as weeds and dead branches, in order to avoid experimental interference. However, an effort was made to maintain the original texture and morphology of the soil as much as possible, and then air-dry it naturally for future experiments. The basic physical and chemical characteristics of the soil are shown in Table 1.

2.2. Strains and Medium

Fresh farmland soil combined with decomposed straw was homogenized, sieved to remove impurities, and utilized as the microbial source. The efficient degrading corn straw bacteria was obtained through enrichment, separation, and screening. The main culture media were shown in Table 2.

2.3. Enrichment and Separation of Straw-Degrading Bacteria

The microbial source mixture 5 g was aseptically transferred into a 150 mL Erlenmeyer flask containing 50 mL of sterile distilled water. The suspension was incubated at 30 °C under constant agitation (120 rpm) for 30 min in an orbital shaker. Subsequently, 1 mL of the resulting suspension was pipetted into a separate Erlenmeyer flask containing 250 mL of sterile enrichment broth. This culture was then incubated at 30 °C with continuous shaking (120 rpm) for 48 h. After cultivation, bacterial suspensions were prepared with different concentration gradients of 10−2, 10−3, 10−4, 10−5, 10−6, 10−7, and 10−8, respectively. Then, the enriched bacterial solutions of 10−5, 10−6, 10−7, and 10−8 in the gradient were diluted and plated on CMC-Na medium for separation. After the bacteria have grown on the agar plate, an inoculation loop was used to collect individual colonies and plated them on CMC-Na medium for separation. The purification of the culture was repeated until pure bacterial strains were obtained.

2.4. Screening of Efficient Straw-Degrading Bacteria

2.4.1. Hydrolysis Transparent Circle Measurement Experiment

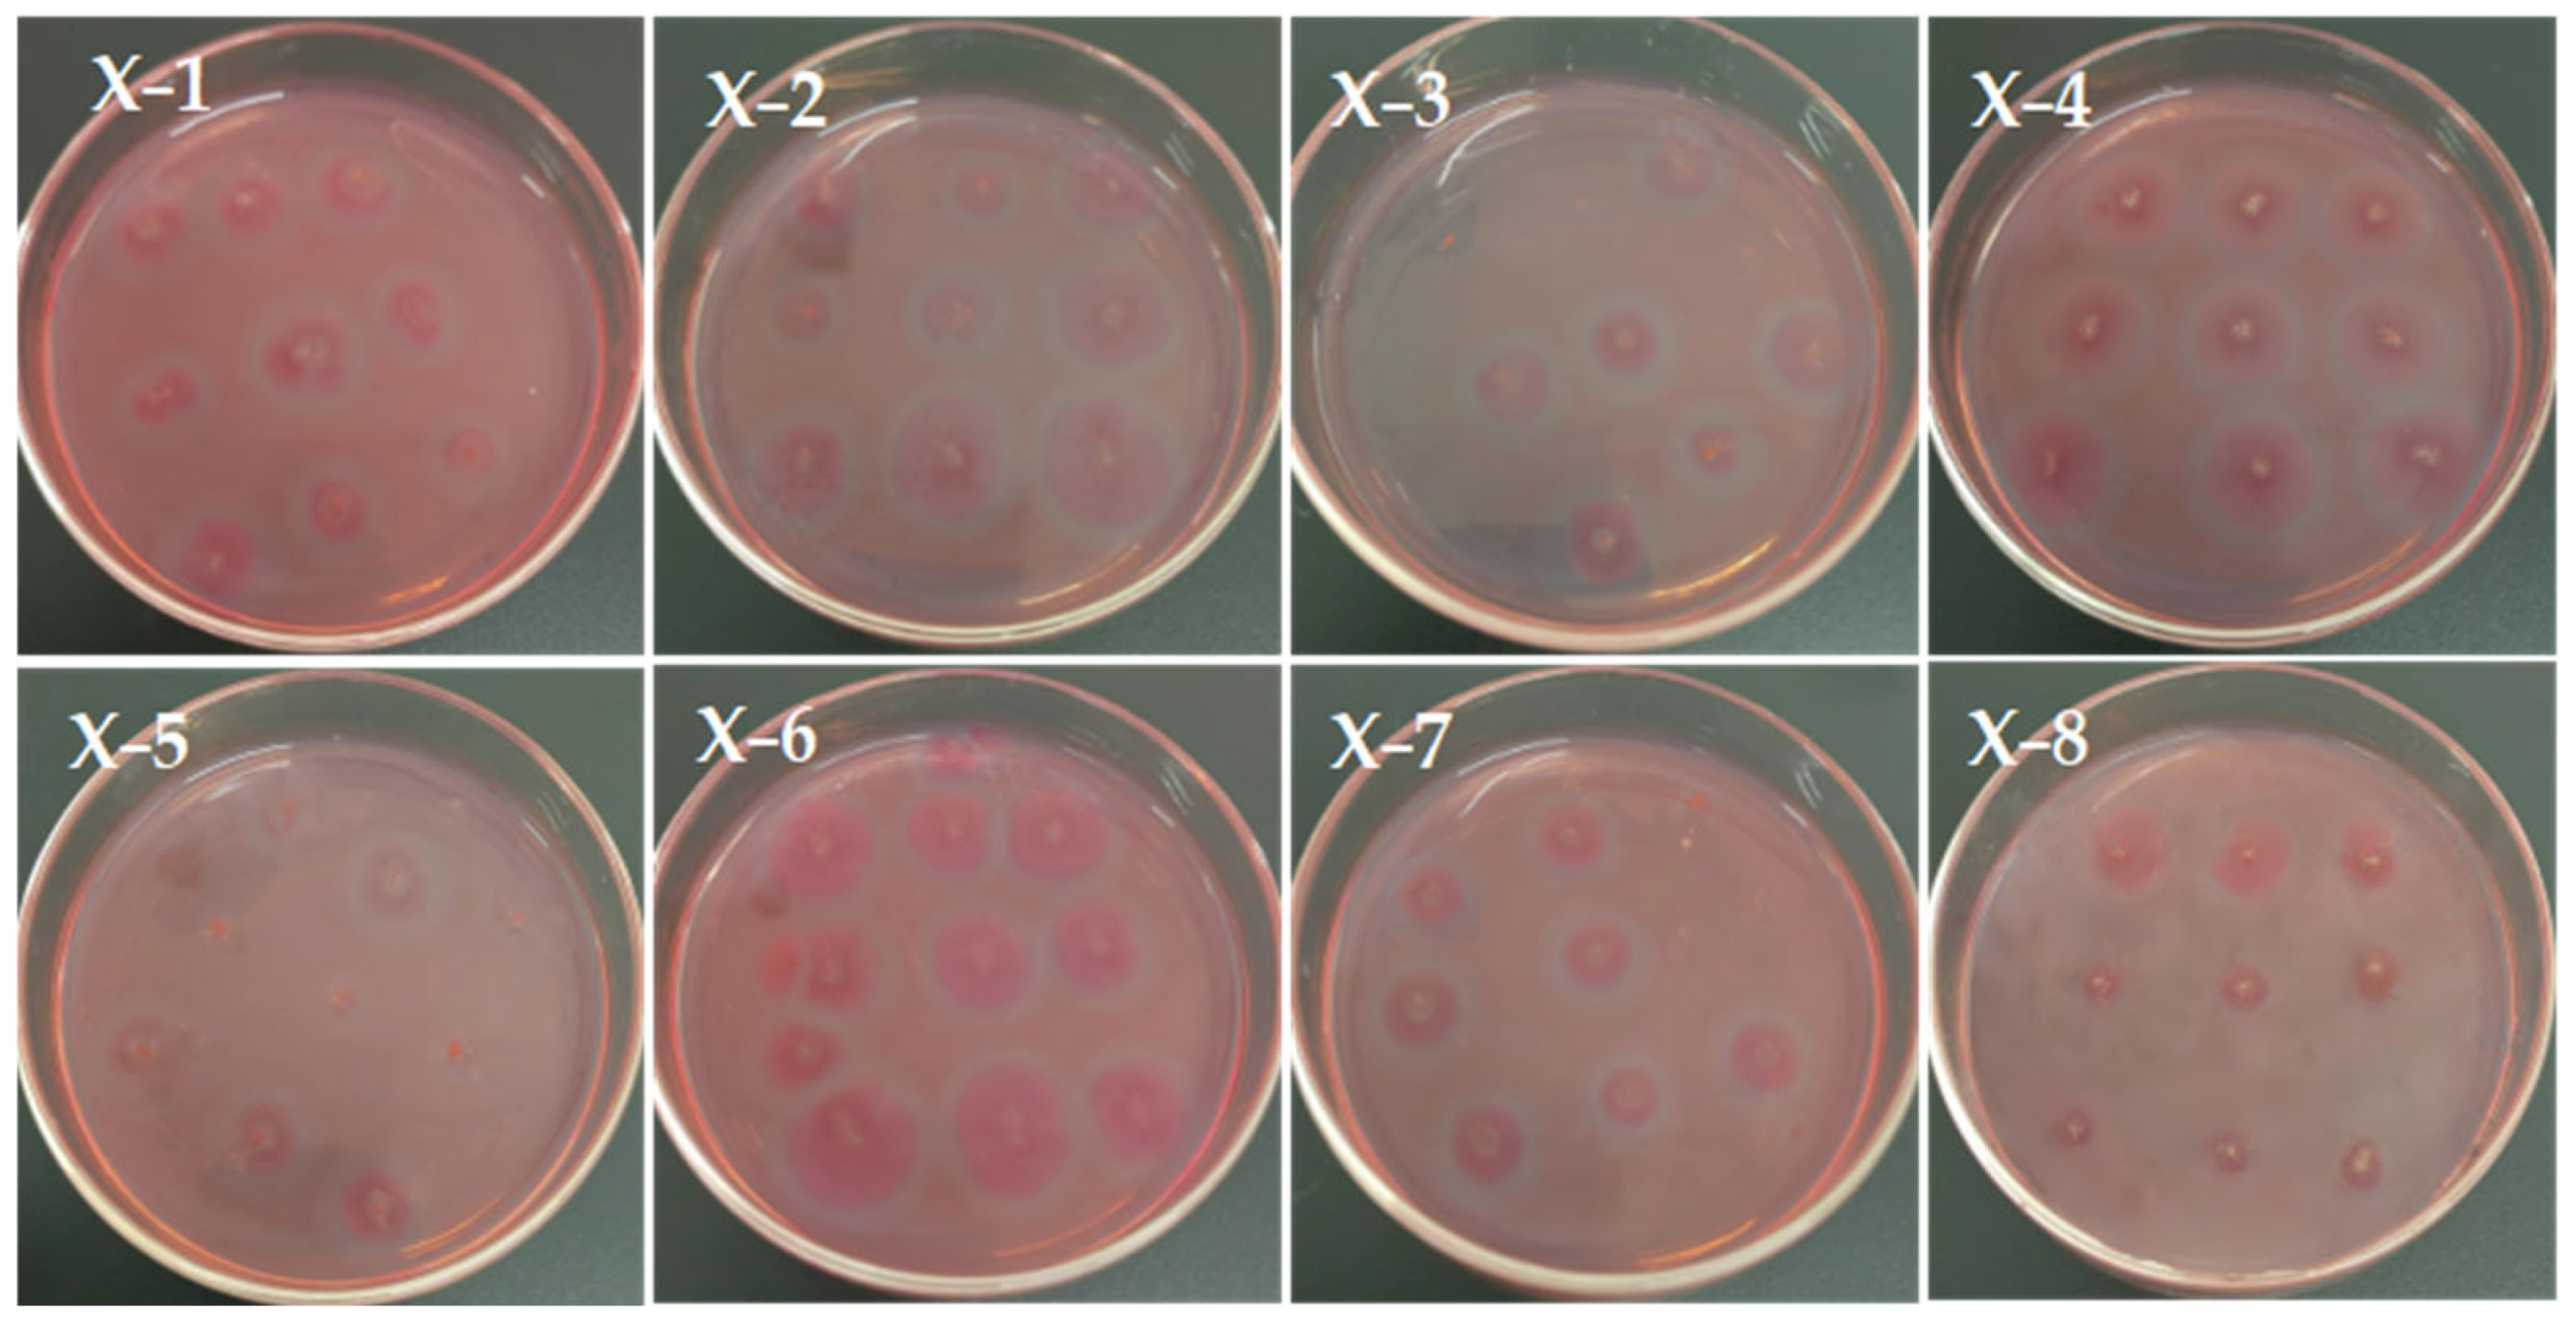
Using the spot inoculation method, the pure bacterial strains obtained by enrichment and separation were inoculated onto Congo red carboxymethyl cellulose sodium medium using an inoculation ring. Nine spots were placed on each medium, and the medium was incubated at a constant temperature of 30 °C for 48 h. The colony diameter (d) and transparent circle diameter (D) were accurately measured using a vernier caliper, and the ratio of transparent circle diameter to colony diameter (D/d) was calculated. Each strain was repeated three times.

2.4.2. Filter Paper Strip Disintegration Experiment

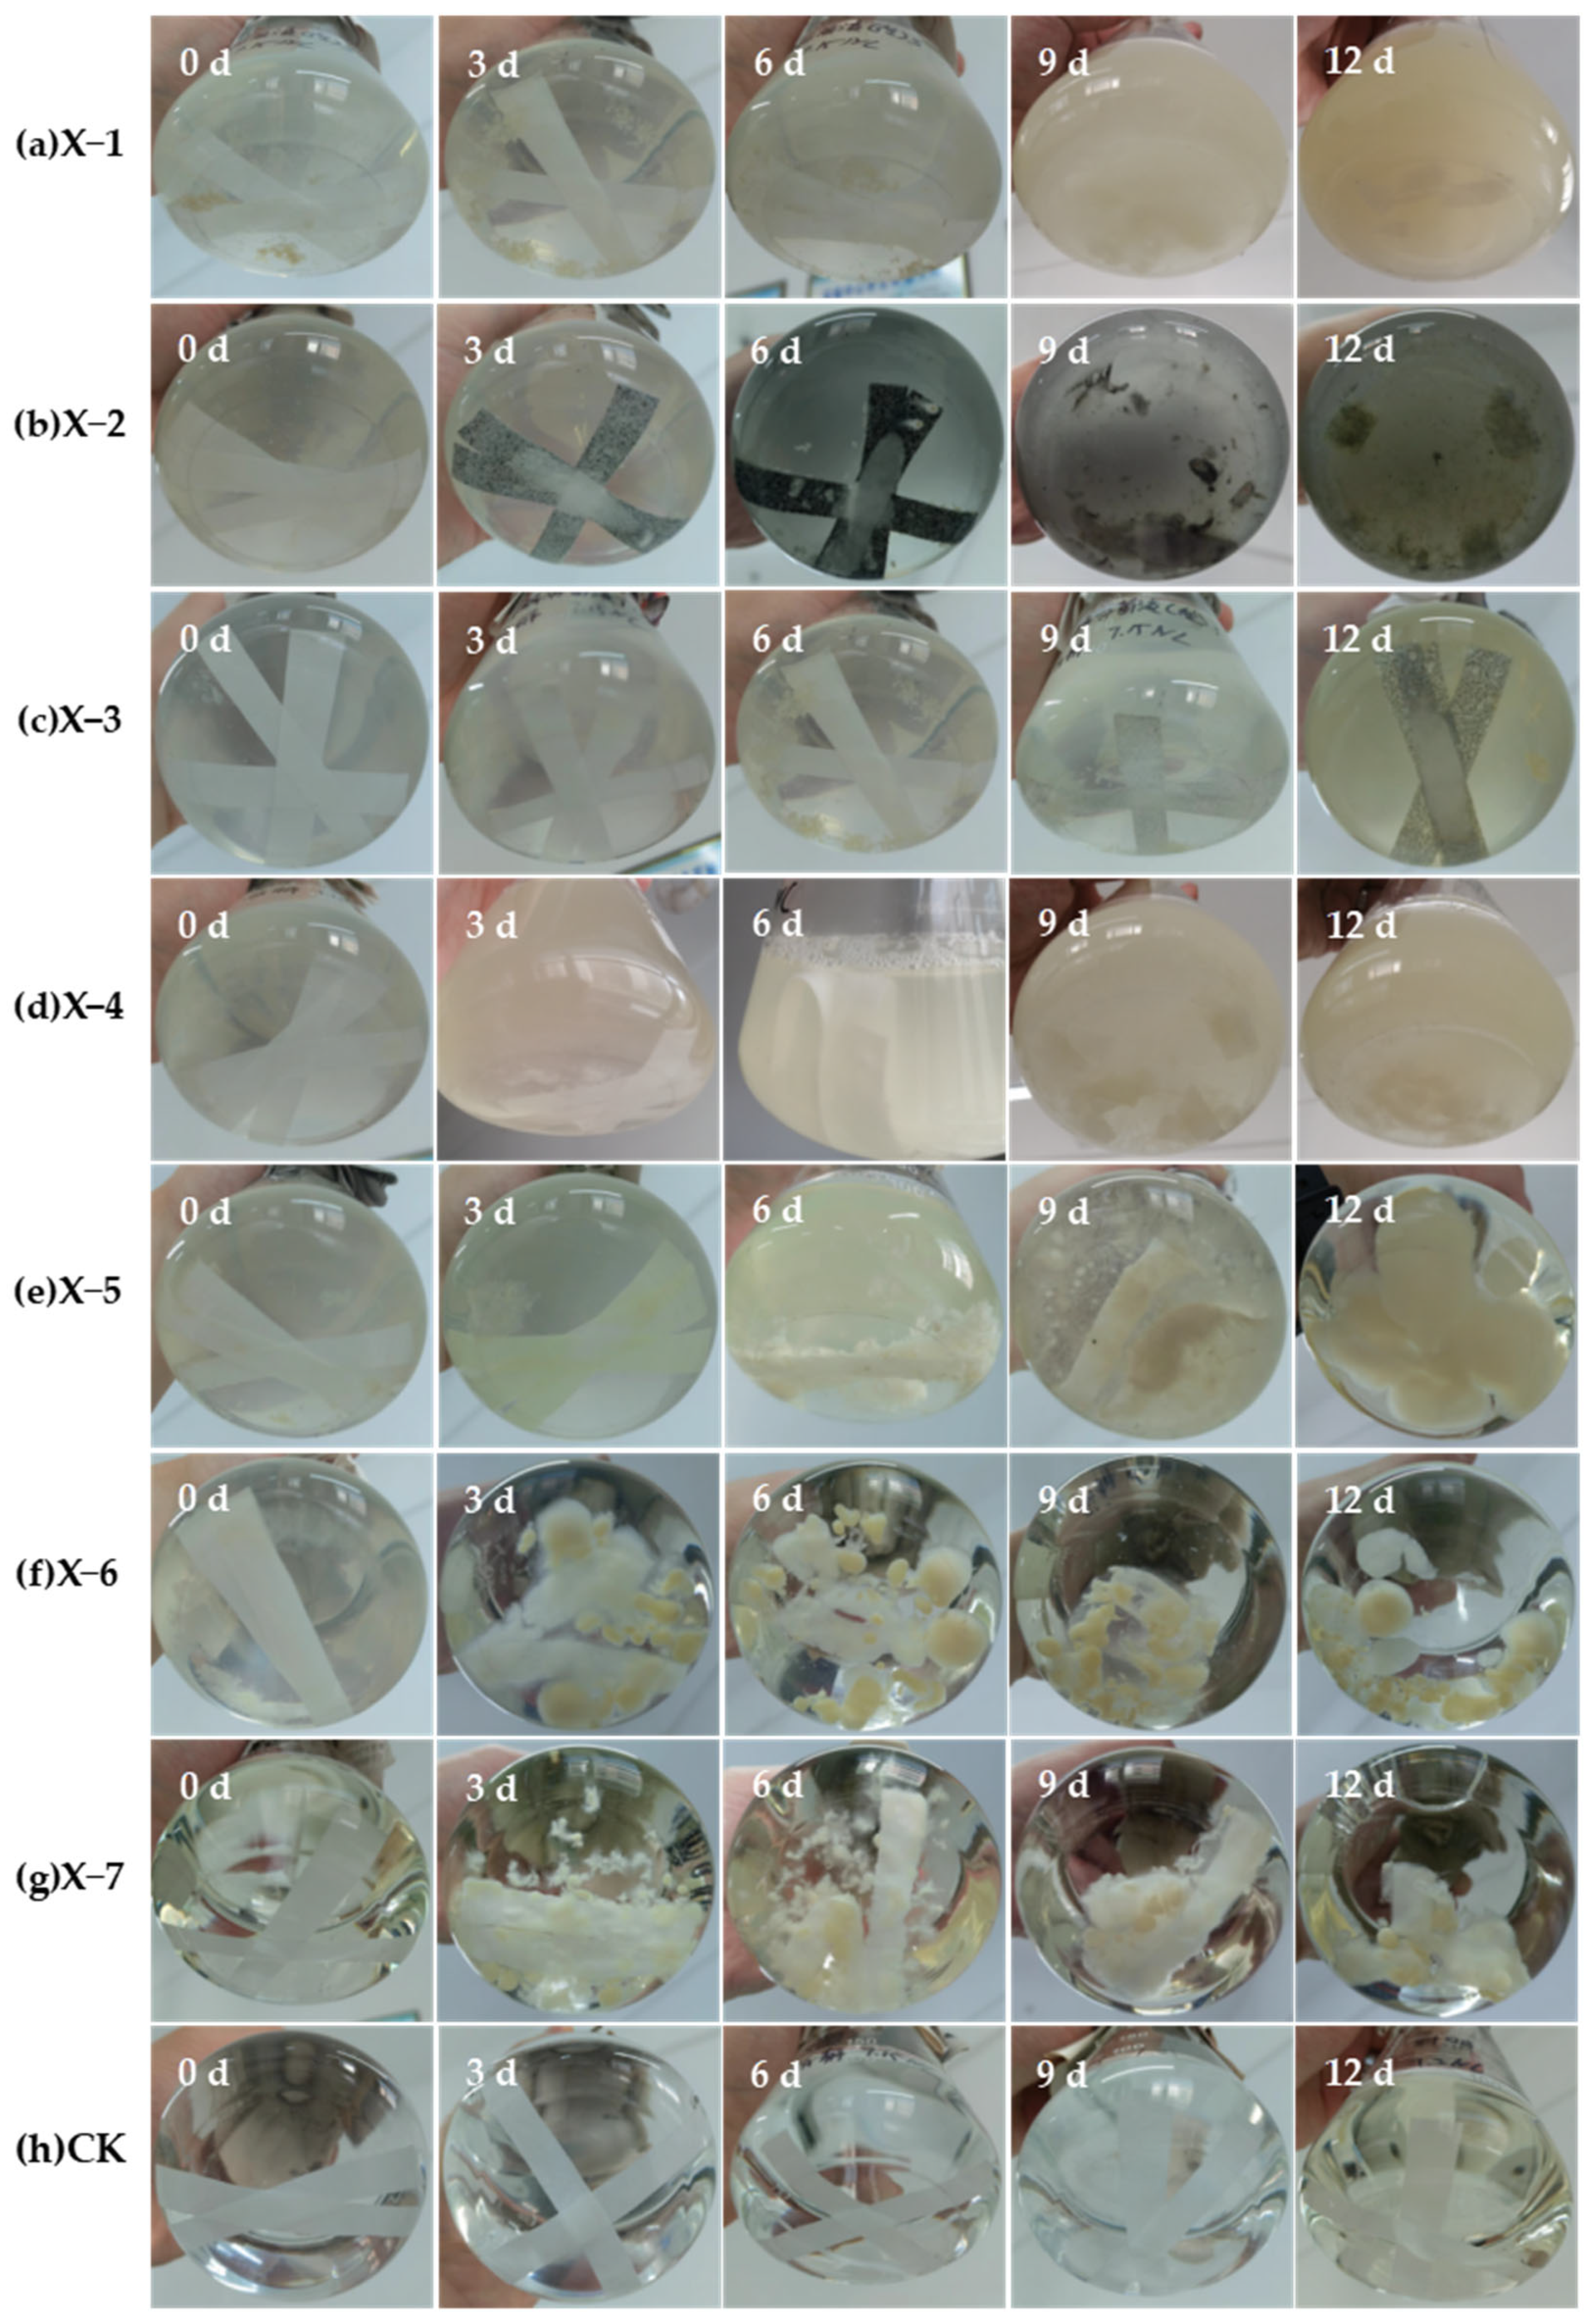
The disintegration of filter paper strips represents the bacterial strain’s ability to degrade cellulose [25]. Based on the results of the hydrolysis transparent circle, each single bacterium with cellulose degradation ability was inoculated separately into a 250 mL conical flask containing 200 mL of seed solution culture medium. Then, they were cultured for 48 h at 30 °C. When the bacterial growth was vigorous, we prepared a seed solution with a concentration of 1.0 × 10⁷ CFU/mL using sterile water. In a sterile operating environment, 30 mL seed solution was transferred to 150 mL inorganic salt medium to obtain a single bacterial reaction solution (20% inoculation volume of bacterial solution). Simultaneously, 30 mL sterile water was added to 150 mL inorganic salt medium as a control (CK). The filter paper strips (1 × 5 cm) were added to each reaction solution and CK (setting up 3 parallel samples for each reaction sample). The samples were incubated in a shaking incubator (120 r/min) for 12 days at 30 °C. The changes in filter paper strips were observed and recorded every 3 days.

2.5. Strain Identification

The DNA of all strain samples was extracted using a bacterial genomic DNA kit (Beijing Liuhe Huada Gene Technology Co., Ltd., Beijing, China). PCR amplification of bacterial strain genes was performed using the primers 27F (5′-AGAGTTGATCCTGGCTCAG-3′) and 1492R (5′-TACGGCACCTTGTTACGACTT-3′). The PCR reaction system (25 μL) included 21 μL PCR Mix (BGI 2 × Super), 1 μL primer 27F, 1 μL primer 1492R, and 2 μL DNA template. The PCR reaction conditions were as follows: 96 °C for 5 min, 35 cycles (96 °C for 20 s, 62 °C for 30 s, 72 °C for 30 s), 72 °C for 10 min, maintenance at 4 °C. The PCR product (3 μL) was detected by 1.0% agarose gel. The sequencing was completed with the assistance of Shenzhen BGI Genomics Co., Ltd., Shenzhen, China. The sequencing result was compared with NCBI-BLAST (https://www.ncbi.nlm.nih.gov/ (accessed on 11 November 2024)).

2.6. Construction of Composite Degradation Bacteria

2.6.1. Antagonistic Experiment

The antagonistic relationship test between bacterial strains is an effective way to test whether bacterial consortium strains can be constructed. In this experiment, the identified dominant bacterial strains were crossed and streaked on CMC-Na medium plates, and incubated upside down for 48 h at 30 °C to observe whether there were any interactions, antagonism, or growth inhibition between the strains during the growth process. Strains that are not antagonistic to each other can be used to construct a bacterial consortium.

2.6.2. Preparation of Bacterial Consortium Suspension

Each single bacterial suspension was prepared. They were mixed in equal proportions (volume ratio) and incubated in a shaking incubator (120 r/min) for 24 h at 30 °C. When the concentration of the mixed bacterial solution reached 1.0 × 10⁷ CFU/mL, the bacterial consortium seed solution was obtained. In the sterile operating environment, 30 mL of bacterial consortium seed solution was transferred to 150 mL of inorganic salt culture medium. The bacterial consortium reaction solution was prepared.

2.7. Determination of Cellulase Activity

Based on the samples prepared, each bacterial suspension (1.0 × 10⁷ CFU/mL) was inoculated into a liquid enzyme producing medium with a 5% inoculation amount. And then samples were trained by shaking for 48 h at 30 °C and 120 r/min. After the training, samples were centrifuged at 8000 r/min for 5 min, and the supernatant taken as the crude enzyme solution [26] used for the determination of cellulase activity. The glucose standard curve was drawn. The cellulase activity (CMCase, FPA, and β-Gase) were determined using the DNS method [27].
The determination method of CMCase was as follows: 1.0 mL CMC-Na standard solution (1.0%), 0.5 mL phosphate-buffered solution (0.1 mol/L), and 0.5 mL crude enzyme solution were added into the test tube. At the same time, the inactivated diluted crude enzyme solution was used as a control (CK). After thorough mixing, samples were placed in a 50 °C water bath for 30 min. Afterwards, 1.5 mL DNS reagent was immediately added to each test tube. The samples were placed in a boiling water bath for 5 min. After completion of the reaction, the samples were quickly cooled to room temperature and the OD540 measured. The reducing sugar content of the samples was determined based on the glucose standard curve, and the CMCase was calculated.
The determination method of FPA was as follows: the filter paper strip (1 cm × 2 cm) was used as the substrate, 1.5 mL phosphate-buffered solution and 0.5 mL crude enzyme solution were added, and reacted in a water bath at 50 °C for 60 min. The remaining operation was the same as that of CMCase.
The determination method of β-Gase was as follows: salicylic acid solution (1%) of 1.5 mL, 0.5 mL of phosphate-buffered solution, and 0.5 mL of crude enzyme solution were added into the test tube and reacted in a water bath at 50 °C for 30 min. The remaining operation was the same as that of CMCase.

2.8. Straw Degradation in Liquid Medium of Bacterial Consortium

The corn straws (2~3 cm) were dried to a constant weight, accurately weighed as a certain amount of straws (W1). They were added to the reaction solutions of single bacteria and bacterial consortium, using straws as the sole carbon source. The samples were cultured on a shaker at 30 °C and 120 r/min. At the same time, the accurately weighed straws were added to the sterile reaction solution as a control treatment (CK). A total of 5 treatments were set up, namely X−2, X−4, X−6, M−1, and CK. Each treatment was set up with 5 groups, with 3 parallel samples in each group. The changes in straw in the samples from each treatment were observed and recorded every 7 days. The straws were taken out from the reaction solution, cleaned, and impurities removed, and the straws were placed in an oven at 80 °C for drying. After drying to a constant weight, they were accurately weighed and recorded as the mass of straw degradation (W2). The weight loss rate of straw was calculated using Formula (1) [14] until 35 days, which was the straw degradation rate (Sdr).
Sdr (%) = (W1W2)/W1 × 100%
Sdr represents the degradation rate of straw (%), W1 represents the quality of straw before degradation (mg), and W2 represents the quality of straw after degradation (mg).

2.9. Straw Returning Degradation Experiment

According to the preparation method of the bacterial suspension mentioned above, suspensions of M−1 and single bacteria were prepared, respectively. About 500 g soil sample was spread evenly in the flowerpot, with a depth of about 5 cm. Then, about 10 g corn straw (2~3 cm) dried (at 80 °C) to constant weight was spread evenly on the soil surface. The mass of straw added to each pot (W1) was recorded accurately. Then, the bacterial suspensions (pH 7) were poured evenly onto the surface of the straw to ensure full contact with it. Next, the straws were covered with about 2 cm of soil layer to completely immerse them in the soil, achieving the purpose of simulating the degradation of the field. Finally, an appropriate amount of distilled water was sprayed on top of the covering soil to maintain a certain humidity of the soil (Figure 2). The temperature of reaction process was controlled at 25 °C.
In this experiment, a total of 5 treatments were set up, including 150 mL X−2 + 10 g straw, 150 mL X−4 + 10 g straw, 150 mL X−6 + 10 g straw, 150 mL M−1 + 10 g straw, and 150 mL sterile water + 10 g straw as CK. Each treatment was divided into 5 groups (for sampling at different times), with 3 parallel samples in each group. Every 7 days, 3 parallel samples were taken, and the straw was completely removed from the soil in the flowerpot. The straw changes were observed and recorded, and then washed with clean water to remove surface soil and impurities. The samples were dried at 80 °C to constant weight and accurately weighed (W2) until 35 days. According to Formula (1), the straw degradation rates were calculated on the 7th, 14th, 21st, 28th and 35th days, and the average of three parallel samples was taken as the final result.

2.10. Optimization Experiment of Single Factor Conditions for Straw Degradation

2.10.1. The Effect of Amount of Bacterial Suspension on Straw Degradation Rate

Different bacterial suspensions (pH 7) with inoculation volumes (volume ratios) of 10%, 15%, 20%, 25%, and 30% were set up as 5 treatments, and each treatment contained 3 parallel samples. At the same time, 10 g of straw dried to constant weight was added to each treatment, separately. The temperature of reaction process was controlled at 25 °C. After 35 days, all straw was taken out from the soil immediately and the degradation rate of the straw was determined.

2.10.2. The Effect of Straw Dosage on Straw Degradation Rate

The different dosages of 6 g, 8 g, 10 g, 12 g, and 14 g of straw were set up as 5 treatments, and each treatment has contained 3 parallel samples. At the same time, the determined optimal inoculation amount of bacterial suspension (pH 7) was added, separately. The temperature of the reaction process was controlled at 25 °C. After 35 days of reaction, all straw was taken out from the soil immediately and the degradation rate of the straw was determined.

2.10.3. The Influence of Initial pH on Straw Degradation Rate

The different initial pH values for the culture media of 5.0, 6.0, 7.0, 8.0, and 9.0 were set up as 5 treatments, and each treatment contained 3 parallel samples. At the same time, the determined optimal straw dosage and optimal bacterial suspension were added separately. The temperature of reaction process was controlled at 25 °C. After 35 days of reaction, all straw was taken out from the soil immediately and the degradation rate of the straw was determined.

2.10.4. The Effect of Reaction Temperature on Straw Degradation Rate

The different reaction temperatures of 20 °C, 25 °C, 30 °C, 35 °C, and 40 °C were set up as 5 treatments, and each treatment contained 3 parallel samples. At the same time, the determined optimal straw dosage and optimal bacterial suspension were added separately, with the optimal initial pH conditions. After 35 days of reaction, all straw was taken out from the soil immediately and the degradation rate of the straw was determined.

2.11. Optimization of Response Surface Conditions

Based on the results of a single factor experiment, the Box–Behnken center combination design based on response surface methodology was adopted. The straw degradation rate (Sdr) was used as the response variable, and a four-factor three-level response surface experiment was conducted to analyze the effects of the bacterial suspension amount (A), straw dosage (B), pH (C), and reaction temperature (D) on the straw degradation rate (Sdr), as shown in Table 3.

2.12. Data Analysis

Microsoft Office Excel (Version 2019) was used to sort out the data. SPSS (Version 20) was used to perform Pearson correlation calculation and analysis. Graphs were generated using Origin (Version 2022). Design-Expert (Version 13) was used for response surface analysis. Mega (Version 12) was used to perform phylogenetic tree analysis.

3. Results and Discussion

3.1. Results and Analysis of Hydrolysis Transparent Circle Experiment

Through enrichment, cultivation, and purification separation, eight strains of single bacteria were finally obtained, named X−1, X−2, X−3, X−4, X−5, X−6, X−7, and X−8, respectively. The results of hydrolysis transparent circle determination showed that each purified and isolated single strain produced hydrolysis circles, as shown in Figure 3. The D/d value produced the following result: X−2 > X−6 > X−4 > X−1 > X−7 > X−3 > X−5 > X−8, as shown in Table 4. D/d represents the ability of microorganisms to degrade cellulose. When D/d > 2, it is considered that the strain has a high cellulose degradation ability [28]. Therefore, the X−8 strain was not further studied. This is consistent with the finding of Wang et al. [29]; they obtained five strains with cellulase production ability, with D/d ranging from 1.03 to 4.69.

3.2. Results and Analysis of Filter Paper Strip Disintegration Experiment

From Table 5 and Figure 4, it can be seen that there was almost no change in the filter paper strips of CK and X−3 on the 12th day, while the filter paper strip of X−4 was completely decomposed, and the decomposition effect was significant. The filter paper strips of X−1, X−2, X−6, and X−7 had basically decomposed, while the filter paper strip of X−5 was amorphous and showed obvious gathering. Nevertheless, their final decomposition phenomenon had significant differences.
The filter paper strip of X−4 showed significant bending and expansion on the 6th day. On the 9th day, it was basically decomposed with a little fragment residue. On the 12th day, it was completely decomposed and the residue was basically consumed. Changes in the filter paper strips of X−1 and X−2 were quite similar, with almost complete decomposition on the 9th day and only a little swollen fragment residue on the 12th day. However, interestingly, the filter paper strip of X−2 produced black spots from the third day and gradually increased, which may be the result of carbonization. The changes of X−6 and X−7 were very similar. On the third day, a large amount of flocculent and spherical substances were formed around the filter paper strip, and obvious fractures occurred. This phenomenon gradually continued until the 12th day, when the filter paper strip was basically decomposed and spherical aggregates were formed, with X−6 being more significant. It is interesting that the separated products of X−5, X−6, and X−7 all produced spherical structures on the 12th day, and the phenomenon of X−6 and X−7 appeared earlier. It related to the development of filamentous fungi in liquid media. The samples were probably contaminated with some fungus, However, from the disintegration process of the filter paper strip, the results of X−6 and X−7 were significant, while X−5 was not significant. Therefore, the strains X−1, X−2, X−4, X−6, and X−7 have strong cellulose degradation ability, while the strains X−3 and X−5 have weaker abilities and have not been further studied. This is basically consistent with the research results of Guo et al. [30], where strains QZ28, QZ29, and QZ43 disintegrated filter paper strips into small discs and flocs with good disintegration effects; strain QZ67 disintegrated the filter paper strip into a paste, with the most thorough disintegration and the best disintegration effect, indicating that strain QZ67 has a strong cellulose degradation ability.

3.3. Results of Strain Identification

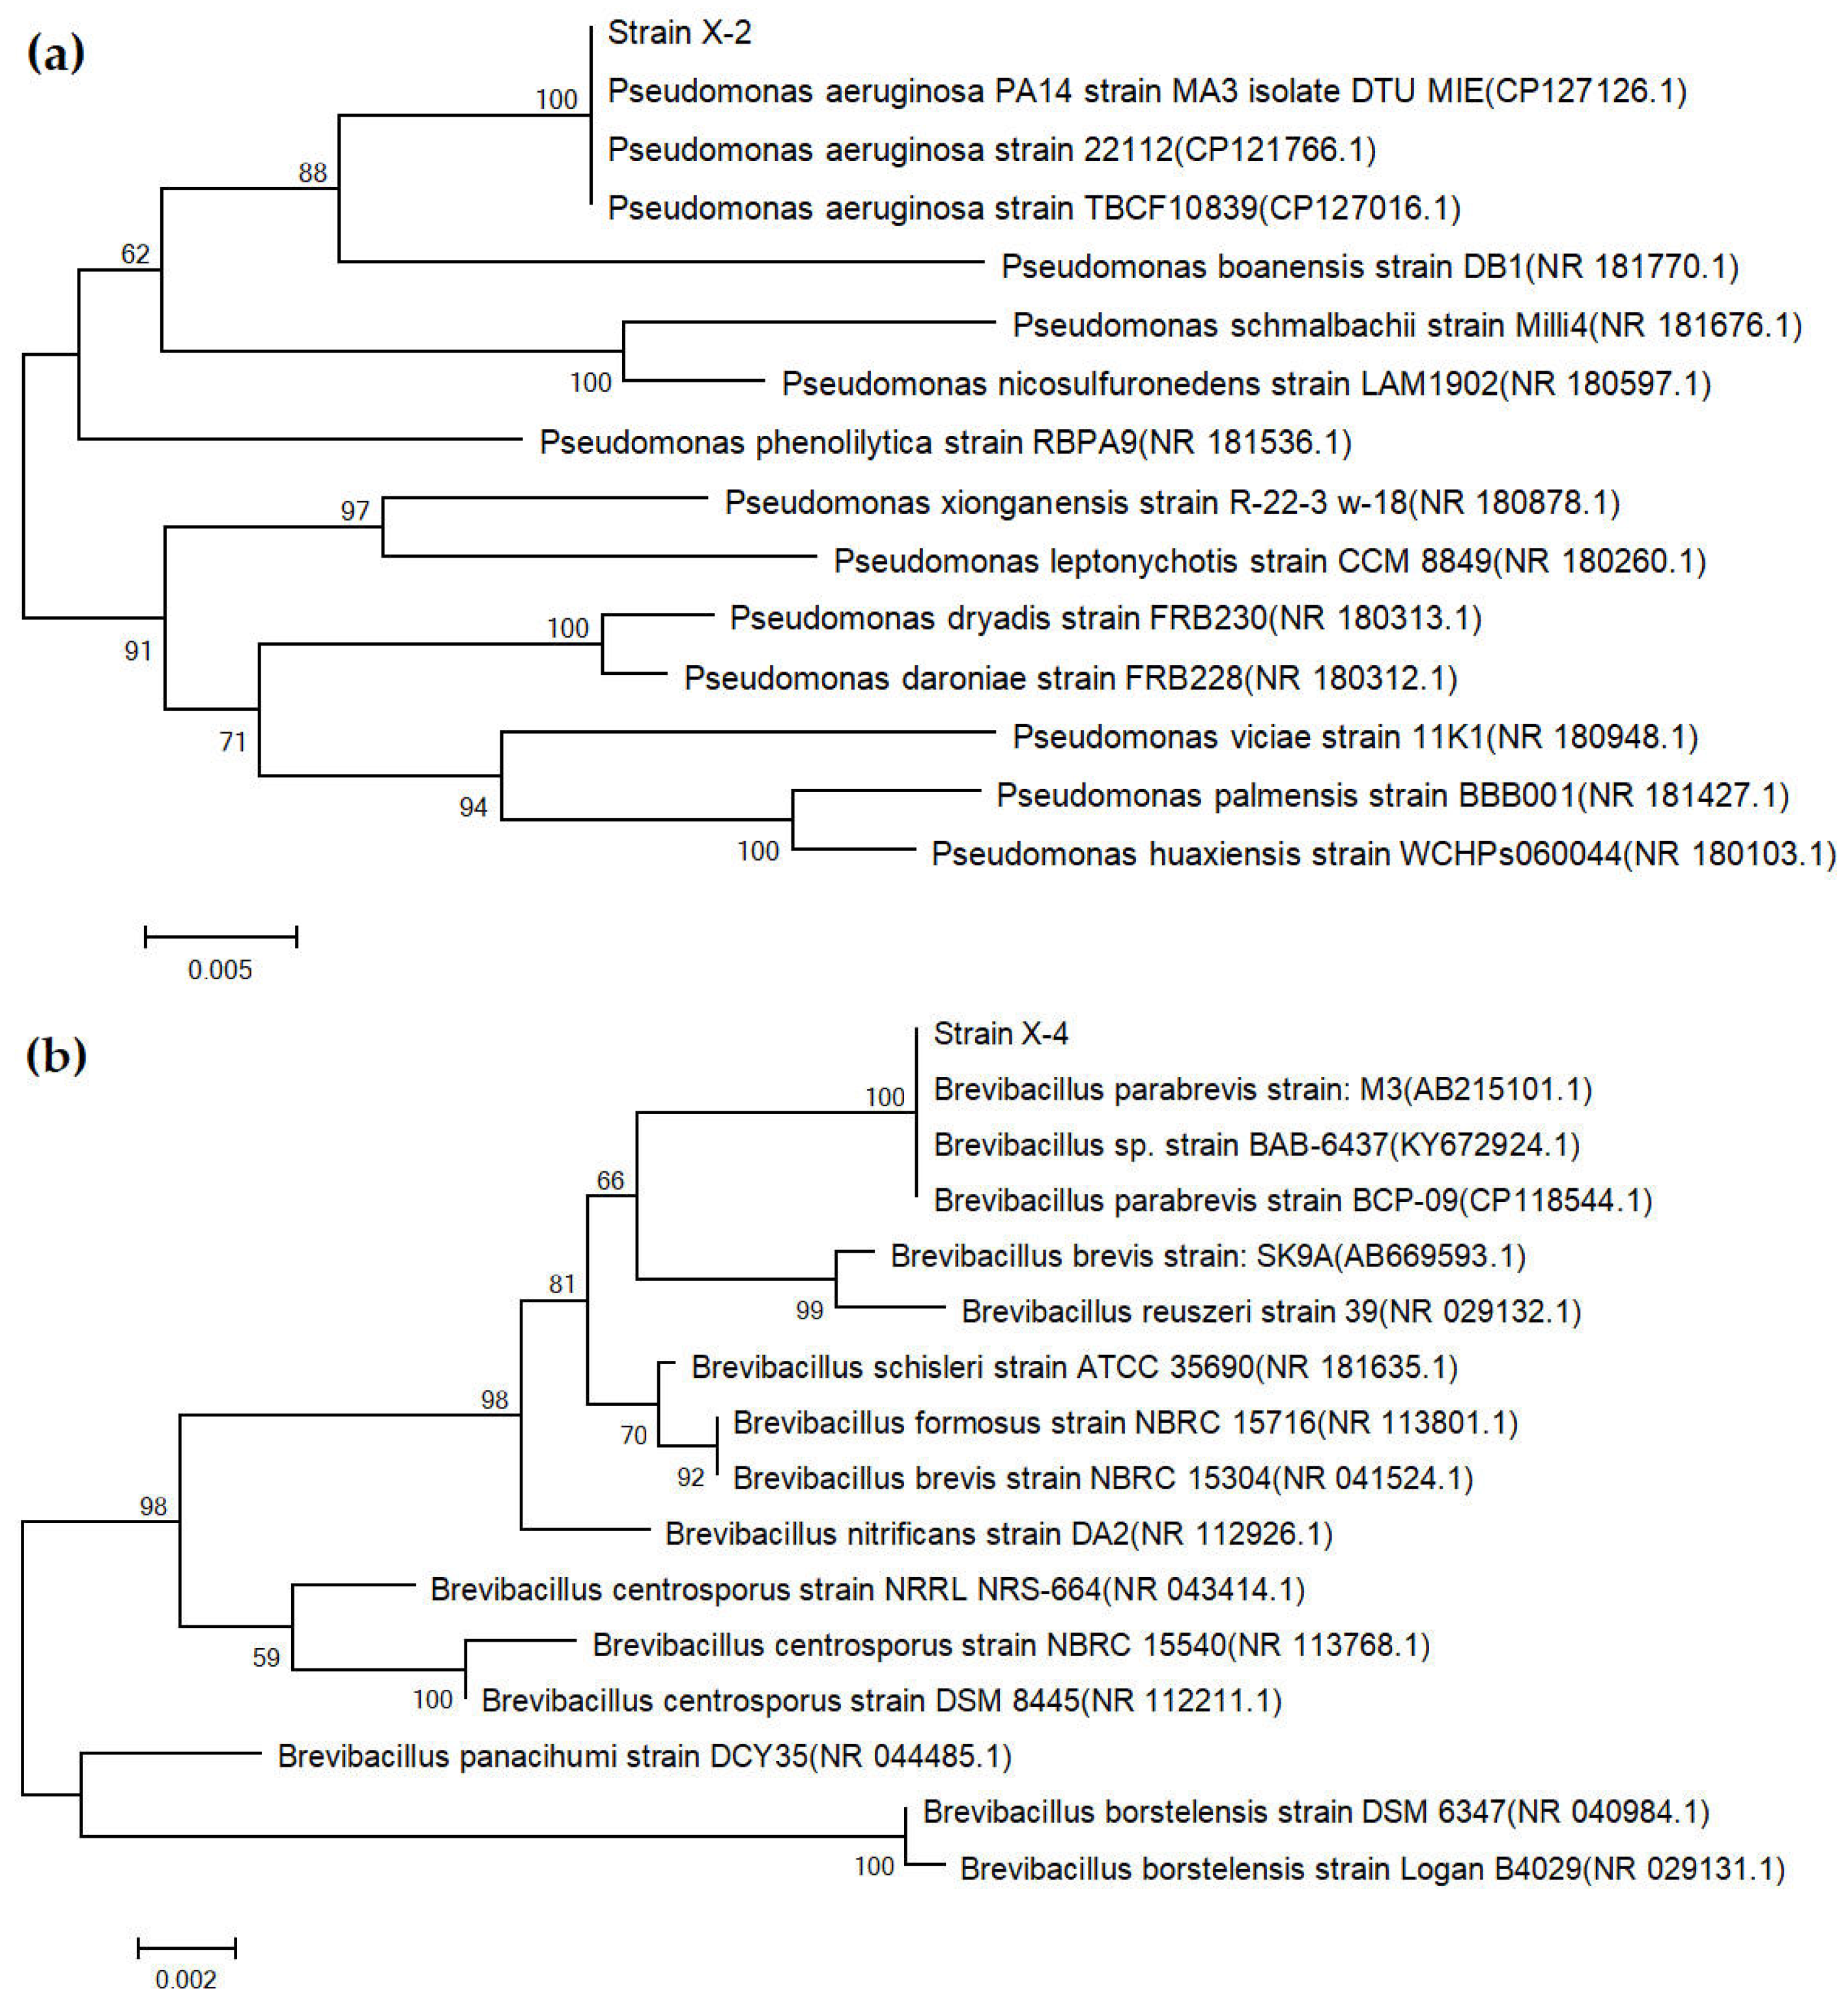
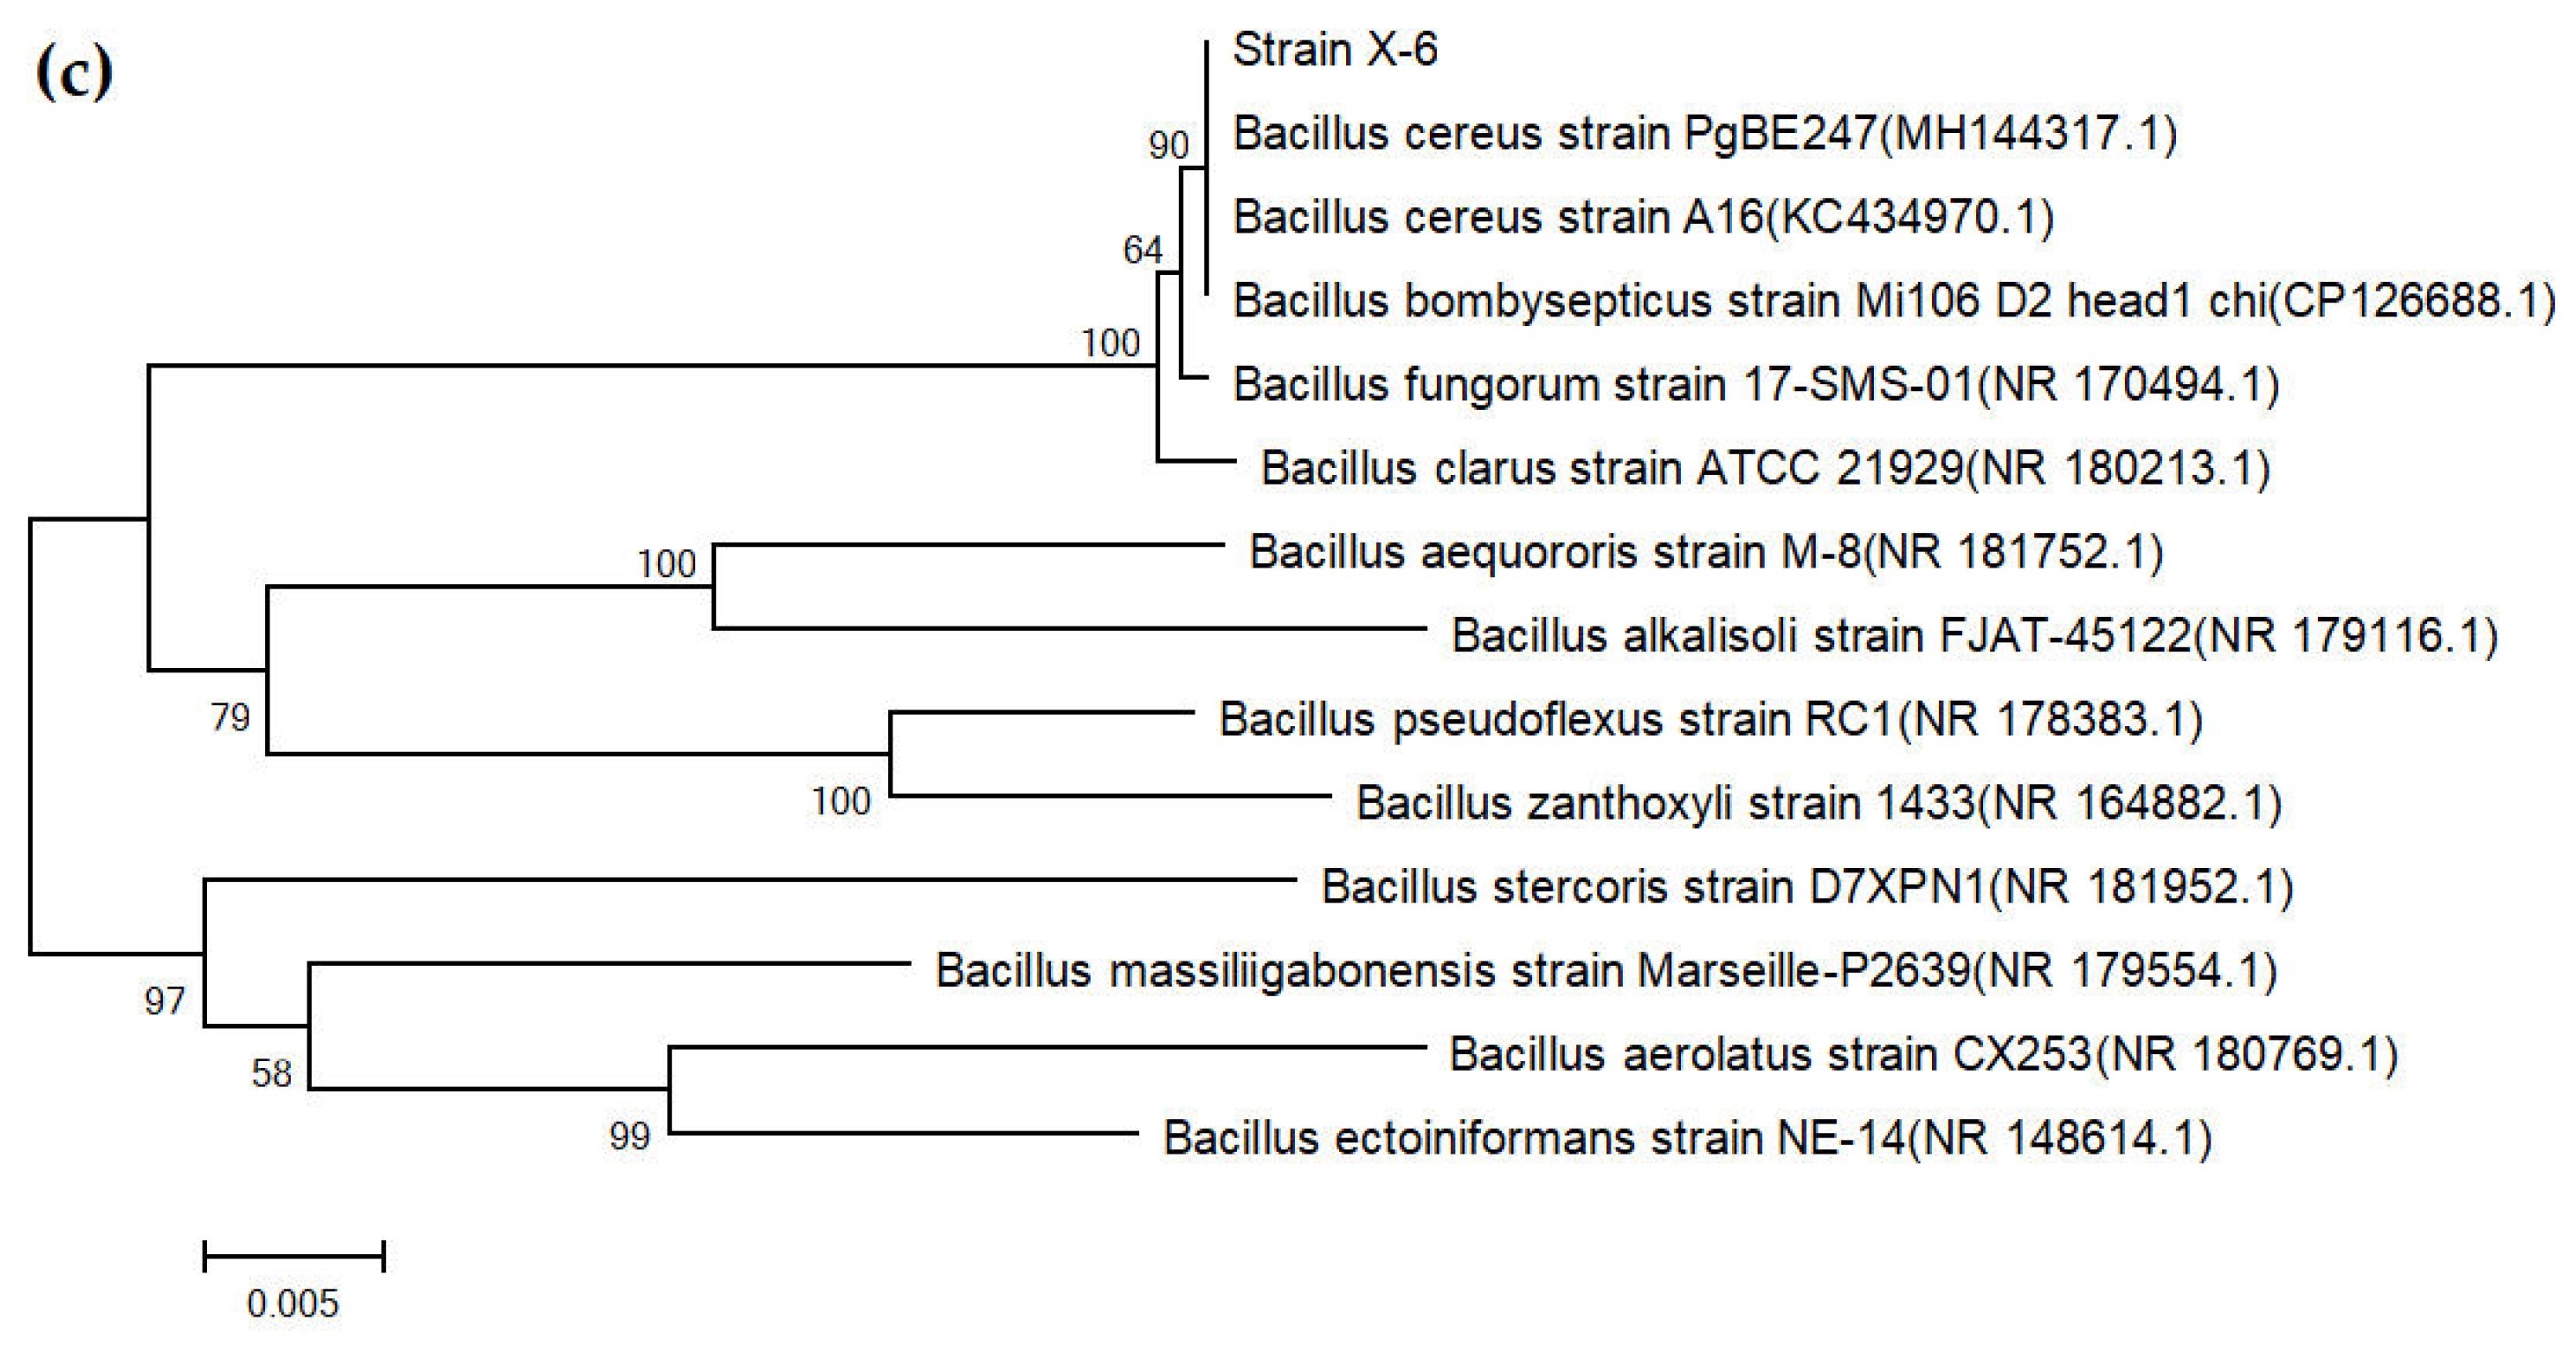
The sequencing results of 16S rRNA were compared and analyzed with the NCBI database (https://www.ncbi.nlm.nih.gov/ (accessed on 11 November 2024)). Strains X−1 and X−2 are both Pseudomonas aeruginosa PA14 (CP127126.1); strains X−4 and X−7 are both Brevibacillus parabrevis M3 (AB215101.1); and strain X−6 is Bacillus cereus PgBE247 (MH144317.1). Further utilized Mega (Version 12) software to construct phylogenetic trees of strains X−2, X−4, and X−6 (Figure 5).

3.4. Results and Analysis of Antagonistic Experiment

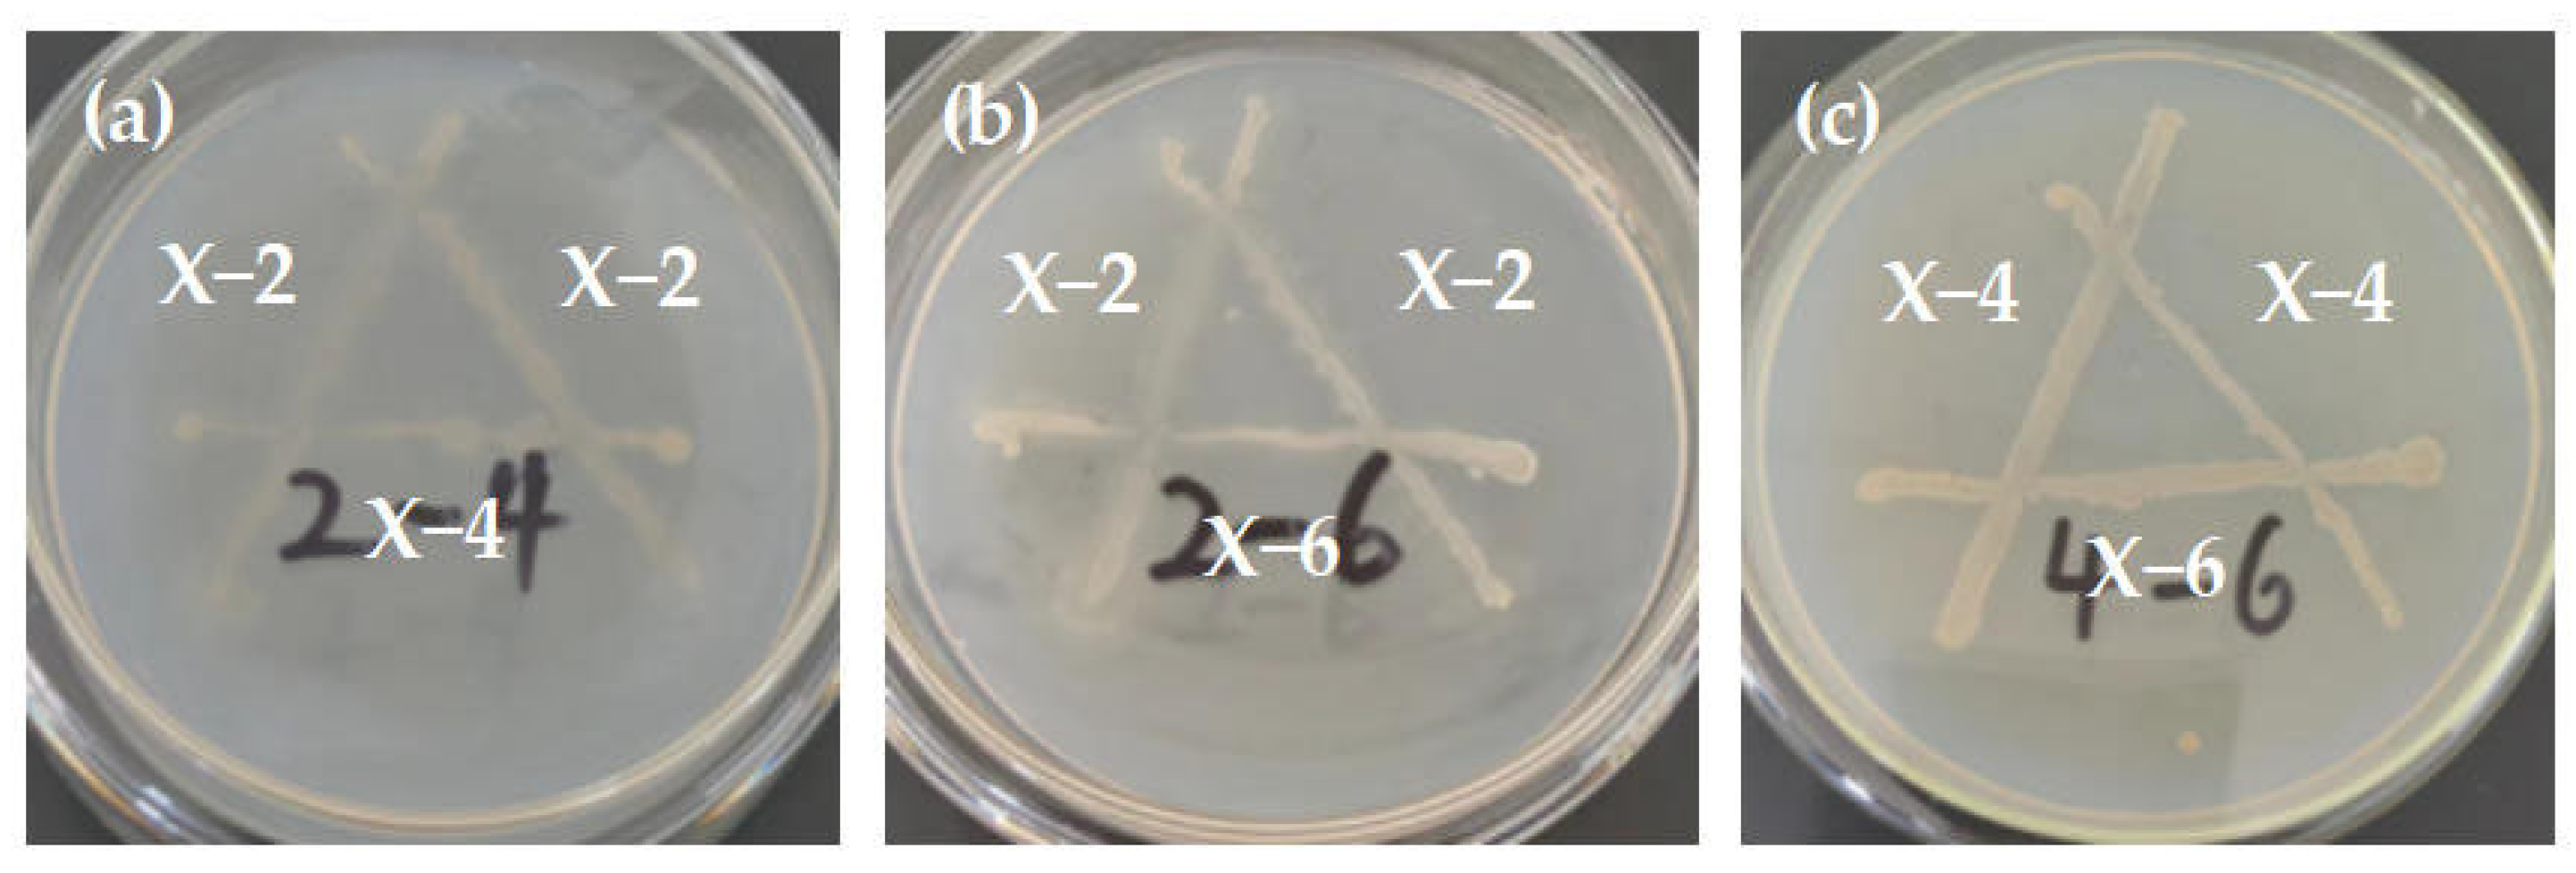
Based on the initial screening, re-screening, and strain identification results of high-efficiency straw degrading bacteria, three strains X−2, X−4, and X−6 were ultimately determined as the dominant bacteria for corn straw degradation. They were crossed and streaked on carboxymethyl cellulose medium plates, and incubated upside down for 48 h at 30 °C. The results were shown in Figure 6. Both strains grew well in each group of experiments, without forming a sterile zone, indicating that there was no antagonistic effect during the growth process of the two bacteria. This suggested that three strains can be compounded to form a high-efficiency straw degradation bacterial consortium (M−1). This is consistent with the research methods of Li et al. [31] and Han et al. [32], which utilized antagonistic experiments to construct a microbial consortium for efficient degradation of corn straw.

3.5. Results and Analysis of Cellulase Activity Determination

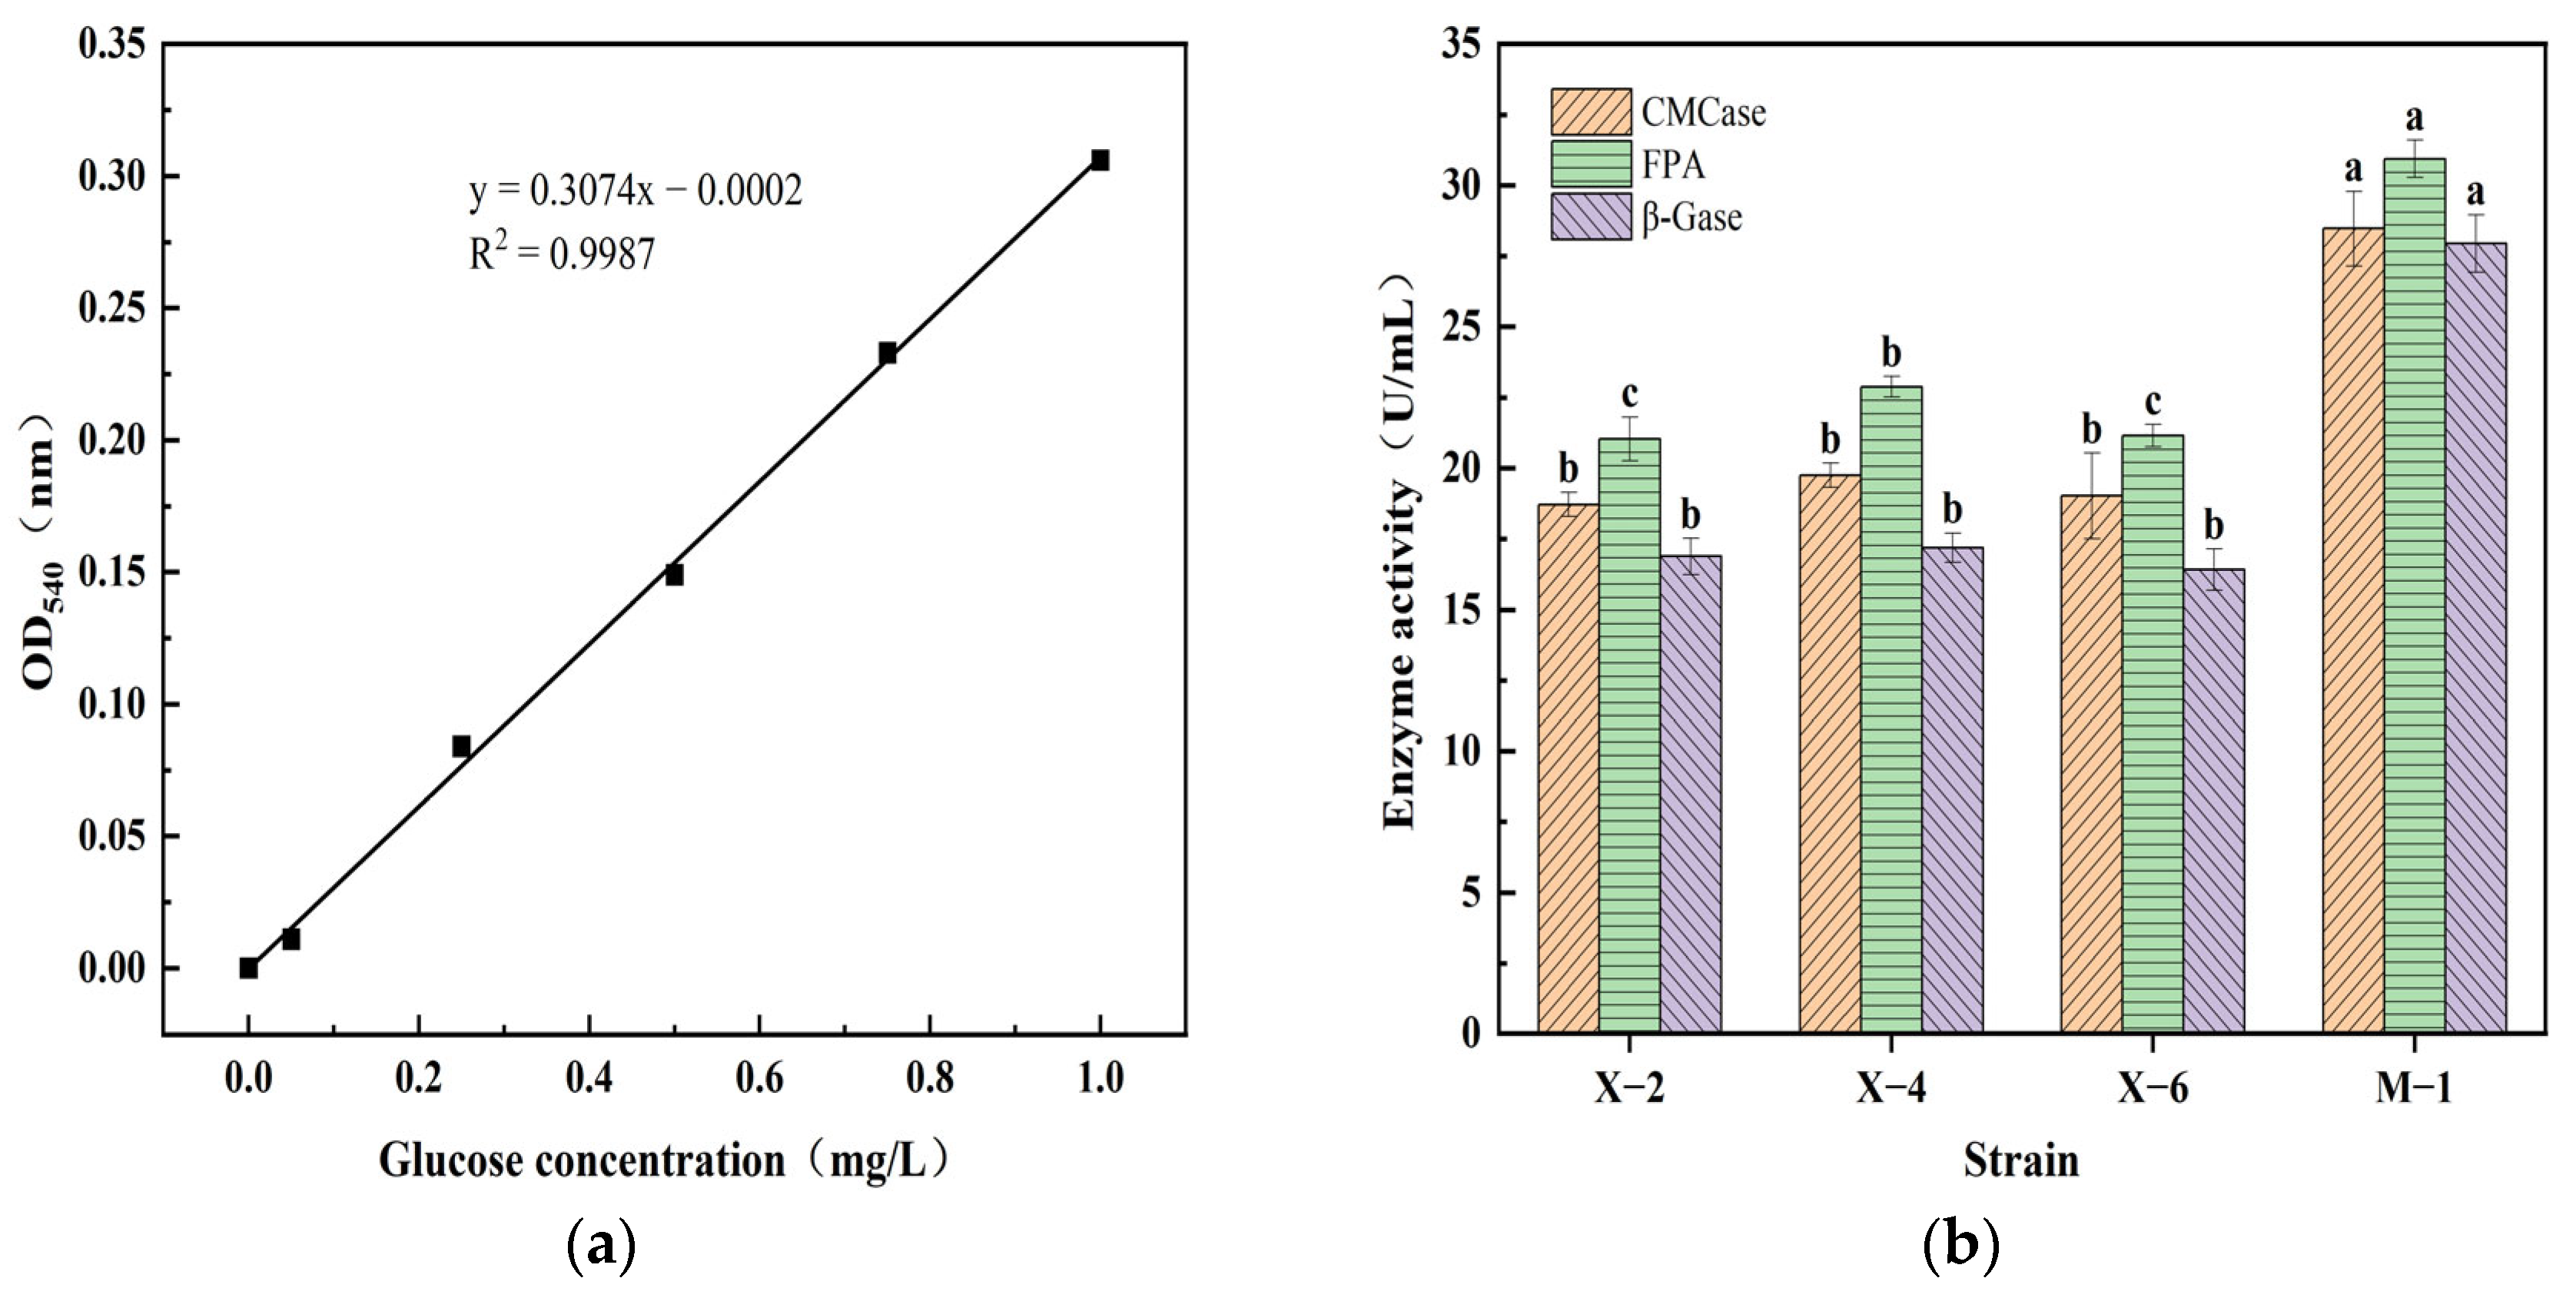
The glucose standard curve is shown in the Figure 7a. The linear fitting is good and can be used to calculate the cellulase activity. The cellulase activity (CMCase, FPA, and β-Gase) of X−2, X−4, X−6, and M−1 was measured, and the results are shown in Figure 7. The three cellulase activities of M−1 were 28.46 U/mL, 30.93 U/mL, and 27.94 U/mL, respectively. The CMCase of M−1 increased by 9.74 U/mL, 8.72 U/mL, and 9.44 U/mL compared to X−2, X−4, and X−6. The FPase of M-1 increased by 9.9 U/mL, 8.06 U/mL, and 9.79 U/mL compared to X−2, X−4, and X−6. The β-Gase of M-1 increased by 11.06 U/mL, 10.75 U/mL, and 11.53 U/mL compared to X−2, X−4, and X−6. The cellulase activity of the bacterial consortium was significantly higher than that of single bacteria. This is consistent with the research results of Liu [33]; the cellulase activity of the bacterial consortium Y−M was much higher than that of each individual strain, with the highest CMCase, FPA, and β-Gase of 37.71 U/mL, 37.12 U/mL, and 38.93 U/mL, respectively.

3.6. Results and Analysis of Straw Degradation in Liquid Medium

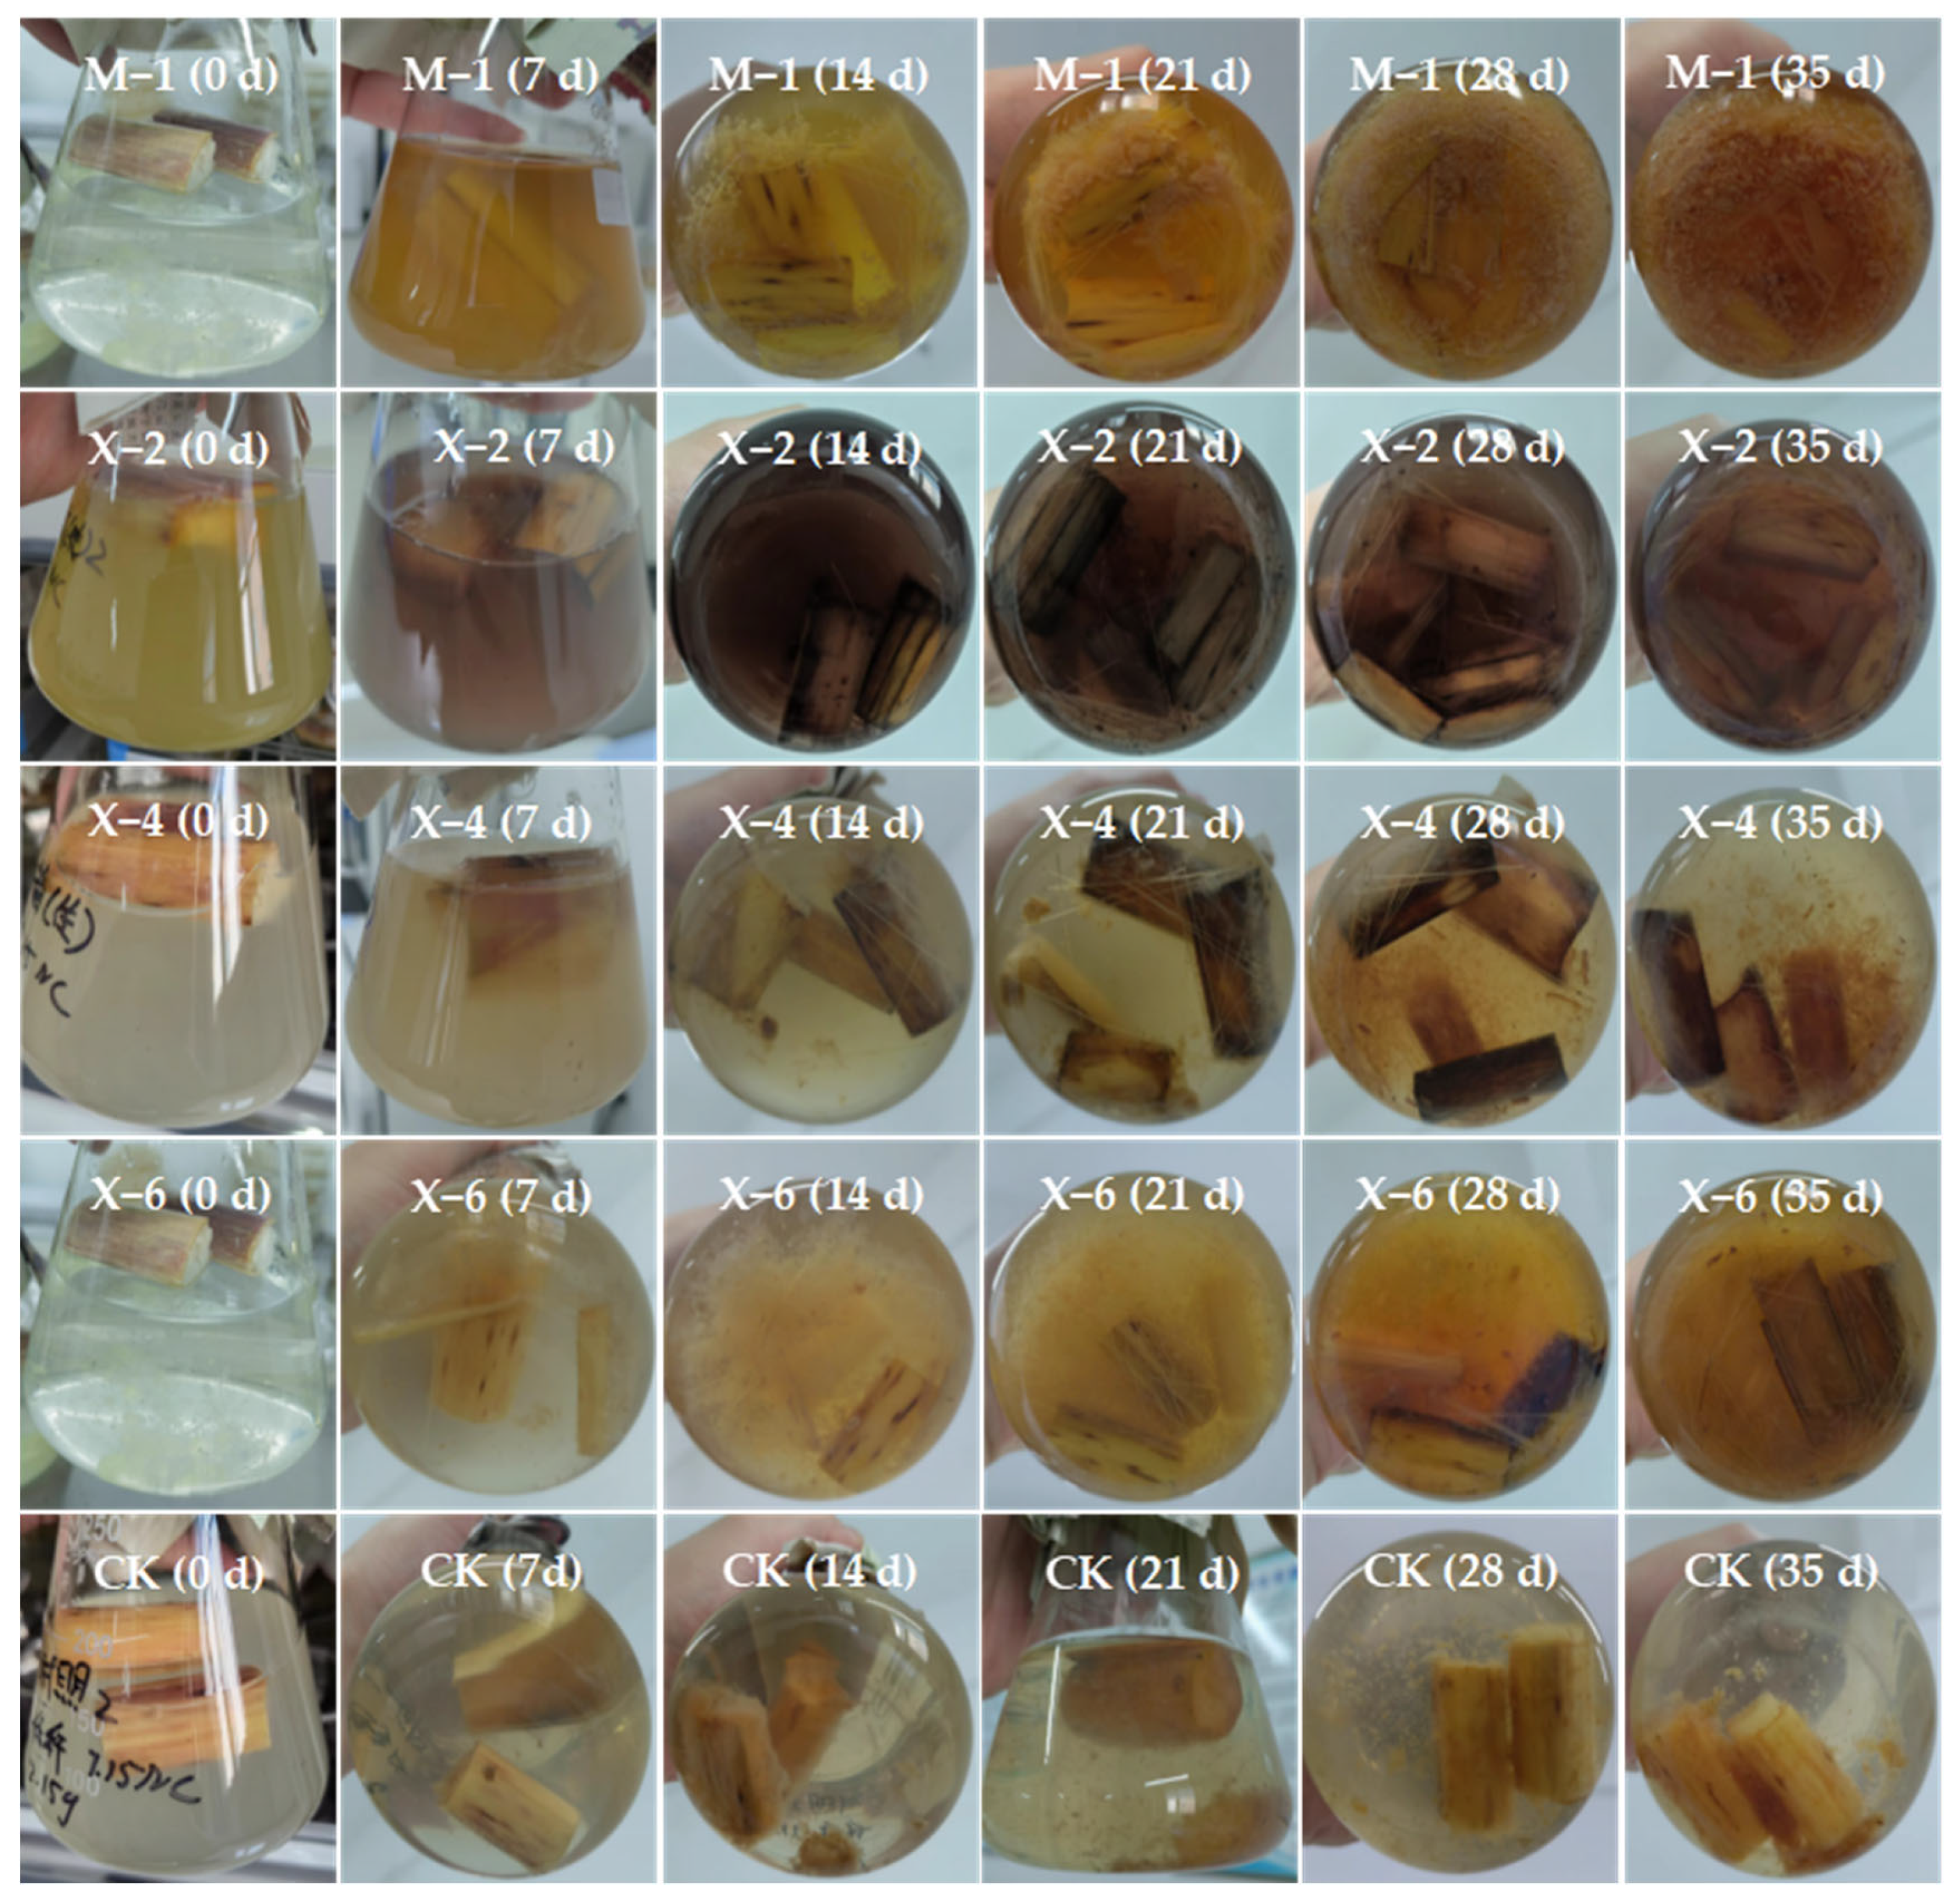
The degradation process of straw by the single bacteria and bacterial consortium was observed from 0 to 35 days, as shown in Figure 8. M-1 showed a more significant degradation effect on straw compared to the control group (CK) and single bacteria (X−2, X−4, and X−6), and the process of straw degradation was more obvious. M−1 produced a significant degradation effect on straw in the early stage of degradation (7~14 days), with the straw shell and inner flesh separating, the shell breaking and falling off, and the inner flesh being decomposed into a large number of fiber filaments and fiber debris. In the mid stage of degradation (21 days), the straw shell formed small fragments and the pulp continuously decomposed into a large number of fiber filaments and fiber debris, with a significant decrease in volume. In the later stage of degradation (28~35 days), the outer shell and inner pulp of straw were completely decomposed, forming a large amount of fiber debris residue, which tends to be gradually consumed.
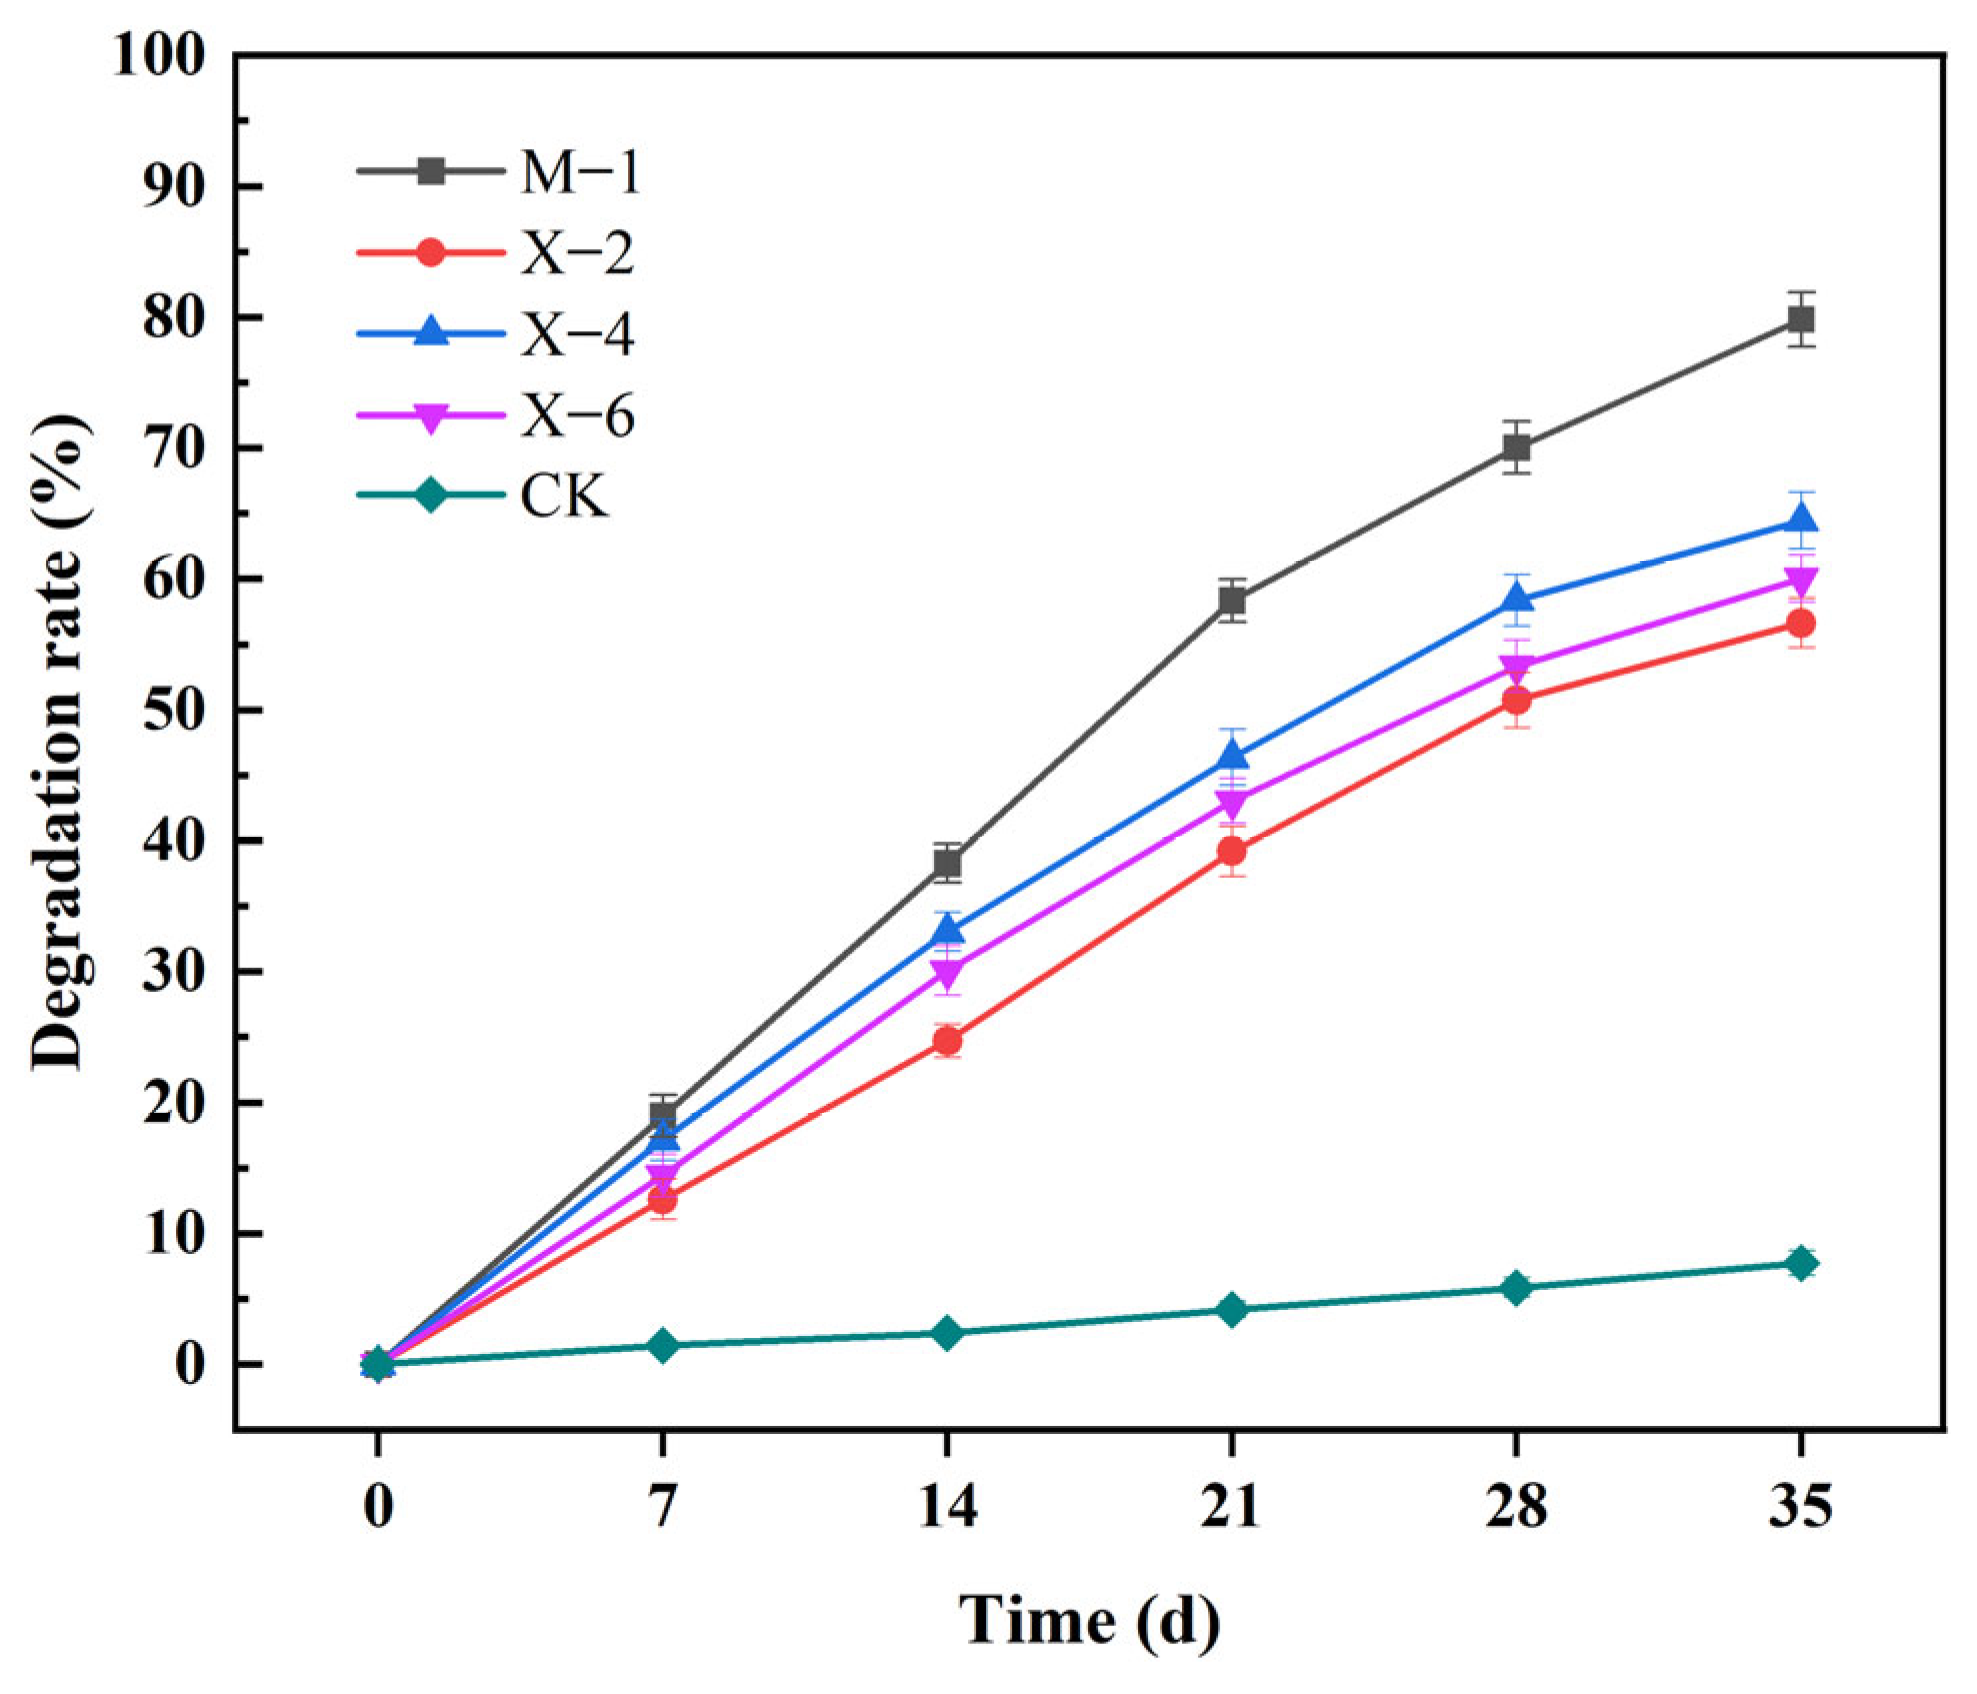
The degradation rate of straw was determined using the weightlessness method, and the results are shown in Figure 9. The degradation rate of straw by M−1 was higher than that of the single bacteria X−2, X−4, and X−6 and CK at all stages. Its degradation rate showed a trend of sudden increase followed by slowing down. On the 35th day, the degradation rate of straw by M−1 reached 79.81%, significantly increased by 72.06% (p < 0.05) compared to the blank control (CK), and increased by 23.18%, 15.36%, and 19.78% (p < 0.05) compared to the dominant bacteria X−2, X−4, and X−6, respectively. The reason for the higher straw degradation rate of M−1 compared to single bacteria may be due to the synergistic effect between each single bacteria, which promotes efficient straw degradation [34]. This is consistent with the results of its enzyme activity changes; that is, the cellulase activity produced by M−1 was the highest (Figure 7). This is basically consistent with the existing research results. Chen [35] constructed the bacterial consortium S8 with seven strains, with an enzyme activity of 25.58 U/mL. After 20 days of reaction, the degradation rate of corn straw by liquid fermentation was 58.2%, which was 38.5% higher than that of CK. The enzyme activity and straw degradation rate were significantly higher than those of each single strain.

3.7. Results and Analysis of Simulated Straw Returning Degradation

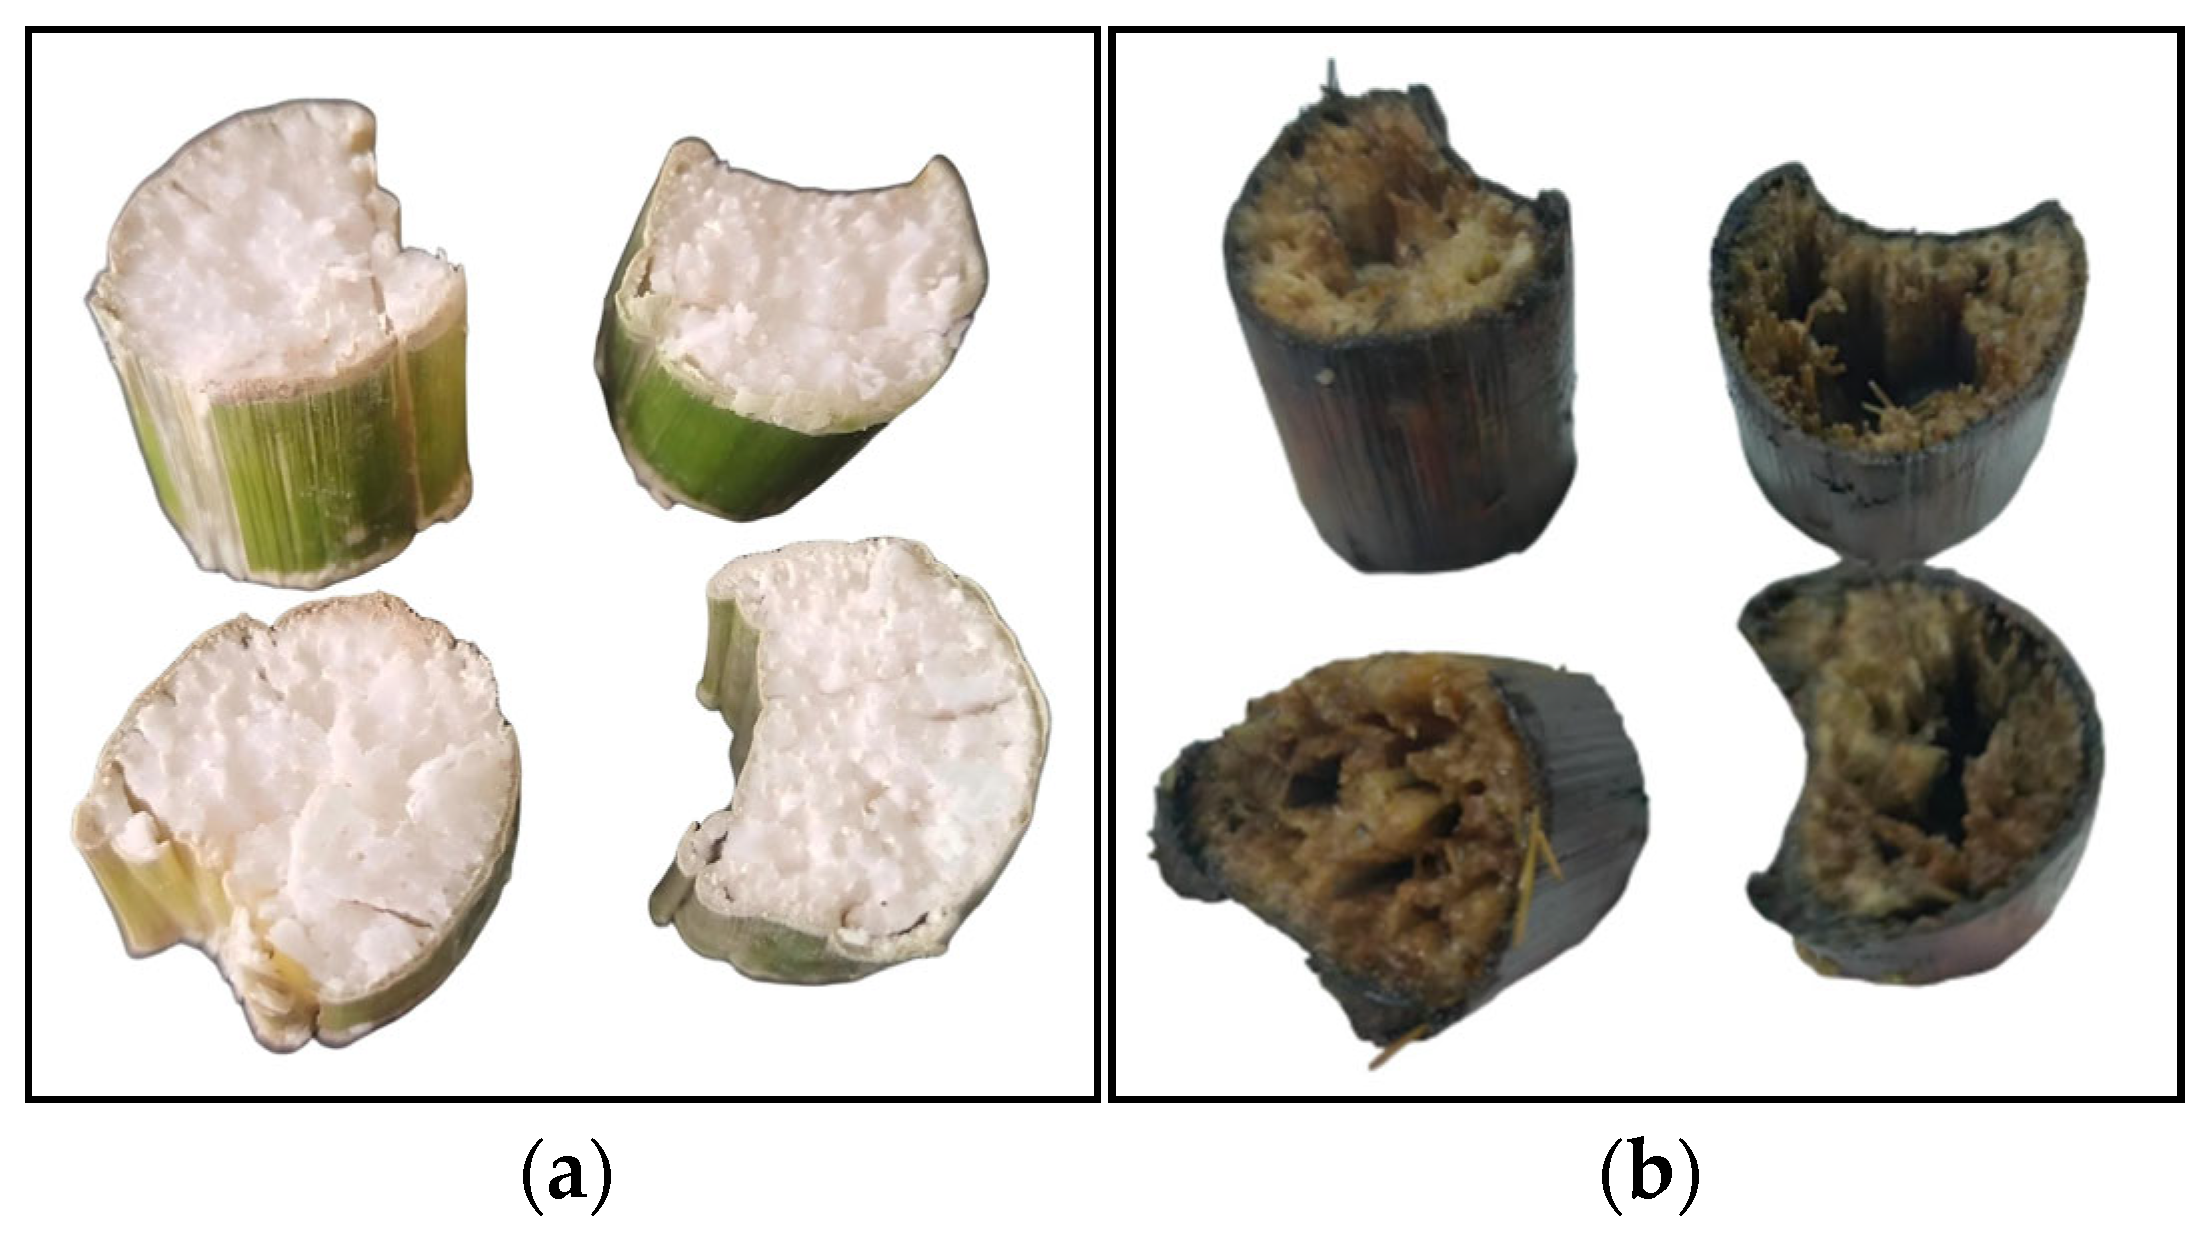
After 35 days of simulated straw returning and degradation experiments, the color of the straw shell with bacteria changed from yellow-green in the early stage to black brown, and its hardness became soft and easily shattered by external forces. The pulp inside the straw showed obvious depressions, going through varying degrees of decomposition. Some of the straw is almost completely decomposed internally, and the color deepens, changing from milky white to brown, as shown in Figure 10. Among them, the composite bacterium M−1 has a more significant effect on straw degradation. At the same time, the straw treated with CK showed no significant changes.
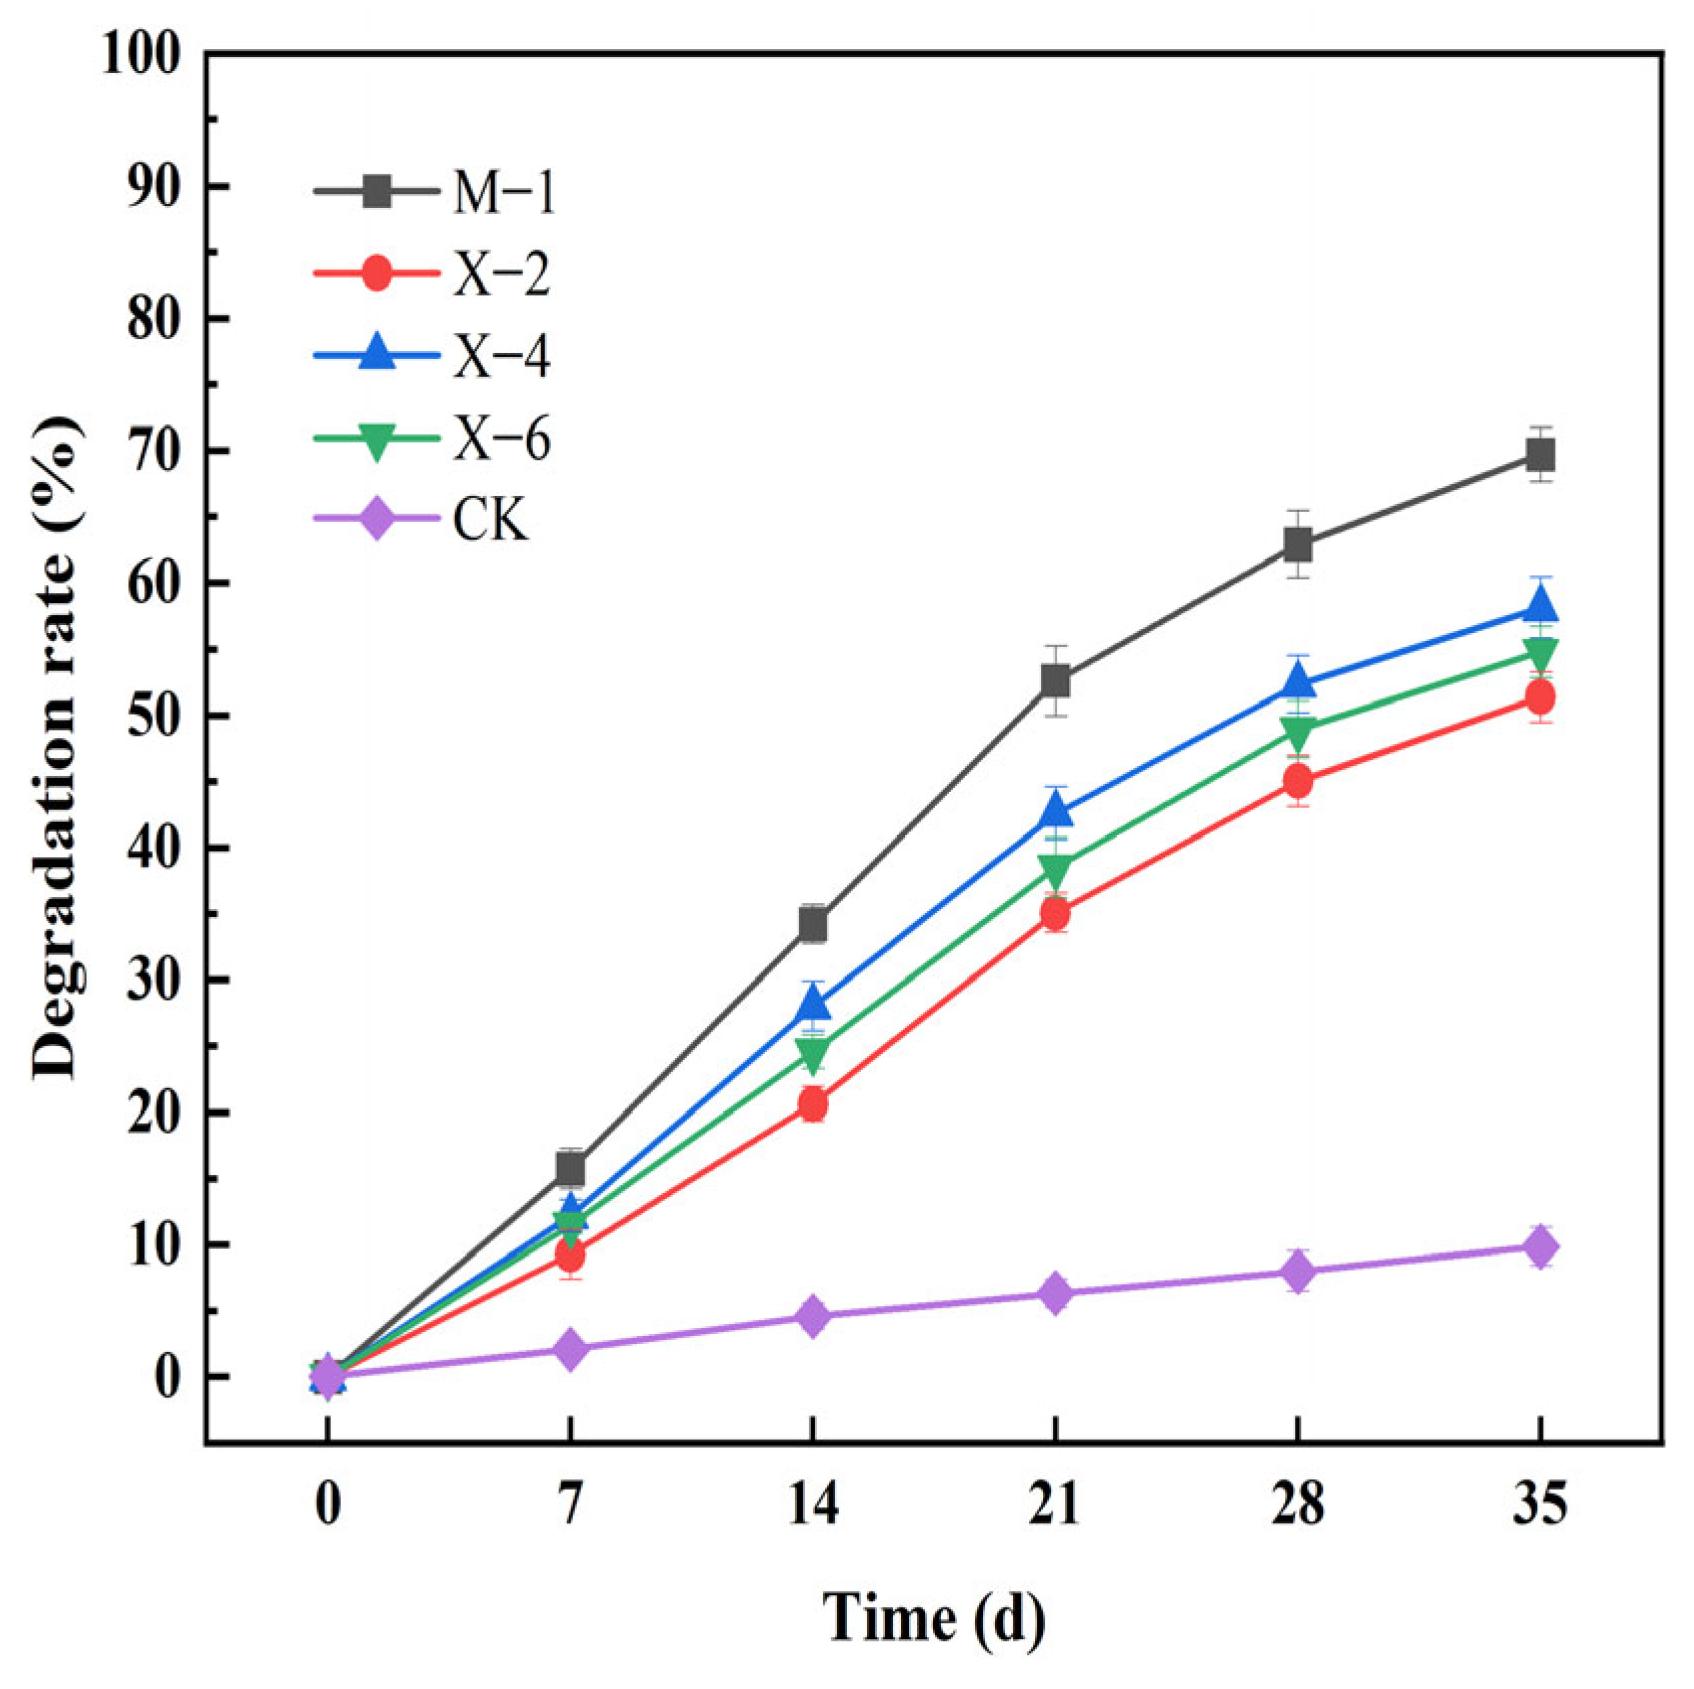
The calculation results of straw degradation rates for each group are shown in Figure 11. On the 35th day, the straw degradation rate of M−1 was the highest at 69.69%, significantly increased by 59.84% compared to CK (p < 0.05), and significantly increased by 18.32%, 11.59%, and 14.92% compared to X−2, X−4, and X−6 (p < 0.05), respectively. The research results are basically consistent with results of Shikata et al. [36]. The residue weights decreased by 64.1% compared with the total initial dry weights of corn straw after inoculation with the microbial consortium ISHI−3 (H. saccincola A7 and C. thermocellum PAL5). By contrast, the dry weights with H. saccincola A7 and C. thermocellum PAL5 decreased to 43.3% and 44.3% compared with the initial weights of corn straw, respectively.
The simulated straw returning degradation results are consistent with the results of a straw degradation experiment performed in liquid medium. M−1 showed high straw degradation effects, but compared with the liquid medium straw degradation, the straw degradation rates of each bacterial treatment were significantly reduced. This is probably due to changes in the reaction environment (liquid medium is homogeneous system; however, soil is heterogeneous system). In the liquid medium environment, the bacterial strains were evenly distributed. They were in full contact with straw (Figure 8), resulting in significant straw degradation effects (79.81%). However, in soil environments, the added bacterial strains were unevenly distributed (Figure 3); this is because the addition position of the bacterial solution was relatively fixed. The degradation effect of the straw was relatively low (69.69%), but the degradation effect of the straw was still significant.

3.8. Results and Analysis of Single Factor Condition Optimization Experiment

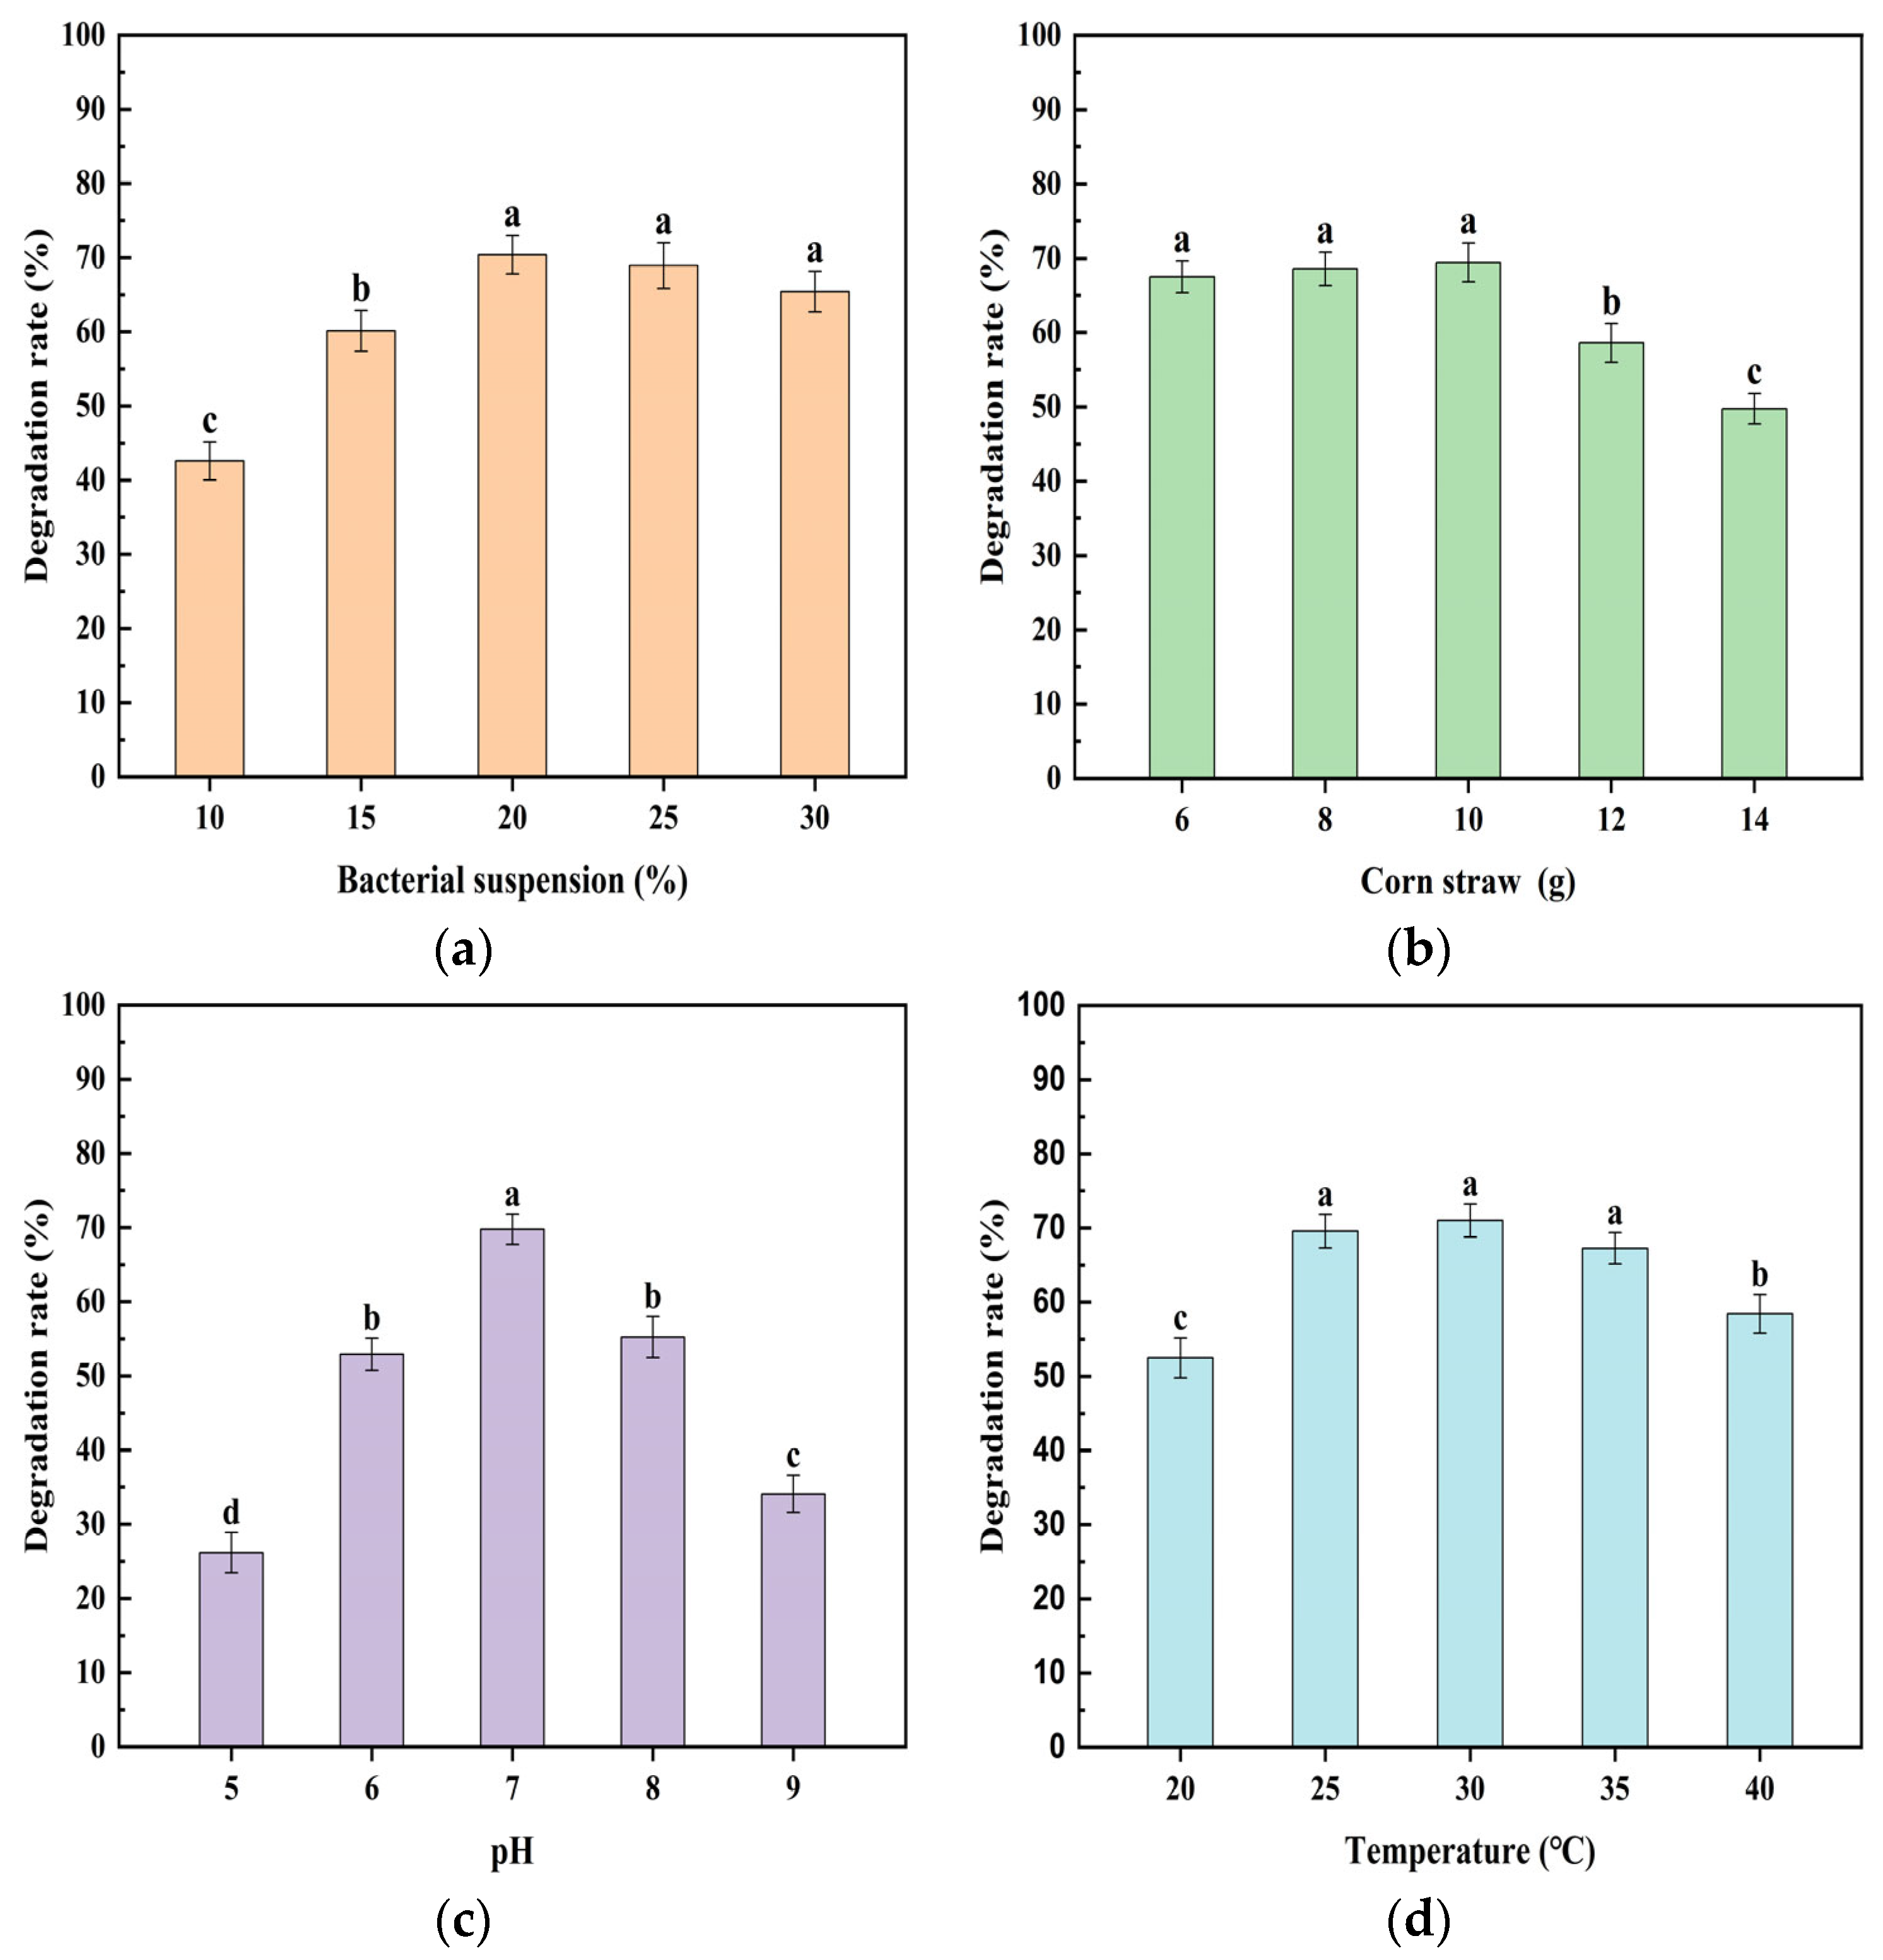
Figure 12a shows that when the inoculation amount of the bacterial solution is 20%, the straw degradation rate is the highest, reaching 70.40%. There is no significant difference in the results compared to the 25% treatment (p > 0.05), and the straw degradation rates are increased by 27.8% and 10.27%, respectively, compared to the 10% and 15% treatments (p < 0.05). The reason for this change may be that when the amount of bacterial solution added is small, the microbial biomass is insufficient, resulting in lower enzyme production and higher straw content, leading to a lower straw degradation rate. As the inoculation amount of bacterial solution gradually increases and the straw content remains unchanged, the straw degradation rate also increases. When it reaches a certain level, due to the limitation of straw morphology and the decrease in other nutrients such as nitrogen sources, the activity of the bacterial strain decreases, and the enzyme amount produced by the strain is less, resulting in a downward trend in the straw degradation rate.
As shown in Figure 12b, when the amount of straw added is 10 g, the straw degradation rate is the highest, reaching 69.44%. The degradation rate of straw treated with straw dosages of 6 g, 8 g, and 10 g is similar, with a difference of 0.87~1.95%. The degradation rate was 10.85% higher (p < 0.05) compared to the addition of 12 g of straw. The reason for this result may be that when the inoculation amount of bacterial solution is fixed and the amount of straw added is relatively small, the contact and distribution of bacteria with straw are uniform, and the decomposition activity is more significant, showing a higher straw degradation rate. As the amount of straw added continues to increase, the consumption of nitrogen sources and other nutrients gradually decreases, leading to a decrease in microbial activity and a gradual decrease in the straw degradation rate. This is consistent with existing research findings that adding nutrients such as nitrogen sources and inorganic salts can improve microbial cellulase activity and straw degradation rate [37].
As shown in Figure 12c, as the pH value gradually increases from 5.0 to 9.0, the straw degradation rate shows a process of first increasing and then decreasing. Among them, when the pH is 7.0, the straw degradation rate is the highest, at 69.77%, which has a significant impact compared to other treatments (p < 0.05), indicating that the initial pH value has a significant effect on the straw degradation rate. The reason is that pH value is an important factor affecting microbial activity and cellulase activity [38,39].
As shown in Figure 12d, when the reaction temperature is 30 °C, the straw degradation rate is the highest, reaching 72.10%. There is not much difference compared to 25 °C and 35 °C, but it is 18.51% higher than at 20 °C and 12.58% higher than at 40 °C (p < 0.05), with significant differences (p < 0.05). The reason for this change is that temperature is an important factor affecting cellulase activity [40]. When the reaction temperature is too low or too high, it will inhibit the activity of organisms, thereby affecting enzyme activity and leading to a decrease in the straw degradation rate. Wang et al. [41] demonstrated through single factor experiments that the degradation rate reached a peak of 39.52%, when the temperature was 37 °C. Microbial enzymatic reactions were fast and the degradation rate was high at suitable temperatures. Bao [42] had optimized the cellulase production conditions of the strain Bacillus cereus XP8 and found that the optimal temperature for cellulase production were 45 °C. According to response surface optimization experiments, temperature was a significant factor affecting cellulase activity. The actual FPA enzyme activity was 15.37 U/mL.

3.9. Results and Analysis of Response Surface Condition Optimization

According to the results of the single factor experiment, the Box–Behnken center combination experiment design is shown in Table A1. Using Design Expert 13 to analyze the experimental data, the regression equation obtained from the quadratic polynomial regression model is as follows:
Y = −542.599 + 5.8659A + 11.3724B + 106.51C + 7.4408D − 0.0247AB + 0.1038AC − 0.0016AD
−0.0459BC − 0.0015BD + 0.0268CD − 0.1364A2 − 0.583B2 − 7.623C2 − 0.1224D2
Y represents the degradation rate of straw, A represents the inoculation amount of bacterial suspension, B represents the amount of straw added, C represents pH, and D represents the reaction temperature.
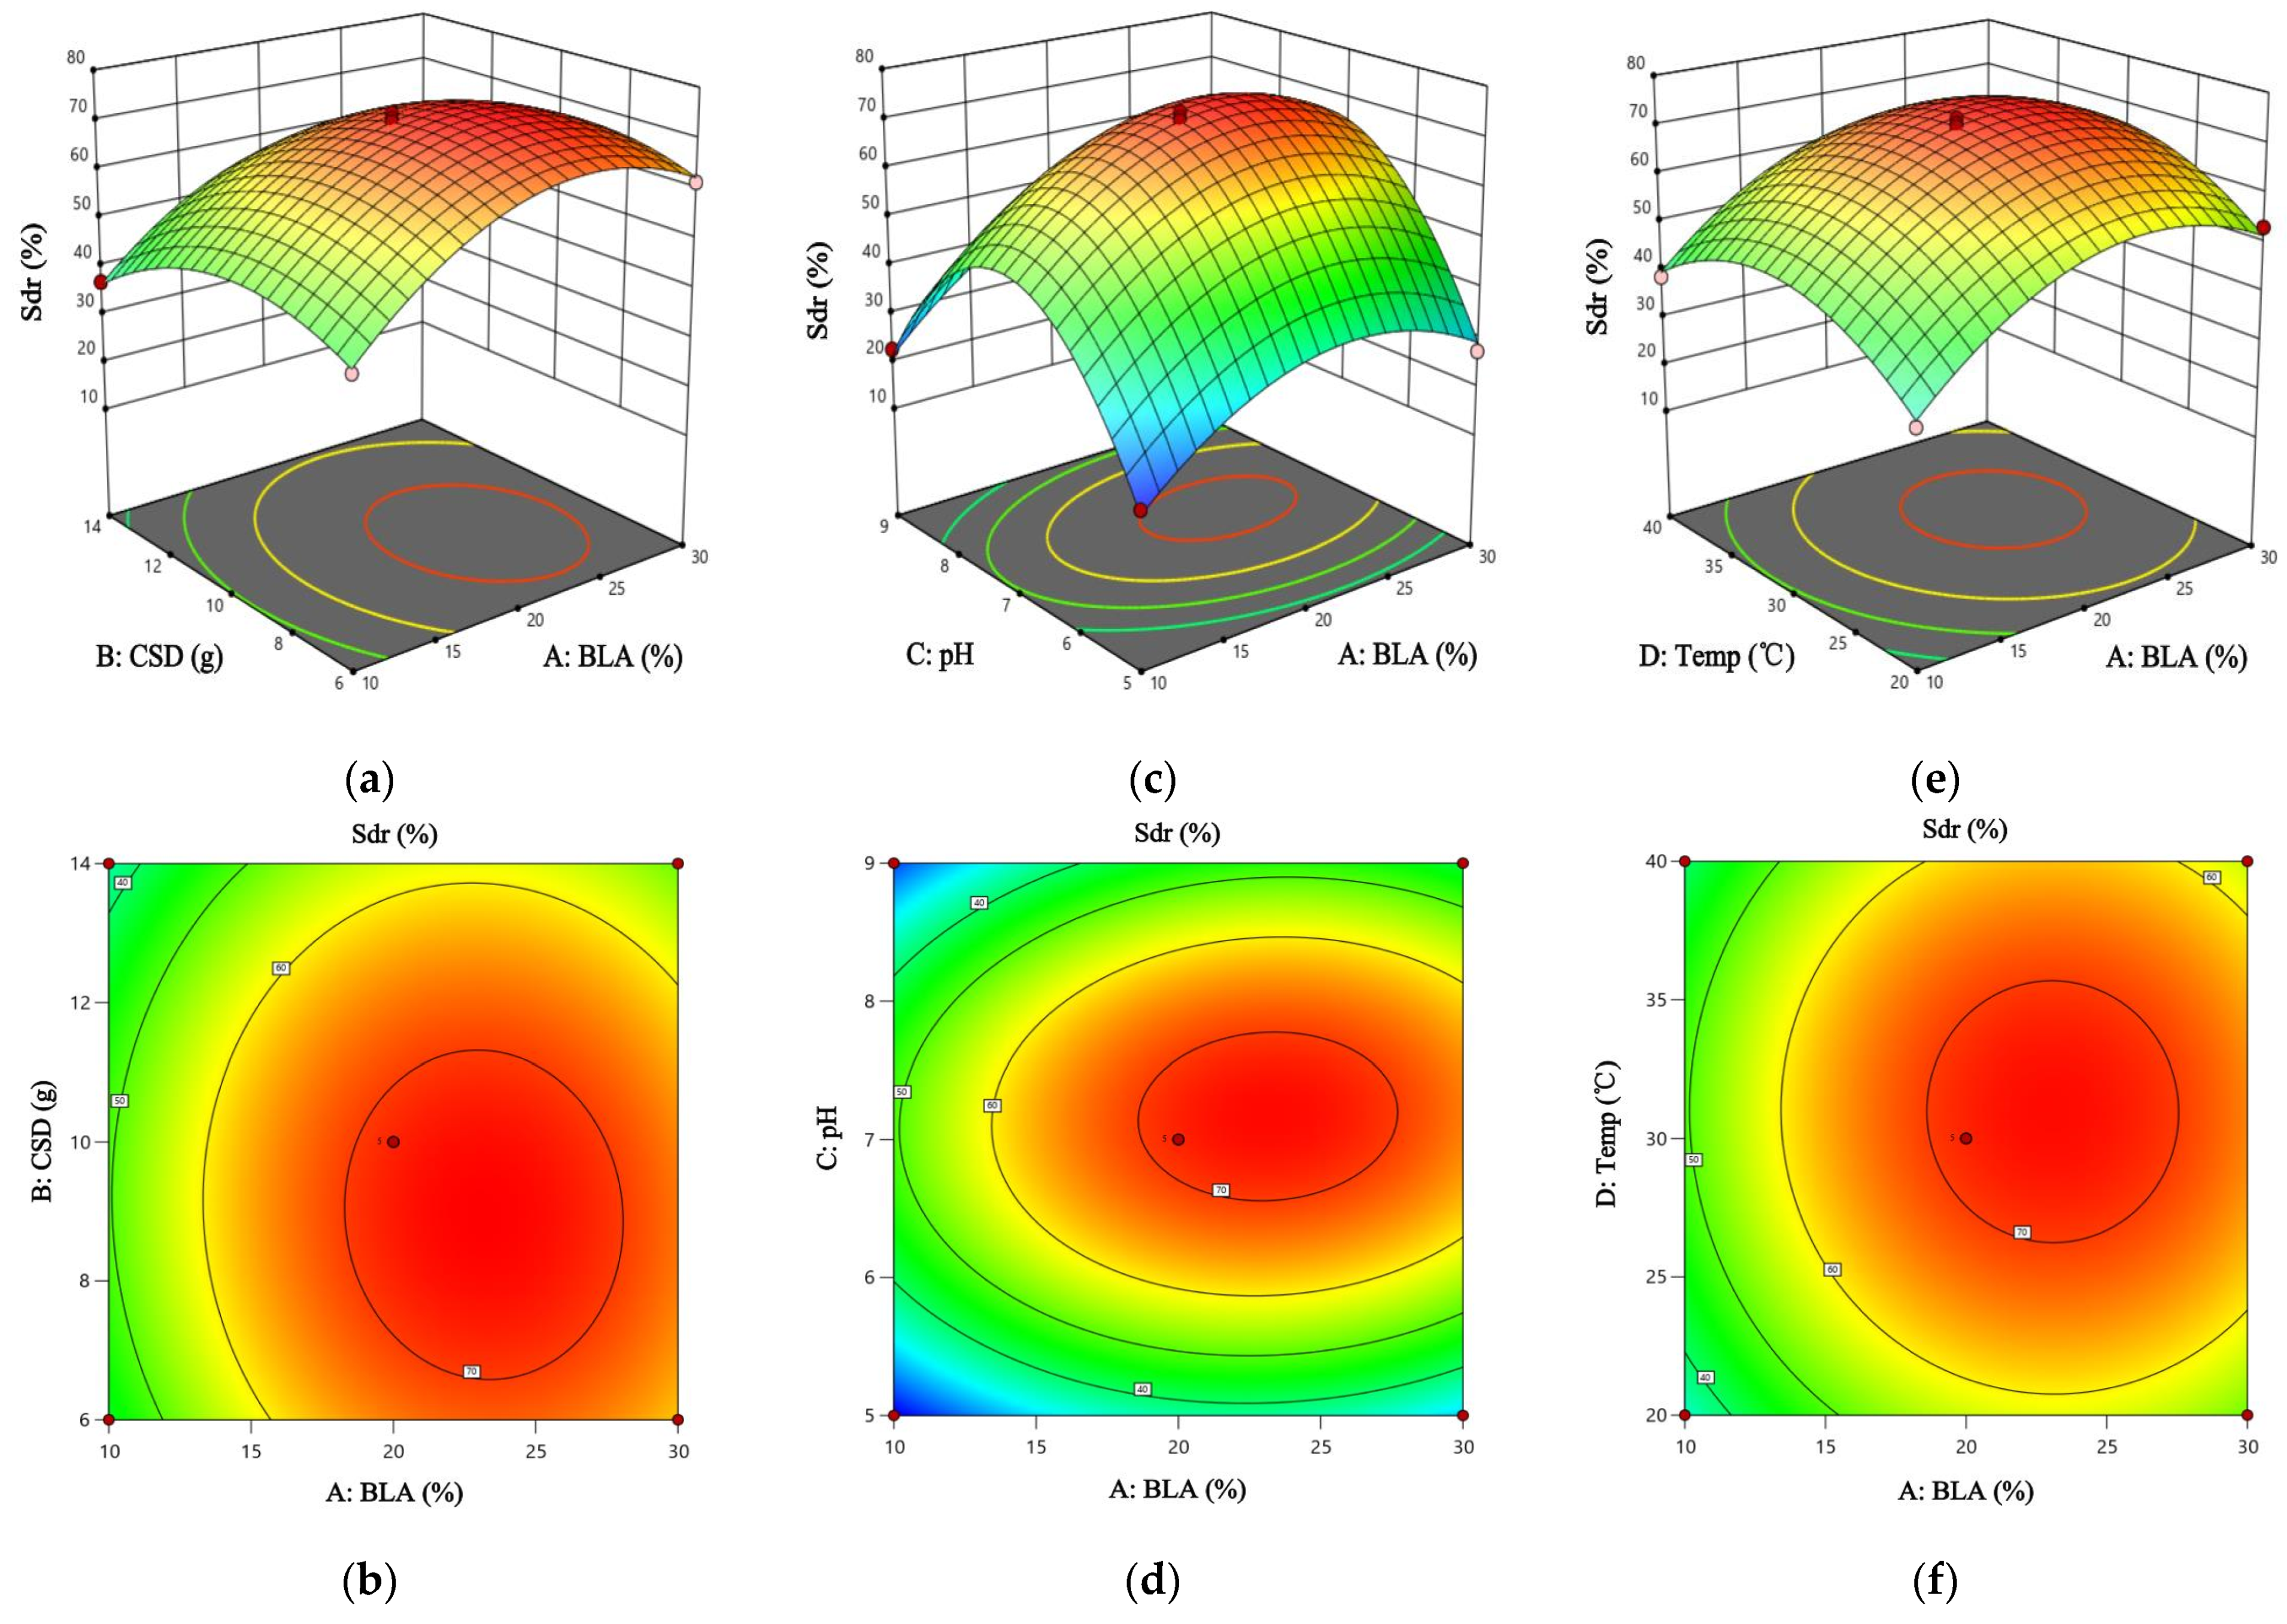
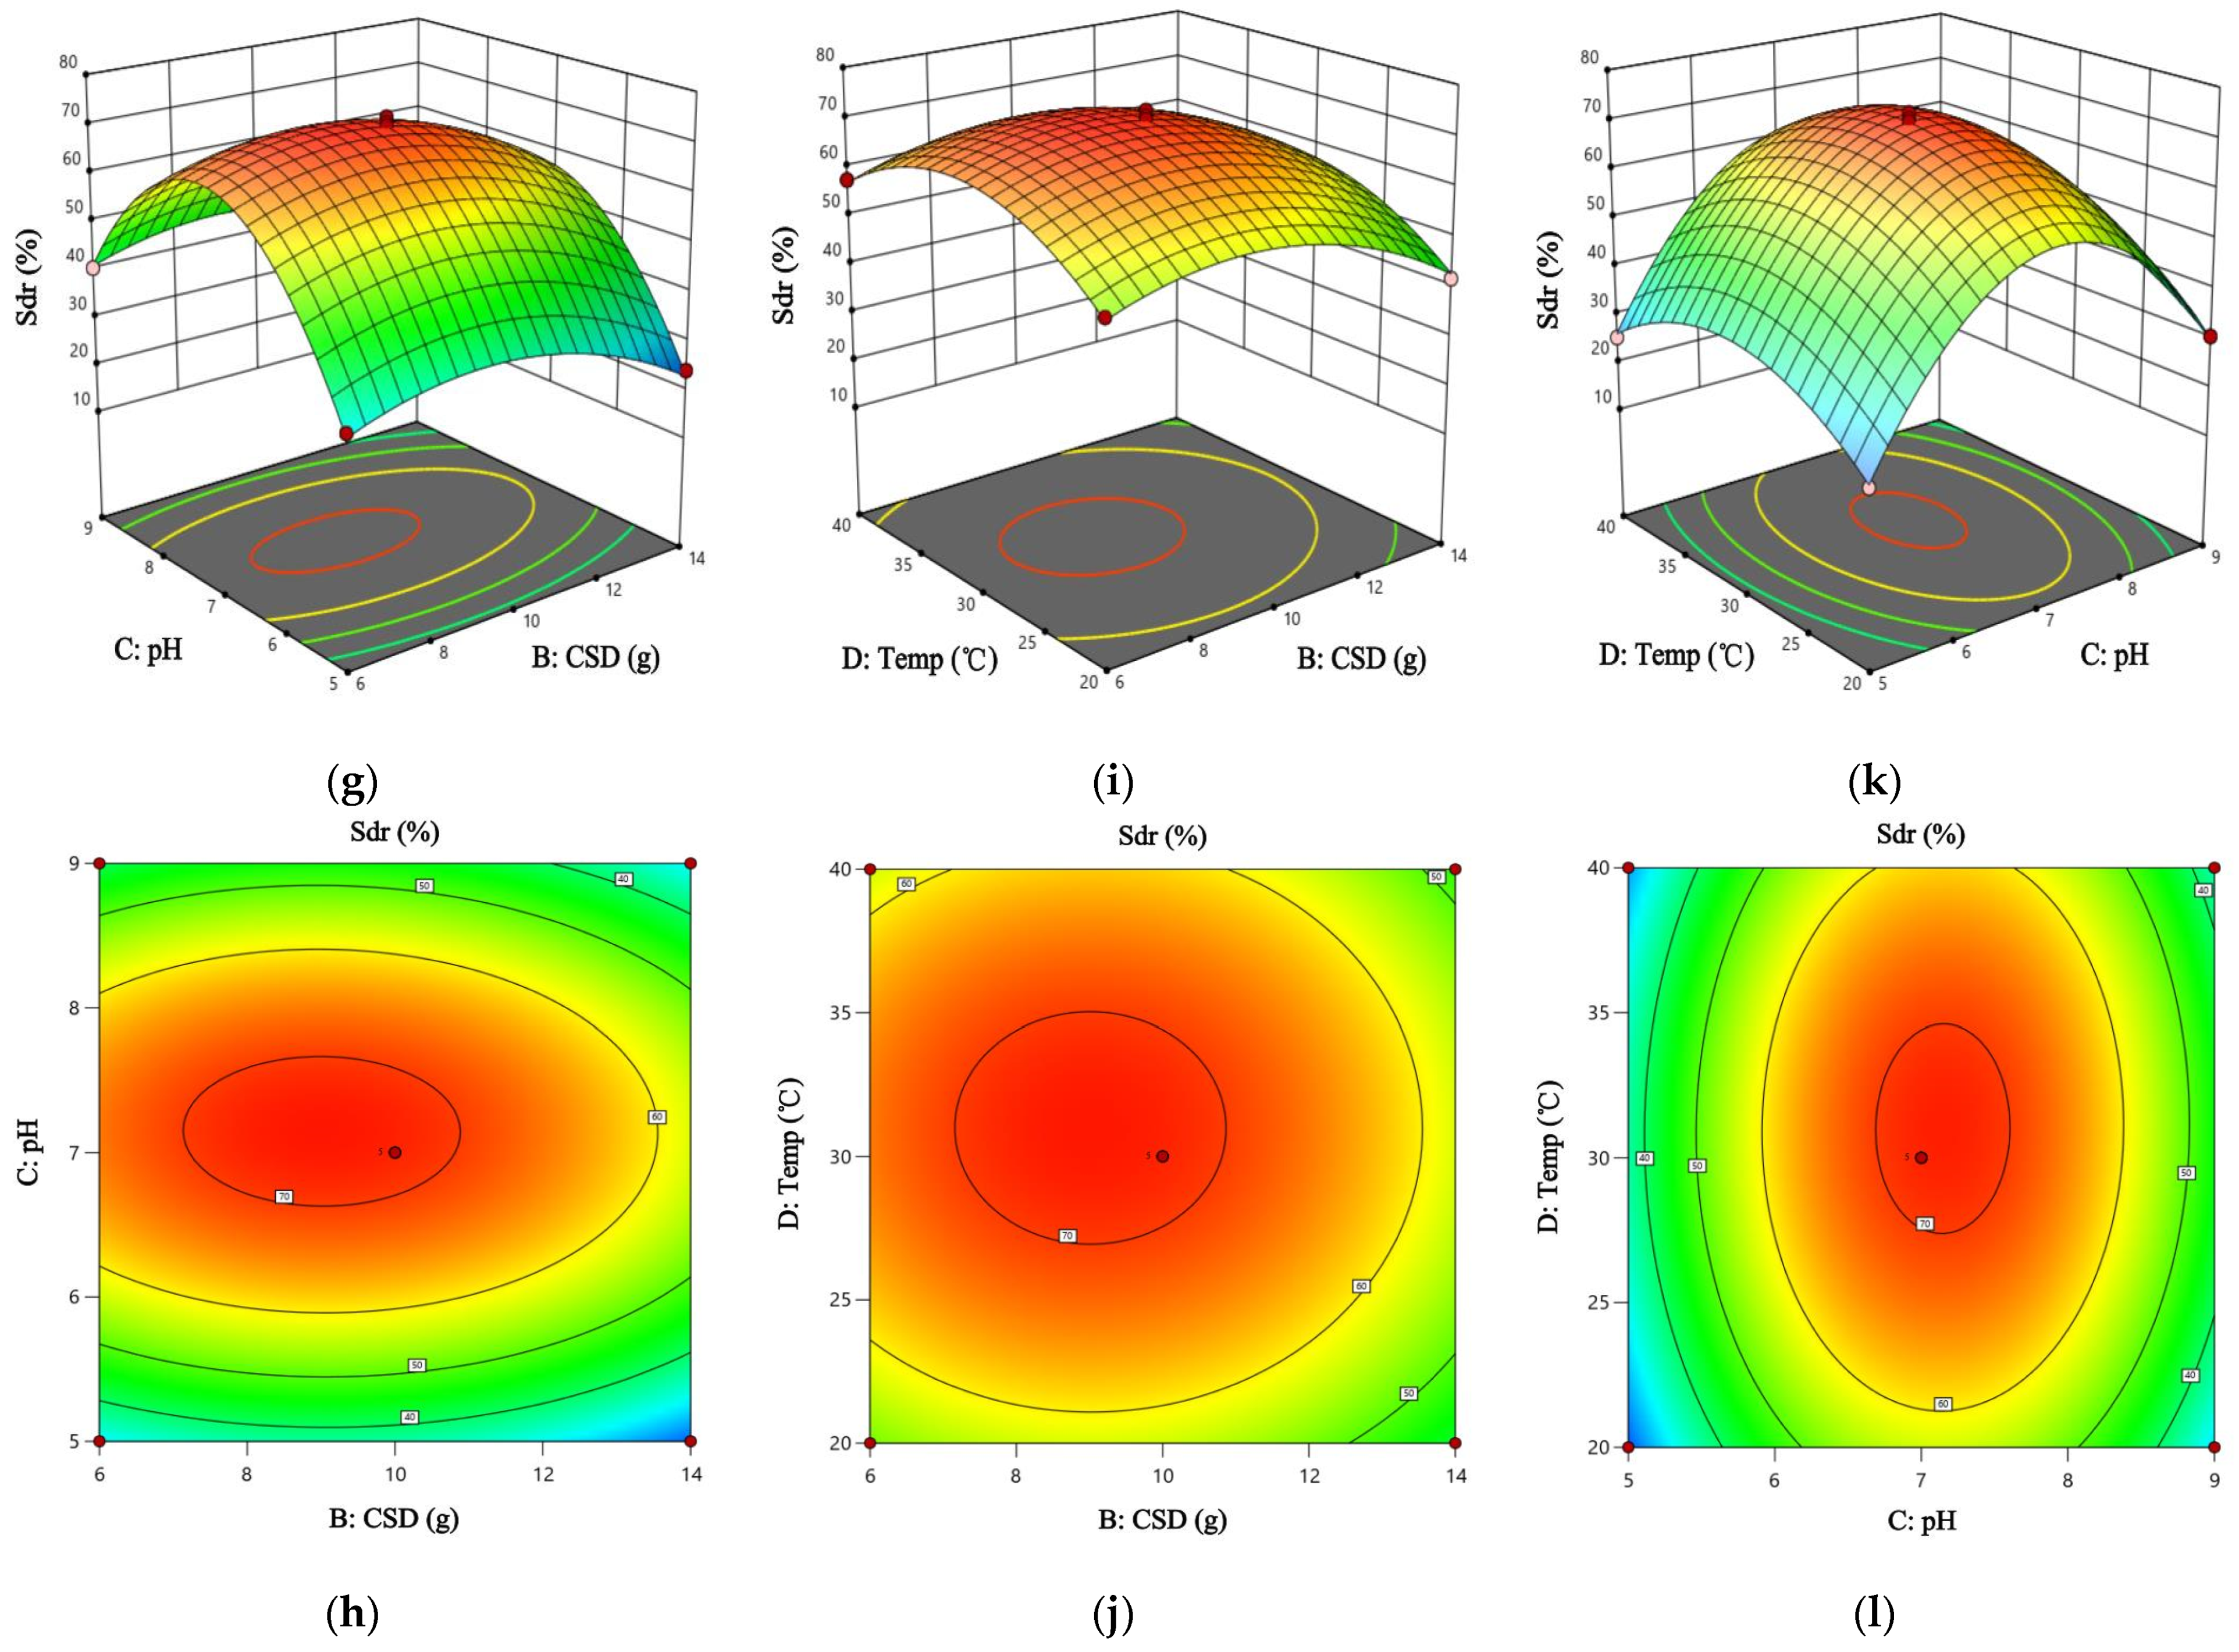
The model constructed with the straw degradation rate (Sdr) as the evaluation index has a p-value of less than 0.0001 (Table A2) with high statistical significance. The loss of fit term p = 0.4545 > 0.05 indicates that the loss of fit factor has no significant impact and can be used for analysis in this regression equation. The R2 value of the model correlation coefficient is 0.9957, the corrected RAdj2 value is 0.9913, the predicted RPre2 is 0.9795, and the difference between RAdj2 and RPre2 is less than 0.2, indicating a strong linear relationship between the dependent variable and the independent variable, indicating a good fit of the model. The significance test results showed that the linear terms A (amount of bacterial suspension), B (straw dosage), C (initial pH), and D (reaction temperature); the secondary terms A2, B2, C2, and D2; and the interaction term AC, all had a significant impact on the straw degradation rate (p < 0.01). The interaction terms AB, AD, BC, BD, and CD had no significant effect (p > 0.05), indicating that their interaction relationship was relatively weak.
As shown in Figure A1 (Appendix A), the response surface and contour plots revealed that pH had the strongest influence on the straw degradation rate, followed by bacterial inoculum volume, reaction temperature, and straw dosage. Significant interactions were observed between pH and other variables, particularly with temperature and inoculum volume. The model predicted optimal degradation conditions at 23.24% inoculum, 8.94 g straw, pH 7.17, and 30.99 °C, with a theoretical degradation rate of 73.60%. Experimental validation under simplified conditions (25%, 9 g, pH 7, 30 °C) yielded 72.15 ± 1.21%, confirming the model’s reliability. It improved by 2.45% compared to before optimization. The research results are basically consistent with the results of Huang et al. [43]. Response surface analysis identified pH had a significant influence on straw degradation and the composite bacterium HC−2 increased the degradation rate of straw after optimization. Full surface plots and statistical details are provided in the Appendix A.

4. Conclusions

This study obtained three highly efficient cellulose degrading bacteria, namely Pseudomonas aeruginosa PA14, Brevibacillus parabrevis M3, and Bacillus cereus PgBE247. Through experimental observations that the strains were antagonistic to each other, they were innovatively prepared into the bacterial consortium M−1. The CMCase, FPA, and β-Gase of M−1 were 28.46 U/mL, 30.93 U/mL, and 27.94 U/mL, respectively, and higher than the single bacteria. On the 35th day, the degradation rate of straw by M−1 reached 79.81% in liquid medium, significantly increased by 72.06% (p < 0.05) compared to CK, and was higher than the other single bacteria. The straw degradation rate of M−1 was 69.69% in the simulated straw returning experiment, significantly increased by 59.84% compared to CK (p < 0.05). An interesting finding is that the degradation of straw in soil starts from the inner pulp and it is continuously decomposed, which is completely different from the phenomenon in liquid. The response surface and contour plots revealed that significant interactions were observed between pH and other variables. Based on the model-predicted optimal degradation conditions, experimental validation under simplified conditions (25%, 9 g, pH 7, and 30 °C) yielded 72.15 ± 1.21%, confirming the model’s reliability. Based on this study, a recombinant expression plasmid can be constructed by extracting efficient straw degradation enzyme genes from strains, which will be more efficient and eliminate biological safety hazards.

Author Contributions

Conceptualization, Data curation, Methodology, Software, Writing—original draft, Writing—review & editing, C.N.; Funding acquisition, Methodology, Resources, Supervision, Writing —original draft, Writing—review & editing, L.S.; Software, Validation, Writing—original draft, R.T. All authors have read and agreed to the published version of the manuscript.

Funding

This study was financially supported by the National Basic Research Program of China (973 Program) (No. 2014CB441106) and the funding project of Northeast Geological S&T Innovation Center of China Geological Survey (No. QCJJ2023-39).

Data Availability Statement

The data presented in this study are available on request from the corresponding author.

Conflicts of Interest

The authors declare no conflicts of interest.

Appendix A

Table A1. Results of Box–Behnken experimental design.
NumberA (%)B (g)CD (°C)Sdr (%)
110673042.7
230673061.46
3101473036.86
4301473051.67
5201052021.77
6201092030.53
7201054025.23
8201094036.13
9101072033.2
10301072053.32
11101074038.61
12301074058.11
1320653032.23
14201453024.01
1520693040.46
16201493030.77
17101053017.54
18301053027.31
19101093022.53
20301093040.6
2120672052.5
22201472041.83
2320674057.42
24201474046.51
25201073073.22
26201073072.1
27201073070.4
28201073069.44
29201073071.44
Table A2. Response surface regression model and ANOVA.
SourceSum of SquaresDegree of
Freedom
Mean SquareF-Valuep-Value
Model8082.99 14 577.36 230.05 <0.0001significant
A850.59 1 850.59 338.92 <0.0001
B253.18 1 253.18 100.88 <0.0001
C233.47 1 233.47 93.03 <0.0001
D69.41 1 69.41 27.66 0.0001
AB3.90 1 3.90 1.55 0.2330
AC17.22 1 17.22 6.86 0.0202
AD0.0961 1 0.0961 0.0383 0.8477
BC0.5402 1 0.5402 0.2153 0.6498
BD0.0144 1 0.0144 0.0057 0.9407
CD1.14 1 1.14 0.4562 0.5104
A21207.18 1 1207.18 481.01 <0.0001
B2564.44 1 564.44 224.90 <0.0001
C26030.92 1 6030.92 2403.06 <0.0001
D2971.13 1 971.13 386.95 <0.0001
Residual35.14 14 2.51
Lock of Fit26.52 10 2.65 1.23 0.4545 not significant
Pure Error8.61 4 2.15
Cor Total8118.12 28
R2 = 0.9957RAd j 2 = 0.9913RPre 2 = 0.9795
Figure A1. Response surface plots and contour plots of the effect of interaction of factors on straw degradation rate: (a) surface plots of A vs. B; (b) contour plots of space between A vs. B; (c) surface plots of A vs. C; (d) contour plots of space between A vs. C; (e) surface plots of A vs. D; (f) contour plots of space between A vs. D; (g) surface plots of B vs C; (h) contour plots of space between B vs. C; (i) surface plots of B vs. D; (j) contour plots of space between B vs. D; (k) surface plots of C vs. D; (l) contour plots of space between C vs. D. The color of the graph from blue to red indicates that the response value is from less to more. The faster the color changes, the greater the slope, that is, the more significant the impact on the result.
Agronomy 15 01947 g0a1aAgronomy 15 01947 g0a1b

References

  1. Bi, Y.Y.; Gao, C.Y.; Wang, Y.J.; Li, B.Y. Estimation of straw resources in China. Trans. Chin. Soc. Agric. Eng. 2009, 25, 211–217. [Google Scholar]
  2. Przybył, J.; Wojcieszak, D.; Garbowski, T. Effect of Corn Stover Ensiling on Methane Production and Carbon Dioxide Emissions. Energies 2024, 17, 6179. [Google Scholar] [CrossRef]
  3. Mika, L.T.; Cséfalvay, E.; Németh, Á. Catalytic conversion of carbohydrates to initial platform chemicals: Chemistry and sustainability. Chem. Rev. 2018, 118, 505–613. [Google Scholar] [CrossRef]
  4. Fan, Y.C.; Yuan, Y.Q.; Li, T.; Lin, W.; Tang, X.W.; Liang, G.M.; Li, N.N. Effects of autumn tillage with straw return on soil physical characteristics of corn fields in the eastern loess plateau. Front. Environ. Sci. 2024, 12, 1362616. [Google Scholar] [CrossRef]
  5. Zhang, C.N.; Lv, X.; Liang, X.M.; Liang, X.M.; Peng, P.; Feng, Y.J. Effects of continuous eeturn of Bt corn straw on soil nutrients, enzyme activities, and microbial communities. Agronomy 2024, 14, 2737. [Google Scholar] [CrossRef]
  6. Liu, R.Z.; Borjigin, Q.; Gao, J.L.; Yu, X.F.; Hu, S.P.; Li, R.P. Effects of different straw return methods on soil properties and yield potential of maize. Sci. Rep. 2024, 14, 28682. [Google Scholar] [CrossRef]
  7. Zhang, S.; Li, M.; Cui, X.; Pan, Y. Effect of different straw retention techniques on soil microbial community structure in wheat–maize rotation system. Front. Microbiol. 2023, 13, 1069458. [Google Scholar] [CrossRef]
  8. Yuan, Y.; Liu, H.; Liang, Y.; Yuan, J.; Zhang, C.; Zhang, J.; Cai, H.; Wang, L. Effects of maize straw return modes on soil organic carbon content and aggregate stability in a mollisol in Northeast China. Mosc. Univ. Soil Sci. Bull. 2024, 79, 693–702. [Google Scholar] [CrossRef]
  9. Su, Y.C.; Xiang, Y.X.; Wang, S.S. Lignin degradation by coprinus comatus in corn stalk. Ind. Crops Prod. 2023, 200, 116906. [Google Scholar] [CrossRef]
  10. Vishnu Vyasa, G.; Narasingappa, R.B.; Prakash, K.V.; Bhavani, P.; Gagandeep, K.R. Prospecting cellulolytic bacteria from white grubs (Holotrichia serrata (F.) and Leucopholis coneophora Burmeister) native to Karnataka region. BMC Microbiol. 2025, 25, 121. [Google Scholar] [CrossRef]
  11. Zhu, N.; Yang, J.S.; Ji, L.; Liu, J.W.; Yang, Y.; Yuan, H.L. Metagenomic and metaproteomic analyses of a corn stover-adapted microbial consortium EMSD5 reveal its taxonomic and enzymatic basis for degrading lignocellulose. Biotechnol. Biofuels 2016, 9, 243. [Google Scholar] [CrossRef] [PubMed]
  12. Arora, D.; Gupta, P.; Jaglan, S.; Roullier, C.; Grovel, O.; Bertrand, S. Expanding the chemical diversity through microorganisms co-culture: Current status and outlook. Biotechnol. Adv. 2020, 40, 107521. [Google Scholar] [CrossRef] [PubMed]
  13. Wang, J.H.; Li, L.L.; Xu, H.; Zhang, Y.H.; Liu, Y.L.; Zhang, F.Y.; Shen, G.N.; Yan, L.Y.; Wang, W.; Tang, H.Z.; et al. Construction of a fungal consortium for effective degradation of rice straw lignin and potential application in bio-pulping. Bioresour. Technol. 2022, 344, 126168. [Google Scholar] [CrossRef] [PubMed]
  14. Hu, Q.B.; Cai, J.L.; Wu, Q.; Li, F.M. Efficient degradation of corn straw at low temperature using a novel co-cultured consortium LHWA. J. Biosci. Bioeng. 2025, 139, 194–205. [Google Scholar] [CrossRef]
  15. Meng, Y.; Gu, W.R.; Ye, L.F.; Chen, D.S.; Li, J.; Wei, S. Degradation of cry1Ab protein within transgenic Bt maize tissue by composite microbial system of MC1. J. Northeast Agric. Univ. (Engl. Ed.) 2014, 21, 10–17. [Google Scholar] [CrossRef]
  16. Li, Y.X.; Kuramae, E.E.; Nasir, F.; Wang, E.; Zhang, Z.G.; Li, J.; Yao, Z.M.; Tian, L.; Sun, Y.; Luo, S.Y.; et al. Addition of cellulose degrading bacterial agents promoting keystone fungal-mediated cellulose degradation during aerobic composting: Construction the complex co-degradation system. Bioresour. Technol. 2023, 381, 129132. [Google Scholar] [CrossRef]
  17. Huang, Q.Y.; Lv, J.X.; He, Q.Y.; Wu, Q.; Liu, M.Q. Screening and Determination of Cellulose-Degrading Strains and Their Utilization in Degrading Straw. J. Fudan Univ. (Nat. Sci.) 2022, 61, 34–42. [Google Scholar] [CrossRef]
  18. Wang, Z.Y.; Ji, Y.Y.; Shu, J.H.; Chen, G.J.; Zhang, R.; Wang, X.L. Screening of high-effciency lignocellulosic degrading bacteria and study on the degradation effect of straw by complex microbial systems. China Feed 2024, 15, 19–26. [Google Scholar] [CrossRef]
  19. Chen, H.X.; Pan, D.W.; Quan, Y.L.; Sun, H.R.; Zhao, L.N.; Zhang, Y.H. Screening of straw-degrading strains and construction of complex microbial system. China Brew. 2024, 43, 70–76. [Google Scholar]
  20. Wang, Y.R.; Kang, Z.C.; Zhu, G.P.; Wang, Y.; Qi, G.Q.; Yu, H.W. Optimization of low temperature resistant corn stalk degrading bacterial community and its effect. Acta Agric. Zhejiangensis 2022, 34, 2720–2727. [Google Scholar]
  21. Zheng, S.; Liu, J.Y.; Sun, L.M.; Wu, J.G. The combined application of swine manure and straw strips to the field can promote the decomposition of corn straw in “broken skin yellow” of black soil. BMC Plant Biol. 2025, 25, 218. [Google Scholar] [CrossRef] [PubMed]
  22. Zhao, X.; Yu, X.; Gao, J.; Qu, J.; Borjigin, Q.; Meng, T.; Li, D. Improvement of Saline–Alkali Soil and Straw Degradation Efficiency in Cold and Arid Areas Using Klebsiella sp. and Pseudomonas sp. Agronomy 2024, 14, 2499. [Google Scholar] [CrossRef]
  23. Zhang, S.N.; Han, S.C.; Yu, X.F.; Gao, J.L.; Hu, S.P.; Borjigin, N.; Borjigin, Q.; Guo, J.G.; Bai, J.F.; Zhang, B.Z.; et al. Successful Formulation and Application of Low-Temperature Bacterial Agents for Corn Stover Degradation. Agronomy 2023, 13, 1032. [Google Scholar] [CrossRef]
  24. Huang, Y.Y.; Huang, Y.L.; Zhang, X.; Zhao, Q.; Zhang, S.M.; Zhang, Z.Y.; Peng, Z.P. Isolation, identification and degradation characteristics of maize straw of low-temperature cellulose-degrading strain Pseudogymnoascus sp. SDF-LT. Soil Fertil. Sci. China 2024, 4, 222–227. [Google Scholar]
  25. Chen, L.L. Isolation and Identification of Corn Straw Degradation Bacteria and Its Degradation Properties; Heilongjiang University of Science and Technology: Harbin, China, 2019. [Google Scholar]
  26. Wang, X.G.; Tian, L.; Wang, E.Z.; Zhong, C.; Tian, C.J. Construction of Microbial Consortium for Efficient Degradation of Corn Straw and Evaluation of Its Degradation Effect. Biotechnol. Bull. 2022, 38, 217–229. [Google Scholar] [CrossRef]
  27. Wang, H.R. Preparation of Multifunctional Compound Fungicide and Its Improvement Effect on Straw Return; Jilin Agricultural University: Changchun, China, 2023. [Google Scholar] [CrossRef]
  28. Ran, Y.Z.; Linghu, M.L.; Ma, S.J.; Zhang, Z.C.; Tian, B.; Liu, J.; Xie, J.; Liu, K.; Hao, J.; Li, J. Screening of a Straw Degradation Strain and Study on Its Degradation Effect. J. Guizhou Univ. (Nat. Sci.) 2024, 41, 118–124. [Google Scholar] [CrossRef]
  29. Wang, W.F.; Liu, Y.X.; Xie, X.J.; Yang, J.; Zhao, Z.Q.; Wang, M.; Zheng, H.B. Screening of efficient cellulose degrading bacteria in cow manure compost and optimization of enzyme production conditions. Microbiol. China 2023, 50, 4796–4811. [Google Scholar] [CrossRef]
  30. Guo, Q.; Liu, R.; Xu, G.; Cao, Y.; Hu, S.L.; Zhao, B. Screening of a rice straw degrading bacteria strain and its degradation effect. J. Northwest A F Univ. (Nat. Sci. Ed.) 2025, 53, 102–112. [Google Scholar] [CrossRef]
  31. Li, J.; Li, J.; Yang, R.P.; Yang, P.; Fu, H.B.; Yang, Y.C.; Liu, C.W. Construction of Microbial Consortium to Enhance Cellulose Degradation in Corn Straw during Composting. Agronomy 2024, 14, 2107. [Google Scholar] [CrossRef]
  32. Han, Q.Y.; Bai, H.J.; Song, Y.; Wang, Z.H.; Lu, J.; Jia, Y.T. Construction of Bacterial Consortium with Efficient Degradation of Corn Straw and Analysis of Degradation Effect. J. North Univ. China (Nat. Sci. Ed.) 2025, 46, 359–368. [Google Scholar]
  33. Liu, X. Construction and Effectiveness of a High Efficient Complex Microbial System for Corn Straw Degradation; Northeast Agricultural University: Harbin, China, 2019. [Google Scholar]
  34. Qing, G.E.; Zhang, B.Z.; Wang, L.J.; Zhao, W.S.; Yu, X.F.; Gao, J.L. Construction and Evaluation Synergistic Effect of Corn Straw Degradation Microbial Compound. J. Maize Sci. 2024, 32, 46–54. [Google Scholar] [CrossRef]
  35. Chen, H.X. Screening of Straw Degrading Bacteria and Application of Compound Microbial Agent; University of Science and Technology Liaoning: Anshan, China, 2023. [Google Scholar] [CrossRef]
  36. Shikata, A.; Sermsathanaswadi, J.; Thianheng, P.; Baramee, S.; Tachaapaikoon, C.; Waeonukul, R.; Pason, P.; Ratanakhano- kchai, K.; Kosugi, A. Characterization of an Anaerobic, Thermophilic, Alkaliphilic, High Lignocellulosic Biomass-Degrading Bacterial Community, ISHI-3, Isolated from Biocompost. Enzym. Microb. Technol. 2018, 118, 66–75. [Google Scholar] [CrossRef] [PubMed]
  37. Zhang, S.H.; Su, X.H.; Ji, J.Y.; Sun, C.C.; Cheng, W.J.; Wang, A.N.; Chen, H. Screening and Characterization of Low-Temperature Fiber Degradation Bacteria from Corn Stalks. J. Jilin Agric. Univ. 2025, 1–10. [Google Scholar] [CrossRef]
  38. Zhang, Y.Y.; Bai, G.W.; Yu, J.H.; Wang, F.; Liu, L.J.; Zhu, L.; Wuyun, D.L. Screening, identification, and enzyme production condition optimization of a cellulose-degrading bacterial strain. Microbiol. China 2025, 1–20. [Google Scholar] [CrossRef]
  39. Song, Y.; Bai, H.J.; Hu, J.J.; Zhao, Q.C.; Han, Q.Y.; Ye, Y.H. Isolation and screening of straw cellulose degrading bacteria, construction of composite strains and optimization of enzyme production conditions. China Brew. 2023, 42, 108–114. [Google Scholar]
  40. He, Z.G.; Ding, B.P.; Ali, Q.B.; Liu, H.Y.; Zhao, Y.; Wang, X.J.; Hao, Y.Z.; Dong, H.; Divvela, P.K.; Juan, Y.H. Screening and isolation of cold-adapted cellulose degrading bacterium: A candidate for straw degradation and De novo genome sequencing analysis. Front. Microbiol. 2023, 13, 1098723. [Google Scholar] [CrossRef]
  41. Wang, L.Y.; Sun, J.J.; Zhang, X.T.; Liu, J.S.; Zhang, S.L.; Zhang, Z. Screening of Straw Degradation Microbial Groups and Optimization of Conditions Degradation. J. Shandong Agric. Univ. 2024, 55, 475–486. [Google Scholar]
  42. Bao, F. Selection, Enzyme Production Condition Optimization, and Enzyme Gene Expression of Cellulose-Degrading Bacteria; Yangzhou University: Yangzhou, China, 2024. [Google Scholar] [CrossRef]
  43. Huang, H.; Wang, J.H.; Leng, S. Construction and application of soil-amending microbial inoculant for straw decomposition. Int. Microbiol. 2025, 1–18. [Google Scholar] [CrossRef]
Figure 1. Corn straw and biodegradation.
Agronomy 15 01947 g001
Figure 2. Simulation of straw returning process.
Agronomy 15 01947 g002
Figure 3. The hydrolysis effect of transparent circles by different degrading bacteria.
Agronomy 15 01947 g003
Figure 4. Changes in filter paper strips of different bacterial strains and CK in 12 days. (a) Strain X−1. (b) Strain X−2. (c) Strain X−3. (d) Strain X−4. (e) Strain X−5. (f) Strain X−6. (g) Strain X−7. (h) CK.
Agronomy 15 01947 g004
Figure 5. Phylogenetic tree of strains based on 16S rDNA. (a) Strain X−2. (b) Strain X−4. (c) Strain X−6.
Agronomy 15 01947 g005aAgronomy 15 01947 g005b
Figure 6. Results of antagonistic experiment. (a) Strain X−2 vs. X−4. (b) Strain X−2 vs. X−6. (c) Strain X−2 vs. X−6.
Agronomy 15 01947 g006
Figure 7. (a) Glucose standard curve and (b) enzyme activity determination results of single bacteria and M−1. The absence of the same lowercase letter after the same color of data indicates a significant difference (p < 0.05).
Agronomy 15 01947 g007
Figure 8. Comparison of the degradation of straw by M−1 with single bacteria X−2, X−4, and X−6 and CK (0~35 d).
Agronomy 15 01947 g008
Figure 9. Comparison of straw degradation rates between M−1 and single bacteria X−2, X−4, and X−6 and CK (0~35 d).
Agronomy 15 01947 g009
Figure 10. Changes in corn straw before and after the straw returning: (a) morphology of straw before returning; (b) morphology of straw after returning.
Agronomy 15 01947 g010
Figure 11. Changes in straw degradation rate from 0 to 35 days.
Agronomy 15 01947 g011
Figure 12. Changes in straw degradation rate from 0 to 35 days. (a) The effect of bacterial suspension dosage on straw degradation rate. (b) The effect of straw dosage on straw degradation rate. (c) The influence of initial pH on straw degradation rate. (d) The effect of reaction temperature on straw degradation rate. The absence of the same lowercase letter after the same color of data indicates a significant difference (p < 0.05).
Agronomy 15 01947 g012
Table 1. The basic physical and chemical characteristics of the soil.
SOM
(g/kg)
pHCEC
(cmol/kg)
Bulk Density
(g/cm3)
AN
(mg/kg)
AP
(mg/kg)
AK
(mg/kg)
Clay
(%)
Silt
(%)
Sand
(%)
7.37.2811.351.2160.7438.91160.3715.0748.4136.52
Table 2. Main culture medium and preparation process.
NumberMediumMedium Composition
1Enrichment mediumCMC-Na 5 g, NaCl 5 g, KH2PO4 0.5 g, MgSO4·7H2O 0.5 g, CaCO3 0.2 g, corn straw powders 5 g, distilled water 1000 mL
2Inorganic salt mediumKH2PO4 1 g, NaCl 0.1 g, MgSO4·7H2O 0.3 g, NaNO3 2.5 g, FeCl3 0.01 g, CaCl2 0.1 g, distilled water 1000 mL, pH 7.2–7.4
3CMC-Na mediumCMC-Na 15 g, NH4NO3 1 g, MgSO4·7H2O 0.5 g, KH2PO4 1 g, yeast extract 1 g, distilled water 1000 mL
4Congo red CMC-Na mediumCMC-Na 15 g, NH4NO3 1 g, MgSO4·7H2O 0.5 g, KH2PO4 1 g, yeast extract 1 g, Congo red 0.2 g, agar 20 g, distilled water 1000 mL
Table 3. Variables and levels in central composite design.
NumberFactorsLevels
−101
ABacterial suspension amount (%)102030
BStraw dosage (g)61014
CpH579
DReaction temperature (°C)203040
Table 4. Results of D/d value by different degrading bacteria.
StrainD/mmd/mmD/d
X−110.282.923.52
X−211.952.704.43
X−39.863.083.20
X−410.482.873.65
X−58.693.222.69
X−610.822.783.89
X−79.132.743.33
X−85.612.881.95
Table 5. Broken condition of filter paper strip.
StrainCultivation Days
0 d3 d6 d9 d12 d
X−1++++++++
X−2++++++++++
X−3++
X−4++++++++++++
X−5++++++
X−6++++++++++++++
X−7+++++++++++
CK
− indicates no significant change in the filter paper strip; + indicates the expansion of the edge of the filter paper strip; ++ indicates that the filter paper strip has expanded and bent as a whole; +++ indicates that the filter paper strip is amorphous and has obvious fracture; ++++ indicates that the filter paper strip is basically decomposed; +++++ indicates that the filter paper strip is completely decomposed.
Disclaimer/Publisher’s Note: The statements, opinions and data contained in all publications are solely those of the individual author(s) and contributor(s) and not of MDPI and/or the editor(s). MDPI and/or the editor(s) disclaim responsibility for any injury to people or property resulting from any ideas, methods, instructions or products referred to in the content.