Article

Deployment of CES-YOLO: An Optimized YOLO-Based Model for Blueberry Ripeness Detection on Edge Devices

College of Engineering and Technology, Jilin Agricultural University, Changchun 130118, China
*
Author to whom correspondence should be addressed.
Agronomy 2025, 15(8), 1948; https://doi.org/10.3390/agronomy15081948
Submission received: 20 July 2025 / Revised: 9 August 2025 / Accepted: 12 August 2025 / Published: 13 August 2025
(This article belongs to the Section Precision and Digital Agriculture)

Abstract

To achieve efficient and accurate detection of blueberry fruit ripeness, this study proposes a lightweight yet high-performance object detection model—CES-YOLO. Designed for real-world blueberry harvesting scenarios, the model addresses key challenges such as significant visual differences across ripeness stages, complex occlusions, and small object sizes. CES-YOLO introduces three core components: the C3K2-Ghost module for efficient feature extraction and model compression, the SEAM attention mechanism to enhance the focus on critical fruit regions, and the EMA Head for improved detection of small and densely packed targets. Experiments on a blueberry ripeness dataset demonstrated that CES-YOLO achieved 91.22% mAP50, 69.18% mAP95, 89.21% precision, and 85.23% recall, while maintaining a lightweight structure with only 2.1 M parameters and 5.0 GFLOPs, significantly outperforming mainstream lightweight detection models. Extensive ablation and comparative studies confirmed the effectiveness of each component in improving detection accuracy and reducing false positives and missed detections. This research offers an efficient and practical solution for automated recognition of fruit and vegetable maturity, supporting broader applications in smart agriculture, and provides theoretical and engineering insights for the future design of agricultural vision models. To further demonstrate its practical deployment capability, CES-YOLO was successfully deployed on the NVIDIA Jetson Orin Nano platform, where it maintained real-time detection performance, with low power consumption and high inference efficiency, validating its suitability for embedded edge computing scenarios in intelligent agriculture.

1. Introduction

With the continuous expansion of blueberry cultivation, the workload of harvesting has increased significantly. The industry is gradually transitioning from traditional manual harvesting to intelligent and mechanized operations. Among them, accurate identification of fruit maturity is a key step in achieving intelligent harvesting [1,2]. In natural environments, the subtle color changes of blueberry fruits, their small size, dense distribution, and frequent occlusion by branches and leaves, as well as interference from light conditions, pose challenges for maturity recognition [3,4]. The maturity level of blueberries directly determines their commercial value and taste quality, with significant differences in color, firmness, and sugar–acid ratio at different stages [5]. Traditional harvesting mainly relies on manual visual inspection, which is inefficient and highly subjective, often leading to the mixing of overripe or unripe fruits, thereby affecting fruit grading and subsequent processing [6]. To enhance the intelligence level of the blueberry industry and achieve precise management of fruit harvesting, there is an urgent need to develop vision-based automatic recognition technologies [7,8].
In recent years, the rapid development of computer vision and deep learning has provided new approaches for fruit and vegetable recognition [9]. In particular, the YOLO (You Only Look Once) series of object detection algorithms, known for their fast detection speed, high accuracy [10], and lightweight structure, have been widely applied in fruit maturity recognition tasks [11]. Existing studies have successfully applied YOLO-based methods to the detection and recognition of fruits such as apples, pears, plums, and strawberries, achieving good results [12,13].
Sun et al. [14] proposed a lightweight detection method named YOLO-CiHFC to address challenges such as the similarity between pear fruits and background colors, occlusion by branches and leaves, dense fruit distribution, and small fruit size. This model was deployed on a Jetson Nano. Zhang et al. [15] introduced a lightweight plum detection algorithm derived from YOLOv5s, used for plum harvesting detection in orchards under complex conditions, achieving an inference speed of 44.64 frames per second on edge computing devices. Yang et al. [16] proposed a fast and lightweight strawberry growth stage detection model, which outperformed state-of-the-art models and was successfully deployed on desktop and Android devices, enabling real-time and efficient detection in resource-limited environments. Wu et al. [17] proposed an innovative and effective model named TobaccoNet to improve the accuracy of tobacco leaf maturity recognition. The classification accuracy of the TobaccoNet model reached 96.67%, highlighting its practical value in tobacco maturity classification. Zhu et al. [18] proposed a model named Olive-EfficientDet for detecting the maturity of multiple olive varieties in orchard environments, achieving over 93% mAP across four olive cultivars.
Research on blueberries is also continuously advancing [19,20,21]. Liu et al. [22] proposed a lightweight YOLO v5s blueberry detection algorithm based on an attention mechanism. Zhao and others [23] improved the YOLOv11 network for 3D spatial perception of blueberry fruits. Song and others [24] proposed a blueberry health monitoring algorithm aimed at WSN scenario applications. Deng et al. [25] proposed the first publicly available blueberry canopy image dataset, and applied YOLOv8 and YOLOv9 for detecting, counting, and evaluating the maturity of blueberries in canopy images, offering a promising method for automated maturity assessment, fruit counting, and yield estimation. A lightweight model named PEBU-Net was developed by Dai et al. [26] for accurately segmenting internal bruises in blueberries caused by mechanical damage using hyperspectral transmittance images (HSTI). Li et al. [27] constructed the MARS-Phenobot field phenotyping system for blueberries, which can measure fruit-related traits, demonstrating a mean absolute percentage error (MAPE) of 23.1% and an R2 of 0.73. Mullins et al. [28] focused on volume estimation of mechanically harvested wild blueberries contained within a harvester tote, while Xiao et al. [29] proposed an enhanced YOLOv5 model that can quickly and accurately detect blueberry fruit maturity. Zhai et al. [30] proposed a YOLOv5-SE + BiFPN architecture that achieved 90.5% mAP with complex backgrounds, with recall and accuracy rates of 88.5% and 88.4%, respectively. Yang et al. [31] constructed the “Blueberry—Five Datasets” containing 10,000 images across five maturity stages and proposed a recognition model based on enhanced detail features and content-aware reorganization, achieving a mAP of 80.7%, which was a 3.2% improvement over the original network. You et al. [32] constructed an image dataset focusing on visual characteristics at different blueberry maturity stages and proposed an improved YOLOv8 detection model—ADE-YOLO—to enhance the accuracy and robustness of blueberry maturity recognition in natural environments. According to Ewa Ropelewska et al. [33], blueberry cultivars can be effectively classified based on image texture parameters, with deep learning models achieving up to 96% accuracy. According to Li et al. [34], a deep learning-based system incorporating a modified YOLOv5 model and an Android application can accurately estimate blueberry count and size, achieving strong correlation (R2 > 0.93) with manually measured berry weight.
In conclusion, although numerous studies have explored the maturity detection of various crops and blueberry fruits, challenges remain in blueberry maturity recognition, due to a small fruit size, subtle color differences, and dense distribution. To address this, this study constructed an image dataset based on the visual characteristics of different blueberry maturity stages and proposes an improved YOLO-based object detection method to enhance the accuracy and robustness of blueberry maturity recognition in natural environments, providing strong technical support for intelligent harvesting and grading management of blueberries.
The main contributions of this study are summarized as follows:
(1)
Construction of a task-adapted blueberry dataset: Based on a publicly available dataset from a published study, this work applied data augmentation to enhance the sample diversity, improving the suitability for detection tasks in orchard environments.
(2)
Development of the CES-YOLO model: Building upon YOLOv11, CES-YOLO introduces three main improvements: (i) replacing the original C3k2 modules with lightweight C3k2_Ghost modules, to reduce parameters and computational cost; (ii) integrating an Efficient Multi-scale Attention (EMA) mechanism to enhance semantic feature representation across scales; and (iii) designing a customized detection head, SEAM (Semantic Enhancement Attention Module), to improve multi-level feature fusion and robustness, especially for small or scale-variant targets. These enhancements jointly improve detection accuracy and model efficiency, making CES-YOLO suitable for deployment on resource-limited edge devices.
(3)
Deployment on edge devices: To validate its practical applicability, the CES-YOLO model was deployed on the NVIDIA Jetson Nano platform, achieving efficient real-time detection performance under constrained computing resources, and demonstrating its potential for intelligent orchard applications.

2. Materials and Methods

2.1. Dataset Construction

The dataset employed in this study is composed of two main sources. The first component consists of images captured at a blueberry harvesting site in Wanliang Town, Baishan City, Jilin Province, as illustrated in Figure 1. The samples used belong to the Northern Highbush Blueberry variety, which is particularly well adapted to the local climate. Image collection was conducted on a clear day during three time slots—9:00 a.m., 12:30 p.m., and 3:00 p.m.—using an iPhone 15 Pro (Apple Inc., Cupertino, CA, USA) equipped with telephoto (f/2.8) and wide-angle (f/1.5) lenses. A total of 500 high-resolution images (4032 × 3024 pixels) in JPG format were obtained. The second part of the dataset includes 1483 images gathered through web scraping from publicly accessible platforms. These images predominantly feature the same Northern Highbush Blueberry cultivar, ensuring varietal consistency throughout the dataset—a factor specifically emphasized to address concerns regarding sample uniformity. All images were carefully curated to maintain quality, resolution (4032 × 3024 pixels), and format consistency with the first component. To ensure the robustness and credibility of the dataset, both acquisition and processing followed ethical guidelines and data usage policies. Furthermore, all images underwent preprocessing, including resizing, annotation, and normalization. For the annotation process, bounding boxes were manually drawn using the open-source tool LabelImg, targeting key features such as berry size, color, and occlusion conditions. This well-curated dataset provides a reliable foundation for subsequent classification and detection model development [32].
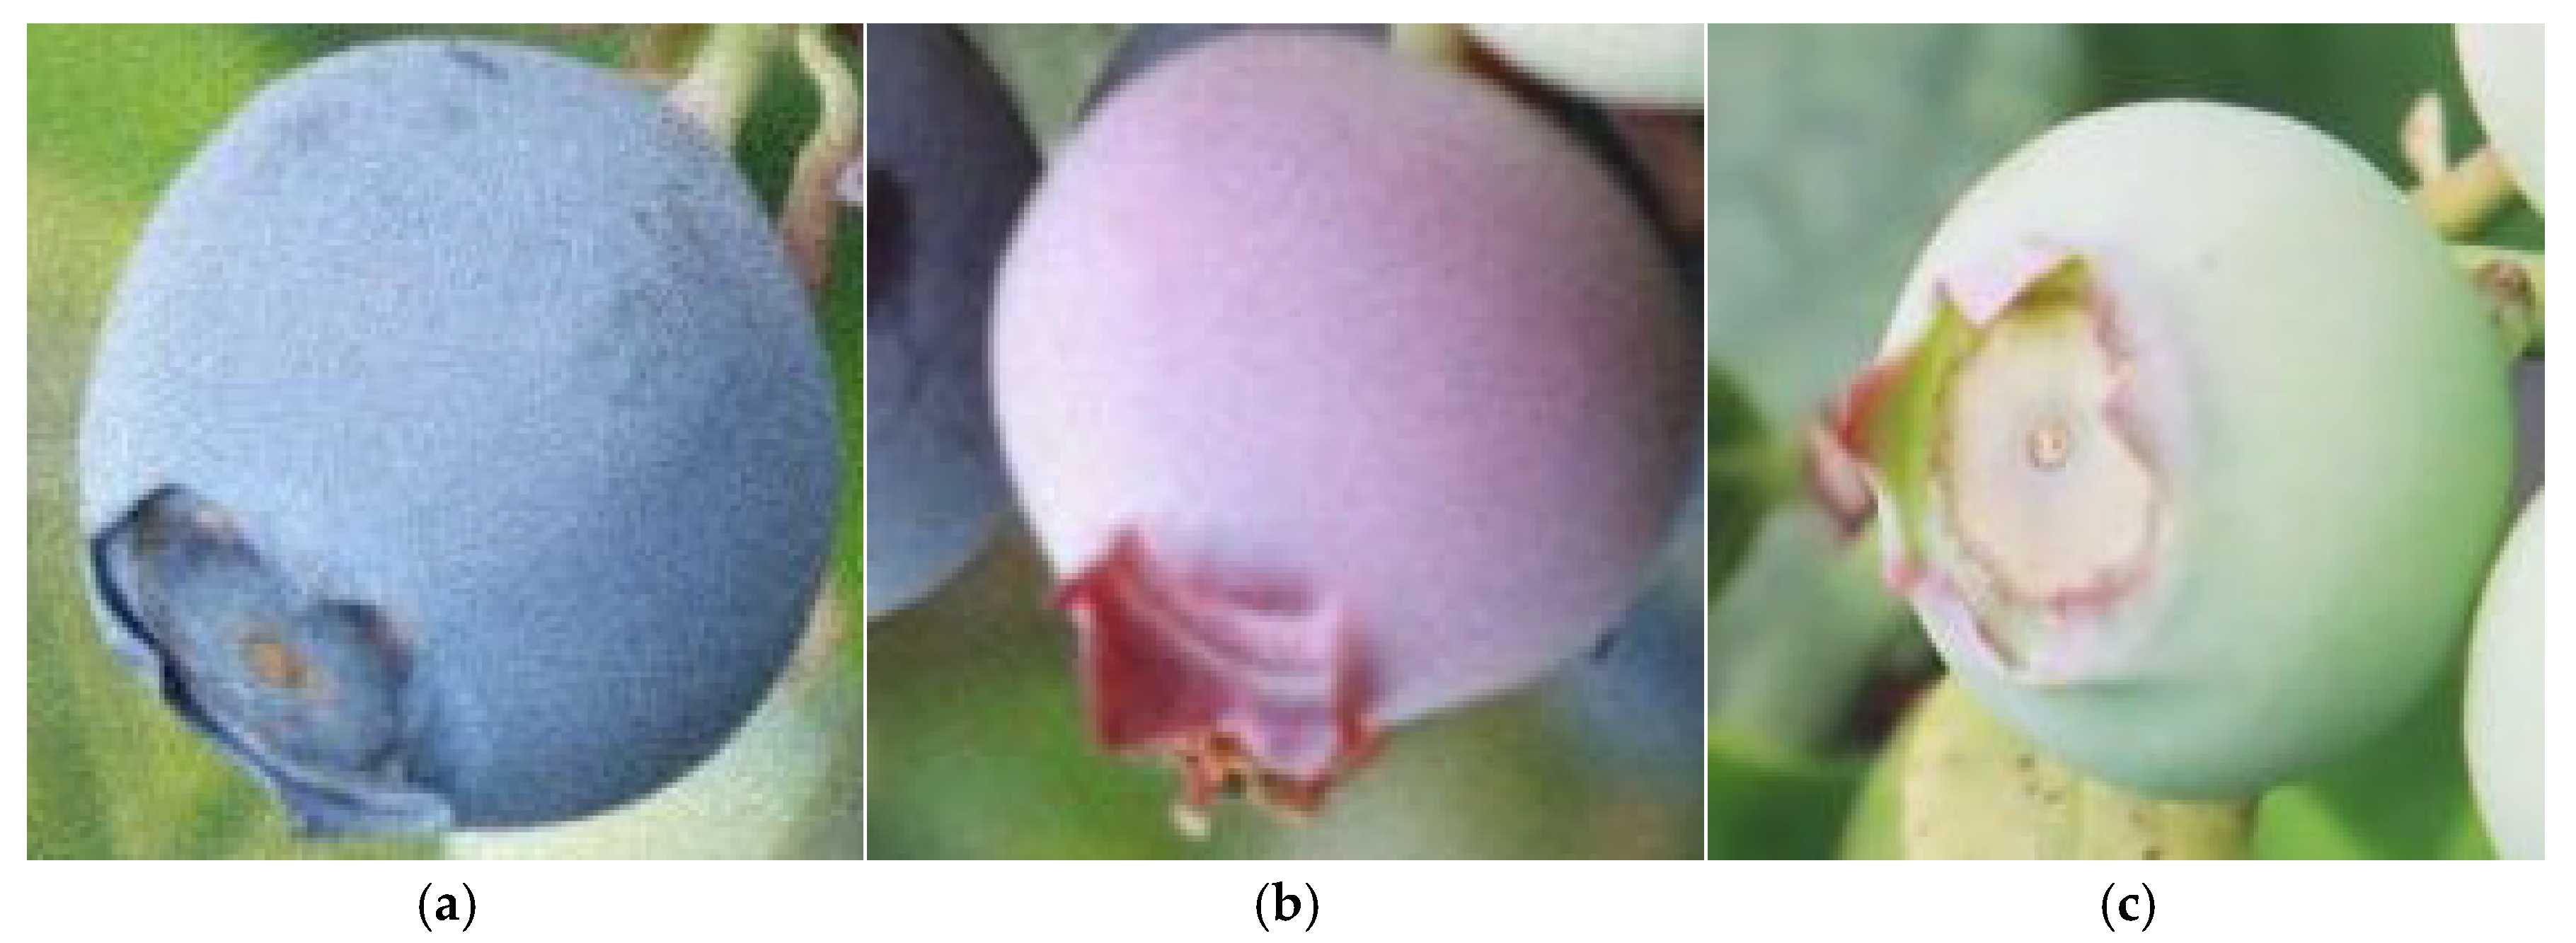
This study proposes a standardized approach for categorizing blueberry fruit maturity stages based on visible image characteristics. Although the BBCH scale offers a detailed system for describing plant developmental stages, it primarily depends on field-based agronomic indicators—such as fruit firmness and soluble solid concentration—which are not directly observable through images. To address this limitation, we designed a maturity classification framework inspired by the BBCH scale, focusing exclusively on externally visible traits, as illustrated in Figure 2. The proposed scheme divides blueberry maturity into three distinct stages: Fully mature: characterized by a uniformly deep blue coloration, round and plump shape, softened skin, and a visibly expanded calyx. This stage indicates peak ripeness, with maximum sugar content, making the fruit ideal for consumption and commercial use. Semi-mature: marked by partial coloration ranging from pink to red, slight skin softening, noticeable surface wrinkling, and reduced calyx tension. At this point, the sugar content begins to rise, although the fruit still retains a tart flavor profile. Immature: Identified by a green appearance with no anthocyanin accumulation, firm and smooth skin, and a fully intact calyx. Fruit at this stage are still in early development, with a low sugar content and a predominantly sour taste. This visually based classification framework ensures objectivity and reproducibility in labeling, aligning conceptually with the BBCH scale, while remaining feasible for image-based analysis. It provides a consistent and practical foundation for annotating maturity levels in datasets, facilitating the training and evaluation of computer vision models in agricultural applications.

2.2. Dataset Production

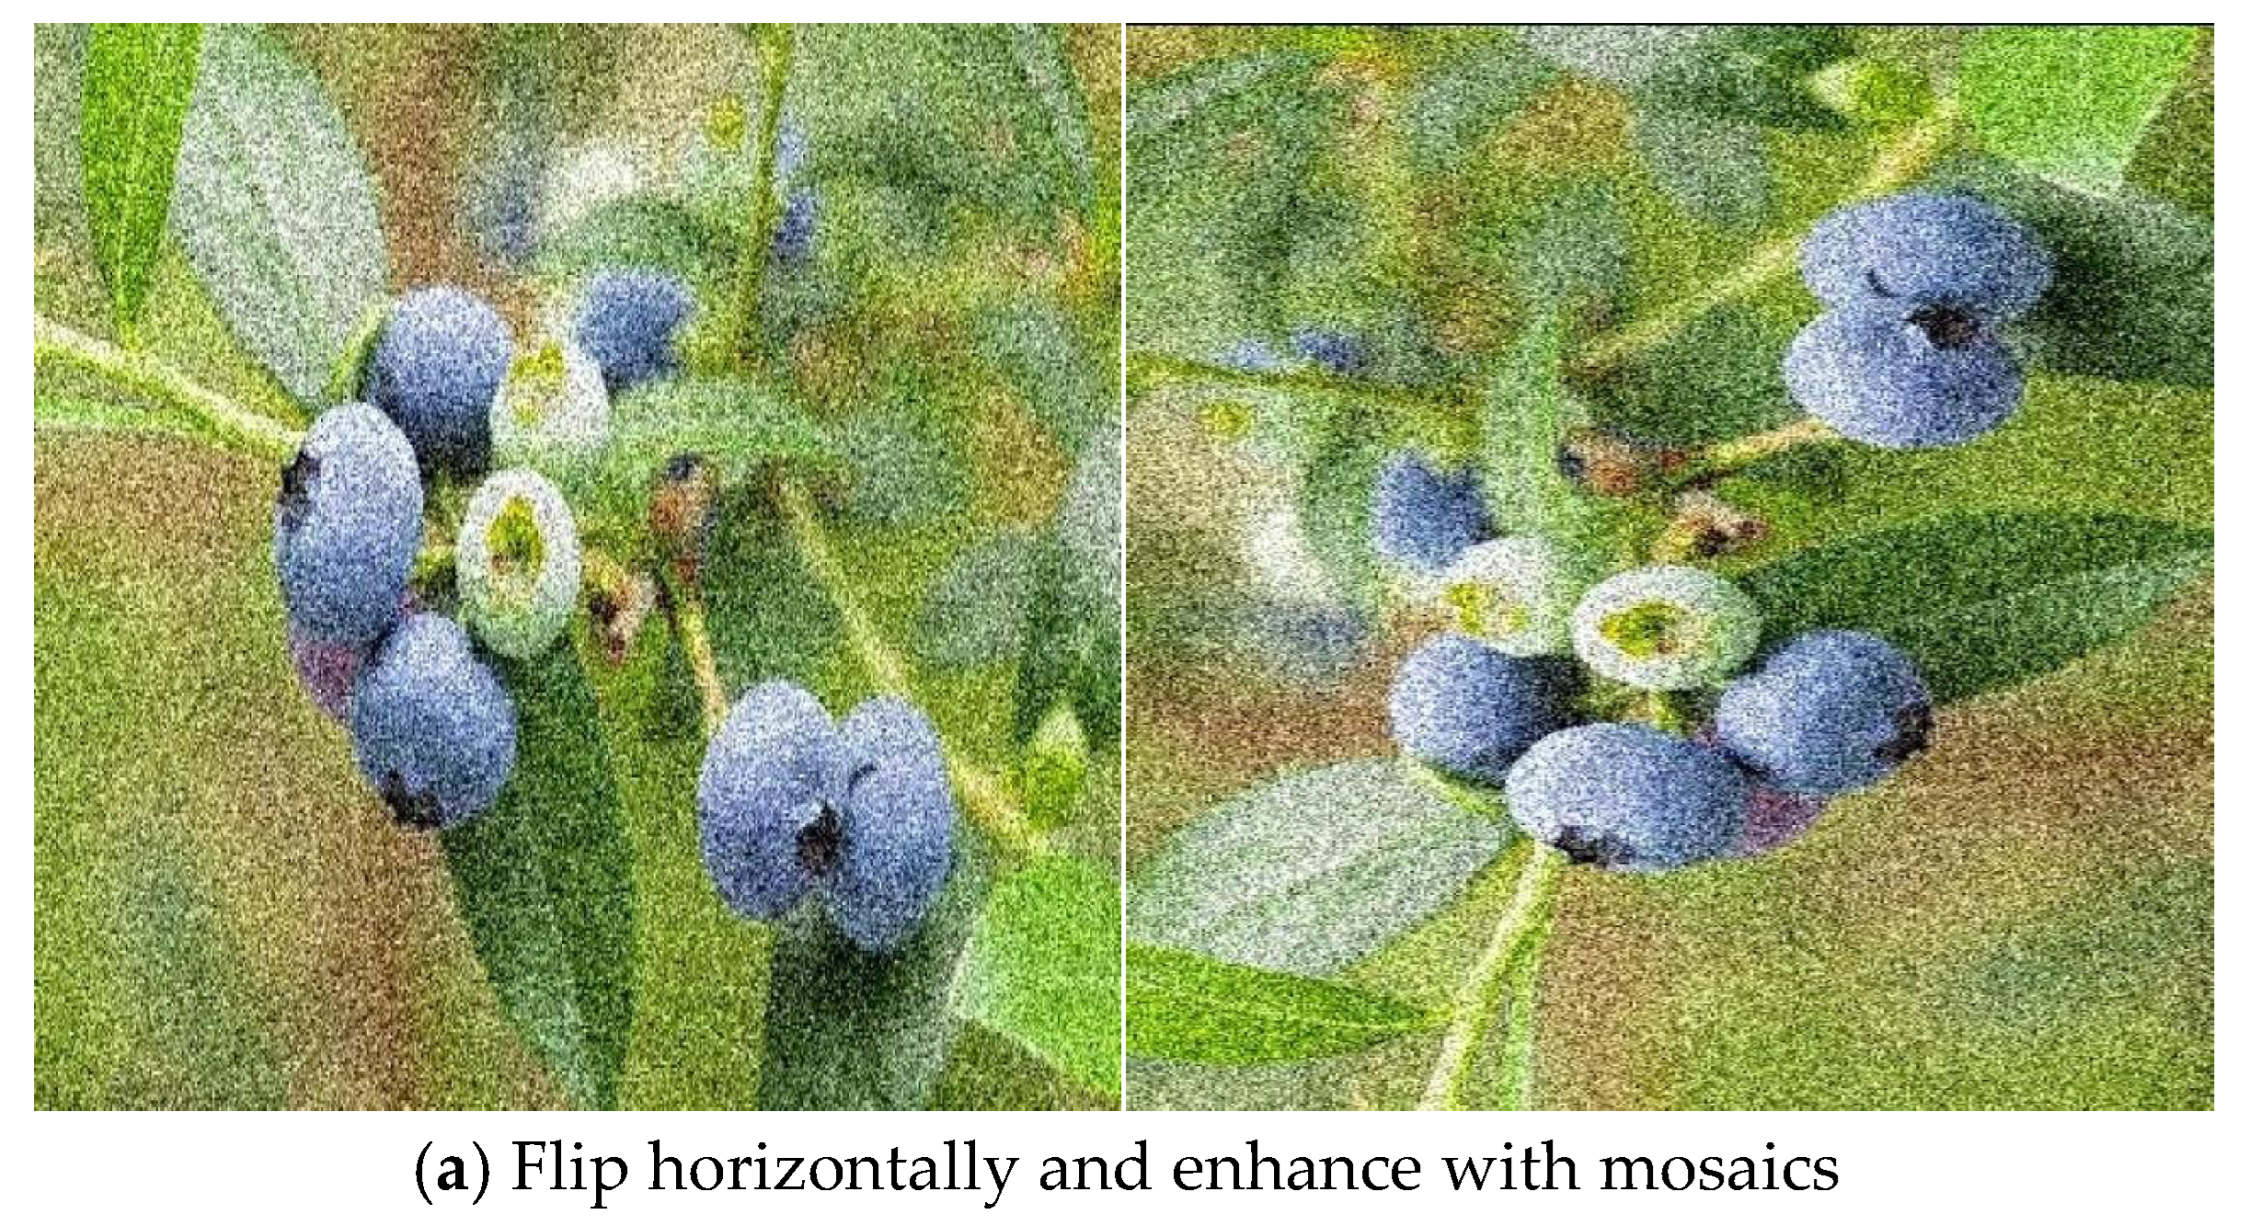
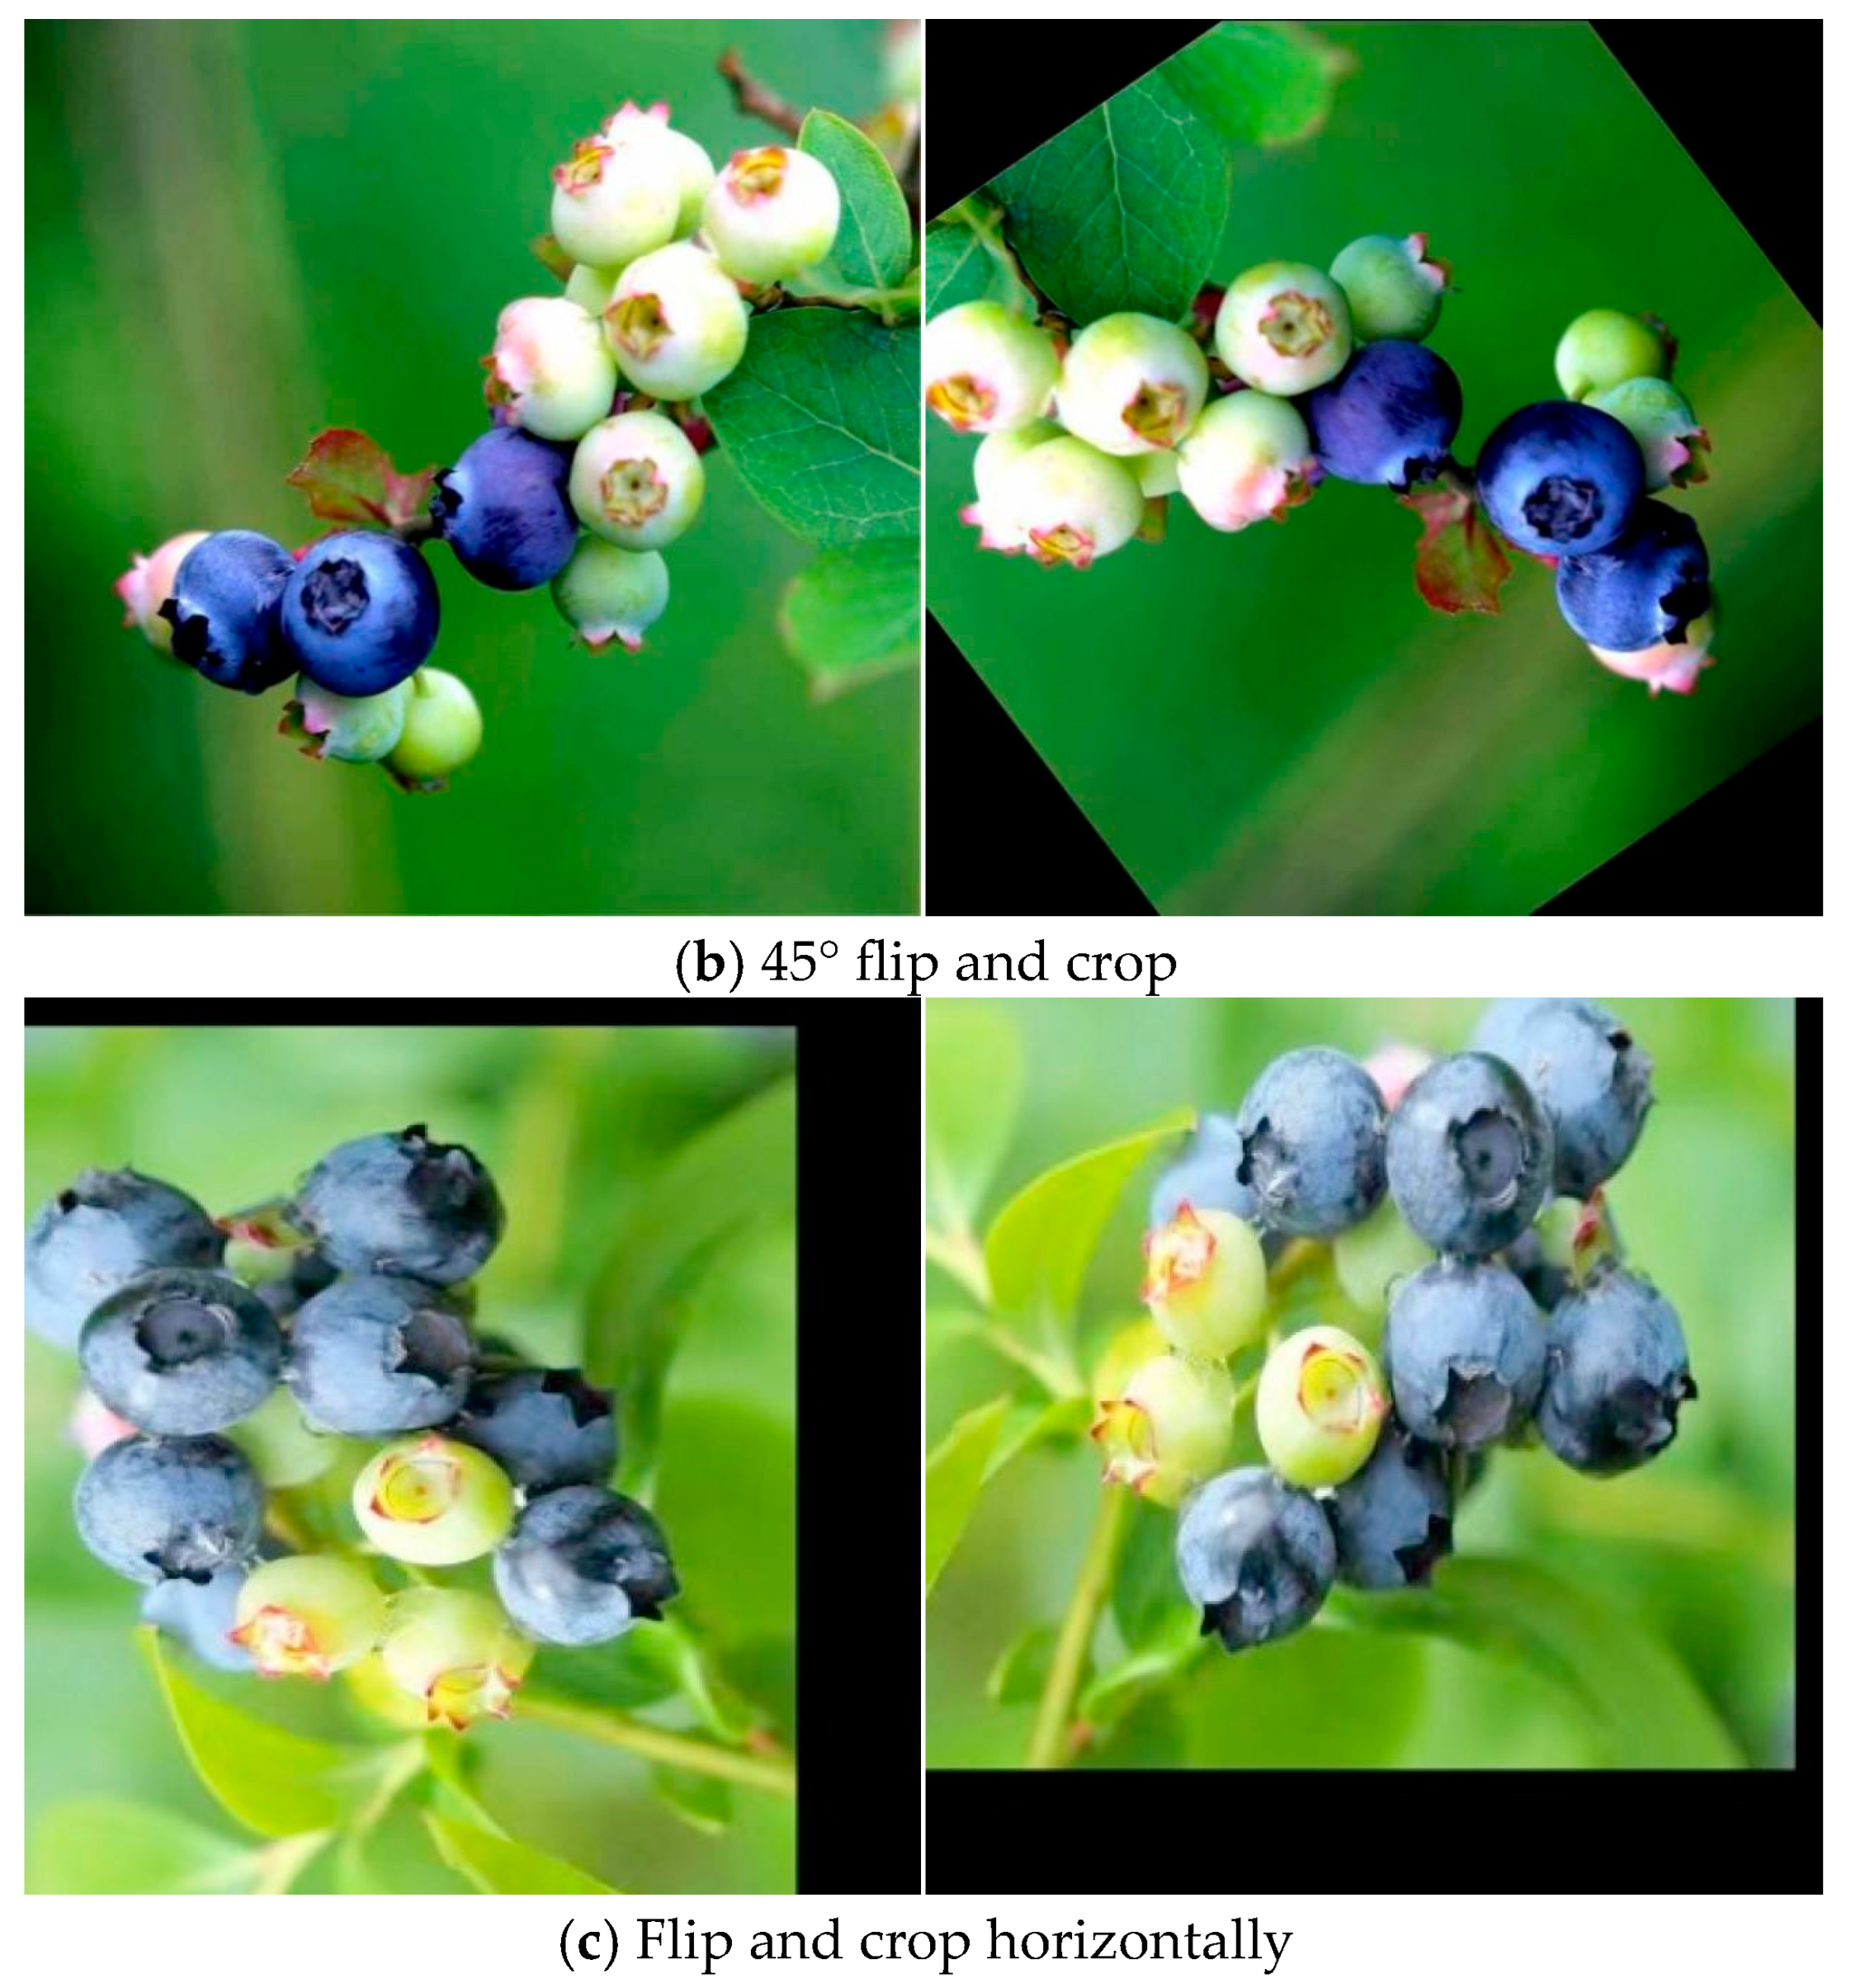
Image preprocessing plays a vital role in improving model robustness and increasing data diversity [35]. In this study, the collected blueberry images were divided into training, validation, and test sets at a ratio of 7:2:1. To enrich the training data, various augmentation techniques were applied, including horizontal flipping, 45° rotation, cropping, translation, and mosaic-like blurring (as illustrated in Figure 3). In particular, mosaic-like blurring introduced pixel-level texture disturbances, which enhanced the model’s adaptability to varying lighting and background conditions. The annotation files for all augmented images were updated accordingly to maintain label consistency. As a result, the dataset was expanded to 3705 images, providing a solid foundation for model training and evaluation.

2.3. Model Selection and Enhancement

YOLOv11, released by Ultralytics in 2024, is the latest real-time object detection framework to build upon YOLOv8, with further architectural and performance enhancements [36]. Its key improvements are as follows: First, in the backbone network, YOLOv11 introduces a novel C3k2 module to replace the original C2f structure. This module is composed of three convolutional blocks, enhancing the network’s capability for feature representation and nonlinear modeling, thereby improving multi-scale feature extraction. Second, in the neck component, a C2PSA (Cross-Stage Partial with Spatial Attention) layer is added following the original SPPF (Spatial Pyramid Pooling-Fast) module. By integrating cross-stage connections with spatial attention, the C2PSA module strengthens the model’s ability to perceive small and occluded objects, improving detection performance in complex scenes. Third, in the detection head, YOLOv11 replaces traditional convolutions with two layers of depthwise separable convolutions (DWConv), which effectively reduce computational complexity, while maintaining expressive power, thereby accelerating inference. Additionally, YOLOv11 re-optimizes the network’s depth and width factors. As a result, it achieves approximately a 20% reduction in parameter count compared to YOLOv8, while maintaining detection accuracy, making the model lightweight and adaptable for deployment across various scenarios.
To further enhance the feature extraction capability and detection accuracy of the model, this study proposes CES-YOLO, an improved architecture based on YOLOv11. The proposed model incorporates the following structural optimizations: Firstly, all C3k2 modules in the original YOLOv11 are replaced with lightweight C3k2_Ghost modules. Built upon GhostConv, this module significantly reduces the number of parameters and computational costs, while maintaining sufficient feature representation capacity, thereby improving the overall feature extraction efficiency. Secondly, the Efficient Multi-scale Attention (EMA) mechanism is introduced to enhance the representation of high-level semantic features. EMA utilizes channel grouping and weighted aggregation to efficiently capture critical information across multiple scales, improving the model’s sensitivity to objects of various sizes, with minimal computational overhead. Finally, a customized detection head named SEAM (Semantic Enhancement Attention Module) is introduced after the SPPF layer, replacing the standard Detect head in YOLOv11. By integrating multi-scale semantic enhancement mechanisms, SEAM effectively fuses feature maps from different hierarchical levels, resulting in improved detection accuracy and robustness, particularly for small or multi-scale targets. The network structure of CES-YOLO is shown in Figure 4.
Notably, these structural optimizations—lightweight convolution, multi-scale attention, and semantic enhancement—are especially beneficial in tasks like blueberry ripeness detection, which involve small, densely packed, and visually similar targets.

2.3.1. C3K2_Ghost

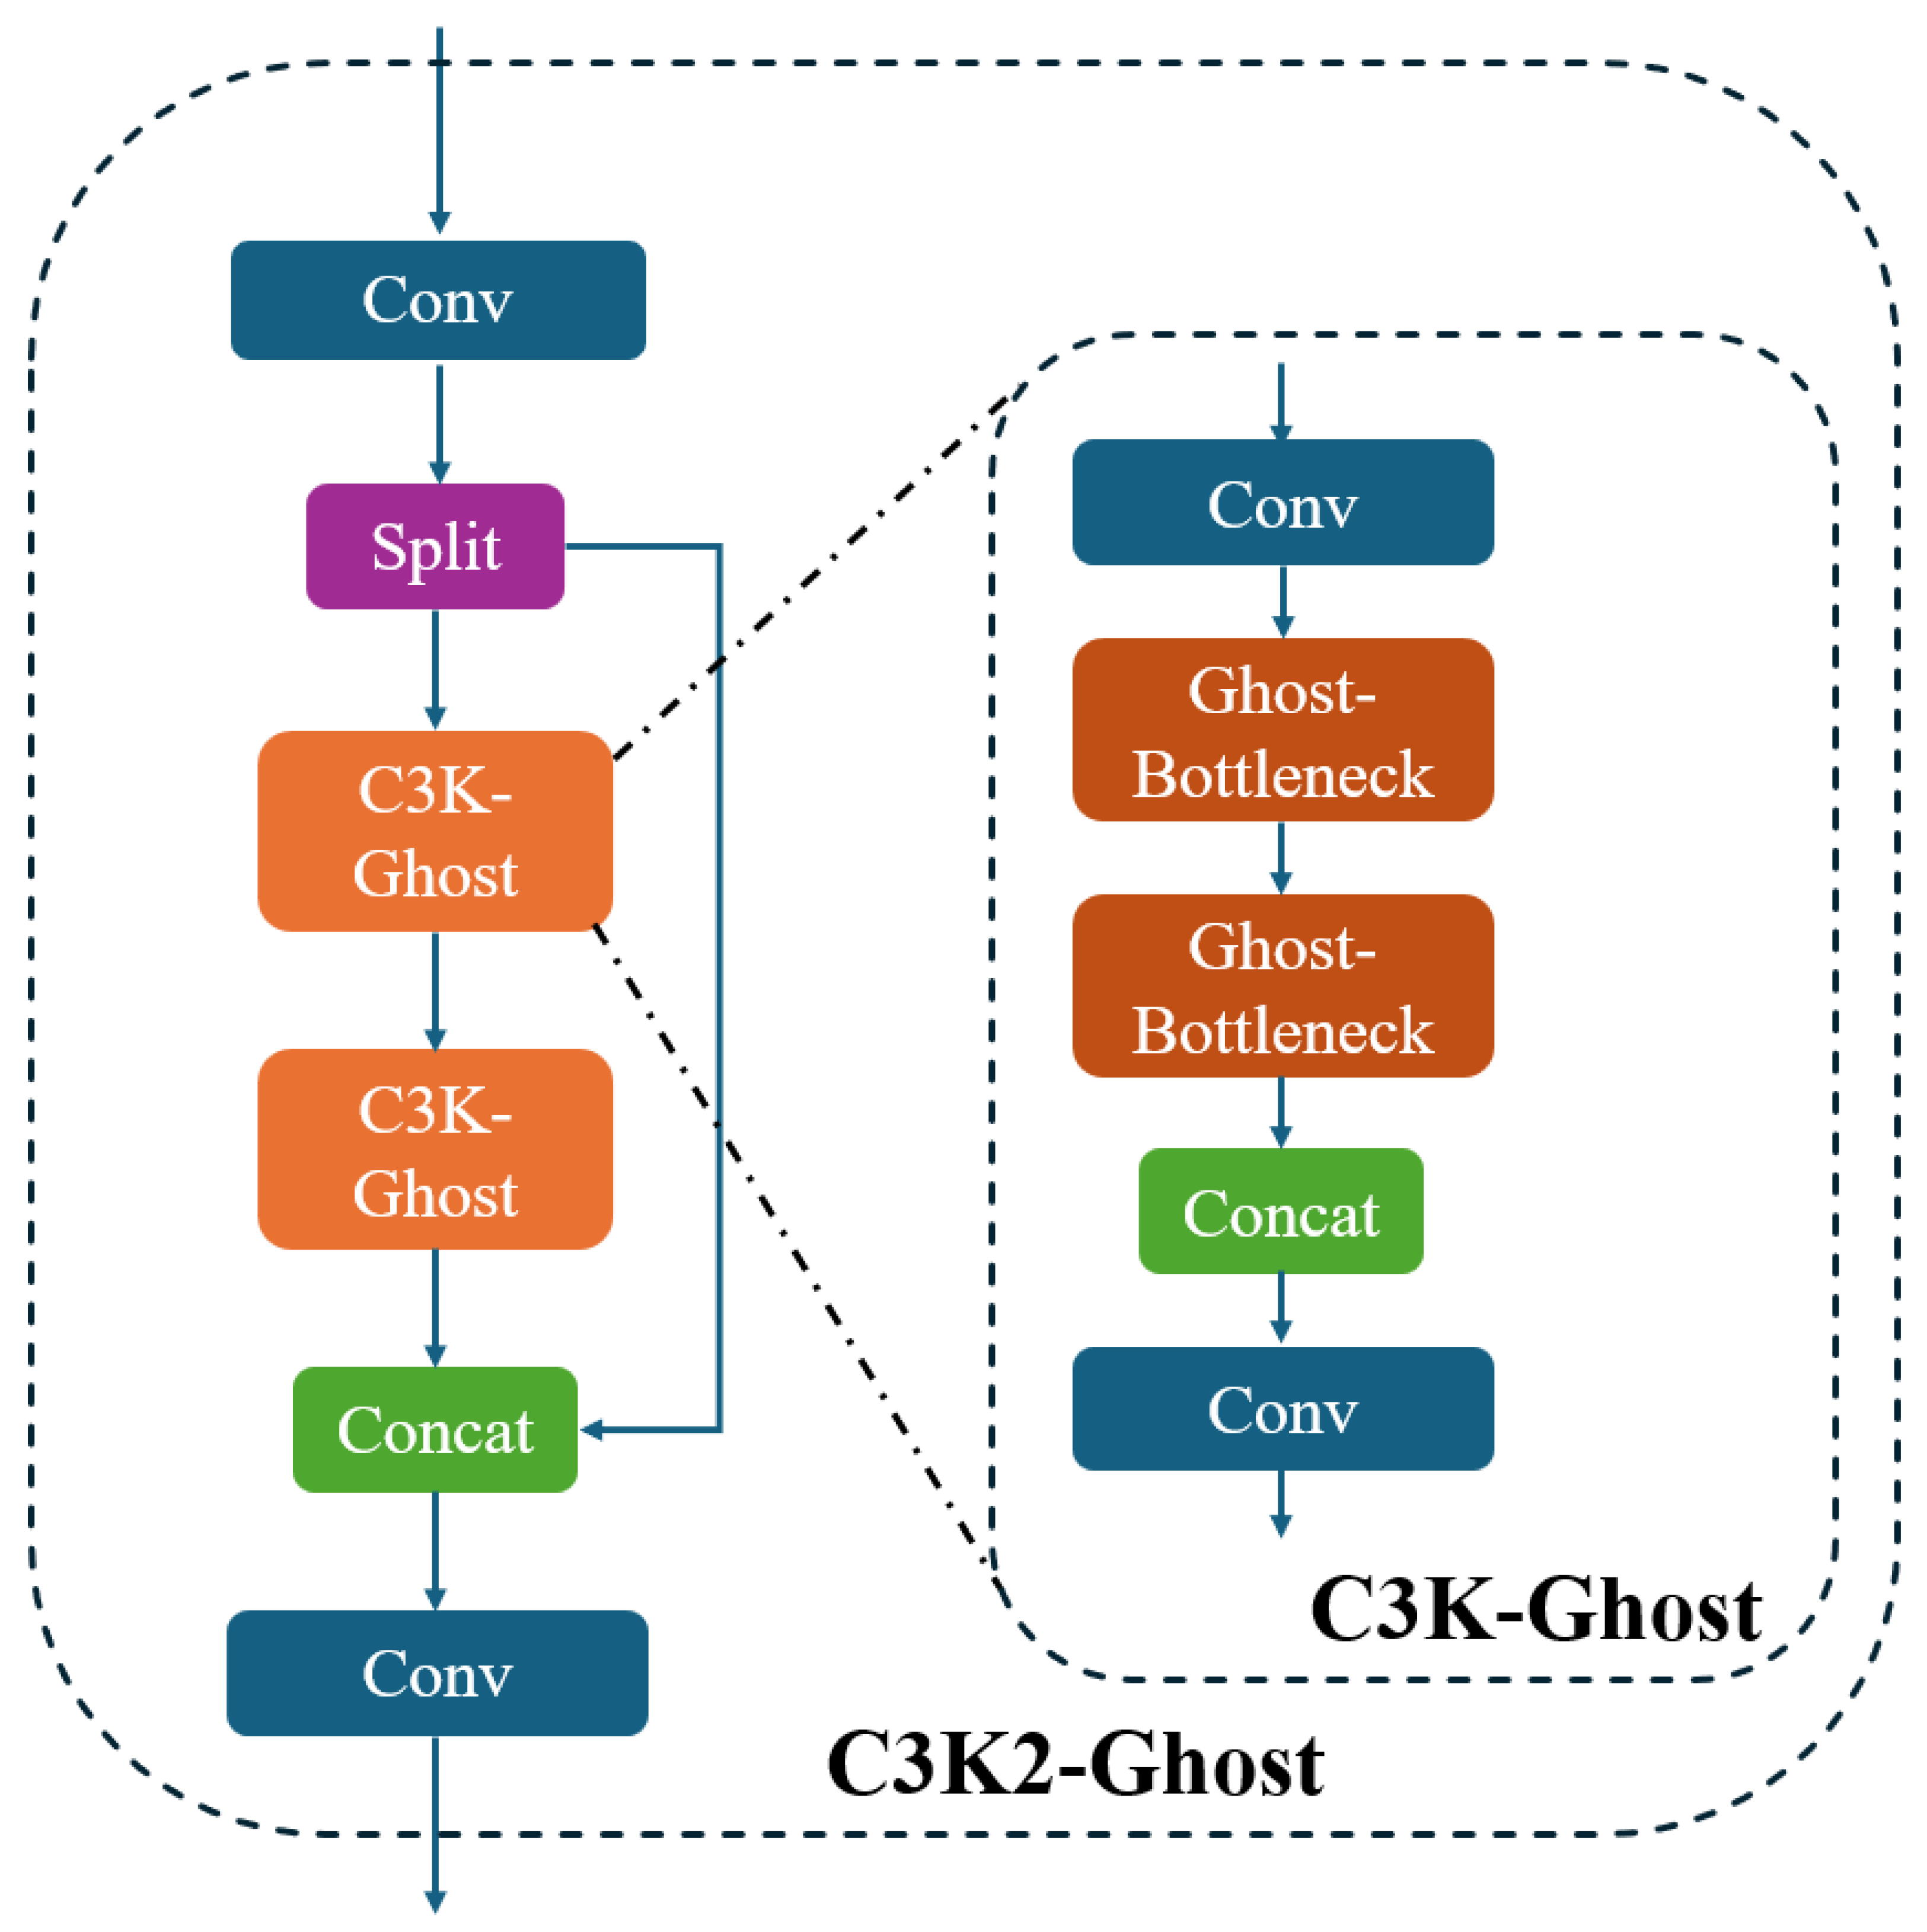
In YOLOv5, the C3K2 module has been widely used for deep feature extraction. Its design is based on a Cross-Stage Partial Network (CSPNet), which splits the input feature map into two parts: one part bypasses heavy computation, while the other passes through a series of bottleneck layers for hierarchical feature learning. The two parts are then concatenated along the channel dimension. This structure improves gradient propagation, reduces redundancy, and enables efficient multi-scale feature fusion [37,38]. However, traditional bottleneck blocks rely heavily on standard convolutions, which bring many parameters and high computational costs. This becomes a critical bottleneck when deploying models in edge or mobile environments. To solve this issue, we introduce GhostConv, a lightweight convolution operation that generates more feature maps from fewer computations by using inexpensive linear operations. GhostConv significantly reduces parameters and FLOPs, while preserving core semantic information, making it well suited for real-time applications [39,40].
Based on this idea, we propose the C3K2-Ghost module, which replaces the standard bottleneck units in C3K2 with Ghost bottlenecks. This module retains the structural advantages of C3K2—such as deep feature integration and multi-scale representation—while greatly reducing the computational burden. Importantly, this module is particularly effective for blueberry ripeness detection, which involves recognizing small, densely packed fruits, with subtle color differences across maturity stages. GhostConv can efficiently capture essential edge, texture, and color features that are critical for distinguishing between immature (green), semi-mature (red to purple), and fully ripe (dark blue) blueberries. Meanwhile, the C3K2 structure ensures robust feature extraction, even under challenging conditions such as occlusion, complex background foliage, and varying light. The combination of GhostConv’s efficiency and C3K2’s representational strength enables C3K2-Ghost to strike a balance between a lightweight design and detection precision. As demonstrated in ablation experiments (Model-B and Model-G), this module alone led to both improved accuracy and reduced computational costs. Therefore, C3K2-Ghost provides a strong foundation for real-time, high-performance blueberry ripeness detection, especially on resource-constrained edge devices, its structure is shown in Figure 5.

2.3.2. Efficient Multi-Scale Attention

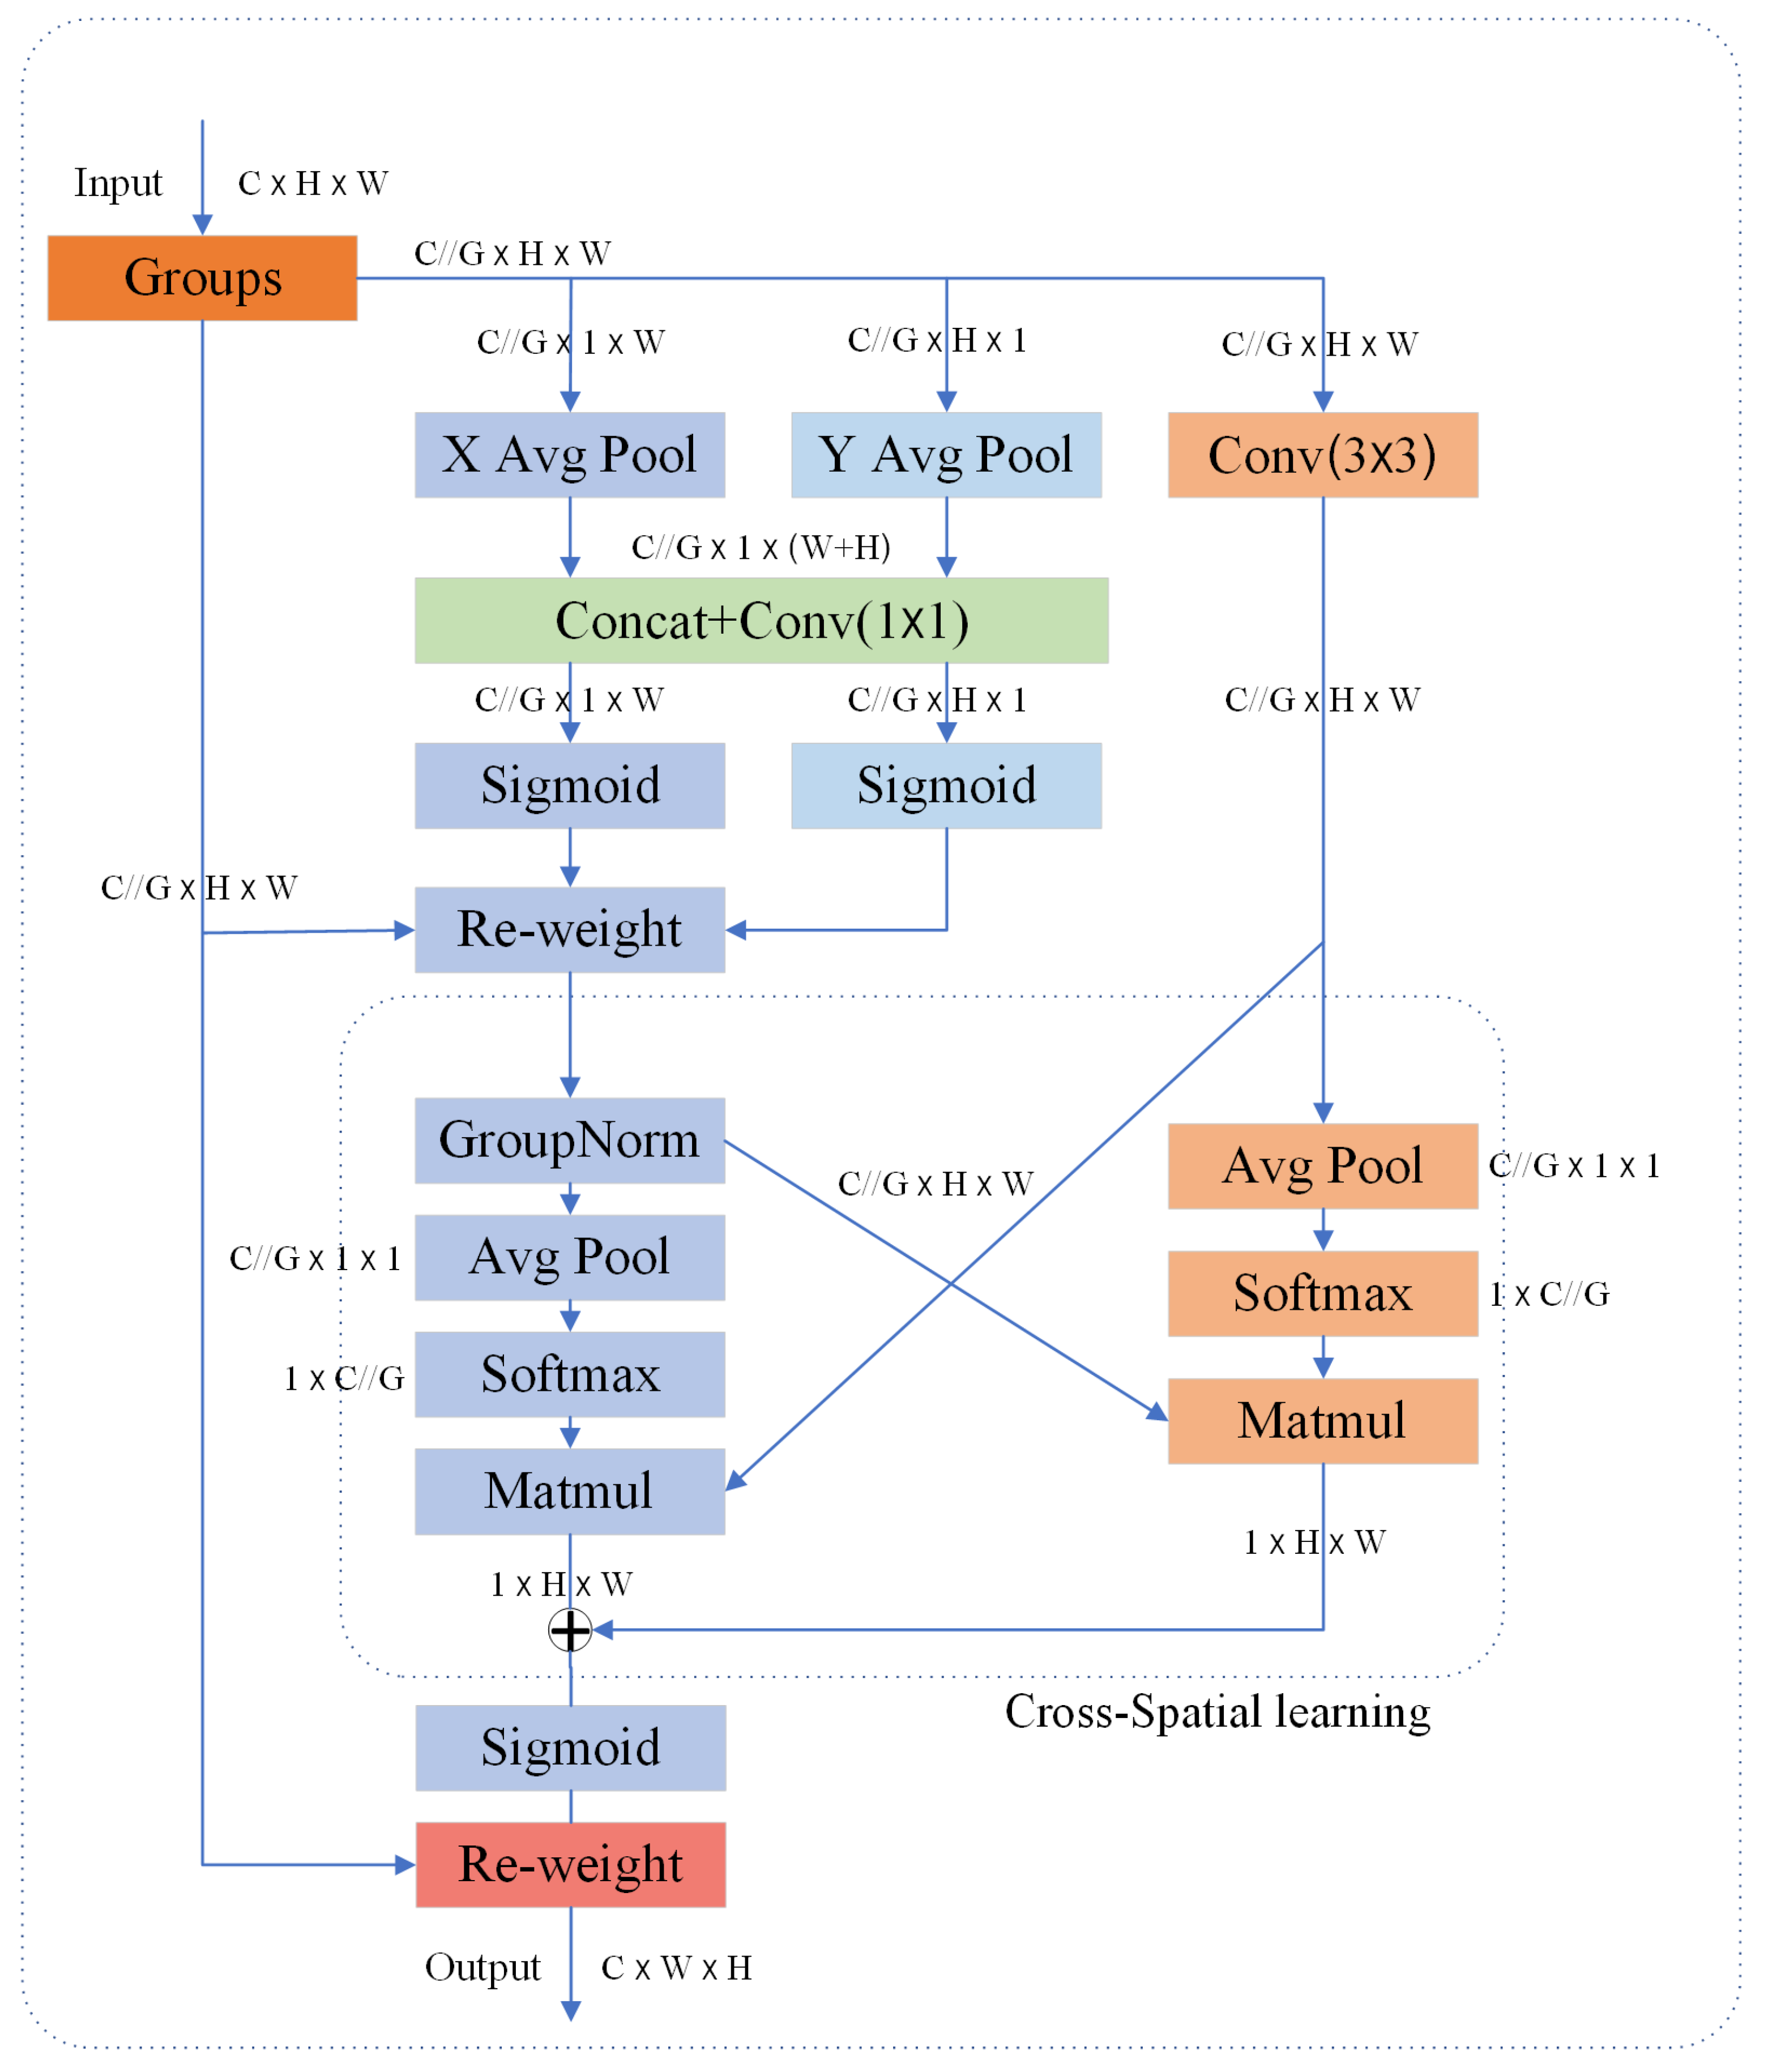
After the first two C2f modules in the backbone network, the EMA (Efficient Multi-scale Attention) mechanism is introduced to enhance the network’s ability to represent features in regions of blueberries with varying maturity levels, thereby improving the joint detection accuracy for blueberry targets and key points, its structure is shown in Figure 6. The EMA module first divides the input feature map into G groups along the channel dimension, reducing computational overhead, while preserving the semantic information within each channel [41]. A multi-branch structure is then employed to process each group, ensuring the spatial semantics are evenly distributed. This structure consists of two 1 × 1 convolution branches and two 3 × 3 convolution branches. The 1 × 1 branches apply global average pooling along the horizontal and vertical spatial dimensions, enabling the capture of global contextual information. In contrast, the 3 × 3 branches utilize standard convolutions to extract local spatial features at multiple scales. The outputs from both branches are then fused through a cross-spatial learning mechanism, which builds interdependencies between channels and spatial positions, resulting in enriched feature representations. For each group of fused features, a two-dimensional global average pooling operation is further applied to compress spatial information into the channel dimension, as defined by
z c = 1 H × W j H   i W   x c i , j
Here, z c denotes the output of the c -th channel after pooling, and x c ( i , j ) represents the pixel value at position ( i , j ) in the c -th channel of the input feature map. Finally, two spatial attention weights are generated for each group using the Sigmoid function to capture pairwise relationships among pixels, significantly enhancing the global context modeling for target regions.

2.3.3. SEAMHead

Unlike standard YOLO detection heads, which often struggle with small or scale-variant targets, due to limited feature aggregation and insufficient semantic context, the proposed SEAM module introduces a multi-branch attention structure that captures fine-grained and hierarchical features. It uses depthwise separable convolutions and multi-head attention to enhance sensitivity to subtle changes in size and appearance, enabling more precise localization and classification of blueberries at different maturity stages. This is particularly beneficial in real-world orchard conditions, where fruits are often overlapping or partially occluded.
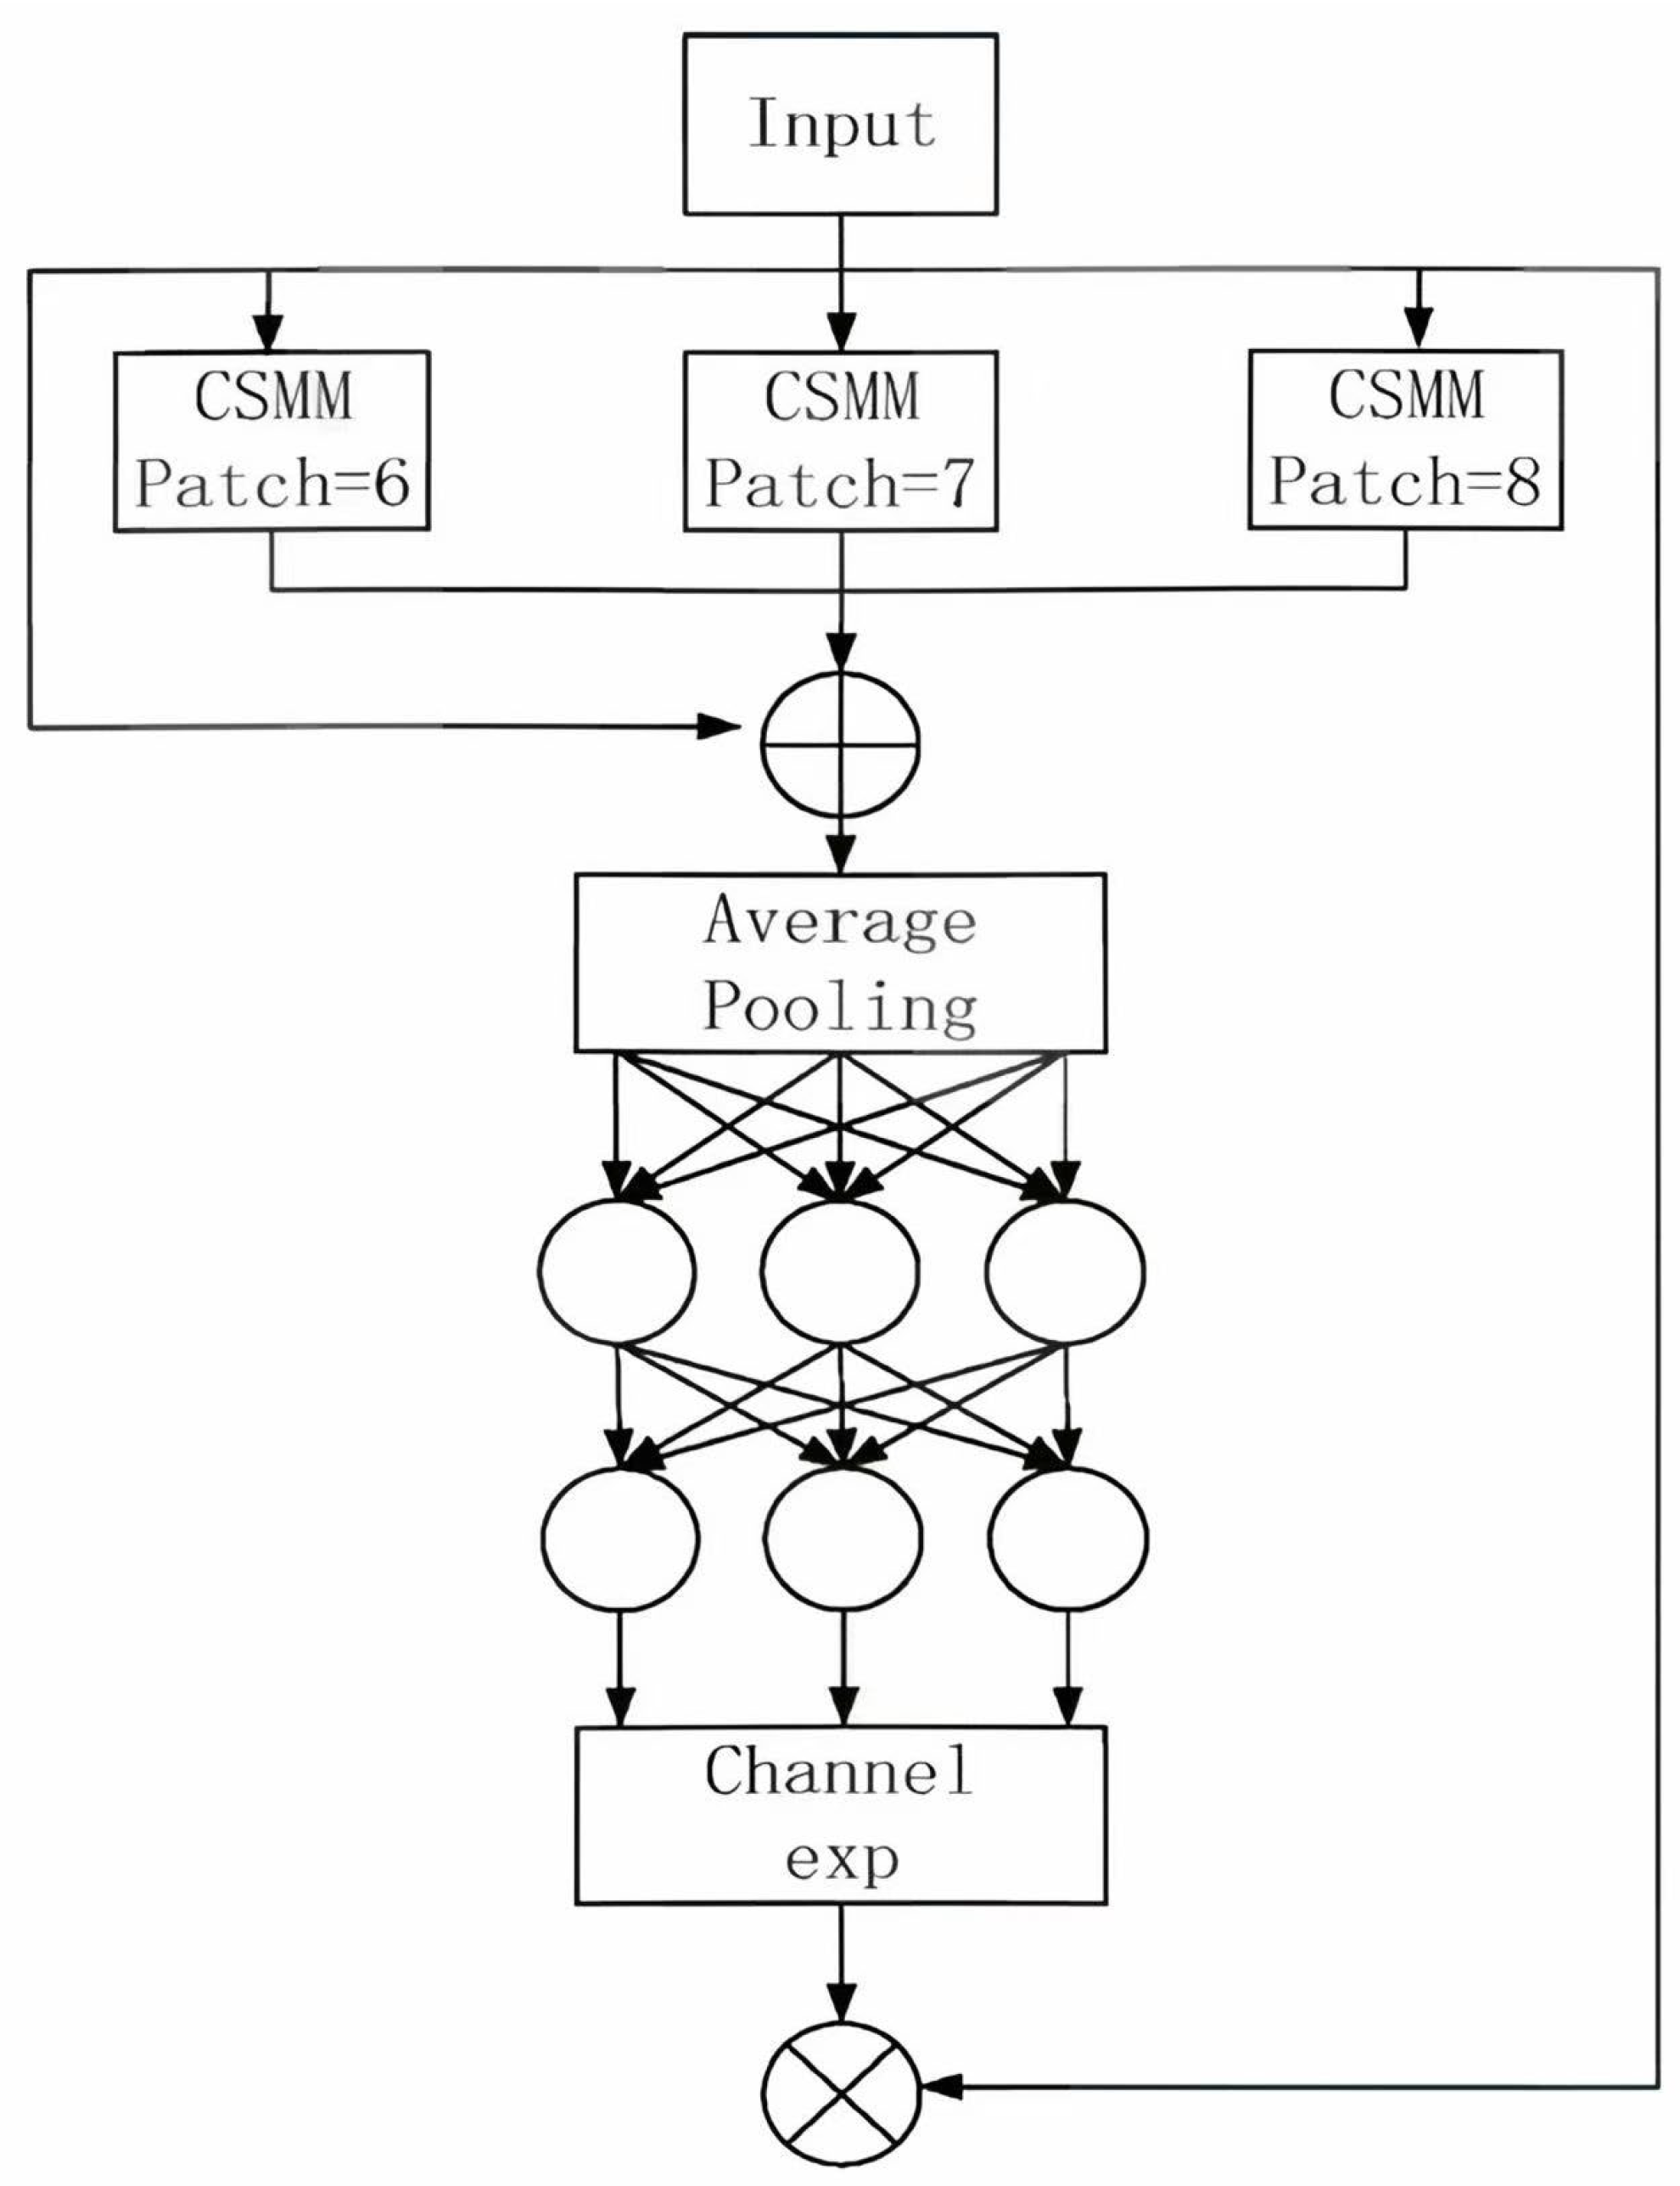
To enhance detection performance under complex conditions, the original detection head of YOLOv11 is replaced with the SEAM (Synthetic Environment Attention Module) for blueberry maturity detection [42], its structure is shown in Figure 7. This module demonstrates superior robustness and accuracy, particularly in scenarios involving occlusion and multi-scale variation. Since blueberry maturity is influenced by color shifts, morphological changes, and environmental lighting conditions, the multi-head attention mechanism embedded in SEAM effectively captures these fine-grained features, enhancing the model’s sensitivity to maturity-related cues. SEAM integrates a multi-head attention mechanism with depthwise separable convolution to balance detection accuracy and computational efficiency. The attention mechanism enables the model to focus on key object regions from multiple subspaces, suppress background interference, and improve the modeling of critical details. The backbone of SEAM adopts a “depthwise convolution + pointwise convolution” structure, which significantly reduces the number of parameters, while retaining multi-scale information. However, depthwise convolutions alone may neglect meaningful inter-channel dependencies. To address this, SEAM utilizes 1×1 pointwise convolutions to aggregate the outputs of the depthwise convolutions, thereby reinforcing channel interactions. A two-layer fully connected network is further employed to model and enhance channel-wise relationships, improving the model’s robustness in cluttered scenes. In handling occlusion, SEAM explicitly models occluded regions to minimize feature loss. Additionally, it introduces an exponential normalization technique that maps output values from [0, 1] to [1, e]), increasing the model’s tolerance to positional deviations. The final attention signal generated by SEAM is applied to the feature maps, enhancing the detection head’s responsiveness to target regions. Consequently, SEAM significantly improves both accuracy and robustness in blueberry maturity detection, especially under challenging conditions such as partial occlusion and scale variation.

2.4. Experimental Environment

In the experiments, Ubuntu 18.04 was used as the operating system, PyTorch was used as the deep learning framework, an experimental platform was set up, and Python 3.9.13 and torch-2.1.1 + cuda11.8 were used. The CPU model was an Intel(R) Xeon(R) Silver 4214R 2. 40 GHz. The graphics card model was an NVIDIA GeForce RTX 3090ti, 24 GB. The detailed hyperparameters of the experiment are shown in Table 1. The hyperparameter settings were determined through a combination of prior literature experience, the default configurations in YOLO-based models, and empirical pre-experiments. Specifically, 200 epochs were used to ensure full convergence of the network under different module configurations. A batch size of 16 was chosen to balance GPU memory usage and training stability. The stochastic gradient descent (SGD) optimizer, with a momentum of 0.937 and a weight decay of 5 × 10⁻⁴, was selected for its stable convergence behavior in detection tasks. The learning rate was fixed at 0.01 based on pretests showing that larger learning rates led to divergence, while smaller ones slowed convergence.
Mosaic data augmentation was employed with a probability of 1.0 during early training, to enhance the model’s generalization to diverse backgrounds and object scales. Following common practice in YOLO training pipelines, it was disabled in the final ten epochs to allow the model to focus on learning the original data distribution. The input image size was set to 640 × 640 pixels, which has been widely adopted in YOLOv5–YOLOv8 models as a compromise between accuracy and computational efficiency. Eight data loader workers were used to ensure sufficient throughput during training.

2.5. Evaluation Criteria

The detection performance of YOLOv11 and its improved model in various categories was evaluated using composite metrics including Recall, Precision, Average Precision (AP), and mean Average Precision (mAP). Specifically, True Positive (TP) refers to the number of samples from the target category (e.g., ripe blueberries) that were correctly identified by the model. False Positive (FP) indicates the number of samples that did not belong to the target category but were incorrectly classified as such by the model. False Negative (FN) represents the number of samples from the target category that the model failed to detect. Recall measures the proportion of actual target samples that were correctly detected by the model, reflecting the model’s ability to avoid missed detections. Precision indicates the proportion of samples predicted as the target category that were correct, reflecting the model’s ability to avoid false alarms. Average Precision (AP) summarizes the model’s precision performance across different recall levels for each category. The mean Average Precision (mAP) is the average of the AP values over all categories, representing the overall detection accuracy of the model. Besides detection accuracy, this study also evaluated the model’s efficiency and lightweight characteristics by considering the number of model parameters and floating-point operations (FLOPs). These metrics are especially important for real-time applications on resource-constrained edge devices, where computational cost and model size directly affect inference speed and energy consumption.
P r e c i s i o n = T P T P + F P
R e c a l l = T P T P + F N
A P = 0 1   P R d R
m A P = i = 1 N   A P i N

3. Experimental Part

3.1. Before and After the Experiment

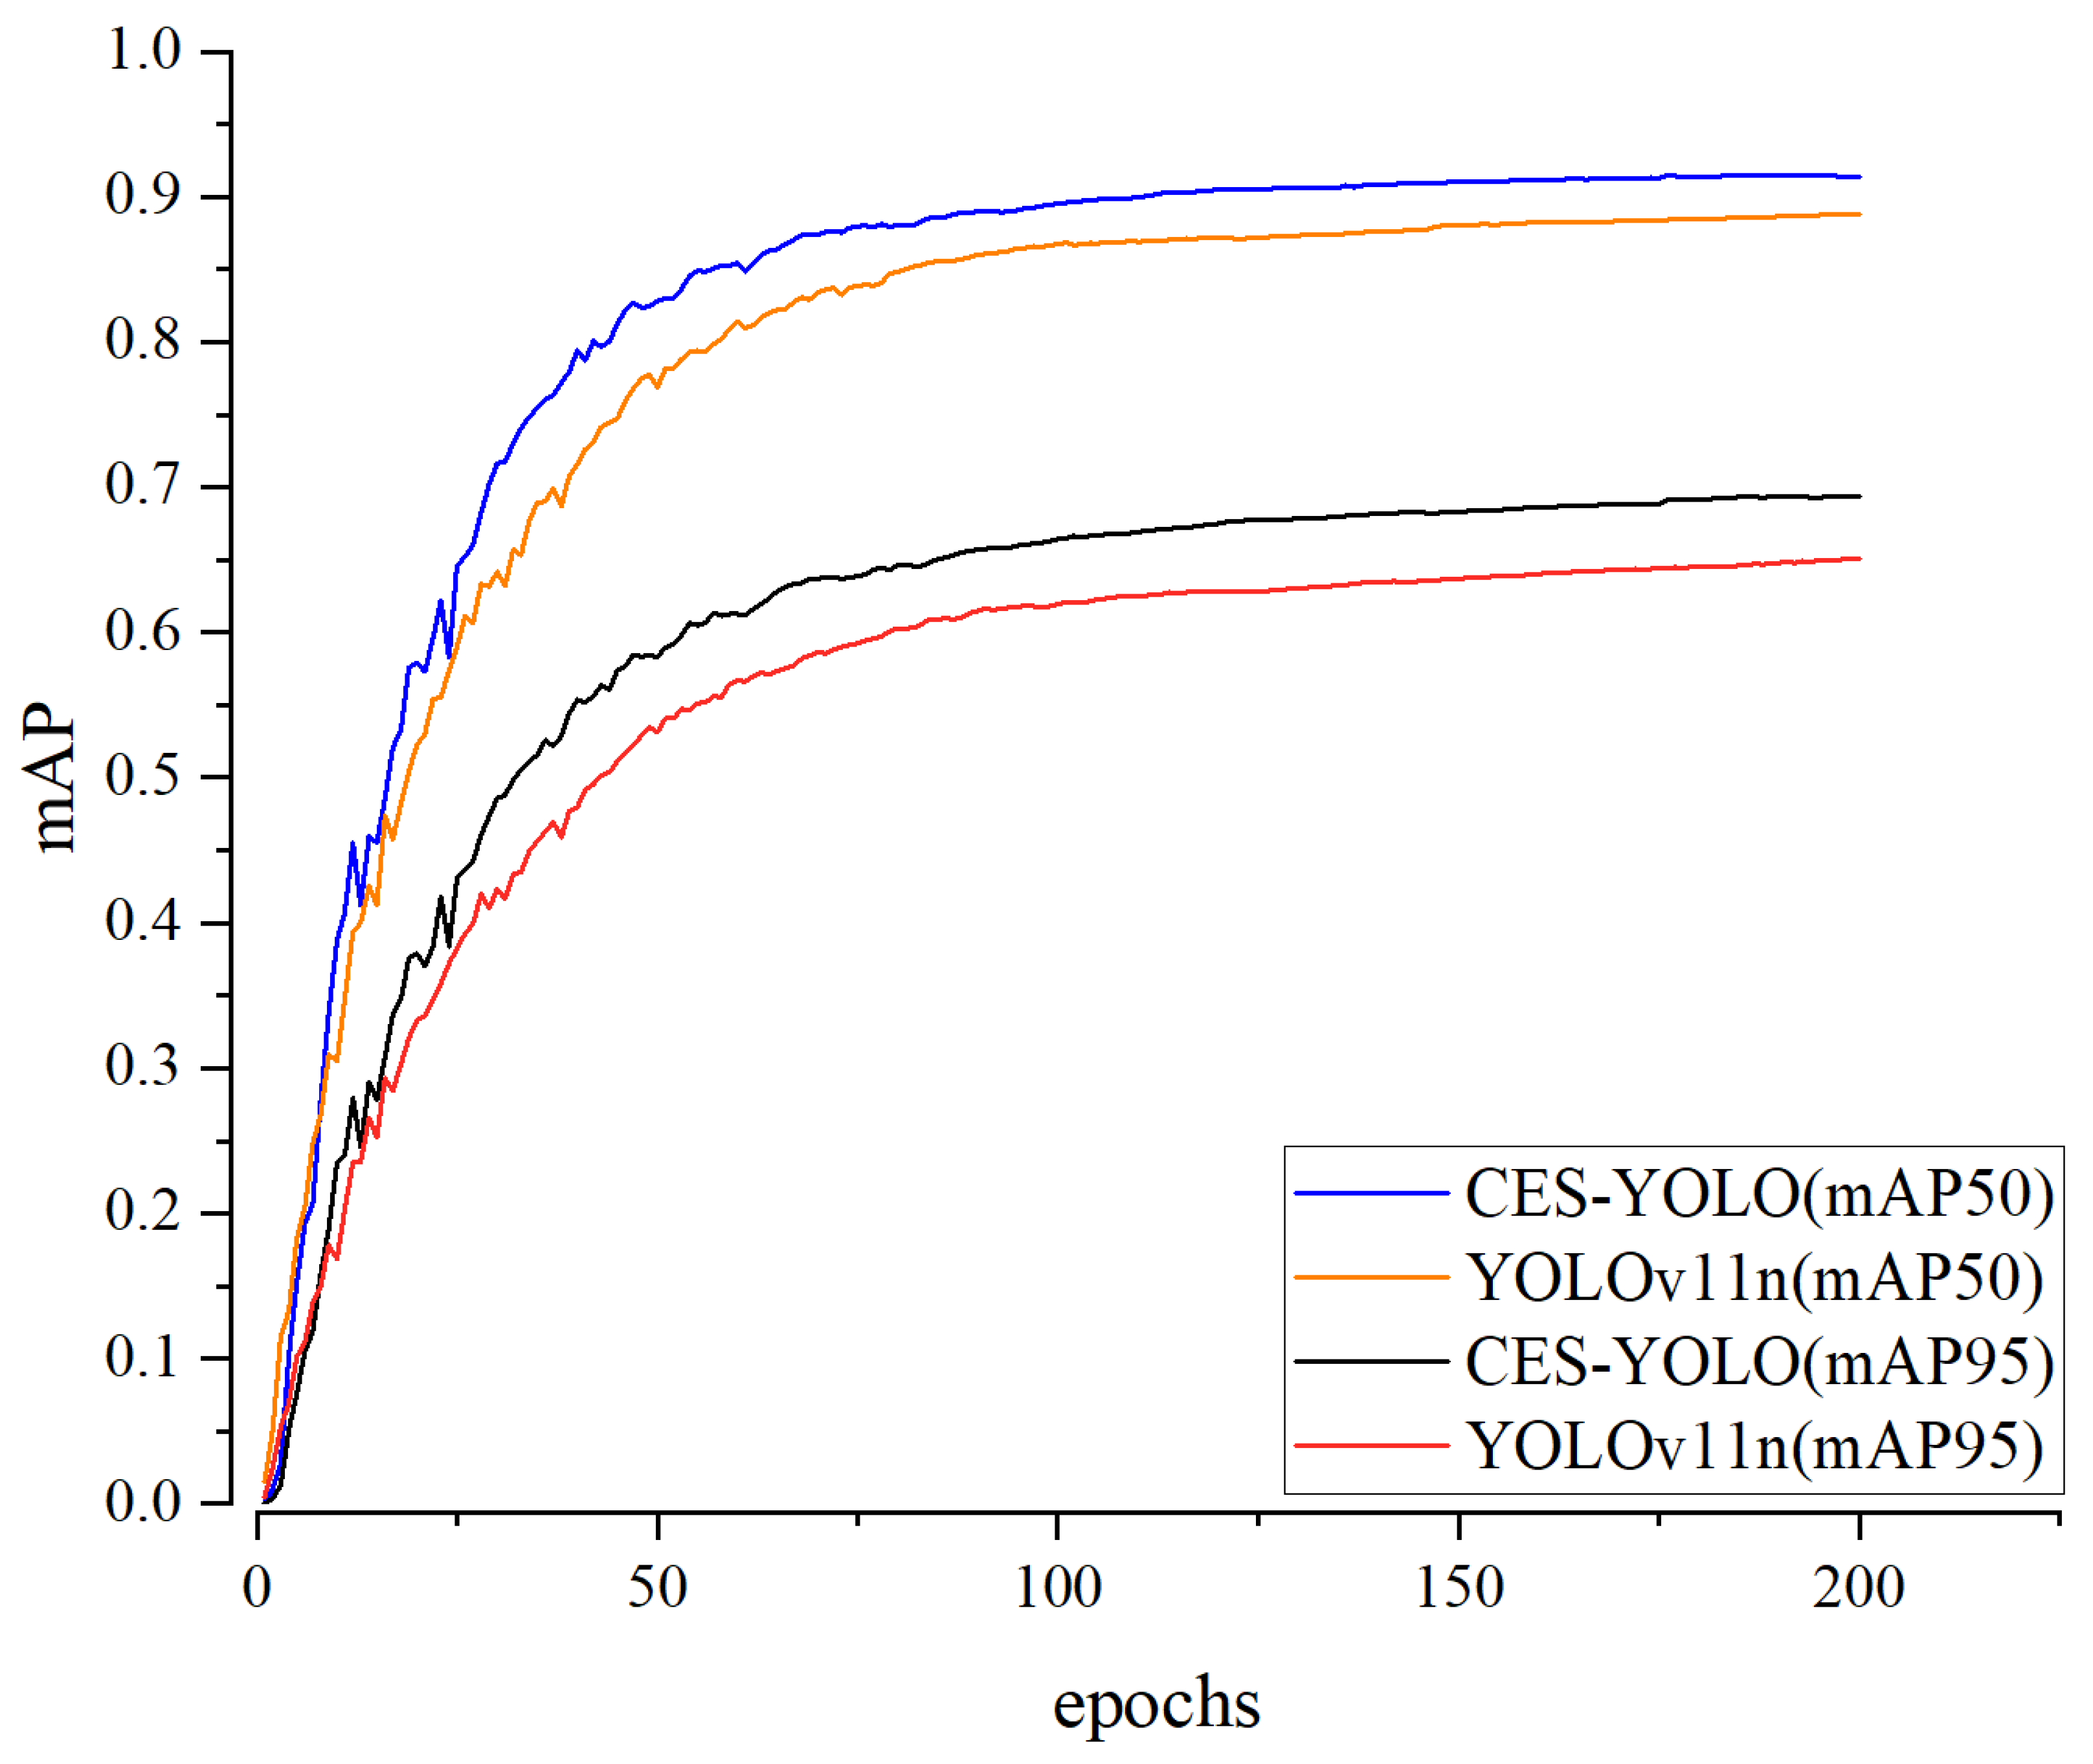
In this study, we systematically evaluated the impact of three modules, namely the C3K2-Ghost module, SEAM attention mechanism, and EMA Head, on the detection performance of the model by designing a series of ablation experiments (Model-A to Model-H). The experimental results show that each module played a positive role in improving the model’s precision, recall rate, and detection effect. Figure 8 shows a comparison of before and after improvement.
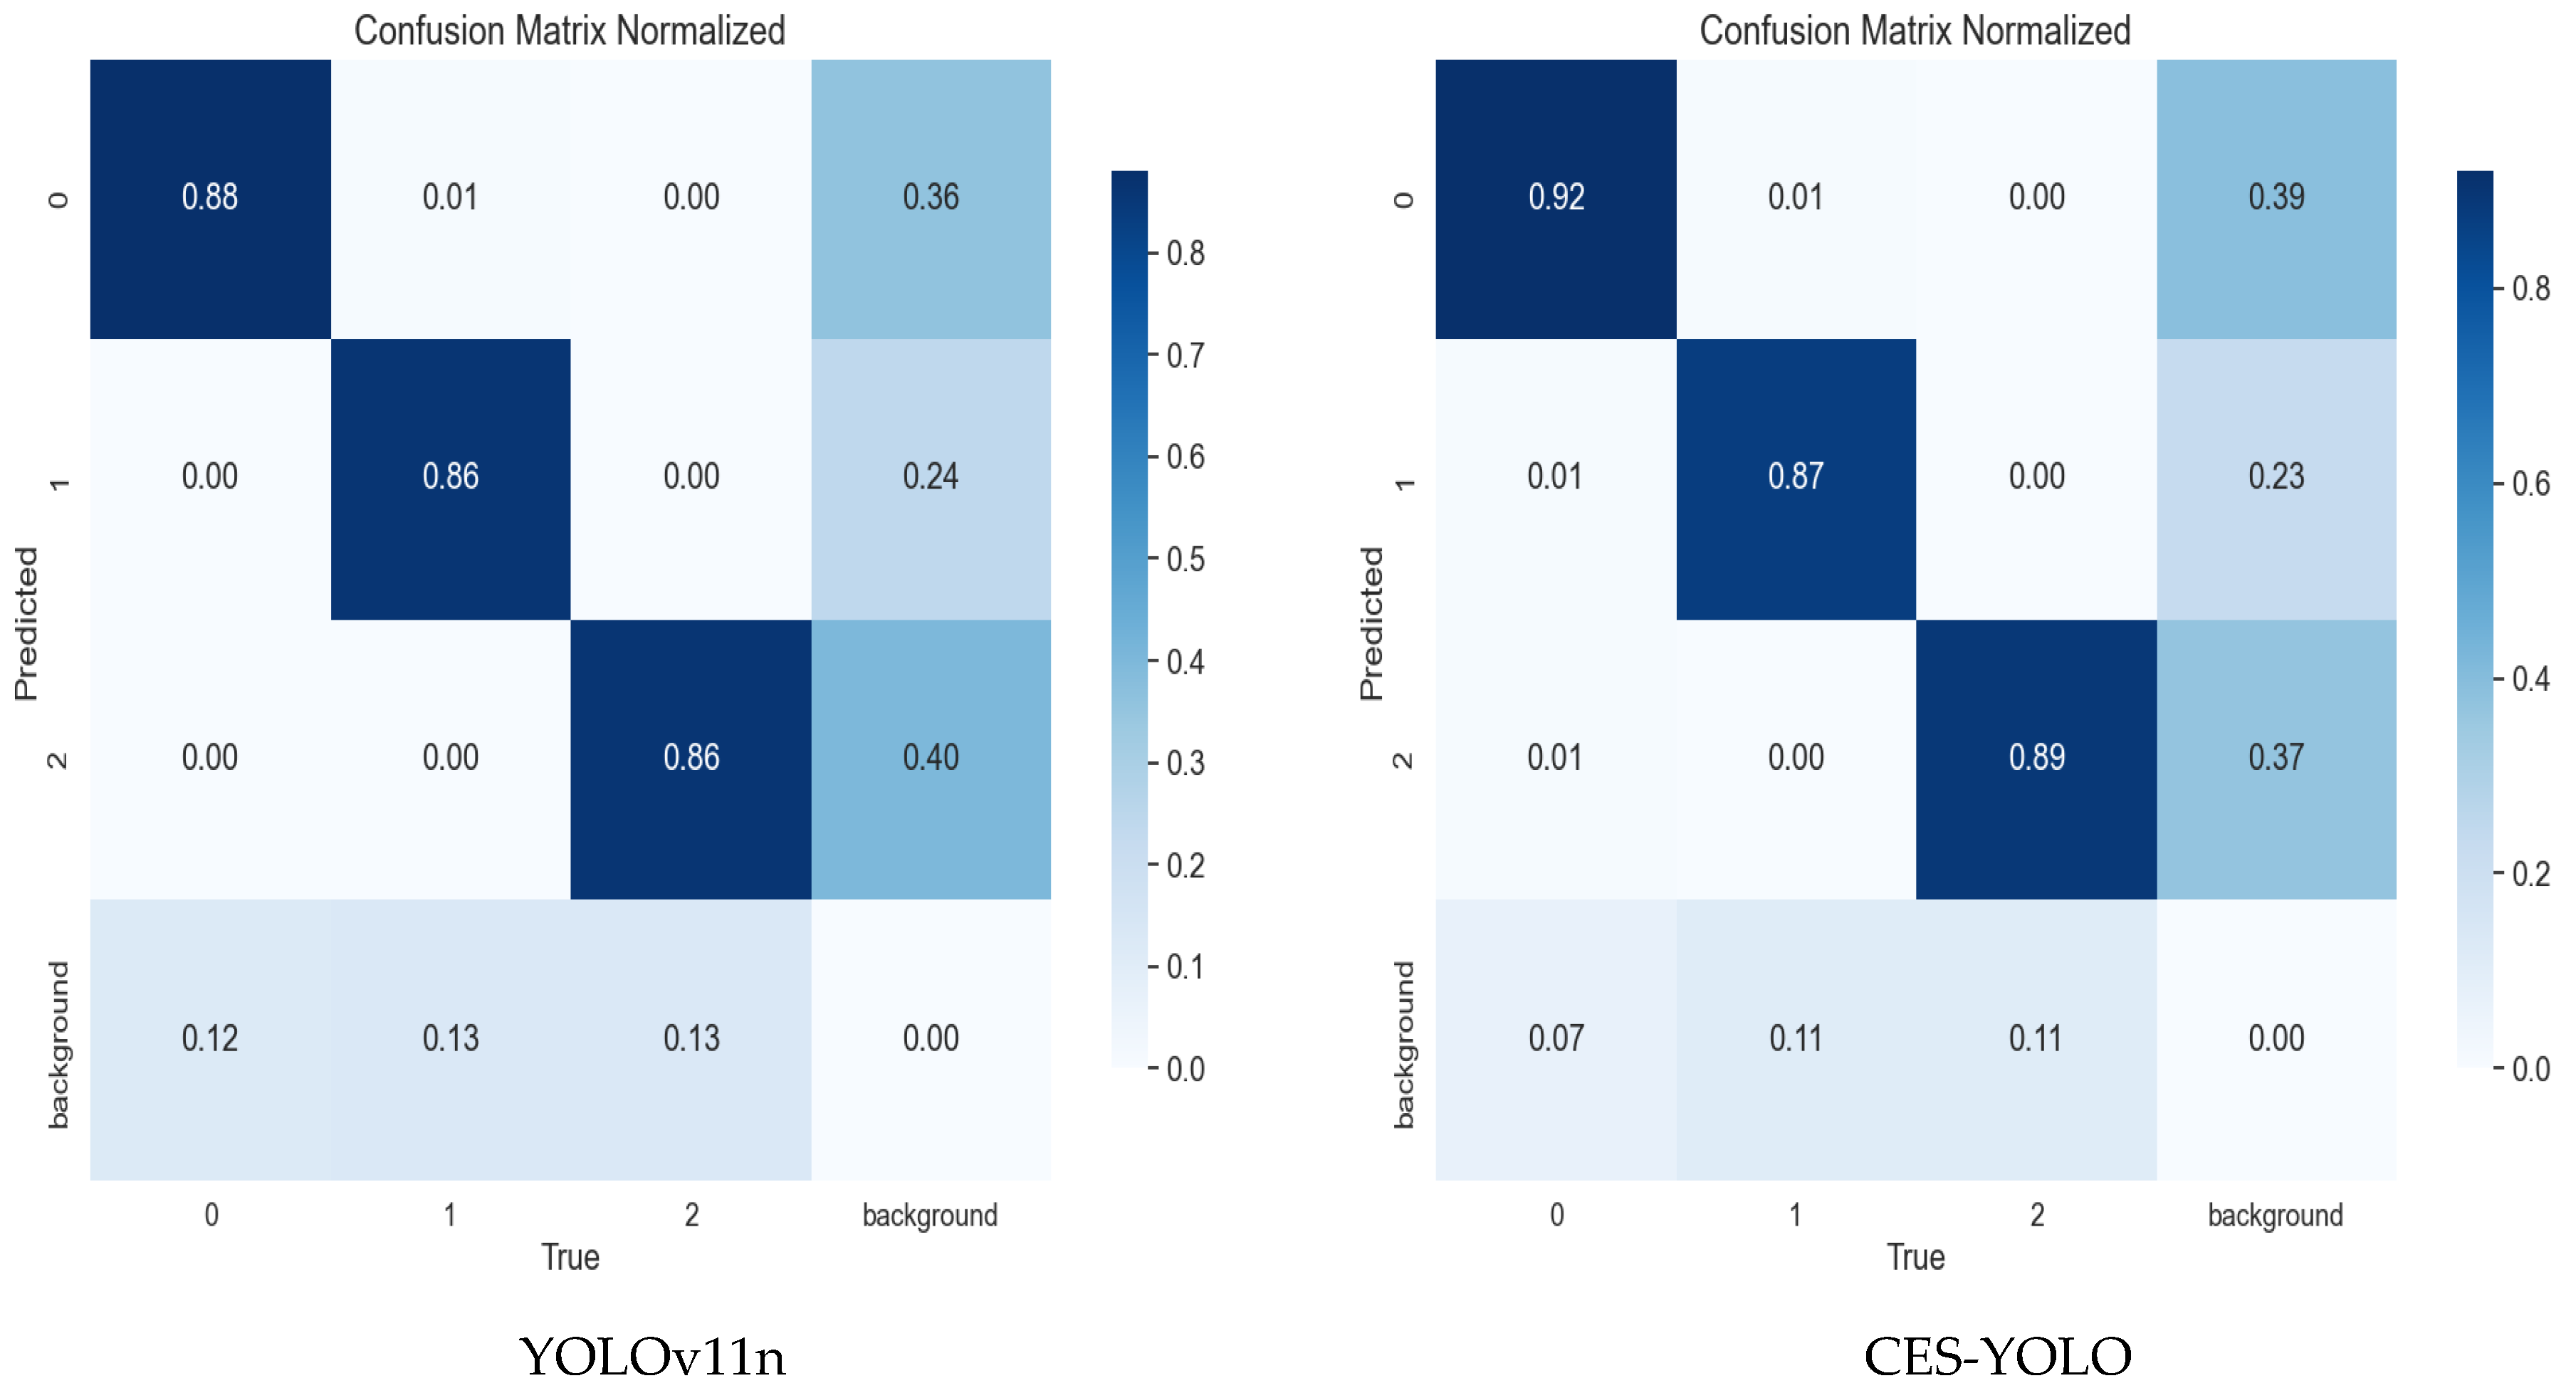
To further evaluate the classification performance of the proposed CES-YOLO model, normalized confusion matrices were compared against those of the baseline YOLOv11n, as illustrated in Figure 9. The results reveal that CES-YOLO exhibited superior accuracy across all blueberry ripeness stages. Specifically, CES-YOLO achieved a higher true positive rate for class 0 (immature) with 0.92, compared to 0.88 for YOLOv11n. Similar improvements were observed for class 1 (semi-ripe) and class 2 (fully ripe), where CES-YOLO attained 0.87 and 0.89, respectively, while YOLOv11n recorded 0.66 and 0.86. Additionally, CES-YOLO demonstrated reduced misclassification rates for background interference, as evidenced by a lower background confusion (e.g., background predicted as class 0 reduced from 0.12 to 0.07). These findings indicate that CES-YOLO not only improves the precision of ripeness classification, but also enhances robustness against background noise and inter-class similarity. The refined feature extraction and attention mechanisms embedded in CES-YOLO contribute significantly to this performance gain.

3.2. Ablation Experiment

Table 2 presents detailed results from the ablation experiments, which evaluated the performance, parameter count, and computational cost of the CES-YOLO model under different combinations of the proposed modules. Starting from the baseline model (Model-A), three architectural enhancements were sequentially introduced: the C3K2-Ghost module, the EAM attention mechanism, the SEAMHead, and the EMA Head. The ablation design isolated each module’s impact and also explored their combined effects, to assess performance gains and efficiency improvements.
Model-B, which incorporated the C3K2-Ghost module into the baseline, showed that this enhancement improved both the accuracy (mAP50 from 88.88% to 89.49%, mAP95 from 65.13% to 65.92%) and efficiency (parameters reduced from 2.6 M to 2.2 M; FLOPs from 6.2 G to 5.5 G). This confirms that the module effectively enhances feature representation, while significantly reducing model complexity. Model-C, integrating only the EAM attention mechanism, yielded mAP50 and mAP95 values of 89.75% and 66.03%, respectively, with no increase in parameters or FLOPs. This indicates that EAM improves the model’s ability to focus on salient regions, particularly enhancing robustness in complex visual environments. Model-D, using the EMA Head, achieved an mAP50 of 89.04% and mAP95 of 65.38%, while reducing parameters to 2.5 M and FLOPs to 5.9 G. These results suggest that this module strengthens feature fusion and small-object detection performance, with a low computational overhead. For the combined configurations, additional improvements were observed:
Model-E (C3K2-Ghost + EAM) achieved mAP50 = 90.06% and mAP95 = 67.13%, demonstrating the complementary effect of structure simplification and attention enhancement. Model-F (EAM + EMA) yielded the highest Recall (84.05%) and notable accuracy (mAP50 = 89.92%, mAP95 = 66.64%), showing that combining attention and a refined detection head enhanced the detection stability. Model-G (C3K2-Ghost + EMA) achieved a strong balance of performance and efficiency (mAP50 = 91.04%, mAP95 = 68.97%, Precision and Recall improved significantly; parameters reduced to 2.1 M, FLOPs to 5.0 G). The final Model-H, integrating all three modules, delivered the best overall performance: mAP50 = 91.22%, mAP95 = 69.18%, Precision = 89.21%, and Recall = 85.23%. Compared to the baseline, it achieved a 2.34% improvement in mAP50 and a 4.05% gain in mAP95, while reducing parameters and FLOPs to 2.1 M and 5.0 G, respectively. These results confirm the effectiveness and synergy of the proposed modules. In conclusion, the C3K2-Ghost module enhances feature extraction while reducing model size, the EAM attention mechanism strengthens the model’s focus on critical regions, and the EMA Head improves the semantic fusion and robustness of the detection head. The integration of all three modules leads to a model that is both highly accurate and lightweight, making CES-YOLO highly suitable for deployment on resource-constrained edge devices.
Figure 10 shows a curve comparison diagram of the ablation experiment process in terms of Precision, Recall, mAP0.5, and mAP0.95 metrics.
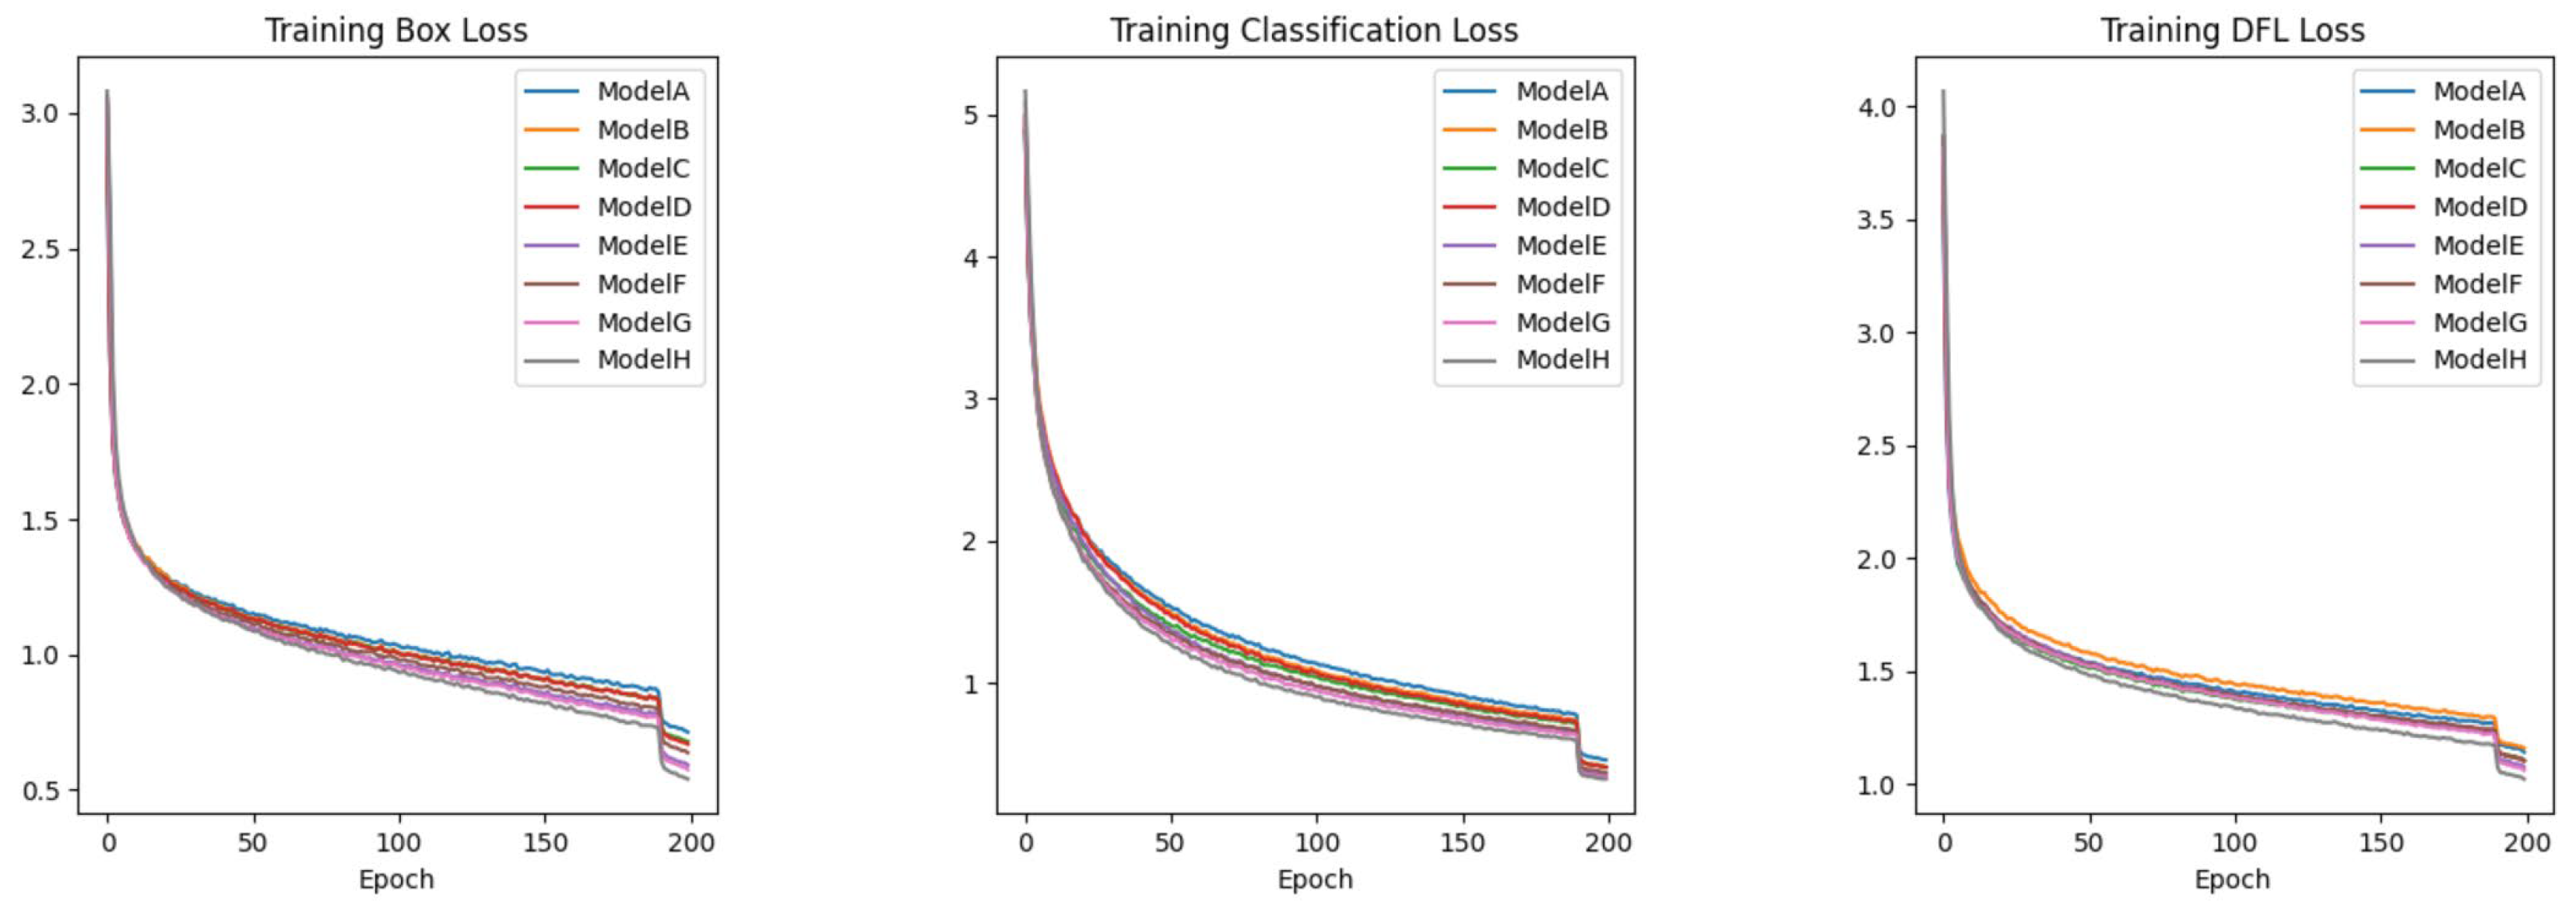
Figure 11 shows a comparison chart of the ablation experiments for three types of losses of the YOLO model during the training process. The stepwise decline in the last 10 epochs was the result of turning off mosaics to fit the real scene, and it can be clearly seen that the loss is in a decreasing state.

3.3. Model Comparison Experiment

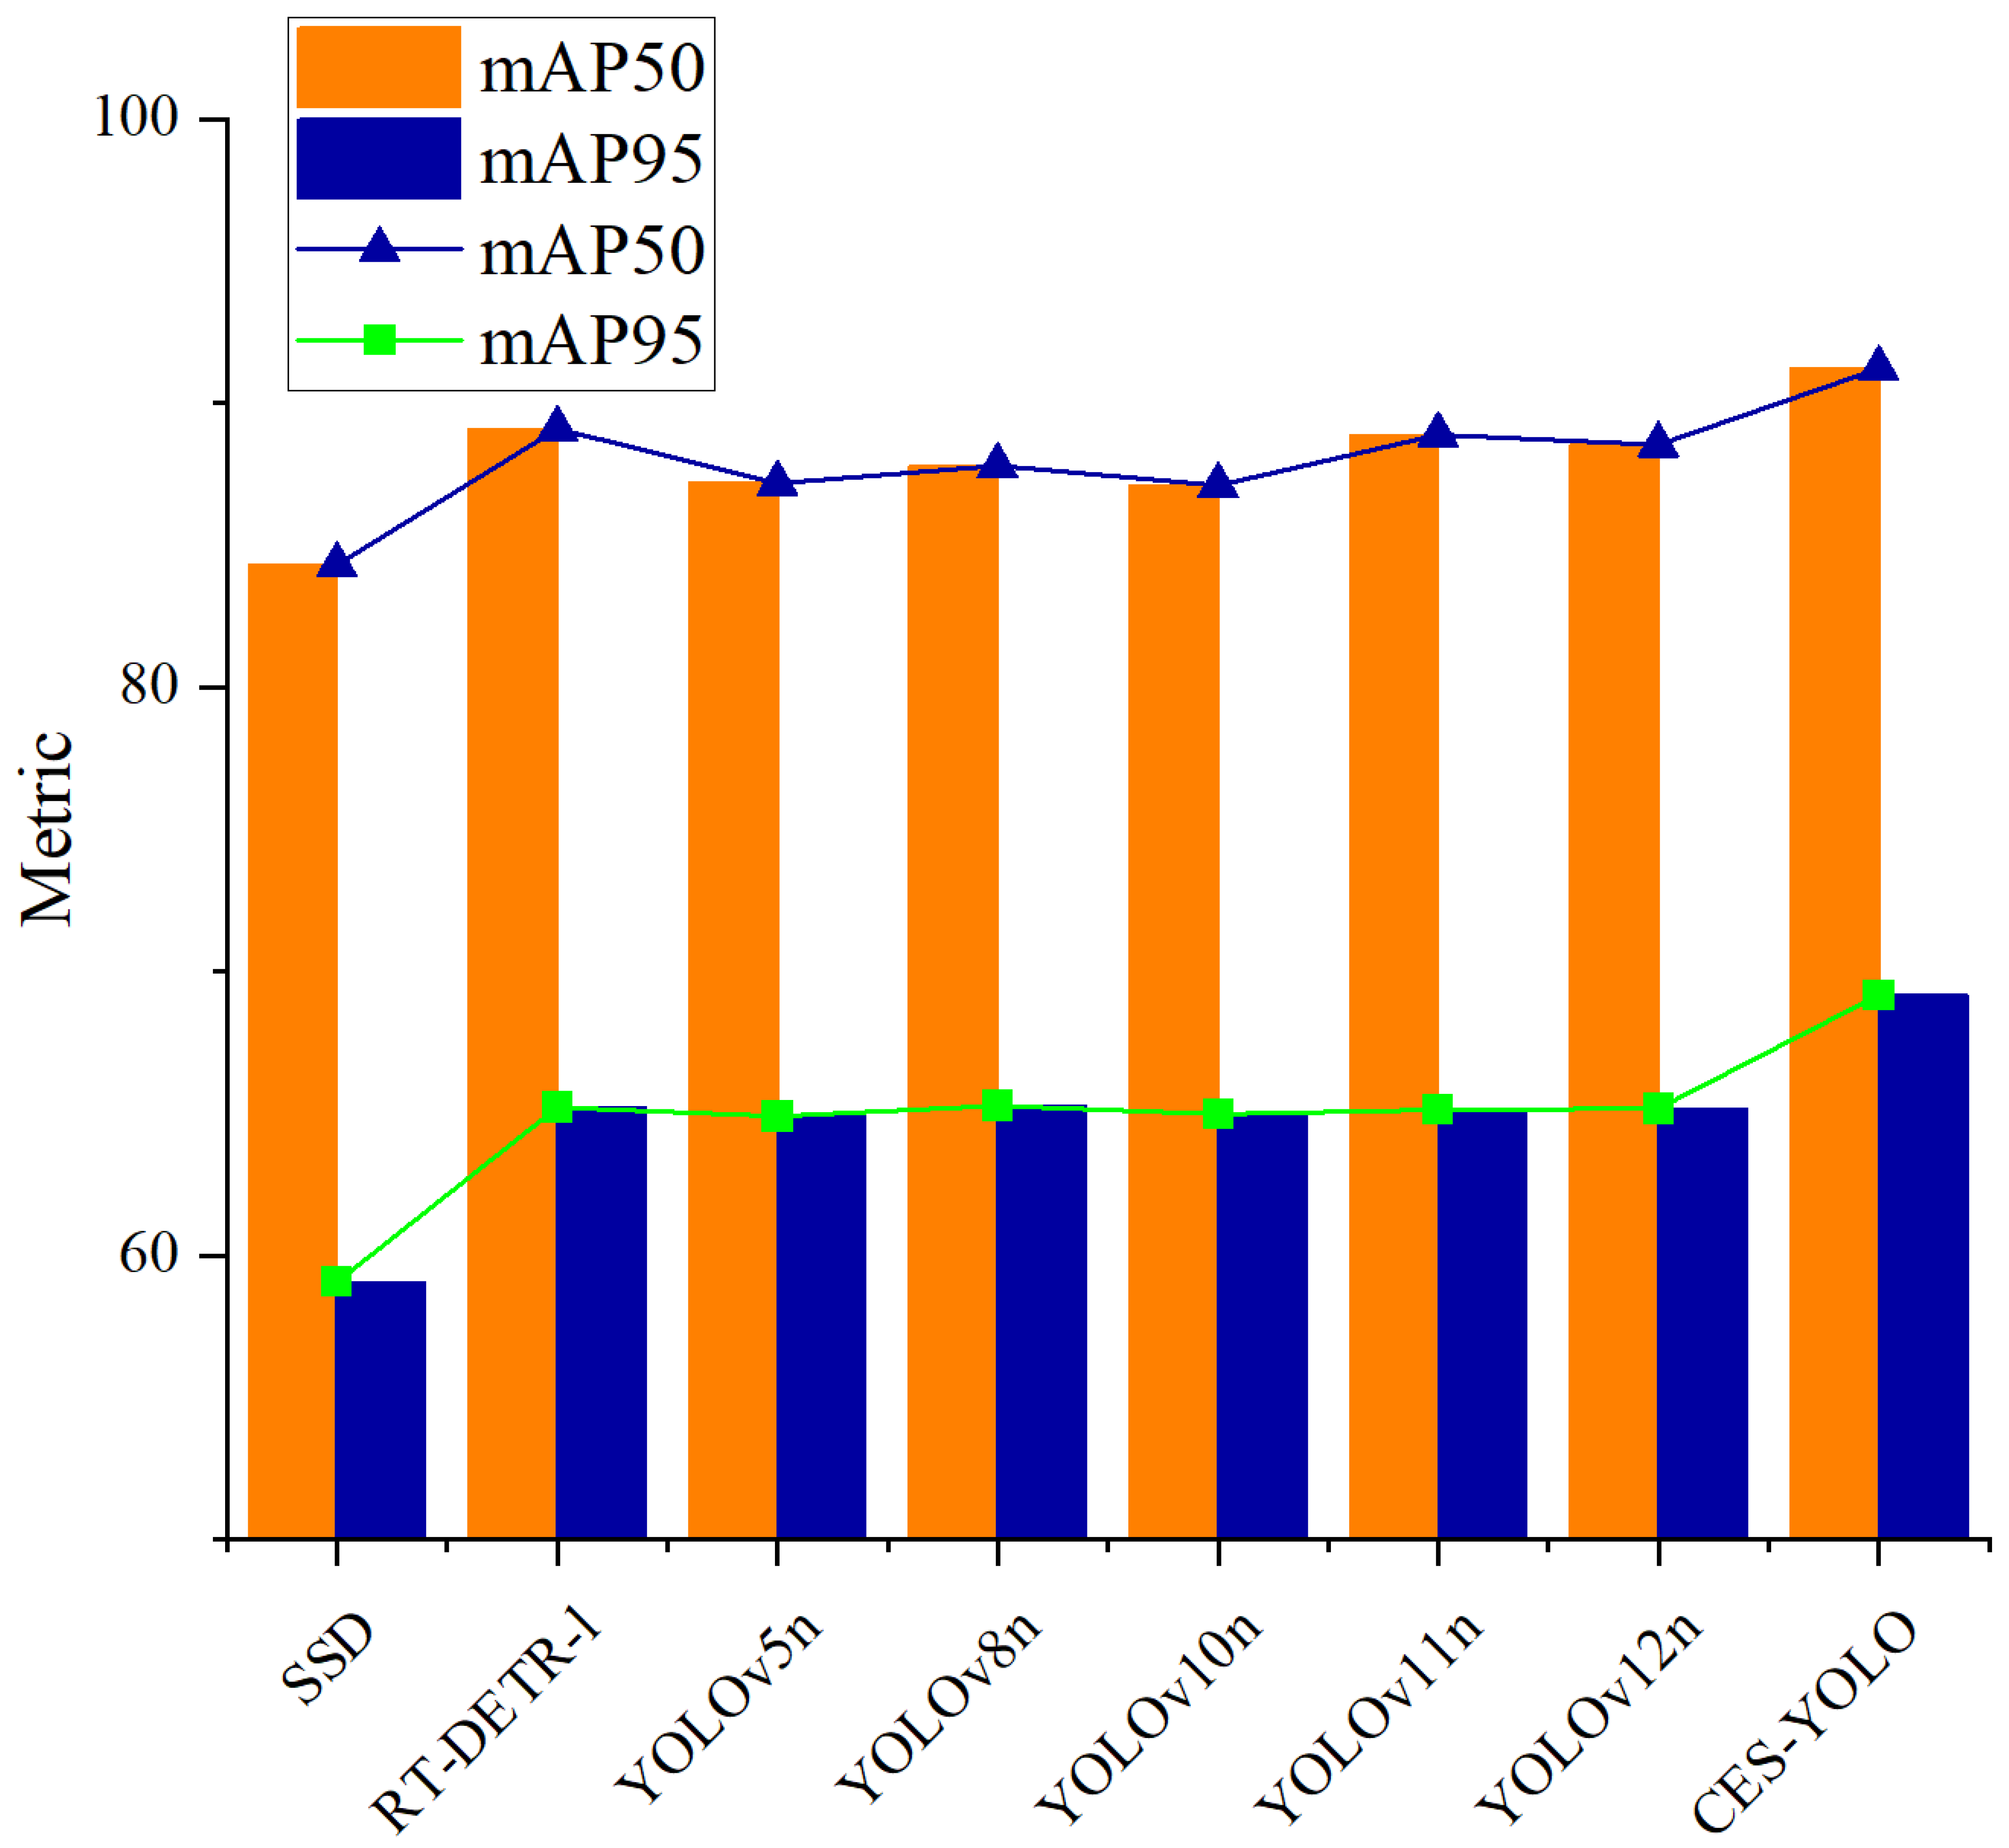
To comprehensively evaluate the performance of the proposed CES-YOLO model in terms of detection accuracy and model lightweighting, we conducted comparative experiments with several mainstream detection models, including SSD (ResNet-50), RT-DETR-l [43], YOLOv5n, YOLOv8n, YOLOv10n, and YOLOv11n. The comparison metrics were Precision, Recall, mAP50, mAP95, model parameters (Parameters), and computational complexity (FLOPs).
From the experimental results in Table 3, CES-YOLO achieved the best overall performance, while maintaining lightweight characteristics. Its Precision, Recall, mAP50, and mAP95 were 89.21%, 85.23%, 91.22%, and 69.18%, respectively, all ranking the highest among all compared models. Among them, the mAP50 was 3.42% higher than that of the current mainstream lightweight model YOLOv8n, and the mAP95 was 3.91% higher. Meanwhile, its parameter count was only 2.7 M, and the FLOPs were only 6.5 G, which is significantly superior to models with similar accuracy but higher computational overhead, such as RT-DETR-l (103.5 G FLOPs).
Compared with the lightweight models YOLOv5n, YOLOv8n, YOLOv10n, YOLOv11n, and YOLOv12n, CES-YOLO achieved a higher accuracy and stronger generalization ability, with almost the same or smaller model size. For example, compared with YOLOv11n, CES-YOLO showed a 2.34% increase in mAP50 and a 4.05% increase in mAP95, with slightly lower parameters and FLOPs, demonstrating excellent structural design and module integration capabilities.
In addition, compared with the traditional detection model SSD (ResNet-50), CES-YOLO showed significant improvements in all indicators, especially 6.92% and 10.11% increases in mAP50 and mAP95, respectively. Moreover, the model size of CES-YOLO was only 5.8% that of SSD, and the computational load was only 43% of SSD. In summary, CES-YOLO significantly improved detection performance, while ensuring extremely low computational overhead, showing broad application prospects in edge device deployment and real-time detection tasks.
Figure 12 is a bar comparison chart of mAP50 and mAP95 for each model in the comparative experiment, from which the differences in key performance can be intuitively observed.

3.4. Contrastive Experiment on Attention Mechanisms

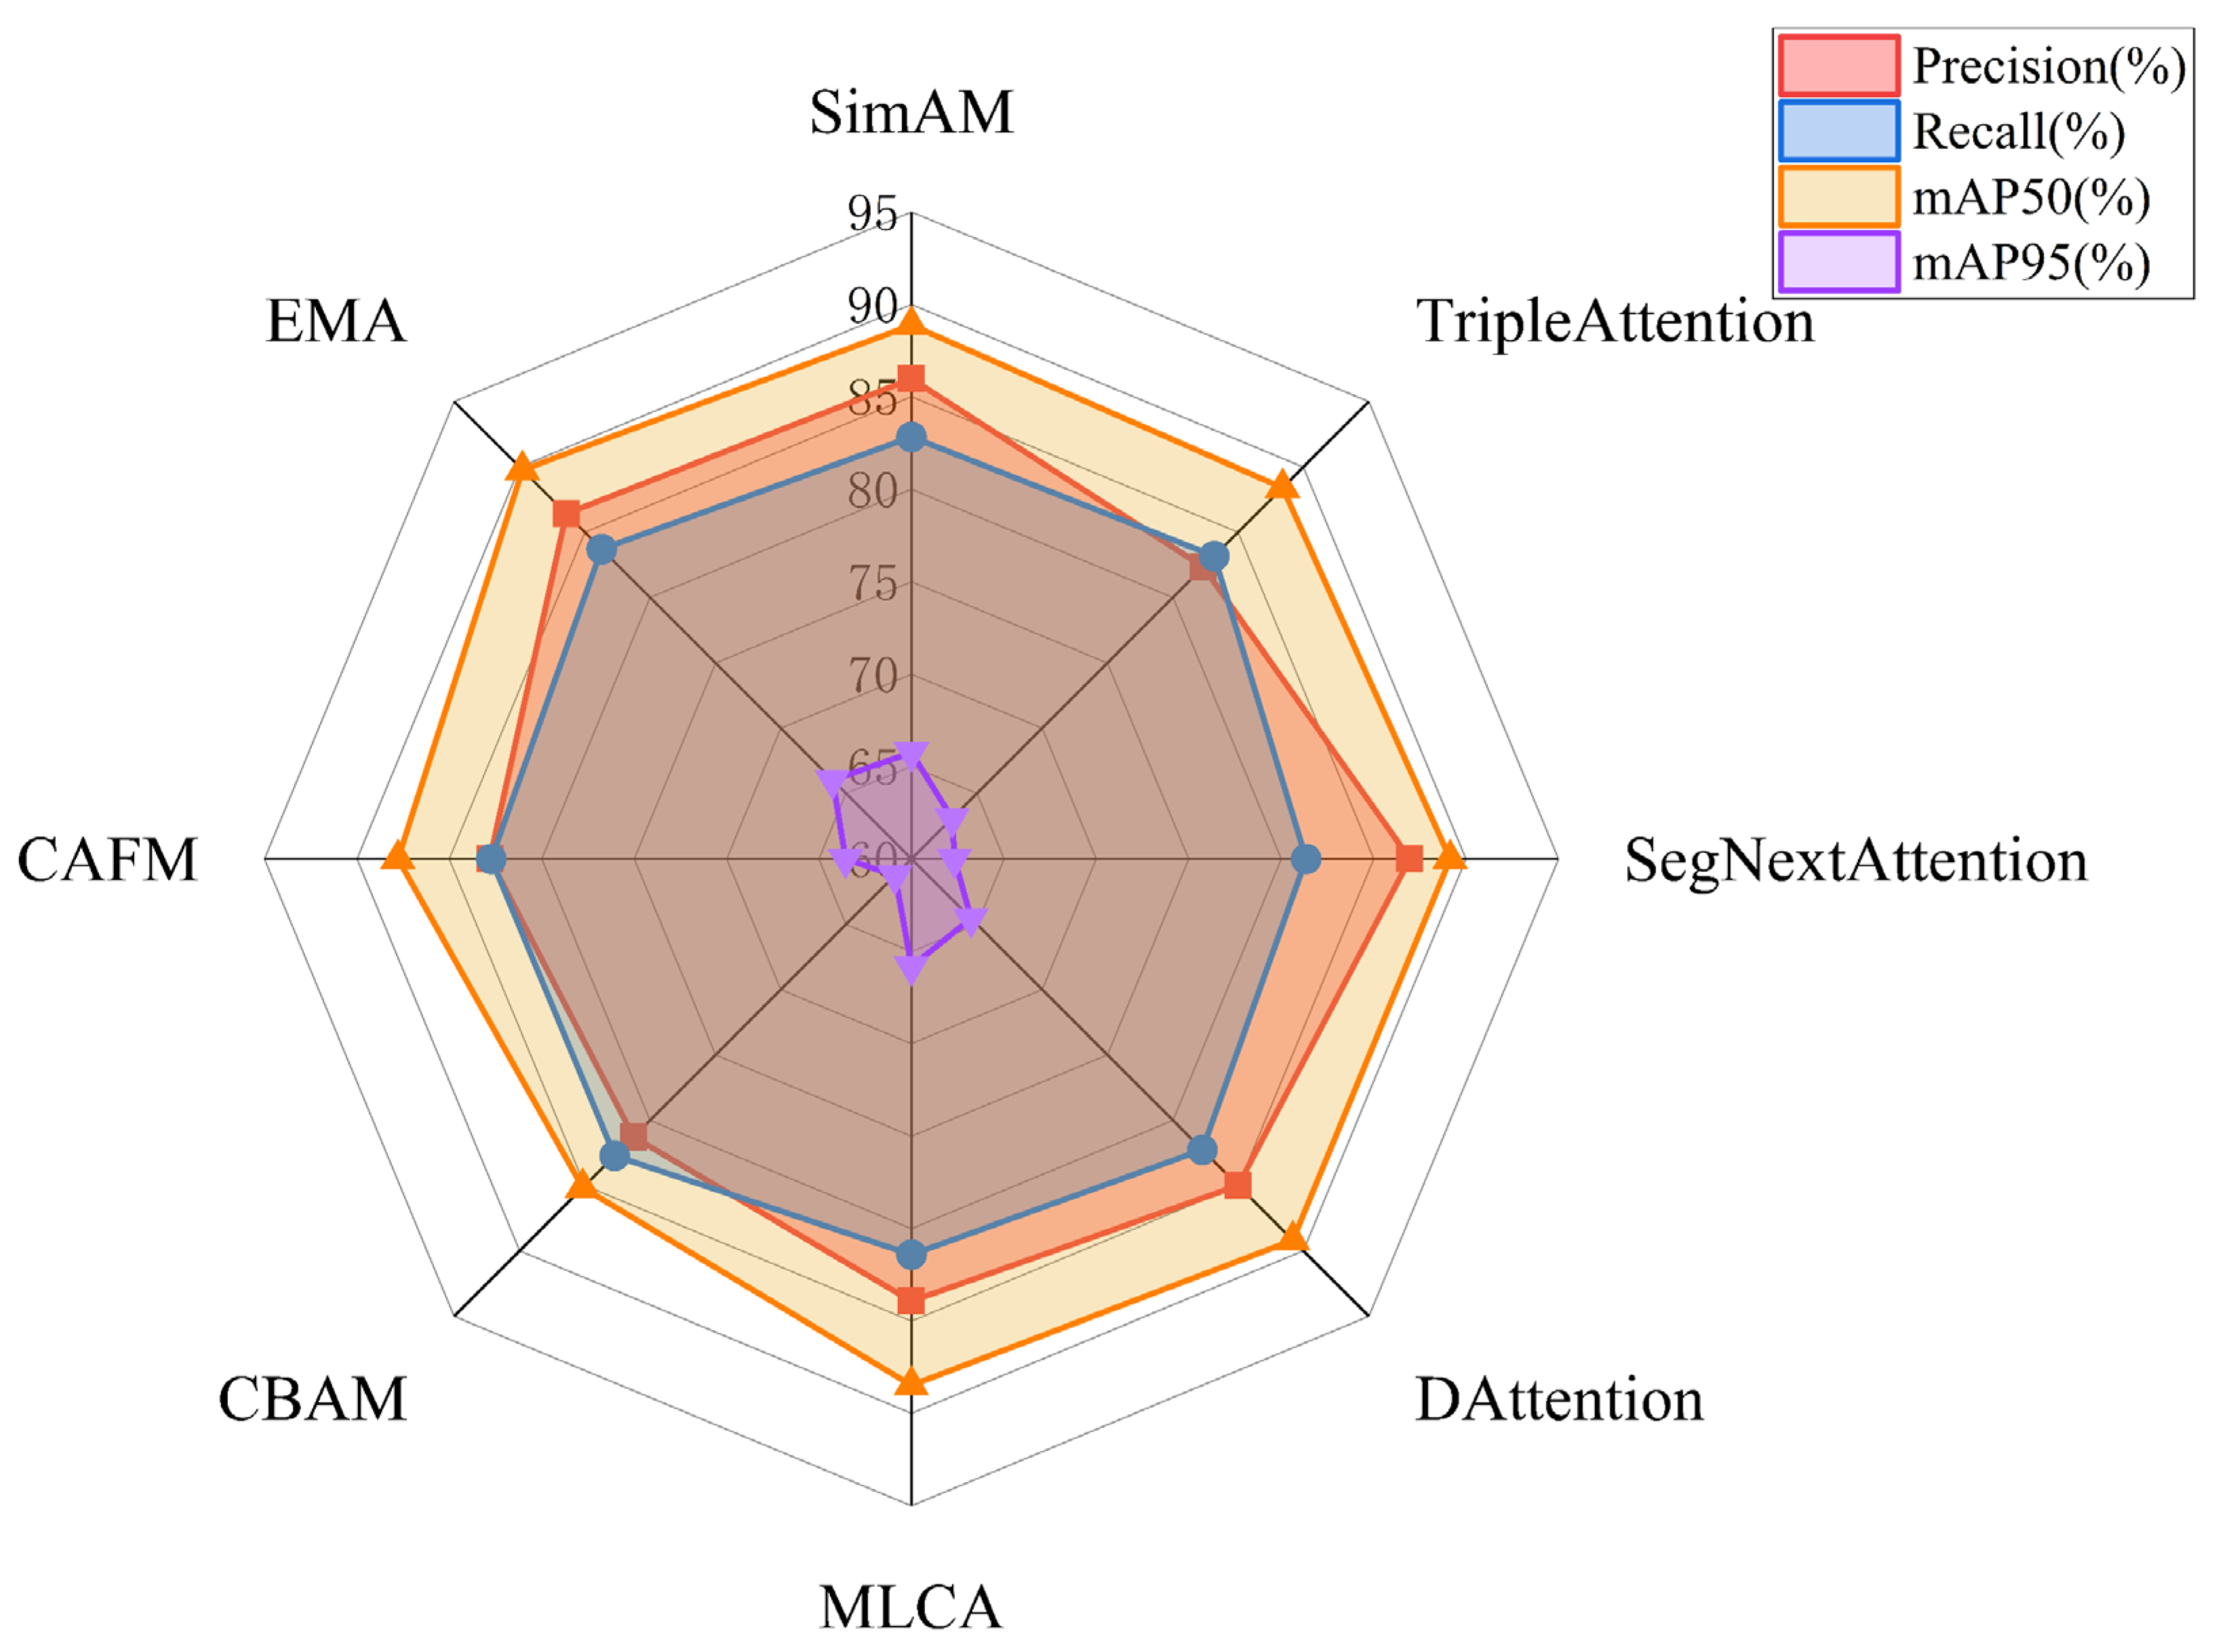
To further verify the effectiveness of the proposed EMA (Enhanced Multi-scale Attention) mechanism, we conducted comparative experiments with several mainstream attention mechanisms, including SimAM [44], Triple Attention [45], SegNext Attention [46], DAttention [47], MLCA [48], CBAM [49], and CAFM [50]. The comparison metrics included Precision, Recall, mAP50, and mAP95, aiming to evaluate the improvement effect of the different attention mechanisms on the model’s detection performance. Detailed experimental results are shown in Table 4.
From the experimental results, EMA performed excellently in multiple evaluation metrics and had the strongest overall performance. Its Precision was 86.40%, Recall was 83.71%, mAP50 reached 89.75%, and mAP95 was as high as 66.03%. Among all attention mechanisms, the mAP50 and mAP95 of EMA were the highest, which indicates that EMA can effectively enhance the model’s perception ability of target regions and improve the quality and distinguishability of feature expression.
Compared with the other methods, SimAM performed relatively well, with mAP95 reaching 65.77%, but it was still slightly lower than EMA’s 66.03%, and it was inferior to EMA in Recall and mAP50. DAttention achieved a result close to EMA in mAP50 (89.16%), but its mAP95 was slightly lower, indicating that its ability to model multi-scale targets was somewhat inferior. Methods such as Triple Attention, MLCA, CBAM, and CAFM showed varying degrees of deficiencies in terms of precision or recall. For example, the mAP95 of Triple Attention was only 63.12%, and that of CBAM was even lower, at 61.27%, indicating that these methods have certain limitations in fusing spatial and channel information and fail to fully explore key features. Although SegNext Attention achieved the highest Precision of 86.97%, its performance for Recall and mAP95 was relatively poor (only 81.35% and 62.34%), indicating that it may be more sensitive to specific targets, but its overall detection stability is not as good as EMA.
In summary, EMA performed prominently for various detection indicators, especially achieving the leading performance in mAP50 and mAP95, which verifies its superiority in fusing multi-scale features and improving target perception ability. It is one of the most stable and best performing methods among current attention mechanisms.
Figure 13 presents a performance comparison of the various attention mechanisms in terms of Precision, Recall, mAP50, and mAP95 in the form of a radar chart.
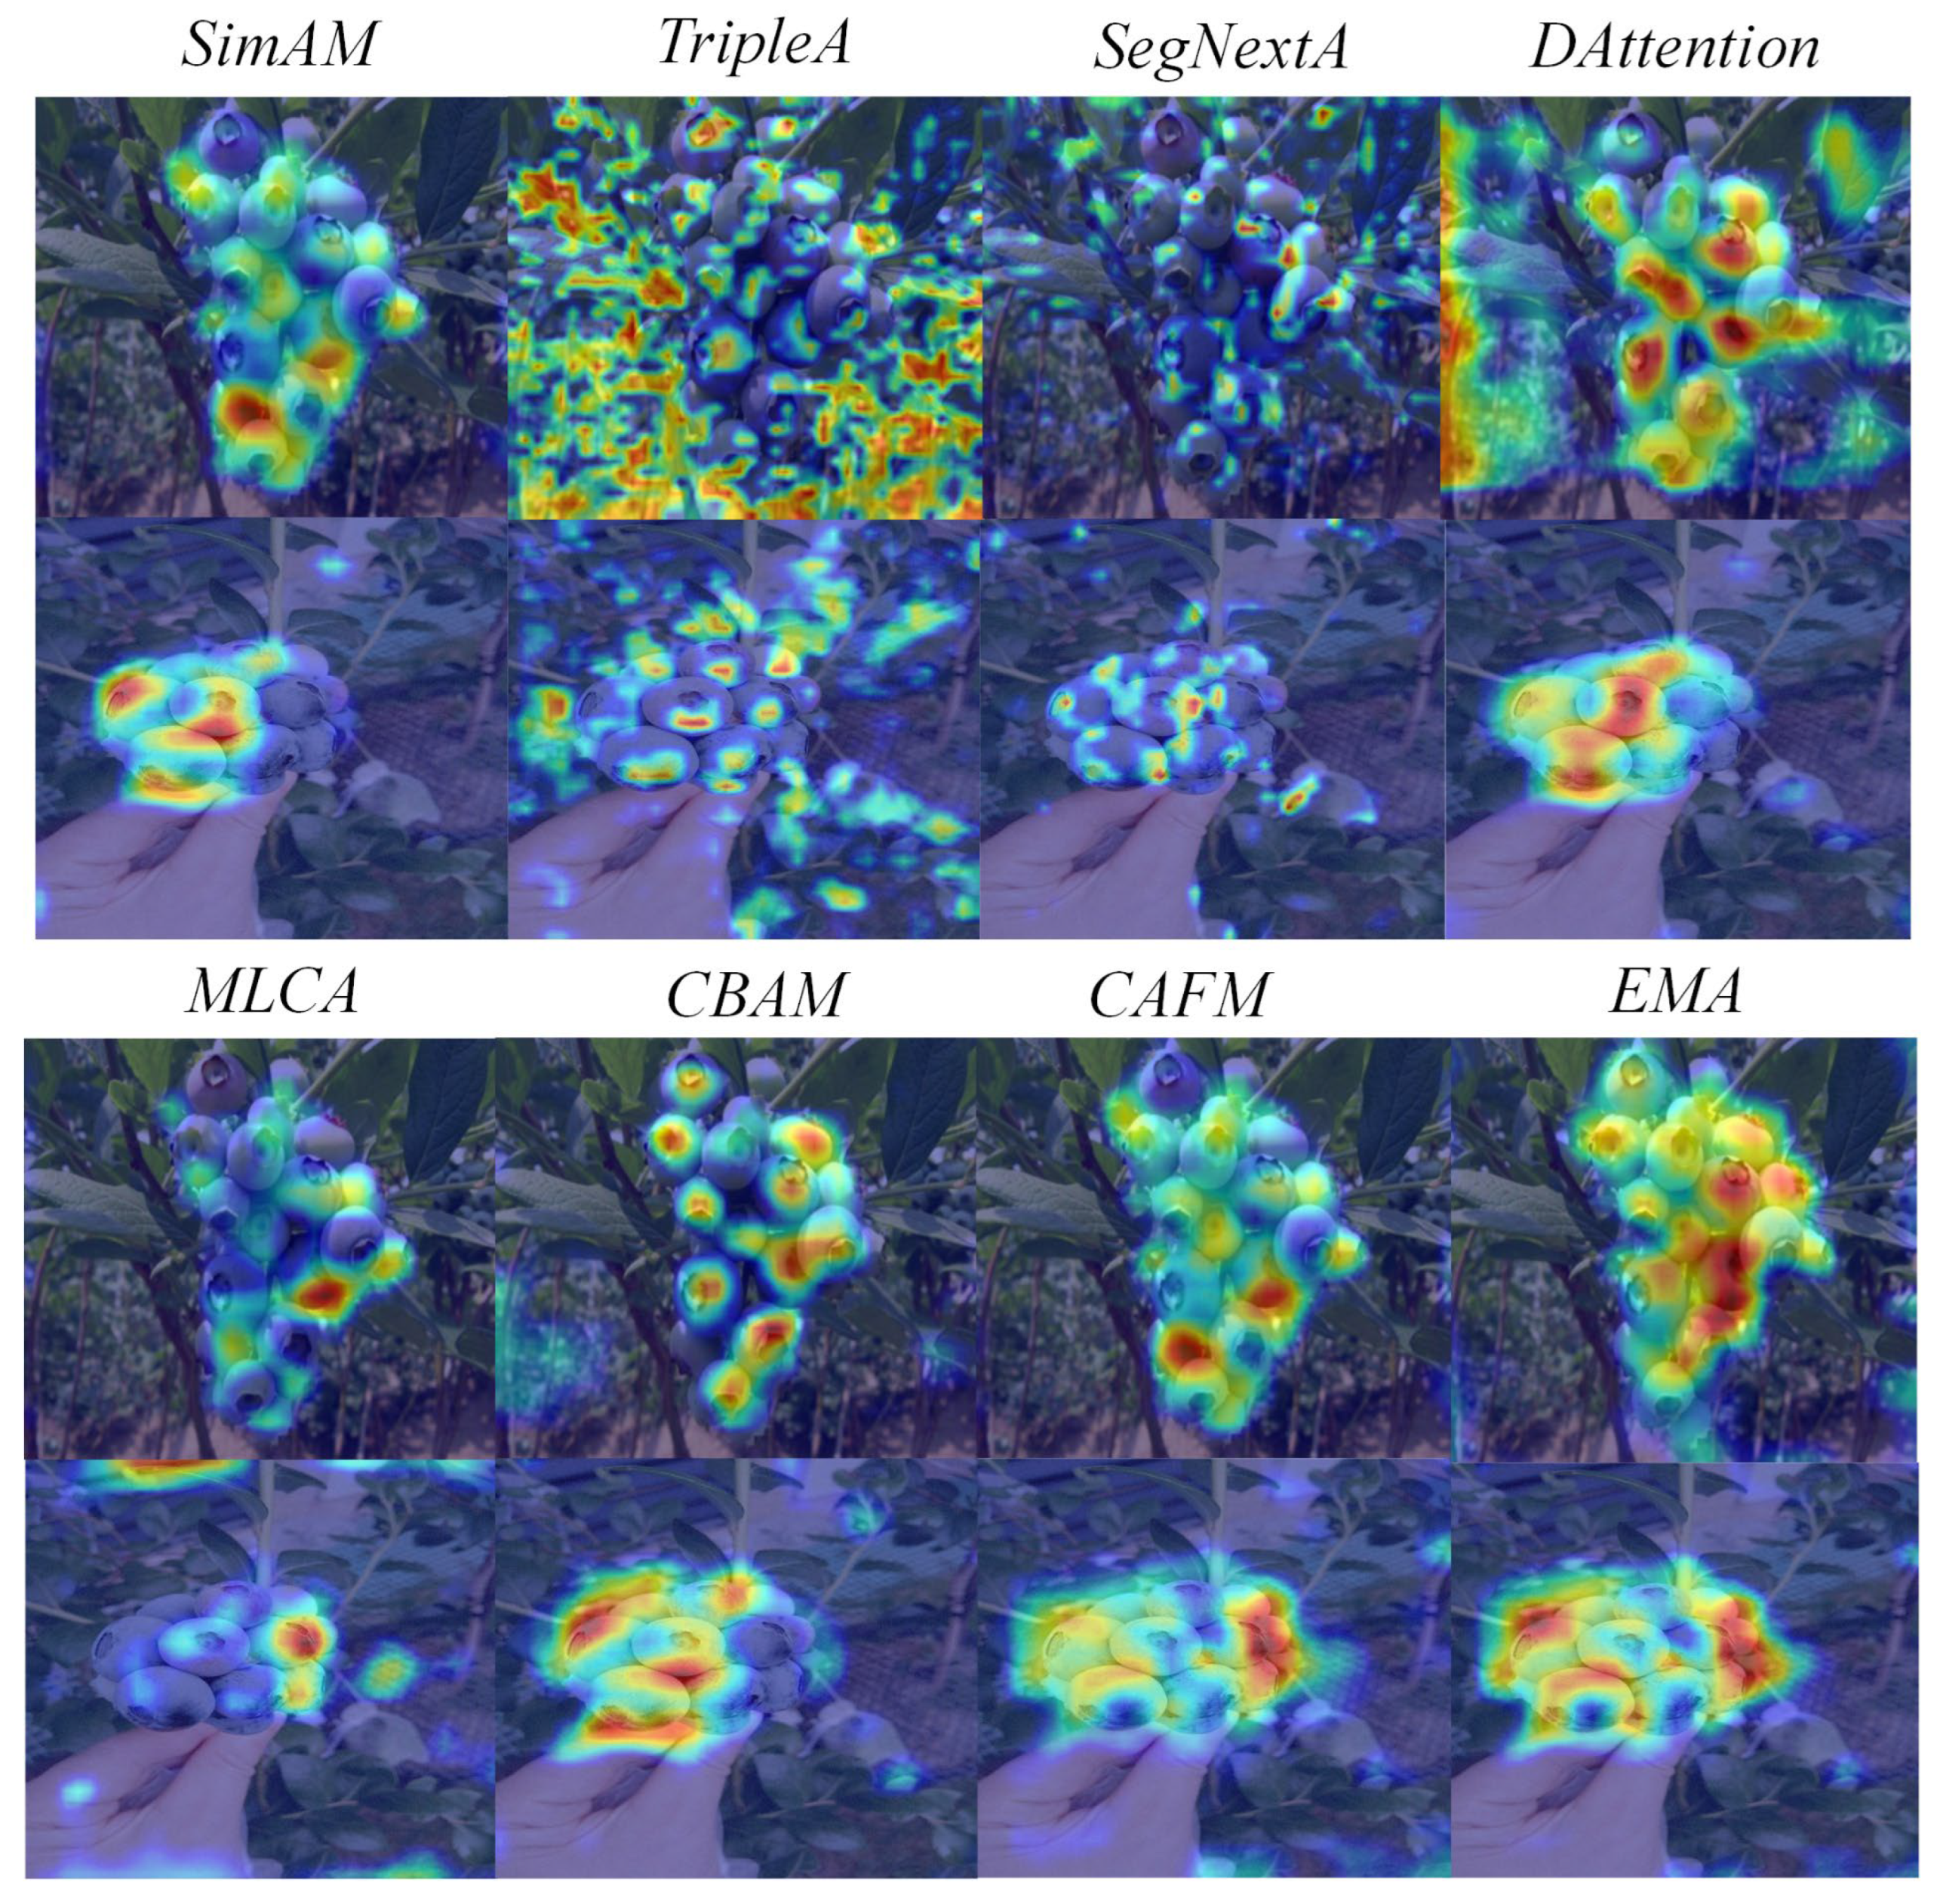
Figure 14 shows a comparison of visualized heatmaps using various attention mechanisms. Through a large number of comparative experiments, it was shown that the EMA attention had the best focus ability. In contrast, Triple Attention and SegNext Attention were too scattered, paying too much attention to background areas. DAttention and MLCA gave excessive unnecessary attention to the edge areas of the image. Although the other attention mechanisms did not have the above problems, their concentration on the core subject was lower than that of the EMA attention mechanism.

4. Discussion

In this study, CES-YOLO introduces three architectural improvements—the C3K2-Ghost module, the EMA attention mechanism, and the SEAM Head—to effectively address key challenges in blueberry ripeness detection, including false positives, missed detections, and limited detection robustness. Through a structurally coordinated module design, the model significantly improves detection metrics such as mAP50, mAP95, Precision, and Recall, while maintaining a low parameter count and computational cost, making it suitable for real-time deployment in edge environments.
From a functional perspective, the C3K2-Ghost module enhances the network’s capability to integrate shallow and deep semantic features by incorporating cross-layer fusion, while preserving its lightweight nature. This design compensates for the feature deficiencies typically found in lightweight models, especially under complex conditions such as leaf occlusion, cluttered backgrounds, or detection of small or immature blueberries. In such scenarios, traditional models often produce missed detections due to weak responses at object boundaries or low-contrast regions; the proposed module strengthens edge sensitivity and improves feature continuity to mitigate this.
The EMA attention mechanism further reinforces the model’s ability to concentrate on informative areas of the image by combining spatial and channel attention. This proves effective in suppressing background interference and irrelevant information—common causes of false detections. It also addresses cases of motion blur, illumination variation, and semi-mature fruits with ambiguous appearance, which may otherwise lead to incorrect classification or unstable predictions.
The SEAM detection head improves semantic feature fusion across scales through a multi-branch structure, enhancing both classification and localization performance. This is particularly beneficial for the detection of dense, overlapping, or partially occluded fruits, where traditional heads may misinterpret object boundaries or suppress valid predictions during non-maximum suppression (NMS).
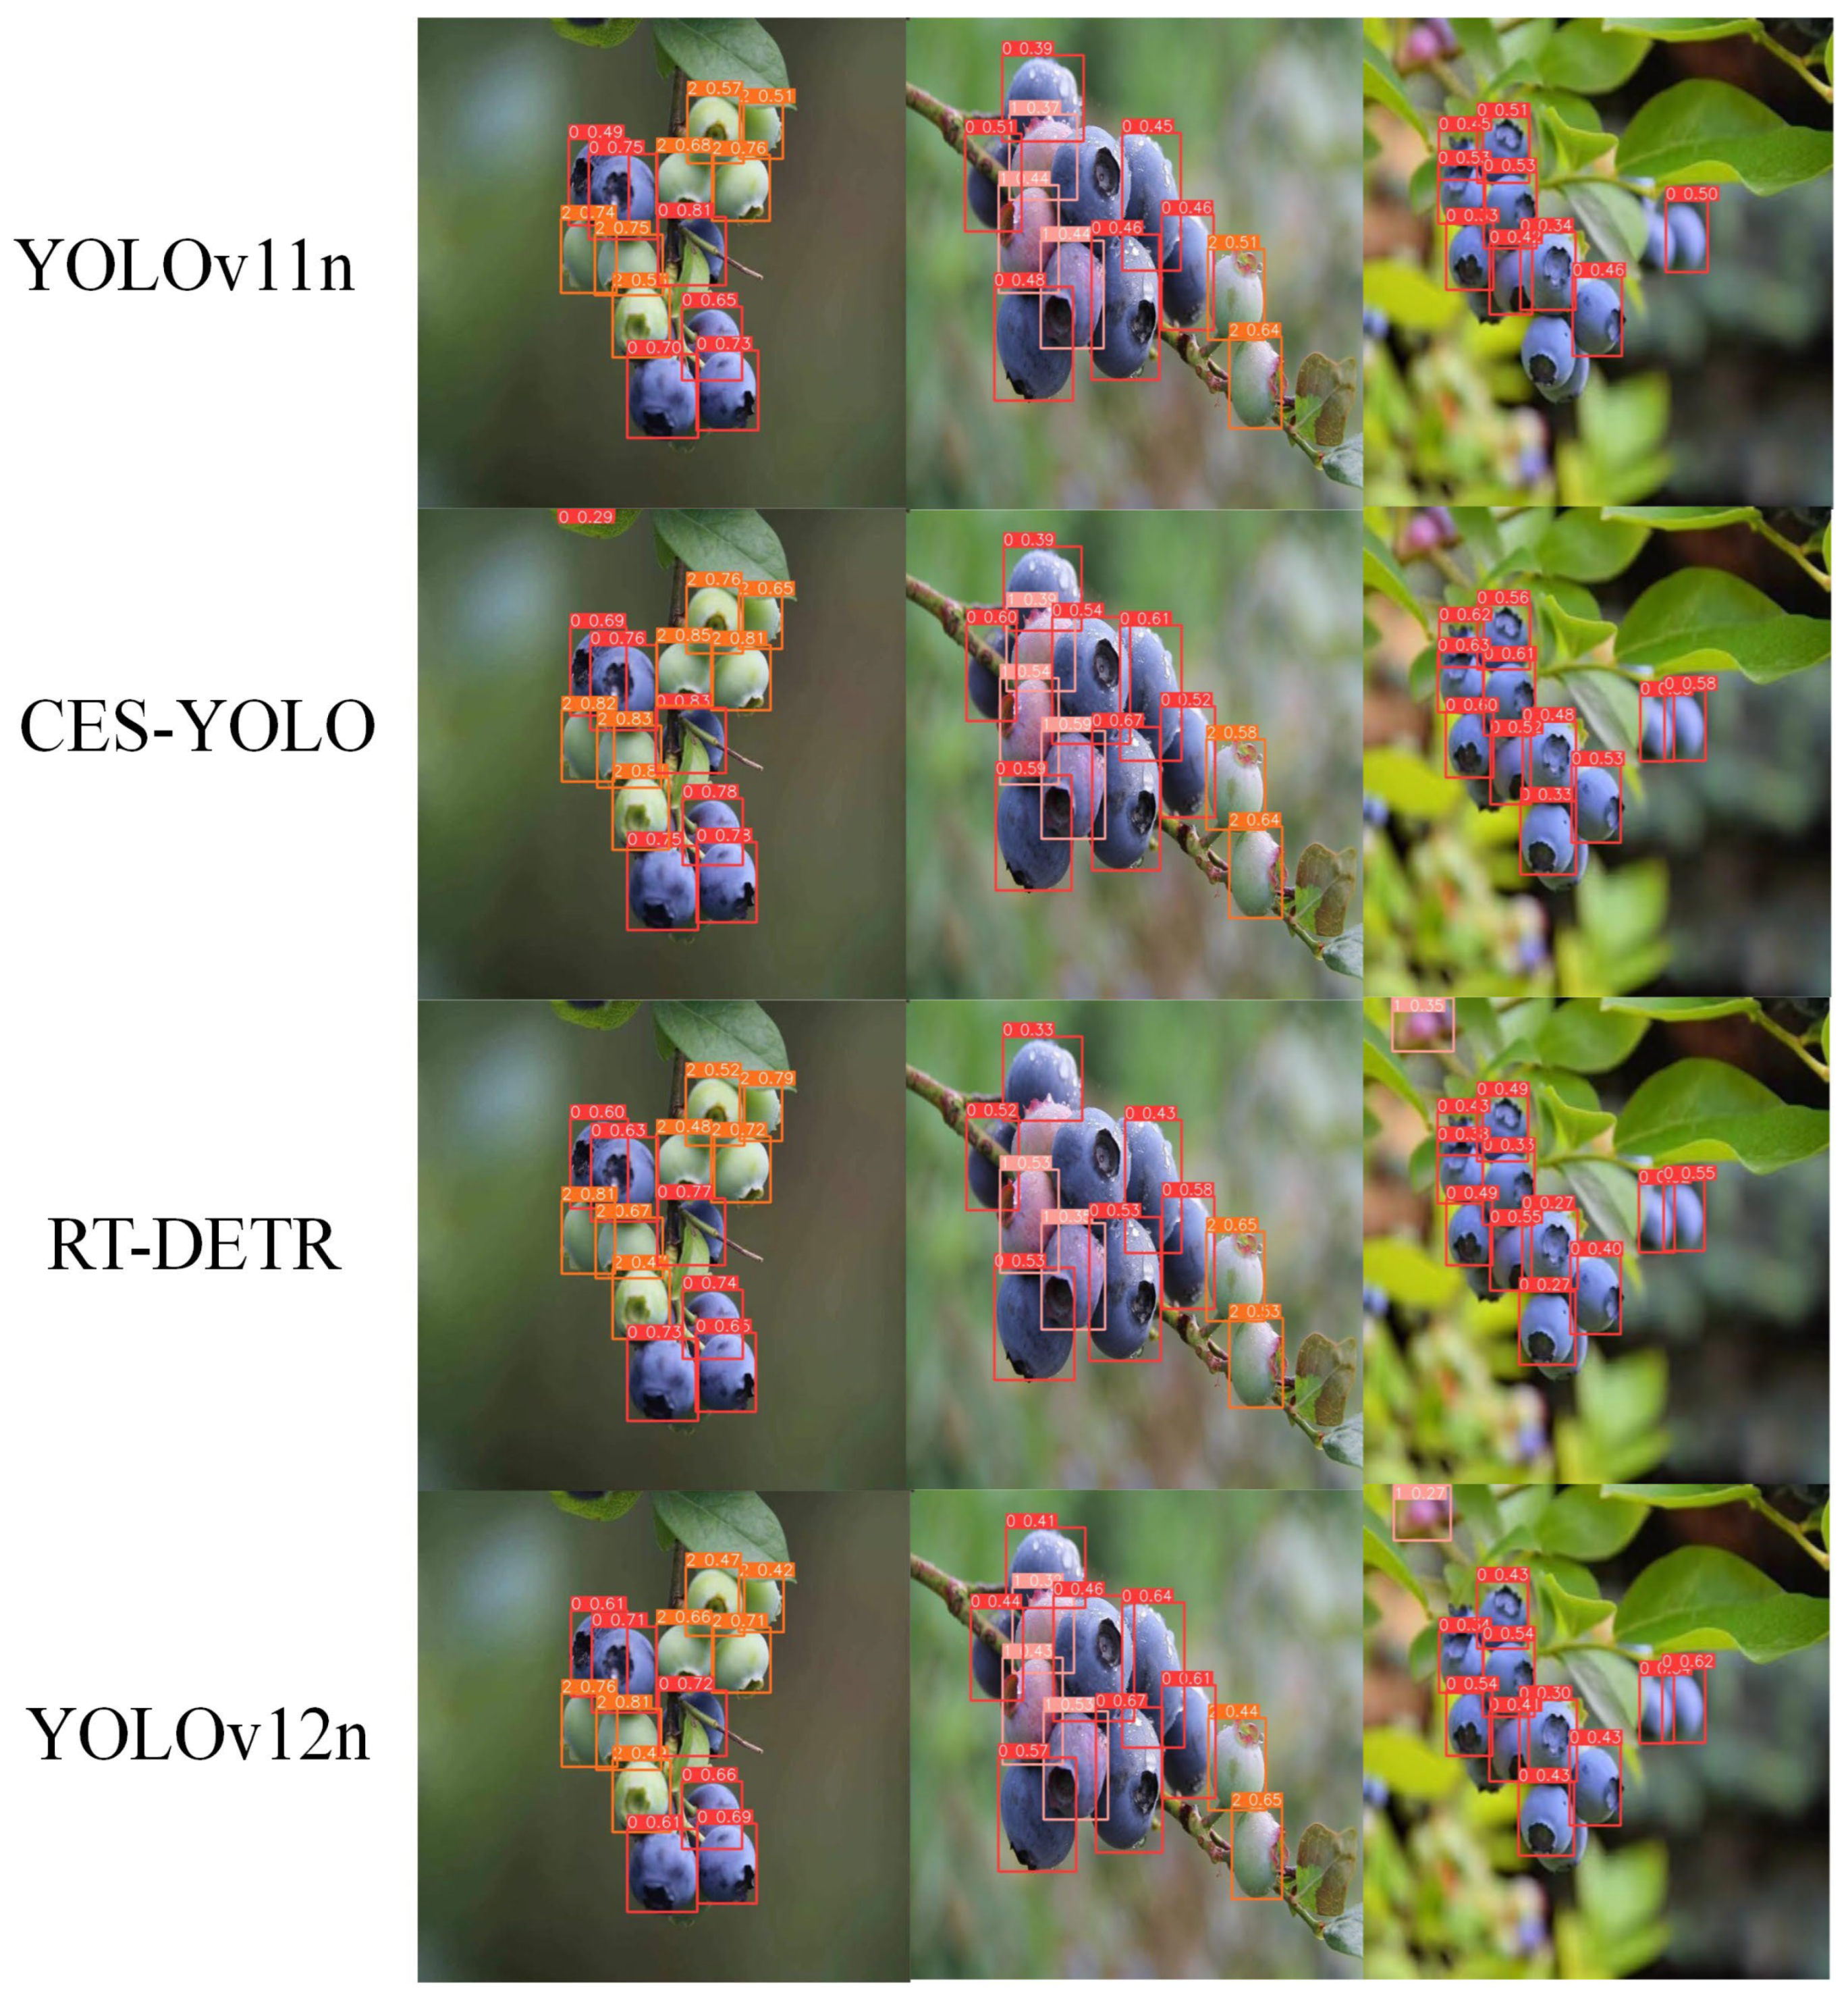
Despite these improvements, errors and missed detections may still occur in extreme cases. Specifically, immature blueberries often exhibit a green coloration similar to foliage, making them difficult to distinguish from the background. Semi-mature fruits, with their blurred boundaries, can lead to overlapping feature activations and classification ambiguity. Additionally, dense fruit clusters or occlusion by leaves can hinder full object representation, increasing the risk of detection failure. CES-YOLO addresses these challenges through its targeted module design, improving robustness and reducing detection errors in real-world orchard environments. Figure 15 visually compares CES-YOLO with YOLOv11n, demonstrating its superior ability to handle complex scenes and nuanced differences in blueberry ripeness.
Figure 15 compares the detection results of the YOLOv11n, YOLOv12n, CES-YOLO, and RT-DETR models. Among them, YOLOv12n is the latest YOLO detection model, RT-DETR is a Transformer-based detection model, and YOLOv11n is the baseline model of CES-YOLO. It can be seen from the detection effect diagrams that CES-YOLO has significant advantages in solving problems such as low precision and missed detection.
What is more important is that these three modules exhibit a good synergistic effect when used in combination. Experimental results show that when the three were jointly integrated (Model-H), the model not only achieved optimal performance in all indicators but also maintained an extremely low number of parameters (2.1 M) and computational load (5.0 G), which was far superior to most mainstream models. This combination method has extremely high cost-effectiveness for practical deployment and is particularly suitable for real-time detection tasks on edge devices or mobile terminals.
The method proposed in this study has certain significance for the design of subsequent target detection models. First, introducing structural complementarity between modules under the premise of model lightweighting can achieve a steady improvement in accuracy, without sacrificing computational efficiency. Second, the multi-module fusion optimization needs to be designed specifically based on the task characteristics, to avoid performance bottlenecks or resource waste caused by redundant mechanisms.
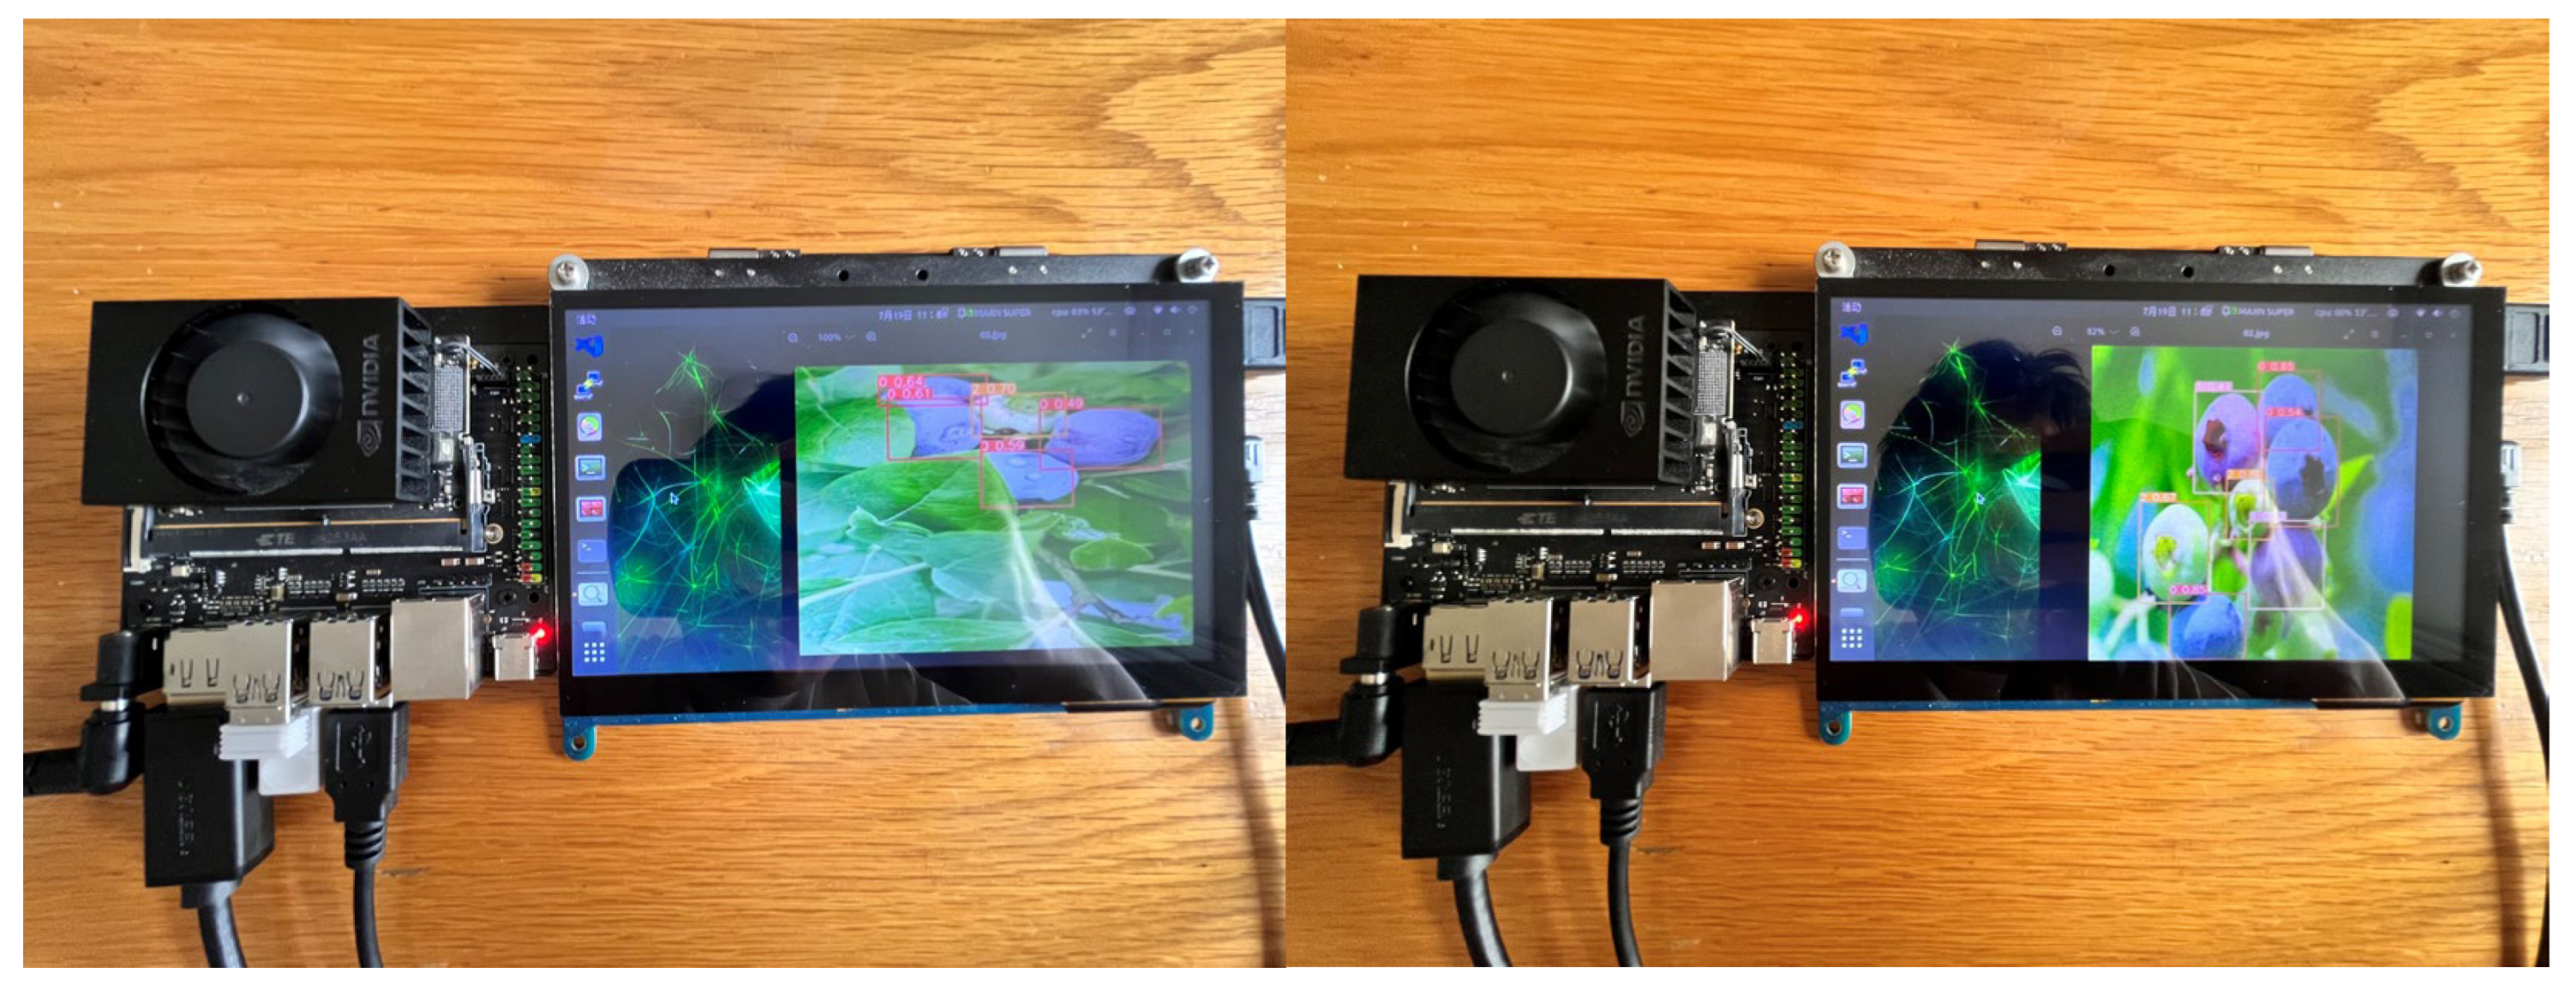
To evaluate the feasibility and real-time performance of the proposed model in practical applications, it was deployed on an NVIDIA Jetson Orin Nano development kit, as shown in Figure 16. The Jetson Orin Nano is an entry-level edge AI platform launched by NVIDIA, featuring high energy efficiency and powerful AI computing capabilities. It is particularly suitable for resource-constrained agricultural devices. During deployment, the system successfully achieved real-time detection and classification of [blueberry ripeness/ginseng quality/silkworm cocoon type], demonstrating excellent inference performance and deployment potential in edge computing environments.
To verify the real-time performance of the model on embedded devices, we conducted inference speed tests with different models using the NVIDIA Jetson Orin Nano platform, with the results shown in Table 5. It can be observed that the frame rates of the traditional SSD and RT-DETR-l on this platform were 12.2 FPS and 8.9 FPS, respectively. In contrast, the lightweight YOLO series models exhibit higher inference speeds on embedded platforms, among which YOLOv8n, YOLOv10n, YOLOv11n, and YOLOv12n all achieve frame rates exceeding 18.0 FPS. The CES-YOLO model proposed in this paper maintained a high accuracy, while reaching an inference speed of 20.3 FPS, which was approximately 10.9% higher than that of YOLOv8n. Thus, it demonstrated superior real-time performance and deployment value on an embedded platform.
However, this study still has room for improvement. Firstly, although the proposed method performs well in the detection of small targets and under complex backgrounds, its generalization ability for large-scale multi-class detection tasks remains to be further verified. Secondly, the current module combination has a static structure; in the future, introducing dynamic routing mechanisms or learnable module selection strategies could be considered to further enhance the model’s adaptability and self-optimization capabilities. In addition, while CES-YOLO demonstrated promising results for general fruit detection, its ability to distinguish between different ripeness stages—namely mature, semi-mature, and immature blueberries—remained limited. Specifically, mature blueberries often have a more pronounced appearance (e.g., deep blue color and glossiness), making them relatively easier to detect. In contrast, semi-mature fruits, which are between green and blue stages, exhibit ambiguous color and texture features that overlap with both mature and immature categories, making precise classification more difficult. Furthermore, immature blueberries typically appear green and are easily confused with surrounding foliage, especially in natural environments dominated by green backgrounds and uneven lighting, leading to higher false negatives or missed detections. Therefore, enhancing the model’s sensitivity to subtle visual cues or incorporating additional modalities (e.g., spectral or infrared information) could be helpful for improving ripeness-level detection performance. Exploring extended applications in video scenarios or for multi-modal inputs are also worthwhile future directions.
Compared with previous studies, our work offers several notable advantages [22,23,24,29,30,32,34]. First, while many earlier approaches focused on improving detection accuracy through model structure modifications, dataset construction, or specific application scenarios, our method achieves both high accuracy and strong robustness in natural orchard environments by integrating multiple targeted network optimizations. Second, unlike most existing models that remain computationally heavy, we adopt a lightweight design strategy that significantly reduces the model complexity, without compromising detection performance, enabling real-time processing. Most importantly, to the best of our knowledge, previous studies have rarely addressed the practical deployment of blueberry detection models. In contrast, our work implements an optimized model on edge devices, ensuring practical applicability for real-world field operations.

5. Conclusions

This paper proposes a lightweight and efficient blueberry ripeness detection model, CES-YOLO, which has been deployed on Raspberry Pi devices. By introducing three core modules: the C3K2-Ghost lightweight structure, EAM attention mechanism, and SEMA Head detection head, the detection accuracy and robustness were effectively improved. While maintaining an extremely low number of parameters (2.1 M) and computational load (5.0 G), CES-YOLO significantly outperformed similar mainstream methods in indicators such as mAP50, mAP95, Precision, and Recall. Ablation experiments and comparative analyses verified the independent advantages and synergistic gain effects of each module, especially in significantly reducing false detections, missed detections, and improving small target detection capabilities on a blueberry ripeness dataset.
Future work will be carried out on the following aspects: First, further improve the cross-scene robustness and adaptability of the model, such as introducing dynamic attention or learnable routing mechanisms; second, explore the model’s performance in multi-modal information fusion (such as RGB with infrared, depth maps); third, promote the deployment and optimization of the model on terminal devices in practical application scenarios, to realize a truly high-precision, low-power consumption, and real-time target detection system. By continuously optimizing its structural design and task generalization ability, CES-YOLO is expected to provide a solid foundation for a visual system for intelligent blueberry picking, saving labor and economic costs.

Author Contributions

Conceptualization, J.Y., J.F., W.Y. and D.L.; methodology, J.Y., J.F., Z.S. and H.L. (Hui Liu); software, J.Y., J.F., Z.S., W.Y. and H.L. (Hongtao Liu); validation, J.F. and Z.S.; formal analysis, J.Y., Z.S., H.L. (Hongtao Liu), J.W. and W.Y.; investigation, J.Y., Z.S., H.L. (Hui Liu), D.L. and J.W.; resources, J.Y., J.F. and D.L.; data curation, J.Y., J.F., H.L. (Hongtao Liu) and H.L. (Hui Liu); writing—original draft preparation, J.Y., J.F. and Z.S.; writing—review and editing, J.Y., J.F. and Z.S.; visualization, J.Y., D.H., Z.S., W.Y. and H.L. (Hongtao Liu); supervision, J.Y., J.W. and D.H.; project administration, D.H. and J.W.; funding acquisition, D.H.; All authors have read and agreed to the published version of the manuscript.

Funding

This research was funded by the “National Key Research and Development Program of China” (grant number 2023YFD1500404) and Natural Science Foundation of Jilin Province (20230101219JC).

Data Availability Statement

The raw data supporting the conclusions of this article will be made available by the authors on request.

Conflicts of Interest

The authors declare no conflict of interest.

References

  1. Bradshaw, M.; Ivors, K.; Broome, J.C.; Carbone, I.; Braun, U.; Yang, S.; Meng, E.; Warres, B.; Cline, W.O.; Moparthi, S. An emerging fungal disease is spreading across the globe and affecting the blueberry industry. New Phytol. 2025, 246, 103–112. [Google Scholar] [CrossRef]
  2. Zhou, Y.; Zhang, W.; Wu, L.; Chen, P.; Li, X.; Wen, G.; Tangtrakulwanich, K.; Chethana, K.W.T.; Al-Otibi, F.; Hyde, K.D. Characterization of fungal pathogens causing blueberry fruit rot disease in China. Pathogens 2025, 14, 201. [Google Scholar] [CrossRef] [PubMed]
  3. Xu, M.; Fang, D.; Shi, C.; Xia, S.; Wang, J.; Deng, B.; Kimatu, B.M.; Guo, Y.; Lyu, L.; Wu, Y. Anthocyanin-loaded polylactic acid/quaternized chitosan electrospun nanofiber as an intelligent and active packaging film in blueberry preservation. Food Hydrocoll. 2025, 158, 110586. [Google Scholar] [CrossRef]
  4. Wu, Z.; Wang, L.; Ma, C.; Xu, M.; Guan, X.; Lin, F.; Jiang, T.; Chen, X.; Bu, N.; Duan, J. Konjac glucomannan/xanthan gum film embedding soy protein isolate–tannic acid–iron complexes for blueberry preservation. Food Hydrocoll. 2025, 163, 111040. [Google Scholar] [CrossRef]
  5. Song, Z.; Chen, C.; Duan, H.; Yu, T.; Zhang, Y.; Wei, Y.; Xu, D.; Liu, D. Identification of VcRBOH genes in blueberry and functional characterization of VcRBOHF in plant defense. BMC Genom. 2025, 26, 153. [Google Scholar] [CrossRef]
  6. Gasdick, M.; Dick, D.; Mayhew, E.; Lobos, G.; Moggia, C.; VanderWeide, J. First they’re sour, then they’re sweet: Exploring the berry-to-berry uniformity of blueberry quality at harvest and implications for consumer liking. Postharvest Biol. Technol. 2025, 230, 113765. [Google Scholar] [CrossRef]
  7. Arellano, C.; Sagredo, K.; Muñoz, C.; Govan, J. Bayesian Ensemble Model with Detection of Potential Misclassification of Wax Bloom in Blueberry Images. Agronomy 2025, 15, 809. [Google Scholar] [CrossRef]
  8. Júnior, M.R.B.; Dos Santos, R.G.; de Azevedo Sales, L.; Vargas, R.B.S.; Deltsidis, A.; de Oliveira, L.P. Image-based and ML-driven analysis for assessing blueberry fruit quality. Heliyon 2025, 11, e42288. [Google Scholar] [CrossRef]
  9. Zhao, F.; He, Y.; Song, J.; Wang, J.; Xi, D.; Shao, X.; Wu, Q.; Liu, Y.; Chen, Y.; Zhang, G. Smart UAV-assisted blueberry maturity monitoring with Mamba-based computer vision. Precis. Agric. 2025, 26, 56. [Google Scholar] [CrossRef]
  10. Jiang, D.; Wang, H.; Li, T.; Gouda, M.A.; Zhou, B. Real-time tracker of chicken for poultry based on attention mechanism-enhanced YOLO-Chicken algorithm. Comput. Electron. Agric. 2025, 237, 110640. [Google Scholar] [CrossRef]
  11. Reddy, B.S.H.; Venkatramana, R.; Jayasree, L. Enhancing apple fruit quality detection with augmented YOLOv3 deep learning algorithm. Int. J. Hum. Comput. Intell. 2025, 4, 386–396. [Google Scholar]
  12. Zhou, X.; Hu, X.; Sun, J. A review of fruit ripeness recognition methods based on deep learning. Cyber-Phys. Syst. 2025, 1–35. [Google Scholar] [CrossRef]
  13. Nguyen, D.T.; Do, P.B.L.; Nguyen, D.D.K.; Lin, W.-C. A lightweight and optimized deep learning model for detecting banana bunches and stalks in autonomous harvesting vehicles. Smart Agric. Technol. 2025, 11, 101051. [Google Scholar] [CrossRef]
  14. Sun, H.; Ren, R.; Zhang, S.; Yang, S.; Cui, T.; Su, M. Detection of young fruit for “Yuluxiang” pears in natural environments using YOLO-CiHFC. Signal Image Video Process. 2025, 19, 382. [Google Scholar] [CrossRef]
  15. Zhang, D.; Chen, N.; Mao, S.; Wu, C.; Gu, D.; Zhang, L. A lightweight real-time algorithm for plum harvesting detection in orchards under complex conditions. Signal Image Video Process. 2025, 19, 327. [Google Scholar] [CrossRef]
  16. Yang, H.; Yang, L.; Wu, T.; Yuan, Y.; Li, J.; Li, P. MFD-YOLO: A fast and lightweight model for strawberry growth state detection. Comput. Electron. Agric. 2025, 234, 110177. [Google Scholar] [CrossRef]
  17. Wu, Y.; Huang, J.; Yang, C.; Yang, J.; Sun, G.; Liu, J. TobaccoNet: A deep learning approach for tobacco leaves maturity identification. Expert Syst. Appl. 2024, 255, 124675. [Google Scholar] [CrossRef]
  18. Zhu, F.; Wang, S.; Liu, M.; Wang, W.; Feng, W. A Lightweight Algorithm for Detection and Grading of Olive Ripeness Based on Improved YOLOv11n. Agronomy 2025, 15, 1030. [Google Scholar] [CrossRef]
  19. Wang, C.; Han, Q.; Li, J.; Li, C.; Zou, X. YOLO-BLBE: A novel model for identifying blueberry fruits with different maturities using the I-MSRCR method. Agronomy 2024, 14, 658. [Google Scholar] [CrossRef]
  20. Ni, X.; Li, C.; Jiang, H.; Takeda, F. Deep learning image segmentation and extraction of blueberry fruit traits associated with harvestability and yield. Hortic. Res. 2020, 7, 110. [Google Scholar] [CrossRef]
  21. Ni, X.; Takeda, F.; Jiang, H.; Yang, W.Q.; Saito, S.; Li, C. A deep learning-based web application for segmentation and quantification of blueberry internal bruising. Comput. Electron. Agric. 2022, 201, 107200. [Google Scholar] [CrossRef]
  22. Liu, Y.; Zhang, W.; Ma, H.; Liu, Y.; Zhang, Y. Lightweight YOLO v5s blueberry detection algorithm based on attention mechanism. J. Henan Agric. Sci. 2024, 53, 151. [Google Scholar]
  23. Zhao, K.; Li, Y.; Liu, Z. Three-Dimensional Spatial Perception of Blueberry Fruits Based on Improved YOLOv11 Network. Agronomy 2025, 15, 535. [Google Scholar] [CrossRef]
  24. Song, Z.; Li, W.; Tan, W.; Qin, T.; Chen, C.; Yang, J. LBSR-YOLO: Blueberry health monitoring algorithm for WSN scenario application. Comput. Electron. Agric. 2025, 238, 110803. [Google Scholar] [CrossRef]
  25. Deng, B.; Lu, Y.; Vander Weide, J. Development and Preliminary Evaluation of a YOLO-Based Fruit Counting and Maturity Evaluation Mobile Application for Blueberries. Appl. Eng. Agric. 2025, 41, 391–399. [Google Scholar] [CrossRef]
  26. Dai, J.; Wang, G.; Yang, M.; Liu, D. PEBU-Net: A lightweight segmentation network for blueberry bruising based on Unet3+ using hyperspectral transmission imaging. Measurement 2025, 253, 117700. [Google Scholar] [CrossRef]
  27. Li, Z.; Xu, R.; Li, C.; Munoz, P.; Takeda, F.; Leme, B. In-field blueberry fruit phenotyping with a MARS-PhenoBot and customized BerryNet. Comput. Electron. Agric. 2025, 232, 110057. [Google Scholar] [CrossRef]
  28. Mullins, C.C.; Esau, T.J.; Zaman, Q.U.; Al-Mallahi, A.A.; Farooque, A.A.; MacEachern, C.B. Time-of-flight-based advanced surface reconstruction methods for real-time volume estimation of bulk harvested wild blueberries. Smart Agric. Technol. 2025, 11, 101050. [Google Scholar] [CrossRef]
  29. Xiao, F.; Wang, H.; Xu, Y.; Shi, Z. A Lightweight Detection Method for Blueberry Fruit Maturity Based on an Improved YOLOv5 Algorithm. Agriculture 2024, 14, 36. [Google Scholar] [CrossRef]
  30. Zhai, X.; Zong, Z.; Xuan, K.; Zhang, R.; Shi, W.; Liu, H.; Han, Z.; Luan, T. Detection of maturity and counting of blueberry fruits based on attention mechanism and bi-directional feature pyramid network. J. Food Meas. Charact. 2024, 18, 6193–6208. [Google Scholar] [CrossRef]
  31. Yang, W.; Ma, X.; An, H. Blueberry Ripeness Detection Model Based on Enhanced Detail Feature and Content-Aware Reassembly. Agronomy 2023, 13, 1613. [Google Scholar] [CrossRef]
  32. You, H.; Li, Z.; Wei, Z.; Zhang, L.; Bi, X.; Bi, C.; Li, X.; Duan, Y. A Blueberry Maturity Detection Method Integrating Attention-Driven Multi-Scale Feature Interaction and Dynamic Upsampling. Horticulturae 2025, 11, 600. [Google Scholar] [CrossRef]
  33. Ropelewska, E.; Koniarski, M. A novel approach to authentication of highbush and lowbush blueberry cultivars using image analysis, traditional machine learning and deep learning algorithms. Eur. Food Res. Technol. 2025, 251, 193–204. [Google Scholar] [CrossRef]
  34. Li, X.; Ru, S.; He, Z.; Spiers, J.D.; Xiang, L. High-throughput phenotyping tools for blueberry count, weight, and size estimation based on modified YOLOv5s. Fruit Res. 2025, 5, e012. [Google Scholar] [CrossRef]
  35. Tian, J.; Jiang, Y.; Zhang, J.; Luo, H.; Yin, S. A novel data augmentation approach to fault diagnosis with class-imbalance problem. Reliab. Eng. Syst. Saf. 2024, 243, 109832. [Google Scholar] [CrossRef]
  36. Khanam, R.; Hussain, M. Yolov11: An overview of the key architectural enhancements. arXiv 2024, arXiv:2410.17725. [Google Scholar] [CrossRef]
  37. Xiao, R.; Wang, H.; Wang, L.; Yuan, H. C3Ghost and C3k2: Performance study of feature extraction module for small target detection in YOLOv11 remote sensing images. In Proceedings of the Second International Conference on Big Data, Computational Intelligence, and Applications (BDCIA 2024), Huanggang, China, 20 March 2025; pp. 464–470. [Google Scholar]
  38. Han, K.; Wang, Y.; Tian, Q.; Guo, J.; Xu, C.; Xu, C. Ghostnet: More features from cheap operations. In Proceedings of the Proceedings of the IEEE/CVF Conference on Computer Vision and Pattern Recognition, Seattle, WA, USA, 13–19 June 2020; pp. 1580–1589. [Google Scholar]
  39. Kuok, K.; Liu, X.; Ye, J.; Wang, Y.; Liu, W. GDE-Pose: A Real-Time Adaptive Compression and Multi-Scale Dynamic Feature Fusion Approach for Pose Estimation. Electronics 2024, 13, 4837. [Google Scholar] [CrossRef]
  40. Ganapathy, M.R.; Periasamy, S.; Pugazhendi, P.; Manuvel Antony, C.G. YOLOv11n for precision agriculture: Lightweight and efficient detection of guava defects across diverse conditions. J. Sci. Food Agric. 2025, 105, 6182–6195. [Google Scholar] [CrossRef]
  41. Ouyang, D.; He, S.; Zhang, G.; Luo, M.; Guo, H.; Zhan, J.; Huang, Z. Efficient multi-scale attention module with cross-spatial learning. In Proceedings of the ICASSP 2023-2023 IEEE International Conference on Acoustics, Speech and Signal Processing (ICASSP), Rhodes Island, Greece, 4–10 June 2023; pp. 1–5. [Google Scholar]
  42. Chen, P.; Liu, W.; Dai, P.; Liu, J.; Ye, Q.; Xu, M.; Chen, Q.A.; Ji, R. Occlude them all: Occlusion-aware attention network for occluded person re-id. In Proceedings of the Proceedings of the IEEE/CVF International Conference on Computer Vision, Montreal, QC, Canada, 10–17 October 2021; pp. 11833–11842. [Google Scholar]
  43. Zhu, X.; Su, W.; Lu, L.; Li, B.; Wang, X.; Dai, J. Deformable detr: Deformable transformers for end-to-end object detection. arXiv 2020, arXiv:2010.04159. [Google Scholar]
  44. Yang, L.; Zhang, R.-Y.; Li, L.; Xie, X. Simam: A simple, parameter-free attention module for convolutional neural networks. In Proceedings of the International Conference on Machine Learning, Vienna, Austria, 18–24 July 2021; pp. 11863–11874. [Google Scholar]
  45. Zhou, T.; Ruan, S.; Vera, P.; Canu, S. A Tri-Attention fusion guided multi-modal segmentation network. Pattern Recognit. 2022, 124, 108417. [Google Scholar] [CrossRef]
  46. Guo, M.-H.; Lu, C.-Z.; Hou, Q.; Liu, Z.; Cheng, M.-M.; Hu, S.-M. Segnext: Rethinking convolutional attention design for semantic segmentation. Adv. Neural Inf. Process. Syst. 2022, 35, 1140–1156. [Google Scholar]
  47. Xia, Z.; Pan, X.; Song, S.; Li, L.E.; Huang, G. Vision transformer with deformable attention. In Proceedings of the IEEE/CVF Conference on Computer Vision and Pattern Recognition, New Orleans, LA, USA, 18–24 June 2022; pp. 4794–4803. [Google Scholar]
  48. Wan, D.; Lu, R.; Shen, S.; Xu, T.; Lang, X.; Ren, Z. Mixed local channel attention for object detection. Eng. Appl. Artif. Intell. 2023, 123, 106442. [Google Scholar] [CrossRef]
  49. Woo, S.; Park, J.; Lee, J.-Y.; Kweon, I.S. Cbam: Convolutional block attention module. In Proceedings of the European Conference on Computer Vision (ECCV), Munich, Germany, 8–14 September 2018; pp. 3–19. [Google Scholar]
  50. Huang, Z.; Wang, X.; Huang, L.; Huang, C.; Wei, Y.; Liu, W. Ccnet: Criss-cross attention for semantic segmentation. In Proceedings of the IEEE/CVF International Conference on Computer Vision, Seoul, Republic of Korea, 27 October–2 November 2019; pp. 603–612. [Google Scholar]
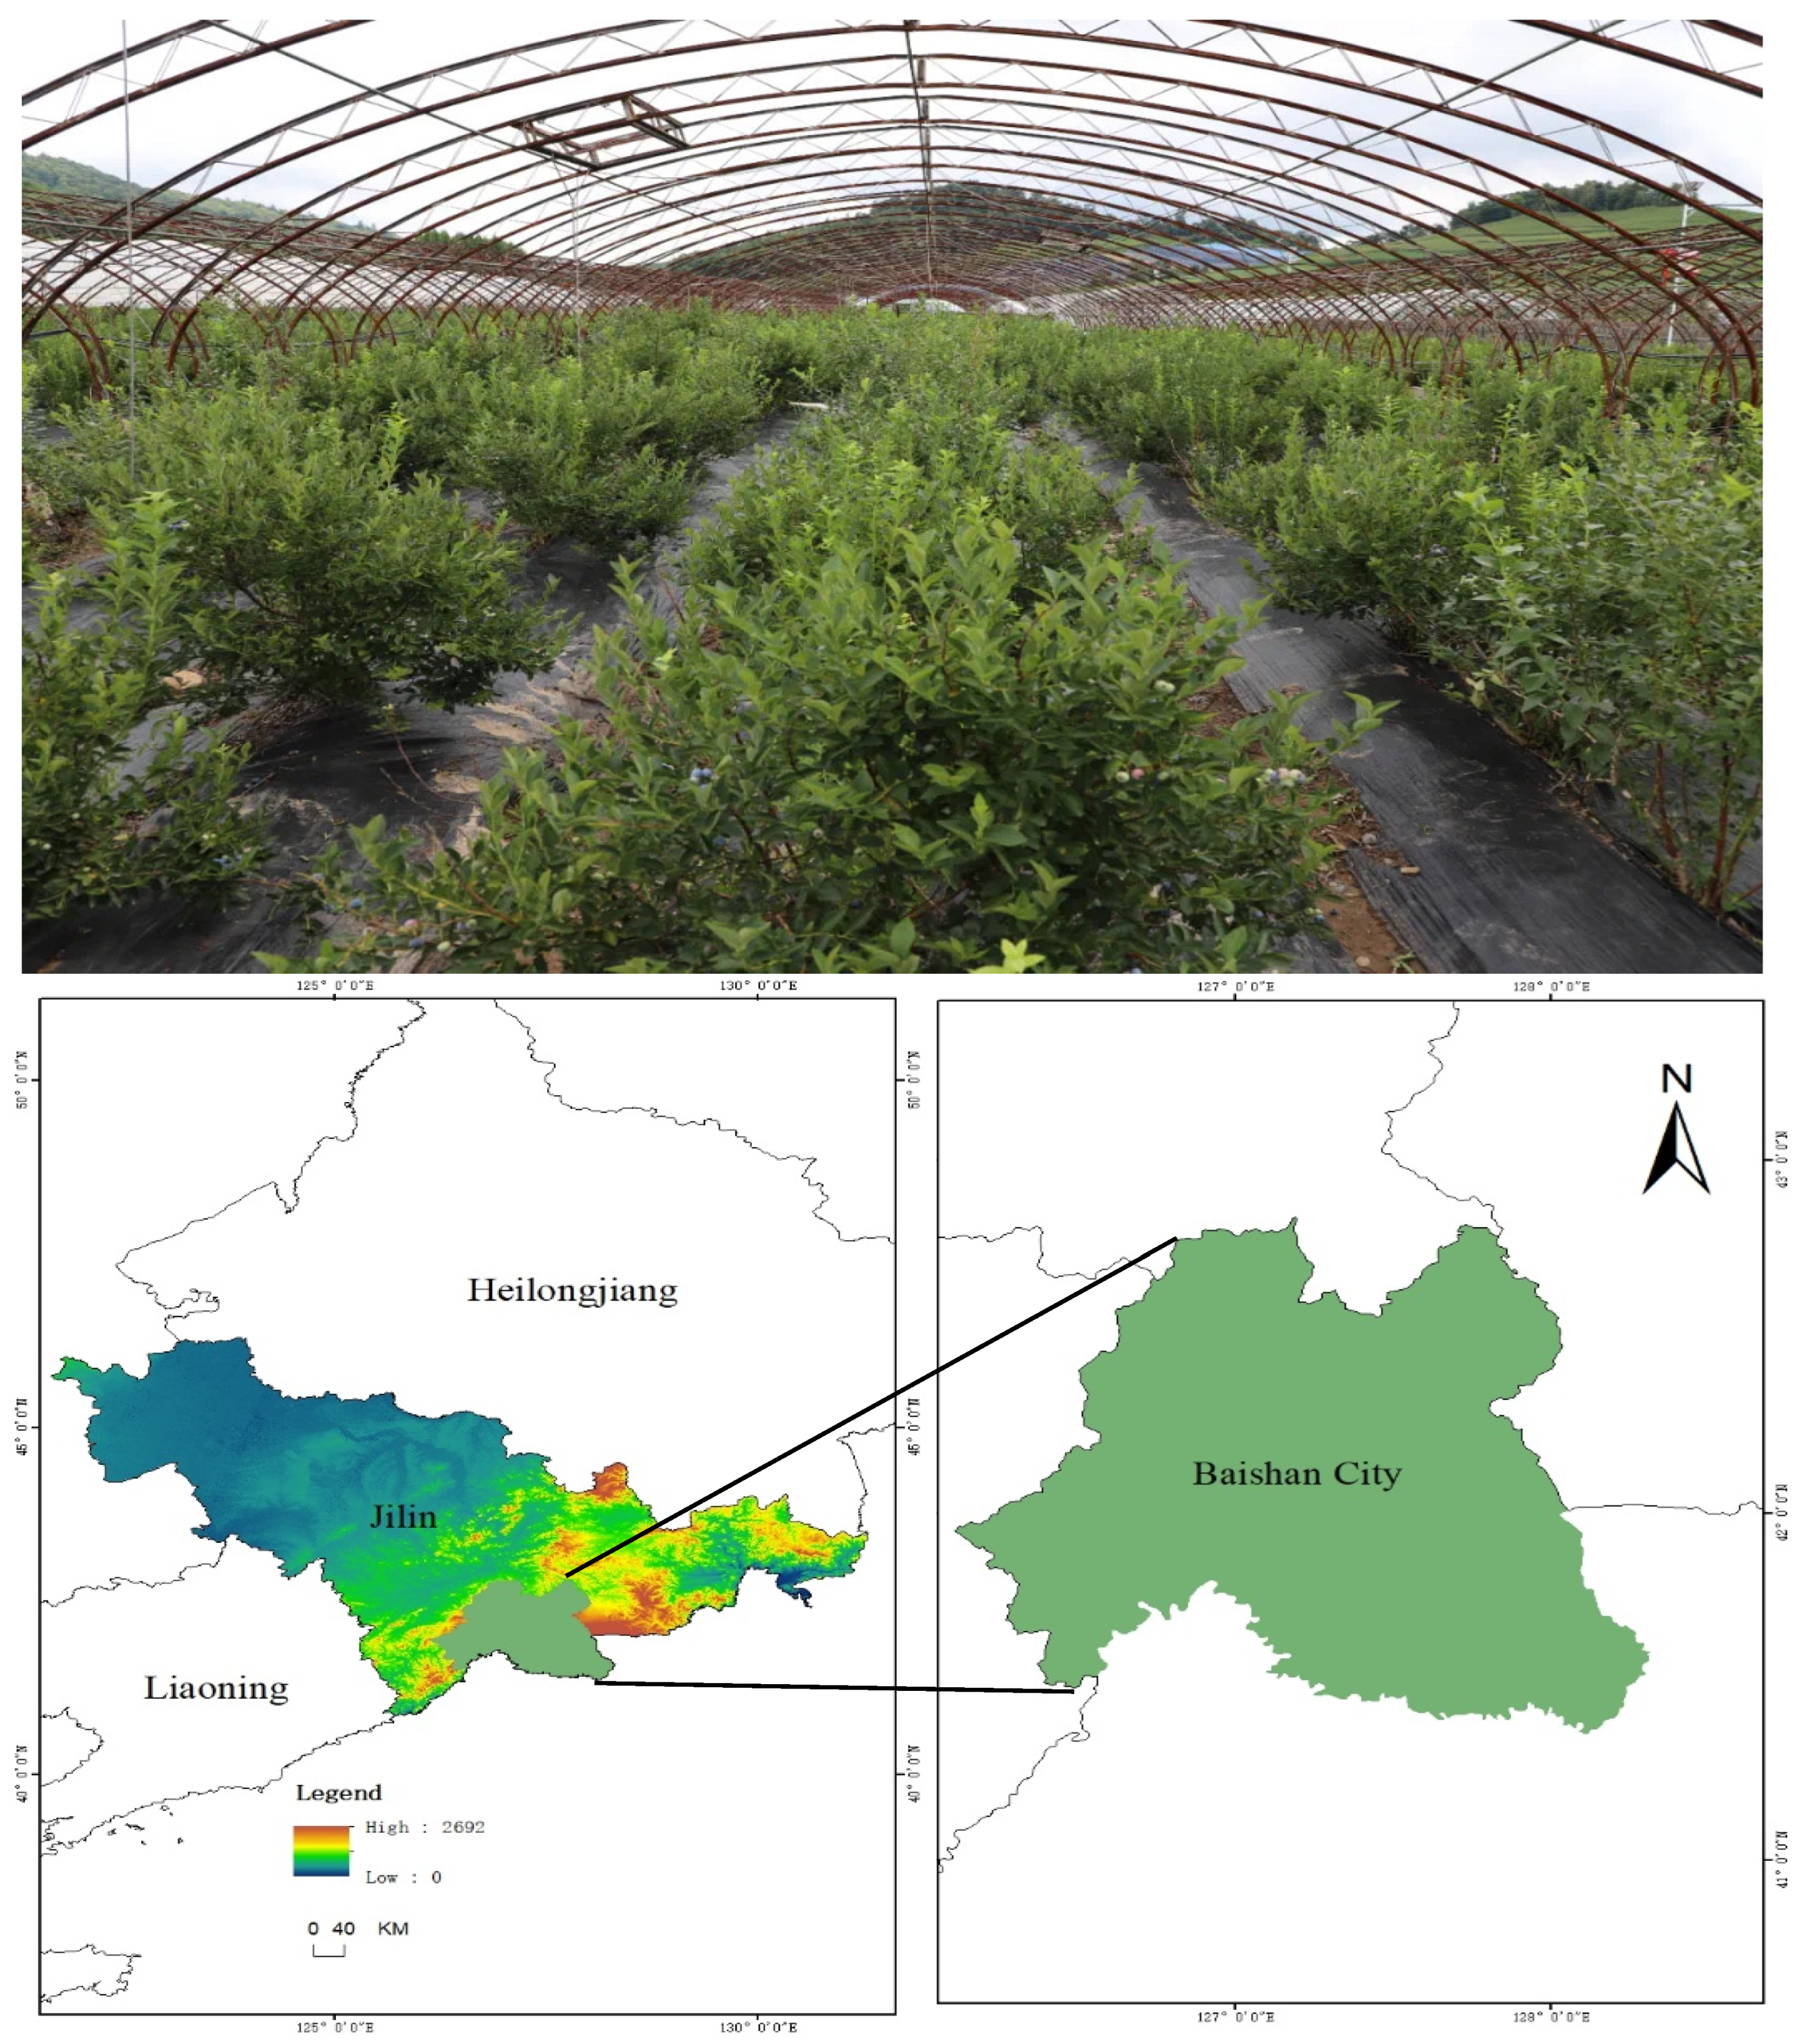
Figure 1. Geographic location and harvesting environment.
Agronomy 15 01948 g001
Figure 2. Photographs of three blueberry ripening stages: (a) fully mature, (b) semi-mature, and (c) immature.
Agronomy 15 01948 g002
Figure 3. Enhanced presentation using data.
Agronomy 15 01948 g003aAgronomy 15 01948 g003b
Figure 4. CES-YOLO network structure.
Agronomy 15 01948 g004
Figure 5. Network structure of the C3K2-Ghost module.
Agronomy 15 01948 g005
Figure 6. EMA module structure.
Agronomy 15 01948 g006
Figure 7. Overall structural diagram of the SEAMhead.
Agronomy 15 01948 g007
Figure 8. Comparison chart of effects before and after improvement. Note: mAP50 is the average accuracy of the IoU threshold of 0.5, and mAP50~95 is the average of the mAP when the IoU threshold is 0.5 to 0.95.
Agronomy 15 01948 g008
Figure 9. Comparison of confusion matrices.
Agronomy 15 01948 g009
Figure 10. Comparison chart of process indicators in ablation experiments.
Agronomy 15 01948 g010
Figure 11. Comparison chart of loss curves in the ablation experiment process.
Agronomy 15 01948 g011
Figure 12. Comparison chart of different models for the mAP metric.
Agronomy 15 01948 g012
Figure 13. Radar chart comparing performance metrics of different attention mechanisms.
Agronomy 15 01948 g013
Figure 14. Thermal comparison chart of different attention mechanisms.
Agronomy 15 01948 g014
Figure 15. Comparison chart of detection effects of different models.
Agronomy 15 01948 g015
Figure 16. Real-time deployment of the proposed model on the NVIDIA Jetson Orin Nano.
Agronomy 15 01948 g016
Table 1. Detailed hyperparameters of the experiment.
ParametersSetup
Epochs200
Batch Size16
OptimizerSGD
Initial Learning Rate0.01
Final Learning Rate0.01
Momentum0.937
Weight-Decay5 × 10−4
Close MosaicLast ten epochs
Images640
workers8
Mosaic1.0
Table 2. Table of ablation experiment results.
Model CodeC3K2-
Ghost
EMA
Attention
SEAM
Head
Precision (%)Recall (%)mAP50 (%)mAP95 (%)Parameters (M)Flops
(G)
Model-A×××84.6383.1588.8865.132.66.2
Model-B××84.5783.9989.4965.922.25.5
Model-C××86.4083.7189.7566.032.66.2
Model-D××86.9682.2389.0465.382.55.9
Model-E×88.5281.7390.0667.132.25.5
Model-F×87.0684.0589.9266.642.55.9
Model-G×89.1284.7891.0468.972.15.0
Model-H89.2185.2391.2269.182.15.0
Note: mAP50 is the average accuracy of the IoU threshold of 0.5, and mAP50~95 is the average of the mAP when the IoU threshold is 0.5 to 0.95.
Table 3. Comparison chart of experimental results of different models.
ModelsPrecision (%)Recall (%)mAP50 (%)mAP95 (%)Parameters (M)Flops (G)
SSD (resnet-50)81.7280.6784.3059.0746.715.1
RT-DETR-l84.0984.1789.1065.2232103.5
YOLOv5n81.8282.5587.1764.912.57.1
YOLOv8n84.7782.2287.8065.273.08.2
YOLOv10n83.5881.9087.1064.982.78.3
YOLOv11n84.6383.1588.8865.132.66.6
YOLOv12n84.6682.9588.5365.172.56.0
CES-YOLO89.2185.2391.2269.182.76.5
Table 4. Comparison chart of experimental results of different attention mechanisms.
Attention MethodPrecision (%)Recall (%)mAP50 (%)mAP95 (%)
SimAM85.9782.8388.8765.77
TripleAttention82.3483.1888.4063.12
SegNextAttention86.9781.3589.1562.34
DAttention84.9882.2589.1664.57
MLCA83.9281.4188.4765.82
CBAM81.2582.7185.1461.27
CAFM82.8182.7387.7863.56
EMA86.4083.7189.7566.03
Table 5. FPS data of different models on the NVIDIA Jetson Orin Nano.
ModelsSSDRT-Detr-lYOLOv5nYOLOv8nYOLOv10nYOLOv11nYOLOv12nCES-YOLO
FPS12.28.917.518.319.719.118.920.3
Disclaimer/Publisher’s Note: The statements, opinions and data contained in all publications are solely those of the individual author(s) and contributor(s) and not of MDPI and/or the editor(s). MDPI and/or the editor(s) disclaim responsibility for any injury to people or property resulting from any ideas, methods, instructions or products referred to in the content.