Article

Field-Based Assessment of Soil Salinity and Alkalinity Stress on Growth and Biochemical Responses in Eggplant (Solanum melongena L.)

by
Eren Özden
1,2,*,
Faruk Tohumcu
3 and
Serdar Sarı
3
1
Department of Horticulture, Faculty of Agriculture, Iğdır University, 76000 Suveren, Turkey
2
Department of Horticulture and Agronomy, Faculty of Agriculture, Kyrgyz-Turkish Manas University, Chyngyz Aitmatov Campus (Djal), Bishkek 720038, Kyrgyzstan
3
Department of Soil Science and Plant Nutrition, Faculty of Agriculture, Iğdır University, 76000 Suveren, Turkey
*
Author to whom correspondence should be addressed.
Agronomy 2025, 15(8), 1945; https://doi.org/10.3390/agronomy15081945
Submission received: 9 July 2025 / Revised: 1 August 2025 / Accepted: 7 August 2025 / Published: 12 August 2025
(This article belongs to the Section Soil and Plant Nutrition)

Abstract

Soil salinity and sodicity are escalating global threats to agricultural productivity, severely limiting crop yield and quality. In the Igdir Plain of Türkiye, high summer temperatures, minimal precipitation, and a shallow groundwater table have intensified salinity-related challenges, currently affecting one-third of the arable land. Despite the substantial impact of salinity stress on eggplant (Solanum melongena L.) production, studies addressing plant tolerance mechanisms under real field conditions remain limited. In this study, eggplant was cultivated in eight distinct soil classes under open-field conditions to evaluate the effects of soil salinity and saline-alkalinity on morphological, physiological, and biochemical traits. Increasing soil exchangeable sodium percentage (ESP) and electrical conductivity (ECe) levels significantly suppressed plant height, root length, stem diameter, and leaf area, along with over 90% reductions in shoot and root biomass. Salinity impaired the uptake of essential nutrients (Ca, K, P, and Fe), while promoting toxic Na+ accumulation in leaves. This ionic imbalance induced oxidative stress, as indicated by elevated malondialdehyde (MDA), hydrogen peroxide (H2O2), and antioxidant enzyme activities (SOD, CAT, APX), all of which were strongly correlated with proline accumulation. The results highlight a coordinated plant response under salinity stress but also reveal the insufficiency of natural defense mechanisms under high salinity levels. Unless supported by external interventions to improve stress resilience and ensure productivity, growing eggplant in saline–alkaline soils should be avoided.

1. Introduction

Plants exhibit their optimal physiological functions under favorable environmental conditions. Although plants are capable of sustaining growth and development through daily and seasonal changes due to the flexibility of their normal metabolism, continuous or intermittent exposure to unexpected adverse conditions can lead to physiological alterations, damage, or diseases that may impair growth and survival [1]. Such conditions that negatively affect or inhibit plant growth, development, and metabolism are defined as stress [2]. Stress factors often affect plants simultaneously and in combination [3].
Salinity is one of the most critical limiting factors among abiotic stresses caused by adverse environmental conditions. It typically occurs in arid and semi-arid climates when soluble salts, which leach into groundwater, rise to the soil surface due to a high water table, and subsequently accumulate near or on the surface as water evaporates [4].
Salt stress is a complex phenomenon involving physical, physiological, and ionic imbalances in plants [5]. As the concentration of soluble salts—especially NaCl—in the soil increases, plant growth and development are negatively affected. The increase in soil salinity and the accompanying decrease in water potential lower the osmotic potential of plant cells, triggering various physiological responses in plants [6,7]. Depending on the severity and duration of salt stress, numerous vital processes in plants such as cell division, germination, growth, development, and photosynthesis may be affected [8,9], ultimately limiting crop productivity and quality in agricultural lands [10].
Soil salinity affects over 1 billion hectares of land globally [11,12] and continues to expand, increasingly impacting arable agricultural areas [13]. In Türkiye, approximately 5.5% of the total land area faces the threat of salinity [14]. This situation causes significant economic losses due to the decline in crop yield and quality [15]. By 2030, hot and dry climates are expected to have a pronounced impact on Southern Europe, including Türkiye, thereby adversely affecting plant production [16].
Globally, approximately 55 million tons of eggplant are produced on 192,000 hectares, while Türkiye accounts for about 818,000 tons produced on 17,000 hectares [17]. These figures indicate that this species, a member of the Solanaceae family, is among the most widely cultivated and economically significant vegetables in both the world and Türkiye. Eggplant is considered a moderately salt-tolerant vegetable species [18], and at a threshold electrical conductivity (EC) of 1.1 dS m−1, each unit increase in EC results in an approximate yield reduction of 6.9% [19]. Therefore, the increasing prevalence of drought and salinity due to global warming may directly jeopardize eggplant production.
Salt stress affects numerous metabolic activities in a complex manner. One of the key metabolic disturbances induced by salinity is the overproduction of reactive oxygen species (ROS). ROS can damage cellular components such as membrane lipids, nucleic acids, proteins, chlorophylls, and other macromolecules [20]. The damage inflicted by ROS on cell membranes occurs via lipid peroxidation [21]. Lipid peroxidation leads to the formation of malondialdehyde (MDA), a product that indicates membrane damage. Salt-tolerant plants typically produce lower levels of MDA compared to sensitive ones, which helps mitigate tissue and ion leakage [22]. To protect against ROS generated under salt stress, plants employ both non-enzymatic antioxidants such as ascorbate, glutathione, α-tocopherol, and carotenoids, as well as antioxidant enzymes including catalase (CAT), peroxidase (POX), glutathione reductase (GR), and superoxide dismutase (SOD) [19].
Although many studies have investigated the effects of salt stress on species like eggplant, there remains a lack of comprehensive research conducted under real field conditions and across different soil types, focusing on extensive morphological and physiological observations. The objective of this study is to examine the impact of salt stress on eggplant plants grown in soils with varying salinity levels and to assess the physiological responses of the plants to these stress conditions. The main hypothesis here is to reveal the extent to which plant development is affected by saline and saline–alkaline environments under actual field conditions, and to relate this to physiological observations. Accordingly, rather than merely documenting growth retardation with increasing salinity, this study aims to clarify how cellular degradation levels and defense metabolism respond, and how these processes are interconnected with nutrient uptake.

2. Materials and Methods

2.1. Materials

Experimental Conditions and Soil–Plant Material

The experimental applications were conducted in 2020 and 2021 at the Igdir University Agricultural Research and Application Center, while the laboratory analyses were carried out at the Department of Horticulture (Vegetable Cultivation and Breeding Laboratory) and the Department of Soil Science and Plant Nutrition laboratories, Faculty of Agriculture, Igdir University.
Trial plots were established in 8 different locations in the research center, and the research was planned according to the trial design with 4 replications in each plot. The locations were named as U1, U2, U3, U4, U5, U6, U7, and U8. The plots within the location were divided into 4 × 15 m.
Eggplant seedlings became ready for transplanting on the 35th day after sowing into seedling trays. The seedlings were transplanted into the plots as soil-grown (potted) plants with an intra-row spacing of 50 cm and inter-row spacing of 80 cm. In the study, the open-pollinated eggplant variety Kemer-27, which has the largest cultivation area in the Iğdır Plain, was used (Küçük Çiftlik Seed Company, Balikesir, Turkey, Seed Packaging Date: August 2018). Eggplant cultivation was conducted in two separate periods, each 20 days apart. The first group of seedlings was transplanted on 17 April 2019, and the second group on 7 May 2019. According to the data obtained from the meteorological station located at the Iğdır University Agricultural Research and Application Center, air temperature and humidity at the time of seedling transplantation were recorded as 14.7–14.9 °C and 93.5–91.7 mm, respectively, depending on the cultivation period. At harvest time, the corresponding values were 32.9–32.6 °C for temperature and 12.1–12.3 mm for humidity.
To ensure repeatability, all soil classes were irrigated every four days using a drip irrigation system. Pest and disease management was carried out regularly; no disease symptoms were observed, and insects that could potentially cause pest outbreaks were manually collected to prevent population increase. Soil temperature and moisture were measured twice between plots using a thermometer and a tensiometer, and no microclimatic variations were observed.
Soil samples were taken from a depth of 0–30 cm in each plot and sieved through a 2 mm mesh for physical and chemical analyses. The soil analysis results for the locations within the research area are presented in Table 1. During the experiment, soil samples were continuously collected from the cultivation areas and subjected to analysis.

2.2. Methods

2.2.1. Soil Analyses

Soil texture was determined by the Bouyoucos hydrometer method [25], lime content by the Scheibler calcimeter method [26] and organic matter (OM) content by the Smith–Weldon method [27].
Soil pHe and ECe were determined in saturation extracts using a glass electrode pH meter [28] and standard EC electrode [29], respectively.
Cation exchange capacities (CECs) of the soils were determined by sodium adsorption with sodium acetate (1 N, pH = 8.2) and then extracted with ammonium acetate (1 N, pH = 7.0), Na was read in the ‘ICP OES spectrophotometer’ [30], and exchangeable cations were determined by reading Na, K, Ca, and Mg in the ICP OES spectrophotometer after shaking and extracting with ammonium acetate (1 N, pH = 7.0) [31].
Exchangeable sodium percentage (ESP) of soils was obtained by subtracting the amount of Na determined in the saturation extract from the amount of exchangeable Na+ determined by ammonium acetate and dividing by the CEC. Water-soluble Na concentration was determined from saturation extracts using a flame photometer. The ESP was calculated according to the USDA [24] (Table 1).

2.2.2. Plant Quality Parameters

At the end of the growing period, the following observations were made on samples taken from five plants from each treatment group:
Plant height (PH): The height from the stem base (at the soil level) to the apical meristem on the main stem (cm) was measured using a digital caliper.
Root length (RL): Roots were carefully removed from the growing medium to avoid damage as much as possible, and measurements (cm) were based on the section where approximately 90% of the root mass was concentrated.
Stem diameter (SD): The diameter of the main stem was measured at the midpoint using a digital caliper (mm2).
Leaf area (LA): After fruit harvest, 20 randomly selected leaves from the same plant were photographed under fixed distance and pixel resolution. Measurements were performed using the imagej2 2015 software, and results were expressed as cm2 based on average values.
Plant fresh weight (PFW) and dry weight (PDW): For fresh weight, the aboveground part of the plant was cut at the stem base and weighed using an analytical balance with 0.0001 g precision. To determine dry weight, the fresh plant material was kept at room temperature for 24 h, then dried in an oven at 80 °C for 24 h, and reweighed with the same precision balance. Both fresh and dry weights were expressed in grams (g).
Root fresh weight (RFW) and dry weight (RDW): For fresh weight, the belowground part of the plant (roots) was separated after cutting from the stem base and weighed using a precision balance (0.0001 g). To determine dry weight, the roots were first kept at room temperature for 24 h, followed by drying in an oven at 80 °C for 24 h, and then weighed again. Both root fresh and dry weights were expressed in grams (g).

2.2.3. Macro and Micro Element Analyses in Plants

After the plant leaves were dried and grounded, 0.5 g samples were taken and analyzed. P, K, Ca, Na, Mg, Fe, Mn, Zn, Cu, and B contents of the plant samples were analyzed with nitric acid–hydrogen peroxide (2:3) in 3 different steps (Step 1: 5 min at 145 °C at 75% microwave power, Step 2: 10 min at 180 °C at 90% microwave power, and Step 3: 10 min at 100 °C at 40% microwave power). (P, K, Ca, Na, Mg, Fe, Mn, Zn, Cu, and B) were determined using an ICP OES spectrophotometer (Inductively Couple Plasma spectrophotometer) (Thermo Scientific, ICAP 6300 Duo, Waltham, Massachusetts, U.S.) after being subjected to 40 bar pressure resistant microwave wet digestion unit (CEM Corporation, Matthews, NC, USA) [32,33].

2.2.4. Physiological Analyses

Hydrogen Peroxide (H2O2) Activity
A 0.5 g leaf sample was homogenized in an ice bath with 5 mL of 0.1% (w/v) trichloroacetic acid (TCA). The homogenate was centrifuged at 12,000× g for 15 min. Then, 0.5 mL of the supernatant was mixed with 0.5 mL of 10 mM potassium phosphate buffer (pH 7.0) and 1 mL of 1 M potassium iodide (KI). The absorbance of the mixture was measured at 390 nm, and the hydrogen peroxide content was quantified using a standard curve [34].
Lipid Peroxidation (MDA) content
Lipid peroxidation in plants was expressed as the malondialdehyde (MDA) content. A 0.5 g leaf sample was homogenized in 10 mL of 0.1% TCA, and the homogenate was centrifuged at 15,000× g for 5 min. From the clear supernatant, 1 mL was taken and mixed with 4 mL of 0.5% thiobarbituric acid (TBA) prepared in 20% TCA. The mixture was incubated at 95 °C for 30 min, then quickly cooled in an ice bath. After centrifugation at 10,000× g for 10 min, the absorbance of the supernatant was recorded at 532 nm and 600 nm. The malondialdehyde (MDA) content was then calculated using the following formula [35,36].
M D A ( n m o l × m L 1 ) = A 532 A 600 ÷ 15500 × 10 6
Antioxidant Enzyme Activities
Leaves collected from each cultivation area were weighed (0.5 g) and ground in porcelain mortars with liquid nitrogen. The ground tissue was homogenized with 5 mL of cold extraction buffer consisting of 0.1 M sodium phosphate buffer (pH 7.5), 0.5 mM Na-EDTA, and 1 mM ascorbic acid. The homogenates were centrifuged at 14,000× g for 30 min at 4 °C. The resulting extracts were kept at room temperature for 1 h. A portion of the homogenate was immediately used for catalase (CAT) activity measurement, and the remaining extracts were stored at −20 °C for later determination of superoxide dismutase (SOD) and ascorbate peroxidase (APX) activities [37].
Catalase (CAT; EC 1.11.1.6) Activity
The reaction mixture (final volume 1 mL) consisted of 2.5 mL of 0.05 M KH2PO4 buffer (pH 7.0), 1.5 mM H2O2, and 0.2 mL of enzyme extract. Enzyme activity was measured by the change in absorbance at 240 nm, with an extinction coefficient of 40 mM−1 cm−1, and expressed as the change per minute per mg protein [37].
Superoxide Dismutase (SOD; EC 1.15.1.1) Activity
SOD activity was determined according to the method developed by Sun et al. [38]. The reaction mixture contained 0.3 mM xanthine, 0.06 mM EDTA, 150 µg/L nitroblue tetrazolium (NBT), 400 mM Na2CO3, 1 g/L bovine serum albumin, 0.166 U/mL xanthine oxidase (diluted from stock using 2 M ammonium sulfate), 0.8 mM CuCl2·2H2O, and 50 µL enzyme extract. The reagent mixture was prepared in bulk with the following proportions: 50 mL xanthine, 25 mL EDTA, 25 mL NBT, 16 mL Na2CO3, and 7.5 mL albumin solution. For the assay, 2850 µL of reagent mix, 50 µL enzyme extract, 50 µL distilled water, and 50 µL xanthine oxidase enzyme were combined in a tube and incubated at 25 °C for 25 min. After incubation, 50 µL of CuCl2·2H2O was added to stop the reaction. Absorbance was measured at 560 nm against a blank tube containing distilled water. One unit of SOD activity was defined as the amount of enzyme required to cause 50% inhibition of NBT reduction under the assay conditions.
Ascorbate Peroxidase (APX; EC 1.11.1.11) Activity
The reaction mixture (final volume 1 mL) included 3 mL of 50 mM potassium phosphate buffer (pH 7.0), 0.5 mM ascorbic acid, 0.1 mM EDTA, 1.5 mM H2O2, and 0.1 mL of enzyme extract. The reaction was initiated by the addition of 0.1 mL enzyme extract. Enzyme activity was determined by monitoring the decrease in absorbance at 290 nm using an extinction coefficient of 2.8 mM−1 cm−1 and expressed as the change per minute per mg protein [36].
Proline
A 0.5 g leaf sample was homogenized in 10 mL of 3% sulfosalicylic acid and filtered through Whatman No. 2 filter paper. The proline content in the extract was determined spectrophotometrically according to the method described by Bates et al. [39].

2.2.5. Statistical Analysis

The study was conducted using a randomized complete block design with four replications. The obtained data were subjected to analysis of variance (ANOVA) using JMP Pro software (SAS Institute, version 14.3). Differences between means were determined by the Least Significant Difference (LSD) test at a 5% probability level. Correlation analysis was performed using the R4.4.0 statistical software package.

3. Results

3.1. Plant Growth

After two consecutive growing periods, the average highest plant height (PH) of the open-pollinated Kemer-27 eggplant cultivar was recorded as 153.1 cm in the U1 area, while the lowest PH was 34.6 cm in the U3 area. Other areas showed PH values between these extremes. Regarding root length (RL), it was determined that the U1 and U2 areas, where salinity was relatively lower compared to other areas, were statistically significant. The highest RL values were measured as 77.6 cm and 73.9 cm in the U2 and U1 areas, respectively, while the lowest was 20.3 cm in the U3 area. Notably, compared to the U1 area, plant height and root length in the U3 area decreased by 77.40% and 72.53%, respectively (Table 2).
Based on measurements of the main stems, it was observed that stem diameter (SD) was statistically lower in areas with relatively higher saline–alkaline and salinity conditions. The highest SD values were 1.52 cm and 1.49 cm in the U2 and U1 areas, respectively, whereas the lowest SD was 0.81 cm in the U3 area. Leaf area (LA) measurements were conducted on leaves sampled from the middle part of the plants after harvest, and it was statistically determined that LA decreased in parallel with increasing soil salinity. The highest LA values were 406.9 mm2 and 397.7 mm2 in the U1 and U2 areas, respectively, while the lowest LA was 23.0 mm2 in the U3 area. Other areas showed LA values between these limits. Compared to the U1 area, SD and LA in the U3 area decreased by 45.64% and 94.35%, respectively (Table 2).
Measurements aimed at determining plant mass showed that the fresh weight (FW) decreased with increasing salinity levels across the areas. The highest FW was recorded as 403.7 g in the U1 area, while the lowest FW was 16.9 g in the U3 area. Similarly, after proper drying of the plants, dry weight (DW) also decreased statistically in parallel with FW. The highest DW was found as 86.9 g in the U1 area, whereas the lowest DW was 5.2 g in the U3 area. The reductions in fresh and dry weights in the U3 area compared to U1 were remarkably high, at 95.81% and 94.02%, respectively (Table 3).
Similarly to plant fresh weight, fresh root weight (RFW) measurements showed a statistically significant decrease in RFW with increasing soil salinity. The highest RFW was recorded as 113.8 g in the U1 area, while the lowest was 6.0 g in the U3 area. Root dry weight (RDW) was also highest in the U1 and U2 areas, with values of 31.5 g and 29.6 g, respectively, and lowest in the U3 area at 1.9 g. Compared to the U1 area, the U3 area exhibited reductions of 94.73% and 93.97% in RFW and RDW, respectively (Table 3).

3.2. Nutrient Uptake

In our study, to investigate the nutritional status of eggplants grown in soils with different salinity classes, analyses of leaf samples revealed that the nutrient element contents varied according to soil salinity levels. Based on the average observations from consecutive production periods, calcium (Ca) content in eggplant leaves was highest at 8.62% in the U1 area, while the lowest values of 1.71% and 1.66% were recorded in the U6 and U3 areas, respectively (Figure 1A).
Potassium (K) content in eggplant leaves was highest at 5.86% in the U1 area and lowest at 2.28% in the U3 area. Similarly, magnesium (Mg) content was statistically highest at 1.58% in the U1 area and lowest at 0.44% in the U3 area. Phosphorus (P) content in the leaves was highest at 1.12% in the U1 area, while the lowest contents of 0.19% and 0.15% were found in the U6 and U3 areas, respectively. Sodium (Na) content showed different results compared to the other nutrient elements. The highest Na contents were found in the U3 and U6 areas at 0.73% and 0.68%, respectively, while the lowest was 0.05% in the U2 area (Figure 1A).
When micronutrient contents in eggplant leaves were examined, statistically significant differences were observed in all elements analyzed across different soil classes based on the averages of consecutive growing seasons. The highest iron (Fe) content was statistically recorded as 369.55 ppm in the U1 area, while the lowest was 47.20 ppm in the U3 area. Regarding manganese (Mn) content, the highest values were found in the U1 and U4 areas at 169.25 ppm and 159.09 ppm, respectively, whereas the lowest values were 81.55 ppm and 78.61 ppm in the U3 and U8 areas, respectively (Figure 1B).
Zinc (Zn) and copper (Cu) contents were considerably lower compared to other micronutrients. The highest Zn content was 79.03 ppm in the U5 area, and the lowest was 33.50 ppm in the U4 area. Cu contents were highest in the U1 and U4 areas at 47.00 ppm and 43.00 ppm, respectively, and lowest in the U8 area at 21.35 ppm (Figure 1B).

3.3. Cellular Damage Level

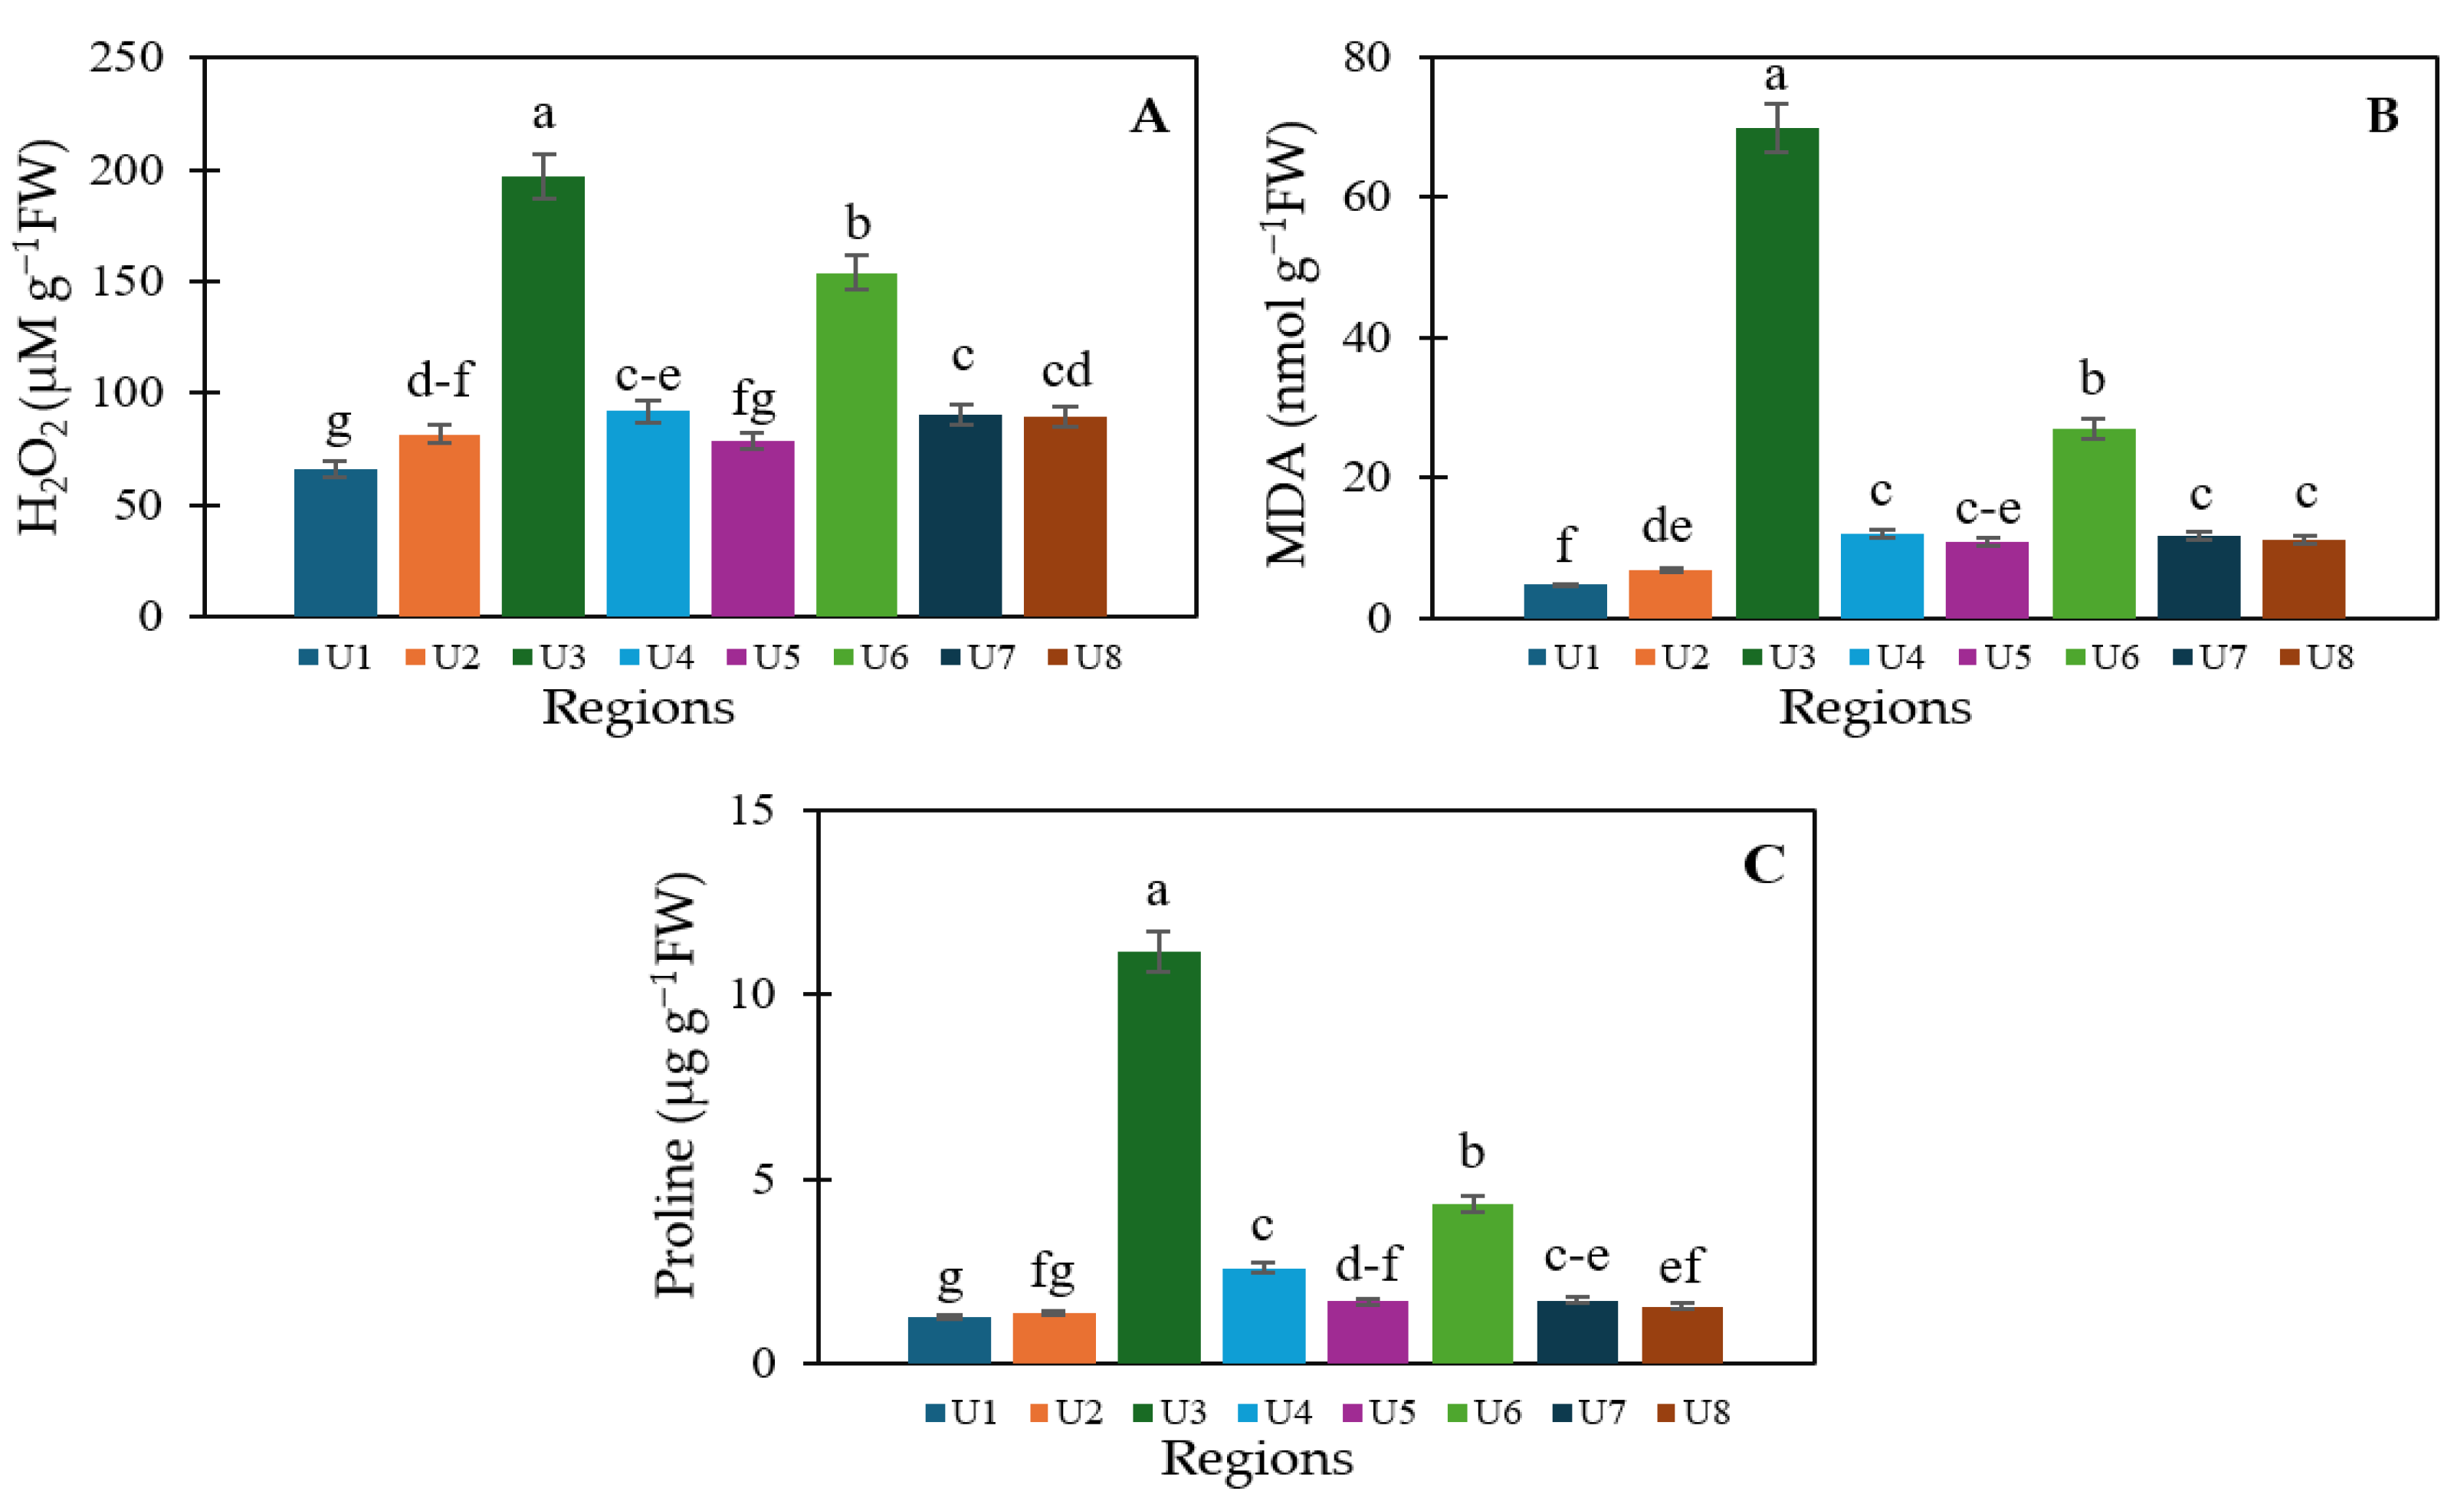
The effects of different salinity classes on lipid peroxidation levels, certain antioxidant enzyme activities, and proline amino acid content in eggplant leaves were found to be statistically significant. When examining hydrogen peroxide (H2O2) activity, one of the key indicators of cellular damage, the highest H2O2 activity was observed in eggplant leaves from the U3 area at 197.37 µM g−1 FW, while the lowest was recorded in the U1 area at 66.22 µM g−1 FW (Figure 2A).
Another indicator used to determine the level of cellular damage, malondialdehyde (MDA) activity, was also statistically significant. The highest MDA activity was found in the U3 area at 69.83 nmol g−1 FW, whereas the lowest was 4.67 nmol g−1 FW in the U1 area (Figure 2B).
When proline levels in eggplant leaves were examined, the highest proline content was found in plants grown in the U3 area at 11.15 μg g−1 FW, while the lowest level was recorded in the U1 area at 1.28 μg g−1 FW (Figure 2C).
These results indicate that the U3 area is the region where eggplant plants are most exposed to soil-borne stress. This stress condition initially causes cellular damage in the physiological parameters examined, followed by the activation of antioxidant defense mechanisms. The elevated proline levels in this area, an important indicator of plant defense against stress, suggest a strong defense response in the plant; however, plant growth is still adversely affected.

3.4. Antioxidant Capacity

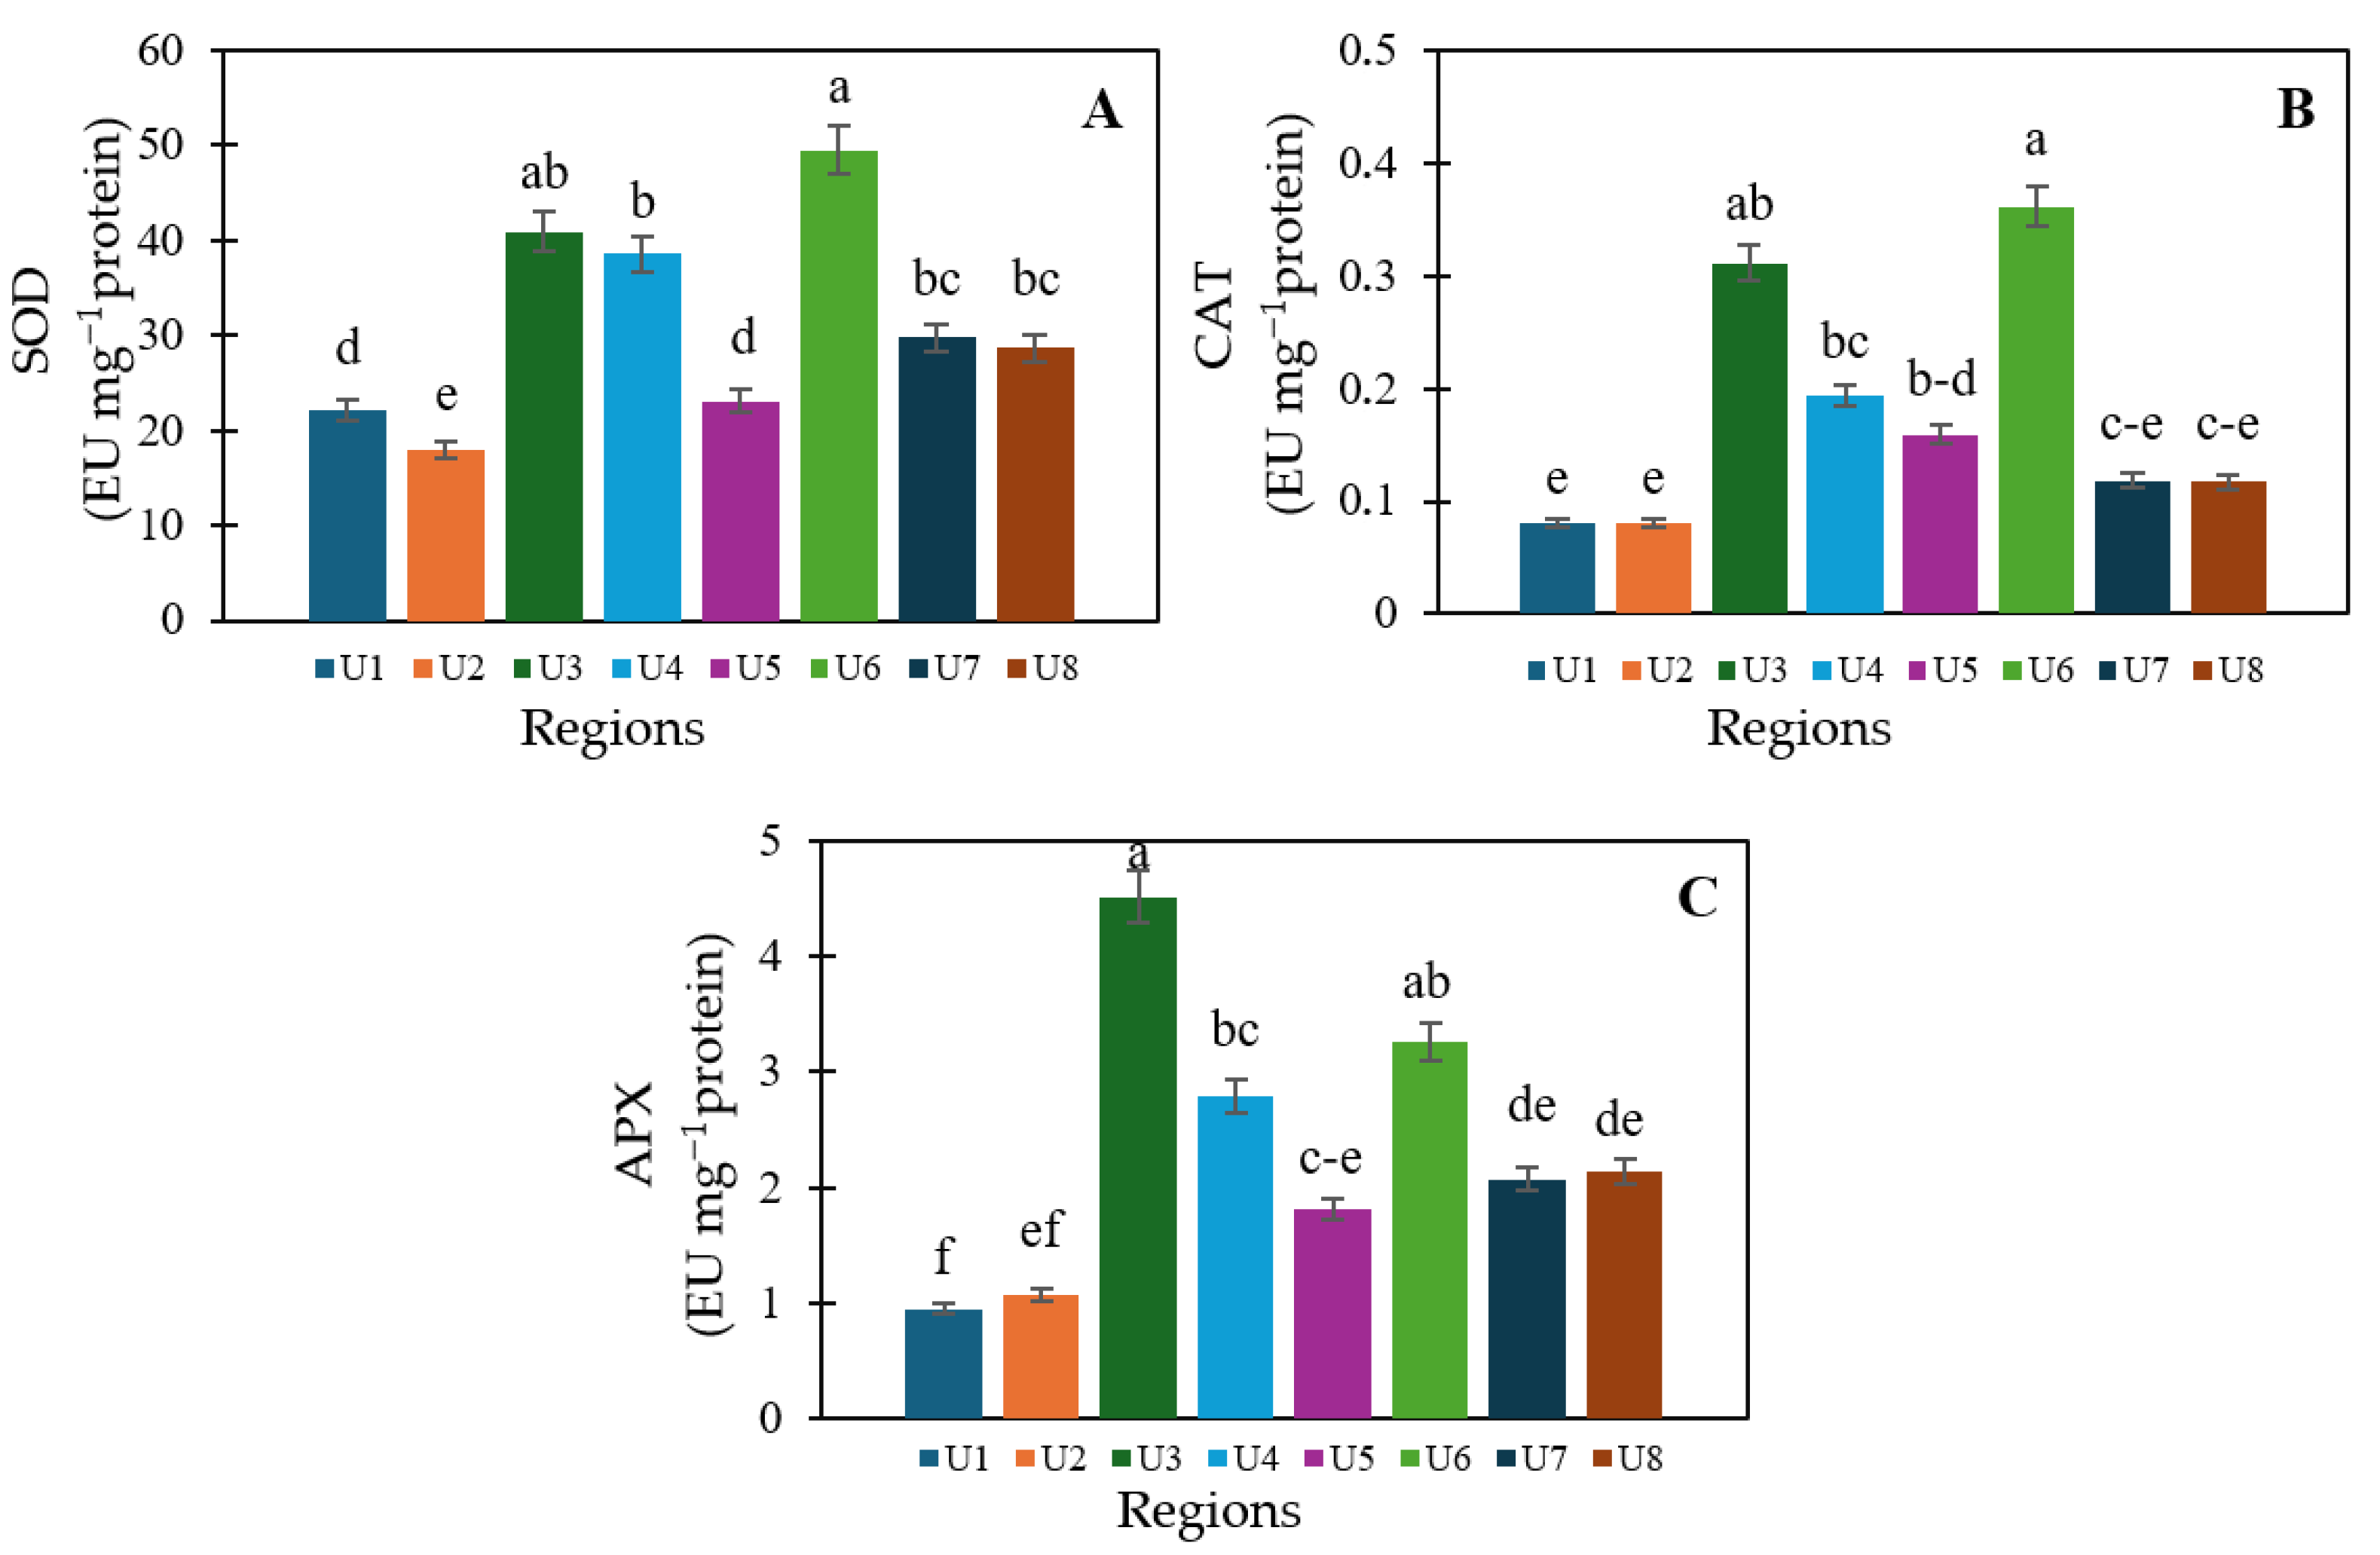
The activities of antioxidant enzymes SOD, CAT, and APX were all found to be statistically significant in eggplant leaves across the different cultivation areas. Superoxide dismutase (SOD) activity was highest in the U6 area at 49.55 EU mg−1 protein and lowest in the U2 area at 18.03 EU mg−1 protein (Figure 3A).
Regarding catalase (CAT) activities, the highest CAT activity was recorded as 0.362 EU mg−1 protein in the U6 area, while the lowest activity of 0.080 EU mg−1 protein was observed in the U1 and U2 areas (Figure 3B).
When ascorbate peroxidase (APX) activities in the leaves were examined, the highest APX activity was found in the U3 area at 4.510 EU mg−1 protein, and the lowest activity of 0.955 EU mg−1 protein was detected in the U1 area (Figure 3C).

3.5. Correlation Analysis

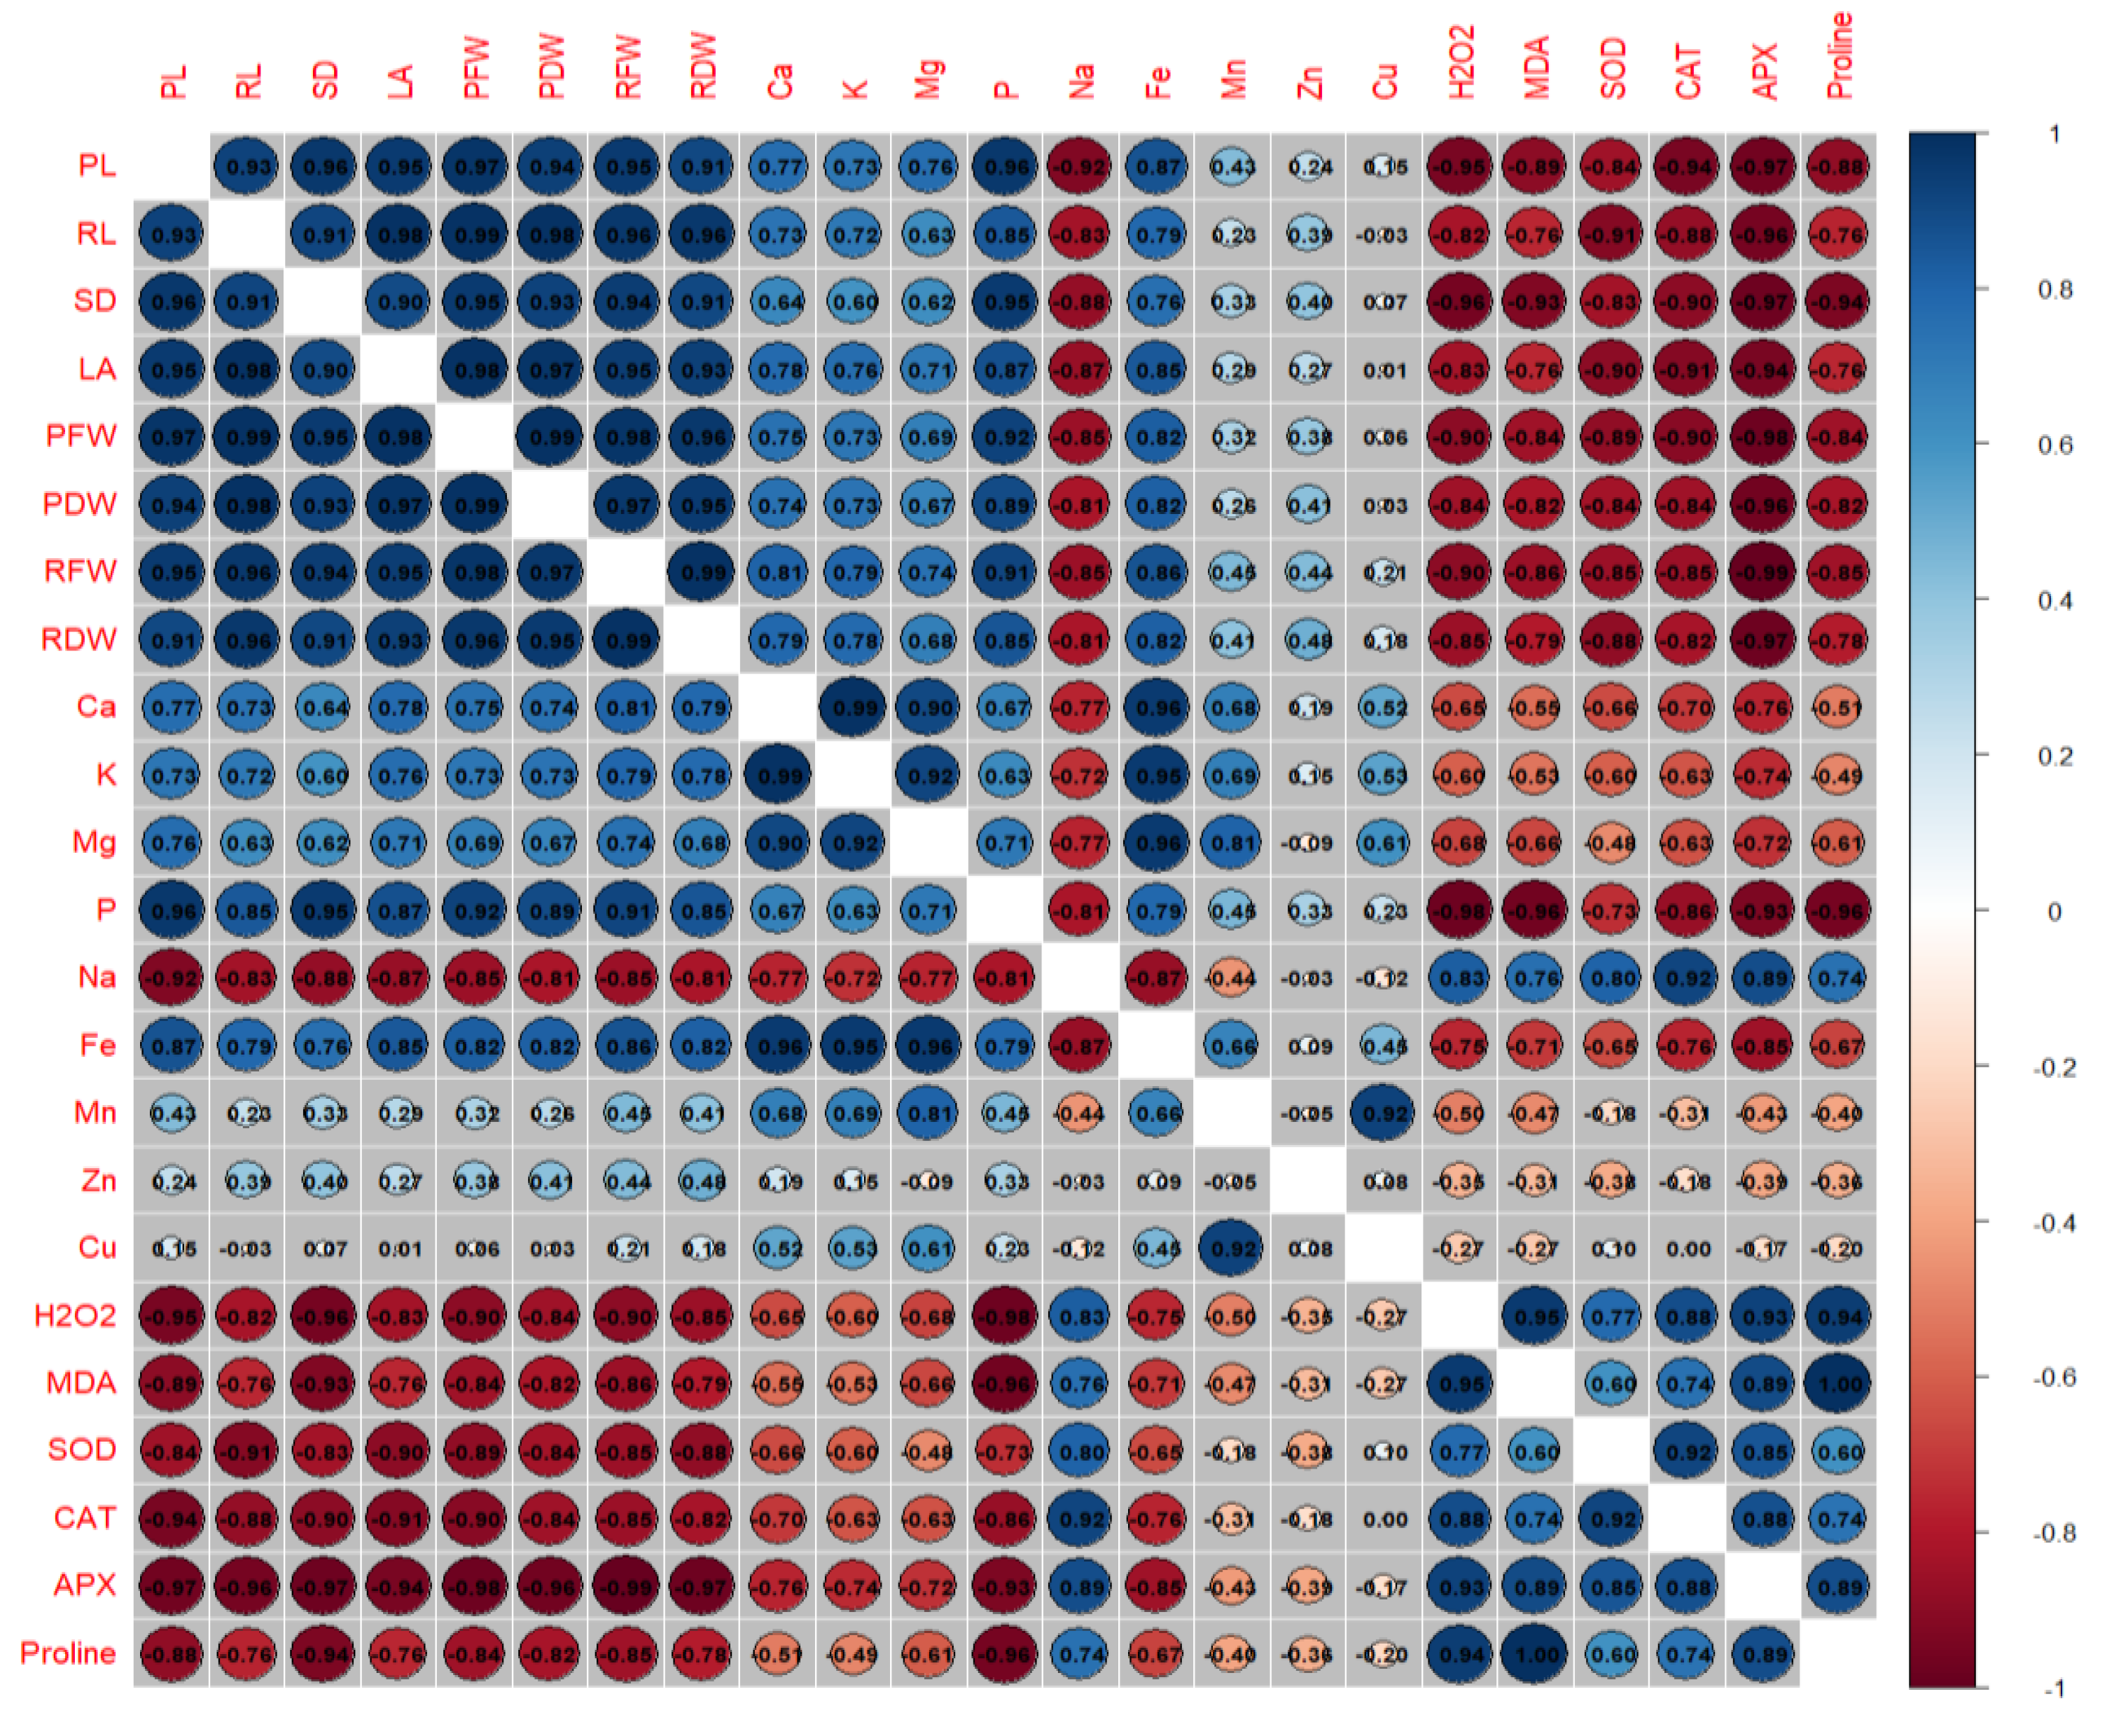
A correlation matrix was constructed to reveal the relationships among morphological, physiological, and stress-related parameters in plants grown under different soil classes (Figure 4). According to the analysis, growth-related parameters such as plant height (PL), root length (RL), stem diameter (SD), leaf area (LA), plant fresh weight (PFW), plant dry weight (PDW), root fresh weight (RFW), and root dry weight (RDW) showed strong positive correlations (r > 0.60) with nutrient uptake, especially phosphorus (P), as well as calcium (Ca), potassium (K), magnesium (Mg), and iron (Fe). However, these growth parameters exhibited strong negative correlations (r > 0.70) with stress markers including H2O2, MDA, proline, sodium (Na) uptake, and antioxidant enzymes (SOD, CAT, and APX). On the other hand, manganese (Mn) uptake, which showed low correlations with growth parameters, had high positive correlations (r > 0.60) with Ca, K, Mg, P, Fe, and copper (Cu) uptake, and a negative correlation (r > 0.40) with Na. Zinc (Zn) uptake was found to have very weak correlations (r < 0.40) with any growth, physiological, or nutrient uptake parameters (Figure 4).
In the correlation analysis of enzymes, a strong positive relationship was observed among the antioxidant enzymes (SOD, CAT, and APX) with correlation coefficients greater than 0.60, indicating the coordinated activation of enzymatic defense mechanisms against oxidative stress. These enzymes were also positively correlated (r > 0.70) with H2O2 and MDA, confirming their role in detoxifying reactive oxygen species (ROS) generated under salt stress (Figure 4).
Similarly, proline showed a high correlation with cellular damage indicators (r > 0.90) and antioxidant enzymes (r > 0.60), suggesting that as stress intensity increases, proline acts as a protective agent for the plant.

4. Discussion

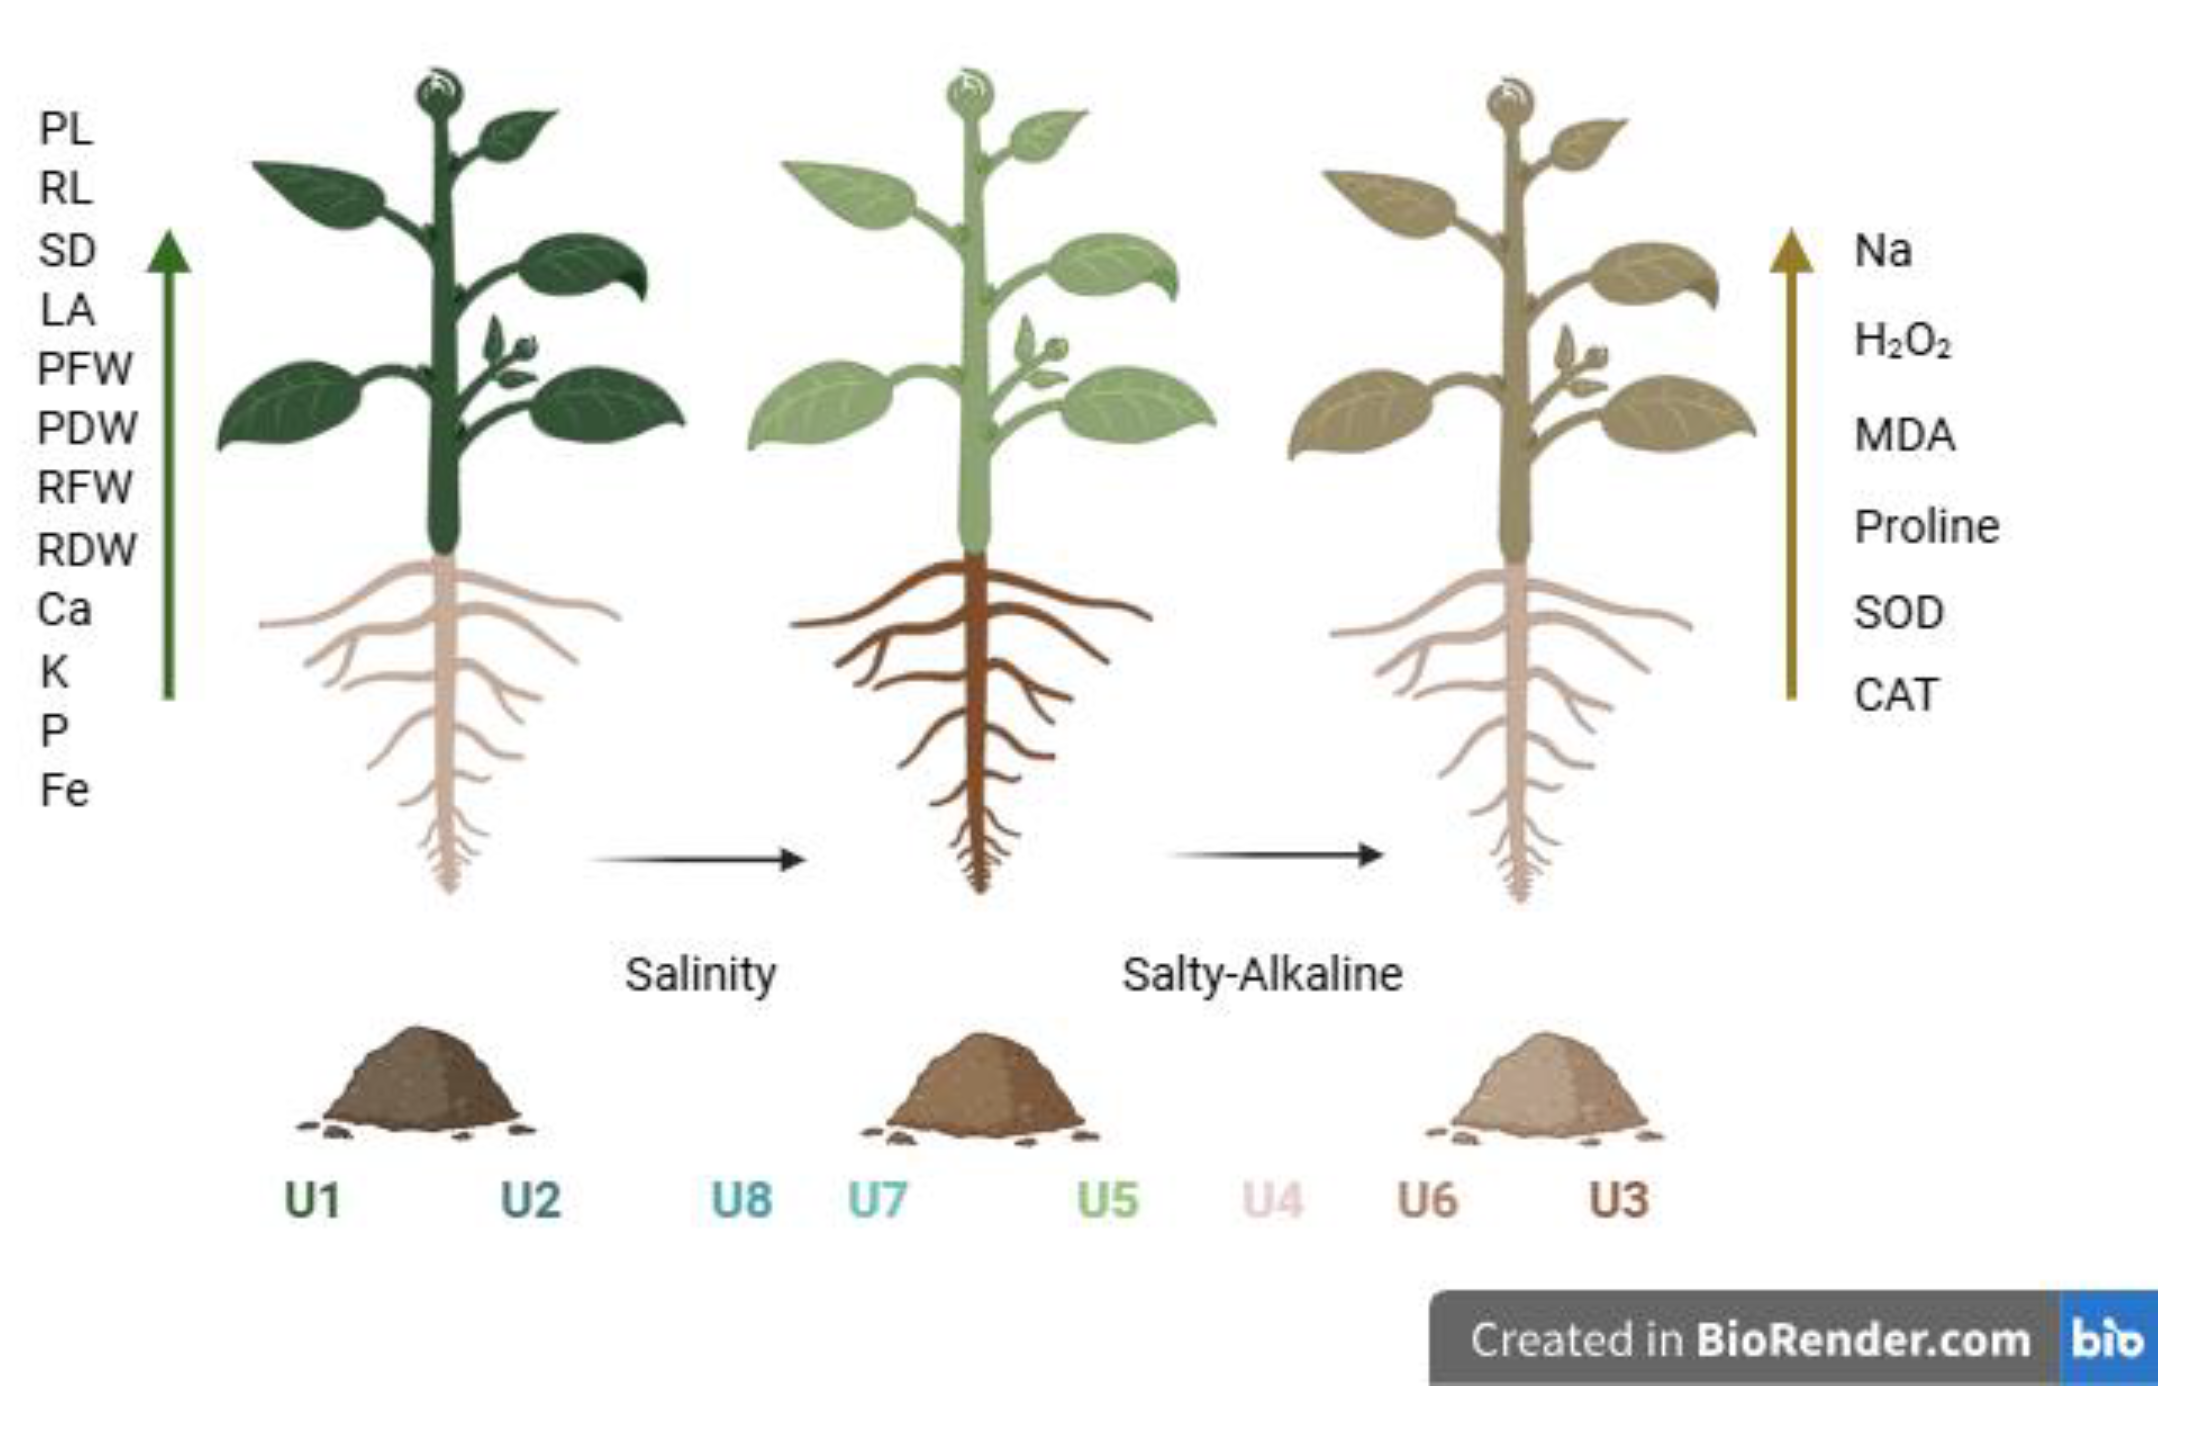
In the present study, the growth performance of eggplant plants exposed to salinity and saline–alkaline conditions was investigated through a range of morphological, physiological, and biochemical traits. The related findings were collectively visualized and are presented in Figure 5. It is evident that salinity, and especially saline-alkalinity, adversely affected plant development under real soil field conditions. Examining the growth across the treatment areas, it is clear that the soil’s exchangeable sodium percentage (ESP) and electrical conductivity (ECe) values play a decisive role in growth performance (Table 1).
Certain morphological traits in plants are known to develop more weakly or at reduced sizes under stress conditions. Numerous studies have reported that plant height decreases under drought and salinity stress in correlation with the severity of the stress, and that the development of stem, root, and other plant parts is adversely affected [40,41,42]. Jameel et al. [43] reported reductions in plant and root length in eggplant as salinity levels increased. Lopez et al. [44] described plant height as an indicator of vigor and stated that reduction in height is one of the first responses of plants to salt stress. Similarly, our findings show that plant height decreases as the salinity intensity of the growing medium increases.
Kıran et al. [45] in their study on eggplant, reported no significant decrease in fresh weight under different salt treatments but observed a marked decline in dry weights. They attributed this to one of the defense mechanisms, namely the dilution of intracellular toxic substances. Generally, the decrease in plant biomass under salinity stress is linked to osmotic imbalance caused by excessive uptake of Na+ and Cl ions, resulting in reduced metabolic activity [46]. Munns and Termaat [47] and Talhouni et al. [16] identified shoot length reduction as one of the earliest symptoms of salt stress. Overall, the reduction in plant height is considered an indicator of plant vigor and a response to salinity [48,49].
Lopez et al. [44] also reported that salinity reduces relative growth rate, leaf area, and dry matter content, along with a decrease in root dry weight depending on soil salinity, and they found a positive correlation between plant dry weight and leaf area. Moreover, Kıran et al. [45] reported that root fresh and dry weight, stem diameter, root length, and plant height were also inhibited by increasing salinity. Dikobe et al. [50] found decreases in stem and root length and weight, as well as leaf size reduction under salt stress. Other studies have similarly reported reductions in root fresh and dry weights due to drought and salinity stresses [43,51,52]. Our results indicate that plant and root lengths as well as weights decreased with increasing salinity severity.
The research findings demonstrate that as stress intensity increases in the growing environment, all morphological parameters of the plants decrease. While this is a well-known phenomenon, the main focus of this study was to reveal the relationships among these morphological parameters themselves and their correlations with physiological parameters examined. Indeed, Figure 4 shows that morphological traits have very high positive correlations and almost all exhibit similar declines under stress.
Under salt stress, the number of stomata decreases and leaf area is reduced as well. This serves as a mechanism for the plant to minimize water loss through transpiration. However, the reduction in leaf area leads to a decrease in CO2 fixation per unit leaf area, which slows down photosynthesis and consequently results in impaired growth and development [53]. Consistent with our findings, Abdelmageed and Gruda [54] reported a decrease in leaf area due to salt stress in tomato, while Chartzoulakis and Klapaki [55] observed similar effects in pepper plants.
Minhas et al. [56] suggested that increasing soil salinity reduces nutrient element uptake by plants, mainly because the osmotic pressure imposed by salt in the root zone diminishes the nutrient uptake capacity of the roots. In our study, Na content in leaves increased with salinity, while the uptake of most other nutrients generally decreased. Although there can be multiple reasons, the primary focus is often on the increased Na uptake. This is because Na accumulation in roots and leaves causes toxicity and disrupts ion transport [57,58].
Our findings revealed that as Na content increased in eggplant leaves from saline areas, Ca uptake decreased (Figure 1A). Calcium ions are among the essential elements necessary for growth and development. Na+ can displace Ca on the cell membrane, increasing the Na/Ca ion ratio in the apoplastic region. This disrupts the physiological and functional integrity of the membrane and affects the cell’s Ca homeostasis. High Na concentrations cause Ca bound within the inner membranes to be released, depleting internal Ca stores and increasing cytosolic free Ca [59].
Salt stress also negatively impacts K uptake similarly to Ca. Cebeci et al. [60] reported that salt-treated plants showed increased Na+ accumulation in roots and shoots, whereas K and Ca levels decreased. According to the correlation analysis by Ortega-Albero et al. [61], increased Na presence in eggplant leaves was associated with decreases in K, Mn, and Mg, while B and Zn levels showed no consistent changes across genotypes. Our study observed similar trends in nutrient uptake; Ca, K, P, and Fe uptake decreased as salinity intensified, whereas Mg, Zn, and Cu showed no significant differences. Some researchers have proposed approaches to mitigate Na dominance. For instance, applying Ca to the growth medium can enhance K/Na selectivity and reduce NaCl toxicity in plants [62,63]. It is believed that eggplant’s relatively high salt tolerance is linked to its ability to maintain low Na concentrations in leaves [64]. Conversely, excessive Na+ accumulation in leaves elevates Na/Ca and Na/K ratios, which leads to reduced total chlorophyll content and severe declines in growth parameters [65,66].
The phosphorus (P) content of the plants in our study decreased with increasing salinity levels. Marschner [67] reported that this decline is due to the precipitation of H2PO4 with Ca ions, the rise in pH, and phosphorus’s inability to compete effectively with K, Ca, and Na ions. In saline–alkali soil, an increase in salinity has been shown to enhance phosphorus fixation, resulting in a decline in the available phosphorus content of the soil [68]. Under alkaline conditions, phosphorus exists in the form of secondary orthophosphates (HPO4)−2. In soils with high pH, phosphorus forms CaHPO4 and Ca3(PO4)2, forming compounds with Na and Mg in a similar manner to Ca. As phosphate increases in mono-, di-, and tri-calcium phosphates, their water solubility decreases. Therefore, due to the excess amount of di- and tri-calcium phosphate in alkaline conditions, plants cannot utilize the phosphorus fixed by Ca, Mg, and Na [69]. We believe that the changes observed in our study are caused by a similar mechanism.
Overall, when considering nutrient uptake, Ca, K, Mg, P, and Fe uptake showed positive correlations with plant growth, whereas Na exhibited a negative correlation. Uptake of Mn, Zn, and Cu, however, appeared to be less affected by plant growth.
Reactive oxygen species (ROS) are continuously produced in cellular metabolism, and under normal conditions, plant cells maintain ROS at low levels through antioxidants and various protective systems. However, environmental stress factors such as salinity, drought, extreme temperatures, and UV exposure trigger enhanced ROS synthesis, leading to their accumulation in plants [42,70]. Free oxygen radicals damage cell membranes primarily through lipid peroxidation. Lipid peroxidation of the cell membrane results in the formation of malondialdehyde (MDA) as an end product of a series of reactions.
In our study, increased salinity levels were accompanied by elevated MDA and H2O2 contents. Under salt stress, H2O2 produced in plants acts as a signaling molecule that triggers protective responses in stressed cells, minimizing the adverse effects of salt toxicity in eggplants [71]. Notably, in the U3 region, which experienced the highest salinity stress, eggplants exhibited nearly 14 times higher MDA accumulation compared to normal conditions. Similar findings were reported by Özdamar et al. [72] and Jameel et al. [42] in salt-treated eggplants, where an increase in MDA levels was observed as part of the plants’ tolerance mechanism to salinity. Our results also showed that plants grown in saline–alkaline and saline soils had significantly higher antioxidant enzyme activities (SOD, CAT, APX) compared to those grown under normal conditions. This suggests that plants exposed to severe cellular damage in highly saline and saline–alkaline environments respond by activating strong antioxidant defense mechanisms. Previous research on eggplant has indicated that antioxidant enzymes assist plants in surviving under stress, with their activity increasing up to a certain threshold as stress intensifies [73,74]. This is likely because extremely saline conditions limit plant growth beyond survivable levels.
Numerous studies have investigated the effects of salinity on antioxidant systems in various plants. For instance, 100 mM NaCl treatment in watermelon induced increases in SOD, CAT, and APX enzyme activities [75]. Jameel et al. [43] reported that increasing salt stress in eggplant led to elevated levels of MDA, H2O2, lycopene, and anthocyanin, along with increased activities of antioxidant enzymes such as SOD, CAT, and PDO, indicating an adaptive response to oxidative damage. Our findings are generally consistent with the literature, demonstrating that cellular damage and antioxidant enzyme activities in eggplant increase in parallel with the severity of soil stress (salinity and alkalinity).
A strong positive correlation was observed among MDA, H2O2, and antioxidant enzymes, which also showed a high correlation with the amino acid proline. Conversely, these parameters exhibited a negative correlation with plant growth, and all these relationships appear to be proportional to the Na content in the soil, or in other words, the intensity of salt stress.
Proline, commonly found in higher plants, accumulates more under salt stress compared to other amino acids [76] and is a reliable stress marker in most species of the Solanaceae family [77]. Under normal conditions, proline accumulates in the cytosol and functions in osmotic regulation within the cytoplasm [78]. Beyond its role as an osmolyte, proline serves as a reservoir for nitrogen and carbon necessary for recovery and growth after stress [79]. It is also thought to be involved in membrane protection, scavenging free radicals, stabilizing protein structures, maintaining cellular redox potential [80], and preventing DNA damage [81]. Our findings indicate that proline synthesis in eggplant increases with rising soil salinity. Cebeci et al. [60] reported that eggplant genotypes with higher proline accumulation exhibit greater tolerance under stress conditions, and they identified a strong correlation between proline content and MDA accumulation. Similar trends were observed in our study, where proline, MDA, and H2O2 accumulation displayed parallel patterns progressing from normal to saline–alkaline conditions. However, regardless of the accumulation level, when stress exceeds the plant’s tolerance threshold, the protective effects of these compounds become limited.
It is possible to make several inferences regarding the fact that MDA, H2O2, proline levels, and APX activity were highest in the U3 soil class, while SOD and CAT activities peaked in the U6 soil class. The first of these is, of course, that each of the investigated parameters has a unique structure, and therefore, different outcomes are to be expected. SOD and CAT may exhibit higher activity at certain developmental stages of the plant, whereas APX and proline might continue to accumulate more extensively as the severity of the stress increases. This could also be related to the sequential synthesis of these antioxidant enzymes, or even to the specific conditions under which the leaf samples were collected from the plant. Supporting evidence for all three hypotheses can be found in the literature [60,77,82]. However, the most important point is the fact that the accumulation of these physiological parameters increases under stress conditions and that they exhibit strong correlations with each other.
Overall, the study revealed that with increasing soil ESP and ECe, eggplant growth declines, directly affecting both its overall development and biomass accumulation. This growth reduction is closely linked to nutrient uptake, particularly of Ca, K, P, and Fe. Stress indicators and protective agents were effective up to a certain level and were found to be closely associated with plant growth and nutrient absorption.

5. Conclusions

In this study, successive eggplant cultivations were carried out under real field conditions in different soil classes over two consecutive periods. The results of the research showed that soil salinity had a significant impact on the morphological development and quality of eggplant plants, nutrient uptake, and enzymatic physiology. In soils with soil salinity and sodicity, compared to normal soil conditions, plant length (PL), root length (RL), stem diameter (SD), and leaf area (LA) decreased by 77.40%, 72.53%, 45.64%, and 94.35%, respectively. Similarly, among the quality parameters, shoot fresh weight (SFW), shoot dry weight (SDW), root fresh weight (RFW), and root dry weight (RDW) decreased by 95.81%, 94.02%, 94.73%, and 93.97%, respectively.
It was observed that soil salinity suppressed the osmotic pressure in the root zone, thereby reducing the plant’s capacity to absorb nutrients—particularly affecting the uptake of Ca, K, P, and Fe. Based on the obtained data and findings, it is recommended to avoid eggplant cultivation in saline–alkaline areas exceeding certain thresholds identified through soil analysis. It was found that economic yield could not be achieved beyond specific salinity levels. Therefore, in cases where cultivation in moderately saline or saline soils is unavoidable, the external application of commercial enzyme or hormone-based preparations that stimulate the plant’s internal defense mechanisms might mitigate the severity of stress.

Author Contributions

Conceptualization, E.Ö.; formal analysis, E.Ö., S.S. and F.T.; funding acquisition, E.Ö.; investigation, E.Ö., S.S. and F.T.; methodology, E.Ö., S.S. and F.T.; project administration, E.Ö.; resources, E.Ö., S.S. and F.T.; supervision, E.Ö.; writing—original draft, E.Ö.; writing—review and editing, E.Ö., S.S. and F.T.; visualization, E.Ö. All authors have read and agreed to the published version of the manuscript.

Funding

This research was funded by Scientific Research Projects Coordination Unit of Igdir University (2019-FBE-A30).

Data Availability Statement

Data are contained within the article. The original contributions presented in this study are included in the article. Further inquiries can be directed to the corresponding author.

Conflicts of Interest

The authors declare no conflicts of interest.

References

  1. Shao, H.B.; Chuc, L.Y.; Shao, M.A.; Jaleeld, C.A.; Mi, H.M. Higher plant antioxidants and redox signaling under environmental stresses. C. R. Biol. 2008, 331, 433–441. [Google Scholar] [CrossRef]
  2. Zhang, H.; Zhao, Y.; Zhu, J.K. Thriving under Stress: How Plants Balance Growth and the Stress Response. Dev. Cell 2020, 55, 529–543. [Google Scholar] [CrossRef]
  3. Pascual, L.S.; Segarra-Medina, C.; Gomez-Cadenas, A.; Lopez-Climent, M.F.; Vives-Peris, V.; Zandalinas, S.I. Climate change-associated multifactorial stress combination: A present challenge for our ecosystems. J. Plant Physiol. 2022, 276, 153764. [Google Scholar] [CrossRef]
  4. Greene, R.; Timms, W.; Rengasamy, P.; Arshad, M.; Cresswell, R. Soil and Aquifer Salinization: Toward an Integrated Approach for Salinity Management of Groundwater. In Integrated Groundwater Management; Jakeman, A.J., Barreteau, O., Hunt, R.J., Rinaudo, J.D., Ross, A., Eds.; Springer: Cham, Switzerland, 2016; pp. 377–412. [Google Scholar] [CrossRef]
  5. Behera, T.K.; Krishna, R.; Ansari, W.A.; Aamir, M.; Kumar, P.; Kashyap, S.P.; Kol, C. Approaches involved in the vegetable crops salt stress tolerance improvement: Present status and way ahead. Front. Plant Sci. 2022, 12, 787292. [Google Scholar] [CrossRef]
  6. Lopez-Delacall, M.; Silva, C.J.; Mestre, T.C.; Martinez, V.; Blanco-Ulate, B.; Rivero, R.M. Synchronization of proline, ascorbate and oxidative stress pathways under the combination of salinity and heat in tomato plants. Environ. Exp. Bot. 2021, 183, 104351. [Google Scholar] [CrossRef]
  7. Raja, V.; Wani, U.M.; Wani, Z.A.; Jan, N.; Kottakota, C.; Reddy, M.K.; Kaul, T.; John, R. Pyramiding ascorbate–glutathione pathway in Lycopersicum Esculentum confers tolerance to drought and salinity stress. Plant Cell Rep. 2022, 41, 619–637. [Google Scholar] [CrossRef]
  8. Dustgeer, Z.; Seleiman, M.F.; Khan, I.; Chattha, M.U.; Alı, E.F.; Alhammad, B.A.; Jalal, R.S.; Hassan, M.U. Glycine-betaine induced salinity tolerance in maize by regulating the physiological attributes, antioxidant defense system and ionic homeostasis. Not. Bot. Horti Agrobot. Cluj-Napoca 2021, 49, 12248. [Google Scholar] [CrossRef]
  9. Akbaba, M.; Özden, E. Salt tolerance of endophytic root bacteria and their effects on seed germination and viability on tomato plants. Braz. J. Microbiol. 2023, 54, 3147–3162. [Google Scholar] [CrossRef] [PubMed]
  10. Koca, H.; Bor, M.; Ozdemir, F.; Türkan, I. The effect of salt stress on lipid peroxidation, antioxidative enzymes and proline content of sesame cultivars. Environ. Exp. Bot. 2007, 60, 344–351. [Google Scholar] [CrossRef]
  11. Wicke, B.; Smeets, E.; Dornburg, V.; Vashev, B.; Gaiser, T.; Turkenburg, W.; Faaij, A. The global technical and economic potential of bioenergy from salt-affected soils. Energy Environ. Sci. 2011, 8, 2669–2681. [Google Scholar] [CrossRef]
  12. Qureshi, A.S.; Mohammed, M.; Daba, A.W.; Hailu, B.; Belay, G.; Tesfaye, A.; Ertebo, T.M. Improving agricultural productivity on salt-affected soils in Ethiopia: Farmers’ perceptions and proposals. Afr. J. Agric. Res. 2019, 14, 897–906. [Google Scholar]
  13. Daliakopoulos, I.; Tsanis, I.K.; Koutroulis, A.; Kourgialas, N.; Varouchakis, E.; Karatzas, G.; Ritsema, C. The threat of soil salinity: A European scale review. Sci. Total Environ. 2016, 573, 727–739. [Google Scholar] [CrossRef] [PubMed]
  14. Temel, S.; Şimşek, U. Desertification Process of Igdır Plain Soils and Solution Suggestions. Alinteri J. Agr. Sci. 2011, 21, 53–59. Available online: https://dergipark.org.tr/tr/download/article-file/26282 (accessed on 15 June 2025).
  15. Mahajan, S.; Tuteja, N. Cold, salinity and drought stress: An overview. Arch. Biochem. Biophys. 2005, 444, 139–158. [Google Scholar] [CrossRef] [PubMed]
  16. Talhouni, M.; Sönmez, K.; Ellialtıoğlu, Ş.; Kuşvuran, Ş. Analysis of some plant and fruit characteristics of grafted eggplants grown under salinity stress. Acad. J. Agric. 2017, 6, 71–80. Available online: https://dergipark.org.tr/en/pub/azd/issue/32275/363327 (accessed on 15 June 2025).
  17. FAOSTAT. The Global Status of Vegetable Production, Trade and Utilization. Crop Production Manual. Available online: https://www.fao.org/faostat/en/#data/QCL (accessed on 15 June 2025).
  18. Fiza, A.; Chugh, V.; Mishra, A.C.; Purwaet, S.; Dwived, S.V.; Mishra, A.; Nagar, S.; Kharor, N.; Kumar, V. Physiological and biochemical adaptations for salt stress tolerance in eggplant (Solanum melongena). Plant Physiol. Rep. 2025, 30, 352–368. [Google Scholar] [CrossRef]
  19. Chinnusamy, V.; Jagendorf, A.; Zhu, J.K. Understanding and improving salt tolerance in plants. Crop Sci. 2005, 45, 437–448. [Google Scholar] [CrossRef]
  20. Mittler, R.; Zandalinas, S.I.; Fichman, Y.; van Breusegem, F. Reactive oxygen species signaling in plant stress responses. Nat. Rev. Mol. Cell Biol. 2022, 23, 663–679. [Google Scholar] [CrossRef]
  21. Hasanuzzaman, M.; Bhuyan, M.B.; Zulfiqar, F.; Raza, A.; Mohsin, S.M.; Mahmud, J.A.; Fotopoulos, V. Reactive oxygen species and antioxidant defense in plants under abiotic stress: Revisiting the crucial role of a universal defense regulator. Antioxidants 2020, 9, 681. [Google Scholar] [CrossRef]
  22. Koyro, H.W. Effect of salinity on growth, photosynthesis, water relations and solute composition of the potential cash crop halophyte Plantago coronopus (L.). Environ. Exp. Bot. 2006, 56, 136–146. [Google Scholar] [CrossRef]
  23. USDA. Soil Survey Manual No: 18; Agriculture Handbook; United States Department of Agriculture: Washington, DC, USA, 2017; pp. 120–130. [Google Scholar]
  24. USDA. Diagnosis and Improvement of Saline and Alkali Soils No: 60; Agriculture Handbook; United States Department of Agriculture: Washington, DC, USA, 1954; pp. 4–6. [Google Scholar]
  25. Gee, G.W.; Or, D. Particle-size analysis. In Methods of Soil Analysis, Part 4. Physical Methods, SSSA Book Series 5; Dane, J.H., Topp, G.C., Eds.; Soil Science Society of America, Inc.: Madison, WI, USA, 2002; pp. 255–293. [Google Scholar]
  26. Loeppert, R.H.; Suarez, D.L. Chemical Methods “Carbonate and gypsum”. In Methods of Soil Analysis, Part 3. SSSA Book Series 5; Sparks, D.L., Ed.; Soil Science Society of America, Inc.: Madison, WI, USA, 1996; pp. 437–474. [Google Scholar]
  27. Nelson, D.W.; Sommers, L.E. Total carbon, organic carbon, and organic matter. In Methods of Soil Analysis, Part 3. Chemical Methods, SSSA Book Series 5; Sparks, D.L., Ed.; Soil Science Society of America, Inc.: Madison, WI, USA, 1996; pp. 961–1010. [Google Scholar]
  28. Thomas, G.W. Soil pH and soil acidity. In Methods of Soil Analysis, Part 3. Chemical Methods, SSSA Book Series 5; Sparks, D.L., Ed.; Soil Science Society of America, Inc.: Madison, WI, USA, 1996; pp. 475–490. [Google Scholar]
  29. Rhoades, J.D. Salinity: Electrical conductivity and total dissolved solids. In Methods of Soil Analysis, Part 3. Chemical Methods, SSSA Book Series 5; Sparks, D.L., Ed.; Soil Science Society of America, Inc.: Madison, WI, USA, 1996; pp. 417–435. [Google Scholar]
  30. Rhoades, J.D. Cation exchange capacity. In Methods of Soil Analysis: Part 2 Chemical and Microbiological Properties, 2nd ed.; Agronomy Monographs; American Society of Agronomy: Fitchburg, WI, USA, 1982; Volume 9, pp. 149–157. [Google Scholar]
  31. Rhoades, J.D. Exchangeable cations. In Methods of Soil Analysis: Part 2 Chemical and Microbiological Properties, 2nd ed.; American Society of Agronomy: Fitchburg, WI, USA, 1982; Volume 9, pp. 159–164. [Google Scholar]
  32. Mertens, D. Plants Preparation of Laboratory Sample. In Official Methods of Analysis, AOAC Official Method 922.02, Chapter 3, 22nd ed.; Horwitz, W., Latimer, G.W., Eds.; AOAC-International: Gaitherburg, MD, USA, 2005; pp. 1–2. [Google Scholar]
  33. Mertens, D. Metal in Plants and Pet Foods. In Official Methods of Analysis, AOAC Official Method 922.02, Chapter 3, 18th ed.; Horwitz, W., Latimer, G.W., Eds.; AOAC-International: Gaitherburg, MD, USA, 2005; pp. 3–4. [Google Scholar]
  34. Alexieva, V.; Sergiev, I.; Karanov, E. The effect of drought and ultraviolet radiation on growth and stress markers in pea and wheat. Plant Cell Environ. 2001, 24, 1337–1344. [Google Scholar] [CrossRef]
  35. Heath, R.L.; Packer, L. Photoperoxidation in isolated chloroplast. I. Kinetics and stoichiometry of fatty acid peroxidation. Arch. Biochem. Biophys. 1968, 125, 189–198. [Google Scholar] [CrossRef]
  36. Sairam, R.K.; Saxena, D.C. Oxidative stress and antioxidants in wheat genotypes, Possible Mechanism of Water Stress Tolerance. J. Agron. Crop Sci. 2000, 184, 55–61. [Google Scholar] [CrossRef]
  37. Jebara, S.; Jebara, M.; Liman, F.; Aouani, M.E. Changes in ascorbate peroxidase, catalase, guaicol peroxidase and superoxide dismutase activities in common bean (Phaseolus vulgaris) nodules under salt stress. J. Plant Physiol. 2005, 162, 929–936. [Google Scholar] [CrossRef]
  38. Sun, Y.; Oberley, L.W.; Li, Y. A simple method for clinical assay of superoxide dismutase. Clin. Chem. 1988, 34, 497–500. [Google Scholar] [CrossRef]
  39. Bates, L.S.; Waldren, R.P.; Teare, I.D. Rapid determination of free proline for water-stress studies. Plant Soil 1973, 39, 205–207. [Google Scholar] [CrossRef]
  40. Abdalla, M.M.; El-Khoshiban, N.H. The influence of water stress on growth. relative water content, photosynthetic pigments, some metabolic and hormonal contents of two Triticium aestivum cultivars. J. Appl. Sci. Res. 2007, 3, 2062–2074. [Google Scholar]
  41. Kurum, R.; Ulukapı, K.; Aydınşakir, K.; Onus, N.A. The influence of salinity on seedling growth of some pumpkin varieties used as rootstock. Not. Bot. Horti Agrobot. Cluj-Napoca 2013, 41, 219–225. [Google Scholar] [CrossRef]
  42. Fu, H.; Yang, Y. How plants tolerate salt stress. Curr. Issues Mol. Biol. 2023, 45, 5914–5934. [Google Scholar] [CrossRef]
  43. Jameel, J.; Anwar, T.; Majeed, S.; Qureshi, H.; Siddiqi, E.H.; Sana, S.; Zaman, W.; Ali, H.M. Effect of salinity on growth and biochemical responses of brinjal varieties: Implications for salt tolerance and antioxidant mechanisms. BMC Plant Biol. 2024, 24, 128. [Google Scholar] [CrossRef] [PubMed]
  44. Lopez, H.; Marco, A.; Ulery, A.P.; Zohrab, S.; Picchioni, G.; Flynn, R.P. Response of chile pepper (Capsicum annuum L.) to salt stress and organic and inorganic nitrogen sources: I growth and yield. Trop. Subtrop. Agroecosystems 2011, 14, 137–147. Available online: https://www.redalyc.org/articulo.oa?id=93915703012 (accessed on 18 June 2025).
  45. Kıran, S.; Ateş, Ç.; Kuşvuran, Ş.; Sönmez, K.; Ellialtıoğlu, Ş. Investigation of changes on some morphological characteristics in different eggplant scion/rootstock combinations under salt and drought stresses. J. Inst. Sci. Technol. 2017, 7, 43–54. Available online: https://dergipark.org.tr/en/pub/jist/issue/34625/389680 (accessed on 18 June 2025). [CrossRef]
  46. Giuffrida, F.; Martorana, M.; Leonardi, C. How sodium chloride concentration in the nutrient solution influences the mineral composition of tomato leaves and fruit. HortScience 2009, 44, 707–711. [Google Scholar] [CrossRef]
  47. Munns, R.; Termaat, A. Whole-plant responses to salinity. Aust. J. Plant Physiol. 1986, 13, 143–160. [Google Scholar] [CrossRef]
  48. Brenes, M.; Solana, A.; Boscaiu, M.; Fita, A.; Vicente, O.; Calatayud, Á.; Prohens, J.; Plazas, M. Physiological and Biochemical Responses to Salt Stress in Cultivated Eggplant (Solanum melongena L.) and in S. insanum L., a Close Wild Relative. Agronomy 2020, 10, 651. [Google Scholar] [CrossRef]
  49. Talubaghi, M.J.; Daliri, M.S.; Mazloum, P.; Rameeh, V.; Mousavi, A. Effect of salt stress on growth, physiological and biochemical parameters and activities of antioxidative enzymes of rice cultivars. Cereal Res. Commun. 2023, 51, 403–411. [Google Scholar] [CrossRef]
  50. Dikobe, T.B.; Mashile, B.; Sinthumule, R.R.; Ruzvidzo, O. Distinct morpho-physiological responses of maize to salinity stress. Am. J. Plant Sci. 2021, 12, 946–959. [Google Scholar] [CrossRef]
  51. Asraf, M.; Iram, A. Drought stress induced changes in some organic substances in nodules and other plant parts of two potential legumes differing in salt tolerance. Flora-Morphol. Distrib. Funct. Ecol. Plants 2005, 200, 535–546. [Google Scholar] [CrossRef]
  52. Türkan, I.; Bor, M.; Ozdemir, F.; Koca, H. Differential responses of lipid peroxidation and antioxidants in the leaves of drought-tolerant P. acutifolius Gray and drought sensitive P. vulgaris L. subjected to polyethylene glycol mediates water stress. Plant Sci. 2005, 168, 223–231. [Google Scholar] [CrossRef]
  53. Hu, H.; Lu, Z.; Meng, F.; Li, X.; Cong, R.; Ren, T.; Sharkey, T.D.; Lu, J. The reduction in leaf area precedes that in photosynthesis under potassium deficiency: The importance of leaf anatomy. New Phytol. 2020, 227, 1749–1763. [Google Scholar] [CrossRef]
  54. Abdelmageed, A.H.; Gruda, N. Influence of Grafting on Growth, Development and some Physio-logical Parameters of Tomatoes under Controlled Heat Stress Conditions. Eur. J. Hortic. Sci. 2009, 74, 16–20. Available online: https://www.cabidigitallibrary.org/doi/full/10.5555/20093109326 (accessed on 18 June 2025). [CrossRef]
  55. Chartzoulakis, K.; Klapaki, G. Response of two greenhouse pepper hybrids to NaCl salinity during different growth stages. Sci. Hortic. 2000, 86, 247–260. [Google Scholar] [CrossRef]
  56. Minhas, P.S.; Ramos, T.B.; Ben-Gal, A.; Pereira, L.S. Coping with salinity in irrigated agriculture: Crop evapotranspiration and water management issues. Agric. Water Manag. 2020, 227, 105832. [Google Scholar] [CrossRef]
  57. Plazas, M.; Vilanova, S.; Gramazio, P.; Rodríguez-Burruezo, A.; Fita, A.; Herraiz, F.J.; Ranil, R.; Fonseka, R.; Niran, L.; Fonseka, H.; et al. Interspecific Hybridization between Eggplant and Wild Relatives from Different Genepools. J. Am. Soc. Hortic. Sci. 2016, 141, 34–44. [Google Scholar] [CrossRef]
  58. Mozafarian, M.; Hawrylak-Nowak, B.; Kappel, N. Effect of Different Rootstocks on the Salt Stress Tolerance and Fruit Quality of Grafted Eggplants (Solanum melongena L.). Plants 2023, 12, 3631. [Google Scholar] [CrossRef]
  59. Matuz-Mares, D.; González-Andrade, M.; Araiza-Villanueva, M.G.; Vilchis-Landeros, M.M.; Vázquez-Meza, H. Mitochondrial Calcium: Effects of Its Imbalance in Disease. Antioxidants 2022, 11, 801. [Google Scholar] [CrossRef]
  60. Cebeci, E.; Boyaci, H.F.; Kiran, S.; Ellialtioglu, S.S. Comprehensive assessment to reveal the salt tolerance potential of cultivated eggplants and their wild relatives. Front. Plant Sci. 2025, 16, 1483409. [Google Scholar] [CrossRef] [PubMed]
  61. Ortega-Albero, N.; Adalid-Martínez, A.M.; Castell-Zeising, V.; Raigón, M.D.; Rodríguez-Burruezo, A.; Fita, A. Internal Fruit Quality Is Maintained in Eggplant under Mild Long-Term Salt Treatment. Agriculture 2024, 14, 871. [Google Scholar] [CrossRef]
  62. Liu, J.; Zhu, J.K. A calcium sensor homolog required for plant salt tolerance. Science 1998, 280, 1943–1945. [Google Scholar] [CrossRef] [PubMed]
  63. Latef, A.A.H.A.; Chaoxing, H. Effect of arbuscular mycorrhizal fungi on growth, mineral nutrition, antioxidant enzymes activity and fruit yield of tomato grown under salinity stress. Sci. Hortic. 2011, 127, 228–233. [Google Scholar] [CrossRef]
  64. Suarez, D.L.; Celis, N.; Ferreira, J.F.; Reynolds, T.; Sandhu, D. Linking genetic determinants with salinity tolerance and ion relationships in eggplant, tomato and pepper. Sci. Rep. 2021, 11, 16298. [Google Scholar] [CrossRef]
  65. Assaha, D.V.M.; Ueda, A.; Saneoka, H. Comparison of growth and mineral accumulation of two solanaceous species Solanum scabrum Mill. (huckleberry) and S. melongena L. (eggplant), under salinity stress. Soil Sci. Plant Nutr. 2013, 59, 912–920. [Google Scholar] [CrossRef]
  66. Hannachi, S.; van Labeke, M.C. Salt stress affects germination, seedling growth and physiological responses differentially in eggplant cultivars (Solanum melongena L.). Sci. Hortic. 2018, 228, 56–65. [Google Scholar] [CrossRef]
  67. Marschner, H. Mineral Nutrition of Higher Plants, 2nd ed.; Academic Press: London, UK, 1995; p. 181. Available online: https://www.cabidigitallibrary.org/doi/full/10.5555/19950708651 (accessed on 18 June 2025).
  68. Zhan, X.Y.; Ren, Y.; Zhang, S.X.; Kang, R.F. Changes in Olsen phosphorus concentration and its response to phosphorus balance in the main types of soil in China. Sci. Agric. Sin. 2015, 48, 4728–4737. [Google Scholar]
  69. Kacar, B.; Katkat, A.V. Plant Nutrition, 5th ed.; Nobel Publications: Ankara, Türkiye, 2010; pp. 250–253. [Google Scholar]
  70. Parida, A.K.; Das, A.B. Salt Tolerance and Salinity Effects on Plants: A Review. Ecotoxicol. Environ. Saf. 2005, 60, 324–349. [Google Scholar] [CrossRef]
  71. Borghesi, E.; González-Miret, M.L.; Escudero-Gilete, M.L.; Malorgio, F.; Heredia, F.J.; Meléndez-Martínez, A.J. Effects of salinity stress on carotenoids, anthocyanins, and color of diverse tomato genotypes. J. Agric. Food Chem. 2011, 59, 11676–11682. [Google Scholar] [CrossRef]
  72. Özdamar, F.Ö.; Furtana, G.B.; Tipirdamaz, R.; Duman, H. H2O2 and NO mitigate salt stress by regulating antioxidant enzymes in in two eggplant (Solanum melongena L.) genotypes. Soil Stud. 2022, 11, 1–6. [Google Scholar] [CrossRef]
  73. Perveen, T.; Nawaz, K. Modulation of morpho-physiological and biochemical attributes of Solanum melongena L.(brinjal) by exogenous application of thiourea under salinity stress. Pak. J. Bot. 2021, 53, 1969–1978. [Google Scholar] [CrossRef] [PubMed]
  74. Kul, R. Integrated application of plant growth promoting rhizobacteria and biochar improves salt tolerance in eggplant seedlings. Turk. J. Agric. For. 2022, 46, 677–702. [Google Scholar] [CrossRef]
  75. Yaşar, F.; Ellialtıoğlu, Ş.; Özpay, T.; Uzal, Ö. The Effect of Salt Stress on Antioksidative Enzyme (SOD, CAT, APX and GR) Activity in Watermelon (Citrullus lanatus (Thunb.) Mansf.). Yuz. Yıl Univ. J. Agric. Sci. 2008, 18, 61–65. Available online: https://dergipark.org.tr/en/pub/yyutbd/issue/21987/236079#article_cite (accessed on 15 June 2025).
  76. Ábrahám, E.; Rigó, G.; Székely, G.; Nagy, R.; Koncz, C. Light-dependent induction of proline biosynthesis by abscisic acid and salt stress is inhibited by brassinosteroid in Arabidopsis. Plant Mol. Biol. 2003, 51, 363–372. [Google Scholar] [CrossRef]
  77. Ortega-Albero, N.; González-Orenga, S.; Vicente, O.; Rodríguez-Burruezo, A.; Fita, A. Responses to Salt Stress of the Interspecific Hybrid Solanum insanum × Solanum melongena and Its Parental Species. Plants 2023, 12, 295. [Google Scholar] [CrossRef]
  78. Parvaiz, A.; Satyawati, S. Salt Stress and Phyto-biochemical Responses of Plant-a Review. Plant Soil Environ. 2008, 54, 89–99. [Google Scholar] [CrossRef]
  79. Jain, M.; Mathur, G.; Koul, S.; Sarin, N. Ameliorative Effects of Proline on Salt Stress-induced Lipid Peroxidation in Cell Lines of Groundnut (Arachis hypogaea L.). Plant Cell Rep. 2001, 20, 463–468. [Google Scholar] [CrossRef]
  80. Vijayan, K. Approaches for Enhancing Salt Tolerance in Mulberry (Morus L)-A review. Plant Omics J. 2009, 2, 41–59. Available online: https://www.pomics.com/Vijayan_January2009_2_1_41_59.pdf (accessed on 15 June 2025).
  81. Lima-Costa, M.E.; Ferreira, S.; Duarte, A.; Ferreira, A.L. Alleviation of Salt Stress Using Exogenous Proline on a Citrus Cell Line. Acta Hortic. 2010, 868, 109–112. [Google Scholar] [CrossRef]
  82. Al Hassan, M.; López-Gresa, M.D.P.; Boscaiu, M.; Vicente, O. Stress Tolerance Mechanisms in Juncus: Responses to Salinity and Drought in Three Juncus Species Adapted to Different Natural Environments. Funct. Plant Biol. 2016, 43, 949–960. [Google Scholar] [CrossRef]
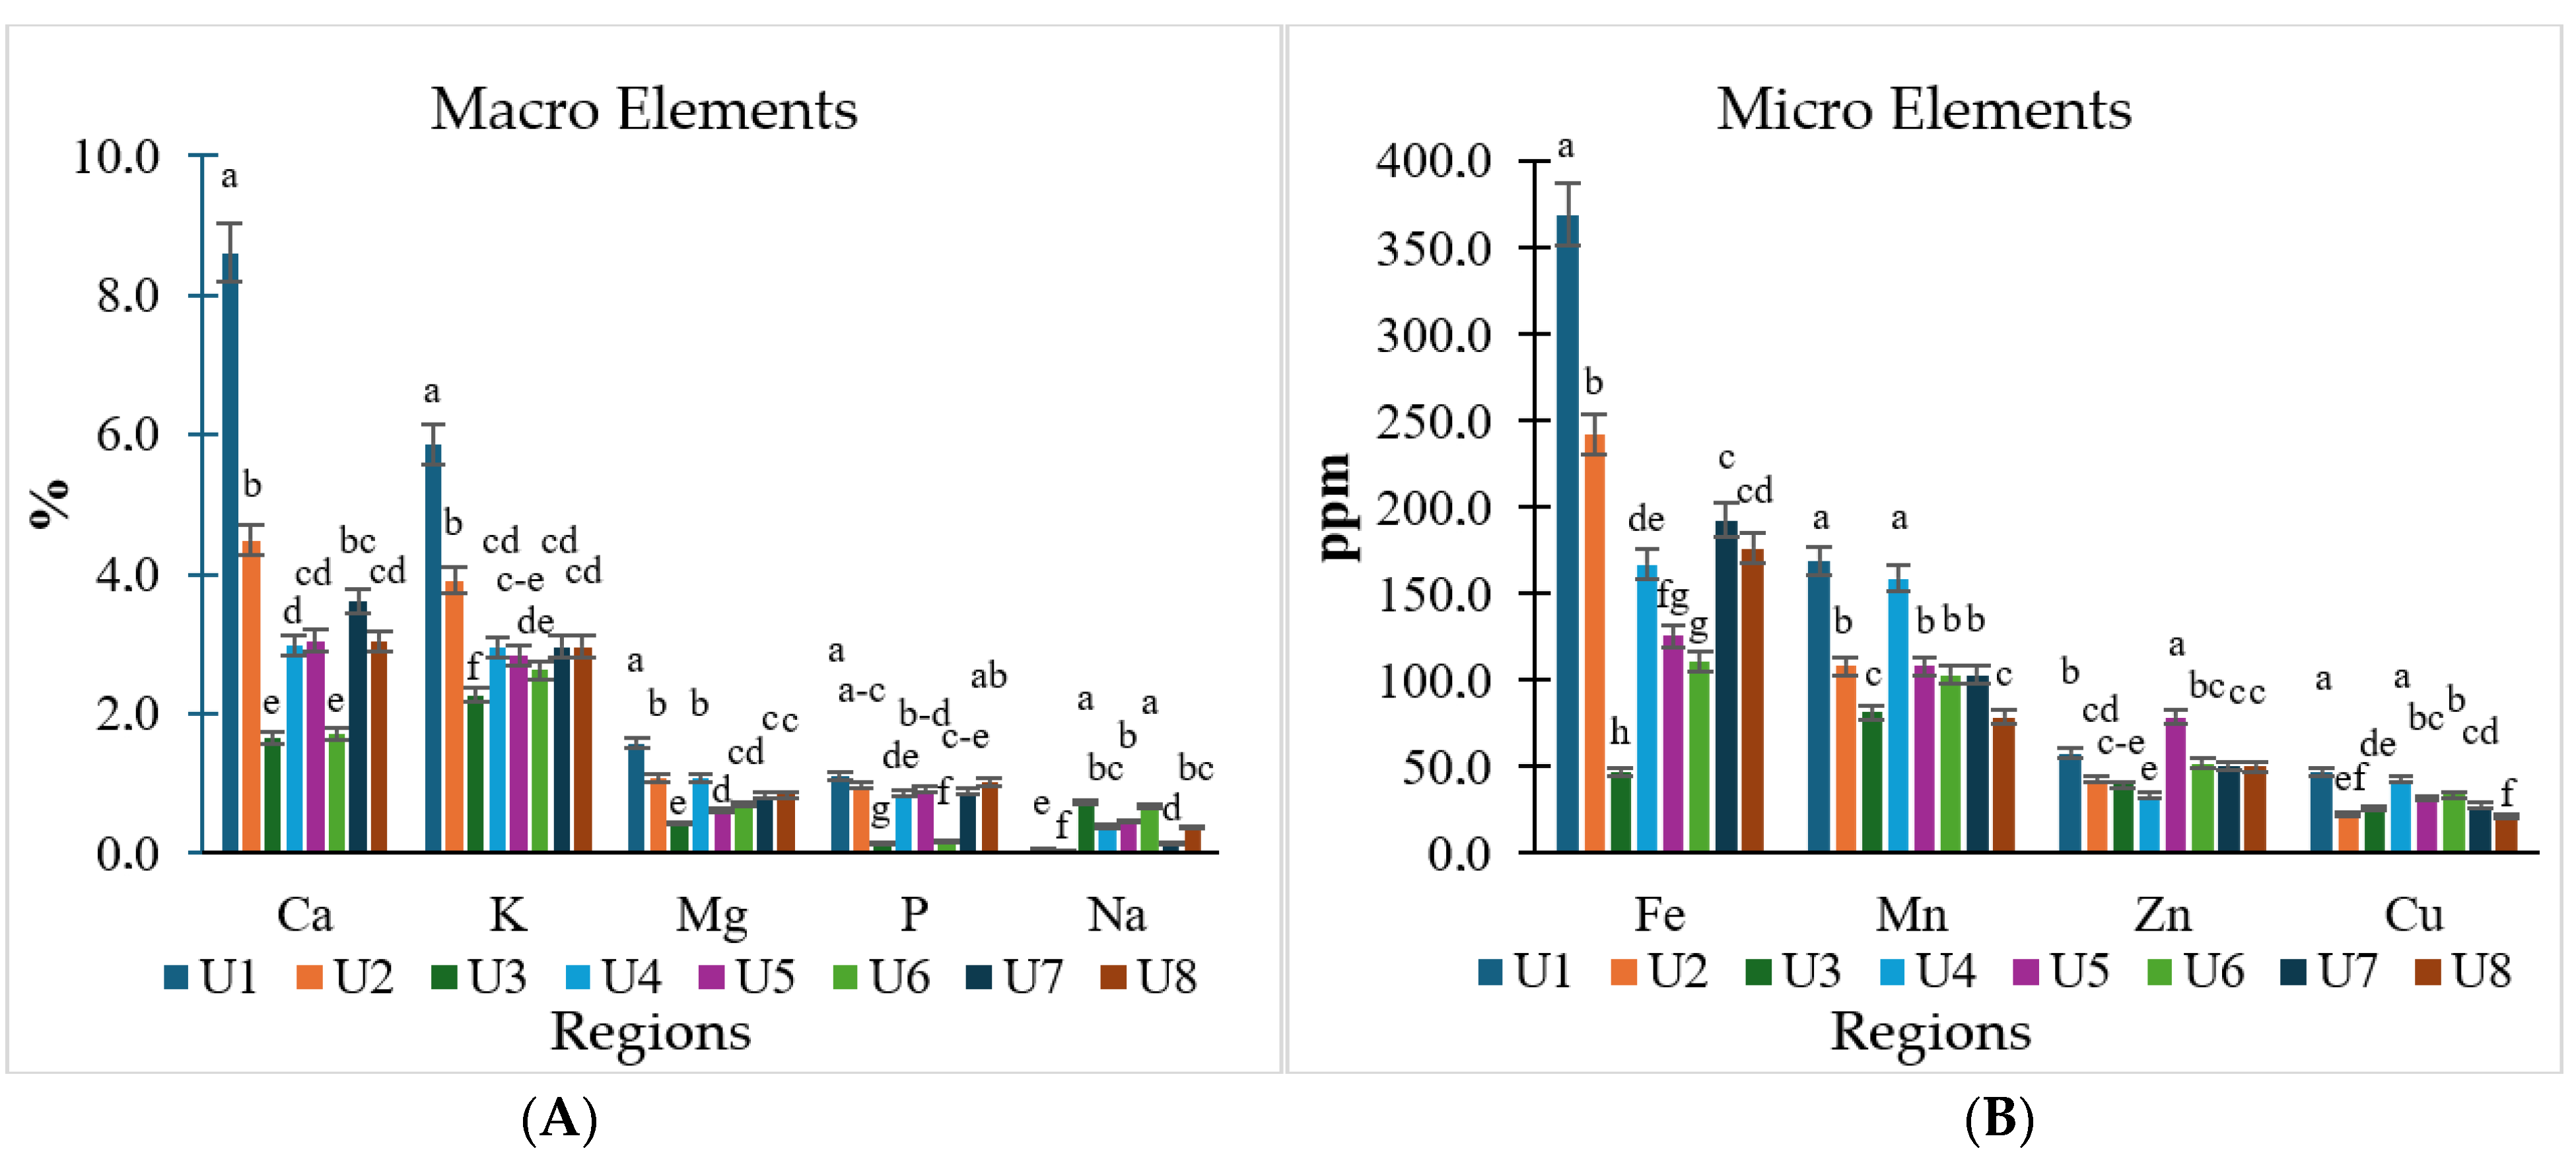
Figure 1. Nutrient element contents in eggplant leaves (p < 0.001). (A) Macro elements contents; (B) Micro elements contents. Different letters indicate significant differences (at p ≤ 0.05) among the ‘plant cultivation area × measured parameter’ combinations.
Agronomy 15 01945 g001
Figure 2. H2O2, MDA, and proline contents in plant leaves grown in different salinity classes (p < 0.01). (A) H2O2 µM g−1 FW contents; (B) MDA nmol g−1 FW contents; (C) Proline μg g−1 FW contents. Different letters indicate significant differences (at p ≤ 0.05) among the ‘plant cultivation area × measured parameter’ combinations.
Agronomy 15 01945 g002
Figure 3. Antioxidant enzyme activities in plant leaves grown under different salinity classes (p < 0.01). (A) SOD activity, EU mg−1 protein; (B) CAT activities, EU mg−1 protein; (C) APX activity, EU mg−1 protein. Different letters indicate significant differences (at p ≤ 0.05) among the ‘plant cultivation area × measured parameter’ combinations.
Agronomy 15 01945 g003
Figure 4. Pearson’s correlation analysis of the investigated parameters.
Agronomy 15 01945 g004
Figure 5. Schematic presentation of the findings of the study.
Agronomy 15 01945 g005
Table 1. Soil characteristics of the study areas.
Clay
(%)
Silt
(%)
Sand
(%)
Texture Class CaCO3
(%)
OM
(%)
CEC, (me100 g−1)Exchangeable Cations
(me100 g−1)
Soluble Na (me100 g−1)pHe ΨECe Ψ
(dS m−1)
ESP (%)Salinity Class §
NaKCaMg
U136.639.024.4Clay Loam11.121.3228.21.31.720.89.10.188.270.883.8Normal
U234.541.124.4Clay Loam10.931.1826.62.31.619.61.01.08.103.604.9Normal
U332.543.224.3Clay Loam13.810.6221.445.61.914.13.030.210.4167.8071.9Saline-sodic
U424.347.428.3Loam11.220.1528.28.91.416.76.83.88.687.8818.0Saline-sodic
U530.639.130.3Clay Loam10.410.8923.74.71.614.67.11.728.396.4412.6Saline
U628.537.134.4Clay Loam11.960.7821.814.91.916.46.13.911.7211.8750.5Saline-sodic
U718.137.244.7Loam11.380.4919.52.10.716.96.40.18.357.510.3Saline
U826.439.234.3Loam12.090.9224.21.61.014.46.20.18.424.96.3Saline
: Classified according to USDA [23]. §: Classified according to USDA [24]. OM: Organic matter. CEC: Cation exchange capacity. ECe: Electrical conductivity. ESP: Exchangeable sodium percentage. Ψ: pHe and ECe were determined in saturation extract.
Table 2. Morphological traits of eggplants grown in different soil classes and changes in vegetative development according to U1 soil class.
RegionPL (cm)Change
(%)
RL (cm)Change
(%)
SD (cm)Change
(%)
LA (mm2)Change
(%)
U1153.1 a0.073.9 a0.001.49 a0.00406.9 a0.00
U2143.5 b−6.2777.6 a+5.011.52 a+2.01397.7 a−2.26
U334.6 h−77.4020.3 e−72.530.81 e−45.6423.0 f−94.35
U4101.9 ef−33.4433.1 d−55.211.22 c−18.12135.5 d−66.70
U5111.4 de−27.2459.1 b−20.031.43 ab−4.03239.3 c−41.19
U662.2 g−59.3731.0 d−58.051.08 d−27.5267.5 e−83.41
U7120.0 c–e−21.6249.9 c−32.481.44 ab−3.36221.1 c−45.66
U8128.4 bc−16.1361.2 b−17.191.39 ab−6.71325.6 b−19.98
Different letters in the columns indicate significant differences (at p ≤ 0.05) among the ‘plant cultivation area × measured parameter’ combinations. (PH: plant height; RL: root length; SD: stem diameter; LA: leaf area).
Table 3. Biomass traits of eggplant grown in different soil classes and changes in vegetative development according to U1 soil class.
RegionPFW (g)Change
(%)
PDW (g)Change
(%)
RFW (g)Change
(%)
RDW (g)Change
(%)
U1403.7 a0.0086.9 a0.00113.8 a0.0031.5 a0.00
U2392.3 ab−2.8282.6 ab−4.95100.7 b−11.5129.6 a−6.03
U316.9 h−95.815.2 h−94.026.0 g−94.731.9 e−93.97
U4170.1 f−57.8729.8 g−65.7149.4 ef−56.5911.5 d−63.49
U5298.8 d−25.9961.4 cd−29.3483.4 bc−26.7125.0 b−20.64
U6115.4 g−71.4134.2 fg−60.6440.8 f−64.139.9 d−68.57
U7250.7 e−37.9052.7 e39.3668.0 d−40.2516.6 c−47.30
U8328.5 cd−22.8971.2 bc−18.0772.0 cd−36.7318.0 bc−42.86
Different letters in the columns indicate significant differences (at p ≤ 0.05) among the ‘plant cultivation area × measured parameter’ combinations. (PFW: plant fresh weight; PDW: plant dry weight; RFW: root fresh weight; RDW: root dry weight).
Disclaimer/Publisher’s Note: The statements, opinions and data contained in all publications are solely those of the individual author(s) and contributor(s) and not of MDPI and/or the editor(s). MDPI and/or the editor(s) disclaim responsibility for any injury to people or property resulting from any ideas, methods, instructions or products referred to in the content.