Article

Effects of Long-Term Cotton Straw Return on Soil Carbon and Bacterial Community in Topsoil and Deep Soil

1
Key Laboratory of Plant-Soil Interactions, Ministry of Education, College of Land Science and Technology, China Agricultural University, Beijing 100193, China
2
College of Land and Environment, Shenyang Agricultural University, Shenyang 110086, China
3
College of Agriculture, Tarim University, Alar 843300, China
4
College of Grassland Science and Technology, China Agricultural University, Beijing 100193, China
*
Author to whom correspondence should be addressed.
Agronomy 2025, 15(8), 1940; https://doi.org/10.3390/agronomy15081940
Submission received: 7 July 2025 / Revised: 28 July 2025 / Accepted: 6 August 2025 / Published: 12 August 2025

Abstract

Straw return directly increases carbon inputs, enhancing soil organic carbon (SOC) stocks. However, long-term straw return leads to carbon saturation in the topsoil (0–20 cm). While most studies focus on the topsoil, the effects of long-term straw return on deep soil (100–200 cm) carbon sequestration remain poorly understood. This study investigated carbon dynamics in an arid region by analyzing 0–200 cm soil profiles under different straw return treatments: control (uncultivated) and cotton straw return for 5 (SR5), 10 (SR10), and 20 years (SR20). Straw return significantly improved soil properties by reducing electrical conductivity (EC), increasing nutrient availability, and enhancing bacterial activity. SR20 resulted in the most pronounced SOC increase (18.6–252.7%) across the entire profile and significantly enhanced soil inorganic carbon (SIC) (27.7–52.7%) in deep layers. In contrast, SOC in the topsoil (0–20 cm) increased initially but plateaued after 5–10 years. Principal component and random forest analyses showed that SOC sequestration was primarily driven by sucrase, urease, available phosphorus, dissolved organic carbon (DOC), microbial diversity indices, and available calcium (p < 0.05), while SIC dynamics were significantly influenced by sucrase, urease, DOC, CO2 emissions, available calcium, and EC (p < 0.05). These findings underscore the importance of exploring subsoil carbon sequestration mechanisms in arid ecosystems.

Graphical Abstract

1. Introduction

Soil carbon constitutes the largest terrestrial carbon pool (from 1115 to 2200 Pg C) [1], encompassing both soil organic carbon (SOC) and soil inorganic carbon (SIC). SOC functions as both a source and sink for atmospheric carbon, with its content variations reflecting net carbon exchange between the atmosphere and soil [2]. Consequently, agricultural management methods for enhancing SOC sequestration have attracted significant research interest [3]. Current studies about agricultural management impacts predominantly focus on topsoil (0–20 cm) [4], while investigations involving subsoils (20–100 cm) remain limited [5], and deep soils (>100 cm) are rarely examined. This focus on topsoil may lead to a noticeably biased estimation of soil carbon sequestration potential. For instance, topsoil SOC may represent only 14.29–39% of the total SOC in 0–200 cm soil profiles [6], suggesting that investigations based solely on topsoil likely misrepresent management impacts. Notably, SIC predominates in arid/semi-arid regions [7,8], where its stocks can exceed SOC by one to nine times [9,10]. Thus, understanding SIC dynamics is critical for comprehensive carbon accounting, yet few studies address agricultural management impacts on SIC, likely because SIC stocks are typically found in deep soil layers [7].
SOC in deep soil is typically considered stable with high accumulation potential. This is because the relatively low organic carbon concentration implies abundant unsaturated adsorption sites on clay minerals, which can retain the downward migrating organic carbon [3,11]. Additionally, deep soils are often biologically quiescent [12], suggesting significant potential for carbon sink. However, emerging evidence indicates substantial microbial functions in deep soils. Fontaine et al. [13] demonstrated that the organic carbon stability in deep soil depends on fresh carbon inputs, while Liebmann et al. [11] showed that such inputs undergo rapid microbial mineralization rather than long-term mineral retention. Moreover, the high partial pressure of CO2 (pCO2) from microbial respiration in the rhizosphere and bulk soil critically regulates carbonate formation [7]. However, root-derived carbon accessibility diminishes significantly with depth; root distribution in deep soil is substantially lower than in topsoil [14], resulting in limited rhizosphere priming effects on SOC mineralization at depth [15]. These findings suggest that the potential of carbon sink in deep soil might be regulated by microbial properties. Despite these insights, the specific mechanism by which microbes control organic carbon stability in deep soil remains poorly understood and needs further investigation.
Straw return is an established practice for enhancing SOC sequestration [16]. It increases carbon input while improving soil physicochemical properties [3] by enhancing fertility, reducing soil-borne diseases [17], improving structure [18], and boosting crop biomass [3]. However, most research addresses straw type, quantity, and application methods [19,20,21,22], with relatively limited focus on the effects of straw return years. Notably, long-term agroecosystem studies indicate that continuous carbon inputs can induce topsoil carbon saturation [23,24,25]. Specifically, Liu et al. [3] reported that nearly 12 years of straw return may lead to saturation, beyond which additional inputs inconsistently increase SOC. This highlights straw return years as a critical factor for carbon sequestration efficacy.
Unlike the straw of wheat, corn, and rice, cotton straw generally contains higher lignin content [26], which may contribute to its relative resistance to degradation. Consequently, the effects of cotton straw return on soil carbon and microbial properties may differ significantly. In Xinjiang—a typical arid region in northwestern China [27,28] and China’s largest cotton production area (>90% of national cotton yield [29])—annual straw residues exceed 10 million tons [30,31]. In this region, collected cotton straw is primarily returned to the field. However, mechanistic understanding of how long-term cotton straw return regulates soil carbon sequestration, particularly in deep layers, remains limited despite its agricultural significance. Thus, quantifying deep soil carbon dynamics is essential to comprehensively evaluate the sequestration potential of cotton straw return technologies.
In this study, soils that had undergone straw return for a different number of years were sampled in Xinjiang province, China. The objective was to investigate the effect of straw return years on soil carbon and microbial properties in topsoil and deep soil in an arid region. We investigated the SOC and SIC in the 0–200 cm layers of soil that had undergone different numbers of straw return years. Additionally, we analyzed dissolved organic carbon (DOC), CO2 emissions, and soil microbial community properties.

2. Materials and Methods

2.1. Site Description

The study site is located in Alar City, Xinjiang province, China (40°30′ N, 81°19′ E), at an altitude of 1000 m. This region features a warm temperate continental arid desert climate, characterized by a mean annual temperature of 10.1 °C and an annual precipitation of 50 mm. The average annual frost-free period and sunshine duration are 214 days and 2838.2 h, respectively. Soil is classified as brown desert soil according to the Chinese Soil Taxonomy. Soil texture data are provided in Appendix A.1, Table A1.

2.2. Experiment Design and Management

Experimental plots were established in mulch drip-irrigated cotton fields reclaimed in 2000. Treatments included a control (uncultivated land) and continuous cotton straw return for 5 (SR5), 10 (SR10), and 20 years (SR20). Each treatment had three replicate plots (~200 m2 each).
Cotton was cultivated annually, planted in March and harvested in October, with a mean annual yield of 6800 kg ha−1. Prior to harvest, all straw was collected, then the mulch film was recycled. The collected cotton straw was chopped into pieces (2–5 cm length) and spread onto the soil surface, followed by a rotary tillage to thoroughly incorporate the straw and soil at a depth of 0–20 cm (~7500 kg ha−1). The cotton straw contained 45.8% ± 1.7% of carbon (C), 5.9% ± 0.6% of hydrogen (H), 1.1% ± 0.2% of nitrogen (N), and 41.9% ± 2.2% of oxygen (O). Irrigation utilized snowmelt water supplemented by groundwater during peak demand. Fertilization included urea (46% N), diammonium phosphate (18% N, 46% P2O5), and potassium chloride (60% K2O), with total inputs of 430 kg N ha−1, 410 kg P2O5 ha−1, and 270 kg K2O ha−1 applied per year. Base application before sowing delivered 30% of total N, 70% of P2O5, and 100% of K2O; the remaining 70% N and 30% P2O5 were drip-applied during growth. Irrigation was delivered through ~10 drip events totaling approximately 4800 m3 ha−1 across the cotton growing season.

2.3. Soil Sampling and Analysis

On 1st July 2019, three soil cores per plot were collected from 5 depths (0–20, 40–60, 100–120, 140–160, and 180–200 cm) for each treatment according to our previous research [10]. Cores were composited by depth, yielding 60 samples (4 treatments × 5 depths × 3 replicates). Subsamples were stored as follows: (1) 4 °C for immediate analysis; (2) −20 °C for dissolved organic carbon (DOC) and incubation; (3) −80 °C for microbial analysis. The remaining soil was air-dried (2 mm sieved) for physicochemical analysis.
The soil particle size distribution was determined by the pipette method [32]. pH and electrical conductivity (EC) (soil:water = 1:2.5) were measured with a pH meter (FE20, Mettler Toledo, Shanghai, China) and a conductivity meter (DDS 11A, Shanghai Yueping, Suzhou, China). Moisture content was determined gravimetrically. Dissolved inorganic nitrogen (NH4+ and NO3) was extracted by 1 M KCl (1:20) and quantified by a continuous flow analyzer (Seal AA3, Seal anasitical, Shanghai, China). Dissolved organic carbon was water-extracted (1:20) and quantified using an element analyzer (Vario TOC cube, Elementar Analysensysteme GmbH, Frankfurt, Germany). Available Ca, Mg, P, and K were extracted by the Mehlich 3 method (HOAc-NH4-NO3-NH4F-HNO3-EDTA, pH 2.5) [33], and their contents were determined by Inductively Coupled Plasma Optical Emission Spectrometry (ICP-OES, Avio 200, Perkin Elmer, Waltham, MA, USA). The total soil carbon of the soil samples was determined by an Elemental Analyzer (Flash Smart NC soil, Thermo Fisher Scientific, Waltham, MA, USA), and SOC was measured after carbonate removal (1M HCl, 24 h) [34]. SIC was then calculated as the difference between total soil carbon and SOC.

2.4. Soil Incubation

Soils from five depths (0–20, 40–60, 100–120, 140–160, 180–200 cm) per treatment were incubated (samples equaled 10 g per depth). Moisture was adjusted to 70% of the field water-holding capacity. All the experiments were conducted in triplicate. The pre-incubation period was set at 5 days to activate the soil microbial activity, conducted in the dark at a constant temperature of 25 ± 1 °C. During the incubation, gas samples (~10 mL) were taken from the containers on days 1, 3, 6, 10, 23, and 35. After each sampling, the bottles were kept open for 30 min for air exchange and equilibrium. The CO2 concentrations in the collected gas samples were then determined using gas chromatography (Clarus 680 GC, PerkinElmer). The cumulative CO2-C emission (CO2 min., mg kg−1) from the mineralized SOC was calculated using the equations provided in Appendix A.2 (Equation (A1)).

2.5. Soil Extracellular Enzyme Activity

Considering that soil salinity (indicated by EC) significantly influences microbial growth, reproduction, and enzyme secretion in saline–alkali soils [35,36], we selected two representative soil layers under straw return treatment where EC values were below and above those in the control treatment for subsequent enzyme activity testing and microbial community diversity analysis. To investigate the influence of straw return treatment on the microbes altering the conversion of SOC to SIC, the enzyme (sucrase, urease, and carbonic anhydrase) activity in the topsoil (0–20 cm) and deep soil (140–160 cm) under control, SR5, and SR20 treatments were analyzed. This is because the activity of sucrase, urease, and carbonic anhydrase characterizes SOC decomposition, nitrogen supply, and CO2 hydration reaction. Briefly, the activity levels of sucrase, urease, and carbonic anhydrase were measured in field-collected air-dried soil samples using soil enzyme activity detection kits (Solarbio, Beijing, China), with all reagents and analytical procedures strictly following the manufacturer’s protocols. Crucially, enzyme activity levels are expressed in U g−1 soil, where one U g−1 soil denotes the amount catalyzing 1 unit of product formed per minute per gram of soil at 37 °C.

2.6. Total Soil Bacterial DNA Extraction and 16S rRNA Sequencing

Total DNA was extracted (0.5 g fresh soil) from 0–20 cm and 140–160 cm layers using a PowerSoil® DNA Isolation Kit (MoBio Laboratories Inc., Carlsbad, CA, USA). The concentration and the purity of the extracted DNA were measured using a NanoDrop One spectrophotometer (Thermo Fisher Scientific, Waltham, MA, USA). DNA samples were diluted to 20 ng μL−1 before PCR amplification. The hypervariable regions V4 of bacterial 16S rRNA genes were amplified using the barcode primers 515F (5′-GTGCCAGCMGCCGCGG-3′) and 806R (5′-GGACTACHVGGGTWTCTAAT-3′). All PCR reactions (50 μL volume) contained 25 μL 2× Premix Taq (Takara Biotechnology, Dalian Co., Ltd., Dalian, China); 1 μL 10 mM forward and reverse primers; 60 ng template DNA; and 20 μL nuclease-free water. The DNA from each sample was individually amplified in triplicated PCR reactions with the following cycling conditions: initial denaturation at 94 °C for 5 min; 30 cycles of denaturation at 94 °C for 30 s, annealing at 52 °C for 30 s, and elongation at 72 °C for 30 s; and a final elongation at 72 °C for 10 min. PCR products from each sample were pooled and cleaned using the E.Z.N.A.® Gel Extraction Kit (Omega Bio-tek, Inc., Norcross, GA, USA).
Illumina libraries were constructed according to the manufacturer’s instructions. High-throughput sequencing was performed using the Illumina Hiseq2500 platform (Guangdong Magigene Biotechnology Co., Ltd., Guangzhou, China). The paired-end clean reads were obtained by Trimmomatic (V0.33), and then merged using FLASH (V1.2.11). Using unique barcodes, the merged reads were sorted into each sample through Mothur (V1.35.1) to obtain the clean tags. The usearch software (V10) was used to cluster the clean tags into OTUs (Operational Taxonomic Units) at a 97% sequence identity threshold. The Chao 1 and Shannon indices of the bacterial community were calculated following Equations (A2)–(A4) (Appendix A.3).

2.7. Co-Occurrence Analysis

According to the method reported by Hartman et al. [37], this study constructed co-occurrence networks of bacteria in the 0–20 cm and 140–160 cm soil layers, respectively. TMM (Trimmed Mean of M-values) and normalized CPM (Counts Per Million) counts were used to conduct Spearman rank correlations between OTUs with strong and significant correlations (r  >  0.8 and p  <  0.01). Then, the networks were visualized using the layout calculated by the Fruchterman–Reingold method with 999 permutations and visualized by using the “igraph” package of RStudio Statistical Software (Ver. 1.2.5042, 2020, Integrated Development for R. RStudio, Inc., Boston, MA, USA). To investigate the bacterial community structure within the different soil depths, we identified network modules by utilizing the greedy optimization of modularity algorithm, as implemented in “igraph”. Additionally, the “sciplot” and “ggpmisc” R packages were employed to identify straw return-sensitive OTUs (srsOTUs), which showed significant differences (p < 0.05) among the varied straw return year treatments. These differences were validated using likelihood ratio tests implemented in edgeR, within the co-occurrence network’s module.

2.8. Data Analysis

Linear regression analysis and principal component analysis (PCA) were used to investigate the effect of Nap on the transport of PyC colloids, which was calculated and visualized by the “ggbiplot” and “ggplot2” packages of RStudio Statistical Software. All values are presented as the mean ± standard deviation (SD). Statistical analyses, such as ANOVA and least significant difference (LSD), were performed using SPSS 20.0 for windows (SPSS Inc., Chicago, IL, USA). In short, a value of p < 0.05 was considered statistically significant, and differences between the means that were greater than the LSD were considered statistically significant (p < 0.05).

3. Results

3.1. Impact of Straw Return Years on Soil Carbon

Straw return significantly enhanced SOC content within the 0–200 cm soil layers compared to the control treatment (5.7–1.2 g kg−1) (Figure 1a). Specifically, the SR5 treatment increased SOC by 25.6%, 23.0%, and 40.0% in the 0–20, 100–120, and 180–200 cm layers, respectively (p < 0.05). The SR10 treatment elevated SOC by 11.2%, 54.1%, and 100.2% at the corresponding layers, respectively (p < 0.05). SR20 induced non-significant change at 40–60 cm but significant increases of 18.6%, 66.1%, 71.9%, and 252.7% in other layers (p < 0.05).
The DOC in the control soils ranged from 3.0 mg kg−1 to 100.6 mg kg−1 across all sampled depths (0–200 cm). Straw return significantly increased DOC (Figure 1b), with SR5, SR10, and SR20 enhancing DOC by 9.9–454.2%, 39.4–833.4%, and 111.1–1048.7%, respectively (p < 0.05). Specifically, SR20 induced substantially greater increases than SR5/SR10 in the 0–20 cm (111.1%), 40–60 cm (147.3%), and 100–120 cm (396.3%) layers. Notably, the 140–160 cm layer exhibited the highest percentage increases (SR5: 454.2%; SR10: 833.4%; SR20: 1048.7%) due to the extremely low DOC content in the control soil, though absolute increments remained small.
The SIC under the control treatment ranged from 17.2 g kg−1 to 22.6 g kg−1. The effect of straw return on SIC was influenced by both soil depth and straw return years (Figure 1c). Compared to the control treatment, under SR5 treatment, the SIC in the 0–20 cm, 40–60 cm, and 100–120 cm soil layers decreased by 10.7%, 11.1%, and 9.2% (p < 0.05), respectively, while there was a significant increase of 6.3% in the 180–200 cm soil layer. Compared to the control treatment, under the SR10 treatment, the SIC in the 0–20 cm and 40–60 cm soil layers decreased by 5.7% and 9.4%, respectively, while it significantly increased by 11.3%, 27.4%, and 33.1% in the 100–120 cm, 140–160 cm, and 180–200 cm soil layers. Under the SR20 treatment, the SIC in the 0–20 cm and 40–60 cm soil layers decreased by 9.7% and 13.9%, and in contrast, SIC significantly increased by 27.7%, 44.5%, and 52.7% in the 100–120 cm, 140–160 cm, and 180–200 cm soil layers.

3.2. Cumulative CO2 Emission from Soil Incubation

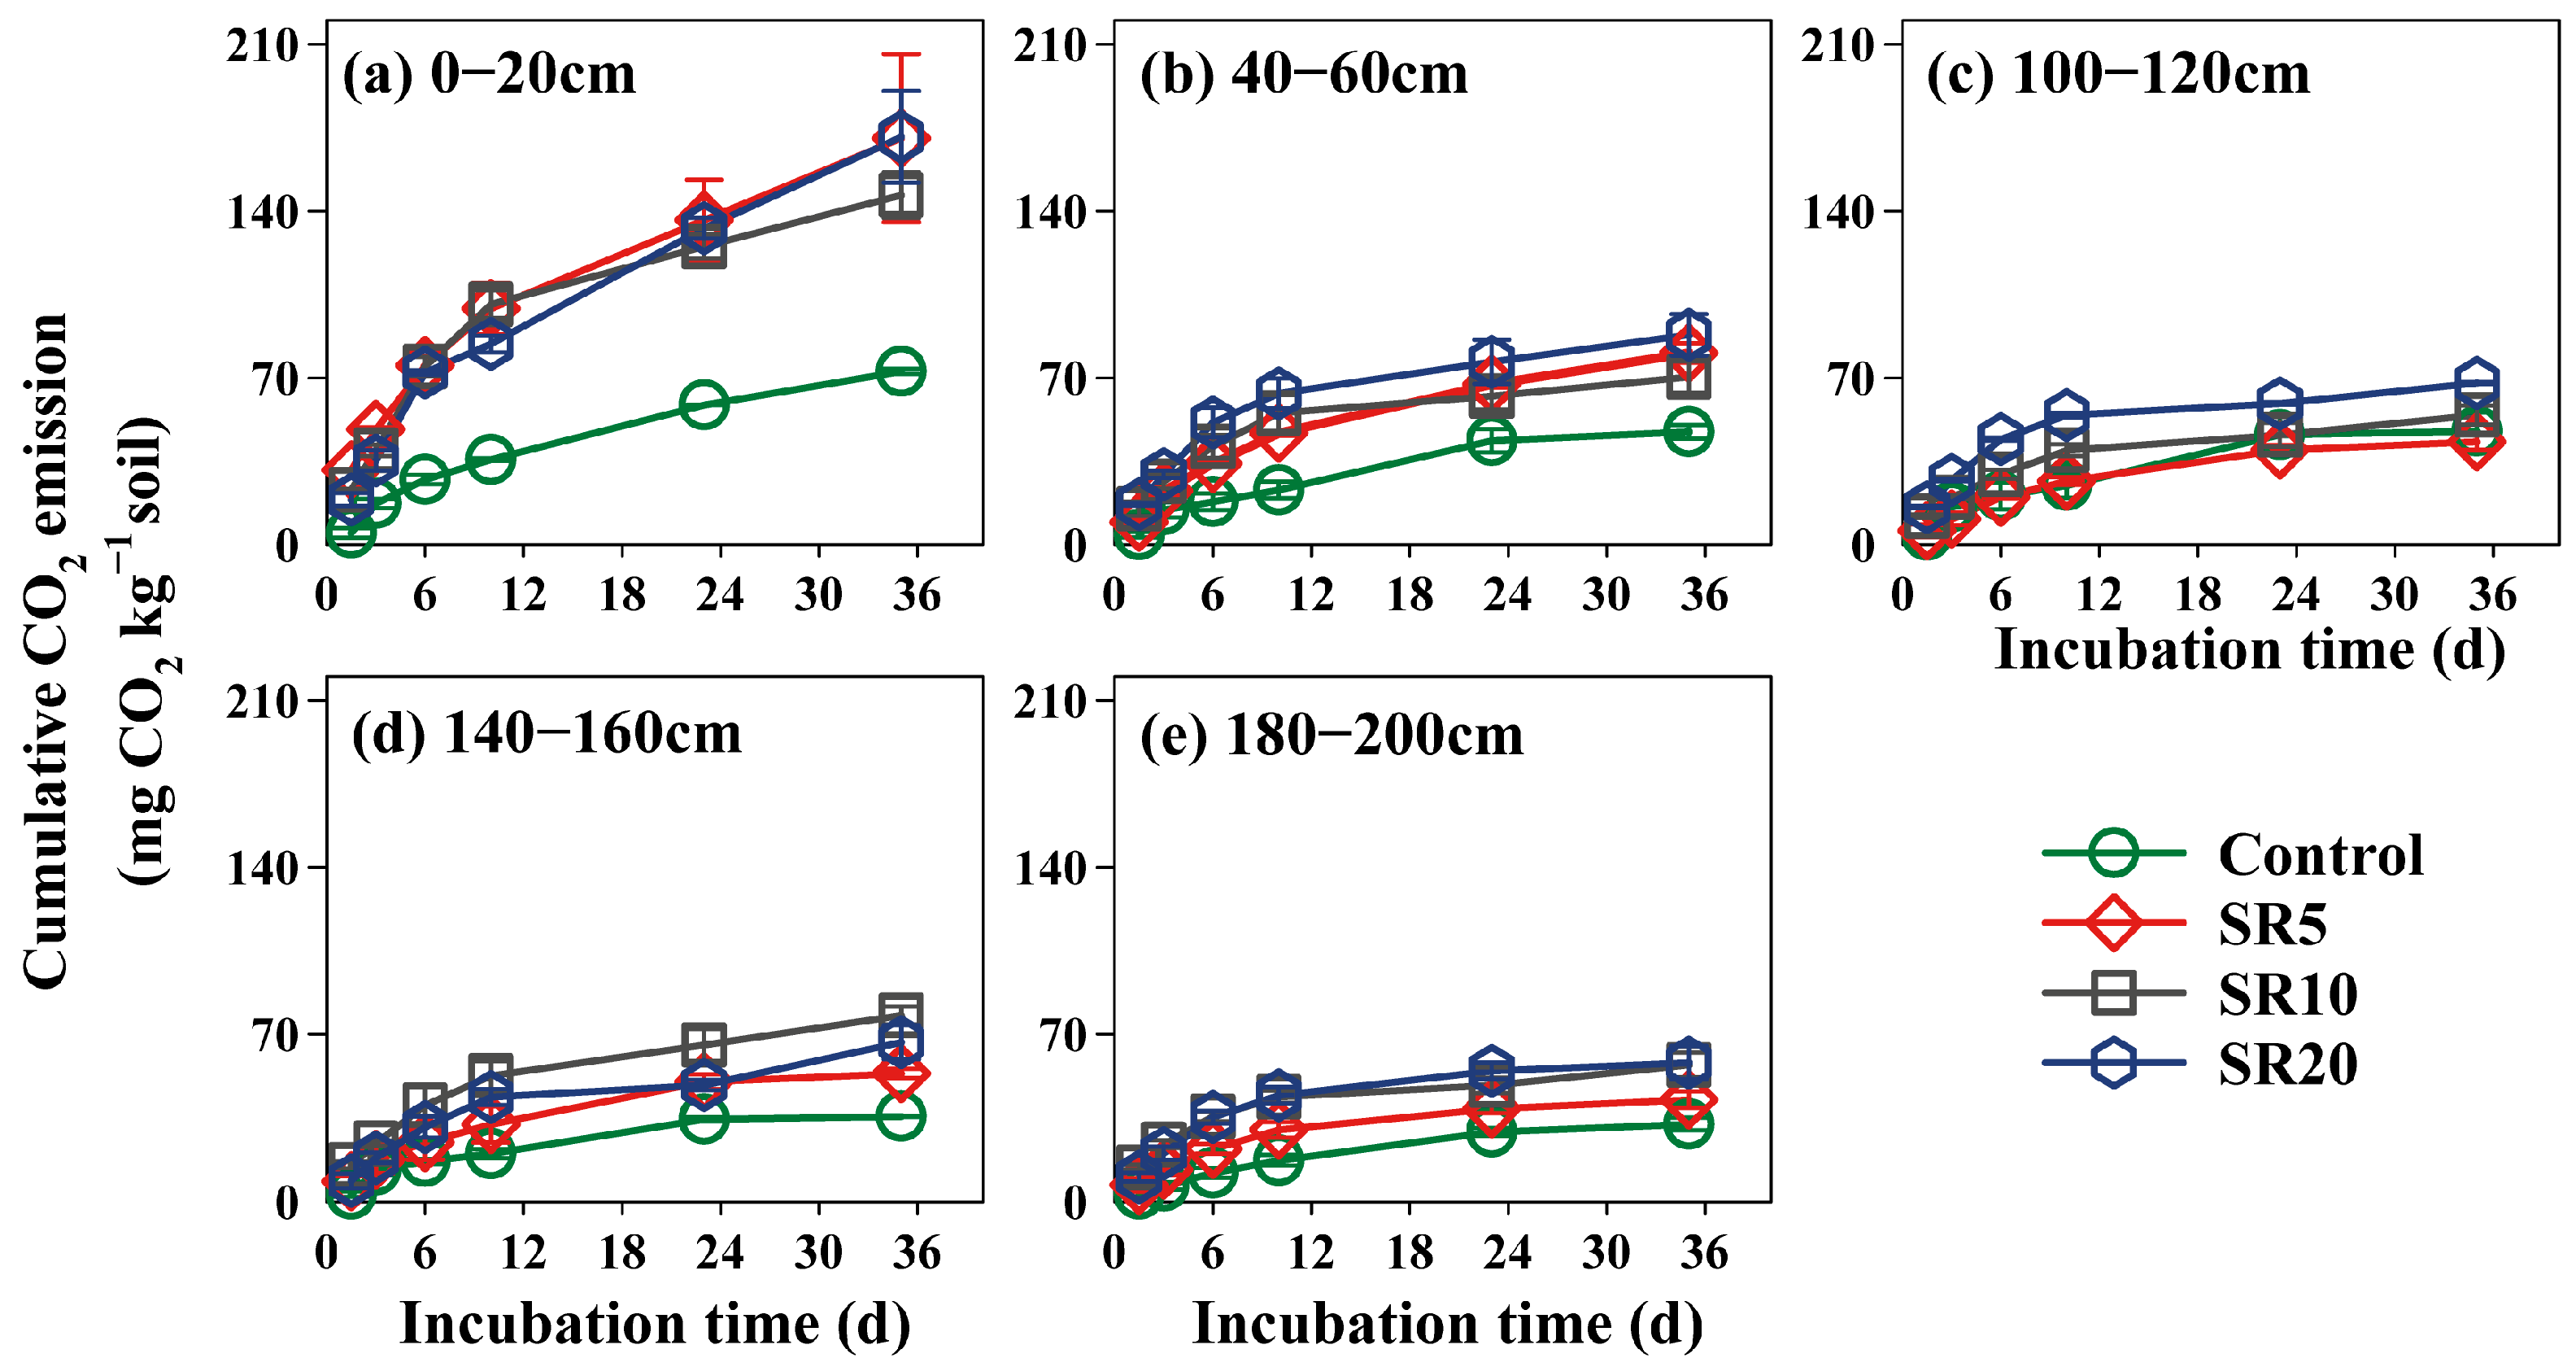
During 35-day incubations, cumulative CO2 emission decreased with soil depth (Figure 2). The peak cumulative CO2 emission was observed in the 0–20 cm soil layer, and it decreased with increasing soil depth (Figure 2). Under the control treatment, the cumulative CO2 emission ranged from 73.7 mg CO2 kg−1 soil to 32.3 mg CO2 kg−1 soil in the five layers of the 0–200 cm soil profile. All straw return treatments significantly increased emissions, with the maximum increase under SR20 treatment. Specifically, the SR5 treatment showed a significant increase in cumulative CO2 emission only in the 0–20 cm, 40–60 cm, and 140–160 cm soil layers, with increases of 134.4%, 69.7%, and 50.5%, respectively (p < 0.05), compared to the control treatment. Under the SR10 treatment, no significant difference was observed in the 100–120 cm soil layer, while the other soil layers showed increases of 101.6%, 48.6%, 119.0%, and 76.9%, respectively (p < 0.05). Under the SR20 treatment, the cumulative CO2 emissions in all incubated soil layers from 0–200 soil were significantly higher than those under the control treatment, with increases of 135.1%, 85.9%, 42.3%, 87.3%, and 79.8% (p < 0.05).

3.3. Effects of Straw Return on Soil Properties

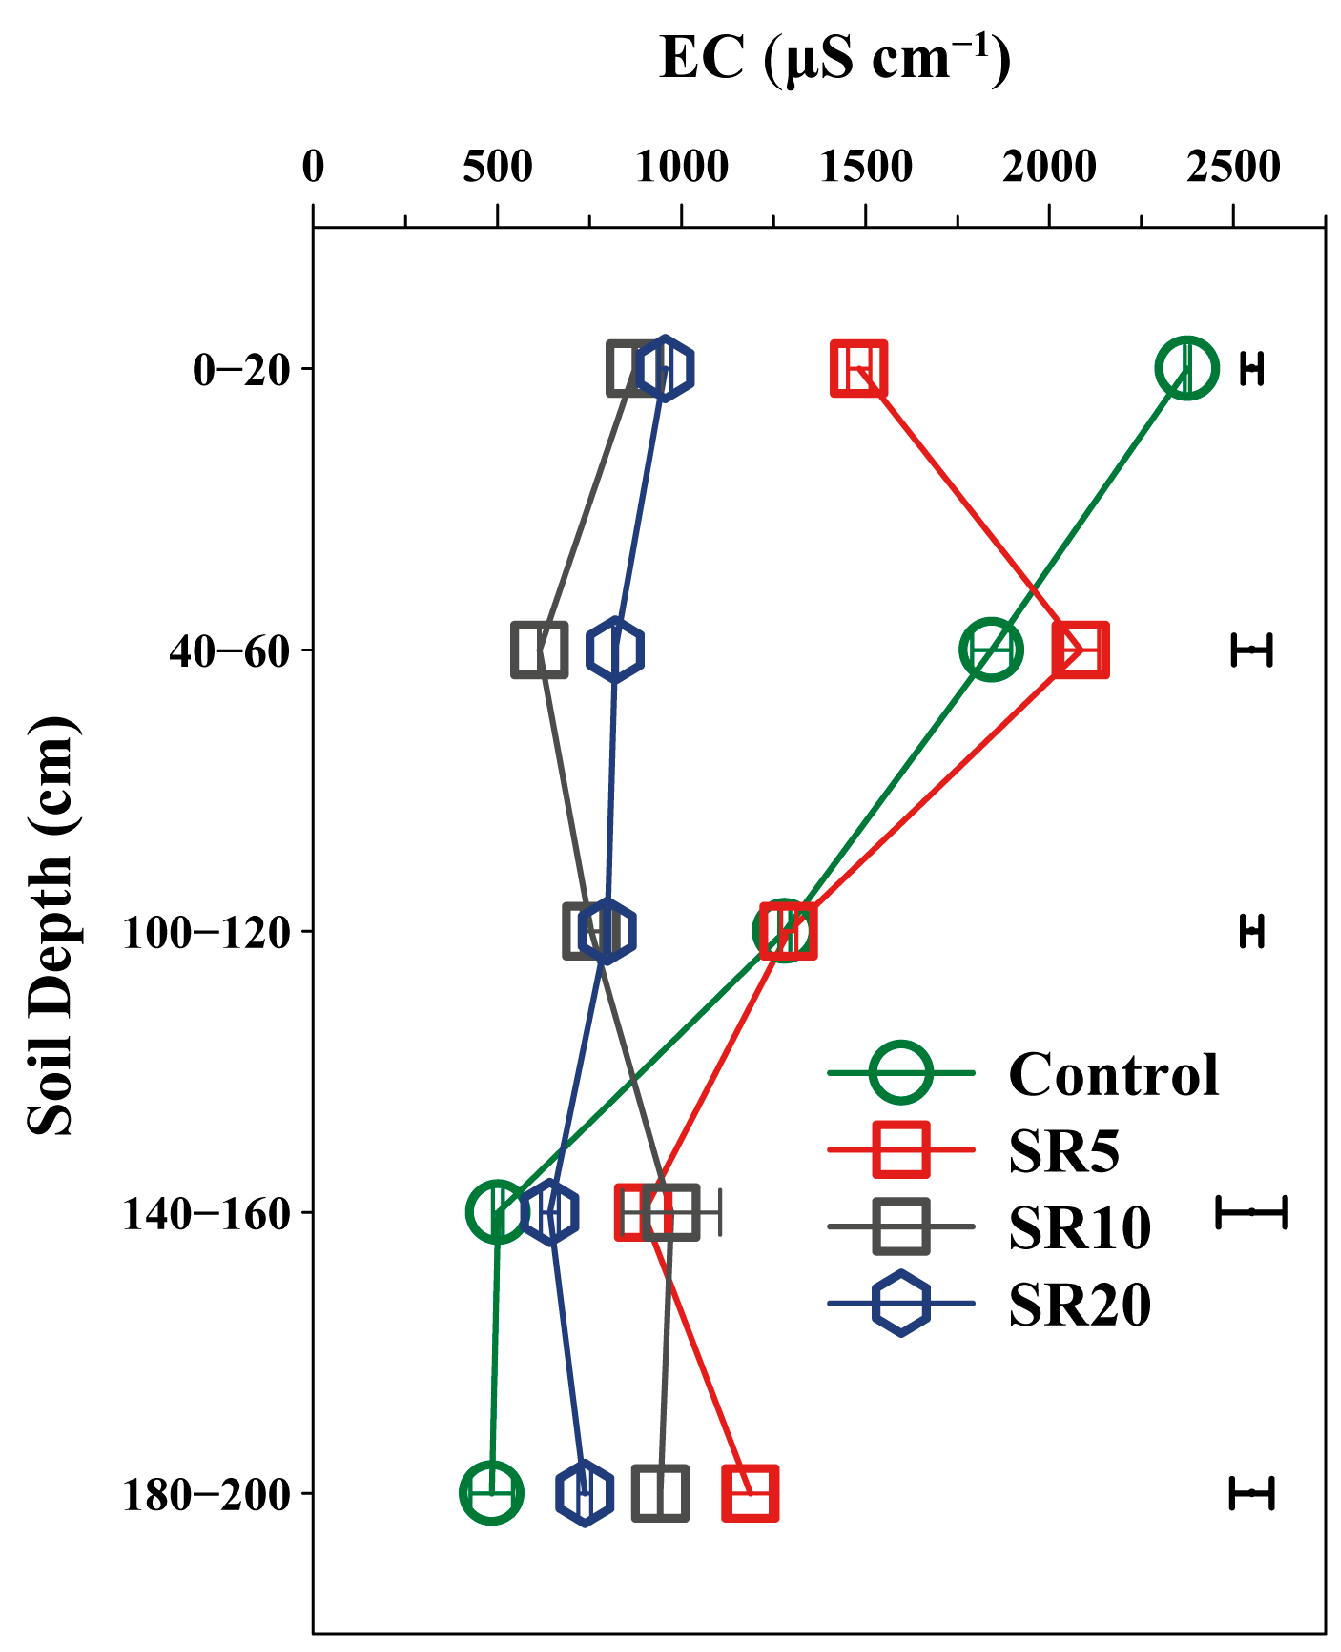
Soil salinity (indicated by EC value), a key microbial constraint [35,36], decreased significantly in the 0–120 cm layers under straw return. Specifically, the SR5 treatment significantly reduced EC values by 37.6% at 0–20 cm, while SR10 and SR20 decreased EC values by 41.0%~63.2% and 37.7%~59.8% in the 0–120 cm soil layers, respectively (p < 0.05), but increased them below 160 cm (Figure 3). This reduction may result from the experimental system (mulch + tillage + irrigation), where water movement likely leached salts from the topsoil [38,39,40], while mulching suppressed salt resurgence via evaporation control [41].
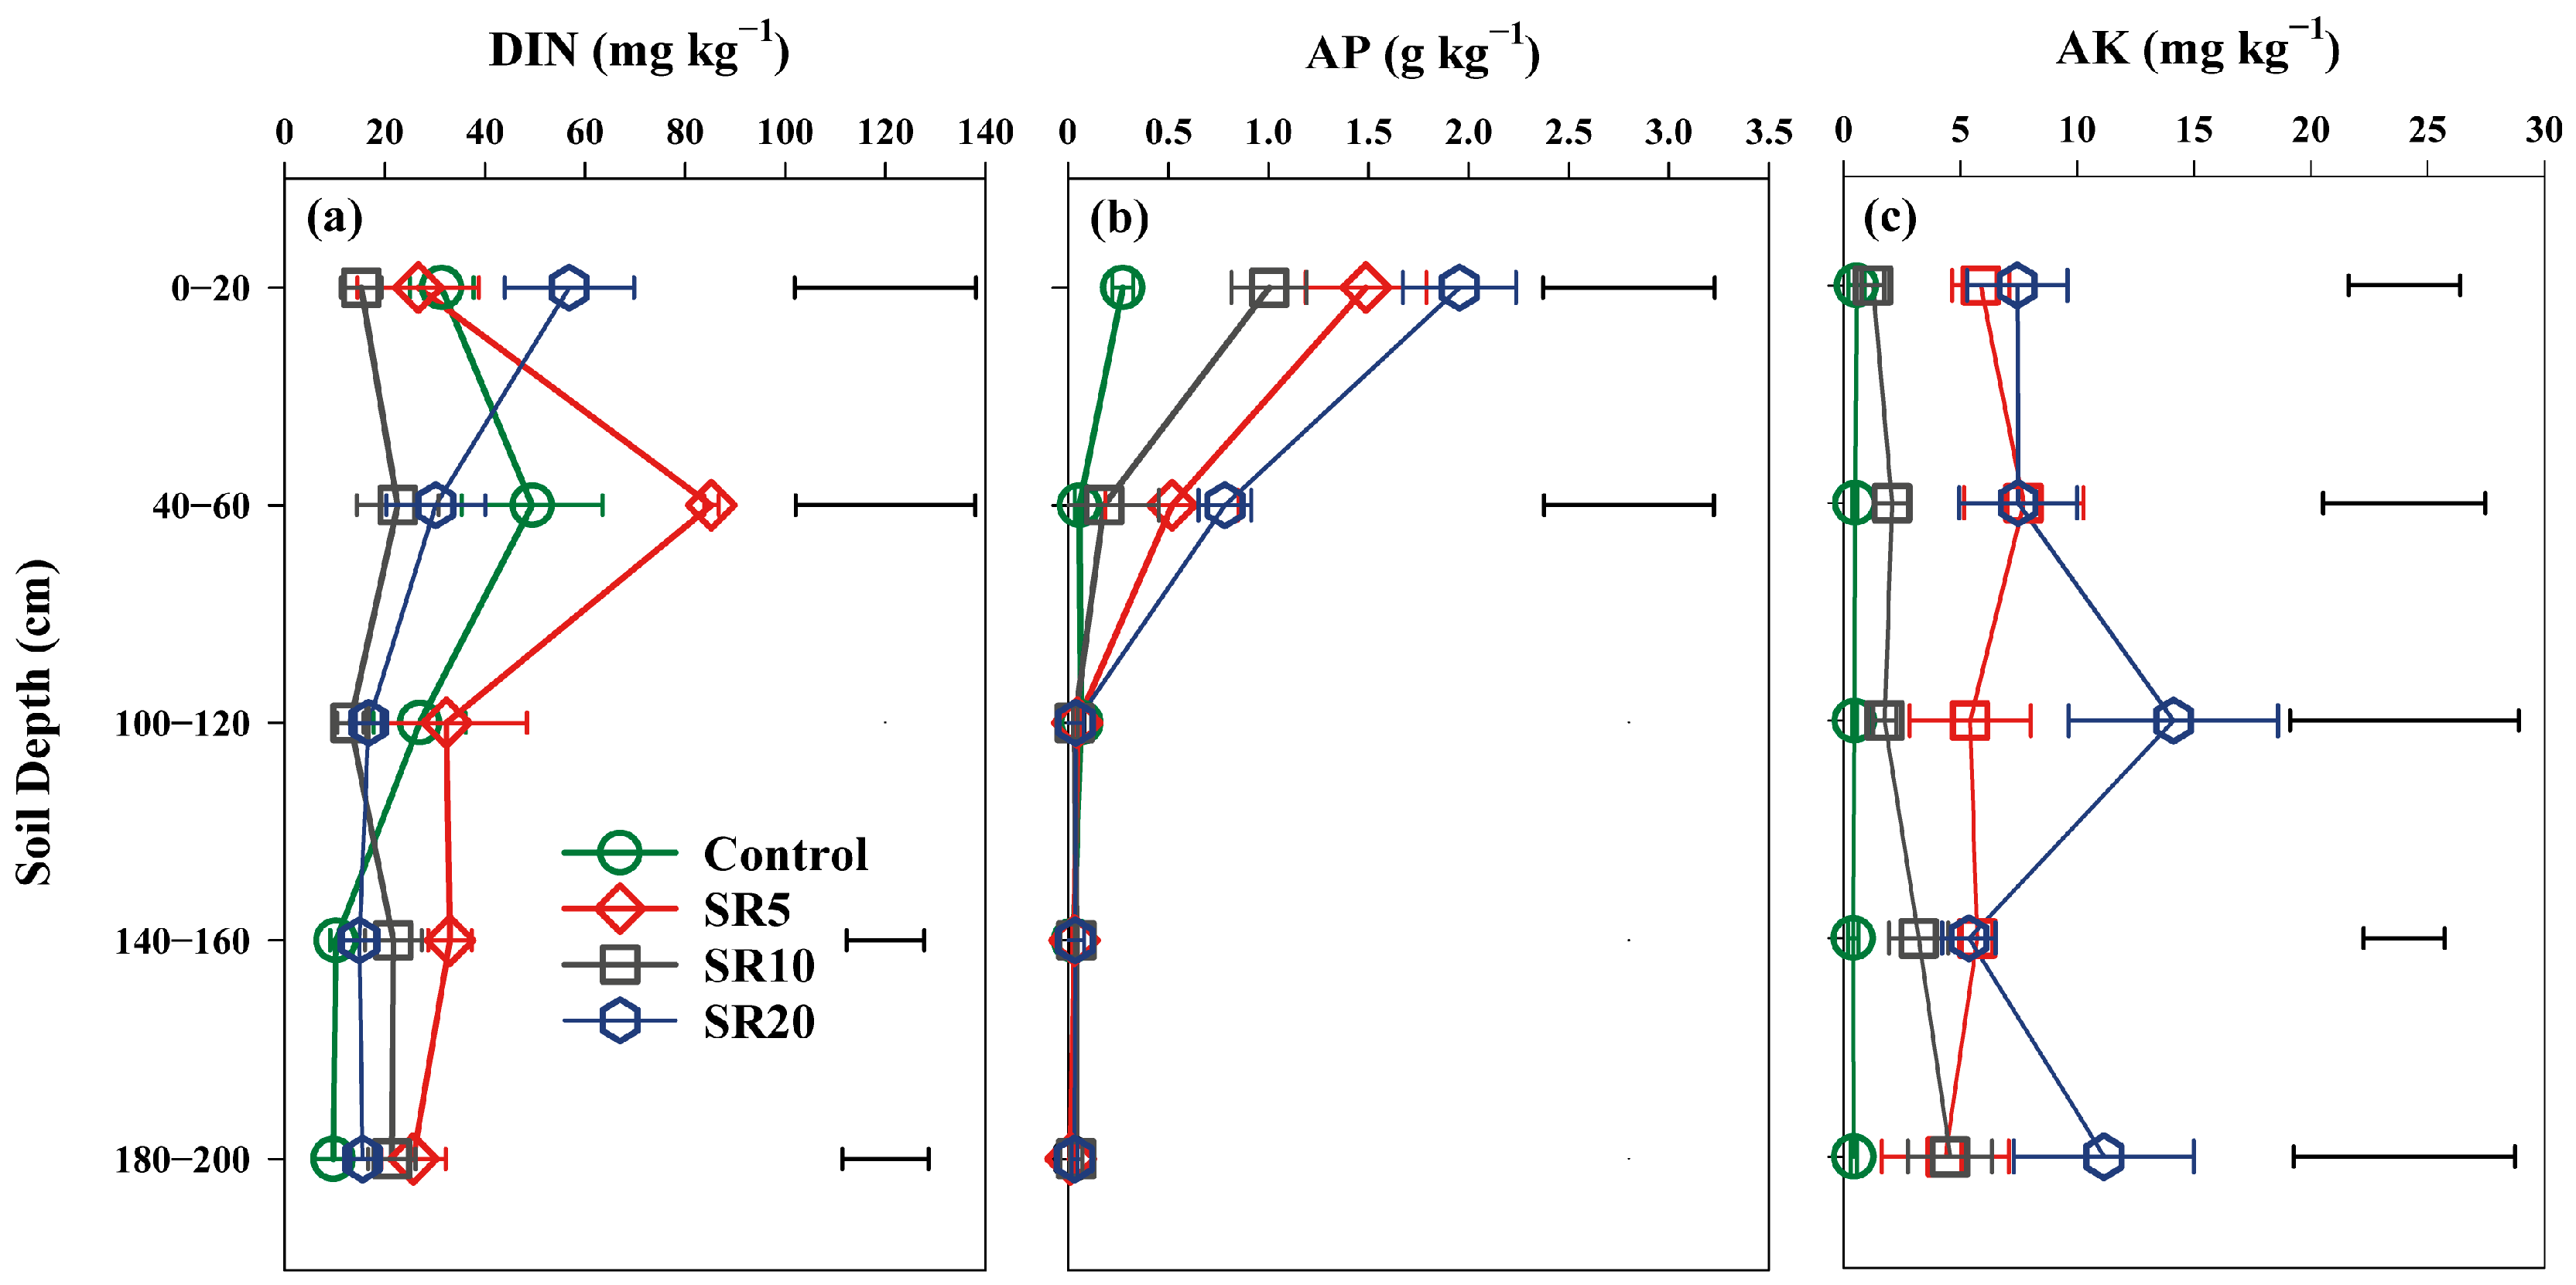
DIN responses varied in the 0–120 cm soil layers, but below 140 cm, DIN increments decreased with straw return years (Figure 4a). The most significant increase in DIN was observed in the SR5 treatment (p < 0.05), with no significant difference between the SR20 and control treatments. Available phosphorus (AP) increased significantly in the 0–60 cm soil layers (p < 0.05) but remained unchanged below 60 cm (p > 0.05) (Figure 4b). Available potassium (AK) increased throughout the 0–200 cm soil layers, with the largest increase (1212.5–2984.2%) observed under the SR20 treatment (p < 0.05) (Figure 4c).

3.4. Soil Enzyme Activities of Topsoil and Deep Soil

Enzyme activity levels in representative soil layers (0–20 cm and 140–160 cm) revealed differential responses (Figure 5). Control soils exhibited the lowest activity levels: sucrase averaged 2.5 U g−1 soil (topsoil) and 1.6 U g−1 soil (deep soil), carbonic anhydrase was 0.069 U g−1 soil and 0.063 U g−1 soil, and urease was 194.1 U g−1 soil and 29.1 U g−1 soil. Straw return significantly altered the enzyme activity levels in both layers. Sucrase activity significantly increased by 225.4–221.3% in the topsoil but remained statistically unchanged in deep soil. Carbonic anhydrase activity exhibited the most pronounced increases under straw return, with the levels in topsoil rising by 258.0–334.7% and those in deep soil increasing by 82.6–116.6%. Urease activity in the topsoil increased significantly by 169.7% to 149.5%, while in the deep soil layer, a significant enhancement (58.1%) only occurred under SR20 treatment.

3.5. Soil Bacterial Communities of Topsoil and Deep Soil

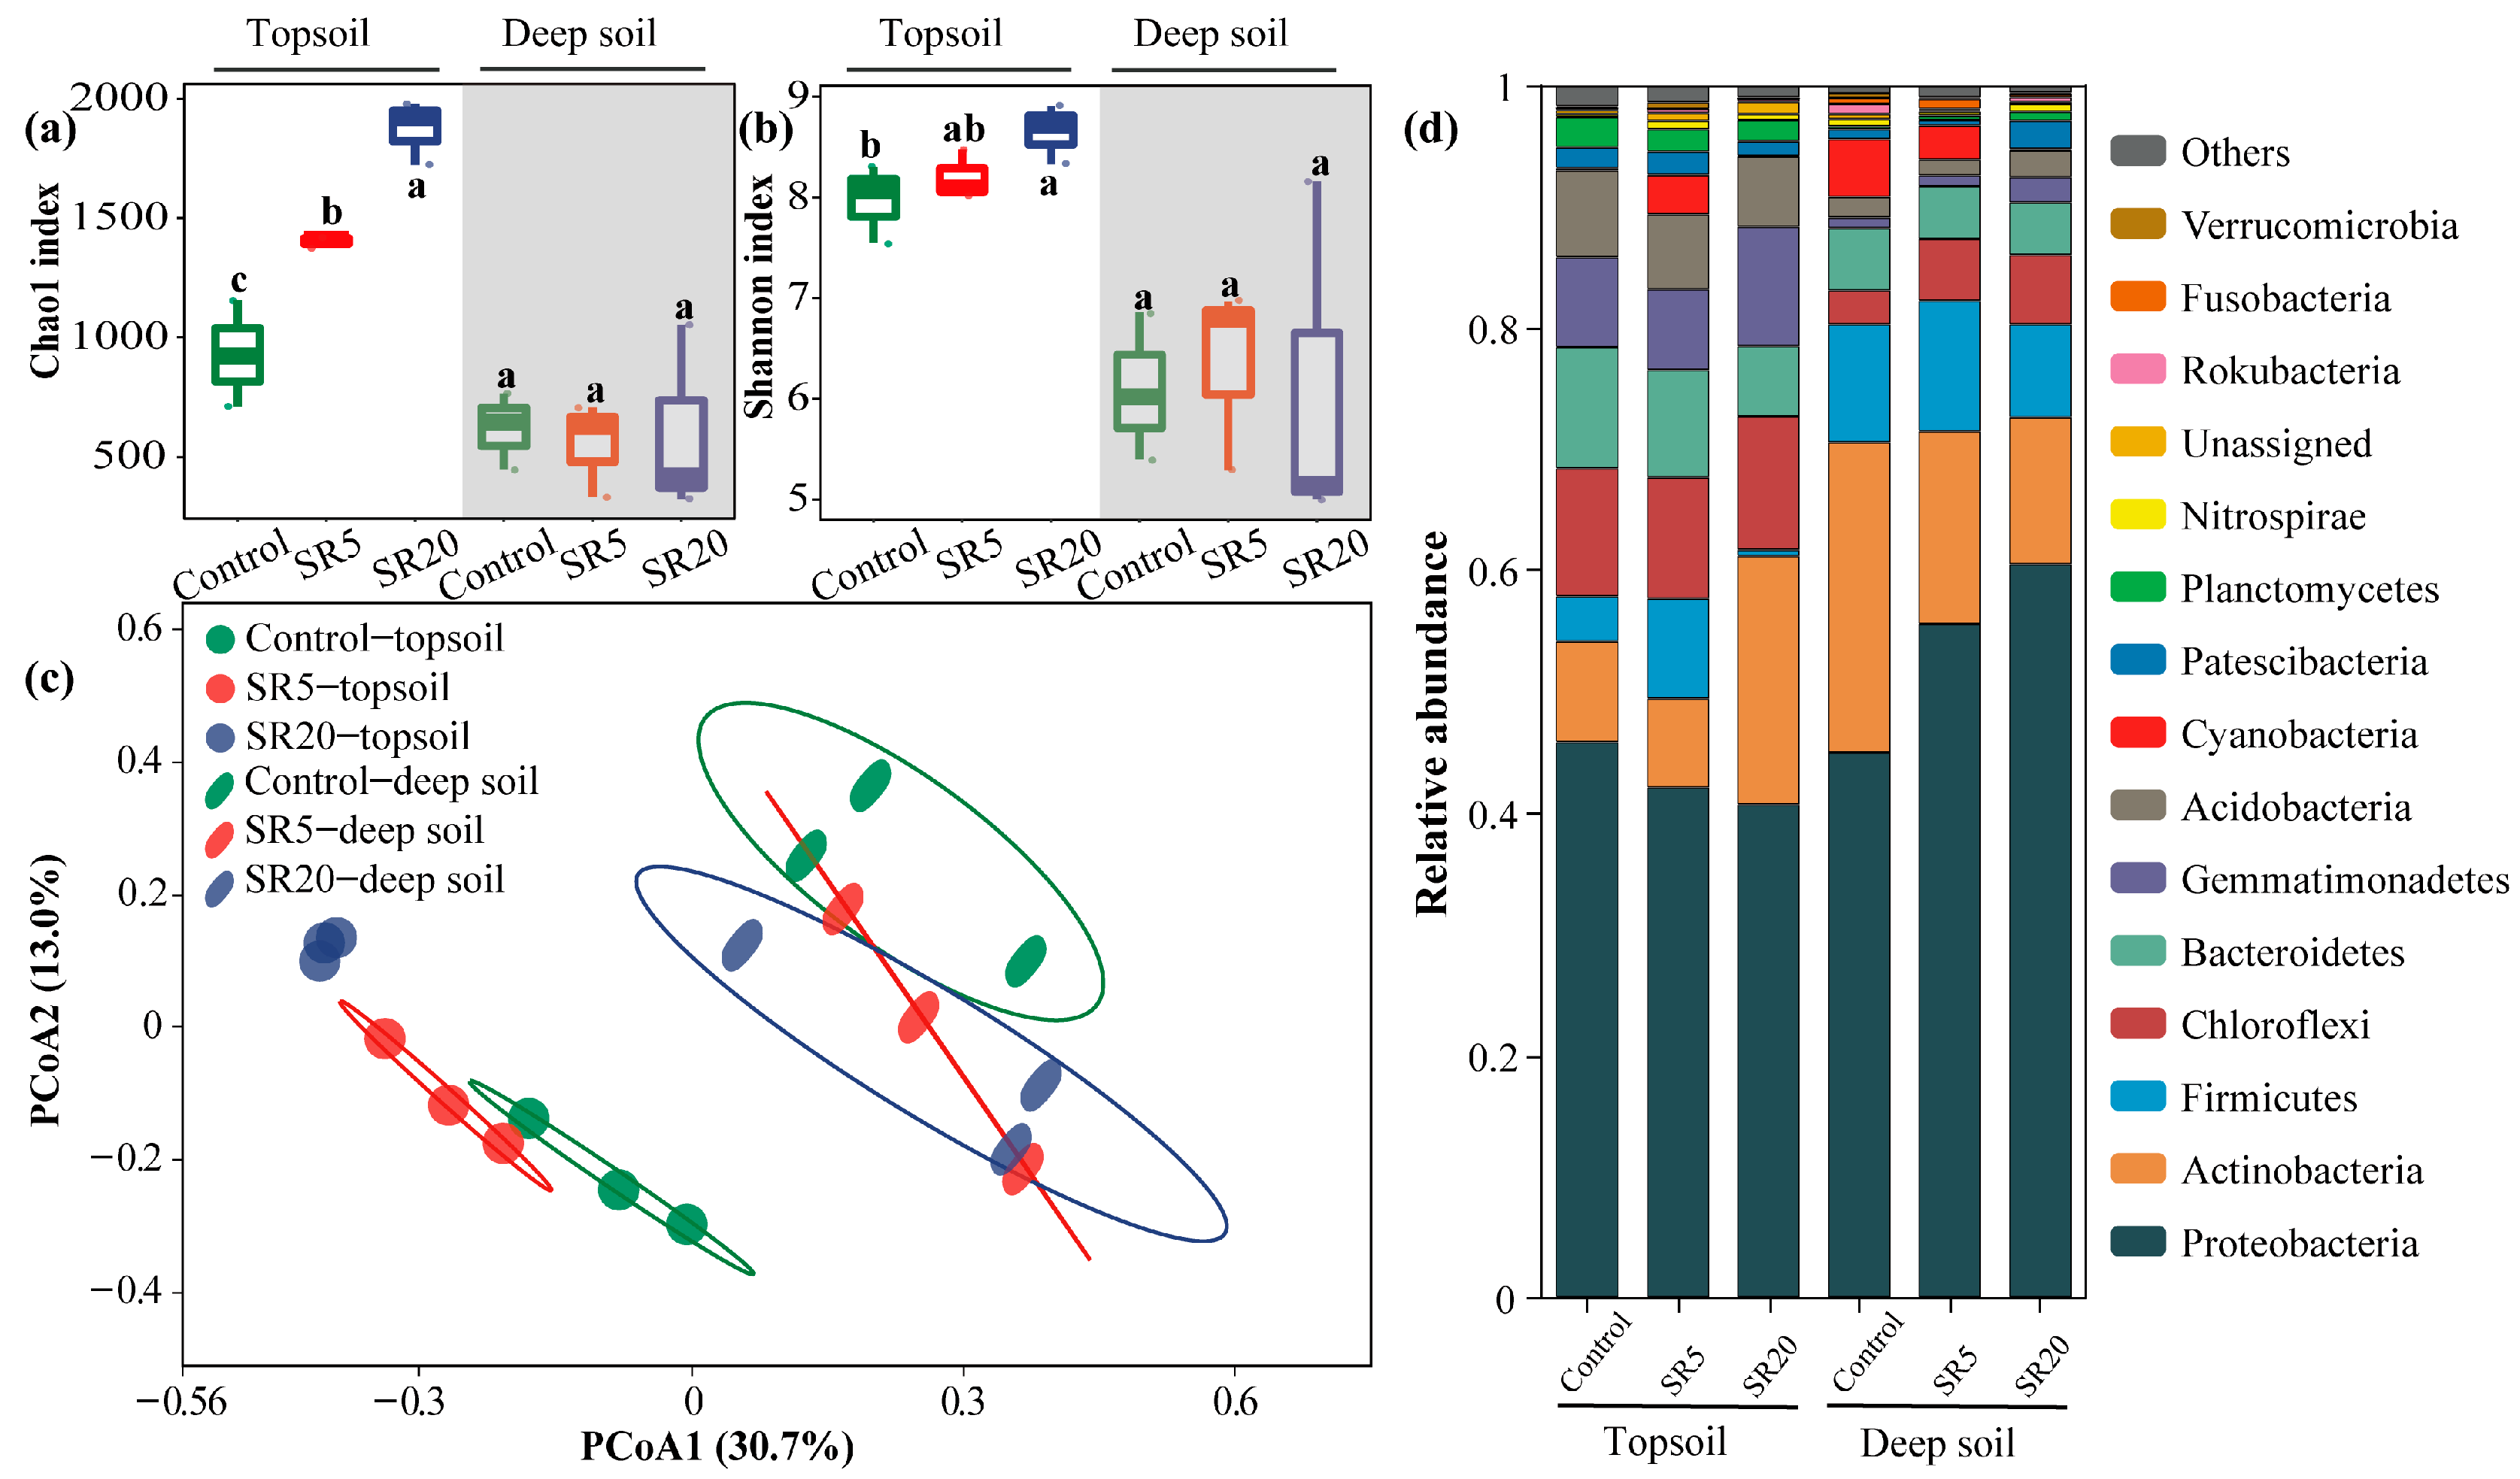
Straw return significantly enhanced the bacterial α diversity in the 0–20 cm layer, while the impact on the 140–160 cm soil layer was minimal (p > 0.05). Specifically, the Chao1 index showed a significant increase under SR5 and SR20 treatments (50.8% and 101.6%, respectively) compared to the control treatment, while the Shannon index exhibited a modest rise (8.5% under the SR20 treatment) (p < 0.05). On the other hand, the straw return did not significantly influence the alpha diversity of bacteria in the 140–160 cm soil layer (p > 0.05). Additionally, Figure 6c shows significant differences in the beta diversity of soil microorganisms in the 0–20 cm soil layer under the first principal component (PCoA1) and the second principal component (PCoA2) between the straw return and control treatments. However, in the 140–160 cm soil layer, significant differences in beta diversity were observed only between the SR20 and control treatments.
Figure 6d shows the composition of the top 15 relative abundances of bacteria at the phylum level in the 0–20 cm and 140–160 cm soil layers under the control, SR5, and SR20 treatments. The dominant phyla across all treatments included Proteobacteria, Actinobacteria, Firmicutes, Chloroflexi, Bacteroidetes, and Gemmatimonadetes, which together accounted for 80–90% of the total abundance. The relative abundance of Firmicus in the SR5 treatment increased to 7.9% from 3.5% in the control treatment. The SR20 treatment increased the relative abundance of Actinobacteria and Gemmatimonadetes to 20.3% and 9.8%, respectively, from 8.3% and 7.4% in the control treatment. Conversely, the relative abundance of Firmicus and Bacteroidetes in the SR20 treatment decreased to 0.5% and 5.8%, respectively, from 3.5% and 10.5% in the control treatment. In the 140–160 cm soil layer, the relative abundance of Proteobacteria increased from 46.9% in the control to 55.4% in the SR5 treatment and 60.4% in the SR20 treatment. The relative abundance of Chloroflexi increased from 2.7% (control) to 5.3% (SR5) and 5.8% (SR20). The relative abundance of Gemmatimonadetes increased from 0.9% in the control to 2.0% in the SR20 treatment. Meanwhile, the relative abundance of Actinobacteria decreased from 24.3% in the control to 16.5% in the SR5 treatment and 12.6% in the SR20 treatment.

3.6. Co-Occurrence Network Analysis

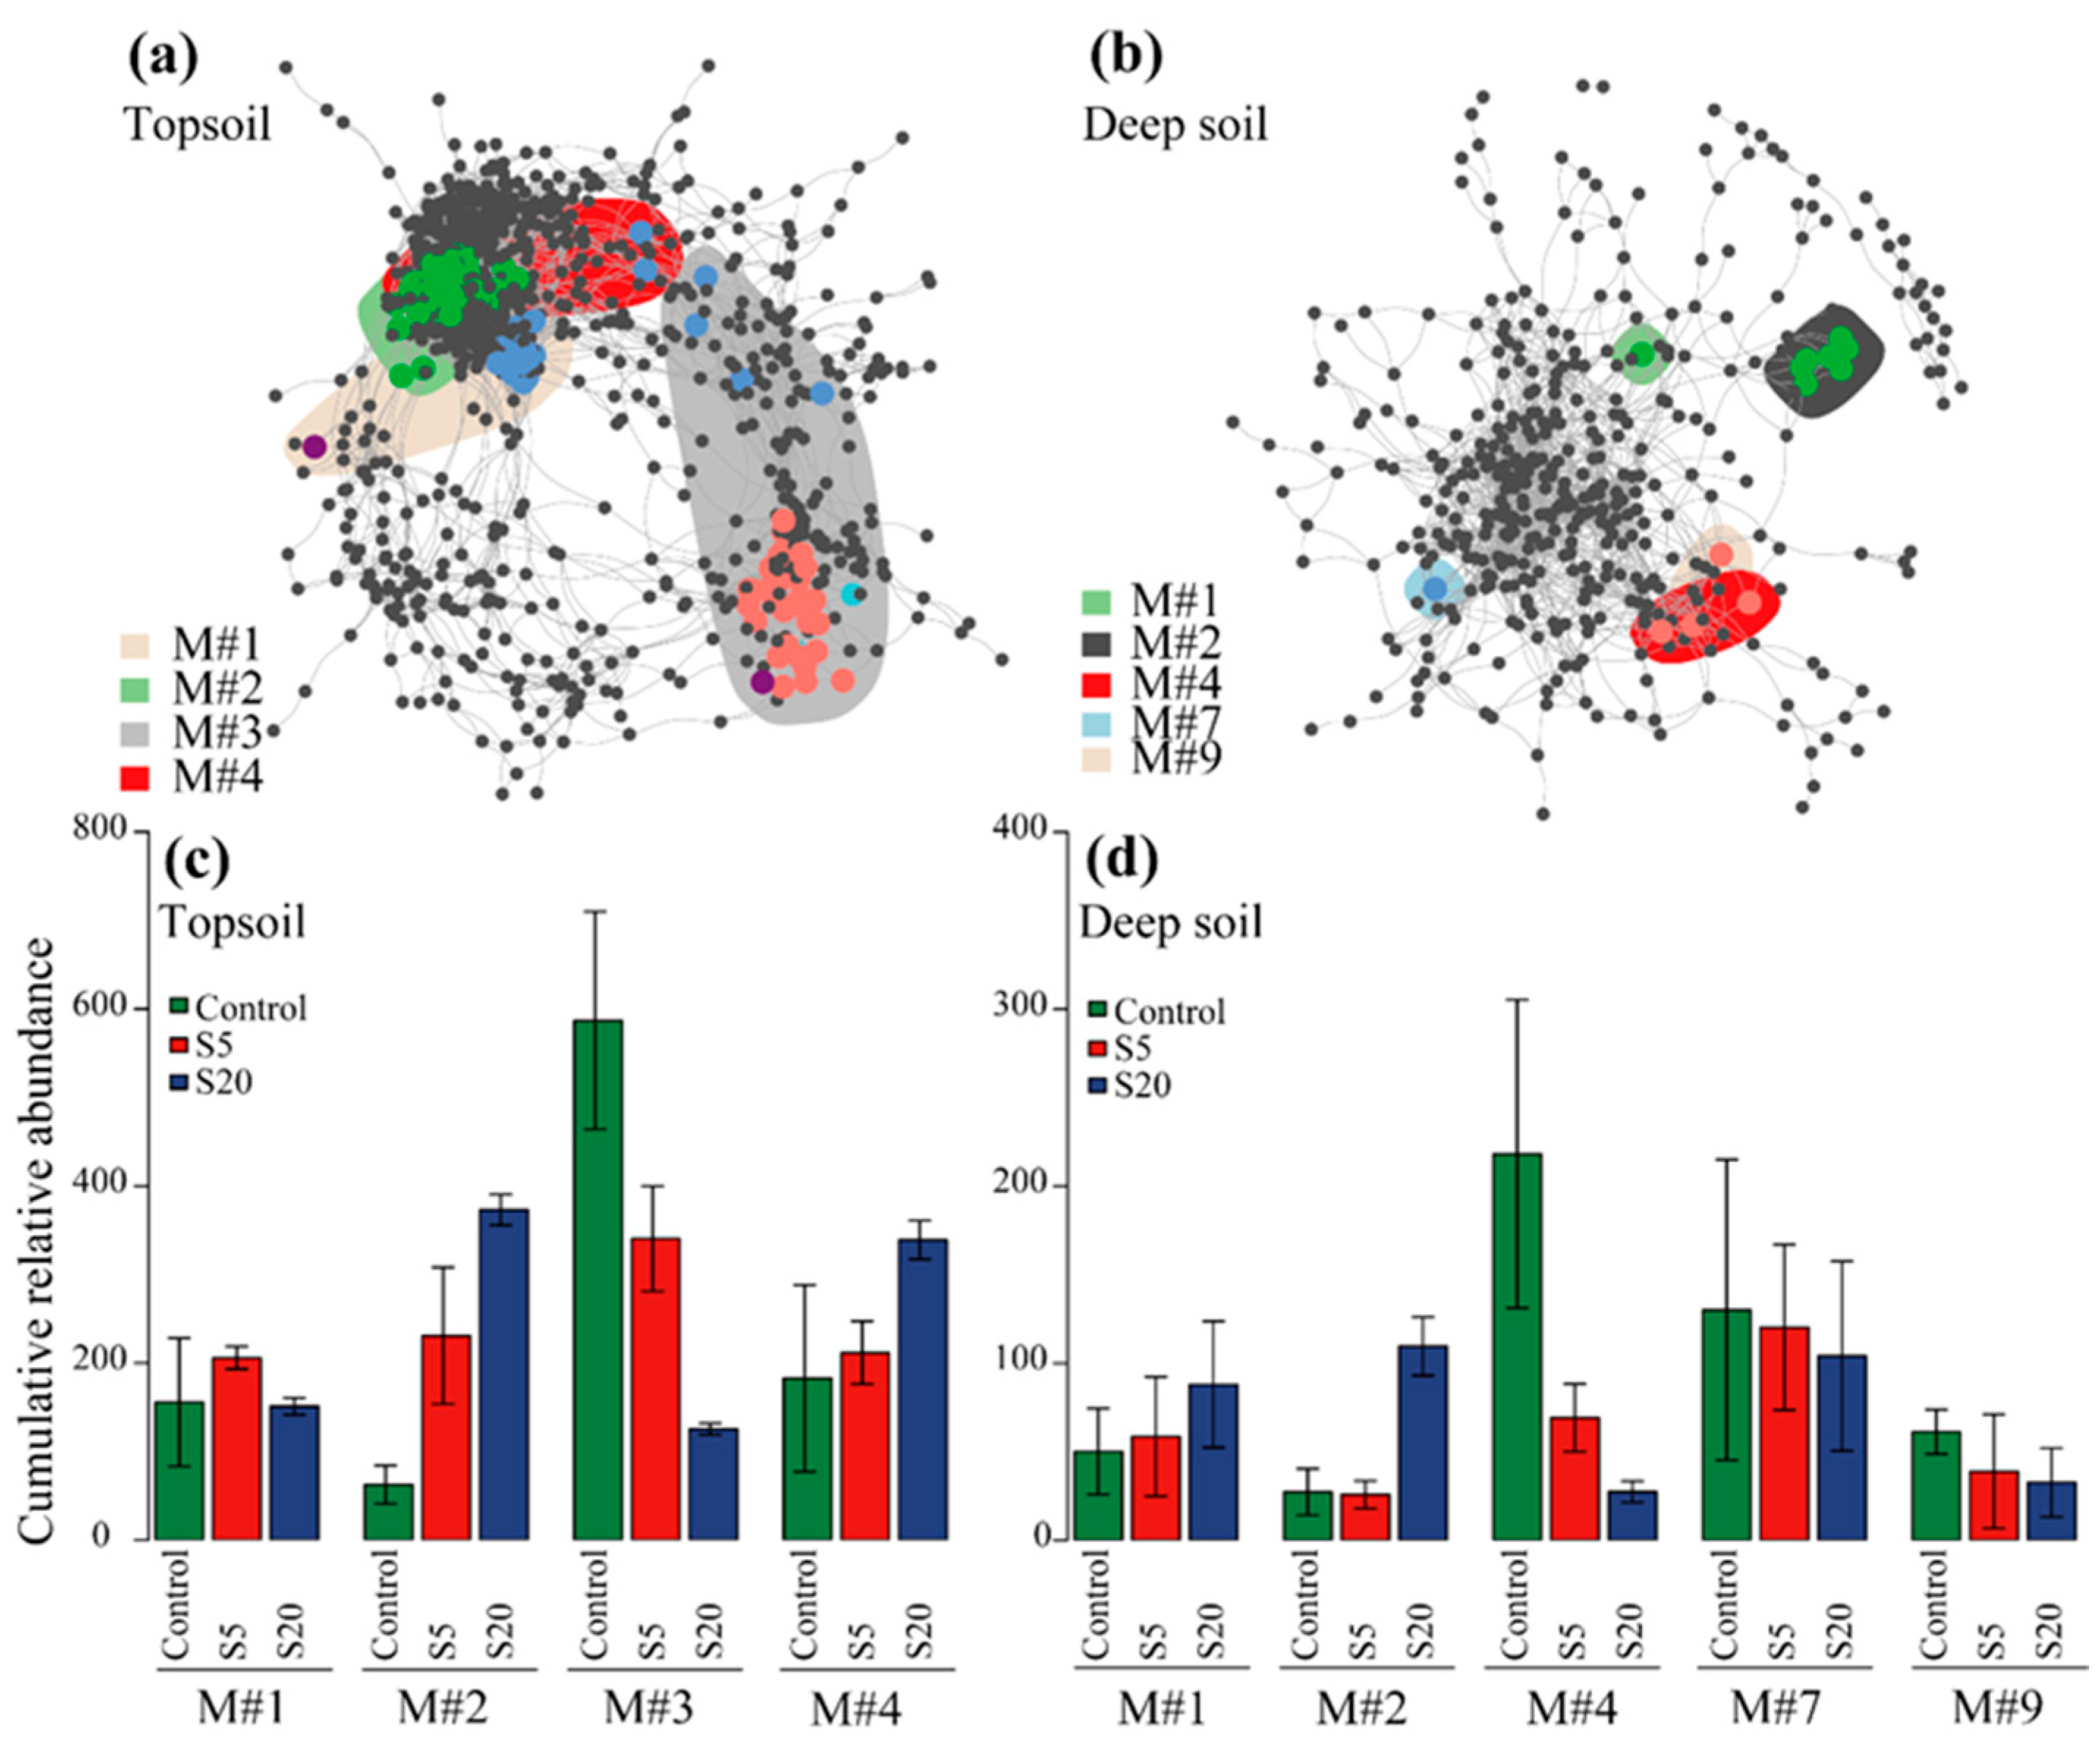
Straw return-sensitive OTUs (srsOTUs) were distributed across different modules in both the 0–20 cm and 140–160 cm soil layers, as observed through bacterial co-occurrence network analysis under the control, SR5, and SR20 treatments (Figure 7a,b). This indicates a significant effect of straw return years on the bacterial abundance in both soil layers. However, the lower cumulative relative abundance of srsOTUs in the 140–160 cm soil layer compared to the topsoil might be due to their reduced sensitivity to straw return (Figure 7c,d). These findings align with the previously analyzed beta diversity of bacteria in the 0–20 cm and 140–160 cm soil layers. Additionally, the bacterial co-occurrence network in the 140–160 cm soil layer exhibited a simpler structure (nodes = 412, edges = 2093, and connectance = 0.0247) compared to the 0–20 cm soil layer (nodes = 1067, edges = 12,345, and connectance = 0.0217).

3.7. Factors Influencing SOC and SIC Sequestration

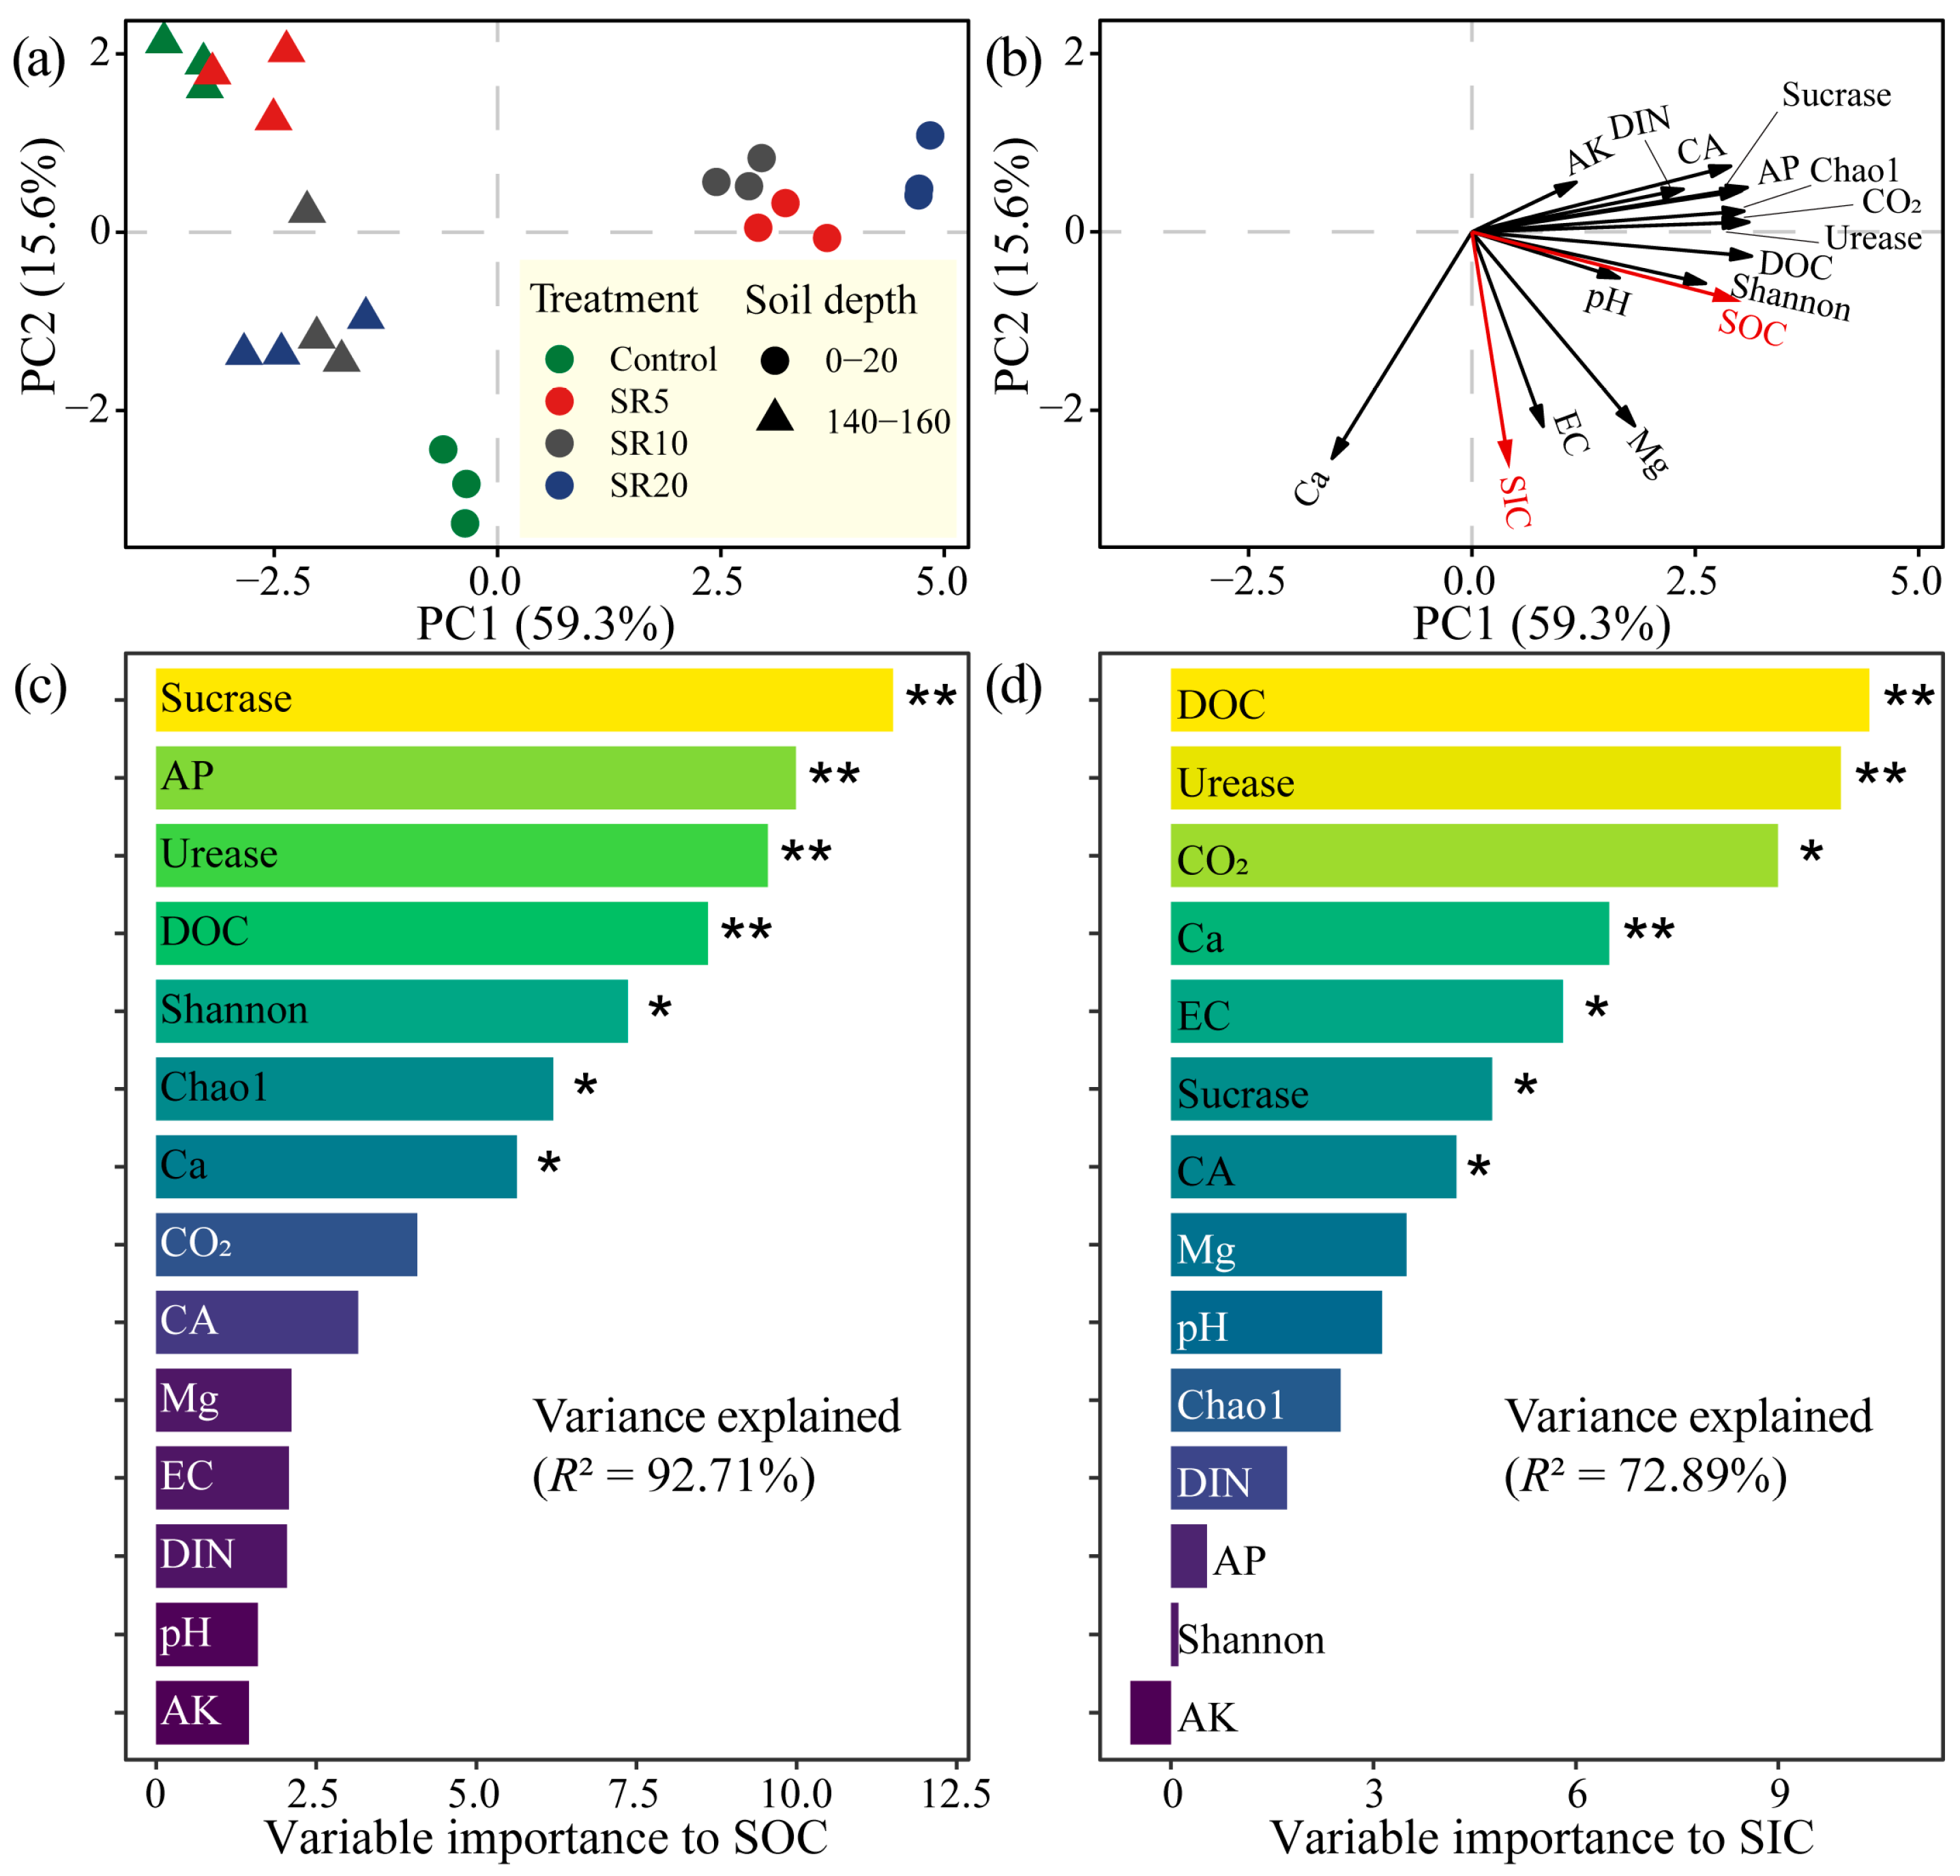
The PCA and random forest model analysis investigated the influences of different factors on SOC and SIC stock in the 0–200 soil profiles with increasing years of straw return treatment (Figure 8). The first two components accounted for 74.9% of the total variation in all the parameters (PC1, 59.3%; PC2, 15.6%). Figure 8a suggests that the straw return years and soil depth substantially influenced SOC and SIC sequestration. The SOC was linked to DOC, CO2, enzyme activity, and nutrients, while SIC was closely and positively related to EC, Ca, and Mg (Figure 8b). Figure 8c shows that sucrase and urease activity, P, DOC, the Shannon and Chao1 indices, and Ca content were the primary factors influencing the SOC sequestration (p < 0.05). On the other hand, the SIC was significantly altered by sucrase and urease activity, DOC, CO2, Ca content, and EC value (p < 0.05) (Figure 8d).

4. Discussion

4.1. Effects of Straw Return on SOC in Topsoil and Deep Soil Layers

Extensive evidence confirms that straw return increases SOC in the topsoil [18], with meta-analyses showing greater increases under long-term (>4 years: +27.7%) than short-term (<4 years: +13.4%) application [42]. Our findings show that straw return significantly increased SOC in the topsoil (0–20 cm) during the first 5–10 years, but this accumulation plateaued with extended application (Figure 1a). The observed carbon saturation point (5–10 years) occurred earlier than previously reported (12–15 years) [3,43], likely due to site-specific climate and soil characteristics. The initial SOC accumulation likely resulted from straw-derived organic matter binding to clay minerals, which inhibited microbial mineralization [44], as reflected in the low CO2 emissions (Figure 2) and reduced microbial and enzyme activity (Figure 5 and Figure 6). However, long-term straw return altered soil conditions by decreasing EC (Figure 3), increasing nutrient availability (Figure 4), and enhancing microbial diversity and enzyme activity (Figure 5 and Figure 6), thereby accelerating SOC mineralization (Figure 2). As the sorption sites on clay minerals became saturated [45,46], unprotected organic matter underwent increased mineralization. Simultaneously, the elevated DOC derived from mineralized SOC (Figure 1b) likely promoted downward leaching, further contributing to SOC depletion in the topsoil [47,48].
In contrast, a significant increase in SOC was also observed in deep soil layers (below 100 cm) (Figure 1a), consistent with a previous study reporting a 44% increase in SOC within the 20–60 cm depth [42]. This pattern likely results from the distinct physicochemical and biological properties of deep soils compared to topsoil. For example, deep soils typically receive lower inputs of plant residues, contain less available substrate, exhibit reduced microbial biomass and activity, and possess greater mineral content [12]. Consistently, our data show significantly lower microbial diversity and enzyme activity in deep soils compared to topsoil (Figure 5 and Figure 6), and PCA confirmed that straw return exerted weaker effects on microbial properties in deeper layers (Figure 8a). Together, these findings suggest that SOC saturation in deep soils occurs much later than in topsoil, highlighting the substantial potential for long-term carbon sequestration in deep soil layers.

4.2. Effects of Straw Return on SIC in Topsoil and Deep Soil Layers

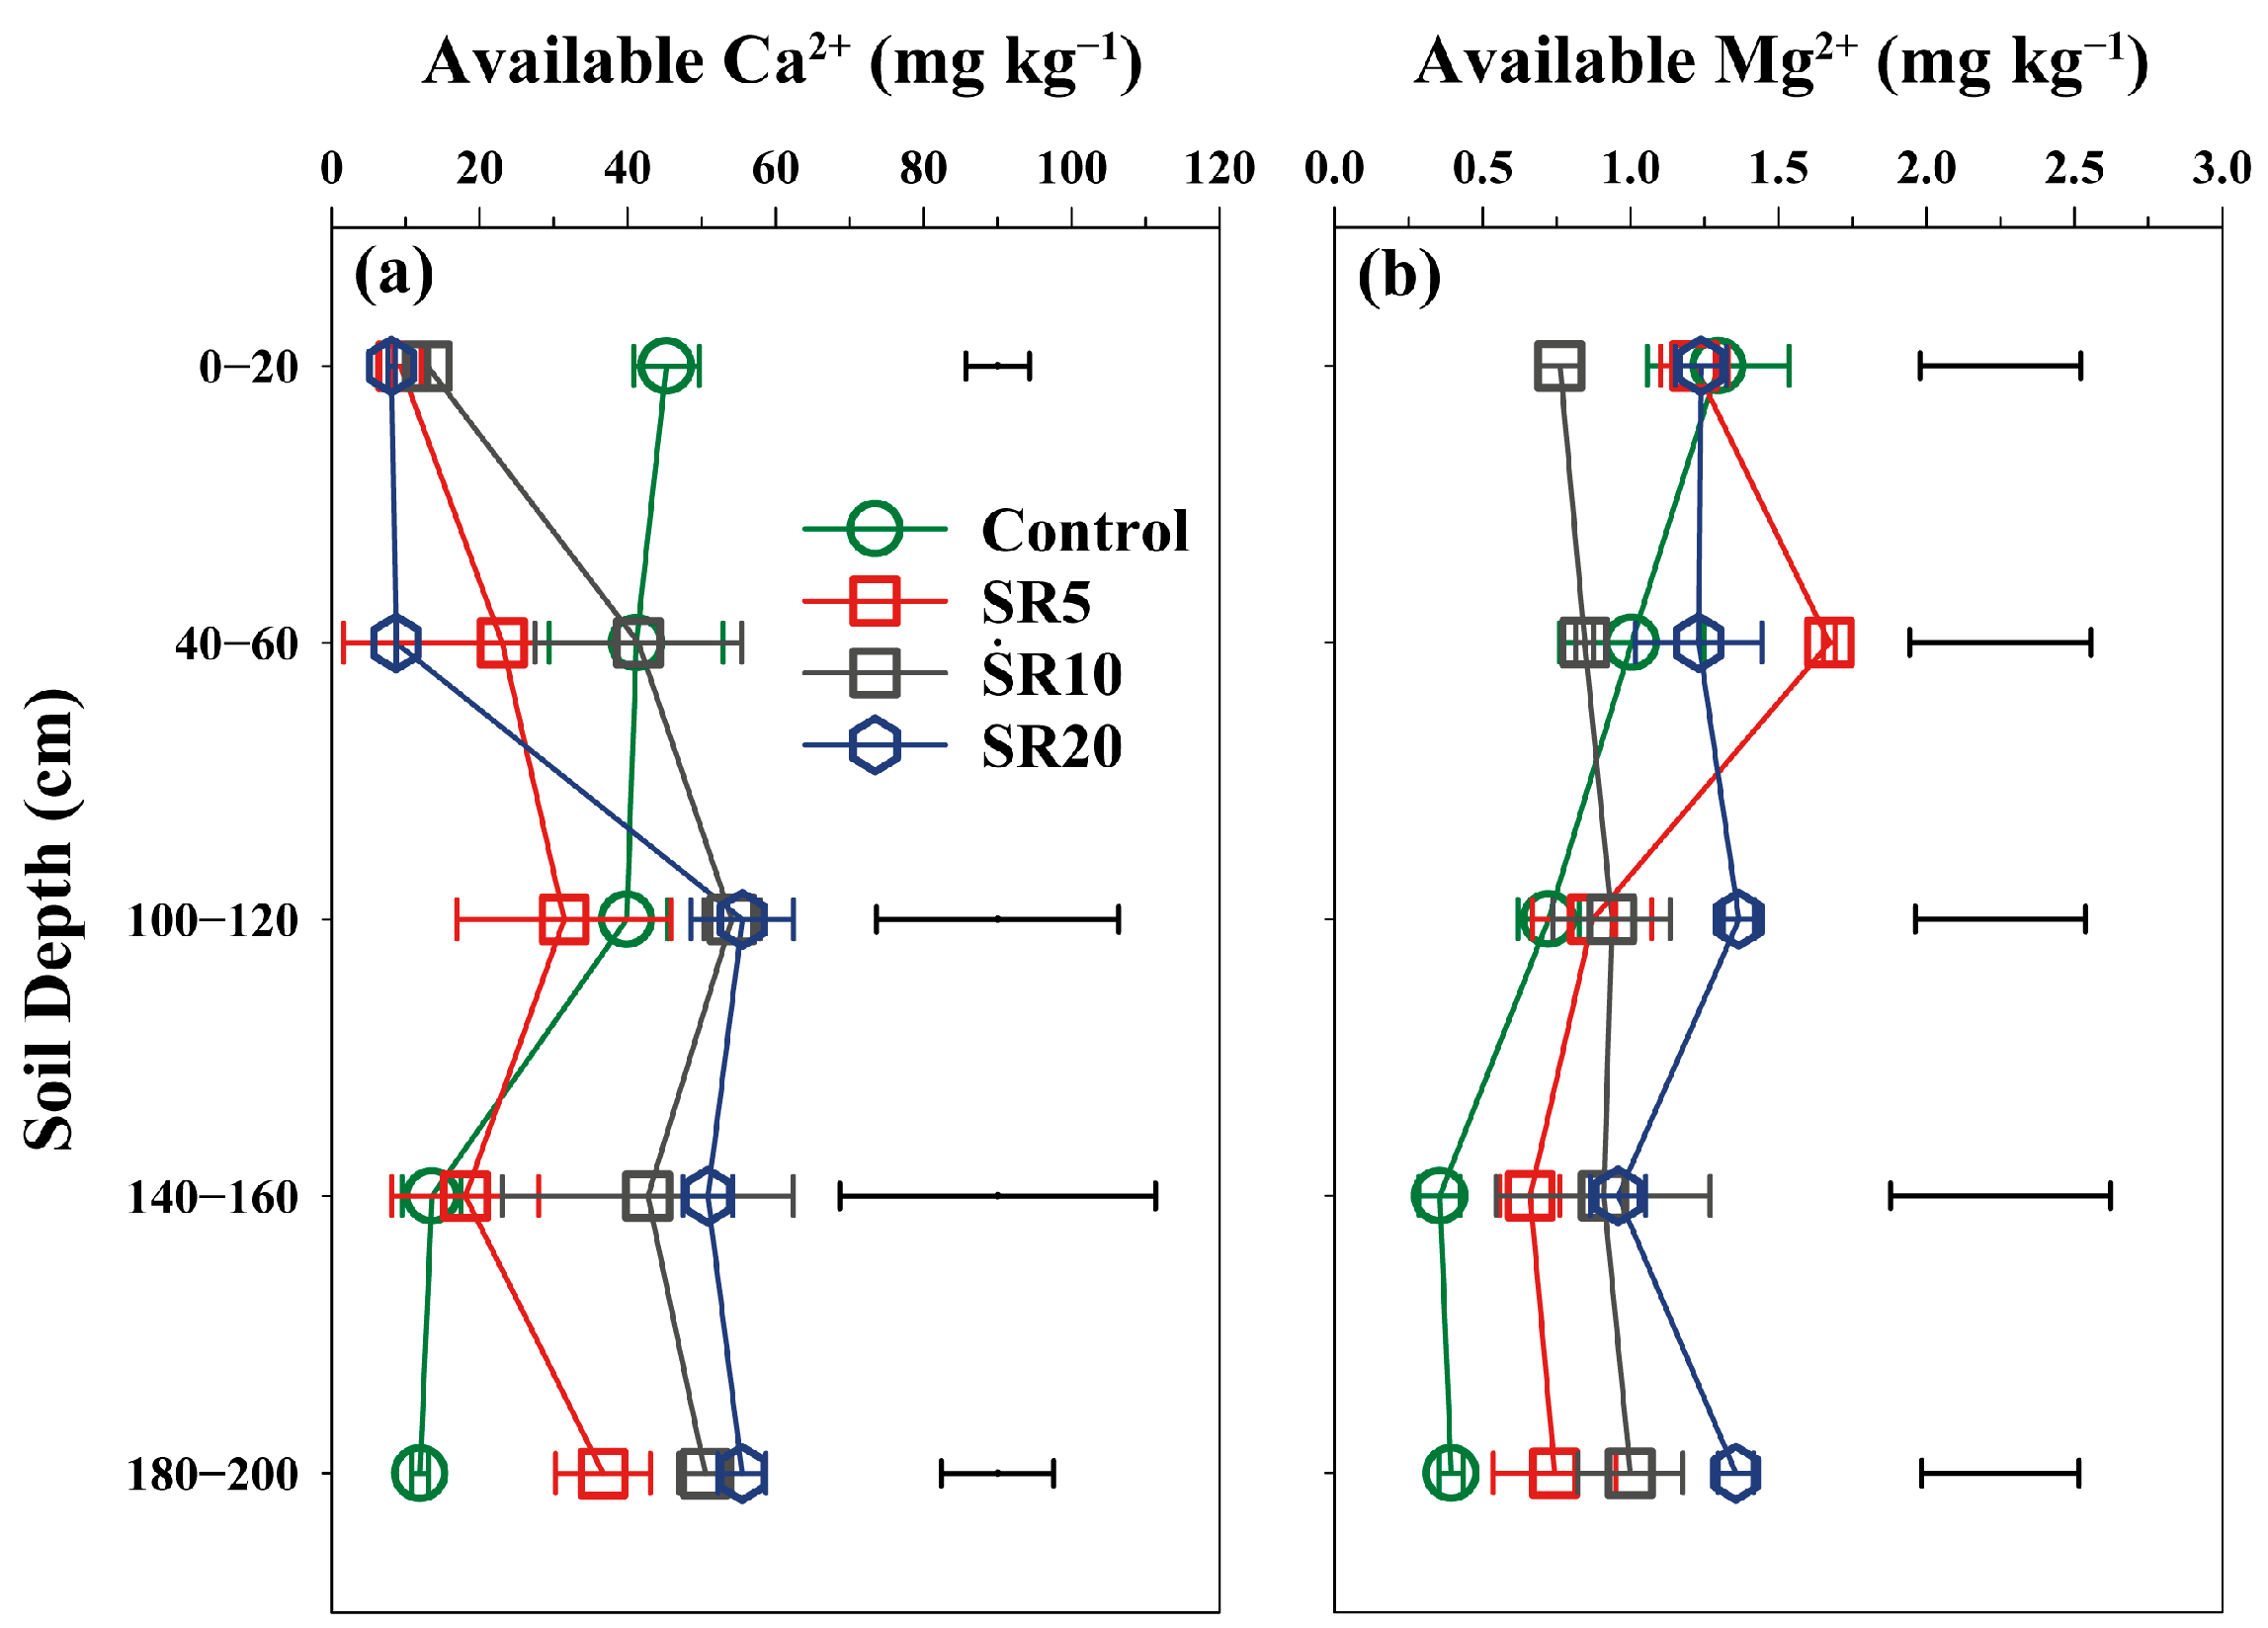
Straw return significantly altered SIC distribution across the 0–200 cm soil layers (Figure 1c), with contrasting responses between upper soil layers (0–60 cm) and deeper soil layers (60–200 cm). In the 0–60 cm soil layers, SIC decreased further under straw return versus the control treatment (Figure 1c). Previous studies have shown significant decreases in SIC contents in the extensive cropland soils in Northern China [49,50,51]. The carbonate loss from the upper soil layers might be due to the acidification of the farm land caused by nitrogen fertilization and straw return [52,53]. Conversely, the pH value did not decline significantly between the control and straw return treatments (Figure A1), excluding acidification as the primary cause. Prolonged straw return reduced EC and available Ca2+ (Figure 3 and Figure A2) and also impeded HCO3 (DIC) precipitation. Instead, the sharp decline in Ca2+/Mg2+ (Figure A2) and reduced evaporation due to plastic film mulch practices critically inhibited carbonate precipitation (Equation (2)). Although elevated sucrase and carbonic anhydrase activity promoted SOC to DIC conversion (Equation (1)), the scarcity of Ca2+/Mg2+ prevented DIC from being further converted to SIC. Consequently, DIC leached to deeper layers rather than forming SIC, explaining the enhanced topsoil SOC mineralization without SIC accrual.
C O 2 + H 2 O     H C O 3 + H +
C a 2 + + 2 H C O 3     C a C O 3 +   C O 2 +   H 2 O
Conversely, straw return significantly enhanced SIC accumulation below 60 cm (Figure 1c), which may indicate the conversion of organic carbon to carbonate [54]. Wang et al. [55] suggested that the increase in SIC reflects the increase in yield and soil available Ca2+/Mg2+, where the increased CO2 derives from SOC decomposition and mineralization. Furthermore, Ca2+ availability in deeper soil layers critically determines carbonate precipitation and SIC sequestration [56,57]. In this study, random forest analysis identified DOC, CO2, enzyme activity, EC, and Ca2+ content as significant drivers of SIC formation. Specifically, straw return elevated enzyme activity, promoting SOC conversion to DOC, CO2, and DIC. Consequently, the increased Ca2+ drove carbonate precipitation. Additionally, DIC leaching from upper layers may contribute to SIC accumulation in deep soil [57], though its role requires further quantification. This highlights deep soil’s role as a net carbon sink under straw return.

4.3. Effects of Microbial Properties on Carbon Sequestration in Topsoil and Deep Soil Layers

The stability and accumulation of soil organic matter are widely recognized to be governed by microbial properties, particularly growth efficiency [58]. In topsoil, significantly increased cumulative CO2 emissions (Figure 2) are indicative of enhanced microbial mineralization activity. Concurrently, straw return significantly modifies bacterial α-diversity (species richness) and β-diversity (community composition dissimilarity) (Figure 6), and also enhances enzyme activity (Figure 5). Changes in the cumulative relative abundance of srsOTUs within the co-occurrence networks (Figure 7) confirmed microbial succession, which drove SOC dynamics until saturation after 5–10 years [59]. Meanwhile, soil salinity, as indicated by electrical conductivity (EC), decreased with the increasing duration of straw return (Figure 3). This reduction in salinity may suggest that straw return alleviates salt stress, thereby promoting bacterial activity and contributing to a balance between organic matter mineralization and accumulation.
Although deep soil layers are typically considered biologically quiescent [12], emerging evidence suggests that the microbial activity in these layers plays a non-negligible role in biogeochemical cycling [11,13]. The lower nodes and edges of co-occurrence network analysis in deep soil compared to topsoil might suggest that bacteria in the 140–160 cm soil layer are more easily stimulated than those in the 0–20 cm soil layer (Figure 7) [60]. In this study, straw return had a limited effect on bacterial diversity and abundance in the 140–160 cm soil layer (Figure 6 and Figure 7), but it significantly enhanced enzyme activity, particularly carbonic anhydrase (Figure 5). This enzymatic enhancement facilitated the conversion of CO2 to HCO3. Subsequently, the presence of sufficient Ca2+ promoted carbonate precipitation, contributing to the observed SIC accumulation (Figure 1c).
Our random forest analysis further elucidated the key drivers (Figure 8). The PCA indicated that straw return years and soil depth substantially influenced SOC and SIC sequestration (Figure 8a). Specifically, SOC was linked to DOC, CO2, enzyme activity, and nutrients, while SIC was closely and positively related to EC, Ca2+, and Mg2+ (Figure 8b). Figure 8c shows that sucrase and urease activity, P, DOC, the Shannon and Chao1 indices, and Ca2+ content were the primary factors influencing SOC sequestration (p < 0.05). On the other hand, SIC was significantly altered by sucrase and urease activity, DOC, CO2, Ca content, and EC value (p < 0.05) (Figure 8d).
Taken together, our findings indicate that microbial shifts in both topsoil and deep soil layers mediate the transformation of straw-derived organic carbon into soil organic carbon (SOC) and soil inorganic carbon (SIC). Consequently, continued straw return is expected to promote further SOC and SIC accumulation throughout the 0–200 cm soil profile. These results highlight a substantial potential for long-term carbon sequestration in the deep soils of Xinjiang Province, China.

5. Conclusions

In summary, our study demonstrates the contrasting responses of soil carbon pools to increasing straw return years across the 0–200 cm soil profile. Topsoil (0–20 cm) reached SOC saturation after 5–10 years of continuous straw incorporation, accompanied by decreased SIC. Conversely, deep soil layers (100–120, 140–160, and 180–200 cm) exhibited progressive SIC accumulation over time, indicating continued carbon sequestration capacity throughout the soil profile (0–200 cm). Enhanced soil fertility promoted crop growth and carbon inputs, though stimulated microbial activity constrained topsoil carbon storage. Critically, the limited microbial response to straw addition at the 140–160 cm layer enabled persistent SOC accumulation in subsoil horizons. Solely assessing topsoil carbon, thus, significantly underestimates the sequestration potential of straw return in arid regions.
These findings establish that sustained straw return achieves dual benefits: boosting agricultural productivity and driving long-term carbon storage, particularly in deep soil layers. The depth-dependent carbon dynamics—topsoil saturation versus deep soil accumulation—necessitate comprehensive profile assessment in carbon accounting. Implementing continuous straw return constitutes an essential strategy for maximizing carbon sequestration in arid land agriculture. Future research should optimize management practices to fully realize this deep soil potential.

Author Contributions

Conceptualization, Y.Y., Y.W., K.L. and J.S.; methodology, Y.Y., D.J., Y.W. and X.W.; validation, Y.Y. and D.J.; formal analysis, Y.Y. and D.J.; investigation, Y.Y. and D.J.; resources, W.L.; writing—original draft preparation, Y.Y.; writing—review and editing, X.W., W.L., K.L. and J.S.; visualization, Y.Y.; supervision, J.S.; funding acquisition, J.S. All authors have read and agreed to the published version of the manuscript.

Funding

This work was supported by the National Natural Science Foundation of China (42377305) and the National Key Research and Development Program of China (2023YFD1700802).

Data Availability Statement

The data used and/or analyzed during the current study are available from the corresponding author on reasonable request.

Conflicts of Interest

The authors declare no conflicts of interest.

Appendix A

Appendix A.1. Soil Texture

Table A1. The soil particle size distribution at different soil depths.
Soil Depth cm2–0.05 mm0.05–0.002 mm<0.002 mmSoil Texture
g kg−1
0–2058.2 ± 0.3431.0 ± 7.4512.5 ± 42.1Silty clay
40–6016.3 ± 3.4489.4 ± 16.7496.4 ± 12.4Silty clay
100–120108.3 ± 4.0429.4 ± 56.1464.7 ± 16.0Silty clay
140–160491.5 ± 13.762.7 ± 0.8451.8 ± 73.6Sandy clay
180–200340.2 ± 0.5109.3 ± 48.9552.4 ± 69.6Clay

Appendix A.2. Calculation of Cumulative CO2 Emission

The cumulative CO2-C emission (Cmin., mg kg−1) from the mineralized SOC was calculated as follows:
C O 2   m i n .   =   V   ×   M   ×   V 0 22.4   ×   m   ×   273 273   +   T
where CO2 min. is the content of the cumulative emission of CO2 during the 35 days of incubation, mg kg−1; V is the CO2 concentration from the mineralized SOC at temperature T (°C); and M represents the relative molecular mass (44 g mol−1 for CO2). V0 and m represent the headspace volume of the anaerobic bottle and the dry soil (10.0 g) used in each bottle (125.0 mL), respectively.

Appendix A.3. Calculation of Chao1 and Shannon Indices

The Chao1 and Shannon indices were calculated as follows:
C h a o 1   =   S o b s   +   n 1 ( n 1     1 ) 2 ( n 2   +   1 )
S h a n n o n = P i ×   ( ln P i )
P i =   N i / N
where Sobs is the total observed species, n1 is the OTUs with singletons, n2 is the OTUs with doubletons, N is the total number of individuals of all species in the community, and Ni is the number of individuals of the i species in the community.

Appendix A.4. Soil pH Value and Available Ca and Mg
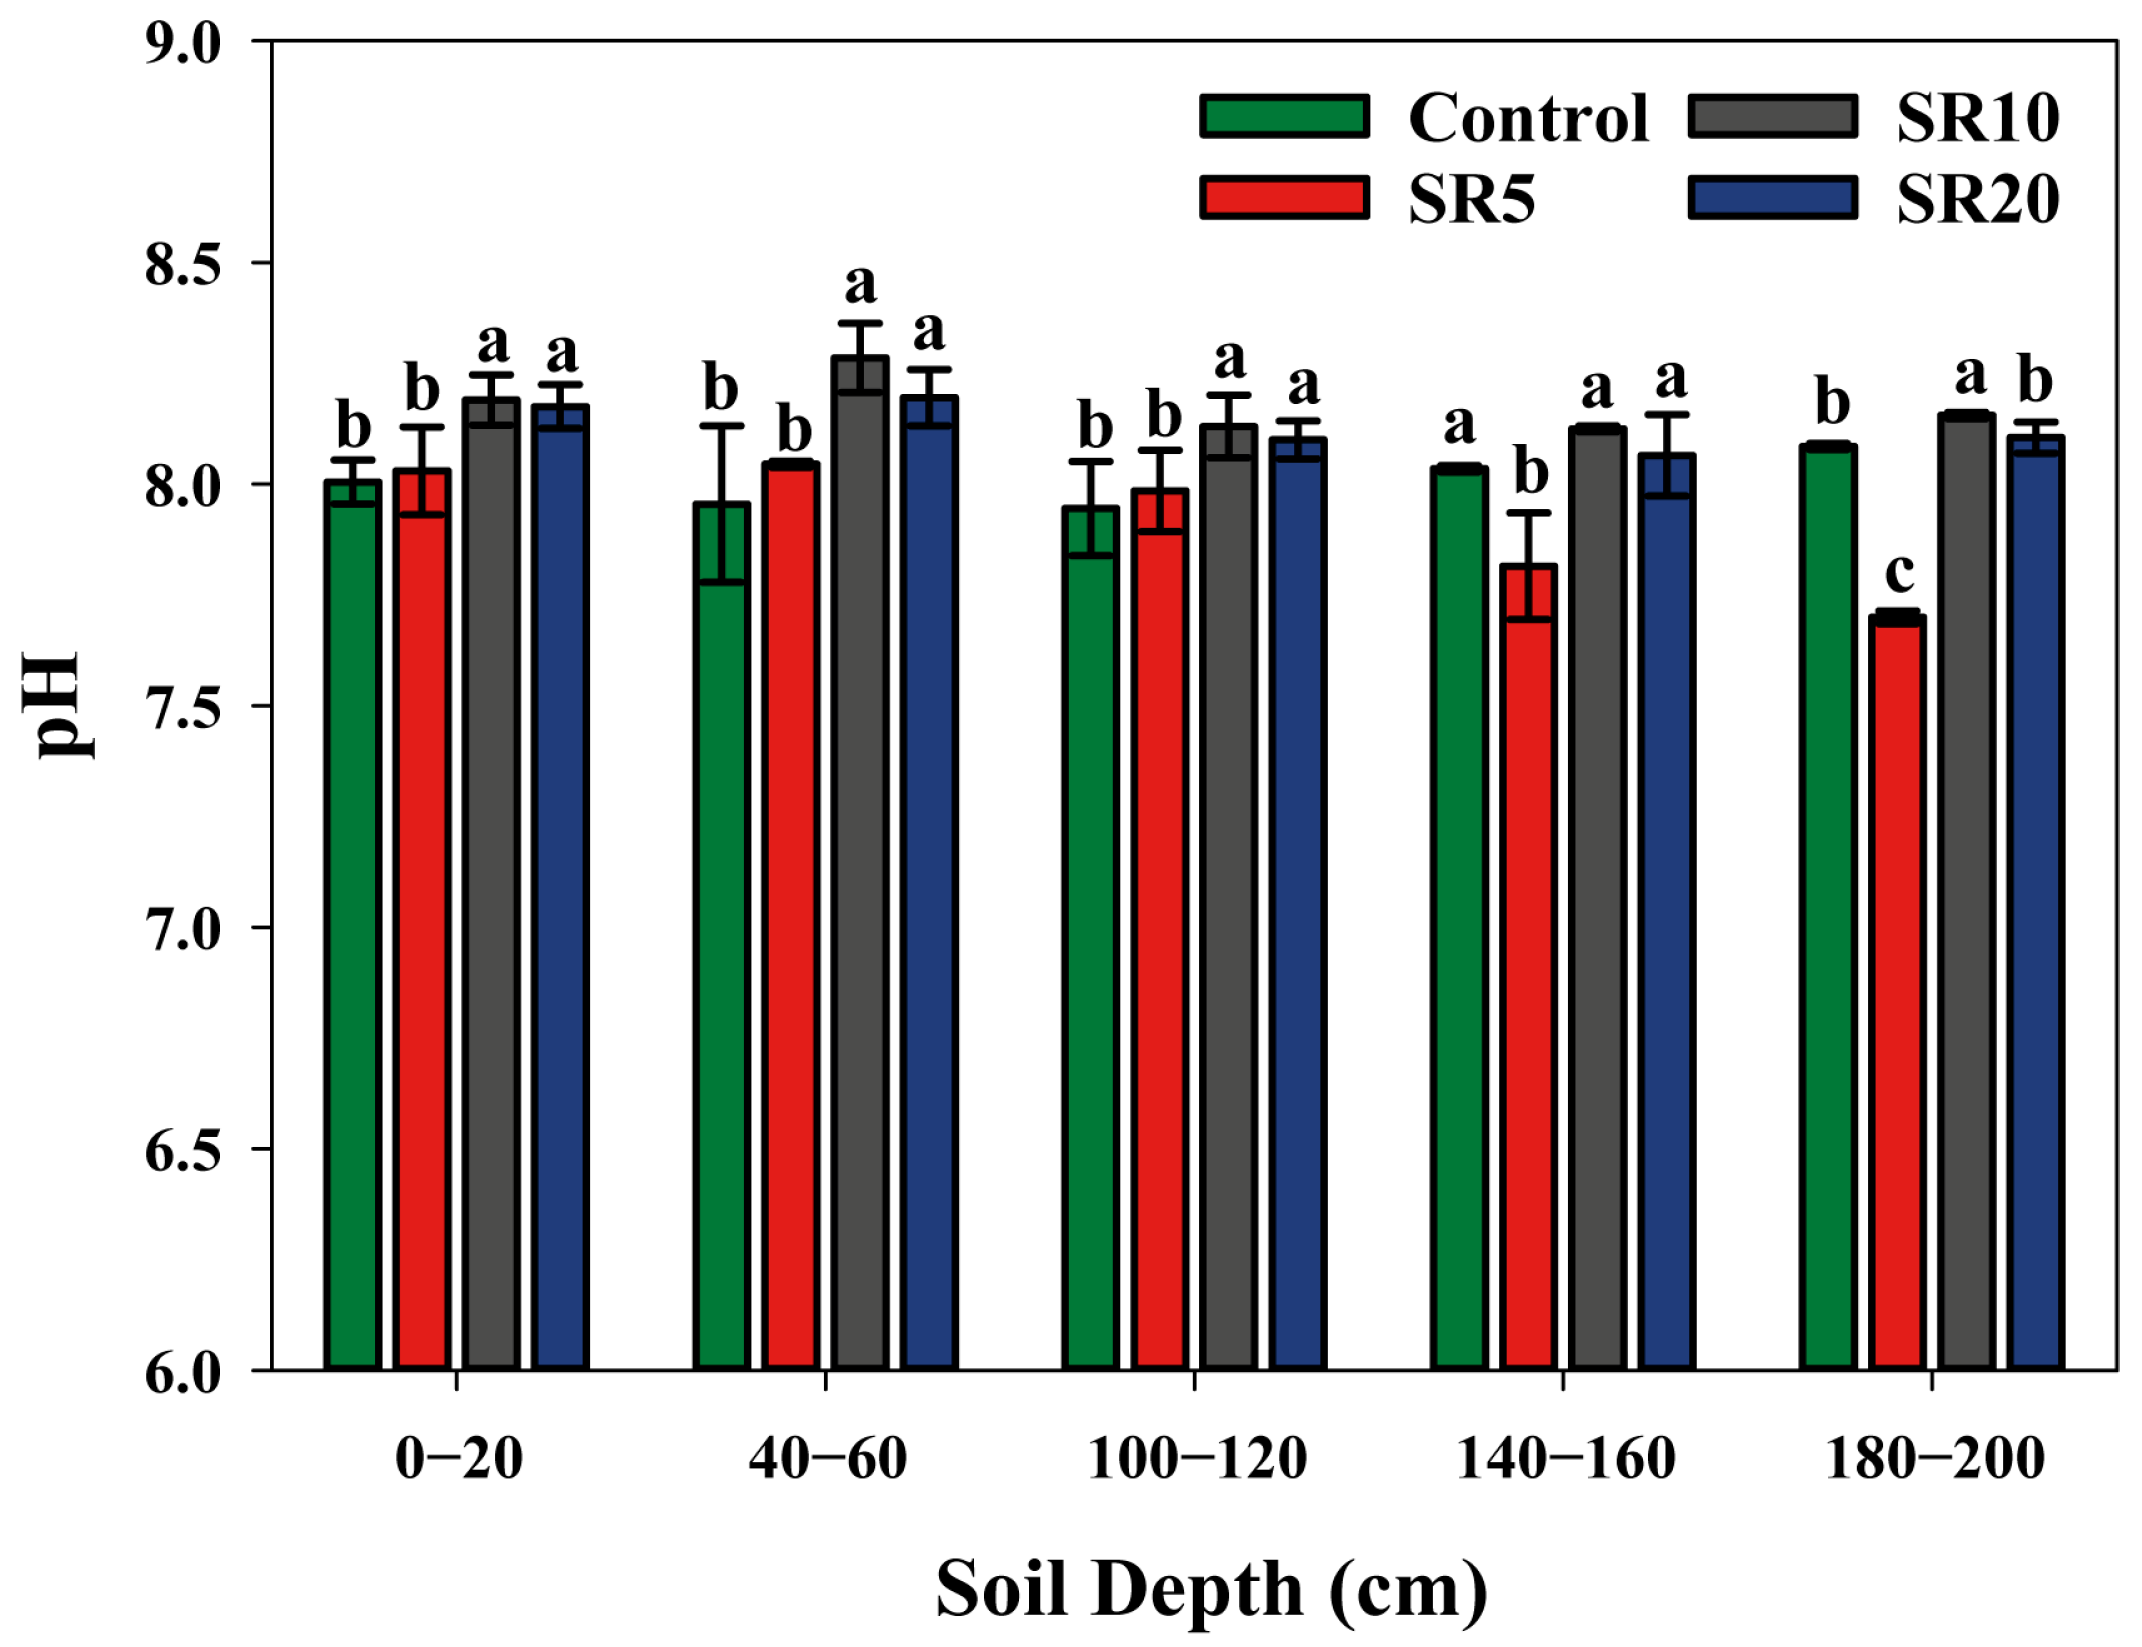
The pH of the control treatment in the 0–200 cm soil profile ranged from 7.95 to 8.09. Compared to the control treatment, straw return treatments had a relatively lesser effect on pH values. However, the SR5 treatment significantly reduced pH in the 140–200 cm soil layers, while the SR10 and SR20 treatments increased pH in the 0–120 cm soil layers (p < 0.05).
Figure A1. The soil pH of the control, SR5, SR10, and SR20 at different soil depths. Different letters represent a significant difference at p < 0.05 in the same soil layer.
Agronomy 15 01940 g0a1
Straw return differentially influenced soil available calcium (Ca2+) distribution across soil depths. In the 0–60 cm soil layers, Ca2+ decreased relative to the control, while it increased in the 60–200 cm soil layers. The SR5 treatment induced the least pronounced changes, reducing Ca2+ by 71.4% in the 0–20 cm soil layer while increasing it by 208.3% in the 180–200 cm soil layer (p < 0.05). In contrast, SR20 exerted the most significant effects, reducing Ca2+ by 82.1–78.9% in the 0–60 cm soil layers and increasing it by 39.2–366.3% in the 60–200 cm soil layers (p < 0.05). No significant differences were observed between the SR10 and SR20 treatments except in the 40–60 cm soil layer (p > 0.05). Additionally, soil available magnesium (Mg2+; 0.35–1.67 mg kg−1) was consistently lower than Ca2+ (8.07–55.49 mg kg−1) across all treatments. These results indicate that changes in Mg2+ likely contribute negligibly to the precipitation of bicarbonates compared to Ca2+. Moreover, the significant enhancement of these ions (Ca2+ and Mg2+) in deeper layers might result from the fact that the soil base ions leached by straw return would accumulate in deeper layers.
Figure A2. The contents of available Ca2+ (a) and Mg2+ (b) at different soil depths under varying durations of straw return. The bars beside the scatters are the LSD (0.05) for the four treatments at each depth.
Agronomy 15 01940 g0a2

References

  1. Batjes, N.H. Total carbon and nitrogen in the soils of the world. Eur. J. Soil Sci. 2014, 65, 10–21. [Google Scholar] [CrossRef]
  2. Shang, Q.; Yang, X.; Gao, C.; Wu, P.; Liu, J.; Xu, Y.; Shen, Q.; Zou, J.; Guo, S. Net annual global warming potential and greenhouse gas intensity in Chinese double rice-cropping systems: A 3-year field measurement in long-term fertilizer experiments. Glob. Change Biol. 2011, 17, 2196–2210. [Google Scholar] [CrossRef]
  3. Liu, C.; Lu, M.; Cui, J.; Li, B.; Fang, C. Effects of straw carbon input on carbon dynamics in agricultural soils: A meta-analysis. Glob. Change Biol. 2014, 20, 1366–1381. [Google Scholar] [CrossRef]
  4. Shi, S.; Zhang, W.; Zhang, P.; Yu, Y.; Ding, F. A synthesis of change in deep soil organic carbon stores with afforestation of agricultural soils. For. Ecol. Manag. 2013, 296, 53–63. [Google Scholar] [CrossRef]
  5. Weil, R.; Brady, N. The Nature and Properties of Soils, 15th ed.; Pearson Press: London, UK, 2017. [Google Scholar]
  6. Yu, H.; Zha, T.; Zhang, X.; Ma, L. Vertical distribution and influencing factors of soil organic carbon in the Loess Plateau, China. Sci. Total Environ. 2019, 693, 133632. [Google Scholar] [CrossRef]
  7. Zamanian, K.; Pustovoytov, K.; Kuzyakov, Y. Pedogenic carbonates: Forms and formation processes. Earth-Sci. Rev. 2016, 157, 1–17. [Google Scholar] [CrossRef]
  8. Emmerich, W.E. Carbon dioxide fluxes in a semiarid environment with high carbonate soils. Agric. For. Meteorol. 2003, 116, 91–102. [Google Scholar] [CrossRef]
  9. Saderne, V.; Cusack, M.; Almahasheer, H.; Serrano, O.; Masqué, P.; Arias-Ortiz, A.; Krishnakumar, P.K.; Rabaoui, L.; Qurban, M.A.; Duarte, C.M. Accumulation of Carbonates Contributes to Coastal Vegetated Ecosystems Keeping Pace with Sea Level Rise in an Arid Region (Arabian Peninsula). J. Geophys. Res. Biogeosci. 2018, 123, 1498–1510. [Google Scholar] [CrossRef]
  10. Wang, Y.; Joseph, S.; Wang, X.; Weng, Z.H.; Mitchell, D.R.G.; Nancarrow, M.; Taherymoosavi, S.; Munroe, P.; Li, G.; Lin, Q.; et al. Inorganic Carbon Accrual in Subsoil through Biochar Application on Calcareous Topsoil. Environ. Sci. Technol. 2023, 57, 1837–1847. [Google Scholar] [CrossRef]
  11. Liebmann, P.; Mikutta, R.; Kalbitz, K.; Wordell-Dietrich, P.; Leinemann, T.; Preusser, S.; Mewes, O.; Perrin, E.; Bachmann, J.; Don, A.; et al. Biogeochemical limitations of carbon stabilization in forest subsoils. J. Plant Nutr. Soil Sci. 2022, 185, 35–43. [Google Scholar] [CrossRef]
  12. Button, E.S.; Pett-Ridge, J.; Murphy, D.V.; Kuzyakov, Y.; Chadwick, D.R.; Jones, D.L. Deep-C storage: Biological, chemical and physical strategies to enhance carbon stocks in agricultural subsoils. Soil Biol. Biochem. 2022, 170, 108697. [Google Scholar] [CrossRef]
  13. Fontaine, S.; Barot, S.; Barré, P.; Bdioui, N.; Mary, B.; Rumpel, C. Stability of organic carbon in deep soil layers controlled by fresh carbon supply. Nature 2007, 450, 277–280. [Google Scholar] [CrossRef]
  14. Henneron, L.; Balesdent, J.; Alvarez, G.; Barré, P.; Baudin, F.; Basile-Doelsch, I.; Cécillon, L.; Fernandez-Martinez, A.; Hatté, C.; Fontaine, S. Bioenergetic control of soil carbon dynamics across depth. Nat. Commun. 2022, 13, 7676. [Google Scholar] [CrossRef]
  15. Qin, S.; Yuan, H.; Hu, C.; Li, X.; Wang, Y.; Zhang, Y.; Dong, W.; Clough, T.; Luo, J.; Zhou, S.; et al. Anthropogenic N input increases global warming potential by awakening the “sleeping” ancient C in deep critical zones. Sci. Adv. 2023, 9, eadd0041. [Google Scholar] [CrossRef]
  16. Lu, F.; Wang, X.; Han, B.; Ouyang, Z.; Duan, X.; Zheng, H.; Miao, H. Soil carbon sequestrations by nitrogen fertilizer application, straw return and no-tillage in China's cropland. Glob. Change Biol. 2009, 15, 281–305. [Google Scholar] [CrossRef]
  17. Bailey, K.L.; Lazarovits, G. Suppressing soil-borne diseases with residue management and organic amendments. Soil Tillage Res. 2003, 72, 169–180. [Google Scholar] [CrossRef]
  18. Gupta Choudhury, S.; Srivastava, S.; Singh, R.; Chaudhari, S.K.; Sharma, D.K.; Singh, S.K.; Sarkar, D. Tillage and residue management effects on soil aggregation, organic carbon dynamics and yield attribute in rice–wheat cropping system under reclaimed sodic soil. Soil Tillage Res. 2014, 136, 76–83. [Google Scholar] [CrossRef]
  19. Kou, X.; Ma, N.; Zhang, X.; Xie, H.; Zhang, X.; Wu, Z.; Liang, W.; Li, Q.; Ferris, H. Frequency of stover mulching but not amount regulates the decomposition pathways of soil micro-foodwebs in a no-tillage system. Soil Biol. Biochem. 2020, 144, 107789. [Google Scholar] [CrossRef]
  20. Dhaliwal, S.S.; Naresh, R.K.; Gupta, R.K.; Panwar, A.S.; Mahajan, N.C.; Singh, R.; Mandal, A. Effect of tillage and straw return on carbon footprints, soil organic carbon fractions and soil microbial community in different textured soils under rice–wheat rotation: A review. Rev. Environ. Sci. Bio/Technol. 2020, 19, 103–115. [Google Scholar] [CrossRef]
  21. Li, J.; Li, H.; Zhang, Q.; Shao, H.; Gao, C.; Zhang, X. Effects of fertilization and straw return methods on the soil carbon pool and CO2 emission in a reclaimed mine spoil in Shanxi Province, China. Soil Tillage Res. 2019, 195, 104361. [Google Scholar] [CrossRef]
  22. Li, S.; Chen, J.; Shi, J.; Tian, X.; Li, X.; Li, Y.; Zhao, H. Impact of Straw Return on Soil Carbon Indices, Enzyme Activity, and Grain Production. Soil Sci. Soc. Am. J. 2017, 81, 1475–1485. [Google Scholar] [CrossRef]
  23. Huggins, D.R.; Buyanovsky, G.A.; Wagner, G.H.; Brown, J.R.; Darmody, R.G.; Peck, T.R.; Lesoing, G.W.; Vanotti, M.B.; Bundy, L.G. Soil organic C in the tallgrass prairie-derived region of the corn belt: Effects of long-term crop management. Soil Tillage Res. 1998, 47, 219–234. [Google Scholar] [CrossRef]
  24. Reicosky, D.; Evans, S.D.; Cambardella, C.A.; Allmaras, R.R.; Wilts, A.; Huggins, D.R. Continuous corn with moldboard tillage: Residue and fertility effects on soil carbon. J. Soil Water Conserv. 2002, 57, 277–284. [Google Scholar] [CrossRef]
  25. Stewart, C.E.; Paustian, K.; Conant, R.T.; Plante, A.F.; Six, J. Soil carbon saturation: Evaluation and corroboration by long-term incubations. Soil Biol. Biochem. 2008, 40, 1741–1750. [Google Scholar] [CrossRef]
  26. Mao, L.; Guo, W.; Yuan, Y.; Qin, D.; Wang, S.; Nie, J.; Zhao, N.; Song, X.; Sun, X. Cotton stubble effects on yield and nutrient assimilation in coastal saline soil. Field Crops Res. 2019, 239, 71–81. [Google Scholar] [CrossRef]
  27. Feng, J.; Zhao, L.; Zhang, Y.; Sun, L.; Yu, X.; Yu, Y. Can climate change influence agricultural GTFP in arid and semi-arid regions of Northwest China? J. Arid. Land 2020, 12, 837–853. [Google Scholar] [CrossRef]
  28. Veroustraete, F.; Li, Q.; Verstraeten, W.; Chen, X.; Bao, A.; Dong, Q.; Liu, T.; Willems, P. Soil moisture content retrieval based on apparent thermal inertia for Xinjiang province in China. Int. J. Remote Sens. 2012, 33, 3870–3885. [Google Scholar] [CrossRef]
  29. National Bureau of Statistics of China. China Statistical Yearbook 2023; China Statistics Press: Beijing, China, 2023. [Google Scholar]
  30. Liu, J.; Jing, F.; Jiang, G.; Liu, J. Effects of Straw Incorporation on Soil Organic Carbon Density and the Carbon Pool Management Index under Long-Term Continuous Cotton. Commun. Soil Sci. Plant Anal. 2017, 48, 412–422. [Google Scholar] [CrossRef]
  31. Guo, H.; Shen, C.; Dai, Y.; Li, F.; Jin, X.; Shen, L.; Deng, Y. Current Situation and Development Countermeasure of Cotton Straw Utilization in Xinjiang. Agric. Eng. 2023, 13, 48–53. [Google Scholar] [CrossRef]
  32. Gee, G.W.; Or, D. 2.4 Particle-Size Analysis. In Methods of Soil Analysis; Soil Science Society of America: Madison, WI, USA, 2002; pp. 255–293. [Google Scholar]
  33. Mehlich, A. Mehlich 3 soil test extractant: A modification of Mehlich 2 extractant. Commun. Soil Sci. Plant Anal. 2008, 15, 1409–1416. [Google Scholar] [CrossRef]
  34. Dong, X.; Guan, T.; Li, G.; Lin, Q.; Zhao, X. Long-term effects of biochar amount on the content and composition of organic matter in soil aggregates under field conditions. J. Soils Sediments 2016, 16, 1481–1497. [Google Scholar] [CrossRef]
  35. Canfora, L.; Bacci, G.; Pinzari, F.; Lo Papa, G.; Dazzi, C.; Benedetti, A. Salinity and Bacterial Diversity: To What Extent Does the Concentration of Salt Affect the Bacterial Community in a Saline Soil? PLoS ONE 2014, 9, e106662. [Google Scholar] [CrossRef]
  36. Zhang, K.; Shi, Y.; Cui, X.; Yue, P.; Li, K.; Liu, X.; Tripathi Binu, M.; Chu, H. Salinity Is a Key Determinant for Soil Microbial Communities in a Desert Ecosystem. mSystems 2019, 4, e0025-18. [Google Scholar] [CrossRef] [PubMed]
  37. Hartman, K.; Van Der Heijden, M.G.A.; Wittwer, R.A.; Banerjee, S.; Walser, J.-C.; Schlaeppi, K. Cropping practices manipulate abundance patterns of root and soil microbiome members paving the way to smart farming. Microbiome 2018, 6, 14. [Google Scholar] [CrossRef] [PubMed]
  38. Ben-Hur, M.; Assouline, S. Tillage Effects on Water and Salt Distribution in a Vertisol during Effluent Irrigation and Rainfall. Agron. J. 2002, 94, 1295–1304. [Google Scholar] [CrossRef]
  39. Huang, Z.B.; Assouline, S.; Zilberman, J.; Ben-Hur, M. Tillage and Saline Irrigation Effects on Water and Salt Distribution in a Sloping Field. Soil Sci. Soc. Am. J. 2000, 64, 2096–2102. [Google Scholar] [CrossRef]
  40. Minhas, P.S.; Ramos, T.B.; Ben-Gal, A.; Pereira, L.S. Coping with salinity in irrigated agriculture: Crop evapotranspiration and water management issues. Agric. Water Manag. 2020, 227, 105832. [Google Scholar] [CrossRef]
  41. Wu, Y.; Du, T.; Ding, R.; Yuan, Y.; Li, S.; Tong, L. An isotope method to quantify soil evaporation and evaluate water vapor movement under plastic film mulch. Agric. Water Manag. 2017, 184, 59–66. [Google Scholar] [CrossRef]
  42. Xie, M.; Zhang, T.; Liu, S.; Liu, Z.; Wang, Z. Profile soil organic and inorganic carbon sequestration in maize cropland after long-term straw return. Front. Environ. Sci. 2023, 11, 1095401. [Google Scholar] [CrossRef]
  43. Akala, V.A.; Lal, R. Potential of mine land reclamation for soil organic carbon sequestration in Ohio. Land Degrad. Dev. 2000, 11, 289–297. [Google Scholar] [CrossRef]
  44. Leinemann, T.; Mikutta, R.; Kalbitz, K.; Schaarschmidt, F.; Guggenberger, G. Small scale variability of vertical water and dissolved organic matter fluxes in sandy Cambisol subsoils as revealed by segmented suction plates. Biogeochemistry 2016, 131, 1–15. [Google Scholar] [CrossRef]
  45. Lajtha, K.; Townsend, K.L.; Kramer, M.G.; Swanston, C.; Bowden, R.D.; Nadelhoffer, K. Changes to particulate versus mineral-associated soil carbon after 50 years of litter manipulation in forest and prairie experimental ecosystems. Biogeochemistry 2014, 119, 341–360. [Google Scholar] [CrossRef]
  46. Mikutta, R.; Turner, S.; Schippers, A.; Gentsch, N.; Meyer-Stüve, S.; Condron, L.M.; Peltzer, D.A.; Richardson, S.J.; Eger, A.; Hempel, G.; et al. Microbial and abiotic controls on mineral-associated organic matter in soil profiles along an ecosystem gradient. Sci. Rep. 2019, 9, 10294. [Google Scholar] [CrossRef] [PubMed]
  47. Chen, Z.; Wang, H.; Liu, X.; Zhao, X.; Lu, D.; Zhou, J.; Li, C. Changes in soil microbial community and organic carbon fractions under short-term straw return in a rice–wheat cropping system. Soil Tillage Res. 2017, 165, 121–127. [Google Scholar] [CrossRef]
  48. Guggenberger, G.; Kaiser, K. Dissolved organic matter in soil: Challenging the paradigm of sorptive preservation. Geoderma 2003, 113, 293–310. [Google Scholar] [CrossRef]
  49. Wu, H.; Guo, Z.; Gao, Q.; Peng, C. Distribution of soil inorganic carbon storage and its changes due to agricultural land use activity in China. Agric. Ecosyst. Environ. 2009, 129, 413–421. [Google Scholar] [CrossRef]
  50. Wang, X.; Wang, J.; Xu, M.; Zhang, W.; Fan, T.; Zhang, J. Carbon accumulation in arid croplands of northwest China: Pedogenic carbonate exceeding organic carbon. Sci. Rep. 2015, 5, 11439. [Google Scholar] [CrossRef]
  51. Bughio, M.A.; Wang, P.; Meng, F.; Qing, C.; Kuzyakov, Y.; Wang, X.; Junejo, S.A. Neoformation of pedogenic carbonates by irrigation and fertilization and their contribution to carbon sequestration in soil. Geoderma 2016, 262, 12–19. [Google Scholar] [CrossRef]
  52. Zamanian, K.; Zarebanadkouki, M.; Kuzyakov, Y. Nitrogen fertilization raises CO2 efflux from inorganic carbon: A global assessment. Glob. Change Biol. 2018, 24, 2810–2817. [Google Scholar] [CrossRef]
  53. Deng, F.; Wang, H.; Xie, H.; Bao, X.; He, H.; Zhang, X.; Liang, C. Low-disturbance farming regenerates healthy deep soil toward sustainable agriculture—Evidence from long-term no-tillage with stover mulching in Mollisols. Sci. Total Environ. 2022, 825, 153929. [Google Scholar] [CrossRef]
  54. Manning, D. Biological enhancement of soil carbonate precipitation: Passive removal of atmospheric CO2. Mineral. Mag.-Min. MAG 2008, 72, 639–649. [Google Scholar] [CrossRef]
  55. Wang, X.J.; Xu, M.G.; Wang, J.P.; Zhang, W.J.; Yang, X.Y.; Huang, S.M.; Liu, H. Fertilization enhancing carbon sequestration as carbonate in arid cropland: Assessments of long-term experiments in northern China. Plant Soil 2014, 380, 89–100. [Google Scholar] [CrossRef]
  56. Schlesinger, W.H. An evaluation of abiotic carbon sinks in deserts. Glob. Change Biol. 2017, 23, 25–27. [Google Scholar] [CrossRef] [PubMed]
  57. Kim, J.H.; Jobbágy, E.G.; Richter, D.D.; Trumbore, S.E.; Jackson, R.B. Agricultural acceleration of soil carbonate weathering. Glob. Change Biol. 2020, 26, 5988–6002. [Google Scholar] [CrossRef] [PubMed]
  58. Whalen, E.D.; Grandy, A.S.; Sokol, N.W.; Keiluweit, M.; Ernakovich, J.; Smith, R.G.; Frey, S.D. Clarifying the evidence for microbial- and plant-derived soil organic matter, and the path toward a more quantitative understanding. Glob. Change Biol. 2022, 28, 7167–7185. [Google Scholar] [CrossRef]
  59. Banerjee, S.; Kirkby, C.A.; Schmutter, D.; Bissett, A.; Kirkegaard, J.A.; Richardson, A.E. Network analysis reveals functional redundancy and keystone taxa amongst bacterial and fungal communities during organic matter decomposition in an arable soil. Soil Biol. Biochem. 2016, 97, 188–198. [Google Scholar] [CrossRef]
  60. De Vries, F.T.; Griffiths, R.I.; Bailey, M.; Craig, H.; Girlanda, M.; Gweon, H.S.; Hallin, S.; Kaisermann, A.; Keith, A.M.; Kretzschmar, M.; et al. Soil bacterial networks are less stable under drought than fungal networks. Nat. Commun. 2018, 9, 3033. [Google Scholar] [CrossRef]
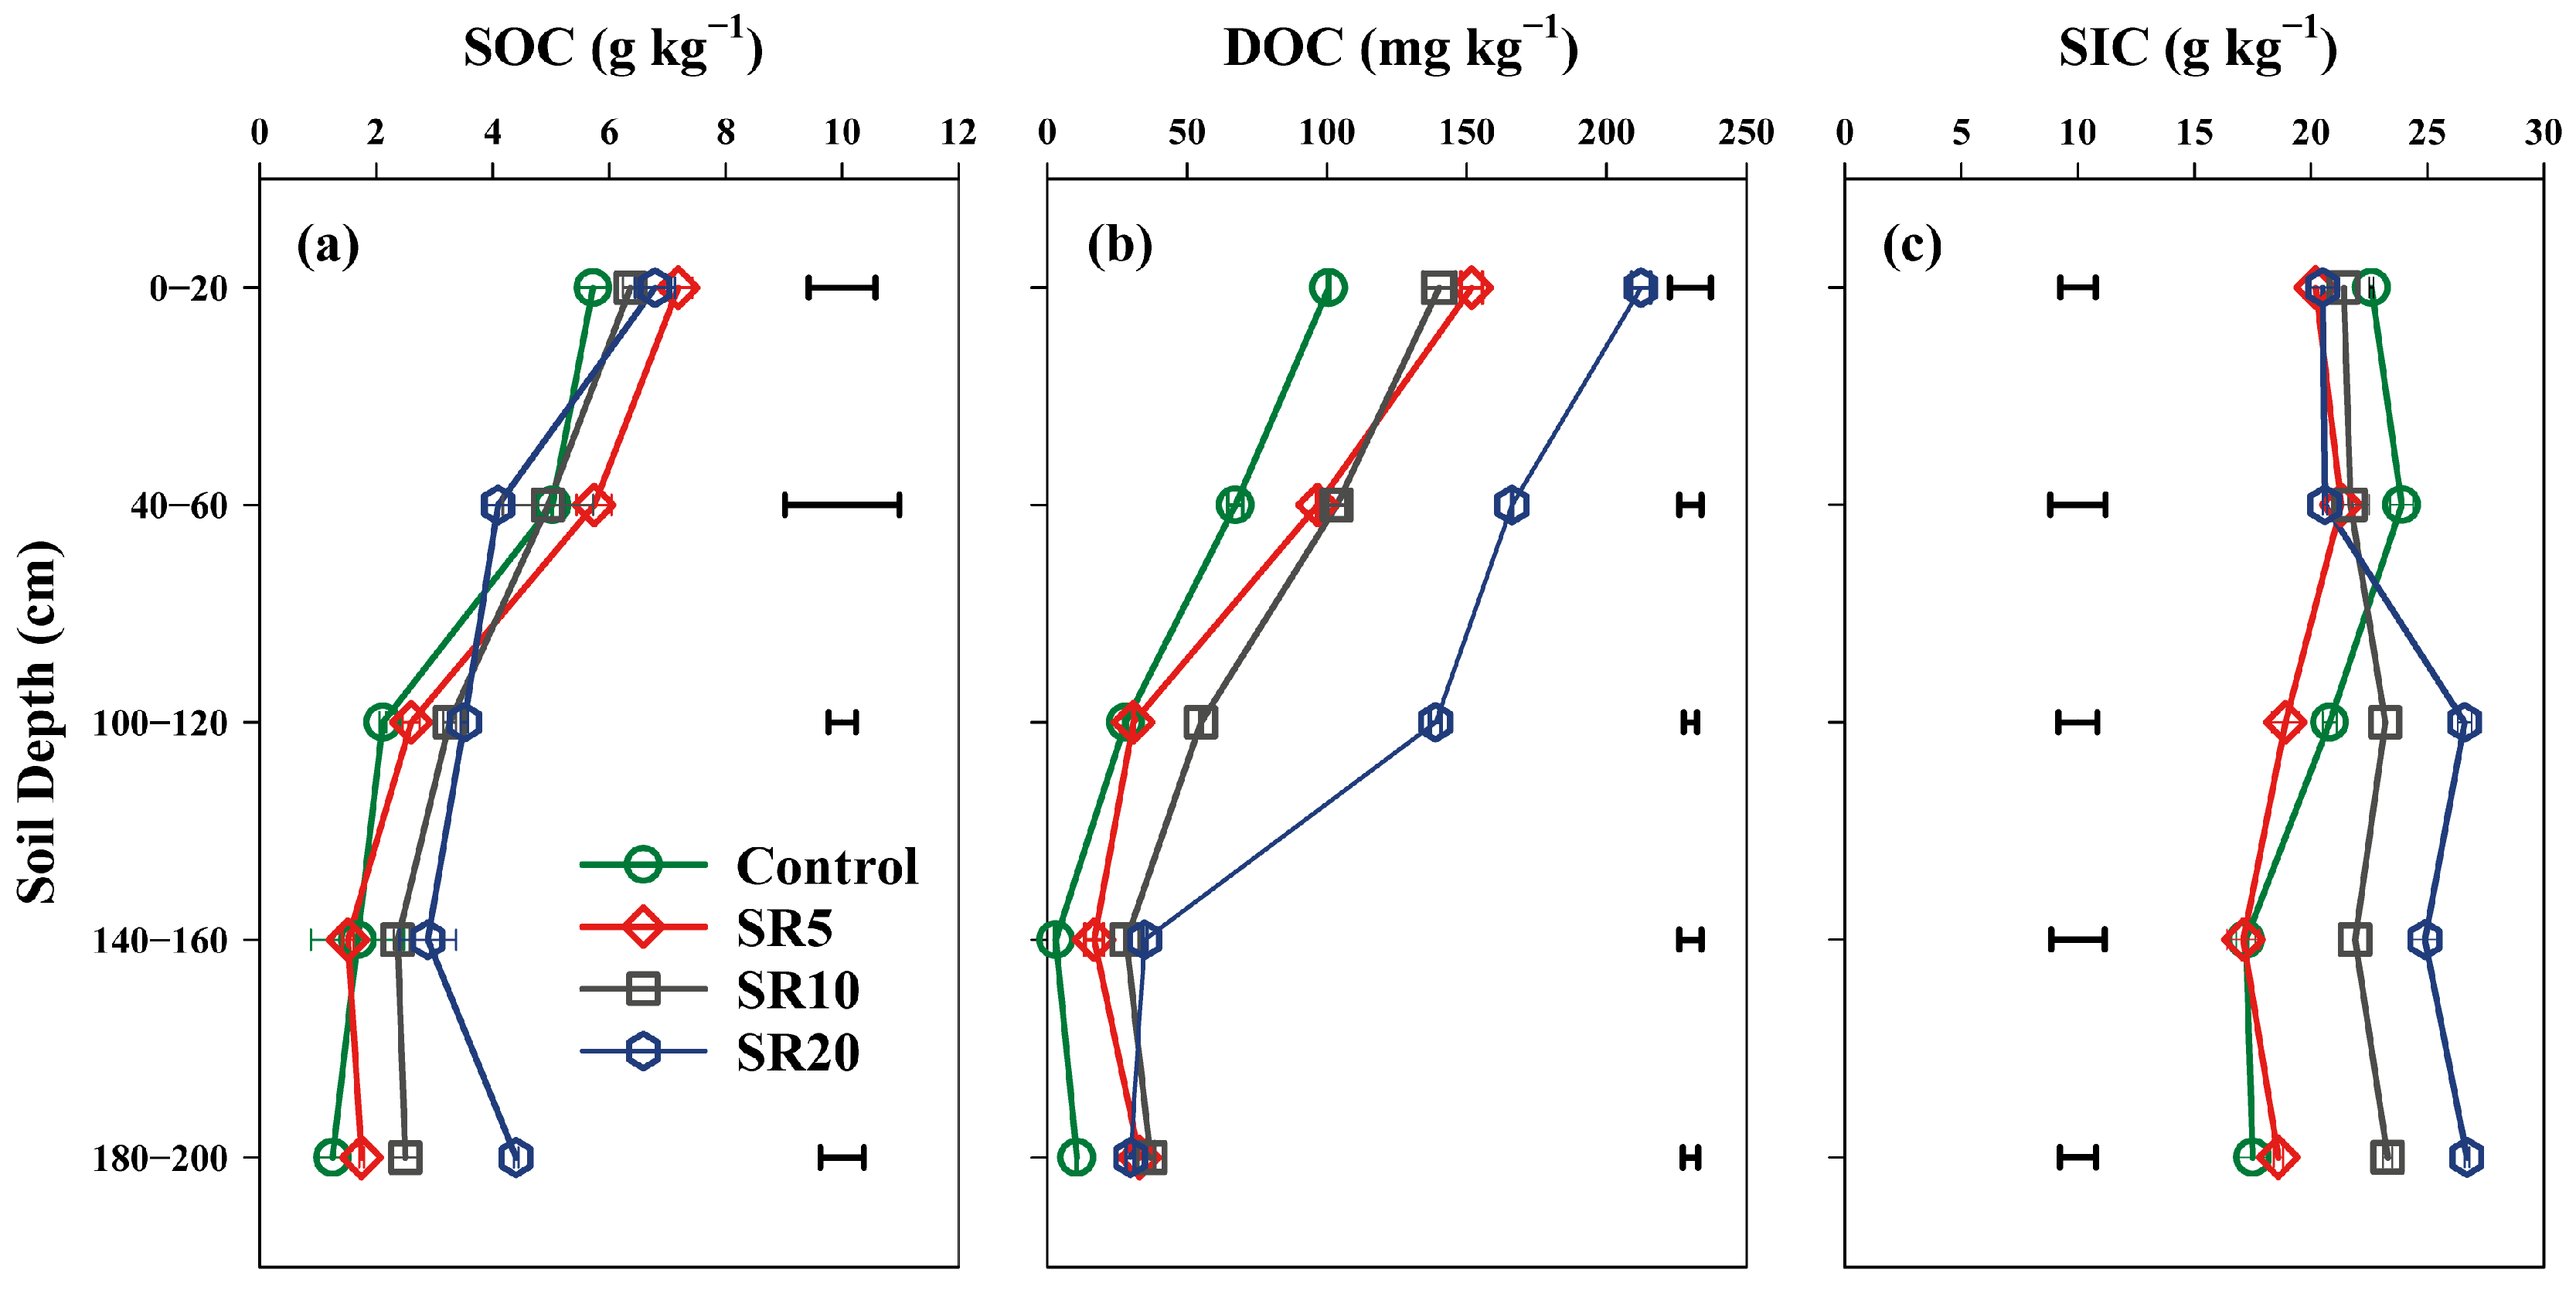
Figure 1. Soil organic carbon (SOC) (a), dissolved organic carbon (DOC) (b), and soil inorganic carbon (SIC) (c) across soil depths under different straw return years. Control, SR5, SR10, and SR20 represent uncultivated land and straw return treatments over 5, 10, and 20 years, respectively. Bars beside scatters indicate least significant difference (LSD) at 0.05 significance level for four treatments at each depth.
Agronomy 15 01940 g001
Figure 2. Cumulative CO2 emission at 0−20 cm (a), 40−60 cm (b), 100−120 cm (c), 140−160 cm (d), and 180−200 cm (e) under straw return treatments. Control, SR5, SR10, and SR20 represent uncultivated land and straw return treatments over 5, 10, and 20 years, respectively.
Agronomy 15 01940 g002
Figure 3. Soil electrical conductivity (EC) at different soil depths under straw return treatments. Control, SR5, SR10, and SR20 represent uncultivated land and straw return treatments over 5, 10, and 20 years, respectively. Bars beside scatters indicate least significant difference (LSD) at 0.05 significance level for four treatments at each depth.
Agronomy 15 01940 g003
Figure 4. Dissolved inorganic nitrogen (DIN) (a), available phosphorus (AP) (b), and available potassium (AK) (c) across soil depths under straw return treatments. Control, SR5, SR10, and SR20 represent uncultivated land and straw return treatments over 5, 10, and 20 years, respectively. Bars beside scatters are LSD (0.05) for four treatments at each depth.
Agronomy 15 01940 g004
Figure 5. Sucrase (a), carbonic anhydrase (b), and urease (c) activity levels in selected soil layers under straw return treatment. Control, SR5, and SR20 represent uncultivated land and straw return treatments over 5 and 20 years, respectively. Different letters represent significant difference (p < 0.05) for three treatments in topsoil (0–20 cm) and deep soil (140–160 cm).
Agronomy 15 01940 g005
Figure 6. Chao1 index (a), Shannon index (b), principal coordinates analysis (PCoA) (c), and phylum level bacteria composition (d) under straw return treatments at 0–20 cm (topsoil) and 140–160 cm (deep soil). Control, SR5, and SR20 represent uncultivated land and straw return treatments over 5 and 20 years, respectively. Different letters indicate significant difference at p < 0.05 within same soil layer.
Agronomy 15 01940 g006
Figure 7. Bacterial co-occurrence networks at 0–20 cm (topsoil) (a) and 140–160 cm (deep soil) (b). Cumulative abundance of straw return-sensitive OTU (srsOTU) modules at 0–20 cm (c) and 140–160 cm (d) with significant difference (p < 0.01). M#1~M#9 represent different network modules, with colored areas indicating significantly altered OTU modules across treatments. Control, SR5, and SR20 represent uncultivated land and straw return treatments over 5 and 20 years, respectively.
Agronomy 15 01940 g007
Figure 8. Principal component analyses (PCA) of soil properties versus SOC (a) and SIC (b) concentrations. Random forest analyses of variable importance (%IncMSE) for SOC (c) and SIC (d). Control, SR5, SR10, and SR20 represent uncultivated land and straw return treatments over 5, 10, and 20 years, respectively. CA: carbonic anhydrase. AP: available phosphorus. AK: available potassium. “*”, p < 0.05; “**”, p < 0.01.
Agronomy 15 01940 g008
Disclaimer/Publisher’s Note: The statements, opinions and data contained in all publications are solely those of the individual author(s) and contributor(s) and not of MDPI and/or the editor(s). MDPI and/or the editor(s) disclaim responsibility for any injury to people or property resulting from any ideas, methods, instructions or products referred to in the content.