Article

Improving Groundcover Establishment Through Seed Rate, Seed Ratio, and Hydrophilic Seed Coating

1
Department of Agronomy, Iowa State University, Ames, IA 50011, USA
2
Seed Science Center, Iowa State University, Ames, IA 50011, USA
3
Department of Horticulture, Iowa State University, Ames, IA 50011, USA
*
Author to whom correspondence should be addressed.
Agronomy 2025, 15(8), 1927; https://doi.org/10.3390/agronomy15081927
Submission received: 13 July 2025 / Revised: 6 August 2025 / Accepted: 8 August 2025 / Published: 10 August 2025
(This article belongs to the Section Innovative Cropping Systems)

Abstract

Kentucky bluegrass (KBG) is well-suited as a perennial groundcover in corn production due to its vigorous growth during the fall and spring and its natural dormancy during the summer, aligning with the corn growing season. However, seeds of KBG germinate slowly, potentially resulting in poor stand establishment in the Midwest, USA. This study was conducted to assess the effect of the seeding rate, the seed ratio in a perennial ryegrass/KBG mixture (PRG:KBG), and seed treatment on KBG percentage groundcover, green rating, the red/far-red ratio, soil temperature, soil moisture, and summer biomass. The split-plot design consisted of KBG seeds treated with the HydrolocTM hydrophilic polymer and untreated seeds with seeding rates and ratios in a randomized design. Hydroloc™ seed treatment showed a significant difference in the fall percentage of groundcover but did not affect the spring groundcover. The seed ratio had a significant effect on the fall and spring groundcover, with a ratio of 1:1 (PRG:KBG) performing best, followed by 1:3, 1:5, and 0:1. The seeding rate was also significant, with 44.8 kg ha−1 having the highest groundcover, followed by 22.4 kg ha−1 and 11.2 kg ha−1. The red/far-red readings, which reflect plant density, gave corresponding results to the percentage of groundcover. The Hydroloc™ hydrophilic polymer increases the groundcover percentage by improving KBG establishment. These results are important for farmers and seed companies interested in using KBG as a perennial groundcover in corn production systems. We recommend a seed ratio of 1:1 (PRG:KBG) and a seeding rate of 22.4 kg ha−1 to provide a dense and rapid-establishing groundcover that is also financially viable for the farmer.

1. Introduction

Modern agricultural systems face the dual challenge of increasing crop yields for a growing population while reversing decades of soil degradation and ecosystem strain. In the Midwest of the United States, the transition from a diverse perennial landscape to a limited number of high-yielding annual cash crops has resulted in high soil erosion, nutrient enrichment of waterways, and declining ecosystem health [1]. Sustaining agriculture into the future requires protecting the finite soil and water resources remaining. Cropping practices that minimize soil disturbance and cover the soil year-round can reduce soil erosion and nutrient runoff [2]. Various efforts have been made to reduce soil erosion by growing winter annual cover crops between cash crop harvest and the next season’s planting. However, adoption of this system remains limited among farmers due to temporal overlap with cash crop field activities and increased costs of production [3]. A perennial groundcover (PGC) is an ideal solution to combat these issues by growing perennial grasses alongside cash crops such as corn or soybeans [4]. A PGC is sown once in the fall and provides year-round soil cover, eliminating the need for farmers to resow cover crops annually [5]. PGC-corn systems have been previously shown to improve water infiltration, increase carbon sequestration, and reduce soil erosion [6,7,8].
Kentucky bluegrass (KBG) (Poa pratensis L.) is an ideal species to use as a PGC due to its adaptability to many climates, low growth habit, and rapid rhizome development [9]. Moreover, cool-season grasses like KBG have active growth periods when the annual cash crop is not growing [10]. KBG is a commonly used species for turfgrass growers, providing a readily available seed market for PGC growers. The requirements of turfgrass differ from those of a PGC; however, there are similarities, such as persistence, shade tolerance, and seed vigor. Although KBG possesses favorable traits to use as a PGC, initial observations of the system indicate that limited soil moisture in the fall, combined with KBG’s slow germination rate, creates challenges for successful establishment [11,12]. Insufficient surface soil moisture where the KBG seed is placed can result in seed entering a quiescent state where the embryo is inactive but can resume growth when favorable conditions return [13]. Prolonged periods of high heat or drought can also trigger facultative dormancy in the KBG seed and remain in this state until favorable conditions break seed dormancy and promote seed germination [14]. If germination does occur but the soil surface subsequently dries out, the seedlings may senesce due to a lack of moisture to sustain growth.
To address the issue of slow germination in KBG, many turfgrass studies have utilized seed mixtures, seed-applied coatings, and increased seeding rates. Turf managers often use perennial ryegrass (PRG), known for its rapid establishment as a nurse crop for KBG, to enhance early groundcover and suppress weed competition. Research conducted in the U.S. Midwest has demonstrated that sowing a mixture of KBG and PRG leads to faster establishment, increased groundcover, and higher biomass production compared to monocultures of either species [15,16]. However, PRG exhibits lower heat tolerance and greater susceptibility to disease under Midwest conditions. As a result, its proportion in the stand tends to decline over time, creating an opportunity for KBG to dominate the sward progressively [17,18]. Given that KBG is the target species for a PGC system, a KBG–PRG mixture may serve as an ideal approach for its successful establishment.
Optimizing the seeding rate is crucial to achieving adequate groundcover while preventing excessive competition with the cash crop that could negatively impact yield. Seeding at excessively high rates not only hinders cash crop yield but also results in weaker grass seedlings and increased seed costs for the farmer [19]. Seed coatings apply a layer of exogenous material that helps protect seeds from drought, desiccation, and nutrient deficiencies. Research in turfgrass systems has shown that hydrophilic polymers and nutrient-based coatings can enhance germination in small-seeded grasses such as KBG, with more pronounced effects under limited moisture conditions [20,21]. Investigating the effects of hydrophilic polymers and lime seed coatings on KBG field establishment may contribute to developing a more reliable PGC system.
Previous research into the KBG-PRG seeding rate and ratios focused on turfgrass settings with optimal environmental conditions and intensive management that are not feasible in a PGC system. Prior research also indicated that hydrophilic coatings enhance KBG establishment in the growth chamber [22], but little is known about their effectiveness in the field. Identifying management practices to improve the establishment of a PGC would allow farmers to increase ecosystem services in their cash crop, effectively suppress weeds, and capture carbon in the soil [5,23]. Moreover, improving establishment removes the need for reseeding and increases profits for the farmer [3]. Improving management guidelines for farmers could lower barriers to adoption, enabling the scalable implementation of the PGC across diverse cropping systems and ultimately increasing vegetative cover on global cropland.
The objectives of this study are to determine the optimal seeding rate, the most effective seed ratio in the grass mixture, and the impact of hydrophilic seed coatings on grass seedling emergence and establishment in both fall and spring after sowing the different PGCs. Another objective of this study is to analyze the species composition of the different PGCs one year after grass establishment in the field.

2. Methods

2.1. Experimental Site

The research was conducted at the Iowa State University Agronomy and Agricultural Engineering Sorenson Research Farm in Boone, Iowa (42°0’36” N 93°44’32” W), and repeated for two years, the 2023/2024 growing season (year 1) and the 2024/2025 (year 2) season of the experiment. Soil survey data of this site characterize soils as Webster clay loam (fine-loamy, mixed, superactive, mesic Typic Endoaquolls) and bemis moraine, with a slope of 0–2%. Both soils have similar properties with high organic matter content but poor drainage. The experiment was sowed on well-drained fields, which are described as a great farmland area [24].

2.2. Field Plot Design

The field was arranged in a randomized complete block design consisting of 4 blocks with a split-plot treatment. The whole plots consisted of sowing either treated or untreated KBG seeds, and subplots were twelve combinations of different ratios of PRG:KBG seeds and different seeding rates. The seeding rates were 11.2, 22.4, and 44.8 kg ha−1, and the seed ratios were 1:1, 0:1, 1:3, and 1:5 (PRG:KBG) (Table 1). Plot sizes were 1.2 m × 1.2 m, and the alleys had 0.6 m separating plots. The total experiment size was 14.4 m × 14.4 m.

2.3. Seed Germination Testing

A purity test and a germination test were carried out for the KBG and PRG seeds according to AOSA Rules for Testing Seeds before planting [25]. Complete protocols used can be found in the Supplemental Materials Section. The PRG seed variety was ‘Top Gun II’. The KBG seed was from the variety ‘Mercury’ with or without hydrophilic seed treatment. The KBG variety ‘Mercury’ has a dwarf growth habit, strong disease and drought tolerance, and good shade tolerance. The PRG variety ‘Top Gun II’ has a high tiller density and is well adapted to many climates.

2.4. Field Plot Management

The year 1 experiment area was sown after soybeans. The soybeans were mowed with a Land Pride (Salina, KS, USA) RCR2512 rotary cutter on 18 August 2023. The adjacent year 2 experiment area was fallow for one year before sowing the experiment. The year 1 experiment was planted on 21 September 2023, while the year 2 experiment was planted on 17 September 2024. The hydrophilic seed treatment Pinnacle Hydroloc™ QS plus from Summit Seeds (Caldwell, ID, USA) was applied to KBG seeds before planting at a 1:1 seed-to-hydrophilic seed treatment ratio. A complete description of the plot management strategy is included in the Supplemental Materials Section. The seeds were weighed out, and each seed mixture was carefully placed in an envelope for sowing. The sowing rates were decided based on previous studies and the experiment’s goals, and rates were calculated based on AOSA germination and pure live seed tests [25]. Soon after the tillage was completed, the plots were staked, and the seeds were sown by the broadcast method on the 1.2 m × 1.2 m plots. In both years, the plots received adequate rainfall the day after sowing the seeds.
A baseline soil test was taken before tillage for P, K, buffer pH, and organic matter (OM). The pH of the top 10 cm of soil was measured to ensure that soil acidity from the N fertilizer was not inhibiting the germination of grass seeds. An external lab (AgSource, Ellsworth, IA, USA) carried out the 15 cm soil core tests, while the pH test of the top 10 cm was carried out on campus (see the method in the Supplemental Materials Section). The pH of the top 10 cm of the soil was 7.05 (five samples averaged). The 15 cm soil cores taken gave the following results: a pH of 7.1, a phosphate level of 42 ppm, a potassium level 182 ppm, an OM percentage of 2.9%, a calcium content of 85%, and a magnesium content of 12%. All these results are adequate for plant growth. Plots from both years received nitrogen (N)–phosphorous (P)–potassium (K) at a rate of 26.3–67.2–89.6 kg ha−1. The fertilizer applied was muriate of potash and diammonium phosphate, which were both broadcast applied with a Befco spinner spreader (Rocky Mount, NC, USA). No further fertilizer was applied before or after sowing the grass seeds. There were no herbicides or pesticides applied after seeding.
In the spring, the plot received N-P-K at a rate of 43.7–112–123.3 kg ha−1. The fertilizers applied were muriate of potash and diammonium phosphate by the broadcast method. The plot was mowed to 8 cm in height using a lawnmower in March to regenerate stem and leaf growth. In April, the plots were sprayed for weed control with 2,4-D for broadleaf weed control at a rate of 2.3 L ha−1 and Callisto® at a rate of 219.2 mL ha−1.

2.5. Soil pH Test

The protocol for the pH test was measured using an established protocol [26]. A comprehensive description of this protocol can be found in the Supplemental Materials Section. The soil sample was air-dried, ground, and mixed with 20 mL of the CaCl2 reagent. After sedimentation of the soil, the supernatant CaCl2 solution was transferred to another test tube without re-suspending the soil. The electrode was submerged in the supernatant by swirling gently until the pH reading stabilizes; then pH was recorded.

2.6. Data Collection

The first seedling frequency count was recorded in early October. A seedling emergence frequency count was recorded inside a 1 m × 1 m quadrant subdivided into 100 equal-surface squares [27]. Each square was assessed, and any square with at least a single leaf blade of grass was counted as one. This process was repeated for each plot to obtain the overall cover frequency for each plot. Frequency counts were taken biweekly until the grass showed signs of dormancy. For 2023, the first fall frost was observed on 10 October, and the final frequency count was recorded on 29 November. For 2024, the first fall frost was observed on 16 October, and the final frequency count was recorded on 11 November.
The following year in the spring, grass cover and growth were recorded from the initiation of grass regrowth in mid-March until the grass went dormant in summer. The last frost of 2024 was observed on 22 April. In the spring, a visual rating [28] of the strength of the stand/greenness rating was recorded using a scale from one to ten, with ten representing a healthy, very dark green grass plot with no signs of leaf tissue death and one representing a light green grass plot with signs of necrotic spots on the leaf or chlorosis. The grass cover percentage was evaluated biweekly, visually estimating the cover percentage over the entire plot. A plot with a score of 100% was entirely covered with grass and had no soil showing, while a 0% score was assigned to a plot covered with weeds and/or bare soil but no PGC grass cover. Soil moisture and temperature measurements were recorded biweekly in spring 2024 using a field scout TDR 350 soil probe from Spectrum Technologies (Aurora, IL). Soil probe readings were recorded when the soil was not saturated so that surface water would not bias the results. Reflectance above the PGC was recorded biweekly in the spring following establishment using a LI-180 spectrometer from LI-COR Environmental (Lincoln, NE, USA). The red:far-red light ratio was recorded for each individual plot. The red:far-red light ratio indicates grass density; the denser the canopy, the less red wavelength light is reflected from the leaf, resulting in a lower ratio. Reflectance measurements could only be performed on a clear day with adequate sunlight. Biomass yield was measured when grass plots had reached full maturity, produced seeds, and showed visual signs of yellowing and a lighter green appearance on the leaf as the grass became dormant. The biomass was harvested within a 30.5 cm × 30.5 cm steel square frame placed within each plot. The grass growing within the square was cut at a height of 5 cm using hand clippers. Each sample was placed in perforated brown paper bags to ensure good airflow during drying. The bags were placed in a cart and dried for 48 h at 70 °C. The dry samples were removed from bags and weighed to record their dry weight.

2.7. Weather Conditions

The monthly mean temperature (°C) and mean rainfall (mm) for the duration of year 1 and year 2 experiments are shown in Table 2 and Table 3, respectively. The 30-year average is included to provide historic data for the same location.

2.8. Species Analysis

The year one plots were hand-harvested one year after establishing. Before harvesting, plots were mowed and irrigated twice in the fall to rejuvenate growth. Each plot received 2.5 cm of irrigation and 28 kg of N ha−1 in the form of urea. At harvesting, grass was cut at a height of 5 cm using hand clippers within a 30.5 cm × 30.5 cm steel frame. Two samples were taken randomly per plot. Pure KBG and pure PRG samples were collected, together with the unknown “mixed-grass” samples, for developing a near-infrared spectroscopy (NIRS) calibration. This ensured that the calibration and unknown grass samples were all at similar maturity. The dried samples were then ground to 2 mm with a Thomas Wiley mill (Swedesboro, NJ, USA) and mixed homogeneously, and then a subsample was ground to 1 mm with a Udy cyclone sample mill (Fort Collins, CO, USA). Ground samples were placed in small glass jars.
The calibration set was created by blending the two pure PRG and KBG samples to a known ratio by weight, from 0% to 100% with 5% intervals [28]. The species composition in each plot was analyzed using a near-infrared spectrometer, Phoenix 5000 NIR Forage Analyzer, Blue Sun Scientific (Jessup, Baltimore, MD, USA). The samples were run twice to capture variability due to sampling. The spectrum collected was 600–2500 nm, and it was captured at 2 nm intervals.
The spectral data were analyzed using R statistical software version 4.4.0 [29]. The spectral data was preprocessed by ensuring that the KBG response variable was numeric (0–100, at 5 percentage unit intervals). The Boruta feature selection method [30] was used to retain the most significant spectral data and discard any noise to improve the model’s performance. The Boruta feature selection method confirmed 33 features of importance and discarded 917 spectra. The Boruta algorithm is a wrapper selection method. These 33 features were used to train and test the random forest (RF) model [31]. In our case, we selected the RF as its processing avoids overfitting and our calibration sample set is relatively small (40 samples) compared to our explanatory variables. The RF avoids overfitting by utilizing multiple decision trees to separately analyze different subsets of the training data [32]. Utilizing cross-validation, the calibration dataset was split into 70% training and 30% testing to train the RF. The RF model was trained using 500 trees to optimize the prediction. The model’s predictive accuracy was tested using the root mean squared (RMSE), the mean absolute error (MAE), and R-squared (R2). After training and testing the model, the RF model was used to predict the KBG percentage from the unknown samples.

2.9. Statistical Analysis

All data were analyzed using the SAS software version 9.4 [33]. Data from year one and year two of the experiment are combined for the statistical analysis, along with the figures and tables presented in the results. All variables in the model were considered fixed except for blocks and years, and their interactions with fixed effects were considered random. Blocks were nested in years. The ANOVA for the fall grid cover data was calculated using the MIXED procedure to calculate the effect of the seeding rate, seed ratio, and seed coating on fall establishment. The least-square means (LSMEANS) function was used to compare the coated seed vs. uncoated seed, seeding rate, and seed ratio means. The LSMEANS function was performed with pairwise differences (PDIFF) to estimate the percentage difference in coverage between the various treatments. An alpha level of 0.05 was used to determine the significance of seeding rates, seed ratios, and seed coatings. The grass dry weight measurements were analyzed separately using the SAS MIXED procedure. The same tests were conducted on these data to find the most effective treatments.
The spring data for percent visual cover, greenness, and red:far-red reflectance measurements were separately analyzed using the SAS GLM procedure. All variables in the model were considered fixed except for blocks, years, and their interaction with fixed effects. Blocks were nested within years. The ANOVA was used to investigate the effect of the seeding rate, ratio, and coating on the measurements taken, which were percentages of visual cover, greenness, and red:far-red reflectance. The least-square means (LSMEANS) function was used to analyze the effect of the rate, ratio, and coating on the measurements taken. LSMEANS was performed with pairwise differences (PDIFF) to investigate their interactions. The least significant difference (LSD) function was used to investigate the differences in rates and ratios under an alpha level of 0.05.
The results of the unknown species composition samples via NIRS were analyzed using the SAS software [33]. The species composition 1 year after sowing was compared to the KBG percentage at sowing, the seeding rate, and the seed coating. The ANOVA for species composition was calculated using the MIXED procedure to determine the effect of the seeding rate, seed ratio, and seed coating on the species composition 1 year after sowing. The LSMEANS function was used to compare the seed coating, seeding rates, and seed ratios. Blocks and their interaction with coating were random variables, while all other variables were considered fixed. An alpha level of 0.05 was used to determine significance.

3. Results

3.1. Environmental Conditions

Temperatures for the fall months were similar in both years. Rainfall for the fall establishment months varied considerably, with the fall of 2024 having more abundant rainfall than the fall of 2023. The seed rate, seed ratio, and seed coating treatments were not significantly different regardless of soil moisture or soil temperature in spring and summer 2024 (p > 0.05). Similarly, in 2025, the seed ratio and seed coating treatments were not different due to soil moisture or temperature. The average soil moisture and temperature over every plot for each day measured in the spring and summer of 2024 and 2025 can be seen in Figure 1A for 2024 and Figure 1B for 2025.

3.2. Seed Germination Testing

The result of the seed purity test was 99.45% pure KBG seed and 0.55% inert matter. The result for the PRG purity test was 99.19% pure seed and 0.81% inert seed. The germination test was carried out using pure seed. The seed germination percentage was 94% for PRG and 81.66% for KBG. These seed purity and germination percentages were used to determine seeding rates for the field experiment.

3.3. Fall Grid Cover Frequency

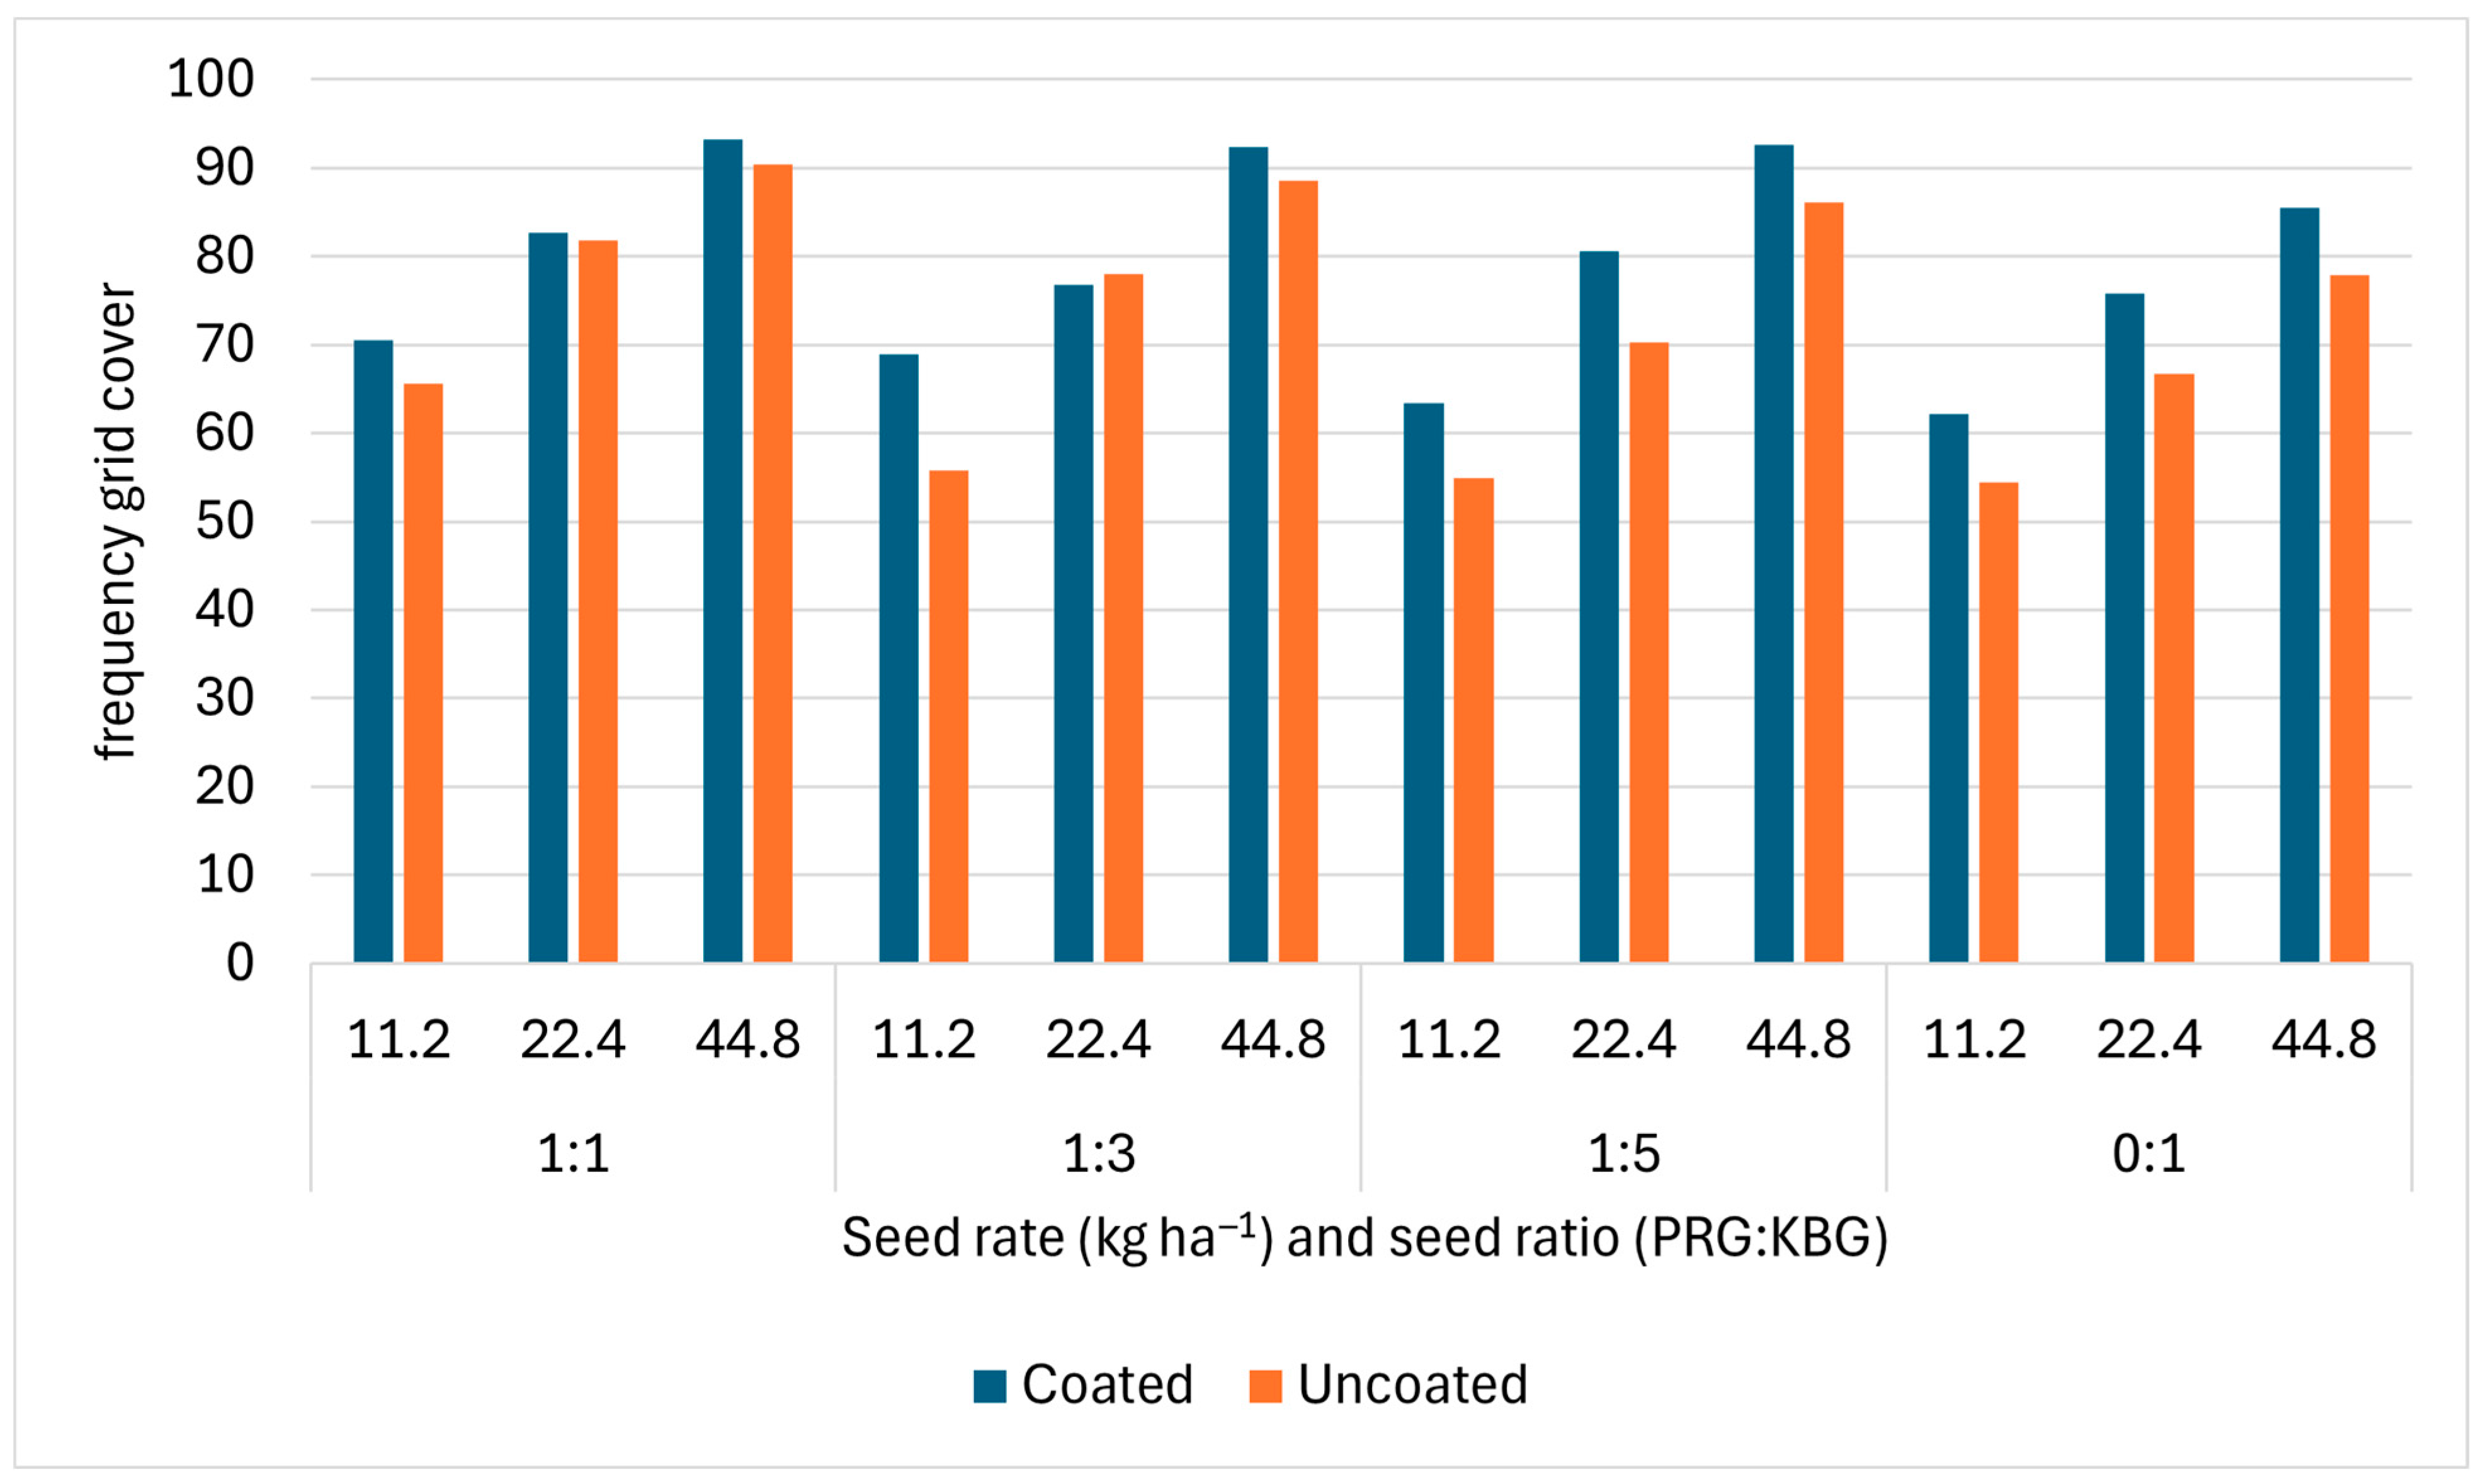
The first signs of germinated grass were observed 12 days after sowing. Figure 2 shows the fall grid cover frequency, measuring the number of cells out of 100 in the grid containing a grass blade. Subsequently, grid cover is used interchangeably with the term ground cover. There was a difference among seed ratio treatments (p < 0.0001). The ratio of 1:1 (PRG:KBG) had the greatest ground cover when compared to the other three ratios (p < 0.01). The seed ratios of 1:3 and 1:5 had the next greatest fall ground cover with no difference between them (p = 0.1897). The ratio of 0:1, which has no PRG in the mix, had the lowest fall ground cover, having 10% less ground cover than the ratio of 1:1 (p < 0.0001). The seeding rate also showed differences, with the highest seeding rate of 44.8 kg ha−1 resulting in the greatest coverage (p < 0.0001). The second highest seeding rate of 22.4 kg ha−1 had the second greatest coverage, and the lowest seeding rate of 11.2 kg ha−1 had the lowest coverage. The 44.8 kg ha−1 rate had 26% more ground cover than the 11.2 kg ha−1 rate. The Hydroloc™ seed coating applied to KBG seeds effectively increased ground cover as it performed significantly better than the uncoated seeds (p = 0.05). The coating of the KBG seed gave a 6% difference in fall ground cover over the two years. Investigating further into the effect of the coating, in the fall of 2023, the coating significantly increased ground cover at 2 and 4 weeks after sowing, and no difference was observed after 4 weeks. However, in the fall of 2024, the effect of the coating on ground cover was not observed until 7 weeks after planting. The interactions between the coating and the seeding rate (p= 0.32) and between the coating and the seed ratio (p = 0.24) were not different.
Figure 3a shows the linear relationship between the seeding rate and the grid cover frequency. As the seeding rate increases, so does the grid cover frequency. The R-squared value of 0.9961 indicated a strong linear relationship between variables. Similarly, linear regression of the seed ratio shows a strong linear relationship between PRG% in the seed mix and the grid cover frequency (Figure 3b). As the PRG% in the seed ratio decreases, so does the grid cover frequency. This linear relationship is confirmed by the R-squared value of 0.985.

3.4. Spring/Summer Visual Ground Cover

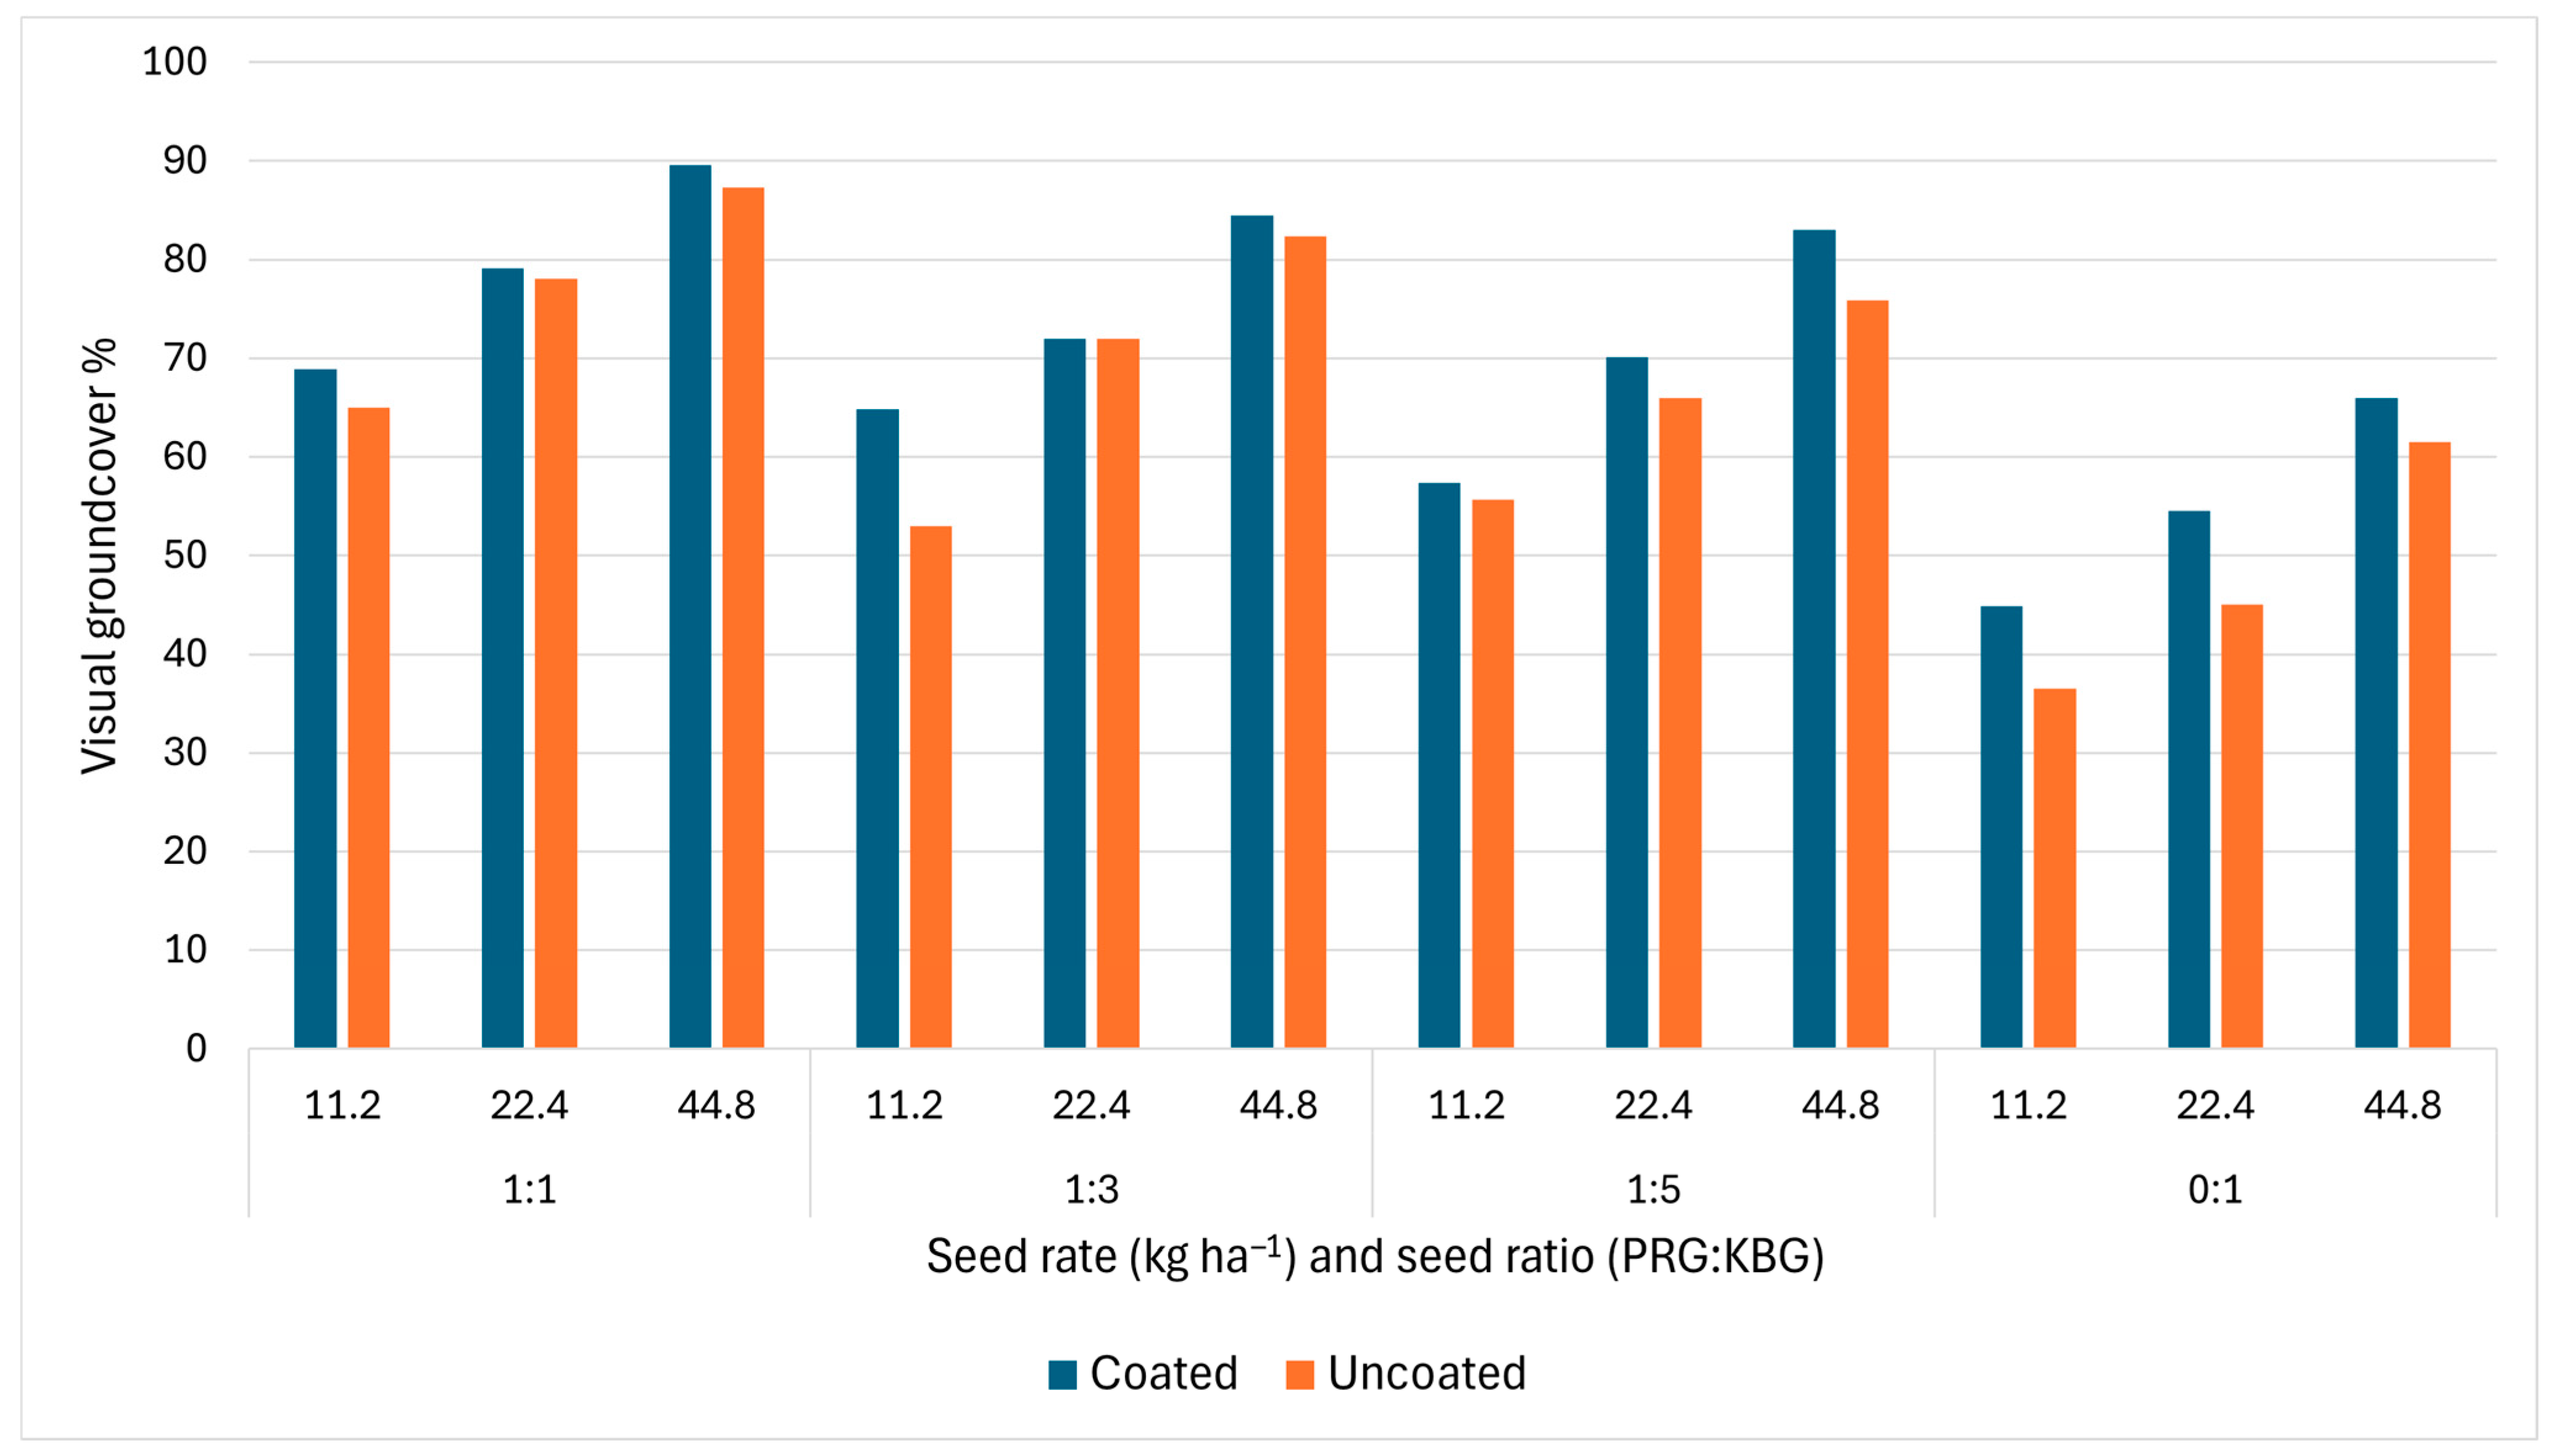
The cover ratings taken in the spring visually estimated the amount of grass coverage in each plot (Figure 4). Similar to the fall data, there was a difference among seed ratio treatments (p < 0.0001). The ratio of 1:1 had the greatest cover, followed by 1:3 and 1:5, with the 0:1 ratio having the lowest cover. The middle-performing seed ratios of 1:3 and 1:5 were not different (p = 0.072). The ratio without PRG of 0:1 had less ground cover than the other three ratios (p < 0.0001). The greatest cover ratio of 1:1 had 26% more ground cover than the lowest cover ratio of 0:1. Seeding rate treatments were different (p < 0.0001), with 44.8 kg ha−1 having the highest ground cover followed by 22.4 kg ha−1 and 11.2 kg ha−1 which had the lowest ground cover. There was a 23% difference in ground cover between the greatest and lowest rates. The Hydroloc™ seed coating applied to the KBG seed did not increase the ground cover when compared to untreated plots (p = 0.149).
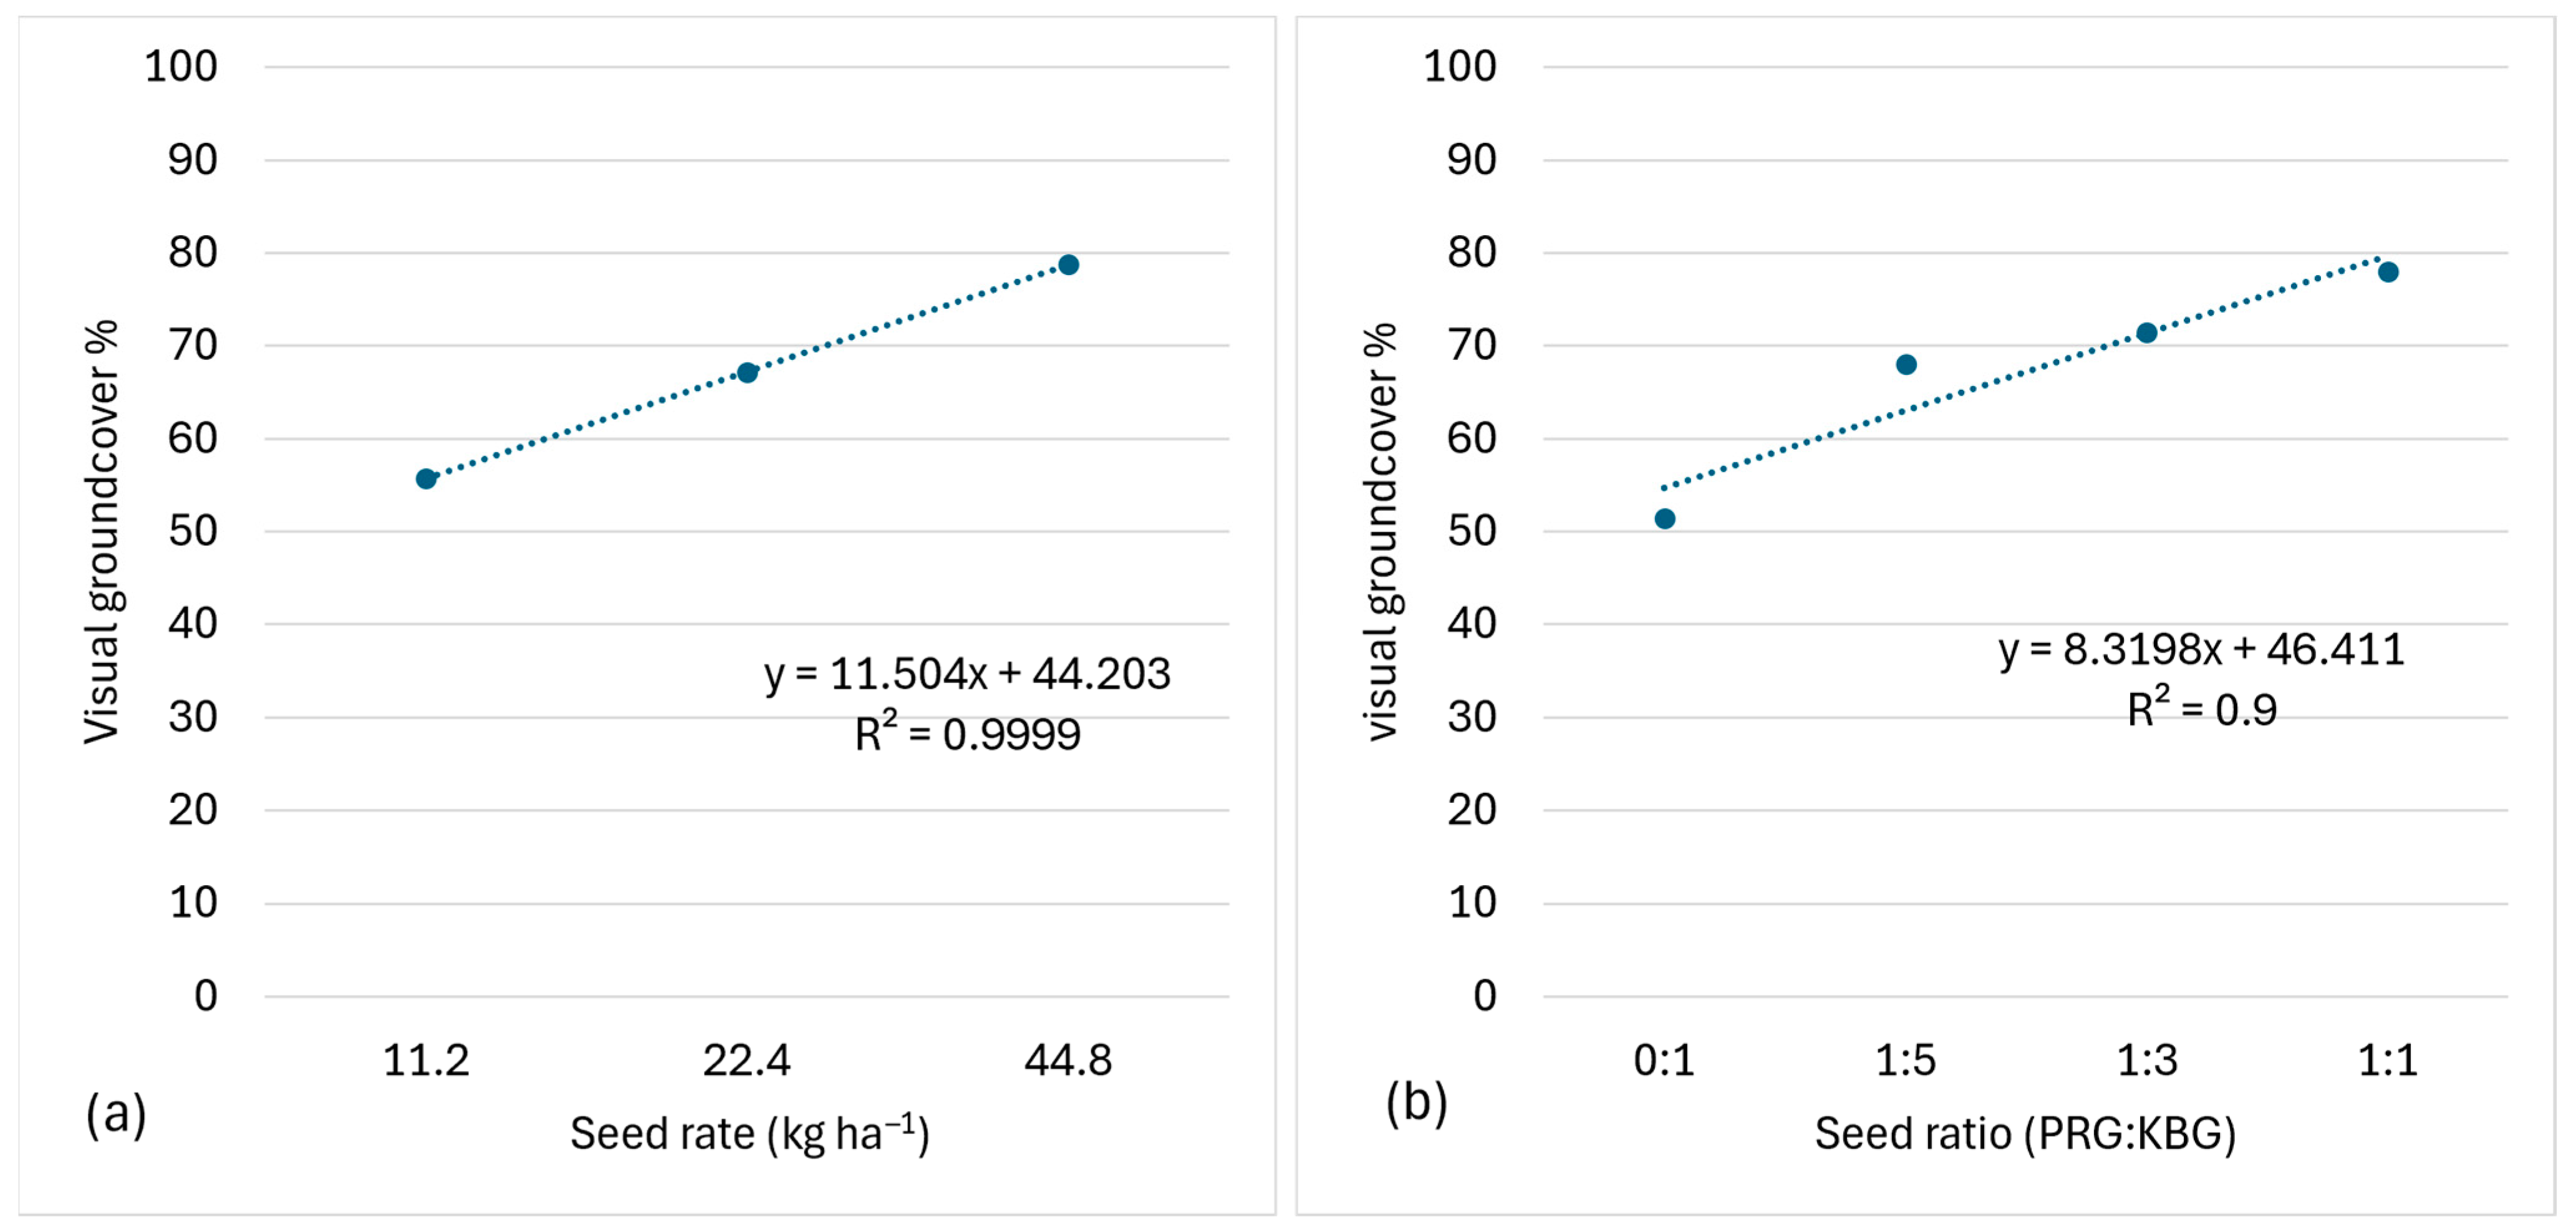
Figure 5a shows the linear relationship between the seeding rate and visual ground cover. The R-squared value of 0.9999 indicated a strong, positive linear relationship between the seeding rate of the PGC and the visual ground cover. Figure 5b shows a strong, negative relationship between the PRG% in the seed ratio and the visual ground cover (R2 = 0.9).

3.5. Spring/Summer Greenness Rating

Figure 6 represents the greenness ratings for blades of grass from each treatment. Grass greenness was rated on a scale from 1 to 10. The grass greenness rating was not different for the seeding rate treatments (p = 0.087). However, the grass greenness rating was different for the seed ratios (p = 0.0001). While the 1:1, 1:3, and 1:5 ratios had similar grass greenness ratings, the ratio of 0:1 had a lower grass greenness rating than the other seed ratios (p < 0.001). The seed coating did not affect the grass greenness rating (p = 0.5421).

3.6. Spring/Summer Red:Far-Red Ratio

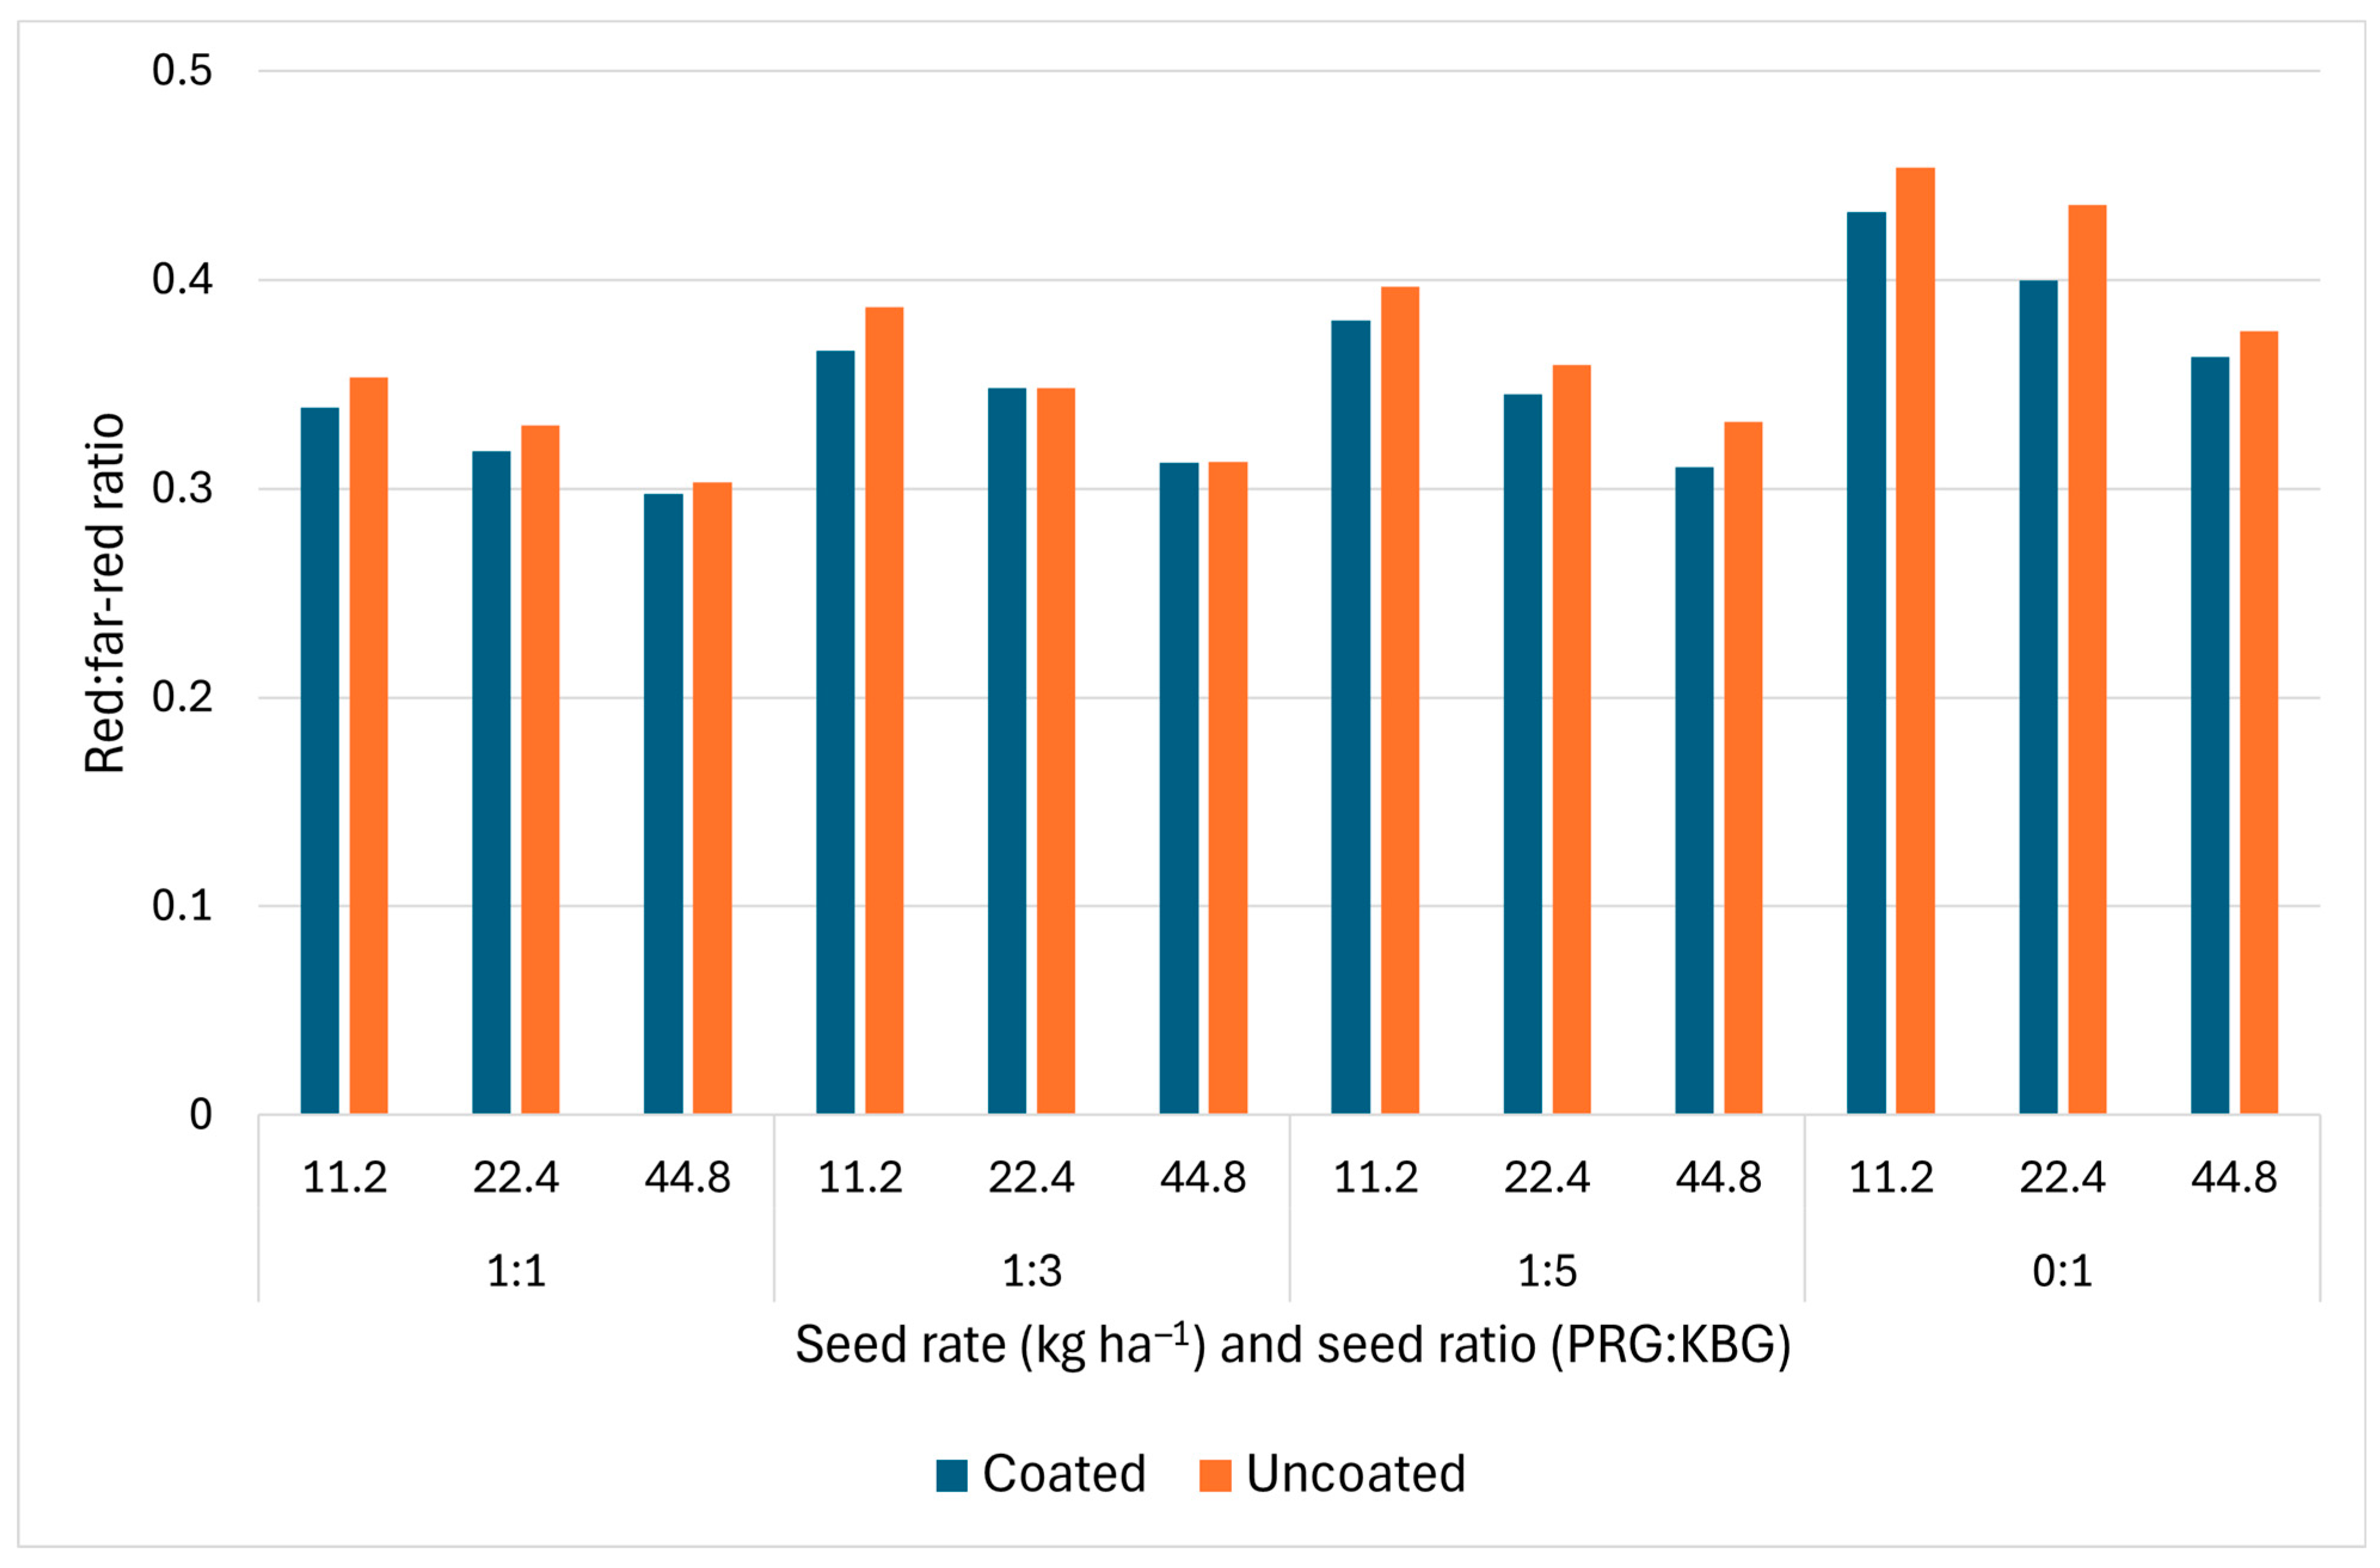
There was a difference in the red:far-red ratio among seeding rates (p < 0.0001) (Figure 7). The highest seeding rate of 44.8 kgha−1 had the lowest red:far-red ratio, indicating dense grass coverage, followed by 22.4 kgha−1 and 11.2 kgha−1 with the highest red:far-red ratio. The 1:1, 1:3, and 1:5 seed ratios differed from the 0:1 seed ratio (p < 0.0001). The seed ratios with PRG in the mix performed similarly (p > 0.05). The seed coating did not affect the red:far-red reflectance ratio (p = 0.256).

3.7. Summer Grass Dry Weight

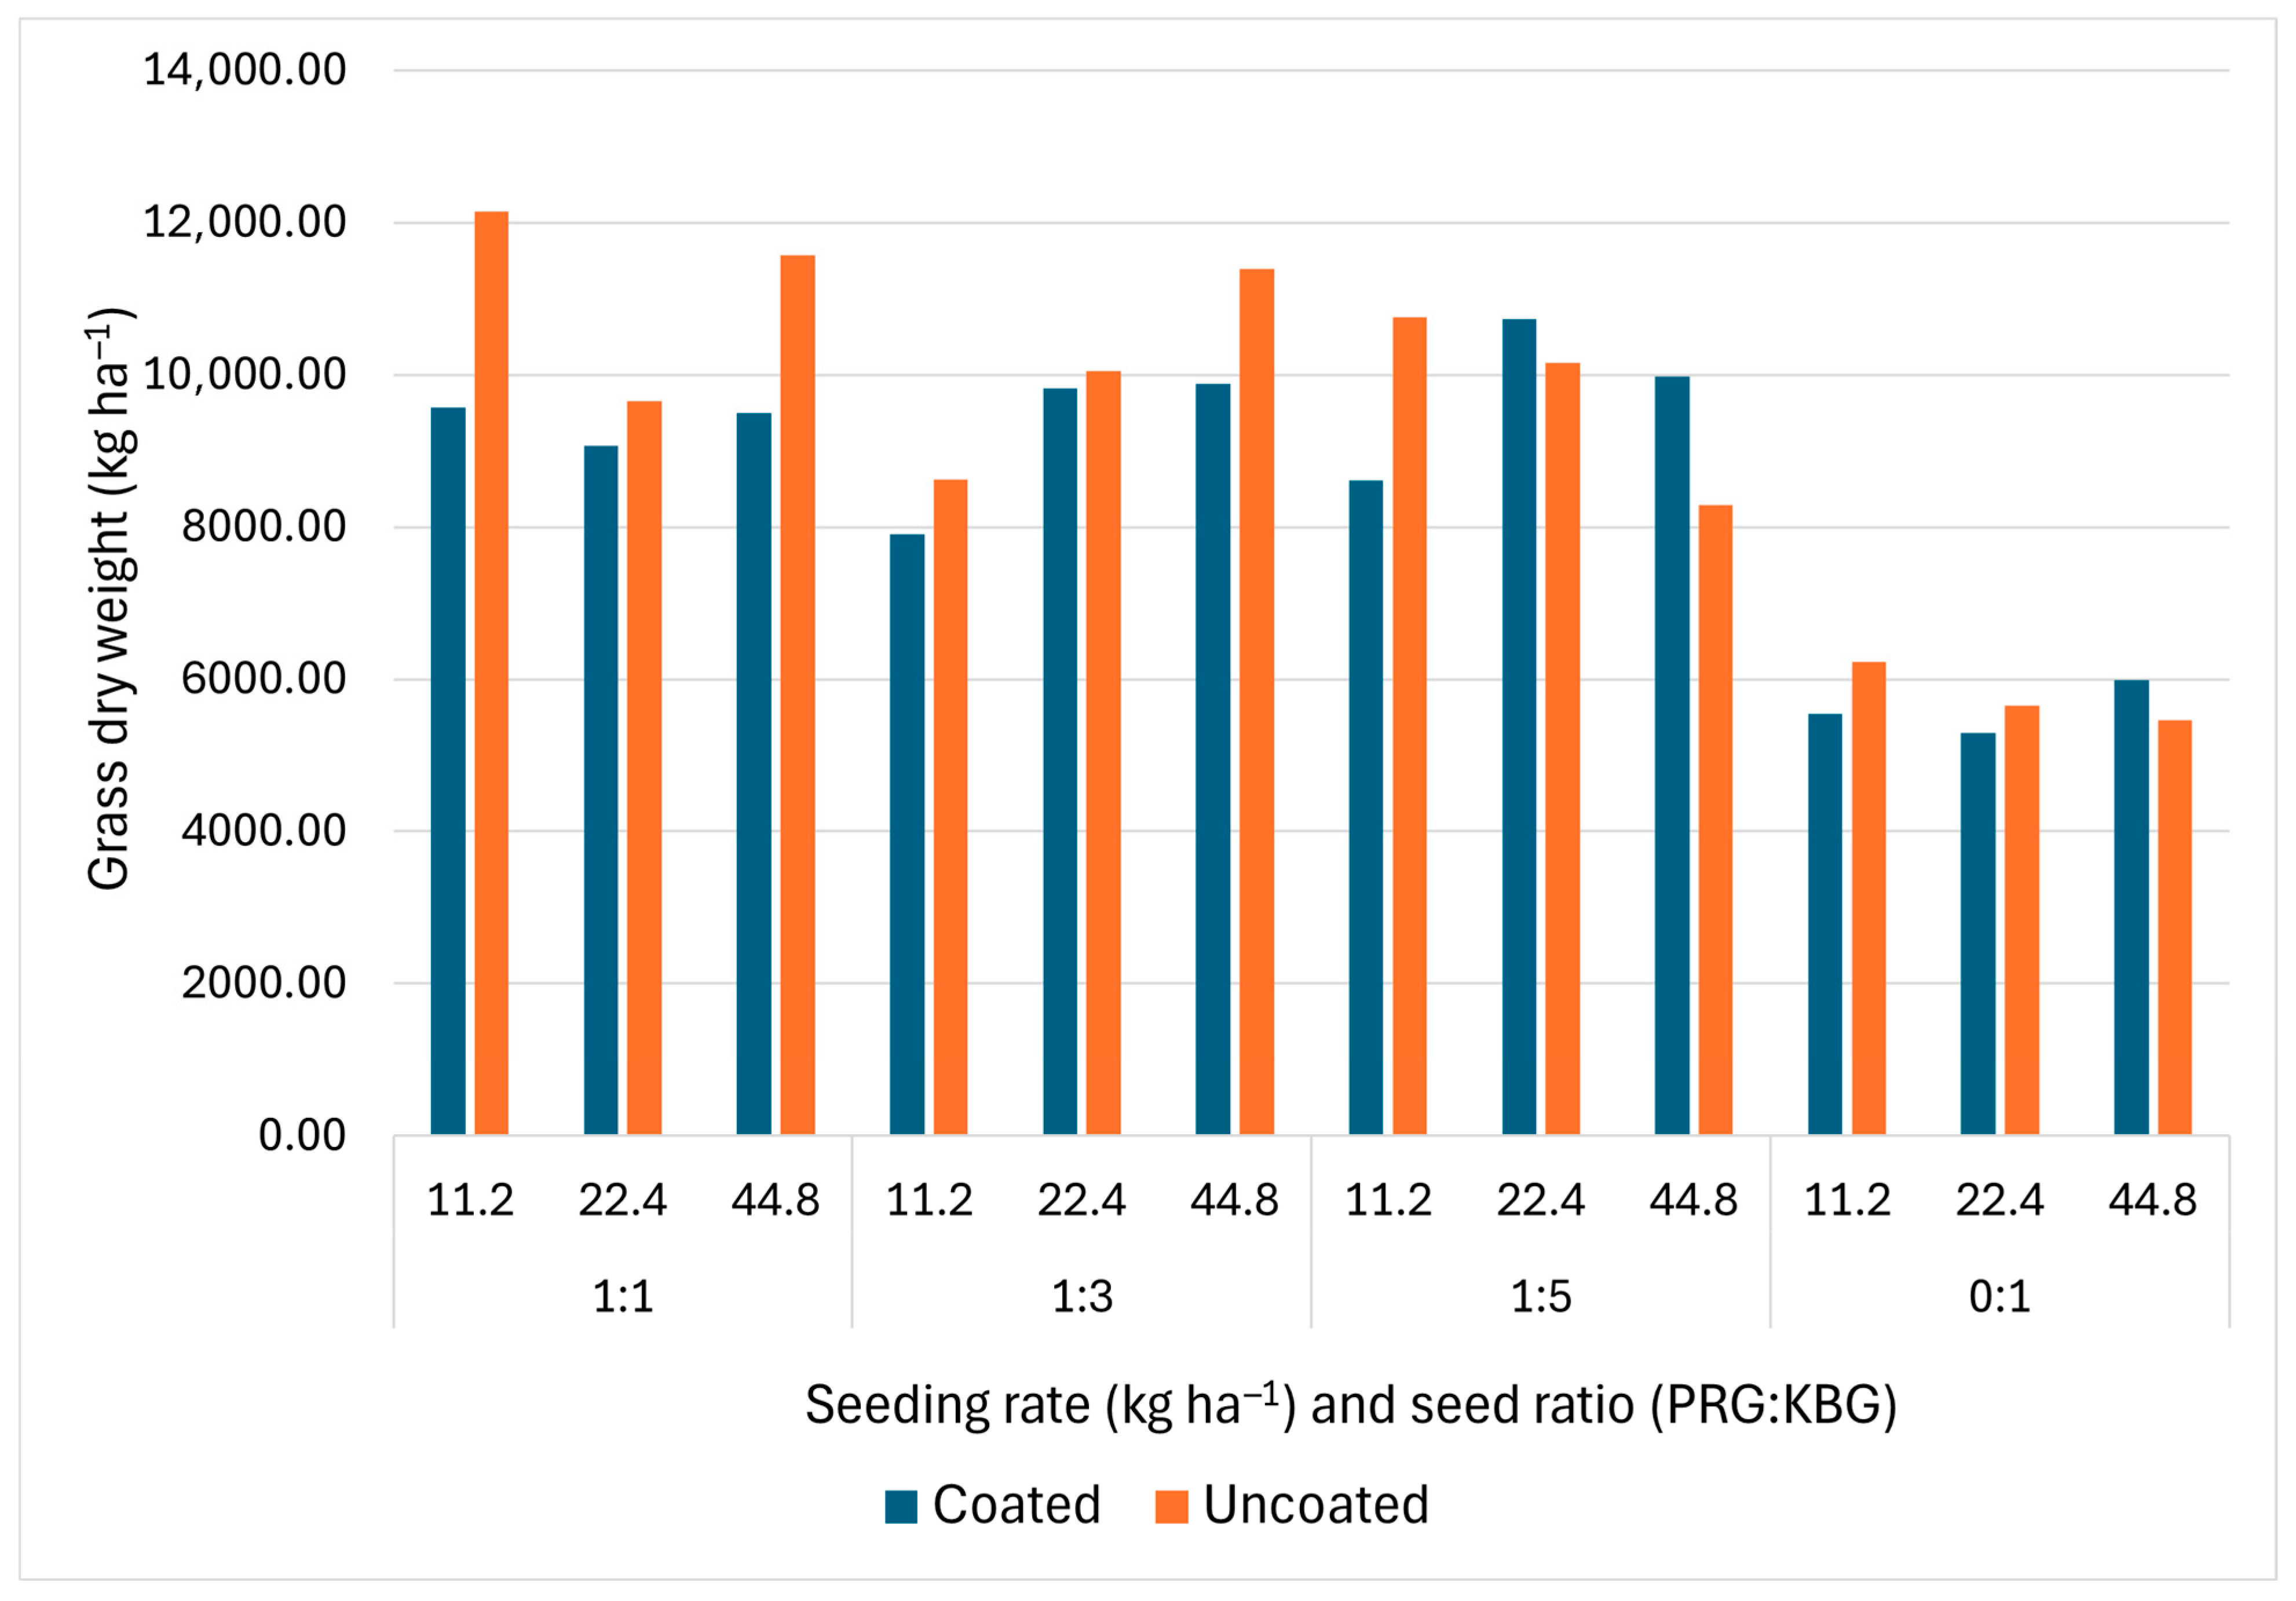
Figure 8 illustrates grass dry weight/biomass data collected at the beginning of the summer when the grass matured. The seeding rate did not affect the grass dry weight (p = 0.8317). The seed ratio treatments were different (p < 0.0001). Seed ratios with PRG in the mix produced greater biomass and had a greater dry weight than the pure KBG ratio. The LSD showed that the dry weight among ratios of 1:1, 1:3, and 1:5 were similar, and all had a heavier dry weight than the ratio of 0:1 (p < 0.0001). The PRG and KBG mixtures had an average of 4100 kg/ha more biomass than the KBG treatment. The Hydroloc™-coated KBG seed did not affect the grass dry weight (p = 0.2340).

3.8. NIRS Grass Composition

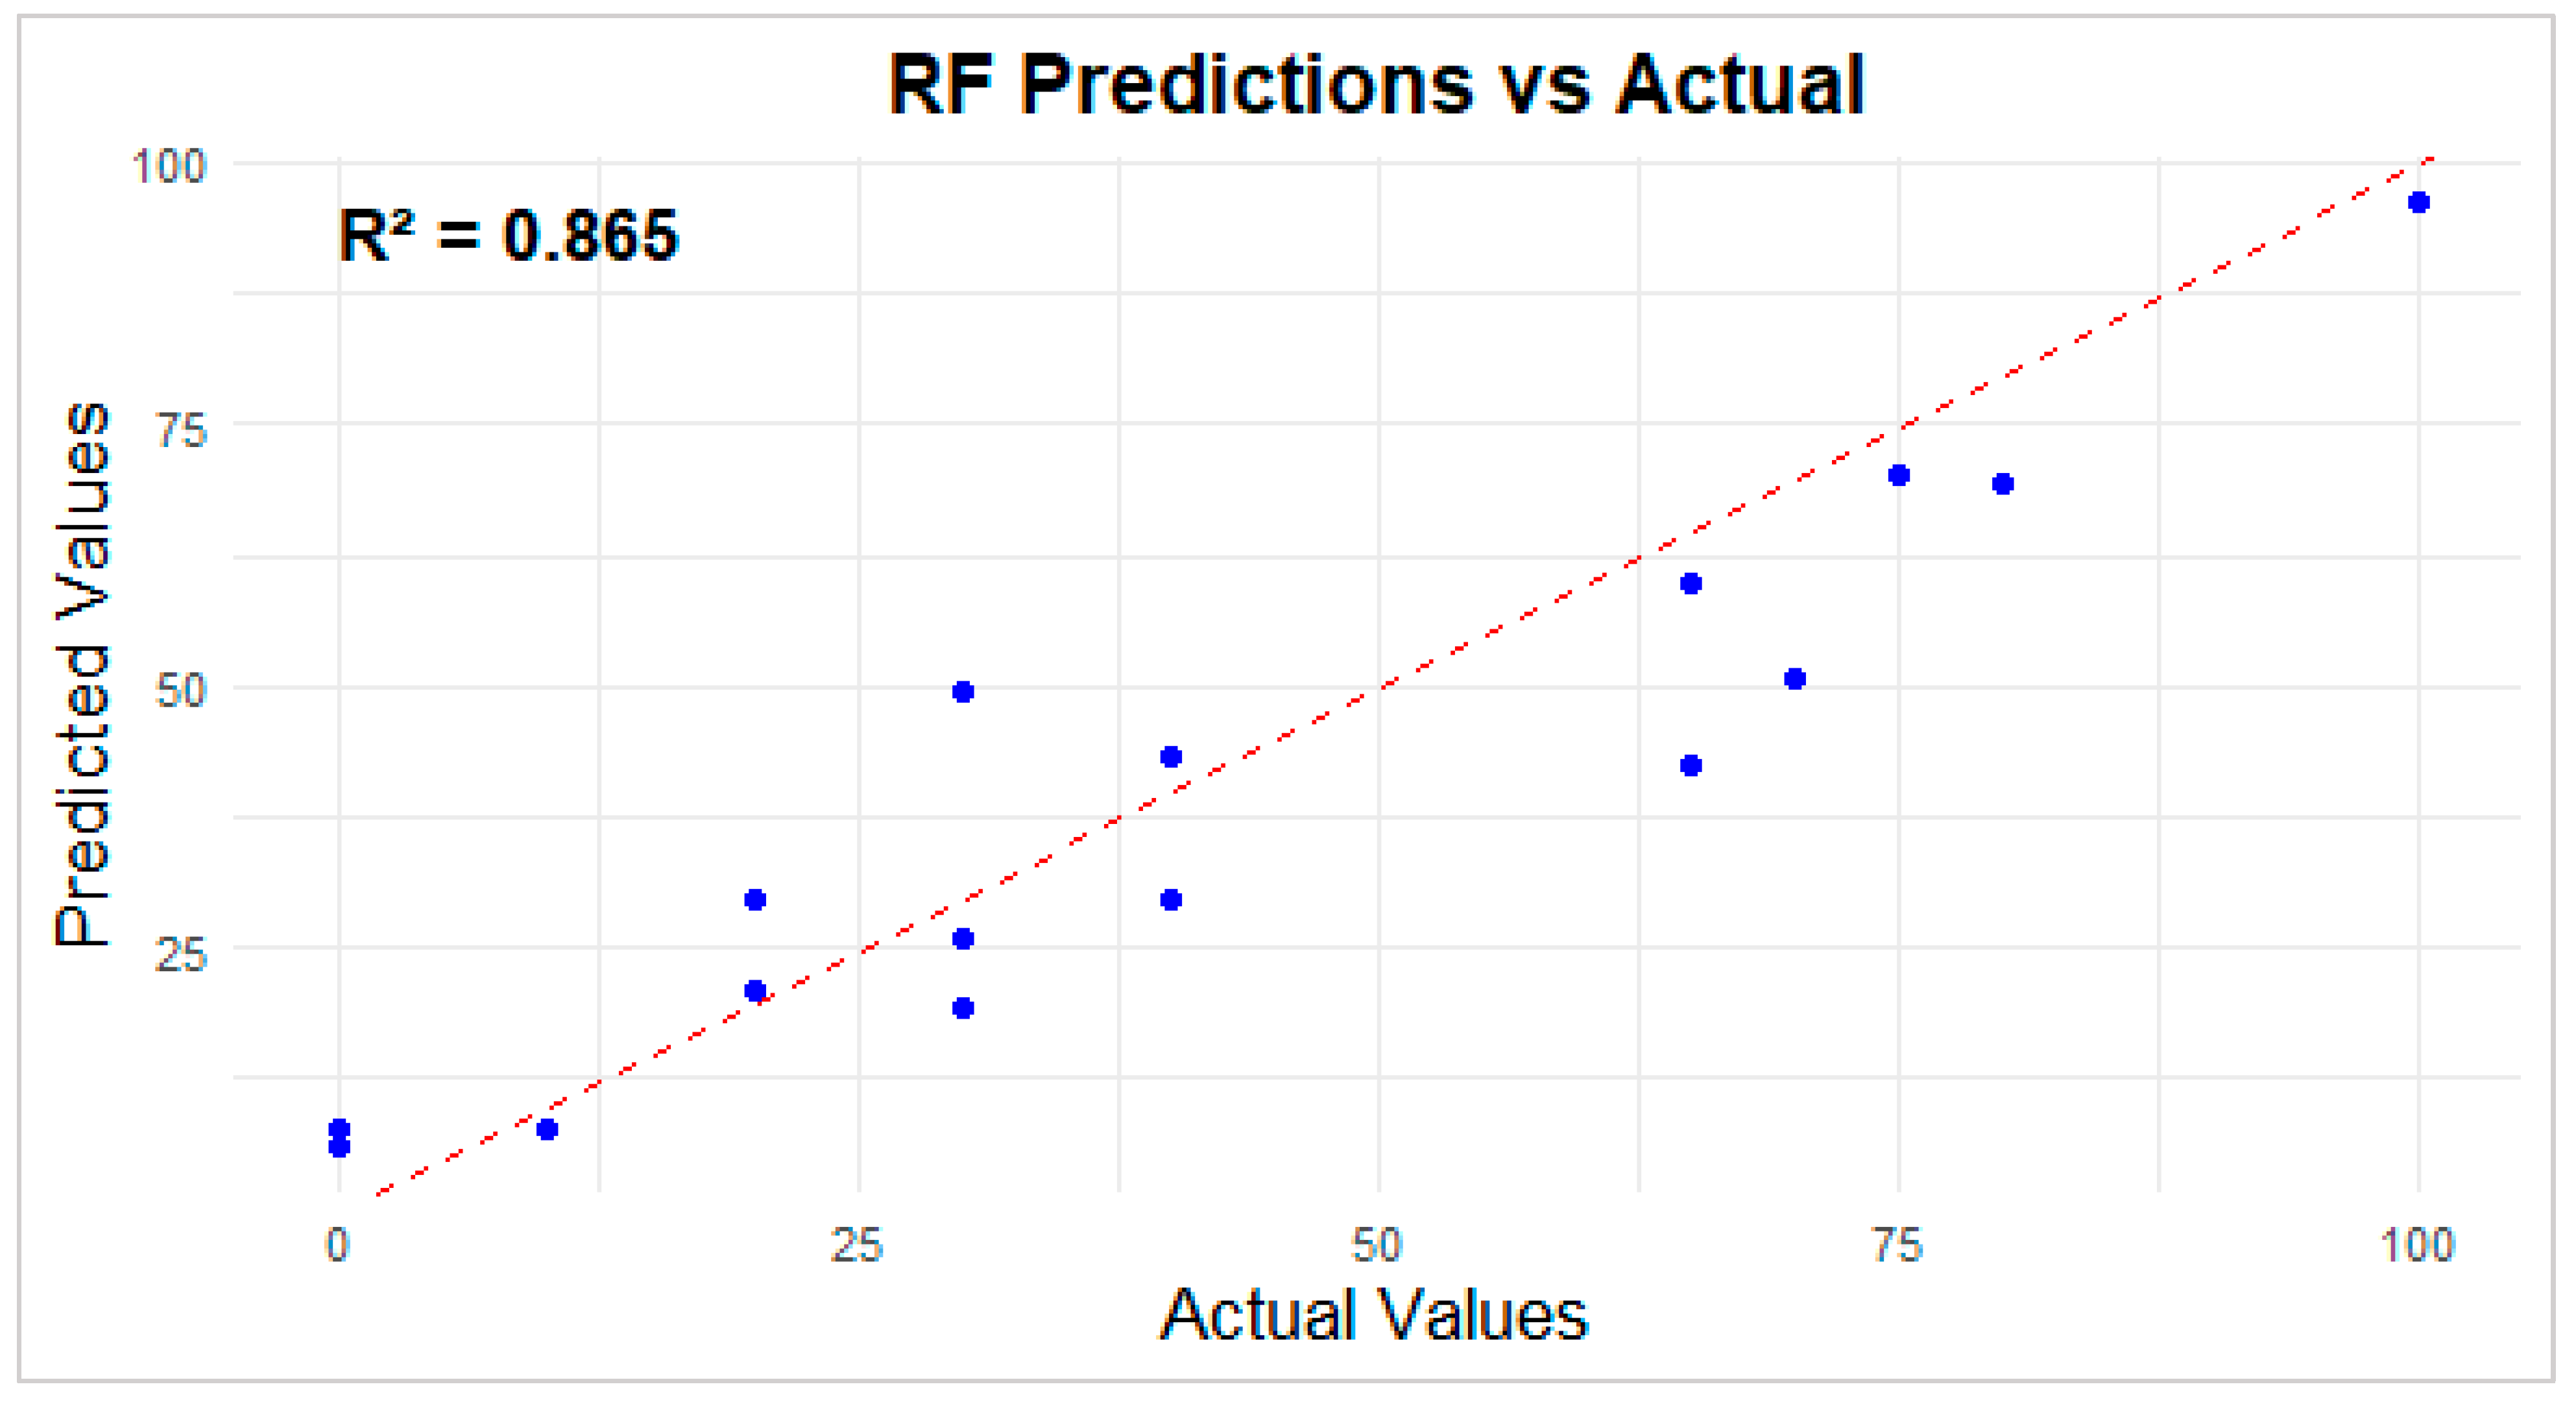
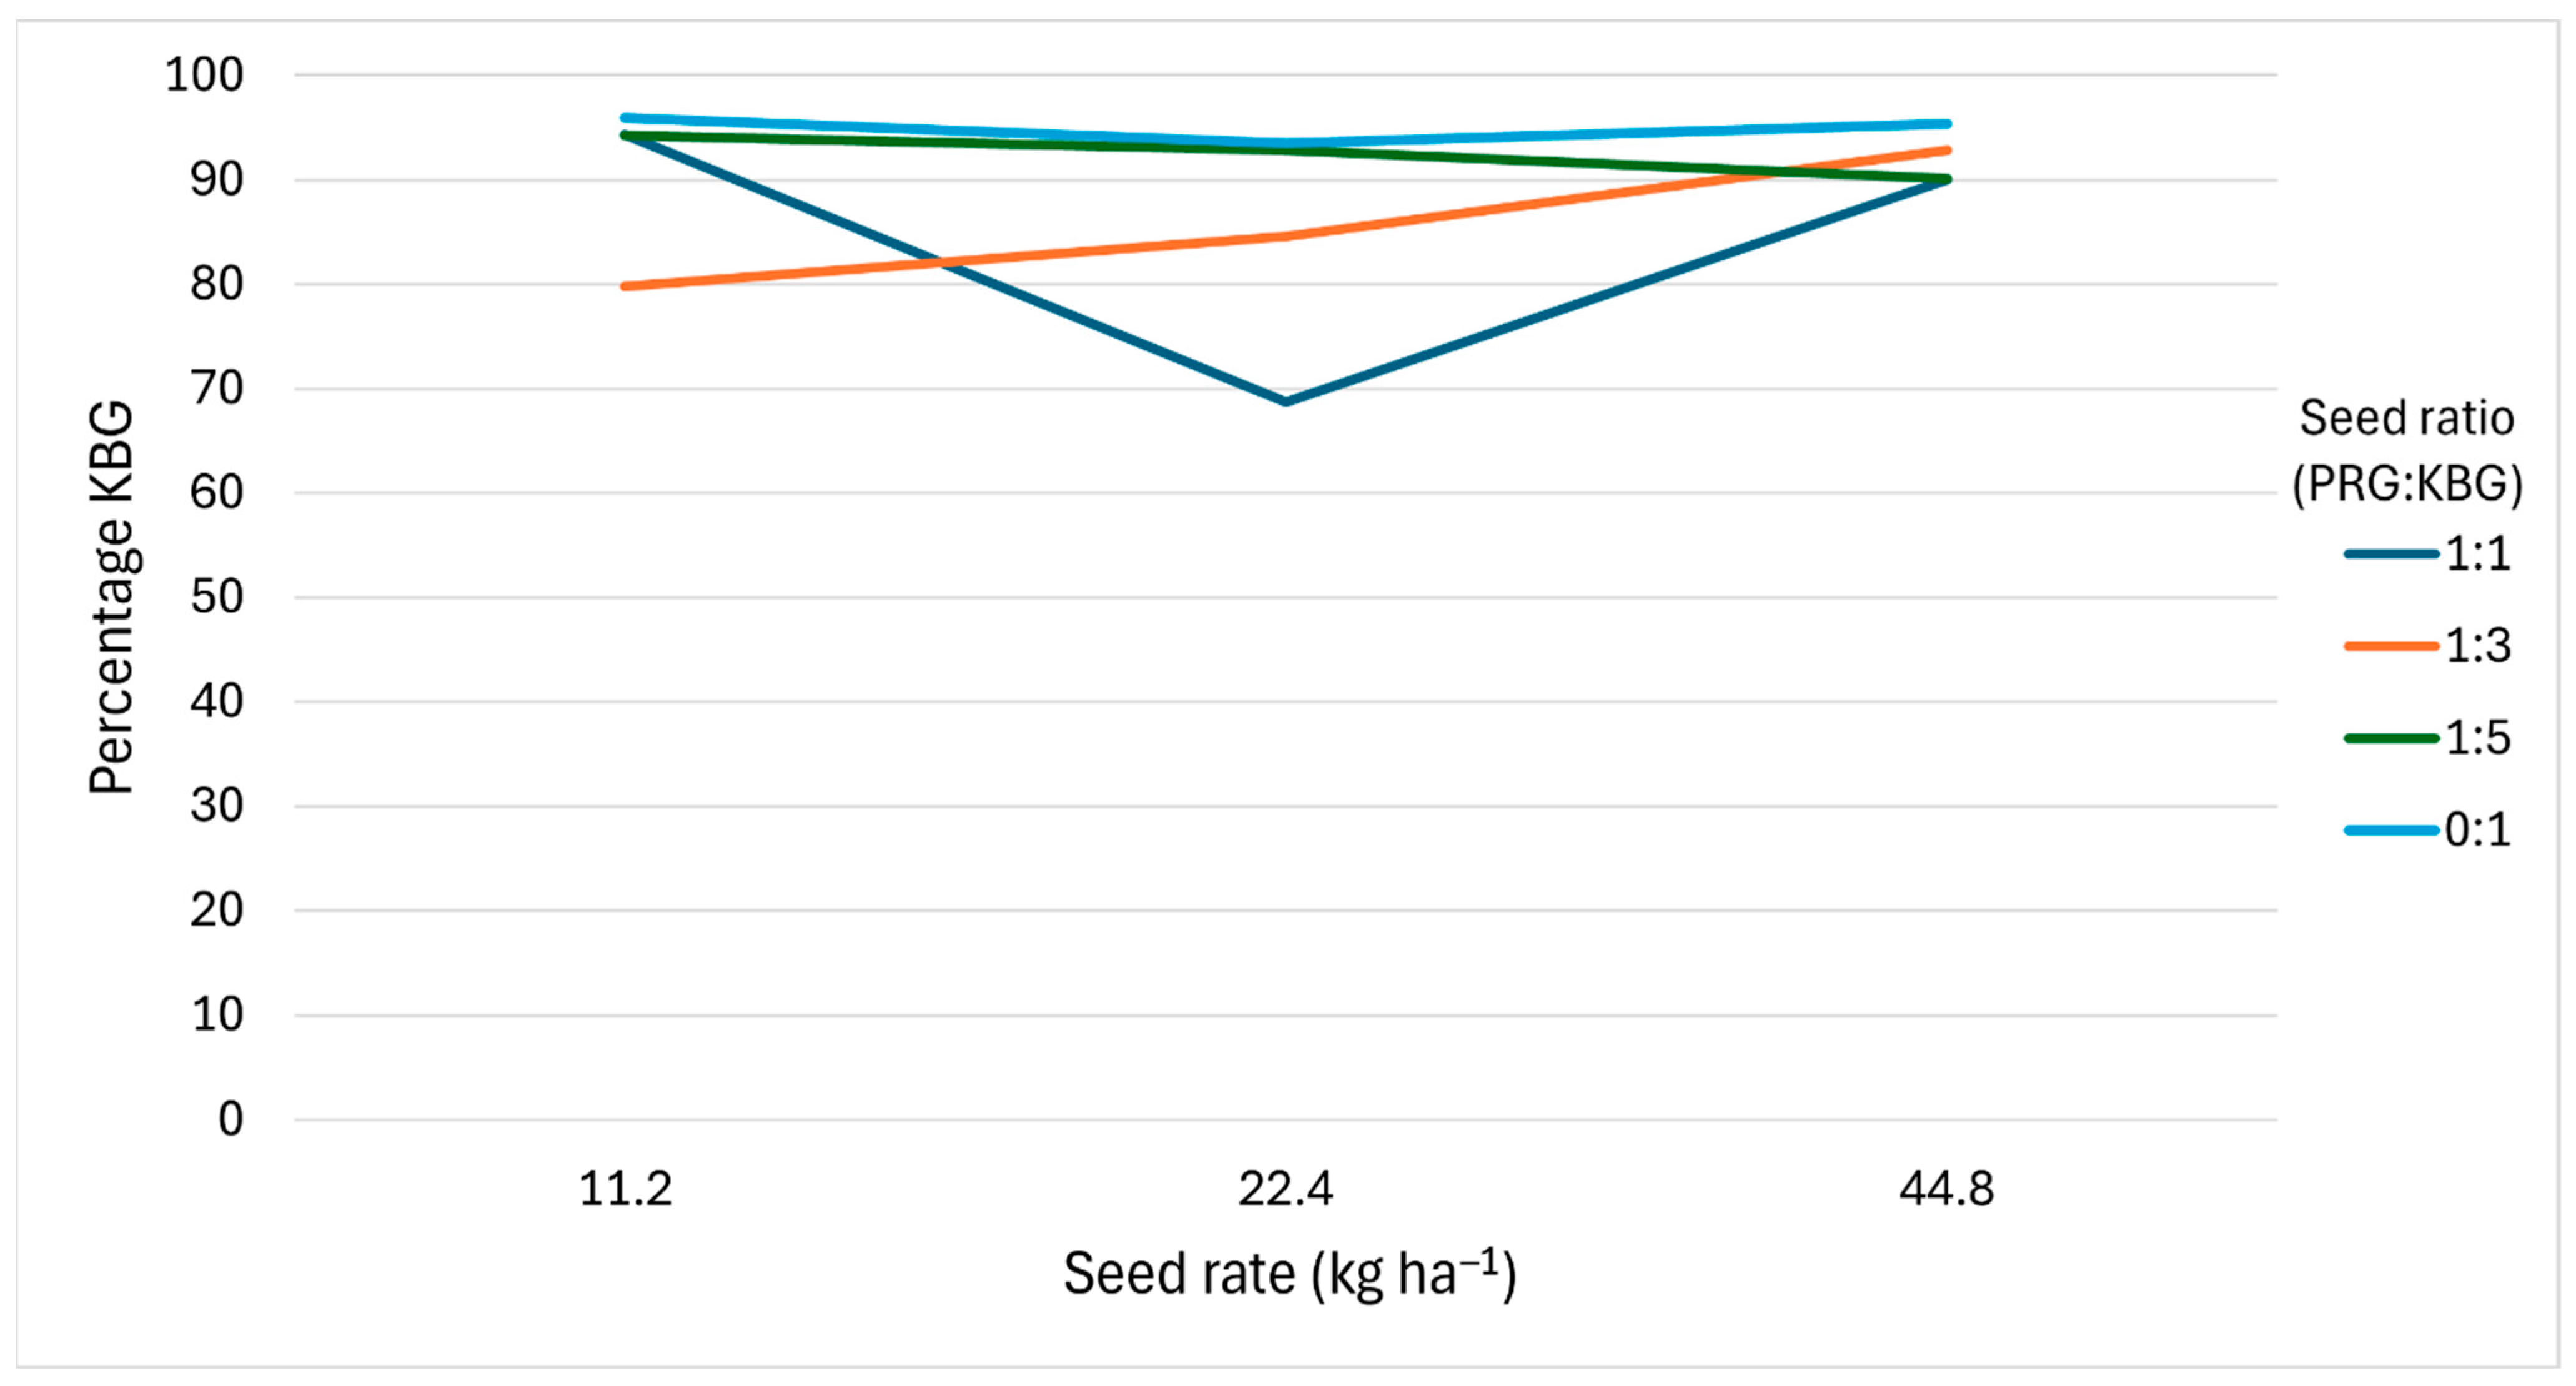
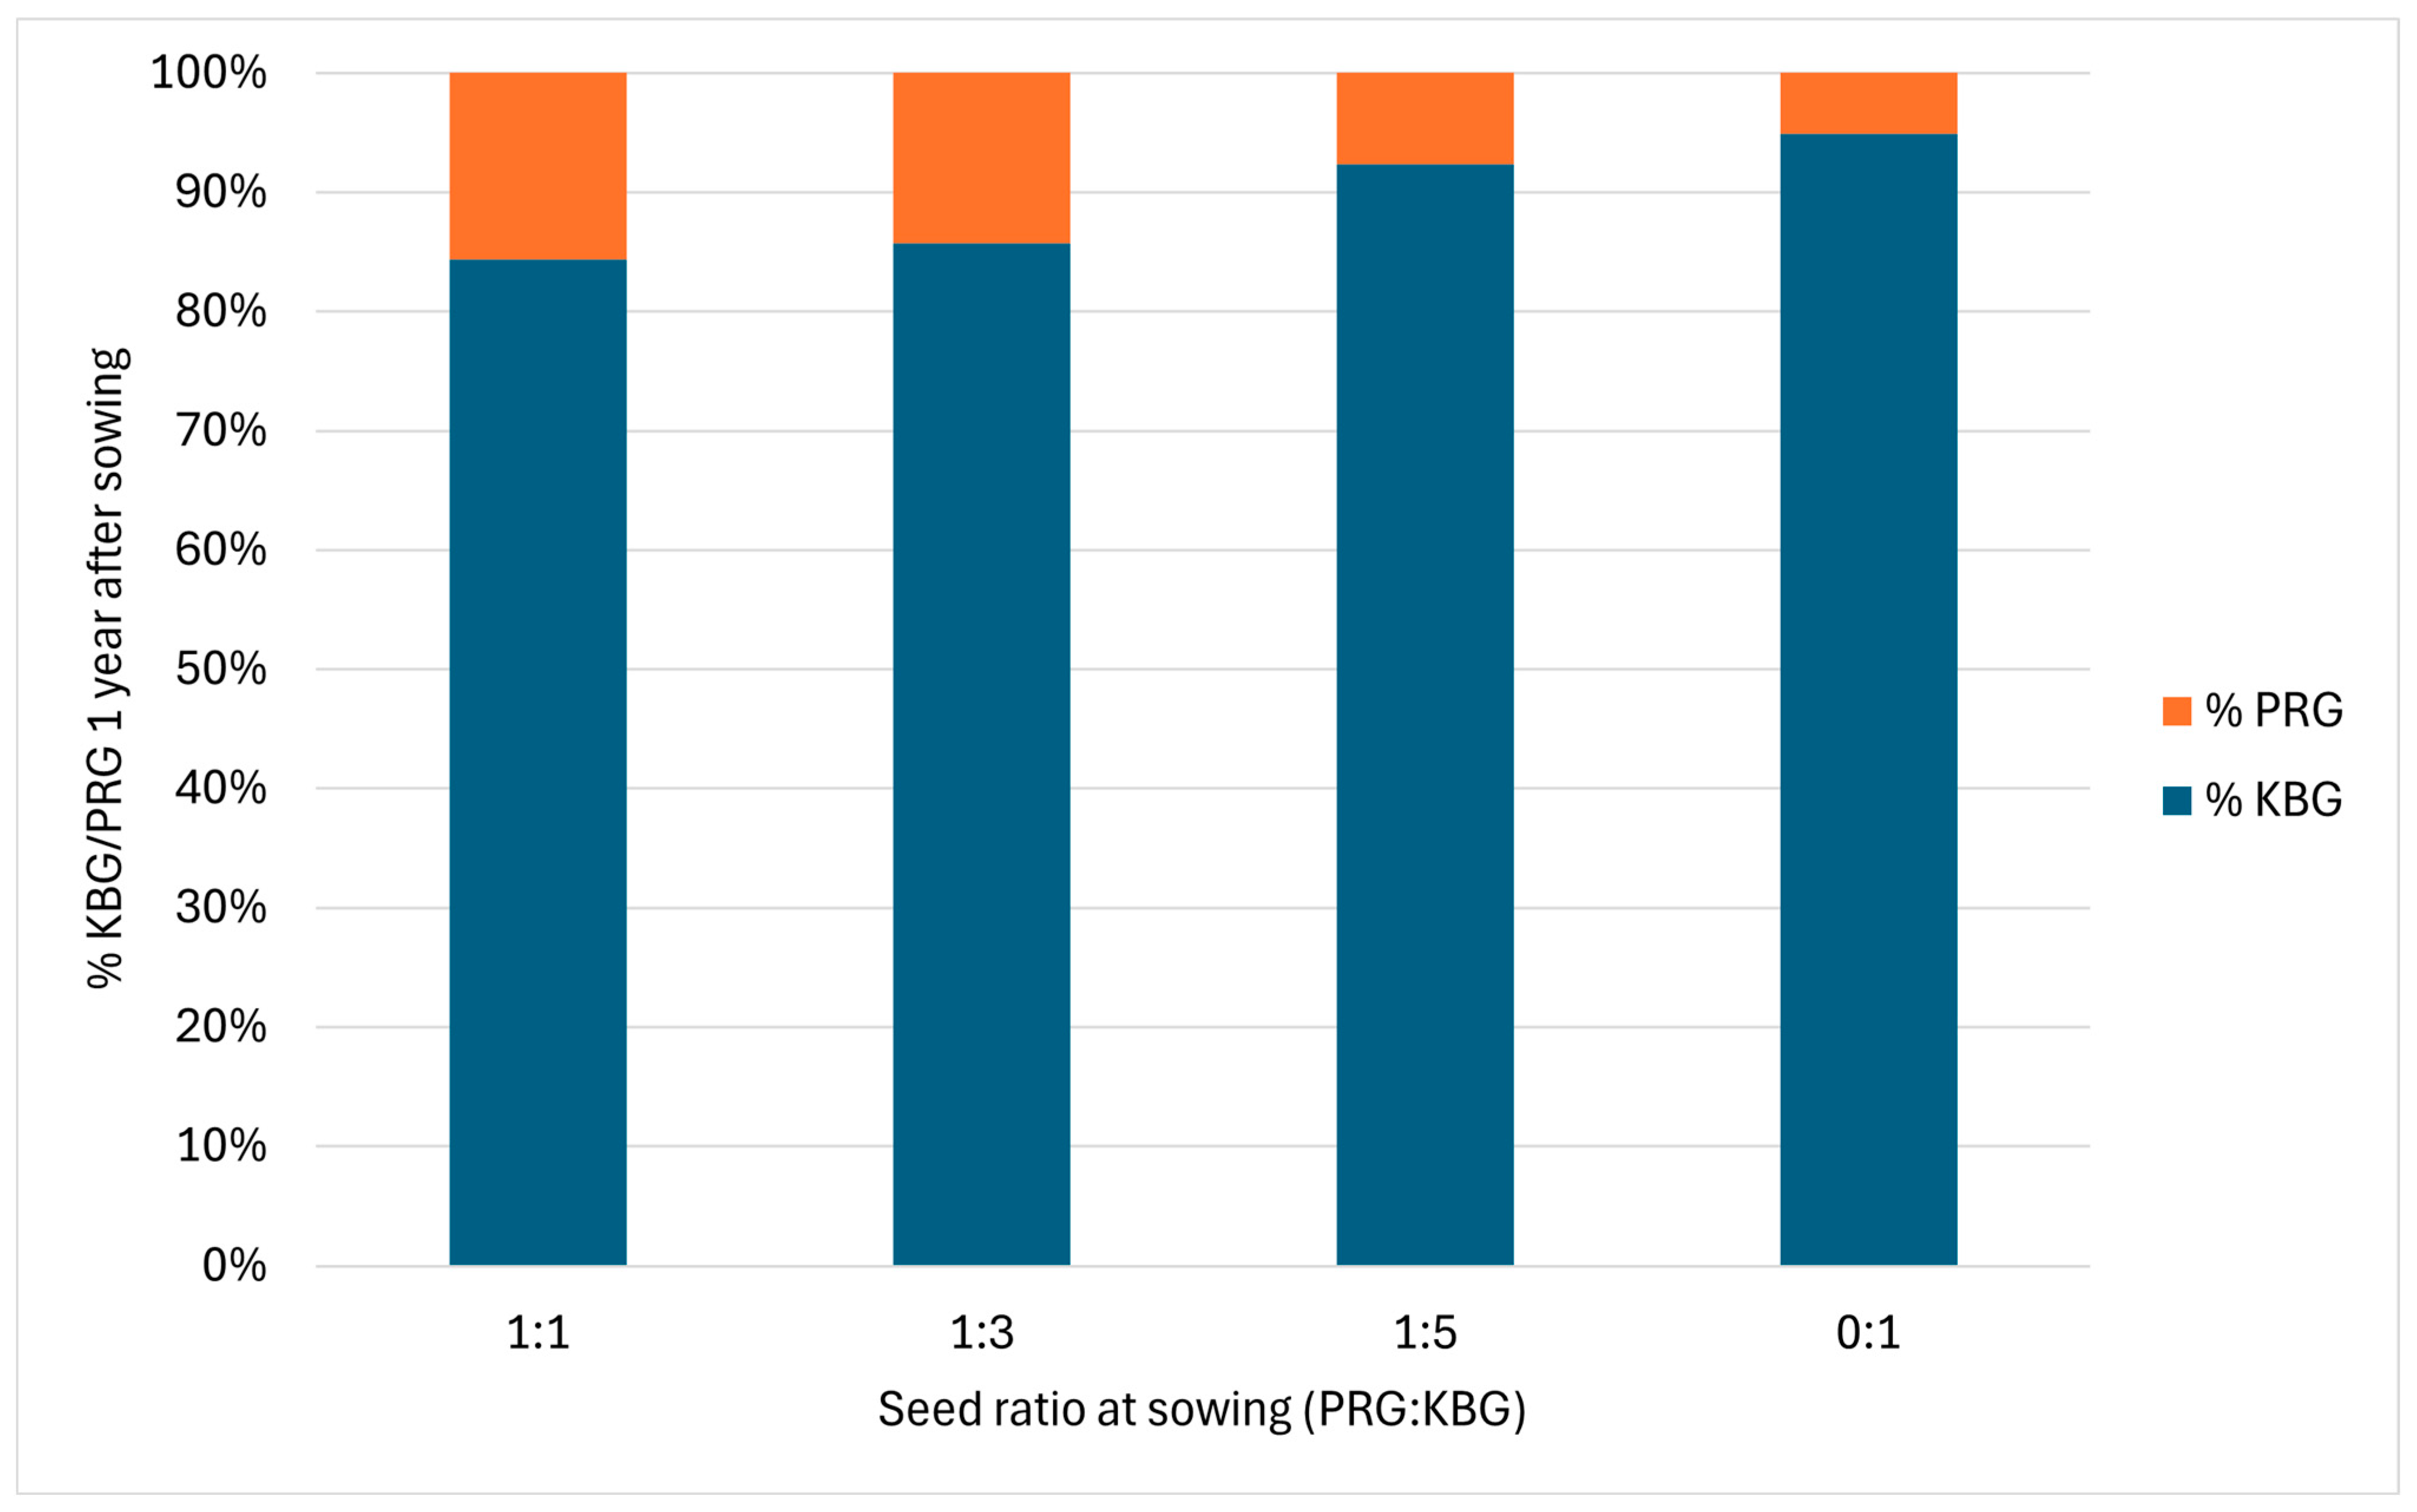
After the RF model was trained, the model’s predictive accuracy gave an RMSE of 10.805, an R2 of 0.865, and an MAE of 8.74. Figure 9 shows the result of testing 30% of the training data. The figure compares the model’s predictive accuracy to the actual values after being trained using the other 70% of the data. Figure 10 illustrates the results of the unknown grass samples, showing the KBG percentage one year after sowing. The results show that the seed coating did not affect the species composition one year after sowing. The effect of seed rates, seed ratios, and their interaction also had no significant difference on the species composition. Overall, the percentage of KBG in the mixed species treatments increased considerably after one year (Figure 11). The KBG percentage in the 1:1 ratio increased to 85% KBG, which is a 25% increase in KBG composition after 1 year. The 1:3 and 1:5 ratios both increased by 10%.

4. Discussion

4.1. Seed Ratio

Our study revealed differences in the ground cover of the 50% KBG ratio (1:1 PRG:KBG) and the 100% KBG or the ratios above 75% KBG. Previous research on PRG-KBG turfgrass mixtures provides useful contexts for understanding seed ratios, though management differences in a PGC system may lead to contrasting outcomes. Brede and Duich [15] concluded that a field-viable turfgrass mixture should contain 70–95% KBG by seed weight, with ratios below 70% resulting in poor KBG establishment and ratios above 95% leading to patchy stands and inadequate PRG distribution [15]. In contrast, Proctor et al. [18] recommended that PRG should make up at least 50% of the seed mix to ensure rapid turf establishment and effective erosion control. While both studies support the use of mixed-species stands, their findings contrast with ours. In a turfgrass system they found that a high KBG seed ratio could perform similarly to a 1:1 PRG:KBG ratio [15,18]. Proctor et al. [18] found that 6 weeks after planting, a 20:80 PRG:KBG ratio had similar cover to a 100% PRG ratio. They found that after fall sowing, the 100% KBG ratio had full coverage in May. This variation in early KBG performance is likely attributed to the routine mowing after establishment in the referenced turfgrass studies, combined with a high seeding rate, both of which support KBG growth. Routine mowing of grasses will stimulate tillering and rhizome development of KBG, increasing the grass cover [34]. As mentioned before, this high maintenance is impractical in a PGC system.
Cultivar selection is a primary factor dictating the predominance of one species or the other in a mixed grass stands. Species/cultivars with more aggressive or better-adapted traits quickly dominate the other grasses in a seed mix [35]. The species and cultivars chosen for the grass mix in this study have good genetic merit and have been previously trialed in a PGC system. Some favorable characteristics of the KBG variety ‘Mercury’ for a PGC system are its low growth habit, strong disease resistance, high drought tolerance, good shade tolerance, high seedling vigor, and rhizomatous growth habit, preventing traffic damage [28,36]. The PRG variety ‘Top Gun II’ was chosen due to its high tiller density, traffic tolerance, wide adaption to different management and locations, fast spring green-up, and good disease resistance [37].
Many cultivar selections are based upon the greenness of the grass stand. However, the greenness of a perennial grass stand is more than just an esthetic trait; it serves as a key indicator of plant health, vigor, and long-term viability. The greenness of a grass stand is closely tied to photosynthetic efficiency, nutrients, and the water status. The study by Brede and Duich [15] found that the KBG and PRG mixture had 44% greater spring greening than the monoculture of either species [15]. Our study corroborates these findings, where all mixtures had an average greenness rating of 7.6/10 over the spring season, while the KBG monoculture stand had an average rating of 7.1/10. This difference in greenness may be attributed to PRG’s naturally darker green leaf coloration compared to KBG [10].
Studies comparing the establishment of KBG and PRG as separate monocultures show conflicting results. Serena et al. [38] and other studies found that PRG typically has the shortest time to reach 50% ground coverage but reaches 95% ground coverage in the same time period as KBG [39,40]. These results are mainly due to KBG’s rhizome development, allowing it to spread horizontally, while PRG has a bunched growth habit incapable of producing rhizomes or stolons. Several authors [41,42] demonstrated that KBG has a much slower establishment than other cool-season species, and PRG has the fastest establishment and greatest ground cover. Moreover, monocultures of PRG have twice the seedling survival of KBG [15]. The differing results from these studies can primarily be attributed to the environment in which the study occurred. Variations in temperature, soil moisture, soil type, time of seeding, cultivar selection, mowing frequency, nutrient application, or traffic among studies can significantly influence the growth of these two species [18]. Unlike previous turfgrass studies, which commonly used irrigation, this study did not make it a key point of difference. In our study, a monoculture KBG stand performed significantly worse than a mixed stand of KBG and PRG. However, including a PRG monoculture in future research could provide an interesting baseline for comparison.
Our research demonstrated that using PRG mixed with KBG increased the dry weight or biomass of the plant stand. Previous studies similarly found that mixtures containing PRG tend to produce more biomass than monoculture stands [16,42]. Increased biomass production generally correlates with increased ecosystem services, which is a goal of the PGC system [43]. The PRG’s larger seed can be established quickly, suppressing weeds that could otherwise hinder the establishment of KBG. However, PRG is vulnerable to a number of biotic and abiotic stresses. PRG is one of the least tolerant cool-season grasses to heat, freezing, and pathogen attacks, which contribute to its decline in a sward overtime [44]. The use of a seed mixture in a PGC benefits from differences in species traits such as disease/insect resistance, water use efficiency, and/or traffic tolerance [17]. Our study exemplifies the benefits of these seed mixtures by PRG:KBG ratios of 1:1, 1:3, and 1:5, increasing ground cover, biomass, and greenness compared to the 0:1 ratio of a KBG monoculture stand.
A strong linear relationship exists between the PRG percentage in the seed mix and the ground cover percentage. Hence, the 1:1 ratio (PRG:KBG) would be the preferred PGC mixture, given the improved fall establishment over other ratios. Also, consistent with the existing literature, our results confirm that the 1:1 ratio will quickly transition to a KBG-dominant stand due to the species’ superior persistence and adaptability. NIR analysis conducted one year post-establishment revealed that all PRG–KBG mixtures had shifted to predominantly KBG composition, occurring even more rapidly than reported in previous studies carried out in the Midwest, USA [15,18]. This suggests that the transition timeline may accelerate under environmental conditions or management practices unfavorable to PRG.

4.2. Seeding Rate

The seeding rate of a PGC must be balanced, as low seeding rates result in lower stand establishment and a patchy PGC, while too high a seeding rate may result in a dense PGC that causes a shade avoidance response in the growing corn crop. A poorly established PGC reduces the ecosystem services provided, leading to increased soil erosion and nutrient leaching [43]. A patchy PGC establishment also results in increased weed invasion, while a well-established PGC with a desirable density should effectively suppress weeds [45]. Although the weed population was not measured in this experiment, suppression of weed species is controlled by population density and not species richness [46]. On the contrary, too high a seeding rate results in weak plants that are more susceptible to diseases and slower to mature. The study by Madison [19] concluded that the fastest-maturing KBG turf stand was observed in the lower seeding rate plots. Similarly, plants with the highest photosynthesizing capacity were those from the lowest seeding rate treatments. It must be noted that the “low” seeding rate in Madison’s study of 48 kg ha−1 is slightly higher than the highest seeding rate tested in our experiment [19].
Our study showed a positive linear relationship between increasing the seeding rate and percentage ground cover throughout both seasons. The 44.8 kg ha−1 seeding rate had the best results for the fall grid cover frequency, spring visual cover, and the red:far-red ratio regardless of mixed species or monoculture stands. However, seeding rate did not affect the summer grass dry weight results. The 22.4 kg ha−1 rate had a similar dry weight to the 44.8 kg ha−1 rate. Haramoto [47] found similar results in rye cover crops: a higher seeding rate of cereal rye resulted in increased ground cover but did not affect cover crop biomass [47]. Other cereal rye studies have found that increased seeding rates have increased fall plant populations and biomass of the rye cover crop but saw no difference in spring biomass [48]. Regardless, there is a general consensus that greater biomass production is linked to the prevention of soil nutrient leaching and soil erosion and adds organic carbon to the soil [4]. These results indicate that increasing the seeding rate did not increase the ecosystem services provided by the PGC. We estimate that with current seed prices, the 1:1 PRG:KBG ratio sown at a rate of 22.4 kg ha−1 is 85 USD/ha while the 44.8 kg ha−1 seeding rate costs the farmer 171 USD/ha. Thus, the results of our study show that a farmer can optimize PGC ecosystem services and reduce seed costs by using the 22.4 kg ha−1 intermediate seeding rate. This management strategy will ensure good fall and spring ground cover while limiting seed costs for the farmer.

4.3. Hydrophilic Seed Coating

There is conflicting evidence on whether polymer coatings on grass seeds can compensate for reduced seeding rates. Some turf studies using starch, nutrient, or hydrophilic polymer coatings found that coated seeds planted at a reduced seeding rate could reach the same or greater level of coverage as uncoated seeds at a full seeding rate [20,49]. However, other studies have found that seed coatings do not compensate for the reduced seeding rate in grasses [50,51,52]. None of these studies used the same seed coating and cannot be directly compared, but they are all designed to increase grass seed germination speed and seedling vigor. A more recent study testing different commercial seed coatings on bermudagrass found that seed coatings did not increase the germination rate [53]. Our study showed no interaction between the Hydroloc™ coating and the seeding rate in the fall or spring ground cover measurements. Hence, our research does not support Greipsson and Leinauer’s findings that a seed coating could compensate for reducing the seeding rate.
Although the Hydroloc™ seed coating cannot compensate for a reduced seeding rate in a PGC, we determined that the Hydroloc™ seed coating increased the fall grid cover frequency. This increase in ground cover is likely a result of the faster establishment of KBG coated with a hydrophilic polymer. These results build on our prior work investigating KBG seed treatments in a growth chamber [22]. In this prior study, we found that the Hydroloc™ coating can increase KBG germination and shoot dry weight in the first 21 days of growth, regardless of whether soil moisture was limiting. Previous studies have also shown that coating small seeds like KBG with a hydrophilic polymer can significantly improve germination [20,21,54]. They found that the effect was more pronounced under conditions of limited soil moisture, whether due to restricted irrigation or inherently dry soil types. The Hydroloc™ coating consists of a primary coating of finely ground limestone, which uses microcapillary action to pull water around the seed. The next layer consists of micronutrients of iron, zinc, and magnesium, surrounded by an absorbent polymer that can hold ten times its weight in water around the seed. We observed in this experiment how soil moisture affected the efficacy of the Hydroloc™ coating. Lower rainfall in the fall of 2023 resulted in plots where seeds were coated with the Hydroloc™ coating having significantly more ground cover in the first 4 weeks after sowing. Slightly greater rainfall in the fall of 2024 resulted in plots where seeds were coated with Hydroloc™ not having a significant difference in ground cover until 7 weeks after sowing.
Studies show that the use of hydrophilic polymers, such as the one used in this experiment, promote early leaf growth in cereals [55,56]. These authors found that using hydrophilic polymers could increase the mobilization of grain reserves, resulting in higher biomass in small-grain cereals. They hypothesized that hydrophilic seed coatings could lead to more efficient use of glucose in the embryo and reduce respiration losses during germination. Other studies noted the benefit of polymer coatings in preventing winter kill/desiccation of the KBG seed [57,58]. This phenomenon is common in fall-established PGCs where the grass does not fully establish due to temperatures dropping below freezing, leading to the grasses going into premature dormancy [59]. These are promising findings for a fall-established PGC with unreliable environmental conditions. At a cost of 0.26 USD/kg for the farmer, Hydroloc™ is a cost-effective solution for ensuring PGC fall establishment and winter survival.

4.4. Species Composition

Regardless of the seeding rate, seed ratio, or coating, all mixed species treatments switched to a predominant KBG stand of 85% or greater composition within 1 year after sowing. Notably, the 1:1 ratio had the most substantial increase in KBG composition. This shift occurred more rapidly in our study than previously reported in other studies, where the transition from PRG-dominant to KBG-dominant stands typically took 3 to 5 years [15,17,60]. The speed at which this change in species composition occurred depends on the environmental conditions and the cultivars used. Our findings align with those by Proctor et al. [18], who concluded that a 1:1 ratio (PRG:KBG) grown in a low weed pressure area would likely consist of a 95% KBG stand within 2 years of establishment.
The NIR analysis revealed that these species probably have different adaptability to environmental stressors which contributed to a progressive decline in PRG composition over time. This shift in composition is common in the Midwest of the United States, where abiotic factors such as extremely high temperatures in late summer followed by low temperatures and snow cover in the winter lead to an increase in disease pressure in PRG such as pythium (Pythium aphanidermatum) and blast (Magnaporthe oryzae), leading to the decline in PRG composition [18]. In contrast, KBG’s ability to enter dormancy under unfavorable conditions allows it to conserve energy and resume growth when environmental conditions improve. Field observations in 2024 supported this dynamic; PRG reached maturity by June and seeded out, but regrowth in early fall was predominantly KBG. Additionally, greater-than-average rainfall in May 2024 likely favored KBG survival while exacerbating diseases in PRG, potentially accelerating the compositional shift. This excess moisture also delayed grass maturity compared to typical regional patterns.
Hydroloc™ treatment had no measurable effect on the proportion of KBG in the stand after one year. Moreover, grass dry weight results were not affected by the use of the Hydroloc™ treatment on KBG seeds. To better understand species dynamics in PGC systems, future research should include more frequent assessments of grass composition throughout the growing season, particularly in PRG–KBG mixtures managed under reduced mowing regimes.

5. Conclusions

Our study demonstrates the enhanced performance of a mixed-species perennial groundcover (PGC). A 1:1 ratio of perennial ryegrass (PRG) and kentucky bluegrass (KBG) improves fall establishment, possibly leading to effective weed suppression and soil protection. This seed mixture leveraged the rapid establishment of PRG and the long-term persistence of KBG. The KBG-only seed ratio underperformed in both ground cover and summer biomass. A 22.4 kg ha−1 seeding rate minimizes seed costs in a PGC system while achieving full spring ground cover before planting corn. Additionally, using the hydrophilic seed coating, Hydroloc™, improved initial establishment in the fall, enhancing ecosystem services and possibly weed suppression, although it could not compensate for reduced seeding rates.
We found that the mixed species sown changed to a predominantly KBG stand one year after establishing. Ultimately, the change in species composition and performance of PGC systems is influenced by environmental conditions and management practices, highlighting the need for improved PGC-specific management guidelines for farmers. These findings offer practical insight for current and prospective PGC growers in the Midwest, USA, where improving PGC establishment can maintain ecosystem services and reduce the need for reseeding in subsequent years. Future research should focus on further optimizing management strategies to ensure long-term persistence of the PGC system.

Supplementary Materials

The following supporting information can be downloaded at: https://www.mdpi.com/article/10.3390/agronomy15081927/s1, File S1: Comprehensive Methodology.

Author Contributions

Conceptualization, J.M., A.S.G. and K.J.M.; methodology, J.M., K.J.M., A.S.G. and S.G. (NIR section); validation, J.M., A.S.G., K.J.M., S.-z.F. and S.G. (NIR section); formal analysis, J.M. and K.J.M.; investigation, J.M., K.J.M., A.S.G., S.G. (NIR section) and S.-z.F.; resources, A.S.G., K.J.M., S.G. (NIR section) and S.-z.F.; data curation, J.M., K.J.M. and A.S.G.; writing—original draft preparation, J.M.; writing—review and editing, J.M., A.S.G., K.J.M. and S.-z.F.; visualization, J.M.; supervision, A.S.G. and K.J.M.; project administration, A.S.G. and K.J.M.; funding acquisition, A.S.G., K.J.M. and S.-z.F. All authors have read and agreed to the published version of the manuscript.

Funding

RegenPGC is supported by the Agriculture and Food Research Initiative Competitive Grant (no. 2021-68012-35923) from the USDA National Institute of Food and Agriculture. Any opinions, findings, conclusions, or recommendations expressed in this article are those of the authors and do not necessarily reflect the view of the U.S. Department of Agriculture. J.M. assistantship also was partially funded by the ISU Seed Science Center’s Leroy and Barbara Everson Fellowship in Seed Science and ISU Department Agronomy’s Franz J. Haas Memorial Fellowship.

Data Availability Statement

The original contributions presented in this study are included in the article. Further inquiries can be directed to the corresponding author(s).

Acknowledgments

We would like to acknowledge the work of research scientists Roger Hintz and Patrick Galland, who helped carry out field work.

Conflicts of Interest

The authors declare no conflict of interest.

References

  1. Comer, P.J.; Hak, J.C.; Kindscher, K.; Muldavin, E.; Singhurst, J. Continent-Scale Landscape Conservation Design for Temperate Grasslands of the Great Plains and Chihuahuan Desert. Nat. Areas J. 2018, 38, 196–211. [Google Scholar] [CrossRef]
  2. Nearing, M.A.; Xie, Y.; Liu, B.; Ye, Y. Natural and anthropogenic rates of soil erosion. Int. Soil. Water Conserv. Res. 2017, 5, 77–84. [Google Scholar] [CrossRef]
  3. Bartel, C.A.; Jacobs, K.L.; Moore, K.J.; Raman, D.R. Anticipatory Technoeconomic Evaluation of Kentucky Bluegrass-Based Perennial Groundcover Implementations in Large-Scale Midwestern US Corn Production Systems. Sustainability 2024, 16, 7112. [Google Scholar] [CrossRef]
  4. Moore, K.J.; Anex, R.P.; Elobeid, A.E.; Fei, S.; Flora, C.B.; Goggi, A.S.; Jacobs, K.L.; Jha, P.; Kaleita, A.L.; Karlen, D.L.; et al. Regenerating Agricultural Landscapes with Perennial Groundcover for Intensive Crop Production. Agronomy 2019, 9, 458. [Google Scholar] [CrossRef]
  5. Schlautman, B.; Bartel, C.; Diaz-Garcia, L.; Fei, S.; Flynn, S.; Haramoto, E.; Moore, K.; Raman, D.R. Perennial groundcovers: An emerging technology for soil conservation and the sustainable intensification of agriculture. Emerg. Top. Life Sci. 2021, 5, 337–347. [Google Scholar] [CrossRef]
  6. Bartel, C.A.; Archontoulis, S.V.; Lenssen, A.W.; Moore, K.J.; Huber, I.L.; Laird, D.A.; Dixon, P.M. Modeling perennial groundcover effects on annual maize grain crop growth with the Agricultural Production Systems sIMulator. Agron. J. 2020, 112, 1895–1910. [Google Scholar] [CrossRef]
  7. Hall, J.K.; Hartwig, N.L.; Hoffman, L.D. Cyanazine Losses in Runoff from No-Tillage Corn in “Living” and Dead Mulches vs. Unmulched, Conventional Tillage. J. Environ. Qual. 1984, 13, 105–110. [Google Scholar] [CrossRef]
  8. Olowoyeye, O.S.; Kaleita, A.L. Investigating Erosion under Perennial Ground Cover (PGC) Using a Rainfall Simulation Experiment. Appl. Eng. Agric. 2024, 40, 611–621. [Google Scholar] [CrossRef]
  9. Chen, A.; Fei, S.-Z.; Lenssen, A.W.; Moore, K.J. Evaluating cool-season grass species as potential perennial groundcover for maize production. Agron. J. 2022, 114, 2415–2429. [Google Scholar] [CrossRef]
  10. Beard, J.B. Turfgrass: Science and Culture; Pearson London: London, UK, 1972; ISBN 13-978-0139330025. [Google Scholar]
  11. Bartel, C.A.; Banik, C.; Lenssen, A.W.; Moore, K.J.; Laird, D.A.; Archontoulis, S.V.; Lamkey, K.R. Establishment of Perennial Groundcovers for Maize-Based Bioenergy Production Systems. Agron. J. 2017, 109, 822–835. [Google Scholar] [CrossRef]
  12. Flynn, E.S.; Moore, K.J.; Singer, J.W.; Lamkey, K.R. Evaluation of Grass and Legume Species as Perennial Ground Covers in Corn Production. Crop Sci. 2013, 53, 611–620. [Google Scholar] [CrossRef]
  13. Larson, J.E.; Sheley, R.L.; Hardegree, S.P.; Doescher, P.S.; James, J.J. Seed and seedling traits affecting critical life stage transitions and recruitment outcomes in dryland grasses. J. Appl. Ecol. 2015, 52, 199–209. [Google Scholar] [CrossRef]
  14. Allen, P.S.; Debaene-Gill, S.B.; Meyer, S.E. Regulation of germination timing in facultatively fall-emerging grasses. In Proceedings-Ecology and Management of Annual Rangelands; USDA: Washington, DC, USA, 1994; Volume 213, pp. 215–219. [Google Scholar]
  15. Brede, A.D.; Duich, J.M. Establishment Characteristics of Kentucky Bluegrass-Perennial Ryegrass Turf Mixtures as Affected by Seeding Rate and Ratio1. Agron. J. 1984, 76, 875–879. [Google Scholar] [CrossRef]
  16. England, F. Competition in mixtures of herbage grasses. J. Appl. Ecol. 1968, 5, 227–242. [Google Scholar] [CrossRef]
  17. Dunn, J.H.; Ervin, E.H.; Fresenburg, B.S. Turf performance of mixtures and blends of tall fescue, Kentucky bluegrass, and perennial ryegrass. HortScience 2002, 37, 214–217. [Google Scholar] [CrossRef]
  18. Proctor, C.A.; Weisenberger, D.V.; Reicher, Z.J. Kentucky Bluegrass and Perennial Ryegrass Mixtures for Establishing Midwest Lawns. HortScience 2015, 50, 137–140. [Google Scholar] [CrossRef]
  19. Madison, J.H. Optimum Rates of Seeding Turfgrasses. Agron. J. 1966, 58, 441–443. [Google Scholar] [CrossRef]
  20. Leinauer, B.; Serena, M.; Singh, D. Seed Coating and Seeding Rate Effects on Turfgrass Germination and Establishment. HortTechnol. Hortte 2010, 20, 179–185. [Google Scholar] [CrossRef]
  21. Richardson, M.D.; Hignight, K.W. Seedling Emergence of Tall Fescue and Kentucky Bluegrass, as Affected by Two Seed Coating Techniques. HortTechnol. Hortte 2010, 20, 415–417. [Google Scholar] [CrossRef]
  22. Moran, J.; Goggi, A.S.; Moore, K.J.; Fei, S. Investigating Seed Treatments and Soil Amendments to Improve the Establishment of Kentucky Bluegrass as a Perennial Groundcover. Seeds 2025, 4, 16. [Google Scholar] [CrossRef]
  23. Qian, Y.; Follett, R.F.; Kimble, J.M. Soil Organic Carbon Input from Urban Turfgrasses. Soil. Sci. Soc. Am. J. 2010, 74, 366–371. [Google Scholar] [CrossRef]
  24. Natural Resource Conservation Service (NRCS). Web Soil Survey; NRCS: Washington, DC, USA, 2024.
  25. AOSA (Association of Official Seed Analysts). 2024 Rules for Testing Seeds: Principles and Procedures; AOSA: Wichita, KS, USA, 2024; Volume 1–4. [Google Scholar]
  26. Thomas, G.W. Soil pH and Soil Acidity. In Methods of Soil Analysis; John Wiley & Sons, Ltd.: Hoboken, NJ, USA, 1996; pp. 475–490. [Google Scholar] [CrossRef]
  27. Vogel, K.P.; Masters, R.A. Frequency Grid—A Simple Tool for Measuring Grassland Establishment. J. Range Manag. 2001, 54, 653–655. [Google Scholar] [CrossRef]
  28. Moore, K.J.; Roberts, C.A.; Fritz, J.O. Indirect Estimation of Botanical Composition of Alfalfa-Smooth Bromegrass Mixtures. Agron. J. 1990, 82, 287–290. [Google Scholar] [CrossRef]
  29. R Core Team. R: A Language and Environment for Statistical Computing Computer Software, version 4.4.0; R Foundation for Statistical Computing: Vienna, Austria, 2025.
  30. Kursa, M.B.; Rudnicki, W.R. Feature Selection with the Boruta Package. J. Stat. Softw. 2010, 36, 1–13. [Google Scholar] [CrossRef]
  31. Breiman, L. Random Forests. Mach. Learn. 2001, 45, 5–32. [Google Scholar] [CrossRef]
  32. Luan, J.; Zhang, C.; Xu, B.; Xue, Y.; Ren, Y. The predictive performances of random forest models with limited sample size and different species traits. Fish. Res. 2020, 227, 105534. [Google Scholar] [CrossRef]
  33. SAS Institute Inc. SAS Computer Software, version 9.4; SAS Institute Inc.: Cary, NC, USA, 2013.
  34. Juska, F.V.; Hanson, A.A. Effects of Interval and Height of Mowing on Growth of Merion and Common Kentucky Bluegrass (Poa pratensis L.). Agron. J. 1961, 53, 385–388. [Google Scholar] [CrossRef]
  35. Lickfeldt, D.W.; Voigt, T.B.; Hamblin, A.M. Composition and characteristics of blended Kentucky bluegrass stands. HortScience 2002, 37, 1124–1126. [Google Scholar] [CrossRef]
  36. Carey, K.; Gunn, E. Characterization of Kentucky Bluegrass Cultivars. Res. Rep. 2004, 18, 6–23. [Google Scholar]
  37. Samudio, S.H.; Brede, A.D. Registration of ‘Top Gun’ Perennial Ryegrass. Crop Sci. 2000, 40, 853. [Google Scholar]
  38. Serena, M.; Leinauer, B.; Sallenave, R.; Schiavon, M.; Maier, B. Turfgrass Establishment from Polymer-coated Seed Under Saline Irrigation. HortScience Horts 2012, 47, 1789–1794. [Google Scholar] [CrossRef]
  39. Loschinkohl, C.; Boehm, M.J. Composted biosolids incorporation improves turfgrass establishment on disturbed urban soil and reduces leaf rust severity. HortScience 2001, 36, 790–794. [Google Scholar] [CrossRef]
  40. Braun, R.C.; Watkins, E.; Hollman, A.B.; Mihelich, N.T.; Patton, A.J. Investigation of cool-season species, seeding rate, and nitrogen fertilization in sod production: I. Establishment and sod tensile strength. Agron. J. 2021, 113, 4176–4189. [Google Scholar] [CrossRef]
  41. Newell, A.J. Effects of different seed treatments and coatings on the germination and establishment of four grass species. J. Turfgrass Sci. 1997, 73, 67–72. [Google Scholar]
  42. Blaser, E.A. Seedling competition in establishing forage plants. Agron. J. 1956, 48, 1–6. [Google Scholar] [CrossRef]
  43. Li, X.; Liu, Z.; Wang, Z.; Wu, X.; Li, X.; Hu, J.; Shi, H.; Guo, F.; Zhang, Y.; Hou, X. Pathways of Leymus chinensis individual aboveground biomass decline in natural semiarid grassland induced by overgrazing: A study at the plant functional trait scale. PLoS ONE 2015, 10, e0124443. [Google Scholar] [CrossRef]
  44. Xiong, Y.; Fei, S.-Z.; Arora, R.; Brummer, E.C.; Barker, R.E.; Jung, G.; Warnke, S.E. Identification of quantitative trait loci controlling winter hardiness in an annual × perennial ryegrass interspecific hybrid population. Mol. Breed. 2007, 19, 125–136. [Google Scholar] [CrossRef]
  45. Liebman, M.; Dyck, E. Crop Rotation and Intercropping Strategies for Weed Management. Ecol. Appl. 1993, 3, 92–122. [Google Scholar] [CrossRef]
  46. Mohler, C.L.; Liebman, M. Weed productivity and composition in sole crops and intercrops of barley and field pea. J. Appl. Ecol. 1987, 24, 685–699. [Google Scholar] [CrossRef]
  47. Haramoto, E.R. Species, Seeding Rate, and Planting Method Influence Cover Crop Services Prior To Soybean. Agron. J. 2019, 111, 1068–1078. [Google Scholar] [CrossRef]
  48. Koehler-Cole, K.; Elmore, R.W. Seeding Rates and Productivity of Broadcast Interseeded Cover Crops. Agronomy 2020, 10, 1723. [Google Scholar] [CrossRef]
  49. Greipsson, S. Seed coating improves establishment of surface seeded Poa pratensis used in revegetation. Seed Sci. Technol. 1999, 27, 1029–1032. [Google Scholar]
  50. Berdahl, J.D.; Barker, R.E. Germination and Emergence of Russian Wildrye Seeds Coated with Hydrophilic Materials1. Agron. J. 1980, 72, 1006–1008. [Google Scholar] [CrossRef]
  51. Bruneau, A.H.; Peacock, C.H.; DiPaola, J.M. Cool season turfgrass establishment with fertilizer coated seed. Intl. Turfgrass Soc. Res. J. 1989, 6, 263–265. [Google Scholar]
  52. Hummel, N.W. Coated seed. In Turfgrass Handbook; Academic Press (Elsevier): Cambridge, MA, USA, 1991; pp. 56–60. [Google Scholar]
  53. Munshaw, G.C.; Layton, J.M.; Stewart, B.R.; Philley, H.W.; Beasley, J.S.; Lemus, R.W. The germination responses of five bermudagrass cultivars to seedcoating and temperature. HortScience 2014, 49, 1225–1229. [Google Scholar] [CrossRef]
  54. Scott, D. Effects of seed coating on establishment. N. Z. J. Ag. Res. 1975, 18, 59–67. [Google Scholar] [CrossRef]
  55. Gorim, L.; Asch, F. Seed coating reduces respiration losses and affects sugar metabolism during germination and early seedling growth in cereals. Funct. Plant Biol. 2014, 42, 209–218. [Google Scholar] [CrossRef]
  56. Gorim, L.; Asch, F. Seed coating with hydro-absorbers as potential mitigation of early season drought in Sorghum (Sorghum bicolor L. Moench). Biology 2017, 6, 33. [Google Scholar] [CrossRef]
  57. Hathcock, A.L.; Dernoeden, P.H.; Turner, T.R.; McIntosh, M.S. Tall Fescue and Kentucky Bluegrass Response to Fertilizer and Lime Seed Coatings. Agron. J. 1984, 76, 879–883. [Google Scholar] [CrossRef]
  58. Vartha, E.W.; Clifford, P.T.P. Effects of seed coating on establishment and survival of grasses, surface-sown on tussock grasslands. N. Z. J. Exp. Agric. 1973, 1, 39–43. [Google Scholar] [CrossRef]
  59. Hall, J.R., III. Effect of Cultural Factors on Tall Fescue-Kentucky Bluegrass Sod Quality and Botanical Composition. In Proceedings of the Third International Turfgrass Research Conference; John Wiley & Sons, Ltd.: Hoboken, NJ, USA, 1980; pp. 367–377. [Google Scholar] [CrossRef]
  60. Hsiang, T.; Carey, K.; He, B.; Eggens, J.L. Composition of mixtures of four turfgrass species four years after seeding under non-wear conditions. Int. Turfgrass Soc. Res. J. 1997, 8, 671–679. [Google Scholar]
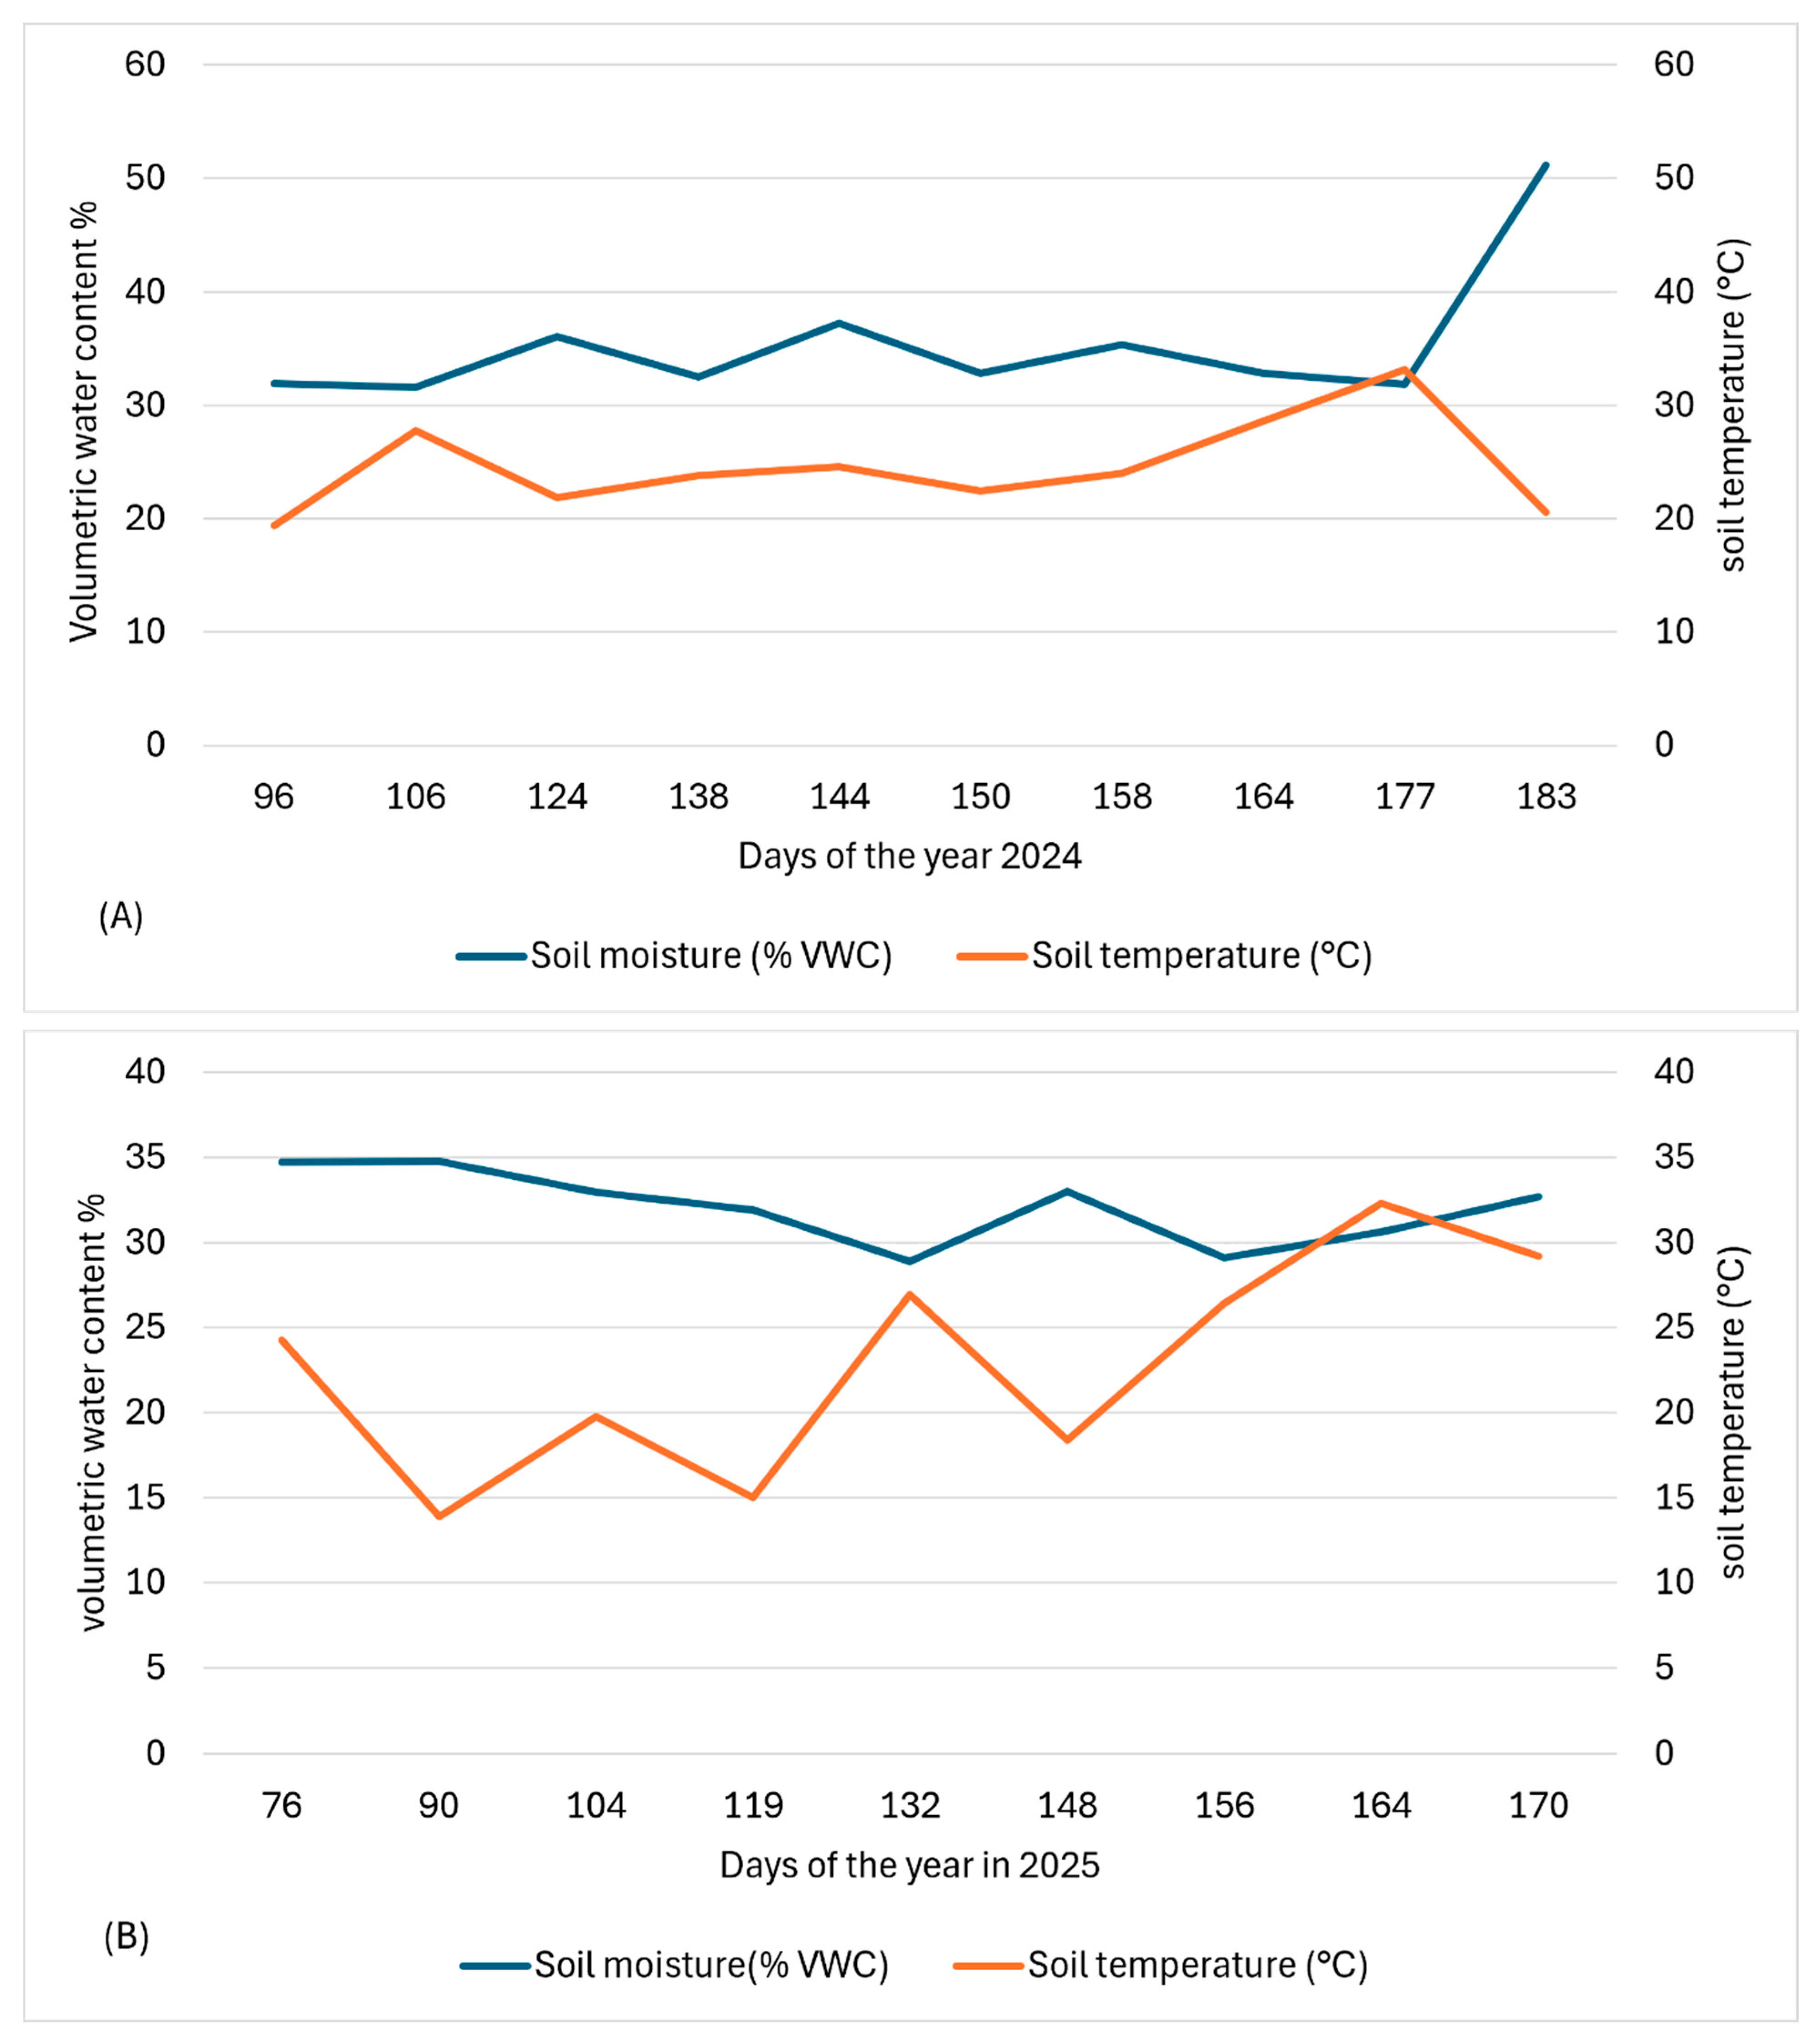
Figure 1. Average soil moisture and temperature were measured throughout the spring and summer of 2024 (A) and 2025 (B). These results were gathered using an 8-inch soil probe in each plot. Soil moisture (blue bar) is calculated as a percentage of volumetric water content (VWC). The soil temperature (orange bar) is measured in degrees Celsius. Both measurements are represented on the Y-axis. The days when soil probe measurements were taken in 2024 and 2025 are represented on the X-axis (days of the year).
Agronomy 15 01927 g001
Figure 2. The fall grid cover frequency measures the number of cells out of 100 within the grid with at least one grass blade. Hydroloc™-coated KBG seeds are the blue bars, and uncoated KBG seeds are the orange bars. Ground cover is represented by 0–100 on the Y-axis. The seeding rate (kg ha−1) and seed ratio (PRG:KBG) are represented on the X-axis. Standard error of the difference between means (SED) = 6.41.
Agronomy 15 01927 g002
Figure 3. Linear regression of the effect of varying seeding rates (a) and seed ratios (b) on grid cover frequency. Predicted regression lines (dotted line) were both calculated using a linear model. R-squared values are calculated to determine the goodness of fit.
Agronomy 15 01927 g003
Figure 4. Visual ground cover percentage for spring and summer. Hydroloc™-coated KBG seeds are the blue bars, and uncoated KBG seeds are the orange bars. The visual ground cover percentage is represented by 0–100 on the Y-axis. The seeding rate (kg ha−1) and seed ratio (PRG:KBG) are represented on the X-axis. SED = 7.68.
Agronomy 15 01927 g004
Figure 5. Linear regression of the effect of varying seeding rates (a) and ratios (b) on spring/summer visual cover. Predicted regression lines (dotted line) were both calculated using a linear model. R-squared values are calculated to determine the goodness of fit.
Agronomy 15 01927 g005
Figure 6. Grass green rating for spring and summer. The visual green rating is represented by 0–8 on the Y-axis. Hydroloc™-coated KBG seeds are the blue bars, and uncoated KBG seeds are the orange bars. The seeding rate (kg ha−1) and seed ratio (PRG:KBG) are represented on the X-axis. SED = 0.36.
Agronomy 15 01927 g006
Figure 7. Red:far-red values for the spring and summer. A low red:far-red ratio indicates high grass density in the plot, while a high ratio indicates lower grass density and more exposed soil. The red:far-red ratio is represented on the Y-axis. Hydroloc™-coated KBG seeds are the blue bars, and uncoated KBG seeds are the orange bars. The seeding rate (kg ha−1) and seed ratio (PRG:KBG) are represented on the X-axis. SED = 0.053.
Agronomy 15 01927 g007
Figure 8. Grass dry weight of plots harvested at the end of summer. The grass dry weight (kgha−1) is represented on the Y-axis. Hydroloc™-coated KBG seeds are the blue bars, and uncoated KBG seeds are the orange bars. The seeding rate (kg ha−1) and seed ratio (PRG:KBG) are represented on the X-axis. SED = 2472.55.
Agronomy 15 01927 g008
Figure 9. Line graph comparing the RF prediction using the 30% testing data to the actual known values. The calibration data was split into 70% training and 30% testing to prevent overfitting and accurately predict the unknown values. The actual values (X-axis) are the known outcome of %KBG, while the predicted values (Y-axis) are what the model says the value should be. The dotted red line of best fit corresponds to an R2 of 0.865, indicating a linear relationship between the actual and predicted values.
Agronomy 15 01927 g009
Figure 10. Species composition in percentage one year after sowing, as estimated by NIRS.
Agronomy 15 01927 g010
Figure 11. Species composition in percentage one year after sowing, as estimated by NIRS. The KBG (blue bar) or PRG (orange bar) percentage 1 year after sowing is represented on the Y-axis. The seed ratio at sowing (PRG:KBG) is represented on the X-axis.
Agronomy 15 01927 g011
Table 1. The twelve treatments in each subplot. Three seeding rates in kg ha−1 and four seed ratios of PRG:KBG.
Trt #Seeding Rate (kg/ha)PRG:KBG Ratio
111:20:1
211:21:1
311:21:3
411:21:5
522:40:1
622:41:1
722:41:3
822:41:5
944:80:1
1044:81:1
1144:81:3
1244:81:5
Table 2. Mean monthly temperature (°C) and rainfall (mm) for the fall establishment months. Weather data was sourced from Iowa Environmental Mesonet (IEM) for the coordinates of the experimental plots.
Mean Temperature (°C)Total Rainfall (mm)
Month2023202430-yr. avg.2023202430-yr. avg.
August21.521.221.638.343.795.3
September1918.517.736.66.984.2
October11.613.210.571.948.872.2
November3.64.62.96.674.244.8
December1.4−2.3−3.82935.635.8
Table 3. Mean monthly temperature (°C) and rainfall (mm) data for the winter and spring months. Weather data was sourced from Iowa Environmental Mesonet (IEM) for the coordinates of the experimental plots.
Mean Temperature (°C)Total Rainfall (mm)
Month2024202530-yr. avg.2024202530-yr. avg.
January−6.8−8.1−7.154.66.625.7
February2.1−6.9−5.14.36.727.4
March4.15.0247.272.449
April9.98.58.98999.895.1
May15.814.715.4245.476.2133.4
June22 21.2121.1 142.4
Disclaimer/Publisher’s Note: The statements, opinions and data contained in all publications are solely those of the individual author(s) and contributor(s) and not of MDPI and/or the editor(s). MDPI and/or the editor(s) disclaim responsibility for any injury to people or property resulting from any ideas, methods, instructions or products referred to in the content.